- 1Department of Physical Oceanography, Woods Hole Oceanographic Institution, Woods Hole, MA, United States
- 2Department of Biology, Boston University, Boston, MA, United States
Despite the widely recognized warming of the New England Continental Shelf (NES), climate patterns of the shelf’s economically and ecologically important coastal environments remain less examined. Here we use a satellite sea-surface temperature (SST) analysis gridded on 0.05°C spatial resolution to show, for the first time, the existence of a warm and a cold spot in the environs of Cape Cod, Massachusetts amid the NES warming of the past 15 years. The warm spot refers to an increasing warming trend in shallow waters of Nantucket Sound sheltered by the islands of Martha’s Vineyard and Nantucket. The summer SST maxima have increased by 3.1±1.0°C (p<0.1), about three times faster than the warming elsewhere on the NES, and the summer season has lengthened by 20 ± 7 days (p<0.1). The cold spot refers to an increasing cooling trend over Nantucket Shoals, an area of shallow sandy shelf that extends south and southeast from Nantucket Island and also known for strong tidal mixing. The strong cooling trend during June–August reduced the SST maxima by -2.5±1.2°C (p<0.1) and shortened the warm season by -32 ± 11 days (p<0.1). Away from the Cape Cod waters, the broad warming on the shelf is attributable to a forward shifted annual cycle. The shift is most significant in August–November, during which the summer temperatures lingered longer into the fall, producing a pronounced warming and delaying the onset of the fall season by 13 ± 6 days (p<0.1). The three different patterns of SST phenology trends displayed by the respective warm spot, the cold spot, and the broad shelf highlight the highly dynamically diverse responses of coastal waters under climate warming. Finally, the study showed that spatial resolution of SST datasets affects the characterization of the spatial heterogeneity in the nearshore SSTs. The widely used Optimum Interpolation SST (OISST) on 0.25°C resolution was examined. Although the two SST datasets agree well with the measurements from the moored buoys at four locations, OISST does not have the cold spot and shows a higher rate of warming on the shelf.
1 Introduction
Cape Cod, Massachusetts, is a hook-shaped peninsula surrounded by water on all sides with Cape Cod Bay to the north, Buzzards Bay to the west, Vineyard and Nantucket Sounds to the south, and the Atlantic Ocean to the east (Figure 1). The region is situated in the large marine ecosystems of the U.S. Northeastern Continental Shelf (NES), and home to economically important tourism, fisheries, and aquaculture industries (Blanchard et al., 2012; Hare et al., 2012). In recent decades, the NES waters have warmed rapidly, at a rate of two-to-three times faster than the global open ocean (Nixon et al., 2004; Friedland and Hare, 2007; Shearman and Lentz, 2010; Mills et al., 2013; Chen et al., 2014; Forsyth et al., 2015; Fulweiler et al., 2015; Oczkowski et al., 2015; Pershing et al., 2015; Kavanaugh et al., 2017; Thomas et al., 2017; Harden et al., 2020; Chen et al., 2020; Karmalkar and Horton, 2021). The warming trends increase toward the north, with a rate of change varying from ~0.3°C decade–1 in the Mid Atlantic Bight (MAB) between Cape Hatteras and Cape Cod, to 0.4°C decade–1 in the Gulf of Maine (GoM), and to more than 0.6°C decade–1 over the Scotian Shelf (Friedland and Hare, 2007; Shearman and Lentz, 2010; Kavanaugh et al., 2017; Poppick, 2018). The warming trend varies seasonally and peaks in later summer (July–September) (~1.0°C decade–1). As a result, the summer season has lengthened at a rate of 0.6 – 1.8 days/year (Thomas et al., 2017).
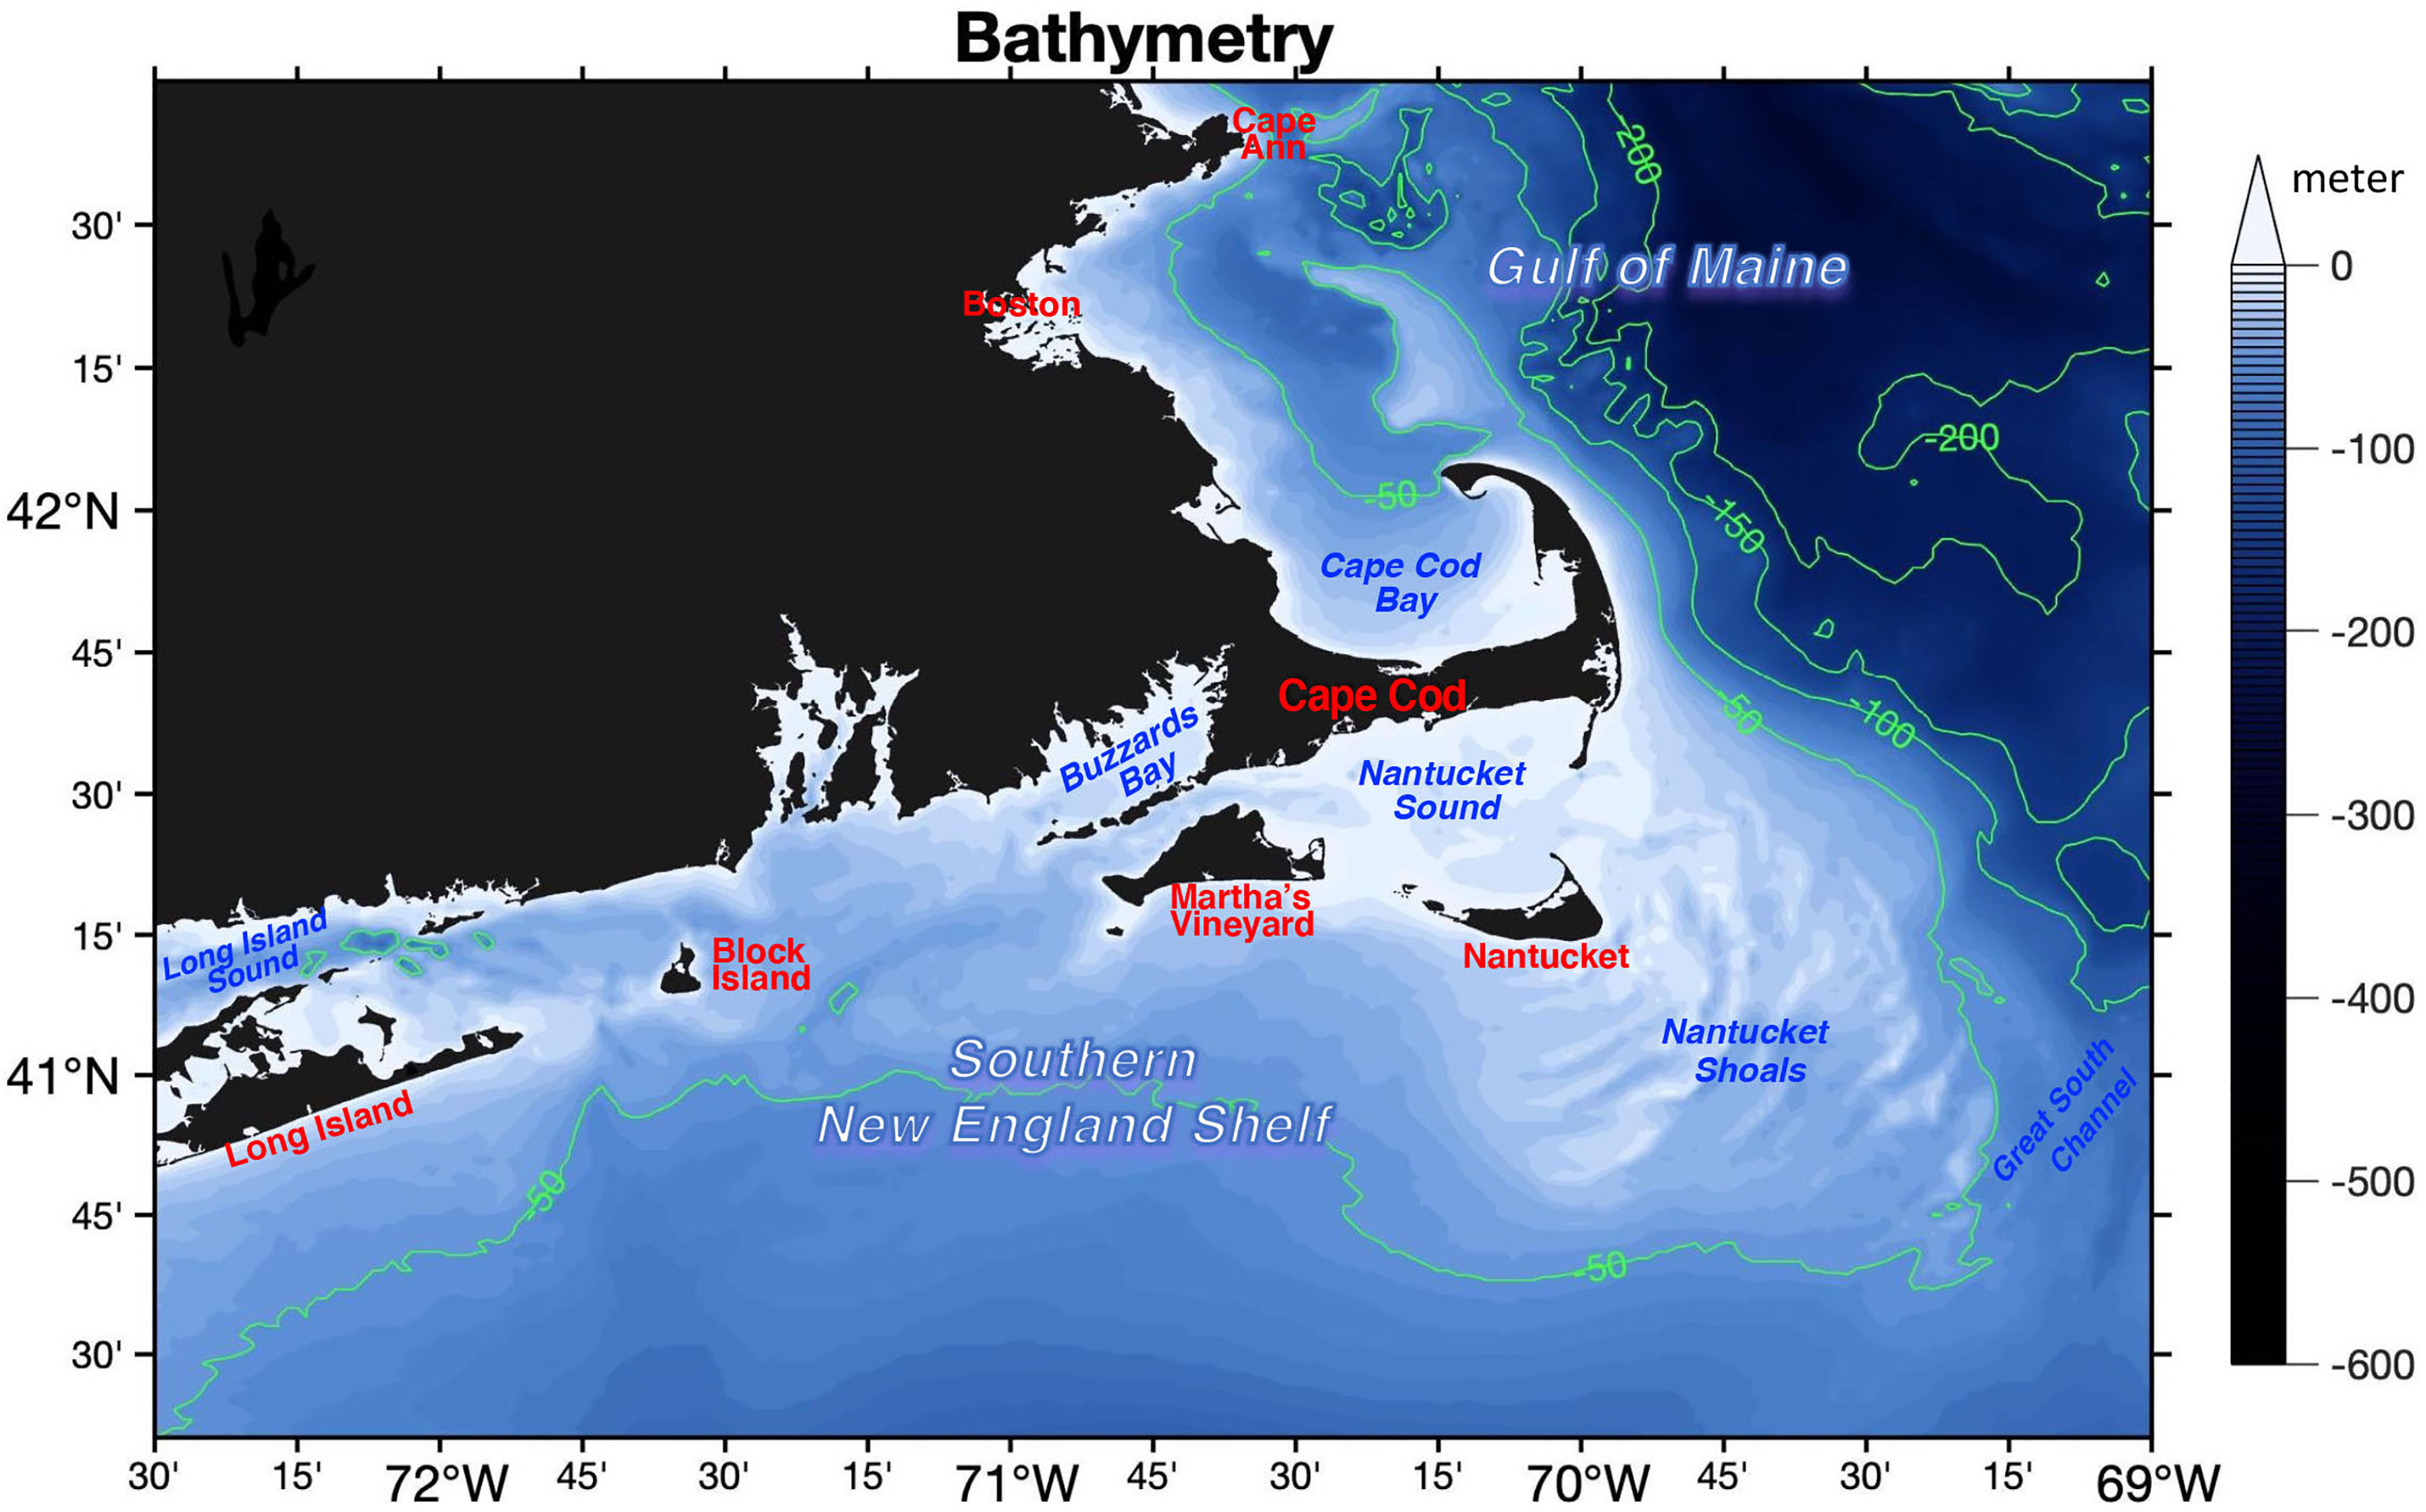
Figure 1 Bathymetry of the study domain that covers the New England continental shelf from Long Island, New York to Cape Ann, Massachusetts. The 50–meter isobath is drawn to define the boundary of the shallow inner-shelf waters, and the water depth of 50–100 m is referred to as the mid shelf and the water depth of 100 m and greater as the outer shelf.
The bays and sounds surrounding the Cape and Island are small in size (< 50 km in width). For instance, Cape Cod Bay is 105 km long and 32 km wide, Nantucket sound 48 km long and 40 km wide, and Buzzards Bay 45 km long and 13 km wide. Despite the numerous studies of the warming in the NES waters as a whole, little attention has been paid to the water temperature changes in the environs of Cape Cod. The main limitation for studying Cape Cod is that sea surface temperature (SST) data products used in previous studies have a relatively coarse resolution, ranging from 1 – 2° grid resolution (~ 84 – 168 km at the latitude 41°C41′N of the Cape) (Friedland and Hare, 2007) to at best at 0.25° (~ 21 km) in recent studies (Mills et al., 2013; Pershing et al., 2015; Kavanaugh et al., 2017; Thomas et al., 2017; Chen et al., 2020). These spatial resolutions are adequate for defining the scale and scope of the warming on the continental shelf (Nixon et al., 2004; Friedland and Hare, 2007; Shearman and Lentz, 2010; Chen et al., 2014; Forsyth et al., 2015; Fulweiler et al., 2015; Oczkowski et al., 2015; Pershing et al., 2015), but insufficient to capture the SST variability in the small-sized nearshore areas around the Cape.
Mounting evidence has shown that the steady, ominous rise of ocean temperatures affects marine food webs at almost every trophic level from plankton to sharks, driving fish stocks to migrate northward along the shelf or offshore into deeper waters to remain in their preferred temperature ranges (Genner et al., 2010; Friedland et al., 2013; Pinsky et al., 2013). Around the Cape, fish species commonly found in warm ocean waters in the south have increased in the area, while Cape Cod’s namesake fish population has been quickly disappearing from the region (Gawarkiewicz et al., 2013; Montero-Serra et al., 2015). Meanwhile, the growth rates of farmed oysters and quahogs have reduced substantially in recent decade across the shellfish farms on the Cape (Annual Report of Massachusetts Division of Marine Fisheries, 2020). Yang (2021) analyzed the measurements of water quality parameters obtained at five monitoring sites around the oyster farms on Cape and identified a forward shift in the phenology of water temperatures. There was a delayed start in spring and delayed termination of summer, and the annual cycles of the biogeochemical properties in the waters, including salinity, dissolved oxygen concentration, turbidity, and acidity, have all shifted accordingly. Yang (2021) suggested that the altered growth rates of farmed oysters and quahogs might be induced by the phenology shift in water temperatures. The rapidly changing ocean habitat raises grave concerns over the future of marine ecosystems and capture fisheries (Nye et al., 2009; Mills et al., 2013; Walsh et al., 2015; Record et al., 2019), highlighting the pressing need for an improved understanding of the phenology changes in Cape Cod waters for effective management of coastal ecosystems in the warming climate.
This study is to use a state-of-the-art satellite daily SST analysis gridded on 0.05° spatial resolution (Donlon et al., 2012) to gain a better understanding and representation of the SST change patterns in Cape Cod waters. The spatial resolution of the dataset is equivalent to 4.2 km at 41°41′ latitude of Cape Cod, which is five times finer than the datasets used in previous studies. The better resolution increases the potential of better resolving the SST structures in a region that is characterized by shallow, irregular bottom bathymetry and complex coastal geometry.
2 Materials and Methods
2.1 Satellite SST Products
The 0.05°-gridded SST product is from the Operational Sea Surface Temperature and Sea Ice Analysis (OSTIA) analysis (Donlon et al., 2012; Good et al., 2020), produced at the Meteorological Office in the United Kingdom (abbreviated as UK Met Office, 2005). The OSTIA SST analysis has daily resolution and is available for the period from 2006 to the present. It is constructed from optimal interpolation (OI) method to SST data from satellite sensors that include the Advanced Very High-Resolution Radiometer (AVHRR), the Advanced Along Track Scanning Radiometer, the Spinning Enhanced Visible and Infrared Imager, the Advanced Microwave Scanning Radiometer-EOS, the Tropical Rainfall Measuring Mission Microwave Imager, and in situ data from drifting and moored buoys. The dataset is defined as foundation SST, which is free of diurnal temperature variability. Observed data were eliminated when the wind speed was less than 6 m s-1 during daytime to ensure the production of foundation SST. Donlon et al. (2012) reported that the OSTIA product has a mean bias close to zero and root-mean-squared error about 0.57 K. OSTIA dataset is specifically produced to support SST data assimilation into numerical weather prediction (NWP) and ocean forecasting (UK Met Office, 2005; Donlon et al., 2012).
Satellite-based studies of the New England shelf warming (e. g. Thomas et al., 2017; Chen et al., 2020) have been primarily based on the 0.25°-gridded gridded Optimum Interpolation SST (OISST) of the National Centers for Environmental Information (NCEI)/National Oceanic and Atmospheric Administration (NOAA) (Reynolds et al., 2007; Banzon et al., 2016). The OISST is produced from an OI method that combines AVHRR and in-situ measurements to generate daily SST fields, and hence the dataset is referred to as a bulk SST, at the depths of the in-situ instruments. The data record covers the 40-year period from 1981 to the present, which provides sufficiently long record for analyzing the anthropogenic contribution to the shelf warming (e. g. Chen et al., 2020).
Although the fine resolution of the OSTIA SST allows a better resolving of SST variability in the environs of Cape Cod, the 15-year data span may not be sufficiently long enough to effectively isolate anthropogenic influence. Nonetheless, our literature survey shows that the rapid increase of the near-shore SST has occurred primarily in the recent decades. For instance, Forsyth et al. (2015) reported that the depth-averaged shelf temperature in the MAB region increases at 0.26 ± 0.01°C dec−1 from 1977 to 2013, but the trend since 2002 is at 1.1 ± 0.2°C dec−1, which is more than four times larger than the overall 37-year trend. Using a water temperature record of past 120 years in the GoM, Pershing et al. (2021) showed that temperatures rose in 1999 and then entered a period of rapid warming around 2005, with the mean temperature over the recent 5 years (2016-2020) being the highest on record. Hence, the 15-year OSTIA SST dataset provides an excellent opportunity to study the spatial heterogeneity of near-shore SST change during the rapid climate change of the recent decades.
2.2 Mean SST Annual Variability in the Study Domain
The study domain (Figure 1) covers a relatively small part of the NES. It extends between 40°15′N and 42°45′N in latitude and between 72°30′W and 69°W in longitude, encompassing the inner continental shelf waters (defined as the waters on the landward side of the 50-m isobath) from Long Island, New York, in the south and Cape Ann, Massachusetts, in the north. The 50-m isobath runs roughly parallel to the coastline, except to the south of Nantucket Island where the isobath bulges out southeastward to circle along the shallow sandy shelf area of Nantucket Shoals. Outer-shelf water bodies (defined as the waters on the seaward side of the 100-m isobath) are located to the east and northeast of Cape Cod.
To examine the effect of spatial resolution on the regional mean SST pattern, monthly SST climatology was constructed from daily SST fields from 2006 to 2020 using both OSTIA and OISST products. Annual mean SST and standard deviation (STD) of monthly SST variability were then computed from the two respective products. Figures 2A, B show that the mean SST pattern is similarly produced by both products, with higher SSTs located to the south and southwest of Cape Cod and lower SSTs to the northwest and southeast of the Cape. The broad structure of the SST STD of annual variations in the two products (Figures 2C, D) is also comparable. The water bodies in Nantucket Sound and Buzzards Bay off the southern coast of Cape Cod have the largest annual variability (STD >7°C), while those over Nantucket Shoals have the lowest annual variability (STD ~ 4°C). The low mean SST and weak annual variability over Nantucket Shoals have been known to be caused by strong tidal mixing (Limeburner and Beardsley, 1982; Beardsley et al., 1985; Wilkin, 2006; He and Wilkin, 2006) that entrains cold water from depth throughout the year and causes perpetually cool ocean temperatures.
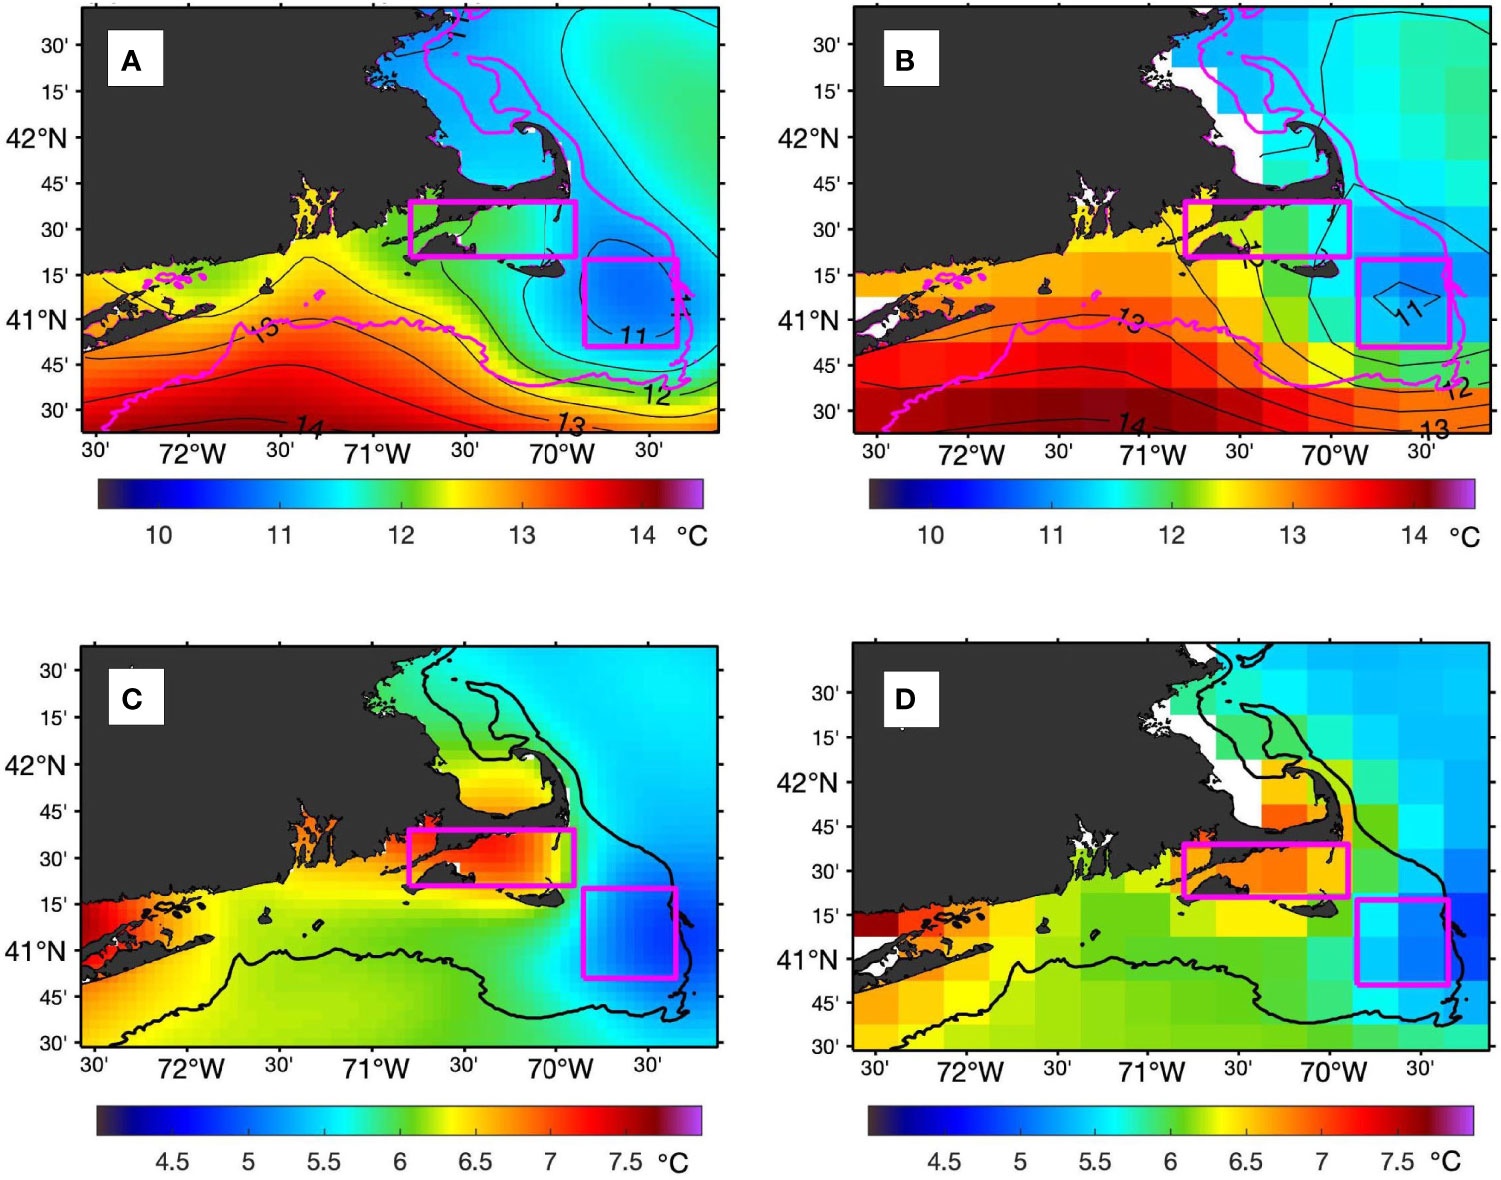
Figure 2 Annual Mean SST based on (A) OSTIA and (B) OISST, and standard deviation of SST seasonal variability based on (C) OSTIA and (D) OISST. Constructed from the daily SST climatology from 2006 to 2020. The rectangle box denotes the area of Nantucket Sound and Buzzard Bay and the square box denotes the area of Nantucket Shoals. The 50–meter isobath is highlighted in magenta.
Spatial resolution does matter in representing SST annual variability in spatially heterogeneous near-shore waters. For instance, the SSTs on Nantucket Shoals (e.g. the square boxed area in Figure 2; refer to as Area I hereafter) are produced with 10 longitude by 10 latitude grid boxes in OSTIA, but with only 2 longitude by 2 latitude grid boxes in OISST. The SSTs in Nantucket Sound (e.g. the rectangle boxed area in Figure 2; referred to as Area II hereafter) are produced with 20 longitude by 7 latitude grid boxes in OSTIA, but with only 4 longitude by 1 latitude grid boxes in OISST. Clearly, the 0.05°-gridded OSTIA product provides more spatial context than the 0.25°-gridded OISST product.
2.3 Selection of SST Phenology Metrics
The phenology metrics of SST in this study are defined by the onset, the termination, and the length of a season, the summer SST maximum and the winter SST minimum, the spring warming rate and fall cooling rate. For each season, there are four metrics that can be used to define the SST phenology and its changes. Thresholds of these metrics are commonly determined by two approaches. One is based on the percentile measure (e.g. Christidis et al., 2007; Park et al., 2018) with the start (end) of summer defined as SST above (below) 75th percentile of long-term mean SST for five consecutive days and the start (end) of winter as SST below (above) 25th percentile of long-term mean SST for five consecutive days. The other method is to select specific SST isotherms as thresholds. For instance, Thomas et al. (2017) chose the warm portion of the annual cycle that is above 12°C as summer and the cold portion of the annual cycle that is below 8°CC as winter. This study takes the second approach to select representative SST isotherms as thresholds for seasons. In the following we showed how to use the curvature characteristics of the SST annual cycle to determine the metrics of the summer and winter onsets.
As shown in Figure 3, the first derivative of SST annual time series contains the information about the critical points of a continuous cycle. Three pairs of points are highly relevant to season transitions. The first is the two zero points, denoted by black squares with red outlines in Figure 3 with one at the end of February and the other in the early August. These points correspond to the timing of the occurrence of the coldest and warmest waters, that is, the SST extrema of the annual cycle. The second pair is the derivative maximum in mid-June and the derivative minimum in mid-October, denoted by solid and open red squares. These two points define the start and end of summer, and the round-up SST value at these two points is 16°CC. During this period, the rate of SST change goes straight downward, first from large positive to zero when the rate of SST increment decelerates day by day as SST climbs to the seasonal peak in early August, and then from zero to large negative when the rate of SST daily reduction accelerates as SST falls to conclude the summer. The third pair is the inflection points (i.e., local extrema), denoted by solid and open blue squares. An inflection point is a point at which the direction of curvature changes. One local minimum occurs in late December, marked by the beginning of slowing down in the rate of sea-surface cooling before SST approaches the seasonal minimum in late February. The another local maximum occurs in late April, marked by the beginning of acceleration in the rate of sea-surface warming after the winter ends. The two inflection points define the period of winter, and the round-up SST value at these two points is 8°C. Hence, the chosen SST thresholds for the start of winter and summer are 8°C and 16°C, respectively. The spring season is referred to the period that SST increases from 8°C to 16°C and the fall season is the period that SST decreases from 16°C to 8°C. Accordingly, the start date for spring in the regional shelf waters occurs on May 2, Summer on June 19, Fall on October 18, and winter on December 27. The warmest day of the year occurs on August 6 and the coldest day on March 3.
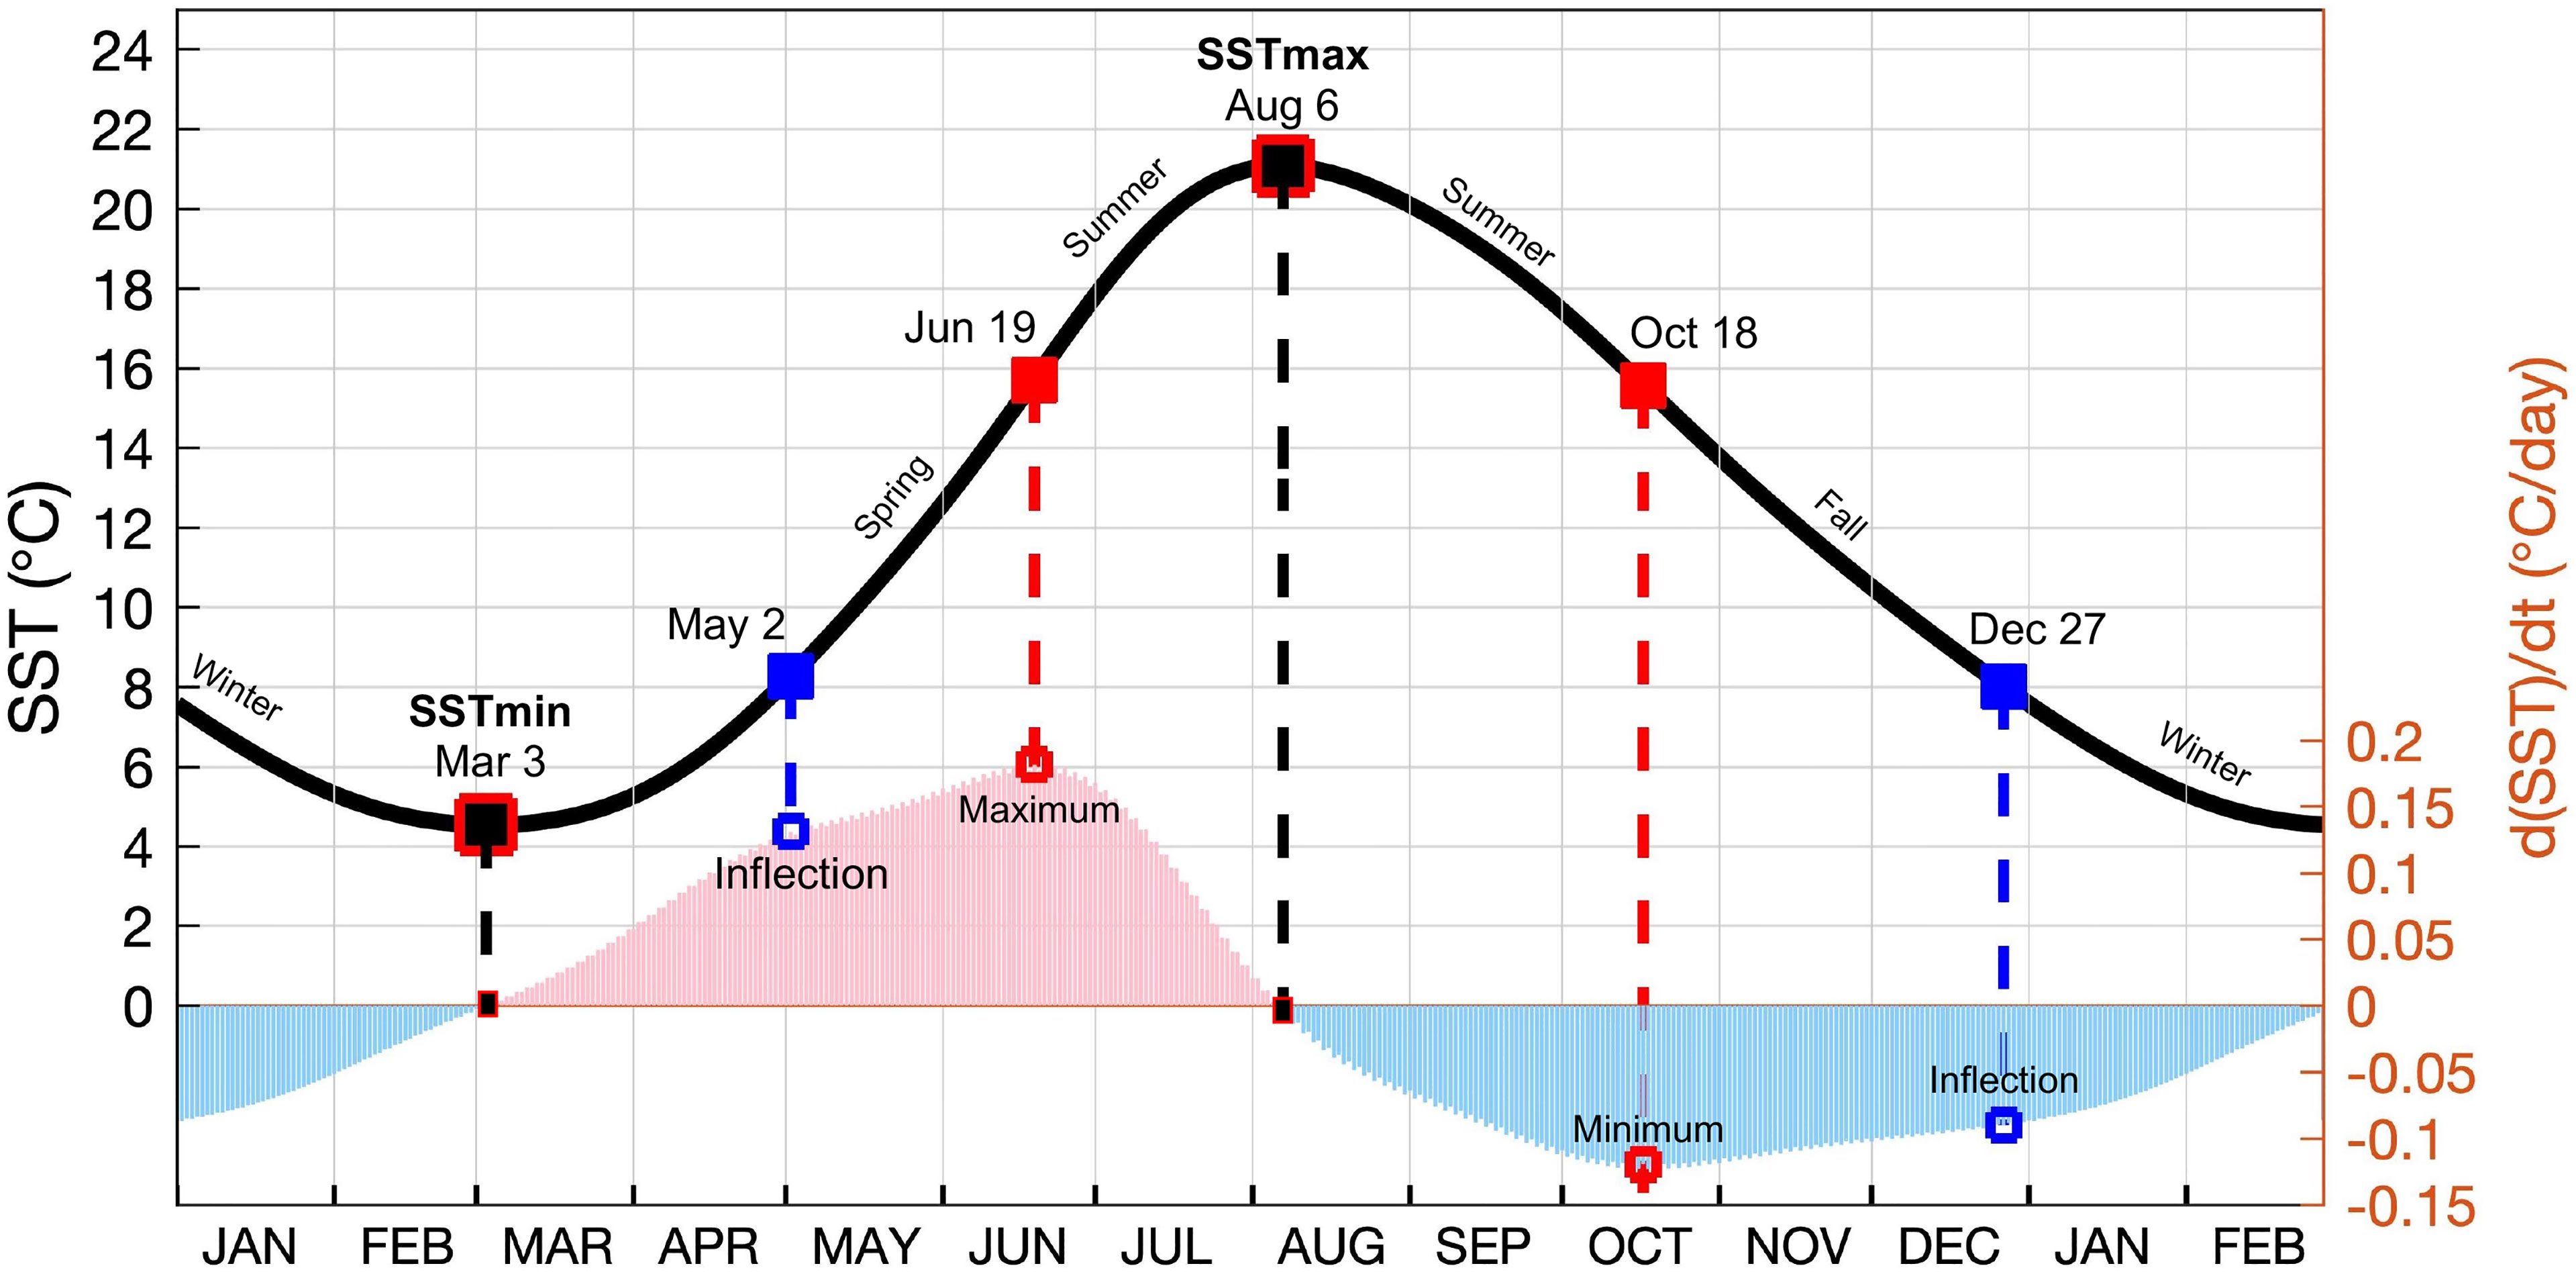
Figure 3 SST annual cycle climatology averaged over the domain of interest (thick black; left y-axis). A low-pass FFT filter with a cutoff frequency of 60 days was applied to reduce high frequency signals. The area plot (right y-axis) below the annual cycle denotes the first derivative of the annual cycle. The start and end of summer correspond to the maximum and minimum of the first derivative, and the start and end of winter correspond to the inflection points of the first derivative. The SST values round up at these specific days were selected as the thresholds for the seasons. The start and end of the summer are set at 16°C, and the start and end of winter are set at 8°C.
The selection of the thresholds for the SST phenology metrics was based on the averaged conditions over the 15-year satellite record. Variations of these thresholds with latitudes and time led to 15-year time series of SST phenology metrics at each grid point. The time series were low-pass FFT filtered with a cutoff frequency of 60 days to remove subseasonal signals. The smoothed datasets were used to extract the phenology metrics. The warmest and coldest days were calculated as the days of the SST maximum and minimum of the year. The spring and summer onset metrics were computed as the first day that SST surpassed the selected onset threshold, 8°C and 16°C, respectively, for five consecutive days. Similarly, the fall and winter onset metrics were computed as the first day that SST fell below the selected onset threshold, 16°C and 8°C, respectively, for five consecutive days. Length of the spring season is defined as the period between the spring onset and one day before the summer onset, and so on for the lengths of the other seasons.
Applicability of 8°C and 16°C as the phenology thresholds for the entire domain were tested, confirming that these thresholds ensured the summer and winter seasons at each grid point. Sensitivity of the phenology patterns to the choice of thresholds was performed by varying the thresholds within the range of ±2°C of the selected values at interval of every 0.5°C. We came to two conclusions. First, the SST metrics for the winter onset cannot go below 7°C to ensure the existence of a winter at every grid point, and the metrics for the summer onset cannot go beyond 16.5°C to ensure the existence of a summer at every grid point. Second, the modified thresholds resulted in different absolute values but did not change the overall patterns. Hence, the SST phonology metrics derived from the curvature criteria appear to be on a solid ground.
Using the curvature characteristics of the SST annual cycle defined in Figure 3, onset dates of the four seasons and the corresponding lengths of these seasons were extracted for each year. The mean patterns averaged over the 2006-2020 span are shown in Figures 4, 5. In the GoM, the spring arrives in early May, the summer in late June, the fall in early October, and the winter in late December (Figures 4A–D). The onsets of spring and summer occur about 15-20 days later than those on the Southern New England shelf, while the onsets of fall and winter occur about 20-30 days earlier than those on the Southern New England shelf. On the climatological mean basis, the spring season lasts about 50 days in the study domain (Figure 5A), with a slightly longer duration in Nantucket Shoals due to its late summer onset. The summer duration ranges from ~70 days in Nantucket Shoals, to ~100 days in the GoM, and to ~140 days on the seaward side of the Southern New England Shelf (Figure 5B). The fall duration is shorter (~ 50 days) on the inner continental shelf but longer (80-90 days) on the outer shelf. The winter season is shorter (~ 90 days) on the outer Southern New England Shelf but longer (~130 days) in the GoM.
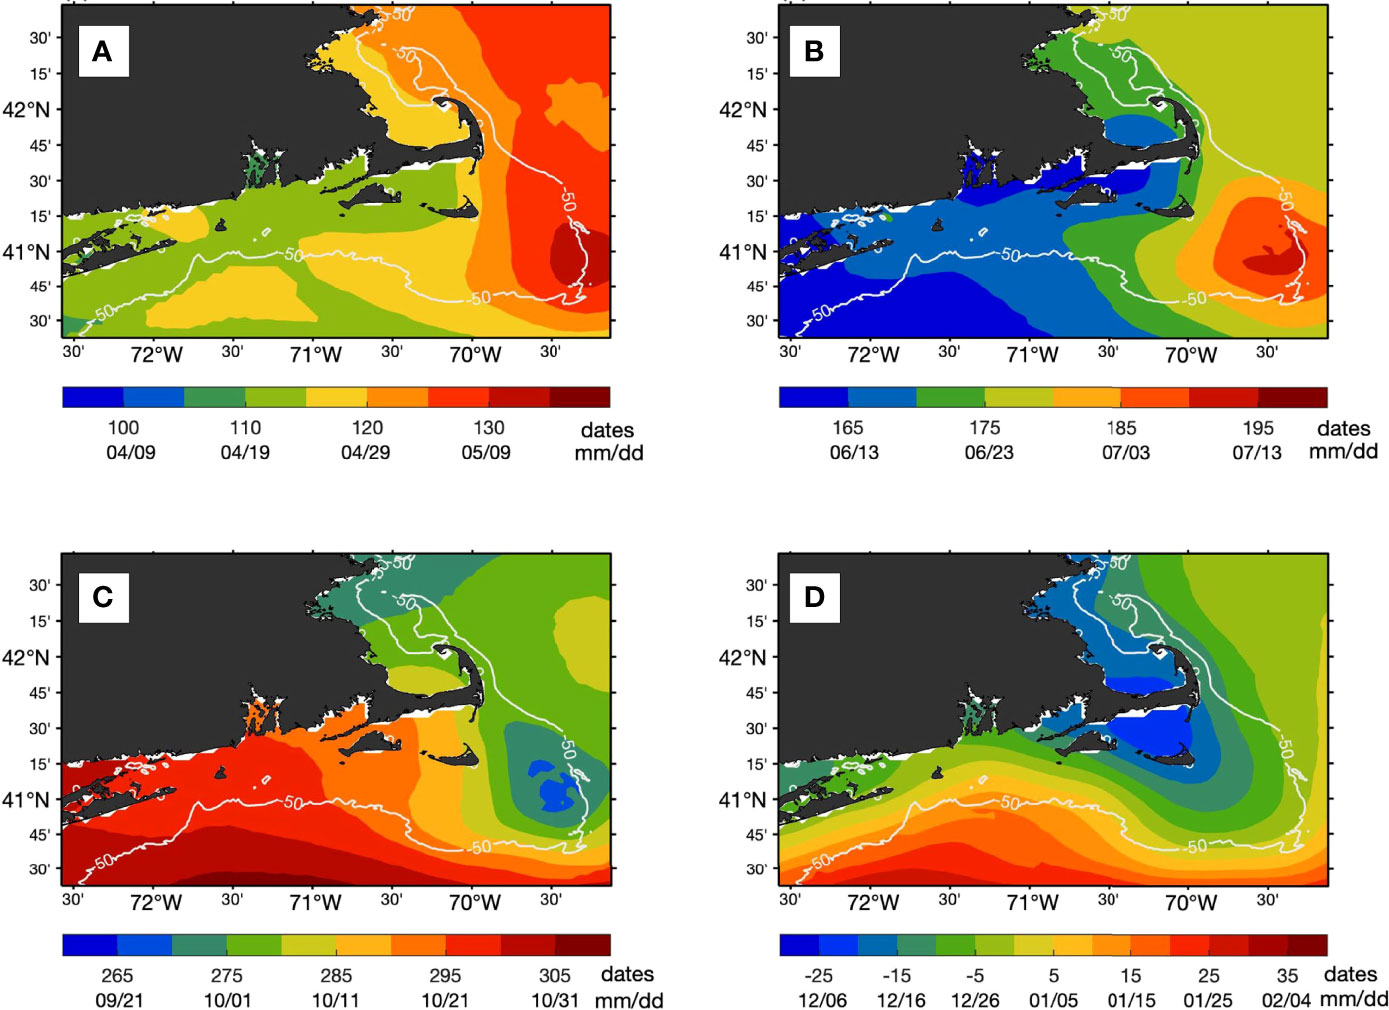
Figure 4 Mean onset date for (A) spring, (B) summer, (C) fall, and (D) winter on a climatological year constructed from OSTIA SST (2006-2020). Two sets of date strings are listed on the colorbar: the day of year (upper) and month/day (lower). The 50–meter isobath is highlighted in white.
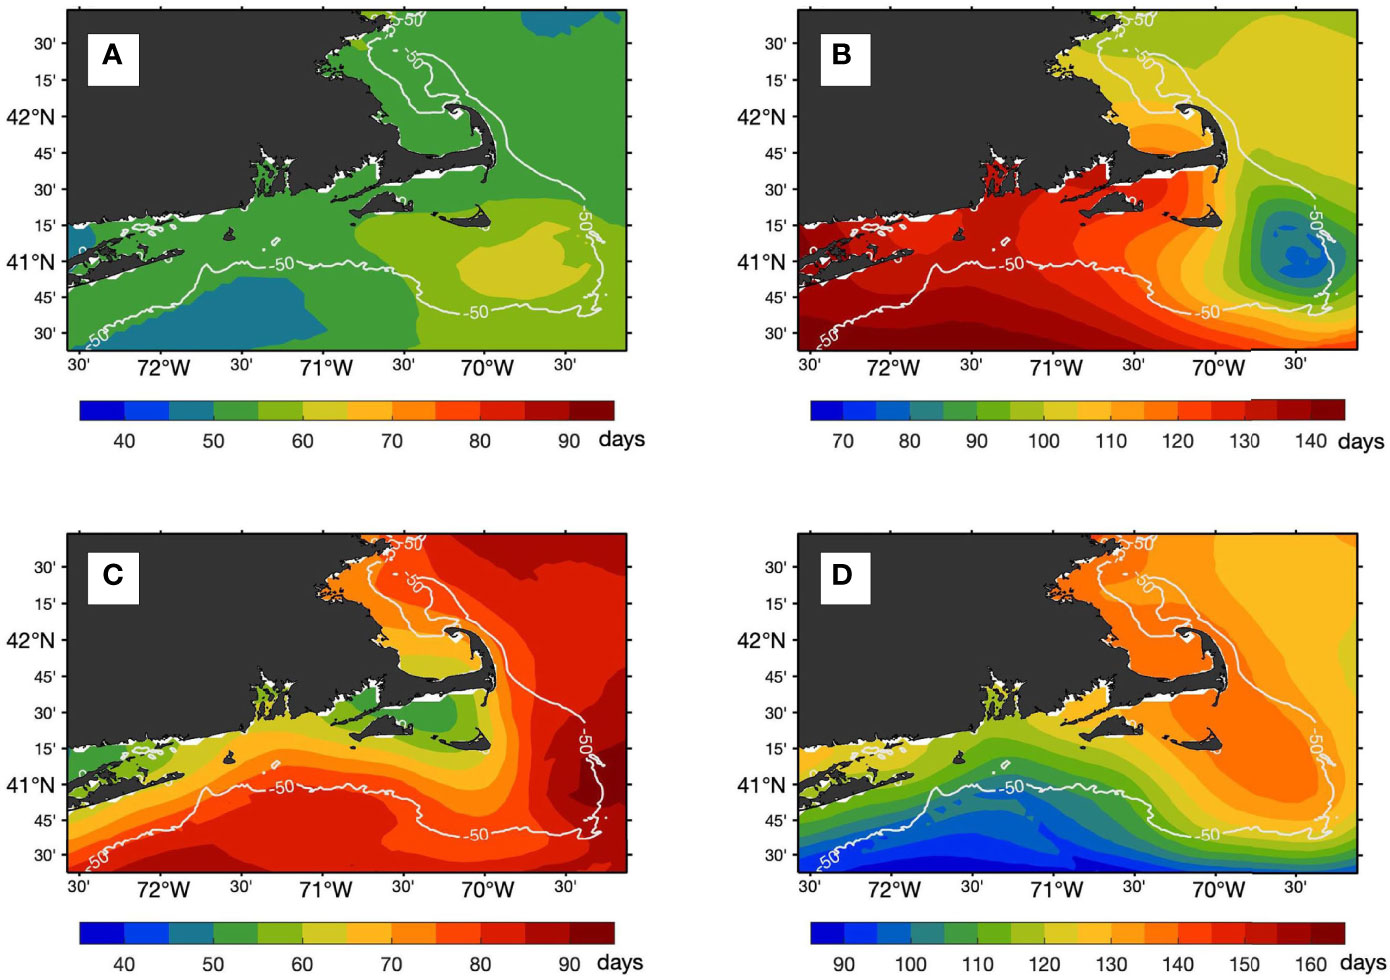
Figure 5 Mean length of the season (days) for (A) spring, (B) summer, (C) fall, and (D) winter on a climatological year constructed from OSTIA SST (2006-2020). The 50–meter isobath is highlighted in white.
2.4 Relation of SST Phenology to Astronomical Seasons
It is worth noting that our estimated onsets of summer (June 19) and winter (December 27) align closely to the astronomical seasons that are defined by the Earth’s revolution around the Sun on its axis at an average of 23.5°. This tilted axis changes the angle at which the Sun’s rays have on the Earth’s surface, leading to two solstices that are marked by the minimum and maximum limits of solar declination. For the Northern Hemisphere, the summer solstice (June 21-22) is the longest day of the year, when the axis of rotation is tilted to its maximum (i.e., a full 23.5°) toward the sun and the incoming solar radiation strikes Earth most directly along the 23.5°N (the Tropic of Cancer). After the passing of the summer solstice, the length of daylight gradually decreases. Conversely, the winter solstice (December 21-22) is the shortest day of the year, when the axis of rotation is tilted to its maximum away from the sun and the incoming solar radiation strikes Earth at the smallest angle along the 23.5°S (the Tropic of Capricorn). After the winter solstice, the days begin to lengthen.
The imprint of solstices in the observed SST annual cycle shows that solstices are pivotal moments in season transitions. The combination of the angle of incoming solar radiation and the length of daylight modifies the solar radiation received at the Earth’s surface, impacting directly the degree of SST change on daily basis. On the other hand, the SST changes are influenced not only by surface solar radiation but also by other oceanic processes, such as advection and tidal mixing (Limeburner and Beardsley, 1982; Wilkin, 2006; Chen et al., 2015). The missing imprint of the two equinoxes, one around March 21 and the other around September 22, could be an indication that the SST changes at these times may not be dictated solely by solar radiation.
2.5 Linear Trend Analysis
Linear trends are computed at each grid point using least-squares linear regression on the full time series of daily SST observations (2006-2020). While the period is too short to reflect the longer-term trends in the region, the findings of the SST phenology shift on the broad shelf region are in good agreement with previous studies using a 33-year time series (1982-2014) with lower spatial resolution. The statistical significance of the trends is tested using the 90% confidence limits determined from the Student’s t distribution.
3 Results
3.1 Phenological Change of SST
3.1.1 Shift in the Onset Dates of Season
Shifts in the onset dates of spring, summer, fall, and winter are represented by positive or negative trends (Figures 6A–D). A positive trend denotes a forward shift in the onset date of the season, or a delayed start of the season, and a negative trend denotes a backward shift in the onset date of the season, or an early start of the season. The trends of the spring onset dates are largely weak positive, indicating that the spring season tended to start slightly later during the 15-year period. The rate of change varies from near zero in the environs of Cape Cod to a maximum about 1.5 day/year on the eastern Nantucket Shoals. The trends with statistical significance at the 90% confidence interval (p<0.1) are limited to the north and southeast of Cape Cod near the 50-meter isobath (shaded by dots). Changes of the summer onset dates are fairly weak over the broad inner shelf region, with the exception of two localized trends that are both statistically significant (p<0.1) but with opposite signs. Trends are predominantly negative over the Nantucket Sound, where the offshore waters tended to warm up faster, causing summer temperatures to commence earlier. Such changes led to an earlier arrival of the summer season at an average rate of 0.8 day/year. On contrary, trends are significantly positive over Nantucket Shoals, where the shoal waters tended to take a longer time to warm up, delaying the timing of the summer onset year by year at a rate of 1–2 day/year.
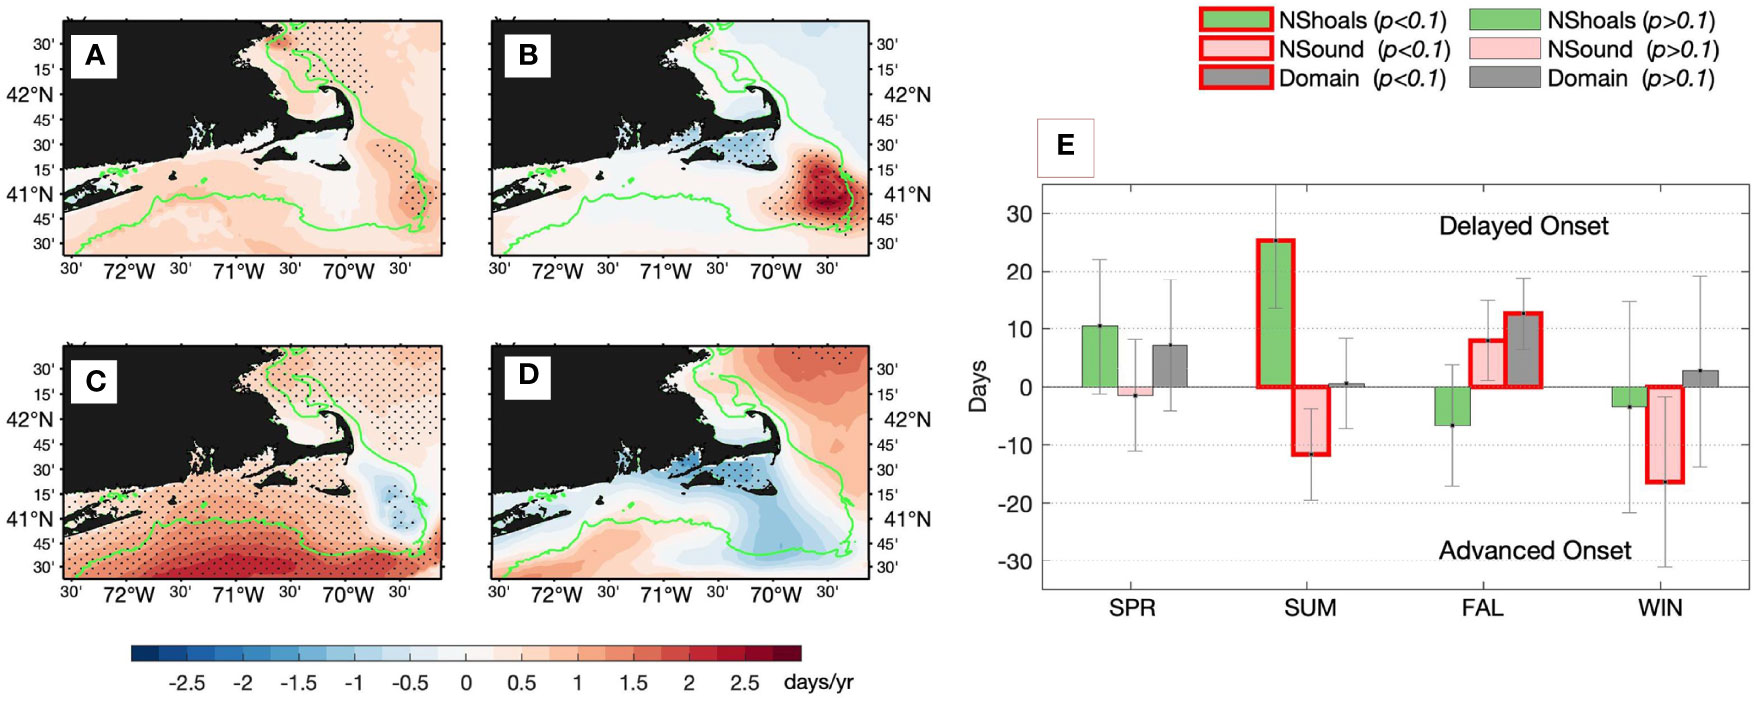
Figure 6 Linear trends in onset date (days/yr) for (A) spring, (B) summer, (C) fall, and (D) winter. Positive (negative) trends denote delayed (advanced) onsets. Areas with trends that are significant at 90% confidence interval are shaded by dots. The 50–meter isobath is highlighted in green. (E) Total shift in onset dates of the four seasons during 2006-2020. The three bars for each season denote the averages over the three respective areas (see Figure 2): Area I (Nantucket Shoals; green), Area II (Nantucket Sound, pink), and the study domain with Areas I & II excluded (gray). Red outlined bars denote the values are significant at 90% confidence interval.
The delayed start of the fall is the most broadly distributed among all seasons, with positive trends prevailing over almost the entire region except for a limited area in Nantucket Shoals. The rate of delayed onset increases southward, from 0.5–1 day/year in the Nantucket Sound and the GoM, up to 1.8 days/year on the seaward side of the 50-m isobath near the southern edge of the study domain. The shift to the generally later start of the fall suggests that the summer temperatures in the region lingered longer, increasingly intruding on the fall season. This pushed the winter season to also start later on the mid and outer shelf in the GoM (i.e., seaward of the 50-meter isobath), but did not seem to have much effect on the southern New England shelf to the south of Cape Cod. In the latter areas, the winter season tended to start earlier (negative trends) and the trends are statistically significant in Nantucket Sound.
Interestingly, the onset phenology change in the water body on Nantucket Shoals shows a sharply different pattern from those in Nantucket Sounds and elsewhere on the shelf. This unique pattern of phenology shift is clearly seen in Figure 6E and Table 1 that summarizes the total shifts in the onset dates of the four seasons in the past 15-years for the three areas defined in Figure 2: Area I (Nantucket Shoals), Area II (Nantucket Sound), and Area III (the broad domain excluding Areas I &II). In Area I (Nantucket Shoals), the significant change is the delay in the onset of summer by 25 ± 8 days (p<0.1) from 2006 to 2020. In Area II (Nantucket Sound), the summer and winter have started earlier by –12 ± 7 (p<0.1) and –16 ± 14 days (p<0.1), respectively, and the fall has shifted later by 8 ± 6 days (p<0.1). For the shelf areas away from the Cape waters (Area III), the delay of the fall by 13 ± 6 days (p<0.1) is the most characteristic change in the season onset.
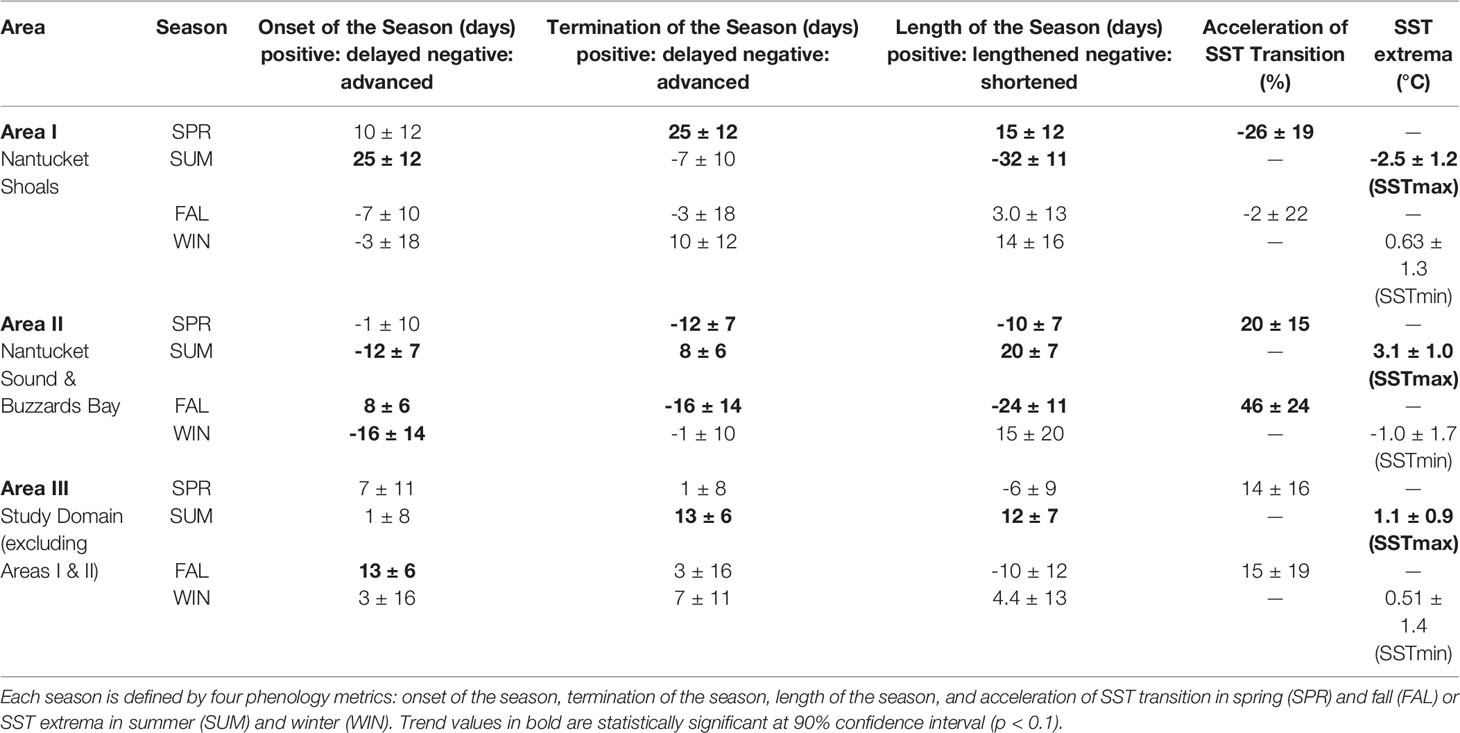
Table 1 Seasonal trends and phenology shifts in SST averaged in three areas: Nantucket Shoals (Area I), Nantucket Sound (Area II), and the study domain that excludes Areas I & II.
3.1.2 Change in the Length of Season
Shifts in the season onset and termination alter the length of the season (LOS). Changes of the season termination dates are not shown, because the termination pattern of the season is the same as the onset pattern of the following season. For instance, if the spring season terminates late, then the summer season will start late, and vice versa, and so the linear trend patterns of the termination dates are identical to those of the onset dates with offset of one season. This information can also be viewed in Table 2 that shows the total shifts in the termination dates averaged over Area I (Nantucket Shoals), Area II (Nantucket Sound), and Area III (the broad domain excluding Areas I &II).
Effects of the shifts in the onset and termination dates on the LOS in spring, summer, fall, and winter are quantified using linear trend analysis (Figures 7A–D). Positive trends denote the lengthening of the season and negative trends denote the shortening of the season. Spring has become shorter and summer become longer over the entire study domain if excluding the limited area over Nantucket Shoals. For the fall season, the LOS trends differ between the GoM and the southern New England shelf, with a slightly prolonged duration in the former but a considerably shortened duration in the latter. For the winter season, the trends are weak and not statistically significant, though there was a tendency for a longer winter on the southern New England shelf and a shorter winter in the GoM.
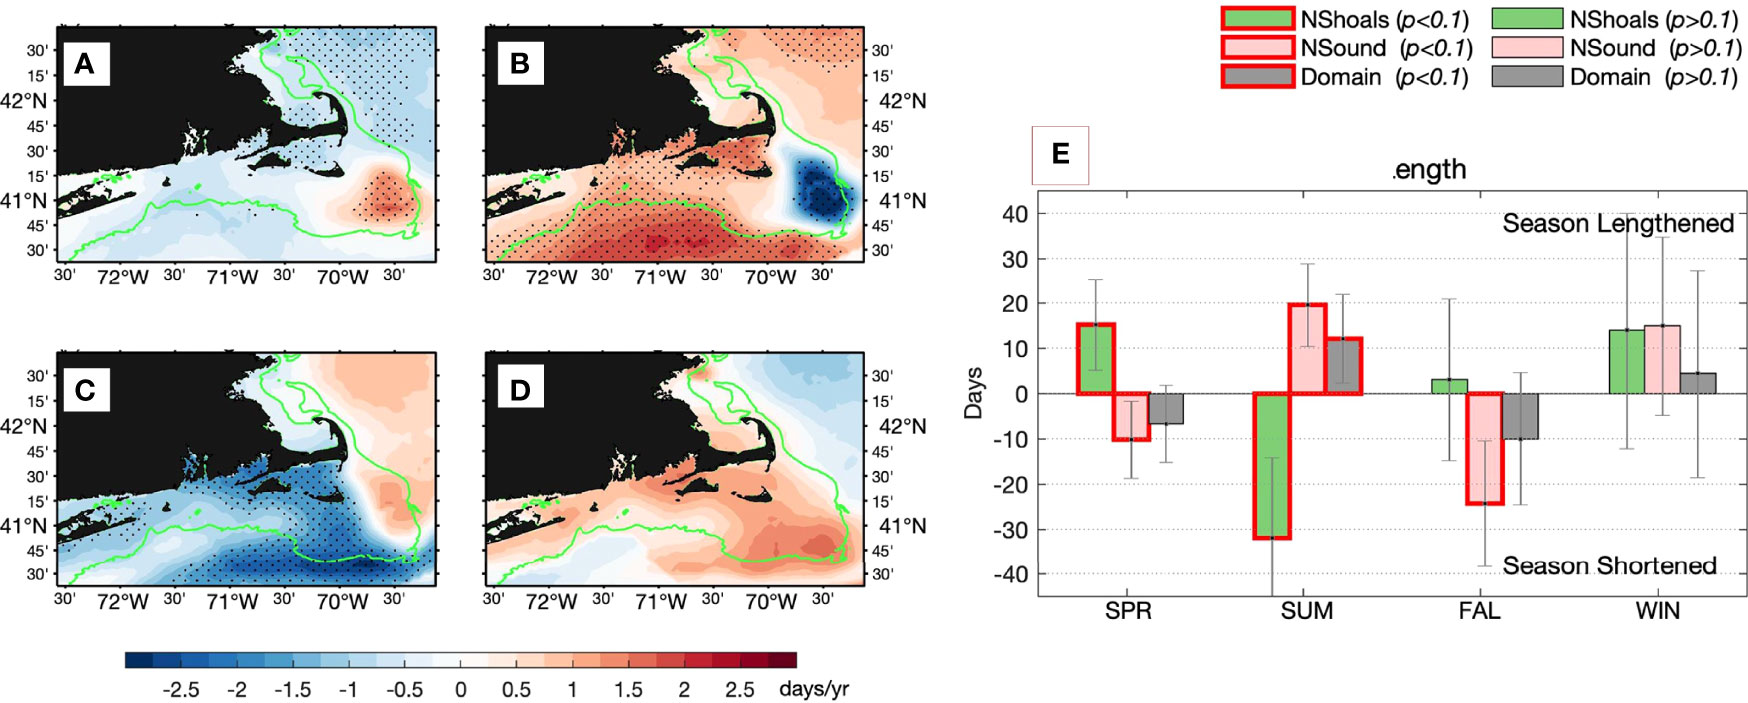
Figure 7 Linear trend in the length of season (days/yr) for (A) Spring, (B) Summer, (C) Fall, and (D) Winter. Positive (negative) trends denote a lengthened (shortened) season. (E) Total change in the length of the four seasons averaged over three areas the same specifications as Figure 6.
Throughout the four seasons, the LOS in Area II (Nantucket Sound) covaried with the LOS on the southern New England shelf, all experiencing shortened spring and fall seasons and prolonged summer and winter seasons. On the other hand, the LOS change in Area I (Nantucket Shoals) is uniquely different from the other shelf region, particularly in spring and summer. The sharp differences between Areas I and II are shown in Figure 7E and Table 1 that summarize the total LOS changes in four seasons during the past 15 years. The spring in Area I (Nantucket Shoals) has lengthened by 15 ± 12 days while summer cut short by –32 ± 11 days, while changes in fall and winter season lengths are not significant. The LOS trends in Area II (Nantucket Sound) indicate a lengthening of the summer warm season by 20 ± 9 days and shrinking of the spring and fall transition seasons by –10 ± 7 and –24 ± 11 days, respectively. By comparison, the most distinct change in Area III (the broad domain excluding Areas I & II) is the prolonged summer season by 12 ± 7 days.
3.1.3 Acceleration of Spring and Fall Transitions
The rates of SST change during the spring and fall transition seasons are affected by the LOS (Figure 8). In the following the spring warming rate is defined as a measure of how quickly SST increases from 8°CC (onset of spring) to 16°CC (onset of summer) for the given LOS of spring, and the fall cooling rate is a measure of how quickly SST decreases from 16°C (onset of fall) to 8°C (onset of winter) for the given LOS of fall. On average, the mean spring warming rates (Figure 8A) are greater (> 0.16°CC/day) on the mid to outer shelf but weaker on Nantucket Shoals (~0.12°C/day). The mean fall cooling rates (Figure 8C) are greater (>0.16 °C/day) in the nearshore waters off the southern New England coast and weaker on the outer shelf. The largest cooling rates are centered in two off-coast areas, one in Nantucket Sound - Buzzards Bay and the other in Long Island Sound.
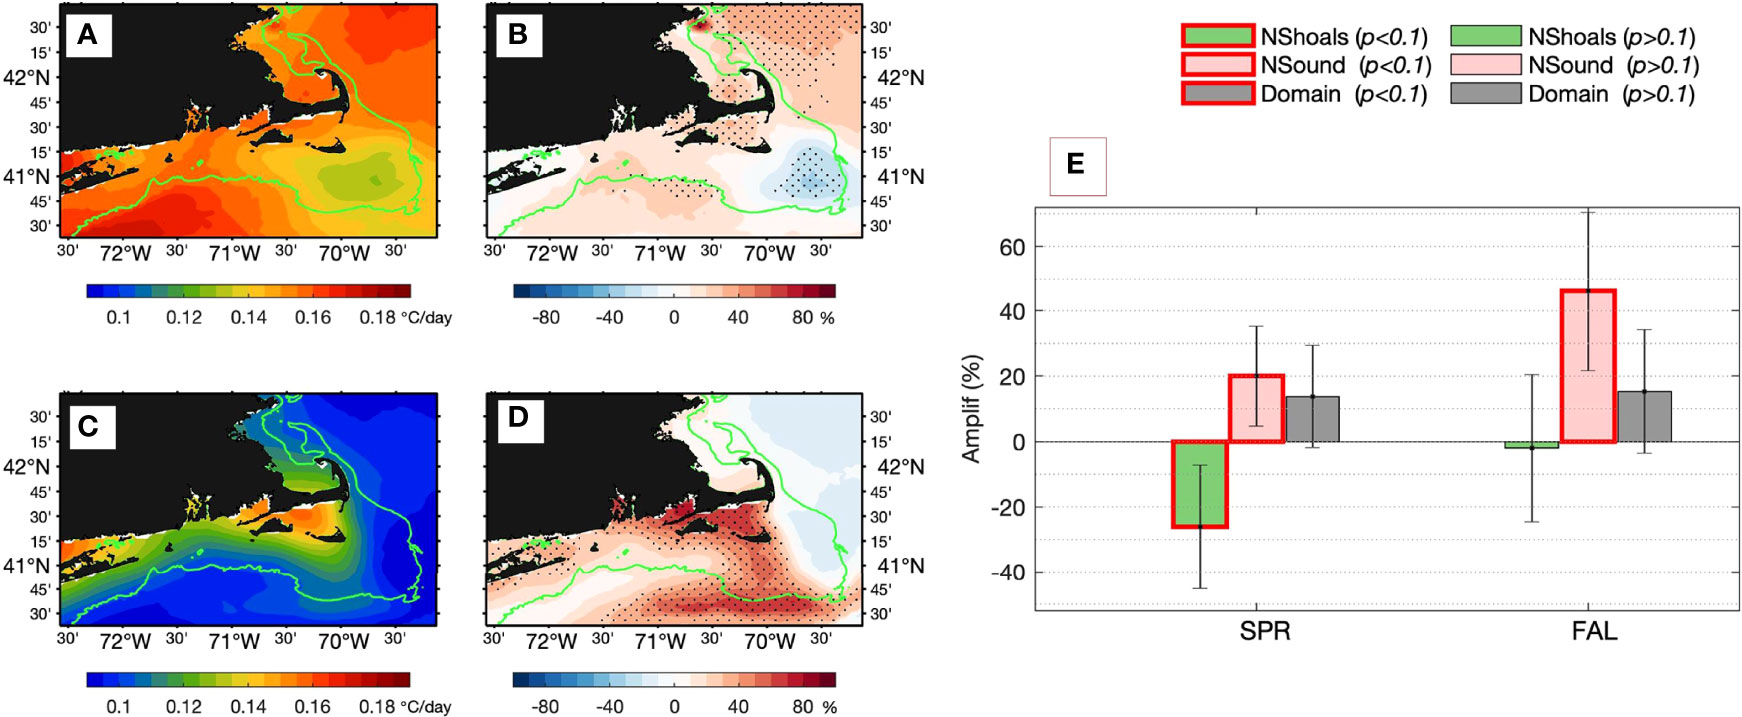
Figure 8 (A) Mean and (B) total acceleration of the SST transition rate in spring. (C) Mean and (D) total acceleration of the SST transition rate in fall. The 50–meter isobath is highlighted in green. In (B, D), areas with trends that are significant at 90% confidence interval are shaded by dots. (E) Total acceleration of the SST transition rate in spring and fall averaged over three areas with the same specifications as Figure 6E.
Linear trends in the warming and cooling rates were first estimated and then used in the following expression to calculate the percentage of acceleration (PA):
PA = Trend (°C/day/yr) × 15 (yr)/mean warming (or cooling) rate (°C/day) × 100 (%).
Positive PA value represents an acceleration of the SST transition rate, whereas negative PA value represents a deacceleration, or slowdown of the SST transition rate. The resultant PA patterns (Figures 8B, D) show that the spring warming rate has accelerated by 10-30% over the broad domain, with the exception in Nantucket Shoals where the warming rate has slowed down, in sharp contrast to the changes occurring elsewhere. The rate acceleration is statistically significant at the 90% confidence interval in the environs of Cape Cod and the GoM. In fall, the cooling rate has amplified on the southern New England shelf and weakened slightly in the GoM. The total changes in the PA values averaged over the three areas are summarized in Figure 8E and Table 1. In Area I (Nantucket Shoals), the SST transition rates have decreased by -26 ± 19% (p<0.1) in the spring but barely changed in the fall. In Area II (Nantucket Sound), the SST transition rates have increased by 20 ± 15% (p<0.1) in the spring and by 46 ± 24% (p<0.1) in the fall. The area emerges as a hotspot of accelerated season transitions on the inner shelf. The PA values averaged over Area III (the broad domain excluding Areas I &II) show that though SST transition rates have generally increased in both spring and fall, the basin averaged rates are not statistically significant because the spread (uncertainty) is large.
3.1.4 Change in Annual SST Maxima and Minima
Over the study domain, the summer peak temperatures are lowest in Area I (Nantucket Shoals) (Figure 9A), while the winter lowest temperatures are lowest in Area II (Nantucket Sound) and also in the Long Island Sound (Figure 9C). SST maxima show warming trends on a broad scale, with the largest rate of increase (>0.24°C/yr) and a moderate increase (~0.1°CC/yr) on the mid and outer shelf (Figure 9B). Strong cooling (negative) trends (< -0.12°C/yr) are seen in Area I (Nantucket Shoals), where the mean summer peak temperatures are known to be lower due to strong tidal mixing (Limeburner and Beardsley, 1982; Beardsley et al., 1985; Wilkin, 2006; He and Wilkin, 2006). This summer cooling spot, which stands against the warming backdrop of the shelf region, is a truly exceptional feature.
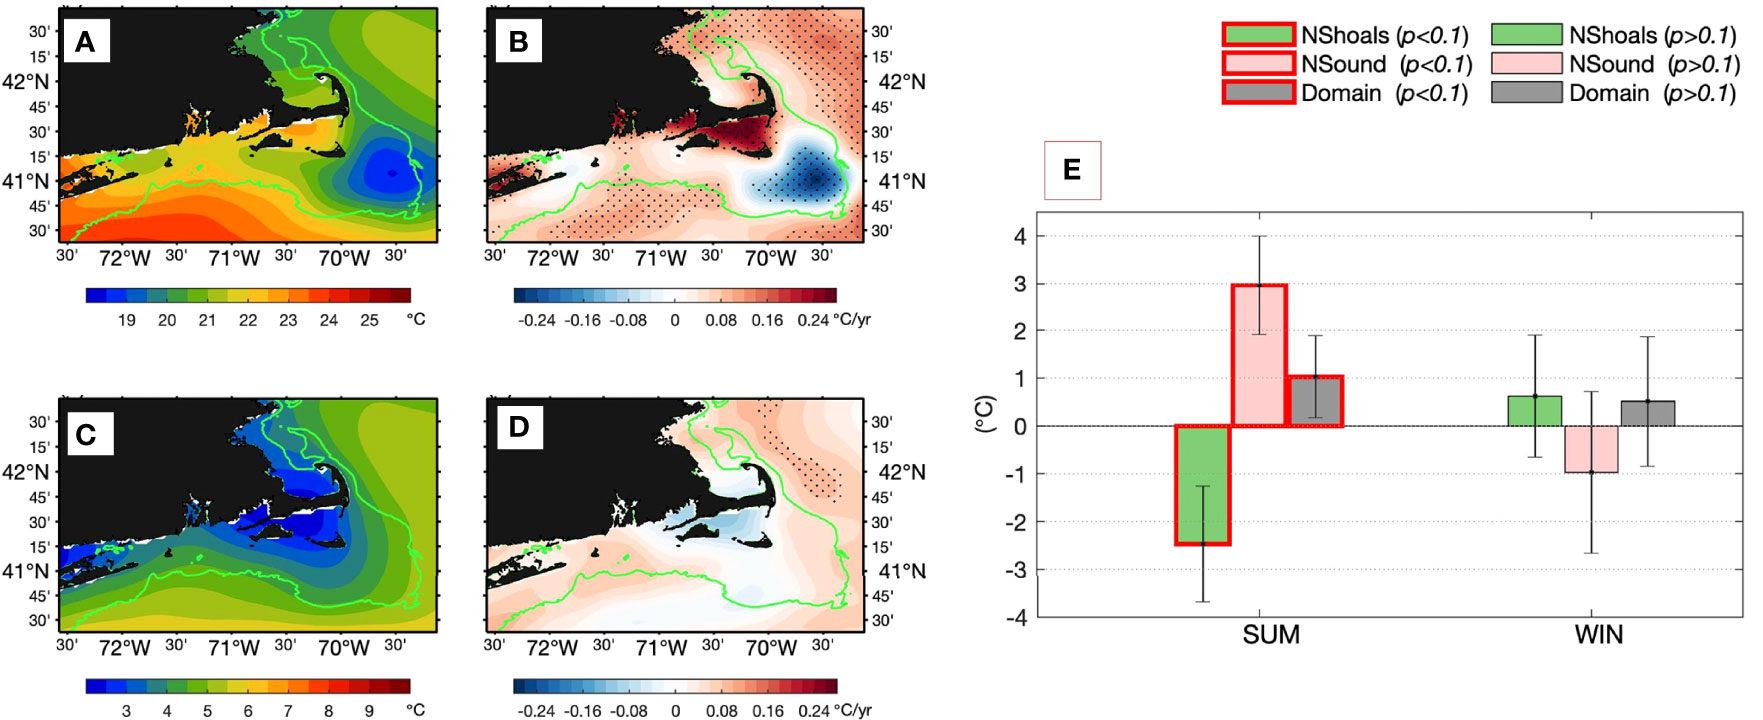
Figure 9 Same as Figure 8 but for SST extrema in summer and winter. (A) Mean and (B) linear trend of SSS maxima in summer. (C) Mean and (D) linear trend of SSS minimum in winter. The 50–meter isobath is highlighted in green. In (B, D), areas with trends that are significant at 90% confidence interval are shaded by dots. (E) Total change in the SST summer maxima and winter minima during 2006-2020 averaged over three areas with the same specifications as Figure 6E.
SST minima display a broad warming tendency in the study domain, with the limited exception of a cooling tendency in Area II (Nantucket Sound) (Figure 9D). Both the warming and cooling trends are weak. Trends with statistical significancy appear in a small area in the GoM, where the basin in winter has generally warmed up. The SST minima in Area I (Nantucket Shoals) have elevated only slightly, unlike the sharp change of summer SST maxima in the area.
The basin averages in Figure 9E and Table 1 reveal three patterns of change in SST extrema. In Area I (Nantucket Shoals), the decrease in summer maxima is significant, totaling about -2.5 ± 1.2°C (p<0.1) during the 15-year span, while the total increase in winter minima is negligible, 0.63 ± 1.3°C (p>0.1). In Area II (Nantucket Sound), summer maxima have increased considerably, totally about 3.1 ± 1.0 °C (p<0.1), and the winter minima have reduced by about −1.0 ± 1.7°C (p>0.1). In Area III (the broad domain excluding Areas I &II), there is an increase in both summer maxima and winter minima, and the change is significant at about 1.1 ± 0.9 °C (p<0.1) in summer and about half of the amount, 0.51 ± 1.4 °C (p>0.1), and not significant in winter.
The change in SST extrema reflects the change of the amplitude of the SST annual cycle. Major changes of the SST annual cycle in the three areas can be characterized as follows: the annual cycle is reduced in Area I, amplified in Area II, and elevated in Area III. These modifications have occurred with asymmetric intensity, which were more intense in summer than in winter. The statistical numbers in Figure 9E and Table 1 show that the magnitudes of the change in summer extrema are all statistically significant and about 2 – 4 times larger than those changes in winter extrema. In particular, the 2.5°C deduction of SST maxima in Area I and more than 3°C increase of SST maxima in Area II are about 2-3 times larger than the changes on the broad shelf in Area III. Theses significant warming and cooling spots in the Cape Cod waters are the exceptional features amid the baseline warming on the New England shelf.
3.2 SST Trends on Calendar Months
Warming of the NES waters is commonly investigated using SST data on the 12 calendar months with each season represented by three months (e. g. Shearman & Lentz, 2010; Forsyth et al., 2015; Chen et al., 2020). Winter usually spans from January through March, Spring from April through June, Summer from July to September, and Fall from October to December. To put the SST phenology change in the context of the change of monthly-mean SST fields, the SST trends in each of the 12 months were estimated (Figure 10).
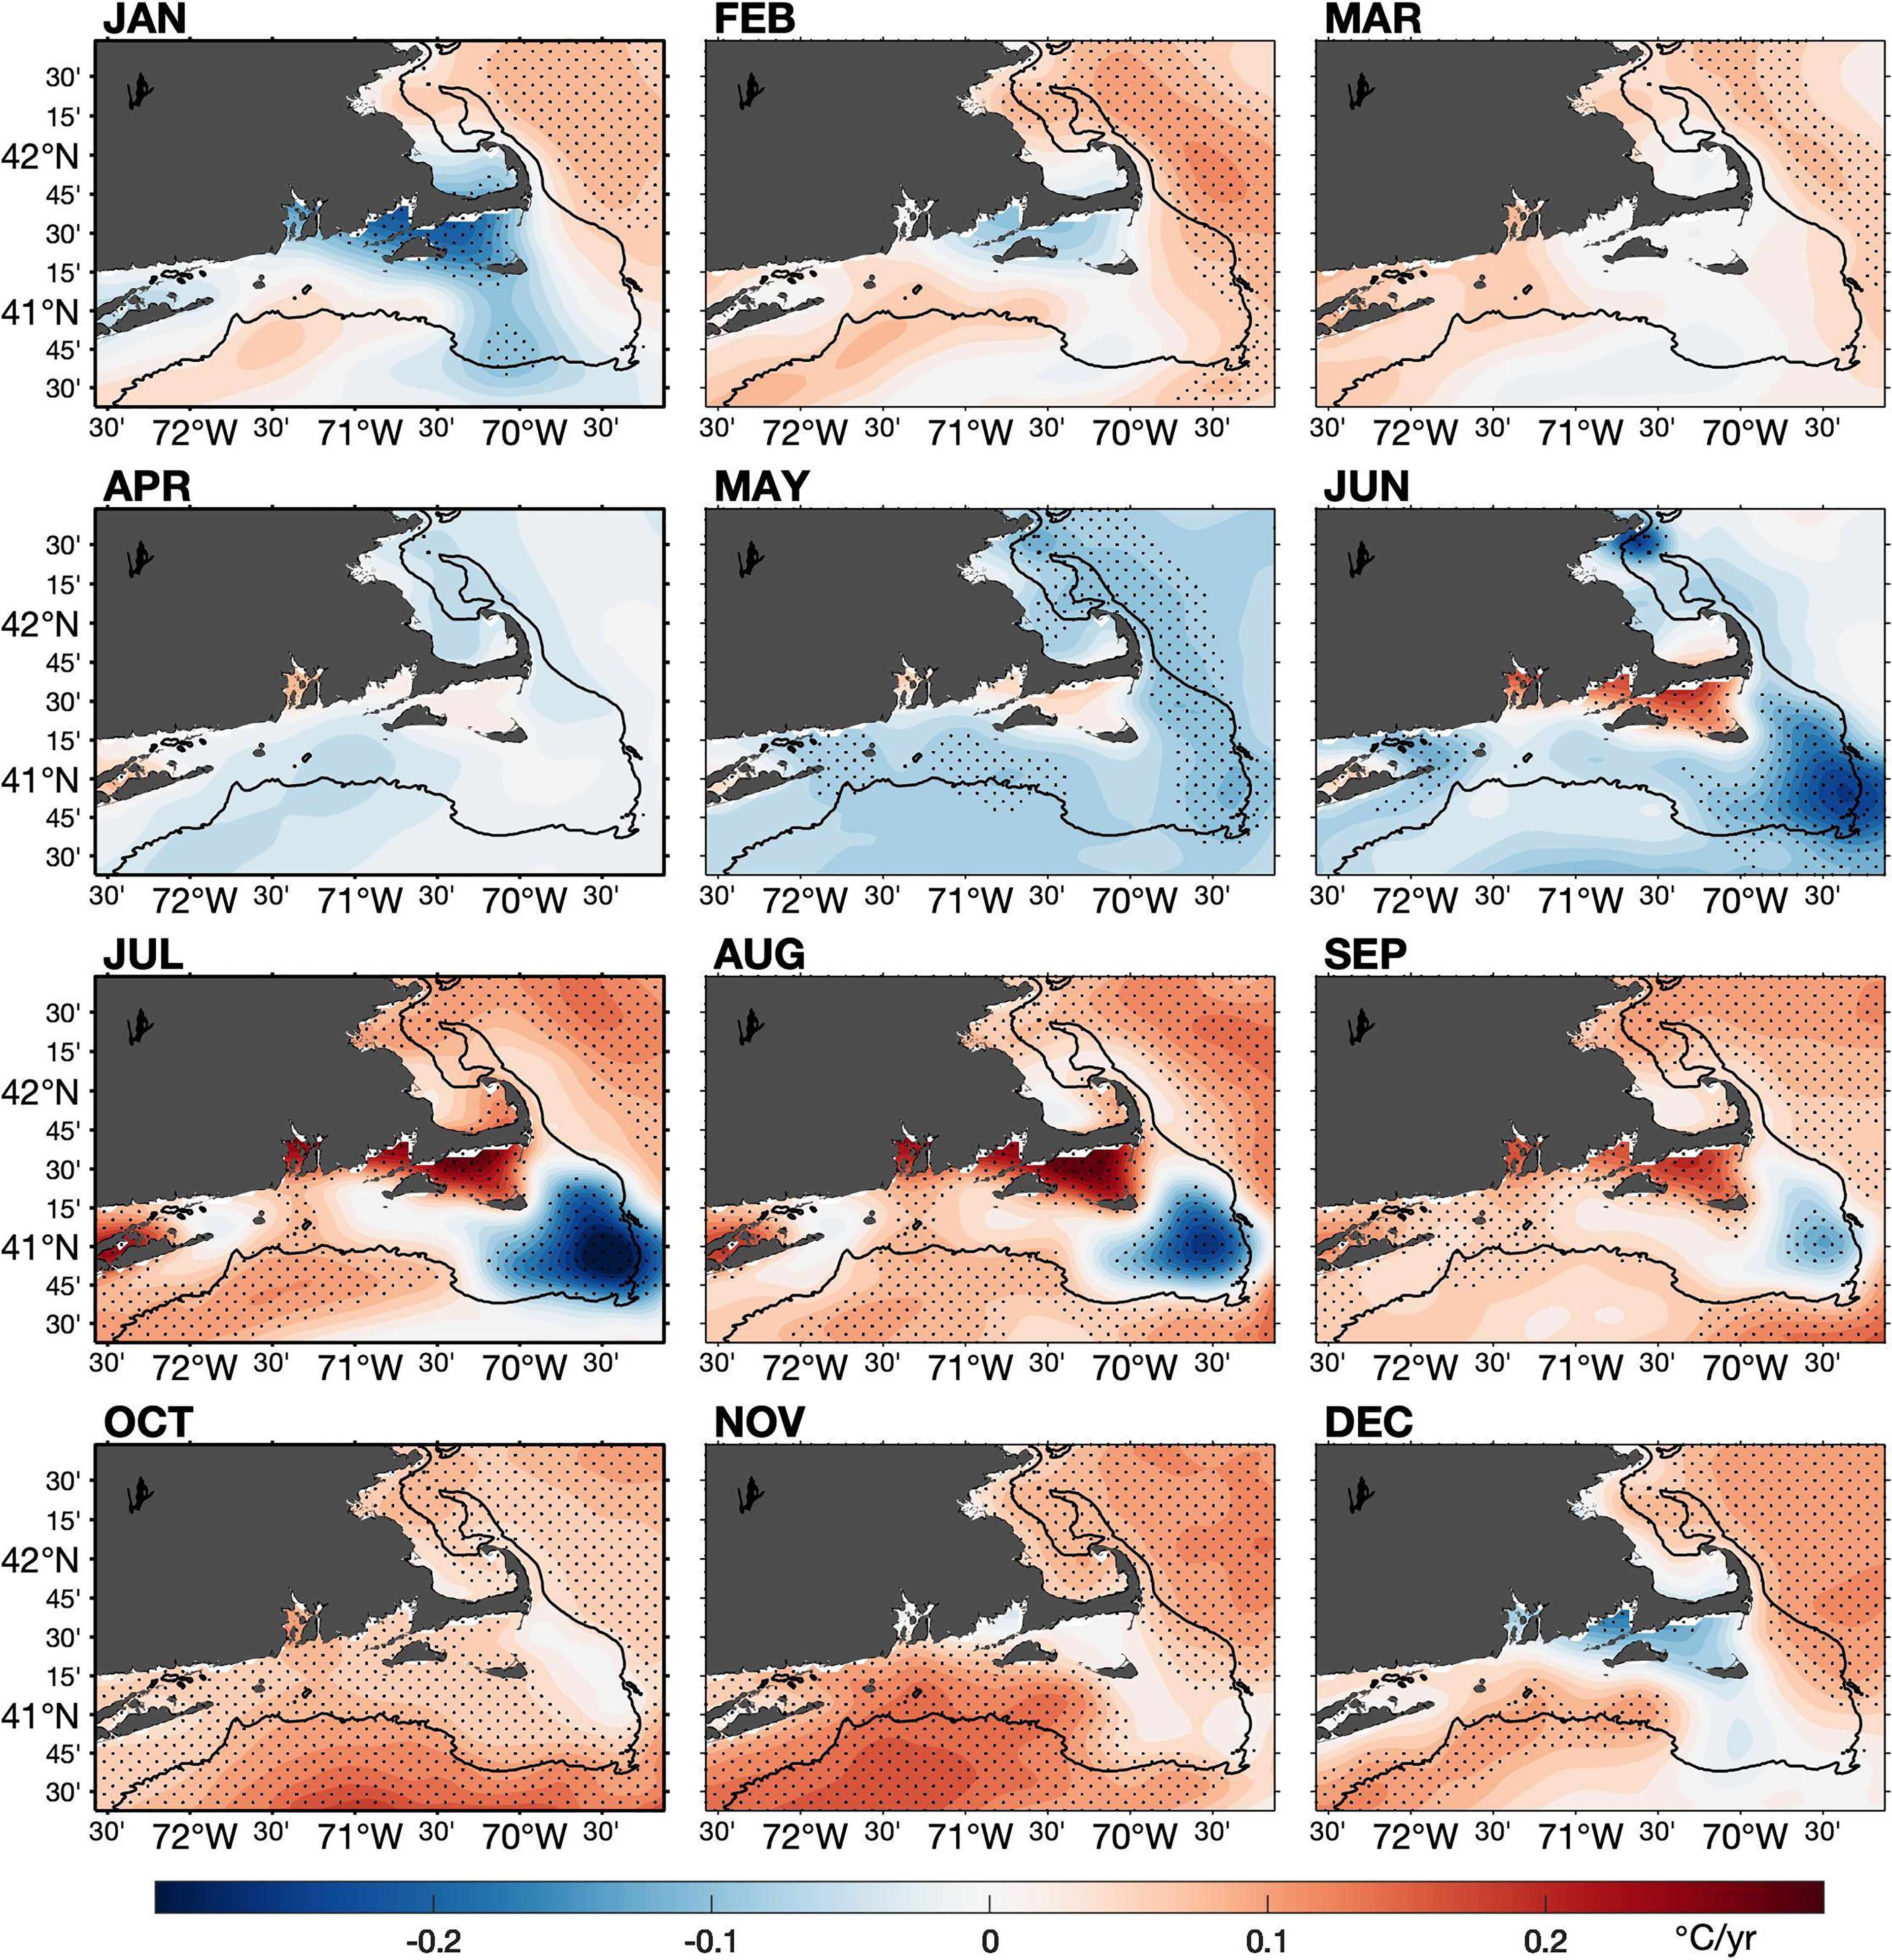
Figure 10 Linear trends of monthly-mean SST from January to December constructed from OSTIA. Areas with trends that are significant at 90% confidence interval are shaded by dots. The 50–meter isobath is highlighted in black.
The monthly SST trends have distinct evolving features throughout the year. During January–March, the southern New England shelf region was dominated by cooling trends, with the maximum intensity (< -0.1°C/yr) centered in Area II (Nantucket Sound). The cooling trends decayed quickly with time after the peak intensity in January. Meanwhile, the GoM was dictated by a moderate warming (~ 0.05 – 0.08°C/yr; p<0.1) that persisted through the winter months. In April, warming trends emerged in Area II (Nantucket Sound) that stood out amid the broad weak cooling trends in the study domain. The localized warming in Aera II continued to develop in the following months through October. On the other hand, the cooling trends were short-lived on the broad shelf region and diminished by the end of June, with the exception for the intensified cooling in Area I (Nantucket Shoals). While the broad shelf region was overwhelmed with warming vibes persisting through the second half of the year from July through December, Area I was clearly a warming hole on the shelf, particularly in the summer months (July – September).
Overall, there has been a baseline warming on the broad shelf. The warming trends prevailed in the GoM for nine out of twelve months, with the exception for the spring period (April – June) when weak cooling trends dominated the area. The rates of SST increase were mostly in the range of 0.05 – 0.12°C/year, with the higher rates occurring in July and August. The rates of SST decrease were less than 0.05°C/year, most evident in May. On the southern New England shelf, the warming trends also predominated the region for nine months from July to March and slight cooling tendencies presided during April – June. The rates of changes were most pronounced on the mid to outer shelf in October – November, associated with a tongue of warmer water moving into the study domain along the seaward side of the 50-m isobath.
Reduction of the SST annual cycle in Area I is evident, where the cooling trends predominated six months from April to September, with the maximum intensity in June – August. Amplification of the SST annual cycle in Area II is characterized by pronounced warming trends in seasonally warm months (June – September) and pronounced cooling trends in seasonally cold months (December–January). The domain-wide warming appeared in the fall (October – November), during which SST trended up almost everywhere on the shelf.
3.3 Trend Patterns From the 0.25°C-Gridded OISST
The 0.25°C-gridded OISST product is widely used in studying the NES warming (e. g. Thomas et al., 2017; Chen et al., 2020). To examine the effects of spatial resolution on representing the spatial heterogeneity of the SST changes in the near shore environment, the monthly SST trends using OISST were constructed for the same 15-year span (2006-2015).
The OISST-based monthly trend patterns (Figure 11) agree well with those based on the 0.05°C-gridded OSTIA (Figure 10) on the broad shelf, though fine-scale details are lacking. OISST captures the spring cooling but only in May and with much reduced scale and duration. OISST well depicts the predominant warming trends in the second half of the year from July to December, and the rates of the SST increase are comparable to those computed from OSTIA. In particular, it well produces the warming trends associated with the warmer water intrusion along the seaward side of the 50-m isobath, which is consistent with OSTIA.
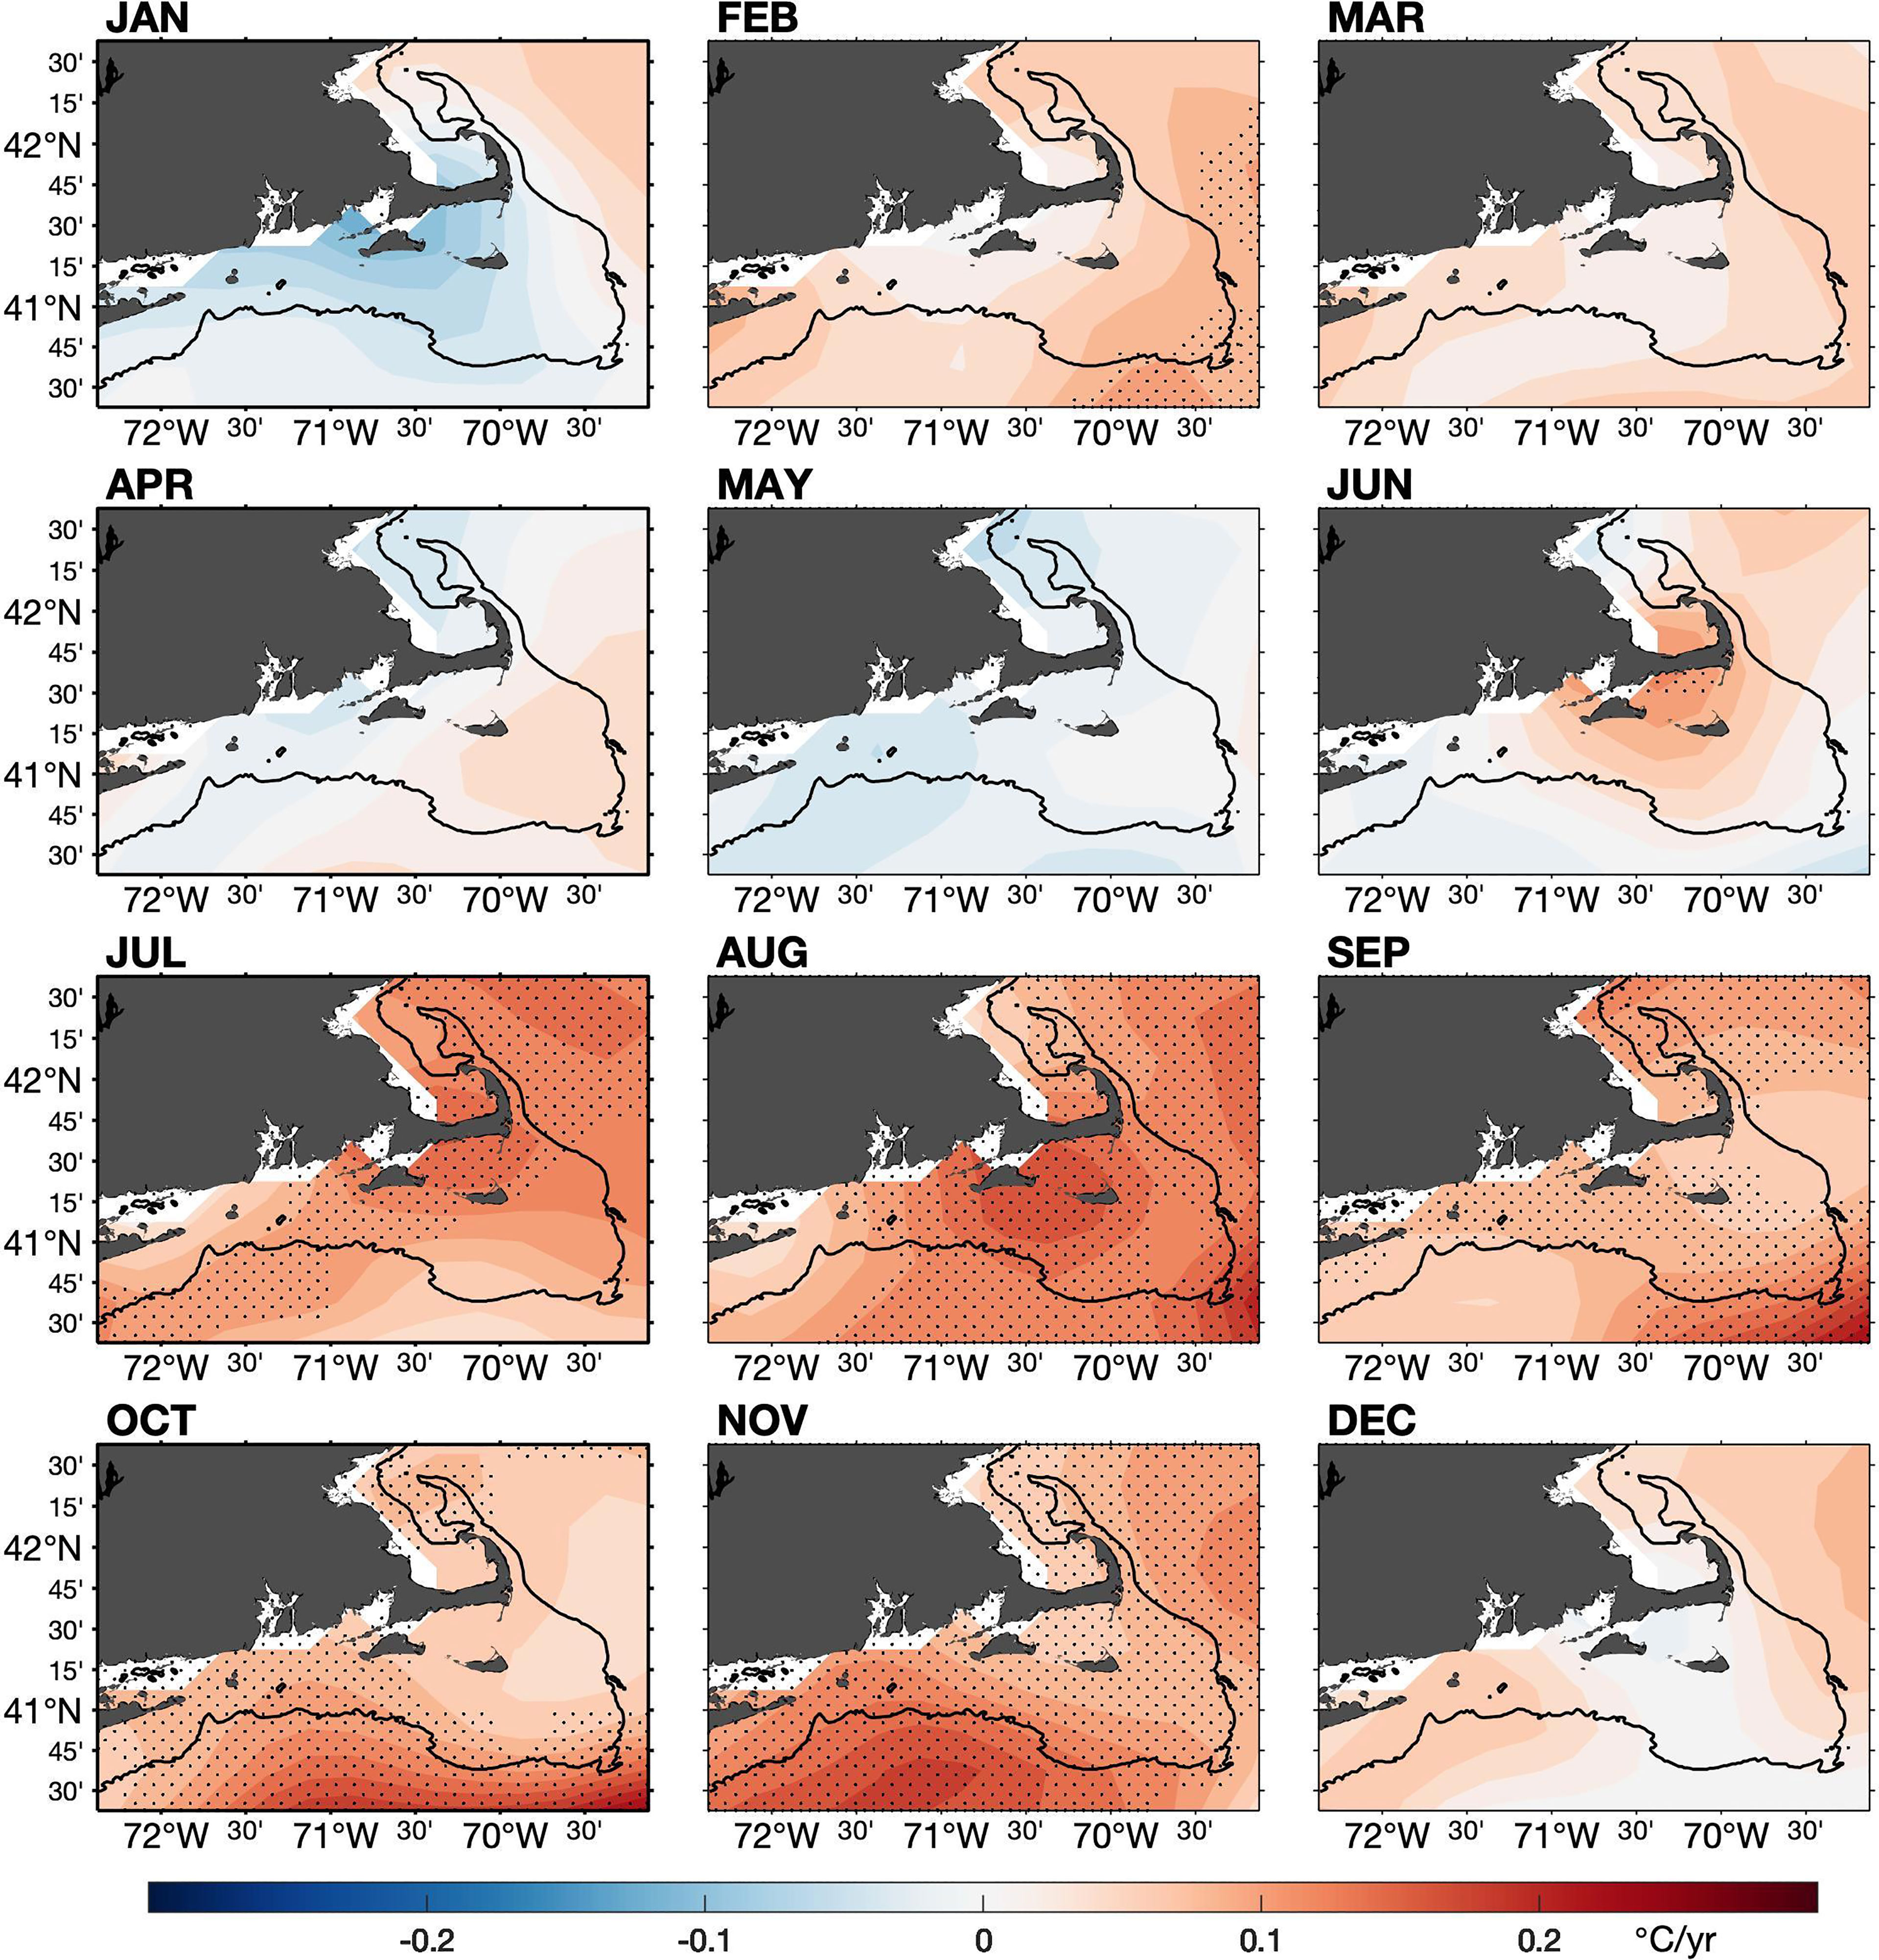
Figure 11 Same as Figure 10 but constructed from OISST.
Nonetheless, OISST underrepresents the SST trends in the water bodies surrounding Cape Cod. The pronounced cooling trends in Area I (Nantucket Shoals) that are so essential in the OSTIA-based SST changes are completely absent. The bathymetry-confined summer warming trends in Area II (Nantucket Sound) are shaped in a roundish blob in the neighborhood of Cape Cod, which deviates from the OSTIA-based depiction in both scope and magnitude. Similarly, the localized winter cooling trends in Area II is underestimated by OISST. Furthermore, OSTIA shows that the SST trends in Areas I & II are strongly seasonally dependent. By comparison, OISST does not have the resolution to differentiate the warm and cold spots in the Cape Cod waters in summer when the shelf was dominated by warming vibes.
3.4 Warming Rates Based on OISST and OSTIA
Long-term changes in SST are usually determined from annual-mean SST anomalies after removing the time-mean reference. The linear trends derived from OSTIA and OISST annual mean anomalies are shown in Figures 12A, B, respectively. The two trend maps have markedly differences in representing the spatial heterogeneity of SST changes, particularly on the southern New England shelf. The cold spot in Area I (Nantucket Shoals) and the warm spot in Area II (Nantucket Sound) stand out in OSTIA trend map, indicating that the these seasonally varying SST local features left strong imprints on the annual mean pattern. OISST produces broad warming trends over the entire study domain, showing no warming hole. The two products have a better agreement in the GoM where the warming trends were predominant on the seaward side of the 50-m isobath. Nonetheless, the overall warming rate in the study domain is higher in OISST than in OSTIA.
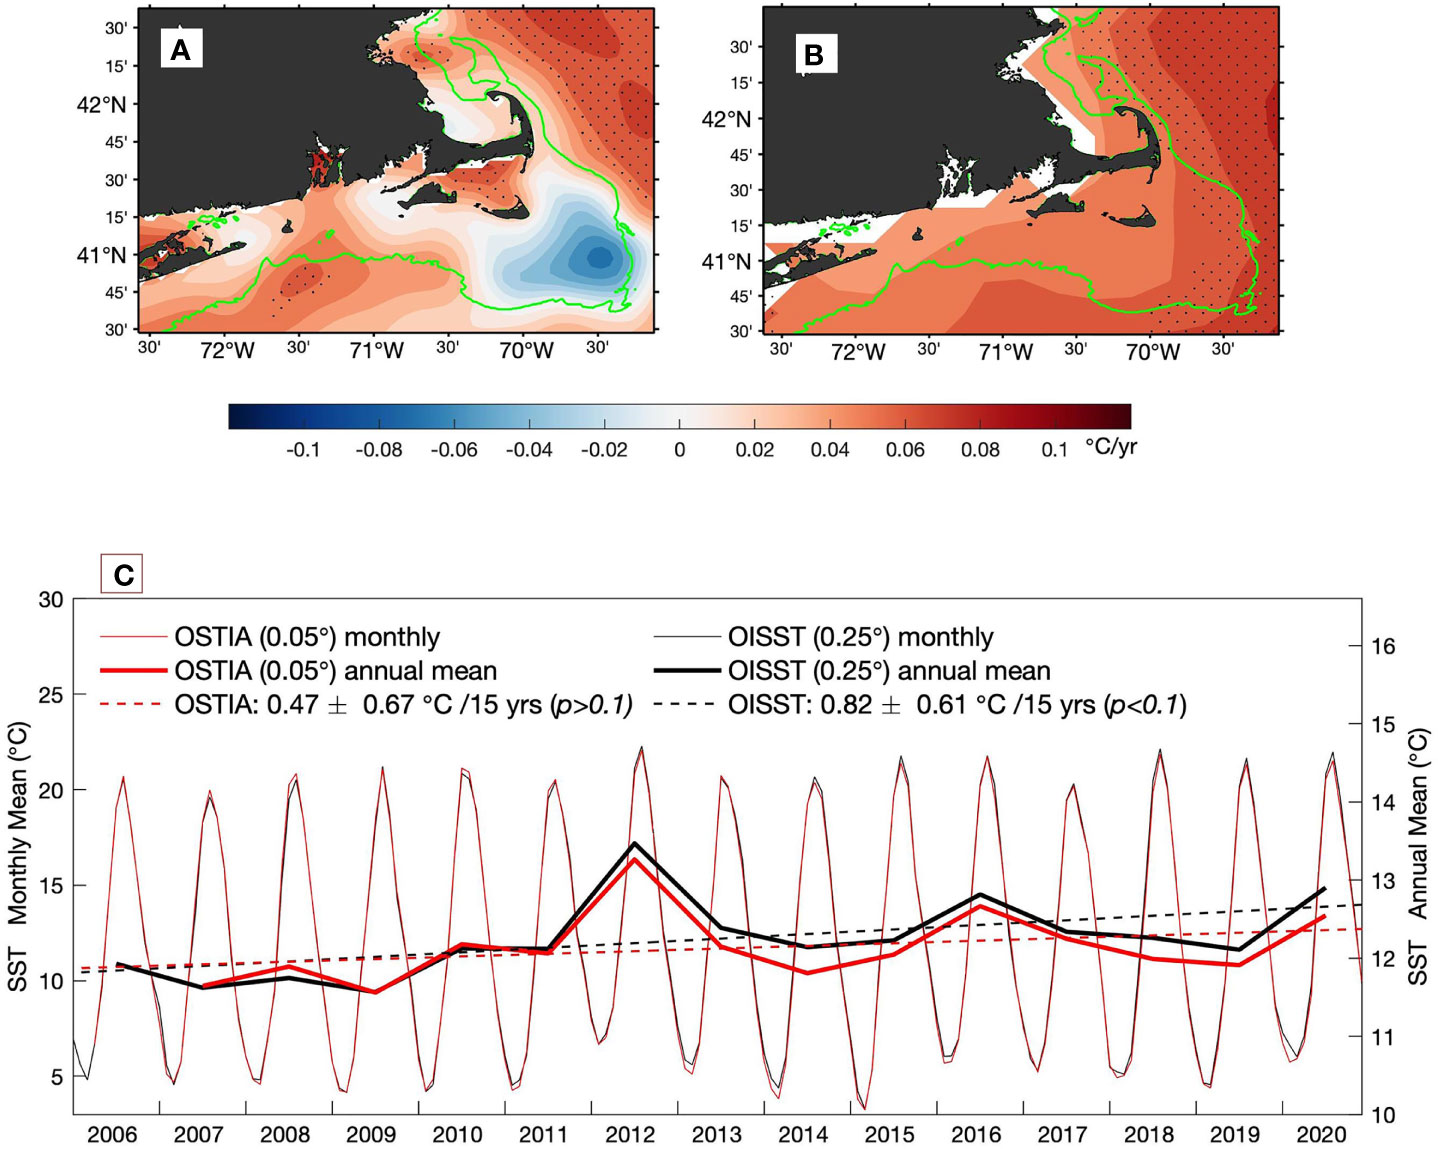
Figure 12 Linear trends of annual-mean SST constructed from (A) OSTIA and (B) OISST. Areas with trends that are significant at 90% confidence interval are shaded by dots. The 50–meter isobath is highlighted in black. (C) Comparison of domain-averaged monthly-mean (thin lines) and annual-mean (thick lines) SST time series between OSTIA (red) and OISST (black). Dashed lines are the trend lines of annual-mean SST time series. OSTIA SST shows a rate of increase at 0.47 ± 0.67°C/15 years that is statistically not significant at the 90% confidence interval (p > 0.1). OISST shows a rate at 0.82 ± 0.61°C/15 years that is statistically significant (p < 0.1).
The lack of representation of small-scale SST variability is apparently a key factor for the different warming rates between OISST and OSTIA. To see how this factor affects the estimates of the warming rates, we first constructed the time series of monthly-mean SST averaged over the study domain (thin lines in Figure 12C). The two monthly-mean time series are almost identical, with the exception for small differences in annual SST minima and maxima. The SST minima are relatively lower in OSTIA, though the SST maxima are more comparable in most years. We then constructed the time series of domain-averaged annual-mean SST (thick lines in Figure 12C) and found that OISST annual means are generally higher than OSTIA annual means and the separation is larger after 2010. The annual-mean differ by about 0.13 ± 0.15°C when averaged over the 15-year period. The SST minima in the two products differ by 0.18 ± 0.21°C on monthly-mean average, and the SST maxima differ by 0.06 ± 0.27°C. It appears that the lower SST minima in OSTIA is a leading cause of its lower annual means.
Interestingly, the small difference in SST annual means has considerably large effect on the estimates of the warming rate. The linear trend analysis conducted to the two annual-mean time series yielded a warming rate of 0.47 ± 0.65°C/15 years (p>0.1) for OSTIA and of 0.82 ± 0.61°C/15 years (p<0.1) for OISST. The rate of warming produced by OISST nearly doubles the rate produced by OSTIA. Additionally, the OISST trend estimate is statistically significant at the 90% confidence interval while the OSTIA estimate is not. The SST perturbations associated with marine heatwaves in 2012 and 2016 (Chen et al., 2014; Chen et al., 2015) appear to have a larger effect on the trend analysis of OSTIA.
The SST phenology metrics were examined using daily OISST. It is not a surprise that the SST phenology change in Area I (Nantucket Shoals) identified in OSTIA is completely missed. The change in Area II (Nantucket Sound) is similar to the change on the broad shelf, which is characterized more profoundly by the lengthening and warming of the fall season. As a result, there is no clear indication of an amplified annual cycle in Area II except for a slight increase in the summer SST maximum. In summary, the pattern of the SST phenology change in OISST is largely homogeneous across the study domain.
3.5 NDBC Measurements
The study domain comprises a number of buoy stations that are owned and maintained by NOAA’s National Ocean Service (NOS) and National Data Buoy Center (NDBC) to provide high-frequency marine meteorological, oceanographic, and geophysical measurements for real-time monitoring and forecast of marine environment. These measurements are accessible at the NDBC website (http://www.ndbc.noaa.gov) and often serve as the base datasets for studies of climate variability (e.g. Shearman and Lentz, 2010; Chen et al., 2014). It would be of interest if NDBC buoy data could verify the two satellite SST products with different grid resolutions. However, two factors make this approach less effective. One is that both OISST and OSTIA apply a bias correction algorithm that nudges the satellite SST analysis toward in situ SST observations from ships, buoys and floats (Donlon et al., 2012; Huang et al., 2021). NDBC are routinely assimilated and hence cannot be used as independent validation. The other factor is that the majority of NDBC buoys are deployed on the mid to outer shelf (>50-m isobath), which may not be able to fully address SST variability on the inner shelf. Nonetheless, NDBC measurements may still have useful insights as buoy and satellite observations are different types of observations. Buoy SSTs are point measurements and represent time averages over the sample intervals (typically less than 60 minutes), while satellite SSTs are area averages of instantaneously measured SSTs over the spatial footprint of the satellite.
A survey of NDBC buoys in the study domain led to the selection of four buoy stations, 44013 (East of Boston), 44020 (Nantucket Sound), 44097 (Block Island), and 44008 (Southeast Nantucket) (Figures 12A, B). NDBC measurement records often have missing data gaps due to instrument failures or power loss at the station. The measurement records at the four stations have adequate continuity during the 2006-2020 satellite observation span. The station information for the four buoys is listed in Table 2. Stations 44020 and 44097 (Block Island) started to operate in 2009, while the other two stations started in the 1980s and have longer time series. The SST measurements are archived at frequencies ranging between every 6 minutes and every 60 minutes. To facilitate the comparison with daily satellite datasets, the high-frequency NDBC measurements were averaged on daily basis.
Figures 12A, B show that all four buoys are in areas of warming trends. Station 44008 (Southeast Nantucket) is the one nearest to Nantucket Shoals, but located on the outskirt of the cooling trends. The lack of buoy measurements within Nantucket Shoals makes it difficult to pin down the cause of the differences between the two satellite products in the area. It is interesting to note that the two satellite products agree well on the distribution of mean and seasonal variability of SST in the study domain (Figure 2), but they do differ on interannual and longer timescales. This can be seen from the comparison of the STD patterns constructed from SST anomalies that have the annual cycle removed (Figures 13A, B). In OISST, the interannual STD pattern is similar to its annual STD pattern, featuring larger variability on the southern New England shelf and weaker variability in Nantucket Shoals and the GoM. In OSTIA, there is a considerable amount of interannual STD on the eastern side of Nantucket Shoals, contrasting sharply to the low annual STD in the area. OSTIA is also more clear than OISST in depicting the largest interannual STD in Nantucket Sound where Station 44020 is located.
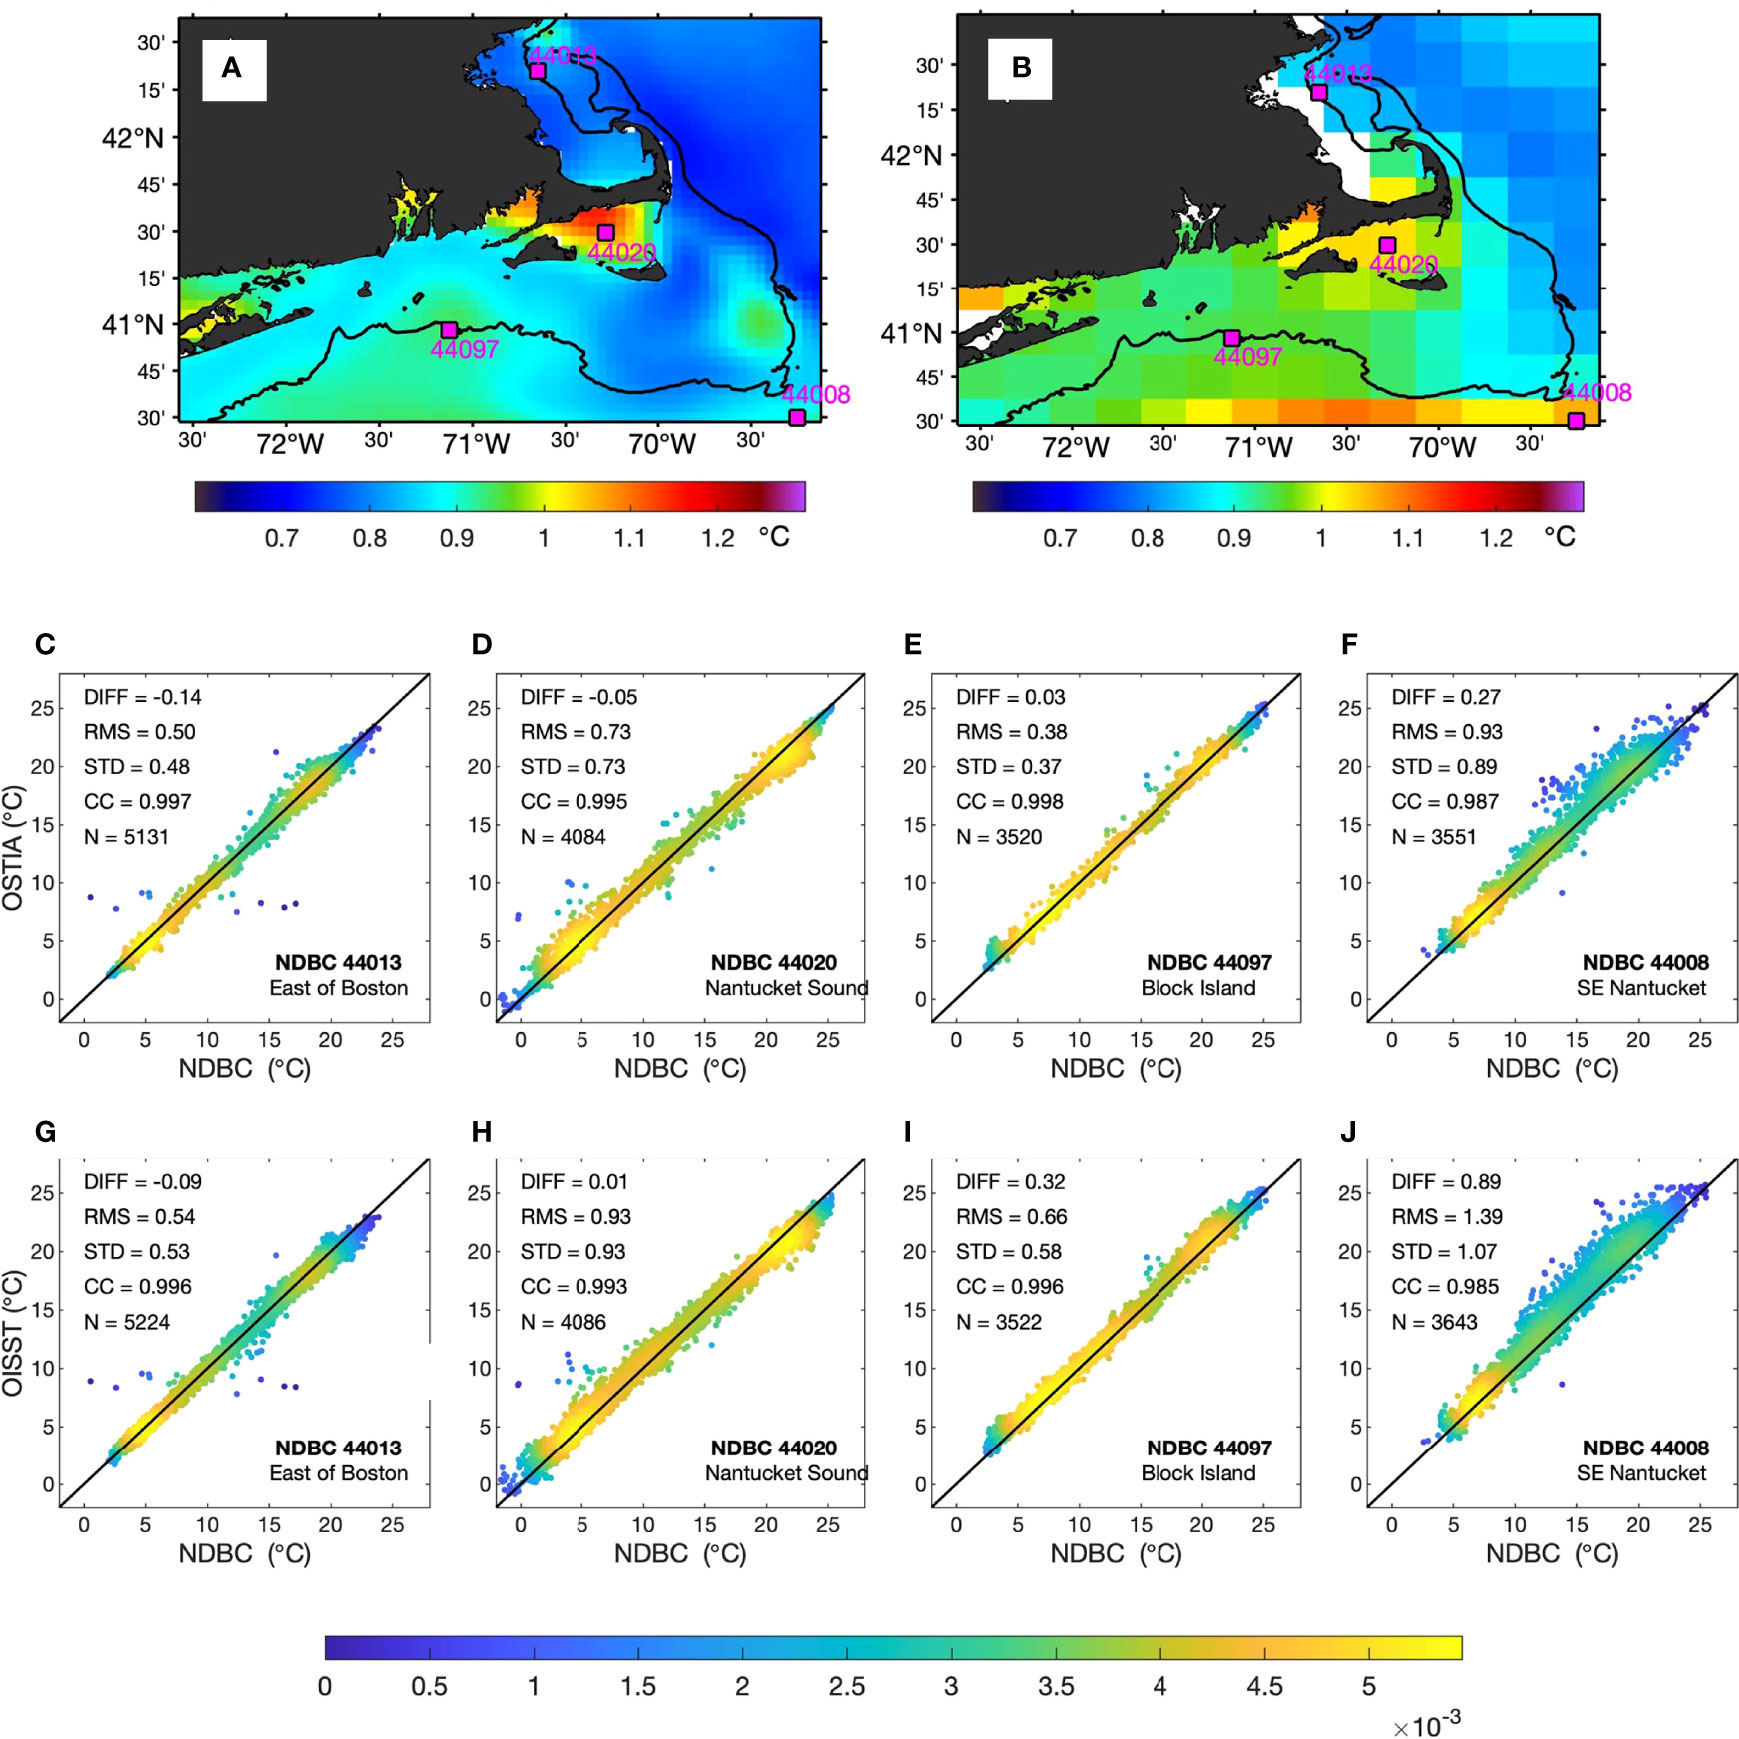
Figure 13 Standard deviations of SST anomalies after removing time-mean seasonal cycle constructed from (A) OSTIA and (B) OISST. The 50–meter isobath is highlighted in black. The four black outlined red squares denote the locations of the four selected NDBC buoys. (C–F) are scatter plots colored by Kernel Density Estimate (KDE) to the relationship between NDBC (x-axis) measurements and collocated OSTIA SST (y-axis) at the four selected stations (44013, 44020, 44097, and 44008), respectively. (G–J) are same as (C–F) but for OISST.
The performance of OSTIA and OISST with collocated NDBC measurements at the four stations is evaluated using the scatter plots (Figures 13C–J). The statistical measures, including mean satellite-buoy differences (or bias), root-mean-squared error (RMSE) and STD of satellite-buoy differences, and correlation coefficient (CC), are listed on each plot. OSTIA performs generally better than OISST at all four locations. OSTIA has a poor comparison at Station 44008 (Southeast Nantucket), where it has a warm bias of 0.27°C and an RMSE of 0.93°C. At this location, OISST is biased by 0.89°C, which is three times larger than OSTIA. The large warm bias in OISST is evident in the scatter plot with all points skewed to the left (positive bias) on the OISST side.
Daily-mean time series of buoy and satellite SSTs were constructed at the four NDBC sites (Figure 14). Although NDBC data records have missing data gaps, there is good consistency between collocated buoy measurements and satellite SSTs. Linear trend analysis was conducted for SST maxima and minims using OSTIA dataset, revealing the SST extrema have trended upward at all locations except for the downward trend in SST minima at Station 44020 (Nantucket Sound). The estimated rates of SST changes are listed in Table 2. The trends at the four locations are consistent with the trend maps in Figure 11, confirming that the SST annual cycle in Nantucket Sound has amplified, featuring a reduction of the winter SST minima and an increase of the summer SST maxima. The broad shelf away from Cape Cod waters have been subject a baseline warming, with an upward trend in both winter and summer SST extrema.
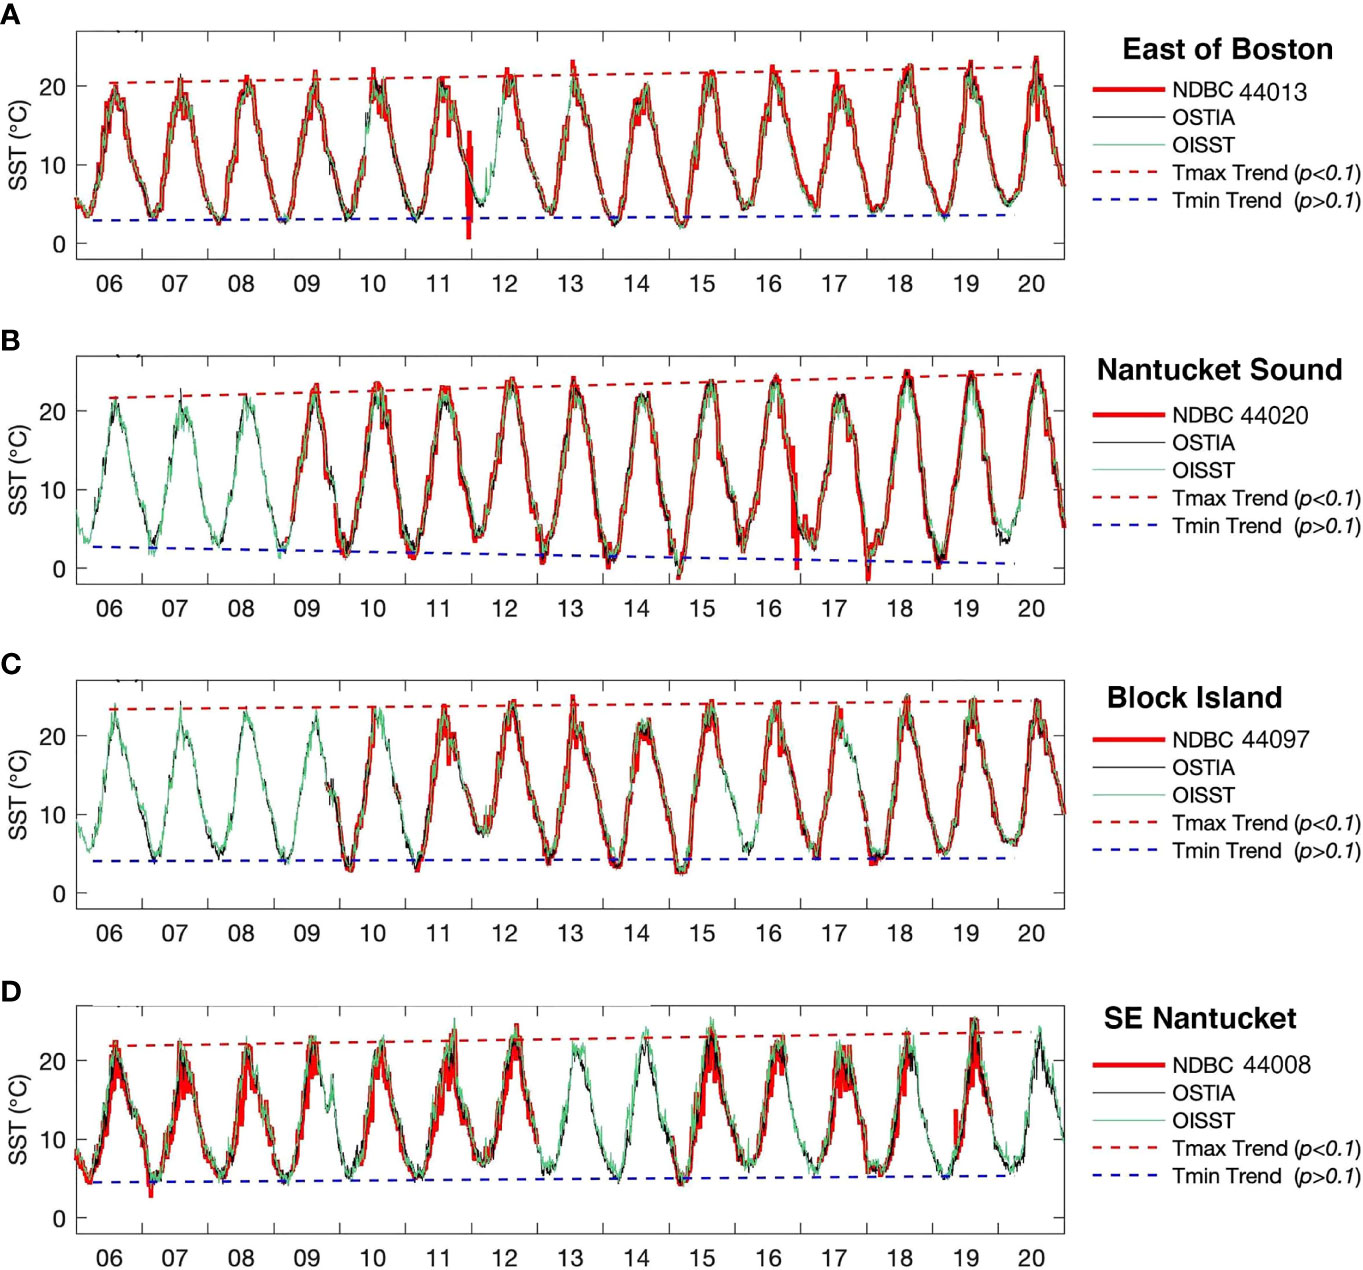
Figure 14 Comparison of daily-mean time series of NDBC measurements (red), OSTIA (black), and OISST (green) at NDBC station (A) 44013, (B) 44020, (C) 44097, and (D) 44008. The dashed red (black) line denotes the trend line of OSTIA SST maxima (minima) with the rate of change listed in Table 2.
4 Discussion
4.1 Three Patterns of Phenology Trends
The study identified the warm and cold spots in Cape Cod waters amid the recent warming of the New England Shelf (Figures 15A, B) and found that three different patterns of SST phenology changes are closely related to the bathymetry of the study domain. Major changing features are characterized in Figures 15C–E, in which two annual cycles averaged at the first (2006-2009) and the last four years (2017-2020) of data record are drawn to illustrate the phenology shift and the SST trends for each month are superimposed to describe the coherent SST changes in monthly-mean fields.
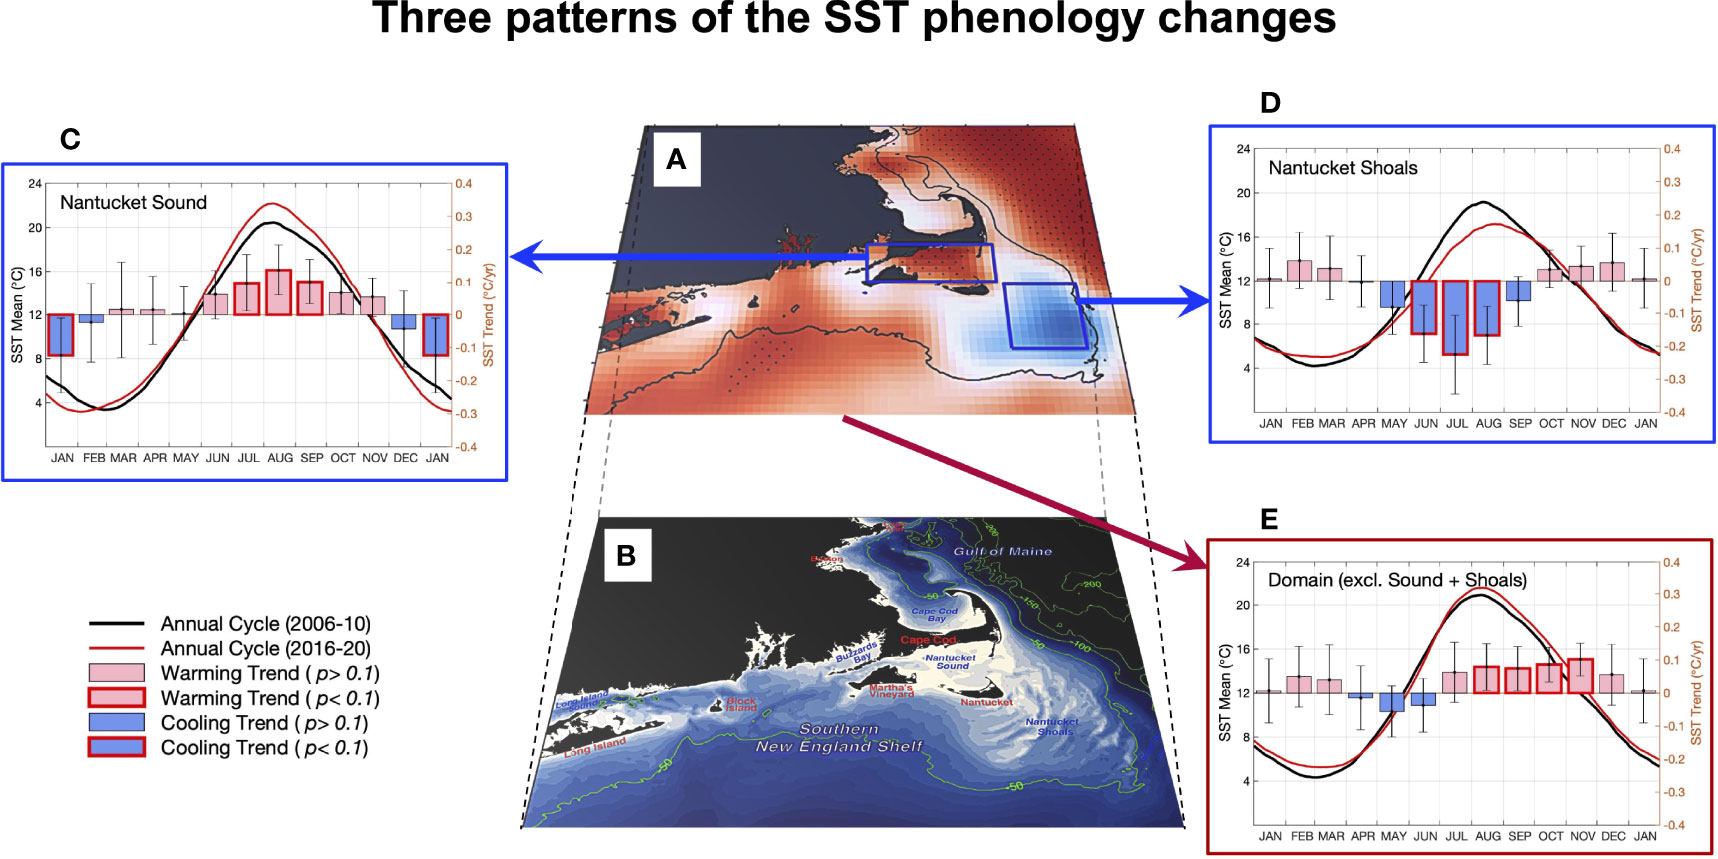
Figure 15 (A) OSTIA SST captured three patterns of SST phenology trends in the past 15 years that are related closely to the bathymetry of the study domain (B). The three patterns are: (C) the warm spot in Nantucket Sound, (D) the cold spot in Nantucket Shoals, and (E) the forward shifted annual cycle on the broad shelf away from the Nantucket Sound and Shoals. In (C–E), the black (red) line (left y-axis) denotes the SST annual cycle averaged over the first (last) five years of the data record. The bars (right y-axis) denote the linear trends of monthly-mean SST in each month, with red (blue) bars representing warming (cooling) trends and thick red outlined bars the trends that are statistically significant at the 90% confidence interval.
In Nantucket Sound where the warm spot occurs (Figure 15C), the SST annual cycle has amplified, featuring enhanced SST maxima and minima and lengthening of the summer and winter seasons. The prolonged warm and cold seasons have intruded on the spring and fall seasons, causing an acceleration in the SST transition rates (Figure 8). On Nantucket Shoals where the cold spot takes place (Figure 15D), the SST annual cycle has reduced its magnitude in summer, resulting from the strong surface cooling in June–August. On the broader shelf region away from Cape Cod waters (Figure 15E), the warming is prevalent. This warming occurred as a result of forward shifting of the annual cycle, most evident in the second half of year (August–November). The shift extended the summer temperatures to the fall, leading to a pronounced warming from the late summer through the fall. The forward shift was also noticeable in spring and produced a weak cooling in April – June. One general tendency across all areas is the greater degree of the phenology change in summer than in winter. This also explains the overall warming on the shelf when the linear trends are derived from annual mean fields (Figure 12).
4.2 Differences Between OSTIA and OISST
Our study shows that within the selected NES domain, changes in the SST phenology are highly diverse and vary with geographic locations. The 0.05°C spatial resolution is equivalent to 4.2 km at 41°C41′ latitude of Cape Cod and is five times finer than the 0.25°C-gridded OISST. The phenology shift on the NES and the resultant warming in later summer and fall are in good agreement with previous studies (Thomas et al., 2017; Chen et al., 2020). However, the distinct warm and cold spots in Cape Cod waters have not been previously identified. The fine-resolution satellite dataset allows SST in the nearshore areas to be resolved in such great detail that is impossible to see using lower resolution datasets. The warm and cold spots are remarkable features in June – September, standing out distinctly from the broad warming occurring elsewhere on the shelf. The great spatial heterogeneity in the SST changes on the New England shelf highlights that the responses of the nearshore waters to the climate warming are highly diverse and complex.
It is worth noting that although OSTIA and OISST are both “bulk” SST, they are defined and processed differently. OSTIA is defined as foundation SST, which is free of diurnal temperature variability. Observed data were eliminated when the wind speed was less than 6 m s-1 during daytime to ensure the production of foundation SST (Donlon et al., 2012; Good et al., 2020). OISST has no special treatment of the effect of diurnal variability (Huang et al., 2021) and hence, the type of “bulk” SST generated from the optimal interpolation is not clearly defined. Presumably, the potential effects of the cool skin and warm layer (Fairall et al., 1996; Minnett et al., 2011; Alappattu et al., 2017; Zhang et al., 2021) could produce implications in OISST.
4.3 Forcing Mechanisms
There are many physical processes that can affect the SST on the New England shelf (Atkinson et al., 1983). Key processes include atmospheric wind and buoyancy forcing (Shearman and Lentz, 2010; Chen et al., 2014), advection of cold and fresh waters by the equatorward-flowing Shelf Currents and Shelfbreak Jet (Beardsley et al., 1985), advection of warm and salty waters by Warm Core Rings originating from the poleward-flowing Gulf Stream (Greene and Pershing, 2003; Pershing et al., 2015), and tidal circulation and mixing (Beardsley et al., 1985; Limeburner and Beardsley, 1982; Wilkin, 2006; He and Wilkin, 2006). SST in the two water bodies surrounding Cape Cod exhibit trends different from each other and from the broader shelf region, indicating that the leading forcing mechanism for SST varies with the geographic location.
Hydrographic observations of the water bodies in the Nantucket Sound and Shoals are scarce, with only a limited number of field programs available. Major field programs are the bimonthly hydrographic surveys (May 1978–July 1979; Limeburner and Beardsley, 1982), the Nantucket Shoals Flux Experiment (NSFE, March 1979–April 1980; Beardsley et al., 1985), the Coastal Mixing and Optics study (CMO, August 1996–June 1997; Lentz et al., 2003), and the low-speed component of the Coupled Boundary Layers and Air Sea Transfer program (CBLAST-Low, summers of 2001, 2002, and 2003; Wilkin, 2006). Limeburner and Beardsley (1982) found that the shallow waters of Nantucket Sound are sheltered by the islands of Martha’s Vineyard and Nantucket and have the highest summertime temperatures on the inner shelf south of Cape Cod. Limeburner and Beardsley (1982) described Nantucket Shoals as a leaky boundary between the GoM and the New England continental shelf and noted that tidal mixing is so strong that the water column is well mixed in the vertical throughout the year even through the spring and summer. Wilkin (2006) conducted a model study of the summer heat budget and produced three characteristic regimes: Nantucket Sound heats rapidly in June and then maintains warm temperatures with little net air–sea heat flux and weak eastward heat transport; tidal mixing on the Nantucket Shoals maintains perpetually cool ocean temperatures despite significant air–sea heating; and the midshelf south of Martha’s Vineyard is strongly stratified by sustained air–sea heating and warms steadily through July and August with only modest cooling from the westward inflows of the GoM waters. Wilkin (2006) showed that the interplay between winds, tidal mixing, and the climatological mean flows defines the seasonal characteristics of SST in each regime. Additionally, the westward flows of the cooler GoM waters have the same cooling effect as the tides but are generally confined to the outer shelf in the shelf/slope front, which is located along approximately the 100-m isobath at the continental shelf break (Linder and Gawarkiewicz, 1998; Gawarkiewicz et al., 2012).
Drivers for the SST changes on decadal and longer timescale are likely linked to climate variability and changes in the Atlantic Ocean, such as the North Atlantic Oscillation, Atlantic Multidecadal Variability, and the northward excursions of the Gulf Stream (Greene and Pershing, 2003; Pershing et al., 2015). Studies have shown that the Gulf Stream has become increasingly unstable after 2000 and a significant regime shift has occurred in the Warm Core Ring activities (Andres, 2016; Gangopadhyay et al., 2019). The increase in Warm Core Ring production increases the shelf-slope heat exchange, which has been suggested as a driver in some marine heatwaves (Gawarkiewicz et al., 2004; Hare et al., 2016; Gawarkiewicz et al., 2019; Chen et al., 2021). Shearman and Lentz (2010) noted that the SST trends to the north of Cape Hatteras are larger than the regional atmospheric temperature trend but similar to atmospheric trends over Labrador and the Arctic, where waters of the GoM and MAB are sourced from. Hence, changes in ice cover (Stroeve et al., 2007) and continued Arctic warming (Steele et al., 2008) could have a profound impact on the warming of the NES.
4.4 Implications
Our study identified the co-existence of warm and cold spots in the environs of Cape Cod amid the rapidly warming of the NES, highlighting a highly diverse nature of climate impacts on coastal waters. SST has an important role in coastal ecosystems, affecting the thermal habitat constraints and spawning patterns of commercially important marine species (Perry, 2005; Hoegh-Guldberg and Bruno, 2010). It has been observed that warming of the surface oceans has been effectively re-arranging the broader marine landscape, causing marine species to shift away from where they are used to live and alter the timing of nature’s calendar (Poloczanska et al., 2013). In this regard, the cold spot identified in this study has profound implications on local scale for spawning and subsequent rearing habitat.
Long-term trends and changes in the SST phenology have direct impacts on coastal ecosystems and fishery resources (Hare et al., 2012; Slesinger et al., 2019; Staudinger et al., 2019; Friedland et al., 2020). They also create a condition conducive to the occurrence of extreme events in the region, such as marine heatwaves that produce persistent warming above the baseline SST trends (Chen et al., 2015; Gawarkiewicz et al., 2019). Since these prolonged high temperatures exacerbate climate change impacts on coastal waters (Pershing et al., 2018), their connections to the SST phenology trends need to be better understood to guide the sustainable management of coastal ecosystems under climate change. Regionally focused observational networks at vital sites and key spots are needed so that the pulses of change can be better monitored and attributed. Meanwhile, high-resolution models that can resolve the processes and mechanisms in the nearshore environment are required to gain a better understanding of the spatially varying patterns of coastal warming as revealed in this study.
Data Availability Statement
The original contributions presented in the study are included in the article/supplementary material. Further inquiries can be directed to the corresponding author.
Author Contributions
LY and KY conceived the idea and performed the analysis. LY processed the original dataset and led the figure production. Both authors contributed to writing and editing the manuscript and agree to be accountable for the content of the work. All authors contributed to the article and approved the submitted version.
Funding
This study is supported by NOAA Global Ocean Monitoring and Observation (GOMO) Program, grand number NA19OAR4320074.
Conflict of Interest
The authors declare that the research was conducted in the absence of any commercial or financial relationships that could be construed as a potential conflict of interest.
Publisher’s Note
All claims expressed in this article are solely those of the authors and do not necessarily represent those of their affiliated organizations, or those of the publisher, the editors and the reviewers. Any product that may be evaluated in this article, or claim that may be made by its manufacturer, is not guaranteed or endorsed by the publisher.
Acknowledgments
We thank Glenn Gawarkiewicz for comments during the writing of the manuscript.
References
Alappattu D. P., Wang Q., Yamaguchi R., Lind R. J., Reynolds M., Christman A. J. (2017). Warm Layer and Cool Skin Corrections for Bulk Water Temperature Measurements for Air-Sea Interaction Studies. J. Geophys. Res. Oceans. 122, 6470–6481. doi: 10.1002/2017JC012688
Andres M. (2016). On the Recent Destabilization of the Gulf Stream Path Downstream of Cape Hatteras. Geophys. Res. Lett. 43, 9836–9842. doi: 10.1002/2016GL069966
Atkinson L. P., Thomas N., Blanton J. O., Chandler W. S. (1983). A Long-Term Record of Blended Satellite and in Situ Sea Surface Temperature for Climate Monitoring, Modeling and Environmental Studies, Earth Syst. Sci. Data Discuss. 88, 4705–4718. doi: 10.1029/JC088iC08p04705
Banzon V., Smith T. M., Liu C., Hankins W. (2016). The Nantucket Shoals Flux Experiment (NSFE79). Part I: A Basic Description of the Current and Temperature Variability. J. Phys. Oceanogr. doi: 10.5194/essd-2015-44
Beardsley R. C., Chapman D. C., Brink K. H., Ramp S. R., Schlitz R. (1985). The Nantucket Shoals Flux Experiment (NSFE79). Part I: A Basic Description of the Current and Temperature Variability. J. Phys. Oceanogr. 15, 713–748. doi: 10.1175/1520-0485(1985)015<0713:TNSFEP>2.0.CO;2
Blanchard J. L., Jennings S., Holmes R., Harle J., Merino G., Allen J. I., et al. (2012). Potential Consequences of Climate Change for Primary Production and Fish Production in Large Marine Ecosystems. Philos. Trans. R. Soc Lond. B. Biol. Sci. 367, 2979–2989. doi: 10.1098/rstb.2012.0231
Chen K., Gawarkiewicz G., Kwon Y., Zhang W. G. (2015). The Role of Atmospheric Forcing Versus Ocean Advection During the Extreme Warming of the Northeast U.S. Continental Shelf in 2012. J. Geophys. Res. Oceans. 120, 4324–4339. doi: 10.1002/2014JC010547
Chen K., Gawarkiewicz G. G., Lentz S. J., Bane J. M. (2014). Diagnosing the Warming of the Northeastern U.S. Coastal Ocean in 2012: A Linkage Between the Atmospheric Jet Stream Variability and Ocean Response. J. Geophys. Res. Oceans. 119, 218–227. doi: 10.1002/2013JC009393
Chen K., Gawarkiewicz G., Yang J. (2021). Mesoscale and Submesoscale Shelf-Ocean Exchanges Initialize an Advective Marine Heatwave. J. Geophys. Res. Oceans. 126, e2021JC017927. doi: 10.1029/2019GL085455
Chen Z., Kwon Y.-O., Chen K., Fratantoni P., Gawarkiewicz G., Joyce T. M. (2020). Long-Term SST Variability on the Northwest Atlantic Continental Shelf and Slope. Geophys. Res. Lett. 47, e2019GL085455. doi: 10.1029/2019GL085455
Christidis N., Stott P. A., Brown S., Karoly D. J., Caesar J. (2007). Human Contribution to the Lengthening of the Growing Season During 1950–99. J. Climate 20, 5441–5454. doi: 10.1175/2007JCLI1568.1
Donlon C. J., Martin M., Stark J., Roberts-Jones J., Fiedler E., Wimmer W. (2012). The Operational Sea Surface Temperature and Sea Ice Analysis (OSTIA) System. Remote Sen. Env. 116, 140–158. doi: 10.1016/j.rse.2010.10.017
Fairall C. W., Bradley E. F., Godfrey J. S., Wick G. A., Edson J. B., Young G. S. (1996). Cool-Skin and Warm-Layer Effects on Sea Surface Temperature. J. Geophys. Res. 101 (C1), 1295–1308. doi: 10.1029/95JC03190
Forsyth J. S. T., Andres M., Gawarkiewicz G. G. (2015). Recent Accelerated Warming of the Continental Shelf Off New Jersey: Observations From the CMV Oleander Expendable Bathythermograph Line. J. Geophys. Res. Oceans. 120, 2370–2384. doi: 10.1002/2014JC010516
Friedland K. D., Morse R. E., Manning J. P., Melrose D. C., Miles T., Goode A. G., et al. (2020). Trends and Change Points in Surface and Bottom Thermal Environments of the US Northeast Continental Shelf Ecosystem. Fish. Oceanogr. 29, 396–414. doi: 10.1111/fog.12485
Friedland K. D., Hare J. A. (2007). Long-Term Trends and Regime Shifts in Sea Surface Temperature on the Continental Shelf of the Northeast United States. Cont. Shelf Res. 27, 2313–2328. doi: 10.1016/j.csr.2007.06.001
Friedland K. D., Kane J., Hare J. A., Lough R. G., Fratantoni P. S., Fogarty M. J., et al. (2013). Thermal Habitat Constraints on Zooplankton Species Associated With Atlantic Cod (Gadus Morhua) on the US Northeast Continental Shelf. Prog. Oceanogr. 116, 1–13. doi: 10.1016/j.pocean.2013.05.011
Friedland K. D., Morse R. E., Manning J. P., Melrose D. C., Miles T., Goode A. G., et al. (2015). Slow Adaptation in the Face of Rapid Warming Leads to Collapse of the Gulf of Maine Cod Fishery. Science 350, 809–812. doi: 10.1126/science.aac9819
Fulweiler R. W., Oczkowski A. J., Miller K. M., Oviatt C. A., Pilson M. E. Q. (2015). Whole Truths vs. Half Truths–and a Search for Clarity in Long-Term Water Temperature Records. Estuar. Coast. Shelf Sci. 157, A1–A6. doi: 10.1016/j.ecss.2015.01.021
Gangopadhyay A., Gawarkiewicz G., Silva E. N. S., Monim M., Clark J. (2019). An Observed Regime Shift in the Formation of Warm Core Rings From the Gulf Stream. Sci. Rep. 9, 12319. doi: 10.1038/s41598-019-48661-9
Gawarkiewicz G., Brink K. H., Bahr F., Beardsley R. C., Caruso M., Lynch J. F., et al. (2004). A Large-Amplitude Meander of the Shelfbreak Front During Summer South of New England: Observations From the Shelfbreak PRIMER Experiment. J (C03006: Geophys. Res. Oceans, 109). doi: 10.1029/2002JC001468
Gawarkiewicz G., Chen K., Forsyth J., Bahr F., Mercer A., Ellertson A., et al. (2019). Characteristics of an Advective Marine Heatwave in the Middle Atlantic Bight in Early 2017. Front. Mar. Sci. 6 (712). doi: 10.3389/fmars.2019.00712
Gawarkiewicz G., Lawson G., Petruny-Parker M., Fratantoni P., Hare J. (2013). The Shelf Break Ecosystem Off the Northeastern United States: Current Issues and Recommended Research Directions, Report (Woods Hole, Mass: Coop. Inst. for the North Atl. Reg., CINAR), 29 pp. Available at: http://www.cinar.org/.
Gawarkiewicz G., Todd R. E., Plueddemann A. J., Andres M., Manning J. P. (2012). Direct Interaction Between the Gulf Stream and the Shelfbreak South of New England, Sci. Rep. 2, 553.
Genner M. J., Sims D. W., Southward A. J., Budd G. C., Masterson P., Mchugh M., et al. (2010). Body Size-Dependent Responses of a Marine Fish Assemblage to Climate Change and Fishing Over a Century-Long Scale. Glob. Chang Biol. 16, 517–527. doi: 10.1111/j.1365-2486.2009.02027.x
Good S., Fiedler E., Mao C., Martin M. J., Maycock A., et al. (2020). The Current Configuration of the OSTIA System for Operational Production of Foundation Sea Surface Temperature and Ice Concentration Analyses. Remote Sens. 12, 720. doi: 10.3390/rs12040720
Greene C. H., Pershing A. J. (2003). The Flip-Side of the North Atlantic Oscillation and Modal Shifts in Slope-Water Circulation Patterns. Limnol. Oceanogr. 48, 319–322. doi: 10.4319/lo.2003.48.1.0319
Harden B., Gawarkiewicz G. G., Infante M. (2020). Trends in Physical Properties at the Southern New England Shelf Break. J. Geophys. Res. Oceans. 125, e2019JC015784. doi: 10.1029/2019JC015784
Hare J. A., Manderson J. P., Nye J. A., Alexander M. A., Auster P. J., Borggaard D. L., et al. (2012). Cusk (Brosme Brosme) and Climate Change: Assessing the Threat to a Candidate Marine Fish Species Under the US Endangered Species Act. ICES. J. Mar. Sci. 69, 1753–1768. doi: 10.1093/icesjms/fss160
Hare J. A., Morrison W. E., Nelson M. W., Stachura M. M., Teeters E. J., Griffis R. B., et al. (2016). A Vulnerability Assessment of Fish and Invertebrates to Climate Change on the Northeast US Continental Shelf. PLoS One 11, e0146756. doi: 10.1371/journal.pone.0146756
He R., Wilkin J. L. (2006). Barotropic Tides on the Southeast New England Shelf: A View From a Hybrid Data Assimilative Modeling Approach. J. Geophys. Res. 111, C08002. doi: 10.1029/2005JC003254
Hoegh-Guldberg O., Bruno J. F. (2010). The Impact of Climate Change on the World's Marine Ecosystems. Science 328, 1523–1528. doi: 10.1126/science.1189930
Huang B., Liu C., Banzon V., Freeman E., Graham G., Hankins B., et al. (2021). Improvements of the Daily Optimum Interpolation Sea Surface Temperature (DOISST) Version 2.1. J. Climate 34 (8), 2923–2939. doi: 10.1175/JCLI-D-20-0166.1
Karmalkar A. V., Horton R. M. (2021). Drivers of Exceptional Coastal Warming in the Northeastern United States. Nat. Clim. Change 11, 854–860. doi: 10.1038/s41558-021-01159-7
Kavanaugh M. T., Rheuban J. E., Luis K., Doney S. C. (2017). Thirty-Three Years of Ocean Benthic Warming Along the U.S. Northeast Continental Shelf and Slope: Patterns, Drivers, and Ecological Consequences. J. Geophys. Res. Oceans. 122, 9399–9414. doi: 10.1002/2017JC012953
Lentz S., Shearman K., Anderson S., Plueddemann A., Edson J. (2003). Evolution of Stratification Over the New England Shelf During the Coastal Mixing and Optics Study, August 1996–June 1997. J. Geophys. Res. 108 (C1), 3008. doi: 10.1029/2001JC001121
Limeburner R., Beardsley R. C. (1982). The Seasonal Hydrography and Circulation Over Nantucket Shoals. J. Mar. Res. 40, 371–406. doi: 10.1016/S0967-0645(96)00052-5
Linder C. A., Gawarkiewicz G. (1998). A Climatology of the Shelfbreak Front in the Middle Atlantic Bight. J. Geophys. Res. 103, 18 405–18 423. doi: 10.1029/98JC01438
Massachusetts Division of Marine Fisheries Annual Reports 2011-2021, (2020) Department of Fish and Game, Division of Marine Fisheries(Massachusett), 107pp. Available at: https://www.mass.gov/service-details/dmf-annual-reports.
Mills K. E., Pershing A. J., Brown C. J., Chen Y., Chiang F. S., Holland D. S., et al. (2013). Fisheries Management in a Changing Climate: Lessons From the 2012 Ocean Heat Wave in the Northwest Atlantic. Oceanogr 191–, 195. doi: 10.5670/oceanog.2013.27
Minnett P. J., Smith M., Ward B. (2011). Measurements of the Oceanic Thermal Skin Effect. Deep. Sea. Res. Part II.: Topical. Stud. Oceanogr. 58 (6), 861–868. doi: 10.1016/j.dsr2.2010.10.024
Montero-Serra I., Edwards M., Genner M. J. (2015). Warming Shelf Seas Drive the Subtropicalization of European Pelagic Fish Communities. Glob. Change Biol. 21, 144–153. doi: 10.1111/gcb.12747
Nixon S. W., Granger S., Buckley B. A., Lamont M., Rowell M. (2004). A One Hundred and Seventeen Year Coastal Water Temperature Record From Woods Hole, Massachusetts. Estuaries 27, 397–404. doi: 10.1007/BF02803532
Nye J. A., Link J. S., Hare J. A., Overholtz W. J. (2009). Changing Spatial Distribution of Fish Stocks in Relation to Climate and Population Size on the Northeast United States Continental Shelf. Mar. Ecol. Prog. Ser. 393, 111–129. doi: 10.3354/meps08220
Oczkowski A., McKinney R., Ayvazian S., Hanson A., Wigand C., Markham E. (2015). Preliminary Evidence for the Amplification of Global Warming in Shallow, Intertidal Estuarine Waters. PLoS One 10, e0141529. doi: 10.1371/journal.pone.0141529
Park B. J., Kim Y. H., Min S. K., Lim E. P. (2018). Anthropogenic and Natural Contributions to the Lengthening of the Summer Season in the Northern Hemisphere. J. Climate 31, 6803–6819. doi: 10.1175/JCLI-D-17-0643.1
Perry A. L. (2005). Climate Change and Distribution Shifts in Marine Fishes. Science 308, 1912–1915. doi: 10.1126/science.1111322
Pershing A. J., Alexander M. A., Brady D. C., Brickman D., Curchitser E. N., et al. (2021). Climate Impacts on the Gulf of Maine Ecosystem: A Review of Observed and Expected Changes in 2050 From Rising Temperatures. Elementa.: Sci. Anthrop. 9 (1), 00076. doi: 10.1525/elementa.2020.00076
Pershing A. J., Mills K. E., Dayton A. M., Franklin B. S., Kennedy B. T. (2018). Evidence for Adaptation From the 2016 Marine Heatwave in the Northwest Atlantic Ocean. Oceanography 31, 152–161. doi: 10.5670/oceanog.2018.213
Pinsky M. L., Worm B., Fogarty M. J., Sarmiento J. L., Levin S. A. (2013). Marine Taxa Track Local Climate Velocities. Science 341, 1239–1242.
Poloczanska E., Brown C., Sydeman W., Kiessling W., Schoeman D. S., Moore P. J., et al. (2013). Global Imprint of Climate Change on Marine Life. Nat. Clim. Change 3, 919–925. doi: 10.1038/nclimate1958
Poppick L. (2018). Why is the Gulf of Maine Warming Faster Than 99% of the Ocean? Eos 99. doi: 10.1029/2018EO109467
Record N. R., Runge J. A., Pendleton D. E., Balch W. M., Davies K. T. A., Pershing A. J., et al. (2019). Rapid Climate-Driven Circulation Changes Threaten Conservation of Endangered North Atlantic Right Whales. Oceanography 32, 162–169. doi: 10.5670/oceanog.2019.201
Reynolds R. W., Smith T. M., Liu C., Chelton D. B., Casey K. S., Schlax M. G. (2007). Daily High-Resolution Blended Analyses for Sea Surface Temperature. J. Clim. 20, 5473–5496. doi: 10.1175/2007JCLI1824.1
Shearman R. K., Lentz S. J. (2010). Long-Term Sea Surface Temperature Variability Along the U.S. East Coast. J. Phys. Oceanogr. 40, 1004–1016. doi: 10.1175/2009JPO4300.1
Slesinger E., Andres A., Young R., Seibel B., Saba V., Phelan B., et al. (2019). The Effect of Ocean Warming on Black Sea Bass (Centropristis Striata) Aerobic Scope and Hypoxia Tolerance. PLoS One 14, e0218390. doi: 10.1371/journal.pone.0218390
Staudinger M. D., Mills K. E., Stamieszkin K., Record N. R., Hudak C. A., Allyn A., et al. (2019). It’s About Time: A Synthesis of Changing Phenology in the Gulf of Maine Ecosystem. Fish. Oceanogr. 28, 532–566. doi: 10.1111/fog.12429
Steele M., Ermold W., Zhang J. (2008). Arctic Ocean Surface Warming Trends Over the Past 100 Years. Geophys. Res. Lett. 35, L02614. doi: 10.1029/2007GL031651
Stroeve J., Holland M. M., Meier W., Scambos T., Serreze M. (2007). Arctic Sea Ice Decline: Faster Than Fore- Cast. Geophys. Res. Lett. 34, L09501. doi: 10.1029/2007GL029703
Thomas A. C., Pershing A. J., Friedland K. D., Nye J. A., Mills K. E., Alexander M. A., et al. (2017). Seasonal Trends and Phenology Shifts in Sea Surface Temperature on the North American Northeastern Continental Shelf. Elementa. – Sci. Anthr. 5, 48. doi: 10.1525/elementa.240
UK Met Office (2005) GHRSST Level 4 OSTIA Global Foundation Sea Surface Temperature Analysis, Ver. 1.0 (CA, USA: NASA JPL PO.DAAC, Pasadena) (Accessed 2022-01-31).
Walsh H. J., Richardson D. E., Marancik K. E., Hare J. A. (2015). Long-Term Changes in the Distributions of Larval and Adult Fish in the Northeast U.S. Shelf Ecosystem. PLoS One 10, 1–31. doi: 10.1371/journal.pone.0137382
Wilkin J. L. (2006). The Summertime Heat Budget and Circulation of Southeast New England Shelf Waters. J. Phys. Oceanogr. 36, 1997–2011. doi: 10.1175/JPO2968.1
Yang K. T. (2021). Delayed Seasonal Cycles and Declining Shellfish Growth Rates Observed at Wellfleet Harbor in the Recent Decades. Project Report (Deerfield Academy: Deerfield, MA), 24pp. doi: 10.6084/m9.figshare.19126490.v1
Keywords: New England continental shelf warming, Cape Cod, phenology change of sea surface temperature, fine-resolution satellite observations, coastal warm spot, coastal cold spot
Citation: Yu L and Yang KT (2022) A Warm and A Cold Spot in Cape Cod Waters Amid the Recent New England Shelf Warming. Front. Mar. Sci. 9:922046. doi: 10.3389/fmars.2022.922046
Received: 17 April 2022; Accepted: 26 May 2022;
Published: 29 June 2022.
Edited by:
Lichuan Wu, Uppsala University, SwedenReviewed by:
Rongwang Zhang, South China Sea Institute of Oceanology (CAS), ChinaJian Shi, Ocean University of China, China
Copyright © 2022 Yu and Yang. This is an open-access article distributed under the terms of the Creative Commons Attribution License (CC BY). The use, distribution or reproduction in other forums is permitted, provided the original author(s) and the copyright owner(s) are credited and that the original publication in this journal is cited, in accordance with accepted academic practice. No use, distribution or reproduction is permitted which does not comply with these terms.
*Correspondence: Lisan Yu, bHl1QHdob2kuZWR1
 Lisan Yu
 Kristine T. Yang2