 Bo Hong
 Xiongxing Huang
 Sumin Liu2
 Hongzhou Xu
94% of researchers rate our articles as excellent or good
Learn more about the work of our research integrity team to safeguard the quality of each article we publish.
Find out more
ORIGINAL RESEARCH article
Front. Mar. Sci. , 22 July 2022
Sec. Physical Oceanography
Volume 9 - 2022 | https://doi.org/10.3389/fmars.2022.920825
This article is part of the Research Topic Variability of the Coupled Physical-Biogeochemical Processes in the South China Sea View all 4 articles
The Hainan Island coastal upwelling (HIU hereafter) off the eastern Hainan Island (EHI) is an important phenomenon in the northern South China Sea. Though this phenomenon has been extensively studied, the fast responses of its inner oceanic processes to typhoon passage remain unclear. Based on satellite data and a validated three-dimensional numerical model, the HIU response to the passage of Typhoon Rammasun (2014) are explored in this study. Impacted by Rammasun, the climbing of deep water off the EHI was depressed and the bottom cold water moved seaward for at least 10 km. Though the HIU was weakened, a cooling event and Chl-a bloom in the HIU were formed after the passage of Rammasun. Diagnostic analyses revealed that both advection and diffusion terms contributed to controlling the local rate of temperate change during the typhoon passage and the advection terms showed significant internal wave signals along the shelf break off southeastern Hainan Island. At the same time, strong near-inertial waves (NIWs) with 0.705 cpd were triggered in the HIU. The NIWs lasted for about two weeks and caused strong vertical mixing in the HIU after Rammasun. Overall, typhoon wind and NIWs combined to dominate temperature variation in the HIU during the typhoon period.
Coastal upwelling brings cold, nutrient-rich, and biologically productive subsurface water to the sea surface which can help fuel an ecosystem companying a high primary production (Lentz and Chapman, 2004; Pitcher et al., 2010) and it becomes the focal region with the world’s most productive fisheries (Hein et al., 2013; Palacios et al., 2013; Benazzouz et al., 2014; Oerder et al., 2015; Liu et al., 2020). The upwelling systems represent only 0.5% of the total surface of the world’s oceans but contribute up to 17% of the global fish catch (Pauly and Christensen, 1995).
In the northern South China Sea (SCS), coastal upwelling is usually induced by the summer southwesterly monsoon and is largely affected by local circulation, topography, freshwater, and ENSO (Liu et al., 2009; Su and Pohlmann, 2009; Jing et al., 2011; Su et al., 2013; Wang et al., 2014; Hu and Wang, 2016; Lin et al., 2016a; Xie et al., 2016; Chen et al., 2019). The upwelling off the coast of Hainan Island (called HIU hereafter) is an important phenomenon in the northern SCS. Previous studies suggest that the southwesterly monsoon is the major driving force for the HIU (Jing et al., 2009; Su and Pohlmann, 2009; Li et al., 2012). Numerical diagnostic analyses revealed that the Ekman pumping induced by local wind stress curl is also responsible for increasing the intensity of HIU (Jing et al., 2009). Further estimation, based on the remote sensing wind data, identified that 33% of the total wind-driven upwelling is due to Ekman pumping and the remainder is due to Ekman transport (Wang et al., 2013). The combined effect of wind and topography leads to the uneven distribution of upwelling centers in the HIU region (Su and Pohlmann, 2009). Su and Pohlmann (2009) concluded that the internal waves can be generated at the shelf break off the southeastern Hainan Island and the vertical mixing caused by the internal wave plays a positive role in the upwelling intensification. Analyses of the cruise observations and reanalysis data indicated that the HIU off the northeastern coast is associated with the prevailing southeasterly wind and can be limited in the lower layer by freshwater discharge, whereas the HIU off the eastern coast is mainly driven by the southwesterly wind with no relation with freshwater discharge (Lin et al., 2016a). Momentum analyses by Lin et al. (2016b) indicated that the upwelling-linked onshore transport off the EHI is primarily intensified by the along-isobath barotropic pressure gradient force, but is weakened by the along-isobath baroclinic pressure gradient force. The cross-isobath forces play an important role in upwelling intensification in the shallow nearshore region.
Typhoons, known as hurricanes or tropical cyclones, are one of the most catastrophic synoptic events to influence oceans. As typhoons pass, they can cause sea surface temperature (SST) cooling and trigger phytoplankton bloom and primary productivity along its paths (Lin et al., 2003a; Lin et al., 2003b; Sun et al., 2015; Li et al., 2022; Lu et al., 2022). With global warming, the intensity and spatial coverage of typhoon activity have strengthened over the past several decades (Webster et al., 2005; Siswanto et al., 2007; Mei et al., 2015; Zhao et al., 2015; Mei and Xie, 2016; Walsh et al., 2016). It is important to monitor and understand the impacts of the typhoon on the HIU.
Based on the statistics of typhoons and remote sensing data from 1982 to 2015, Xie et al. (2017) concluded that the intensity and incidence angle of the typhoon are the major factors in impacting the SST in the HIU region. Of the total 43 typhoon cases, 45% showed a significant SST decrease after typhoon passage. Su et al. (2011) suggested that strong mixing caused by typhoons can establish the front between the mixed coastal water and offshore water and weaken coastal upwelling. Li et al. (2021b) found that both surface and subsurface water temperature off the southeastern Hainan Island and the Indochina Peninsula dropped sharply during and after the passage of super Typhoon Rammasun (2014). Based on mooring observation and remote sensing data, Zhang et al. (2014) found that strong near-inertial waves (NIWs) induced by typhoons could enhance turbulent mixing off southeastern Hainan Island, which could increase the upward nutrient flux into the surface and result in Chl-a concentration augment. However, their analyses excluded the effect of the advective transport process. While significant progress has been made in understanding the dynamics of the HIU, there are limited studies on the fast dynamic response of the HIU to the passage of the typhoon. The responses of upwelling inner processes and primary production to the typhoon passage remain poorly understood.
In this study, we present the dynamic response of physical and biogeochemical processes to the passage of the super typhoon Rammasun. The dynamic processes are explored with the aid of observations and a calibrated 3D numerical model.
The HIU region is located at the EHI (Figure 1) and it has been identified from cruise observations, satellite remote sensing data, and numerical modeling (e.g., Jing et al., 2009; Su and Pohlmann, 2009; Jing et al., 2011; Su et al., 2011; Li et al., 2012; Lin et al., 2016a; Lin et al., 2016b; Xie et al., 2017; Liu et al., 2020). Based on in situ observation data, Han et al. (1990) defined a region below the depth of 30 m where the temperature was less than 24.5°C and salinity was higher than 34.3 PSU as the upwelling center of the HIU. The HIU can be merged with the western Guangdong upwelling system in the subsurface layer (Xu et al., 2013). It generally begins in April, becomes strongest in summer (peaking from mid-July to mid-August), and remains evident until September.
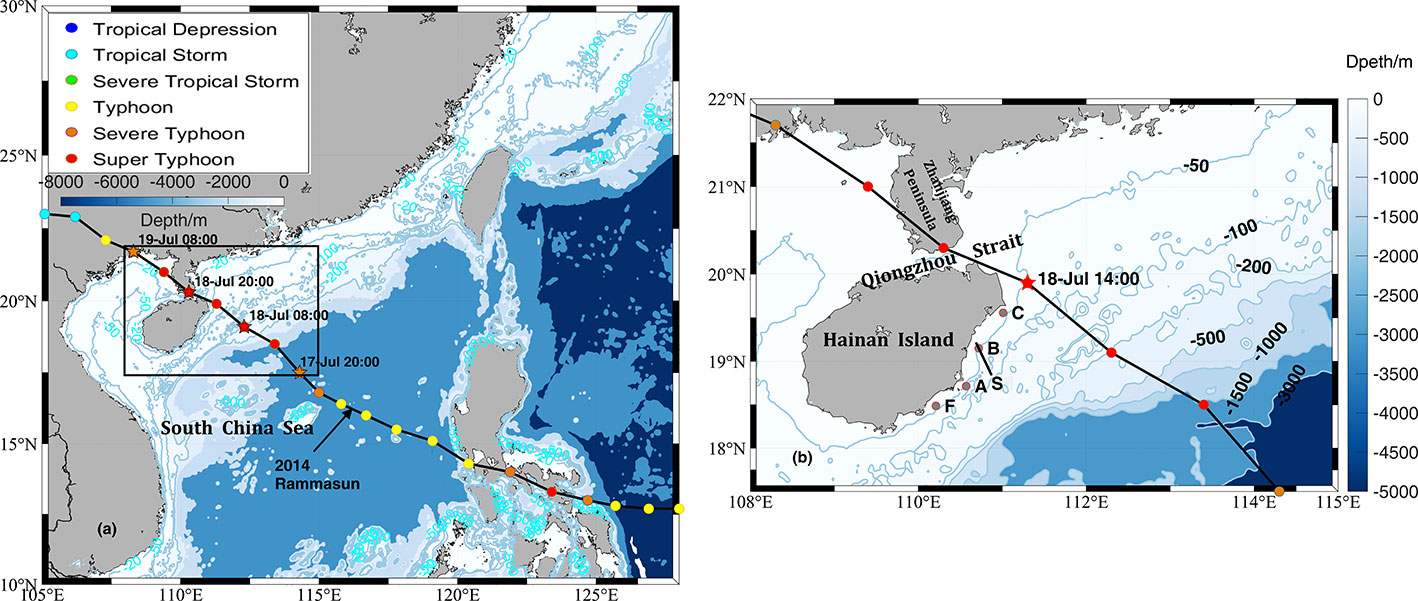
Figure 1 (A) Bathymetry (m) of the northern South China Sea and the track of Typhoon Rammasun (2014). The typhoon track was recorded every 6 hours. The intensity of typhoon is represented by colored dots which are scaled by the maximum wind speed. Rammasun passed the northern Hainan Island as a super typhoon on July 18, 2014. (B) Bathymetry around Hainan Island. Stations A–C, F, and transect S in the upwelling region are used for analyses.
The information about Typhoon Rammasun was obtained from the Chinese Meteorological Administration dataset (https://typhoon.nmc.cn/web.html) and included a six hour time-series of typhoon center locations, the maximum sustained wind speed at 10 m above the mean sea level, typhoon center pressure, and typhoon status. Typhoon Rammasun originated from the Northwest Pacific and entered SCS as a typhoon on July 16, 2014 (Figure 1A). It moved northwestward and intensified as it approached Hainan Island. It became a super typhoon at 0200 UTC on July 18 and swept over the Hainan Island from 0800 UTC on July 18 to 0200 UTC on July 19. Rammasun made landfall at the northern edge of the Island at 0800 UTC on July 19. The peak wind speed (72 m/s) and minimum sea-level pressure (888 hPa) of Rammasun occurred at 1400 UTC on July 18 (Figure 1B). This fast-moving super typhoon passed over the eastern shore of the island. and it is a suitable case to explore the oceanic responses of this upwelling system to the typhoon.
The satellite-derived sea surface Chl-a and SST data during Typhoon Rammasum are provided by MODIS (Moderate Resolution Imaging Spectroradiometer) products (https://oceandata.sci.gsfc.nasa.gov/directaccess/MODIS-Aqua/Mapped). The spatial resolution of the daily data is 4 km. The daily Chl-a data has poor coverage during the typhoon period, so the 8-day averaged data are used instead. The GHRSST provides a new generation of global high-resolution (< 10 km) SST products (http://apdrc.soest.hawaii.edu/erddap/search/index.html?page=1&itemsPerPage=1000&searchFor=GHRSST). The daily data products are used to obtain the SST time series in the HIU region in this study. The surface wind data is obtained from the latest ERA5 hourly wind dataset at 10 m above the sea surface. ERA5 is the global reanalysis product produced by ECMWF (https://www.ecmwf.int/en/forecasts/datasets/reanalysis-datasets/era5). It is based on a hybrid incremental 4D-Var system, which uses observations from over 200 satellite instruments or types of conventional data (Bonavita et al., 2016).
The numerical investigation is performed using the Princeton Ocean Model (POM), which is documented in detail by Blumberg and Mellor (1987). Briefly, the POM is a hydrostatic, free-surface, sigma-coordinate, and primitive equation model. The POM has been successfully used in a numerical modeling study of the SCS circulation (Hong and Wang, 2008; Lü et al., 2008; Wang et al., 2010; Sun et al., 2015). To avoid the influence of open boundary, the model domain is extended from the SCS to the western Pacific Ocean and the southern East China Sea. The ETOPO2 dataset provided by the National Geophysical Data Center is used for prescribing the model bathymetry through bilinear interpolation. The horizontal orthogonal curvilinear coordinates are designed to be largely parallel and orthogonal to the along-shelf direction in the northern SCS. The model grids have spatial scales ranging from 3 km (in the northern SCS and the western boundary area of the Pacific Ocean) to 12 km (in the southwestern SCS). The vertical sigma-coordinate has 30 levels, which are logarithmically distributed with a higher resolution near the surface and bottom to better resolve the surface and bottom Ekman layers. Horizontal diffusivities are parameterized using the Smagorinsky (1963) formulation.
The coarse-grid version of this model had been successfully used in investigating the dynamical mechanism of SCS warm current (Wang et al., 2010). In this study, we use the high-resolution version of this model. All the forcing fields are realistic. For model validation, the cruise data obtained off the EHI from July 29 to August 7, 2015 and several Argos profiles in the northwestern Pacific, are used to do the model-data comparison. Detailed model-data comparisons are shown in Appendix A. In general, our model can reasonably reproduce the upwelling process off the EHI and is suitable for examining the coastal upwelling response to the passage of a typhoon.
The snapshot of daily wind vectors and wind stress curls from July 15 to July 26, 2014 are plotted in Figure 2. On July 15, wind force around Hainan Island was mainly southerly under the control of the Asian summer monsoon. As Typhoon Rammasun approached, the change of wind forcing off the EHI became tremendous. On July 16, the upwelling-favorable southerly wind ceased. On July 17, strong northeasterly winds occupied the coastal sea. On July 18, southwesterly winds dominated the area again but the wind speeds tripled. The winds started to decrease on July 19 and reached the minimum on July 21. Subsequently, the southwesterly winds recovered gradually.
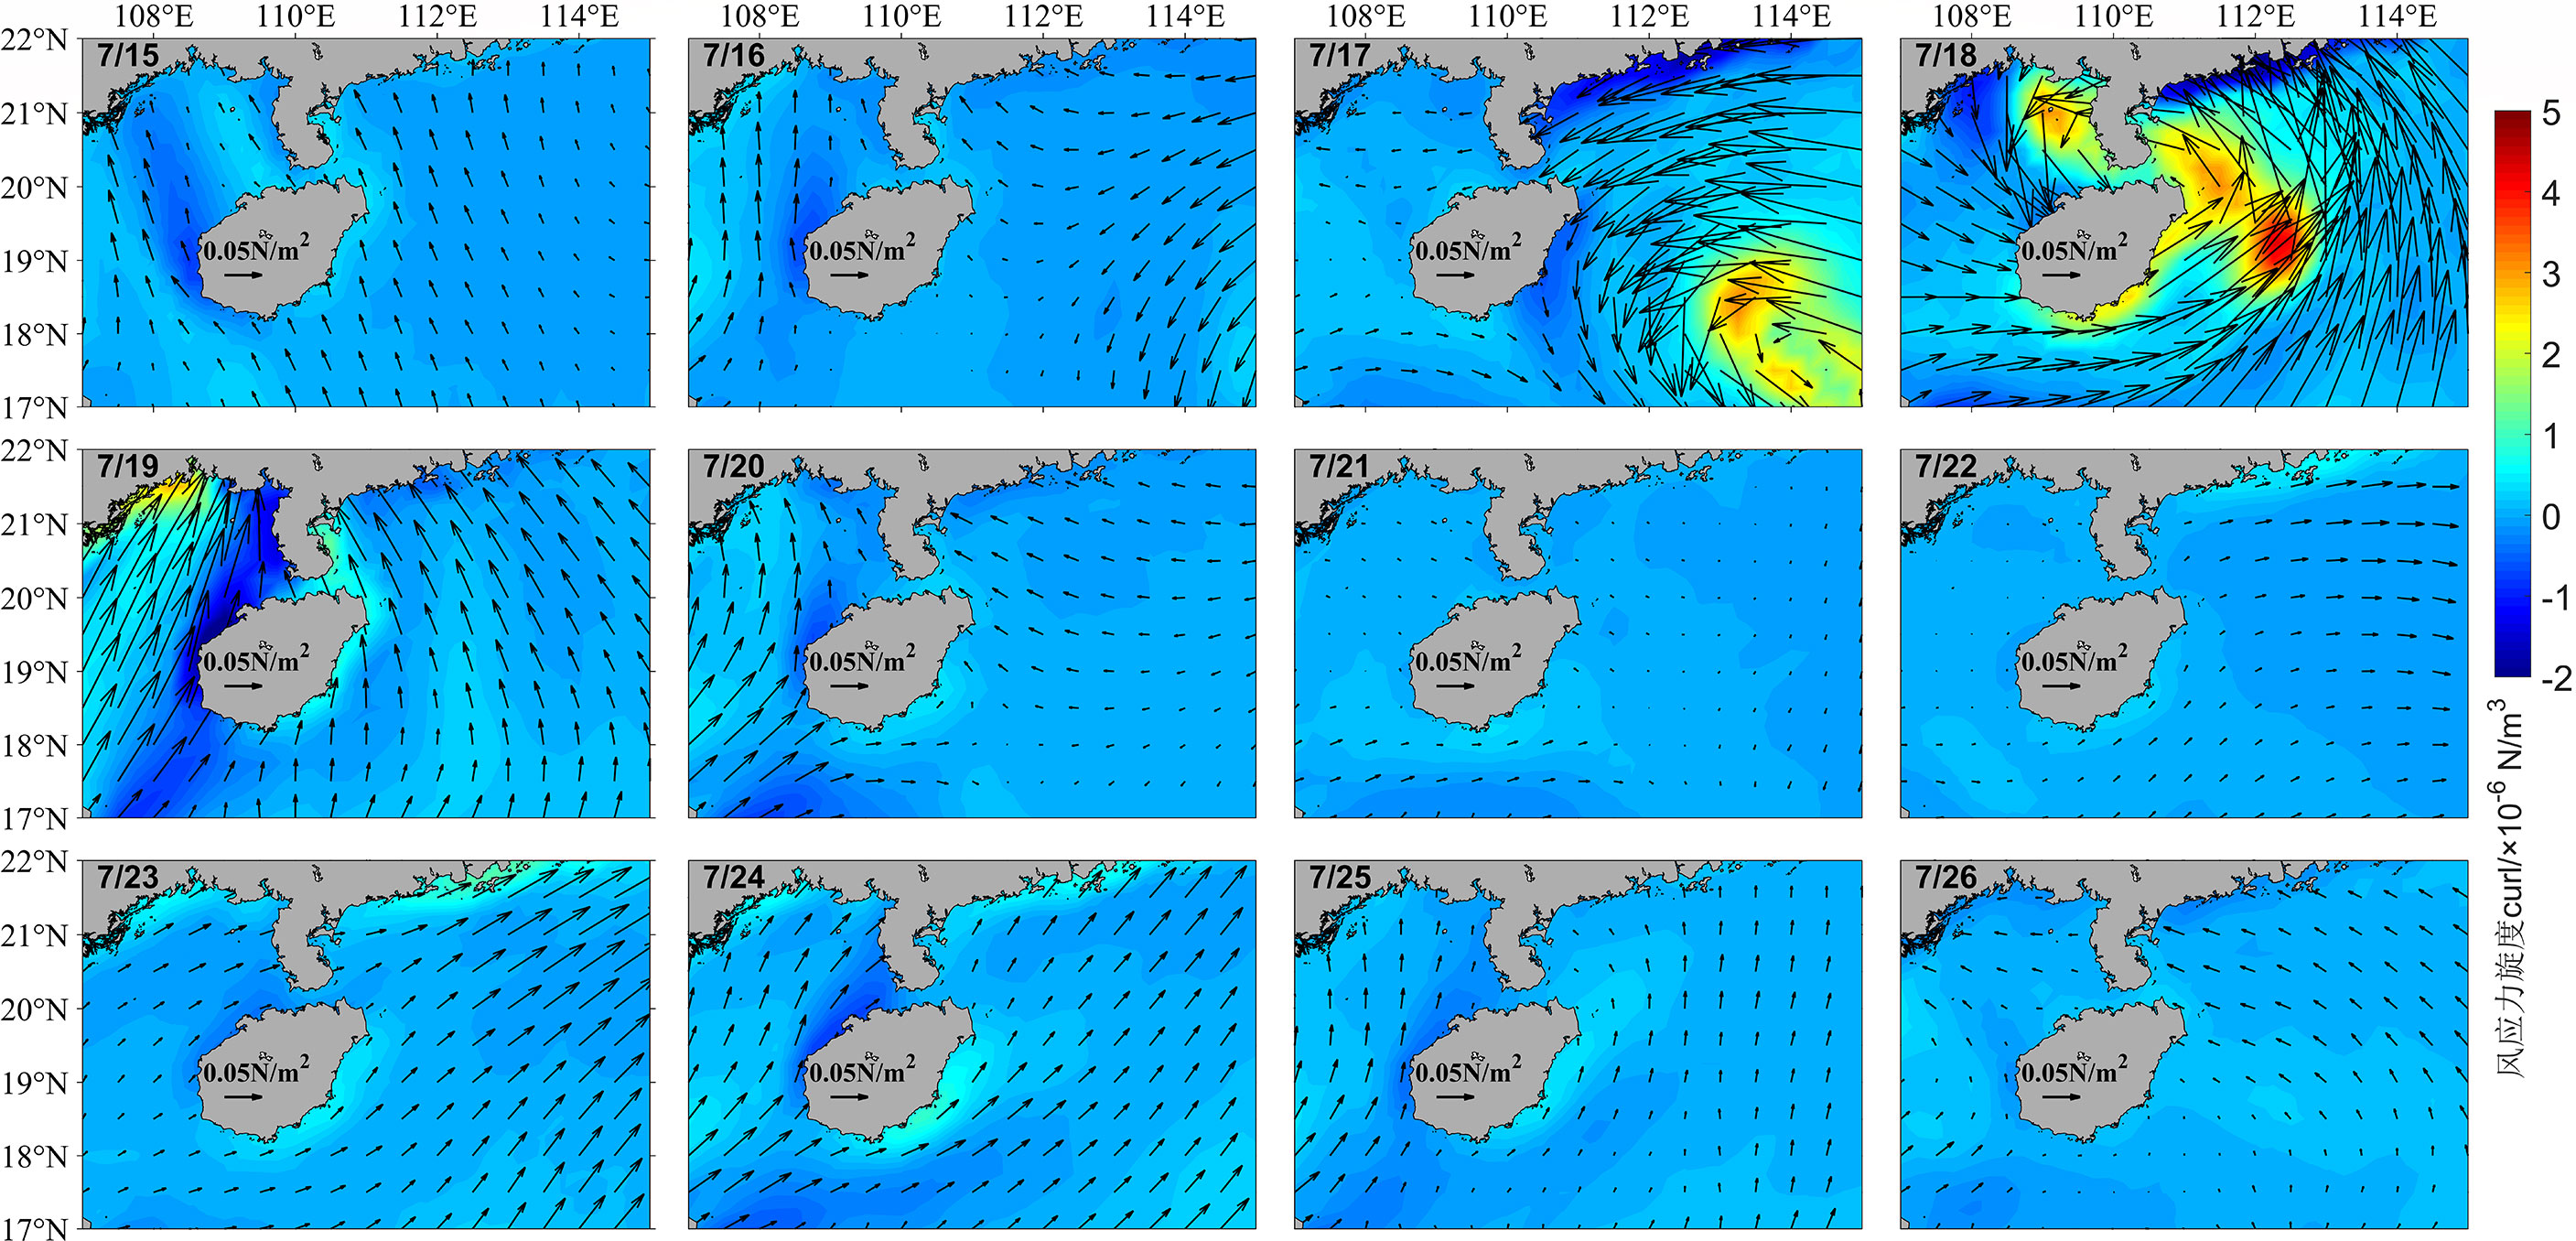
Figure 2 Distribution of daily wind vectors and wind stress curl (×10-6Nm-3) from July 15 to 26.
A cold tongue of the HIU can be observed off the EHI from the daily SST image on July 15 (Figure 3). However, the SST data at the HIU were missing from July 16 to 19. Typhoon Rammasun swept over the Island on July 18. After the typhoon passage, colder water was discerned along the track. From July 20 to 21, sea surface cooling reached 3-4°C on the right of the typhoon track. The cold surface waters were maintained in the shelf region off the Zhangjiang Peninsula until July 26.

Figure 3 Distribution of MODIS daily sea surface temperature (°C) from July 15 to 26.
Due to the poor coverage of remote sensing data of Chl-a, the 8-day averaged data are used to illustrate the spatial distribution of primary production in the HIU (Figure 4). The highest Chl-a concentration and largest spatial coverage appeared at the coastal sea off the eastern Hainan and the shelf sea off Zhanjiang Peninsula along the typhoon track during July 20 to 27. Previous studies indicated that typhoon-boosted Chl-a burst usually has a temporal lag of five days after the typhoon passage (Zhao et al., 2008; Li et al., 2013; Li et al., 2022). The high Chl-a concentration disappeared from July 28 to August 4.
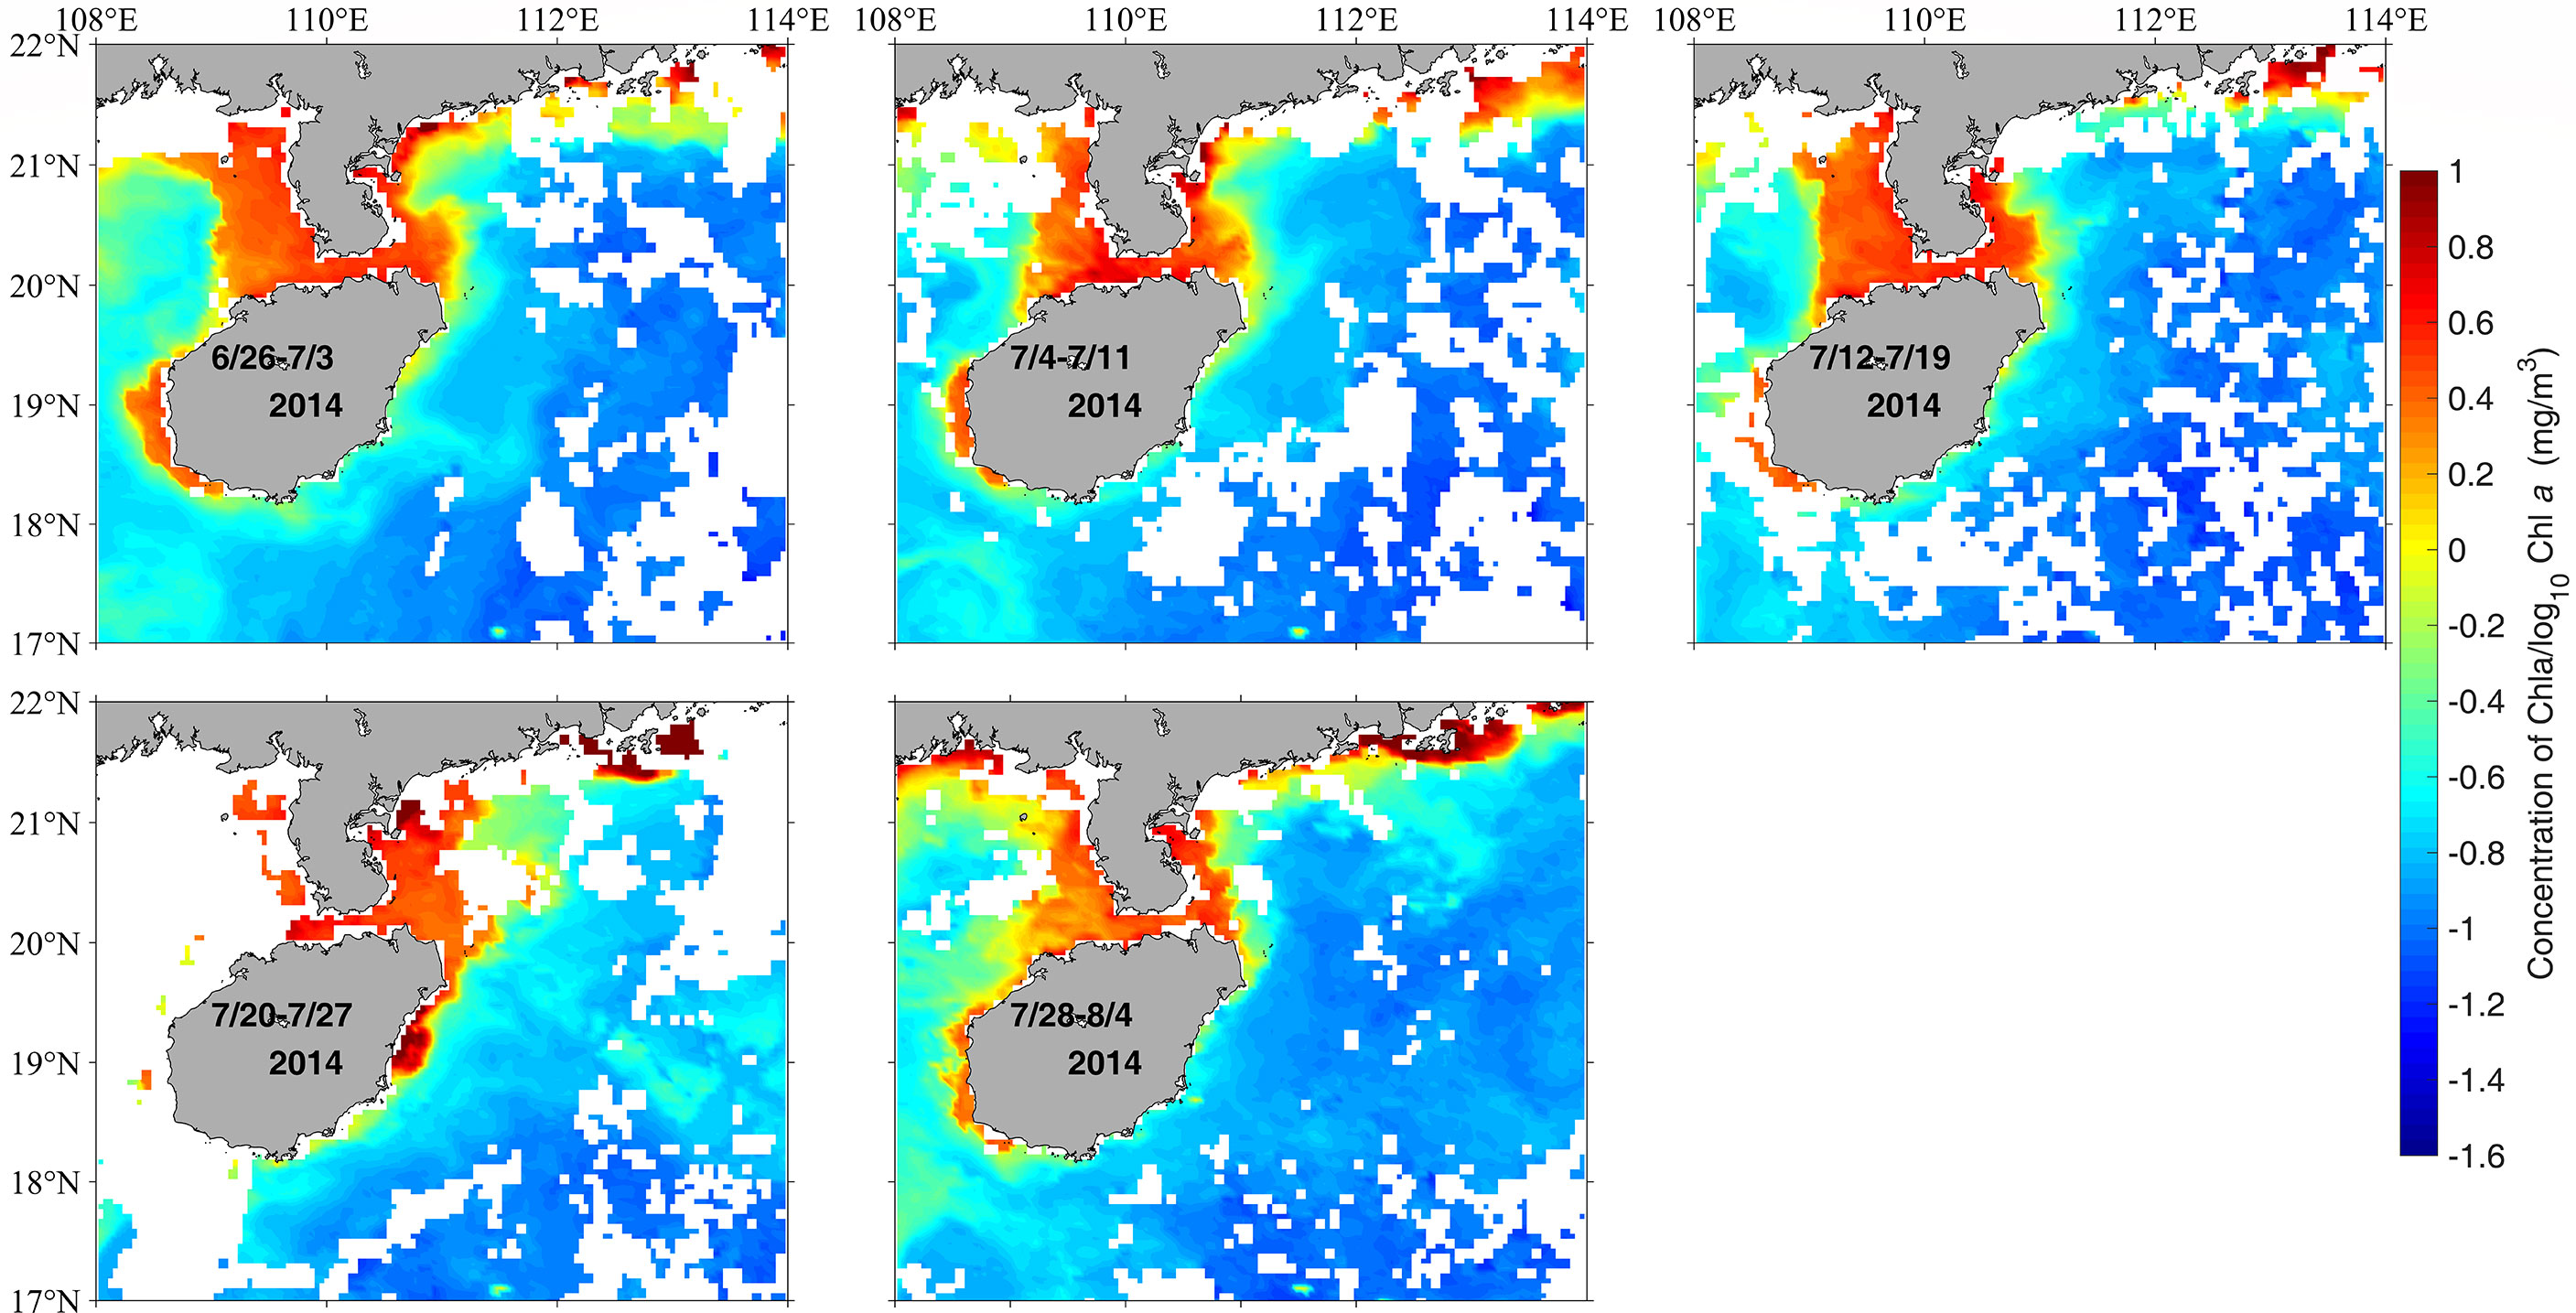
Figure 4 Distribution of MODIS 8-day averaged Chl-a (mg m-3) from June 26 to August 4.
We chose three representative stations (stations A, B, and C) to illustrate temporal and spatial variations of different variables in the HIU during the typhoon period (Figure 1B). The time series of wind speed, wind stress curl, SST, and Chl-a at station B, which represent the center zone of the HIU, are shown in Figure 5. Compared to the results during the pre-typhoon and post-typhoon periods, the wind speeds were doubled and the wind stress curls were extremely reinforced during the typhoon passage. The SST started to decrease on July 18 and reached its minimum around July 19 to 20. Then the SST increased gradually until the end of July. Model results show that the response of SST to Typhoon Rammasun is almost consistent with the remote sensing results (Figure 5). Although the daily Chl-a data was missing during the typhoon passage, there was still some data coverage from July 21 to 27. The Chl-a concentration was substantially high on July 22, which lagged about 5 days after the passage of Rammasun. Observations on the inner shelf of the East China Sea also showed a 5-day lag of Chl-a burst after the typhoon passage (Li et al., 2022). The Chl-a concentration on July 23 was still higher than those during the pre-typhoon period. After that, it decreased gradually.
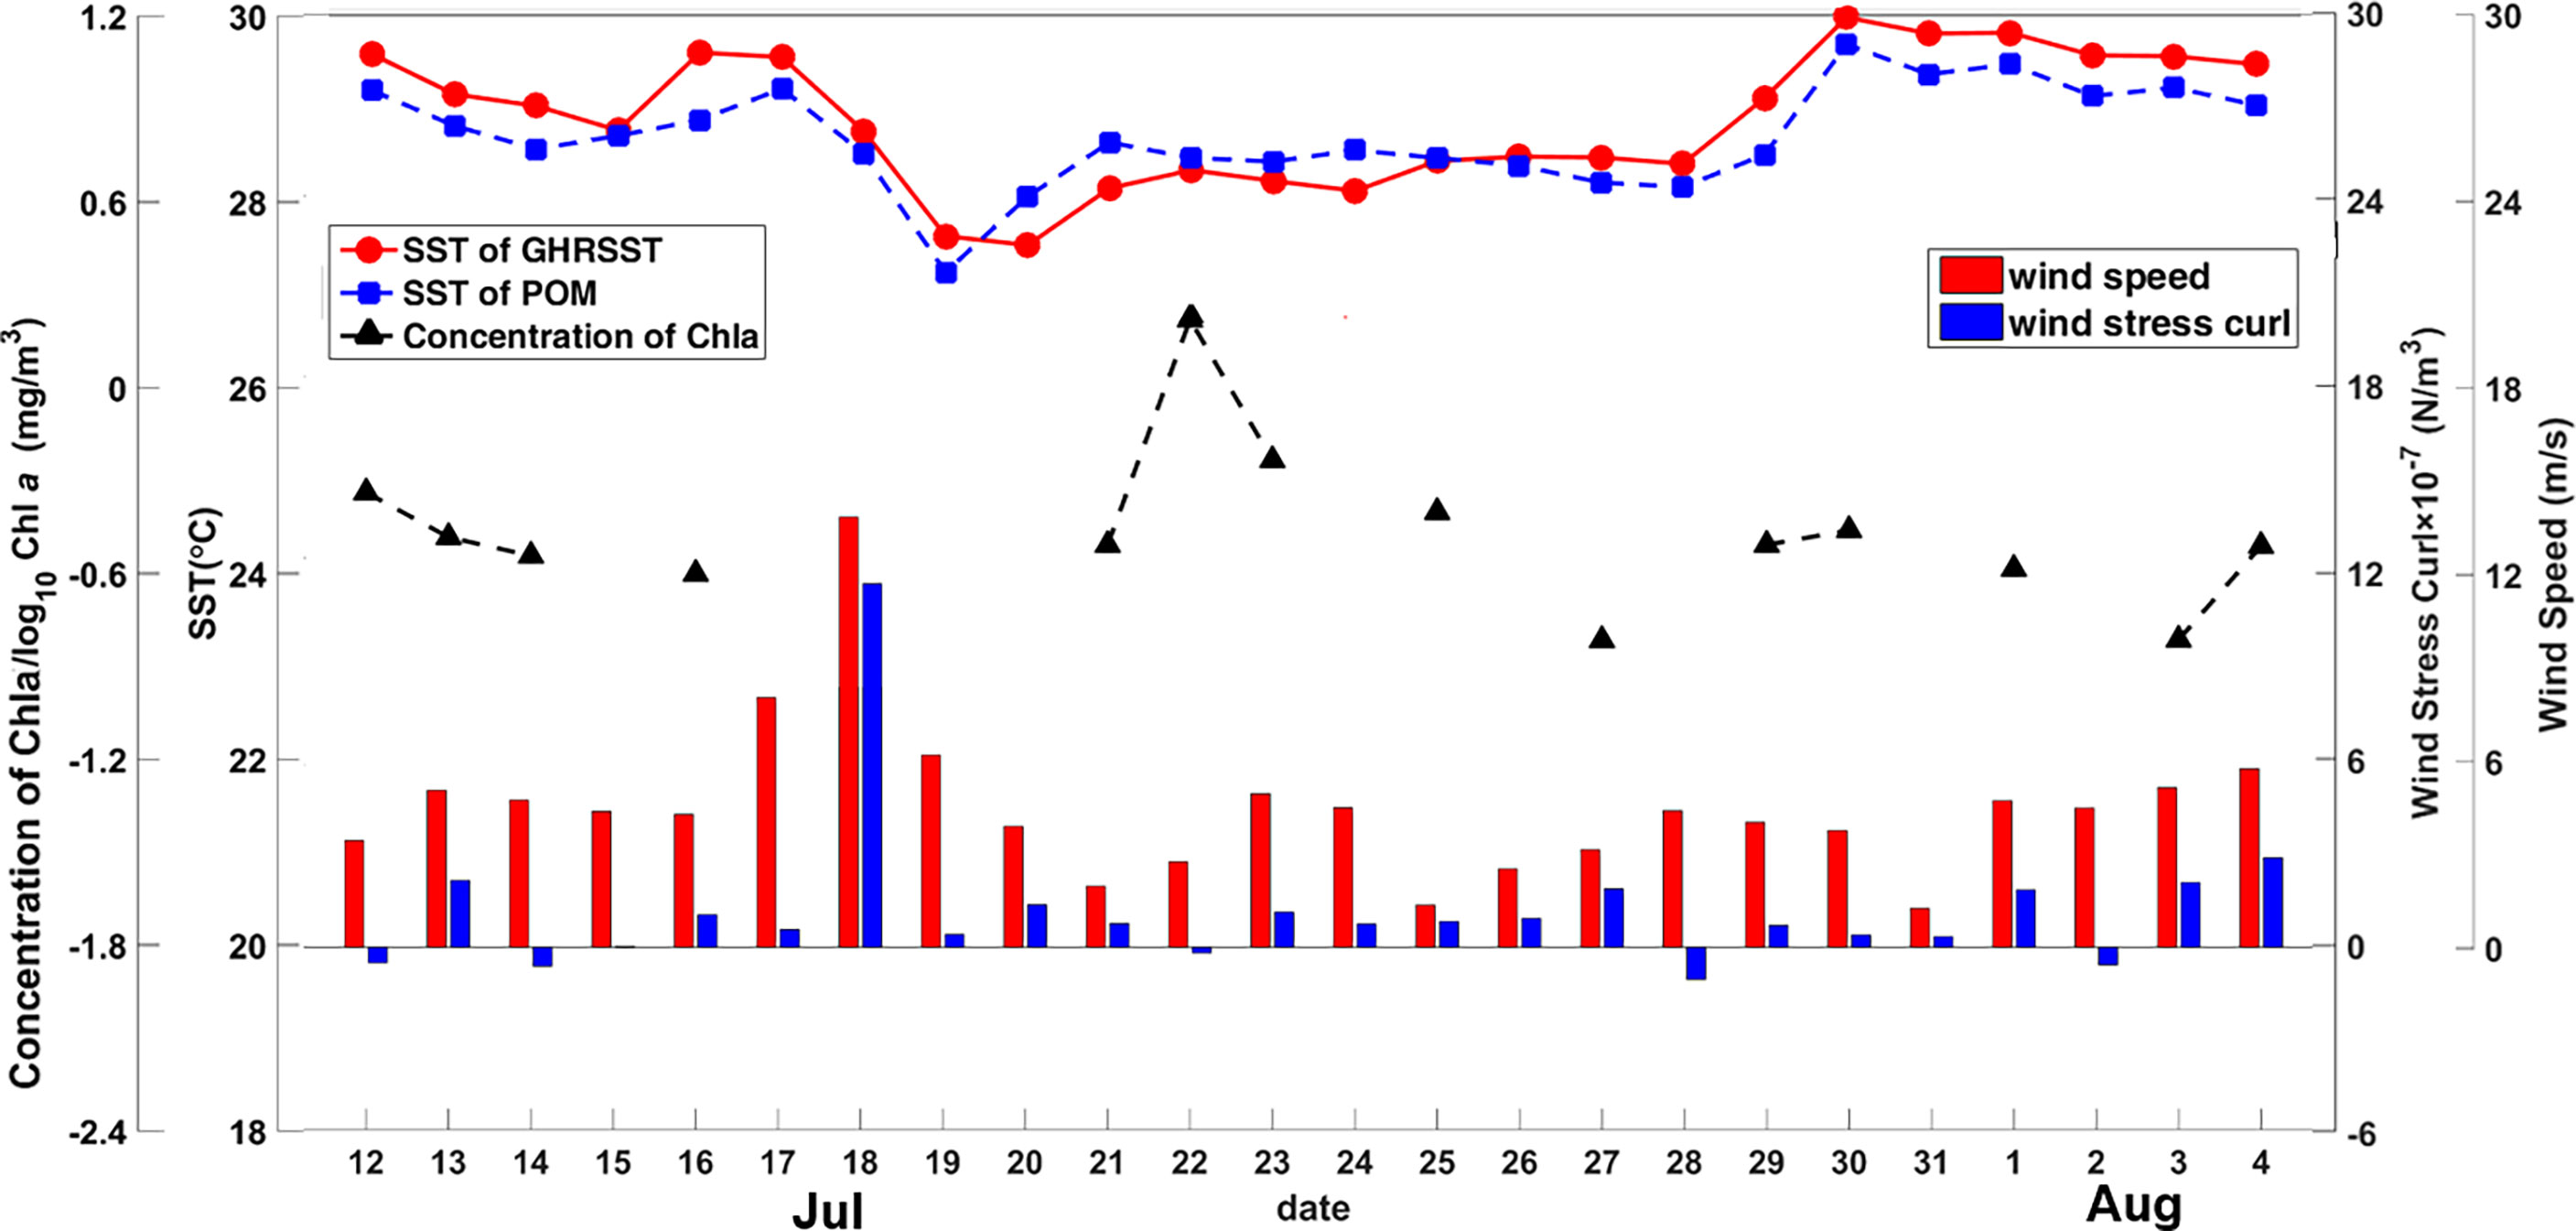
Figure 5 Time series of SST (data from GHRSST), Chl-a, wind speed, and wind stress curl from July 12 to August 4, All the data are averaged in the typical zone of the HIU.
Numerical model outputs are used in the section to show the evolution of surface current and SST in the HIU from July 15 to 26 (Figure 6). The cold-water jet of the HIU can be observed off the EHI on July 15 to 17. As Rammasun arrived on July 18, sea surface cooling was formed in a large domain and its center appeared in the shelf region off the Zhanjiang Peninsula companying a strong cyclonic ocean circulation. The strongest sea surface cooling occurred on July 19 with the disappearance of the cyclonic ocean circulation. At the same time, the northeastward coastal jet recovered and extended southeastward off the Island. In addition, a warm current coming from Beibu Gulf via Qiongzhou Strait flowed along the northern coast of the Island. Zhou et al. (2022) found that the east-west water level gradients at the Strait are responsible for this warm current. Starting from July 20, the cold center on the shelf sea faded away gradually. The HIU center shifted from the east coast (pre-typhoon) to the south coast (post-typhoon) indicating a large adjustment of the HIU circulation by Rammasun.
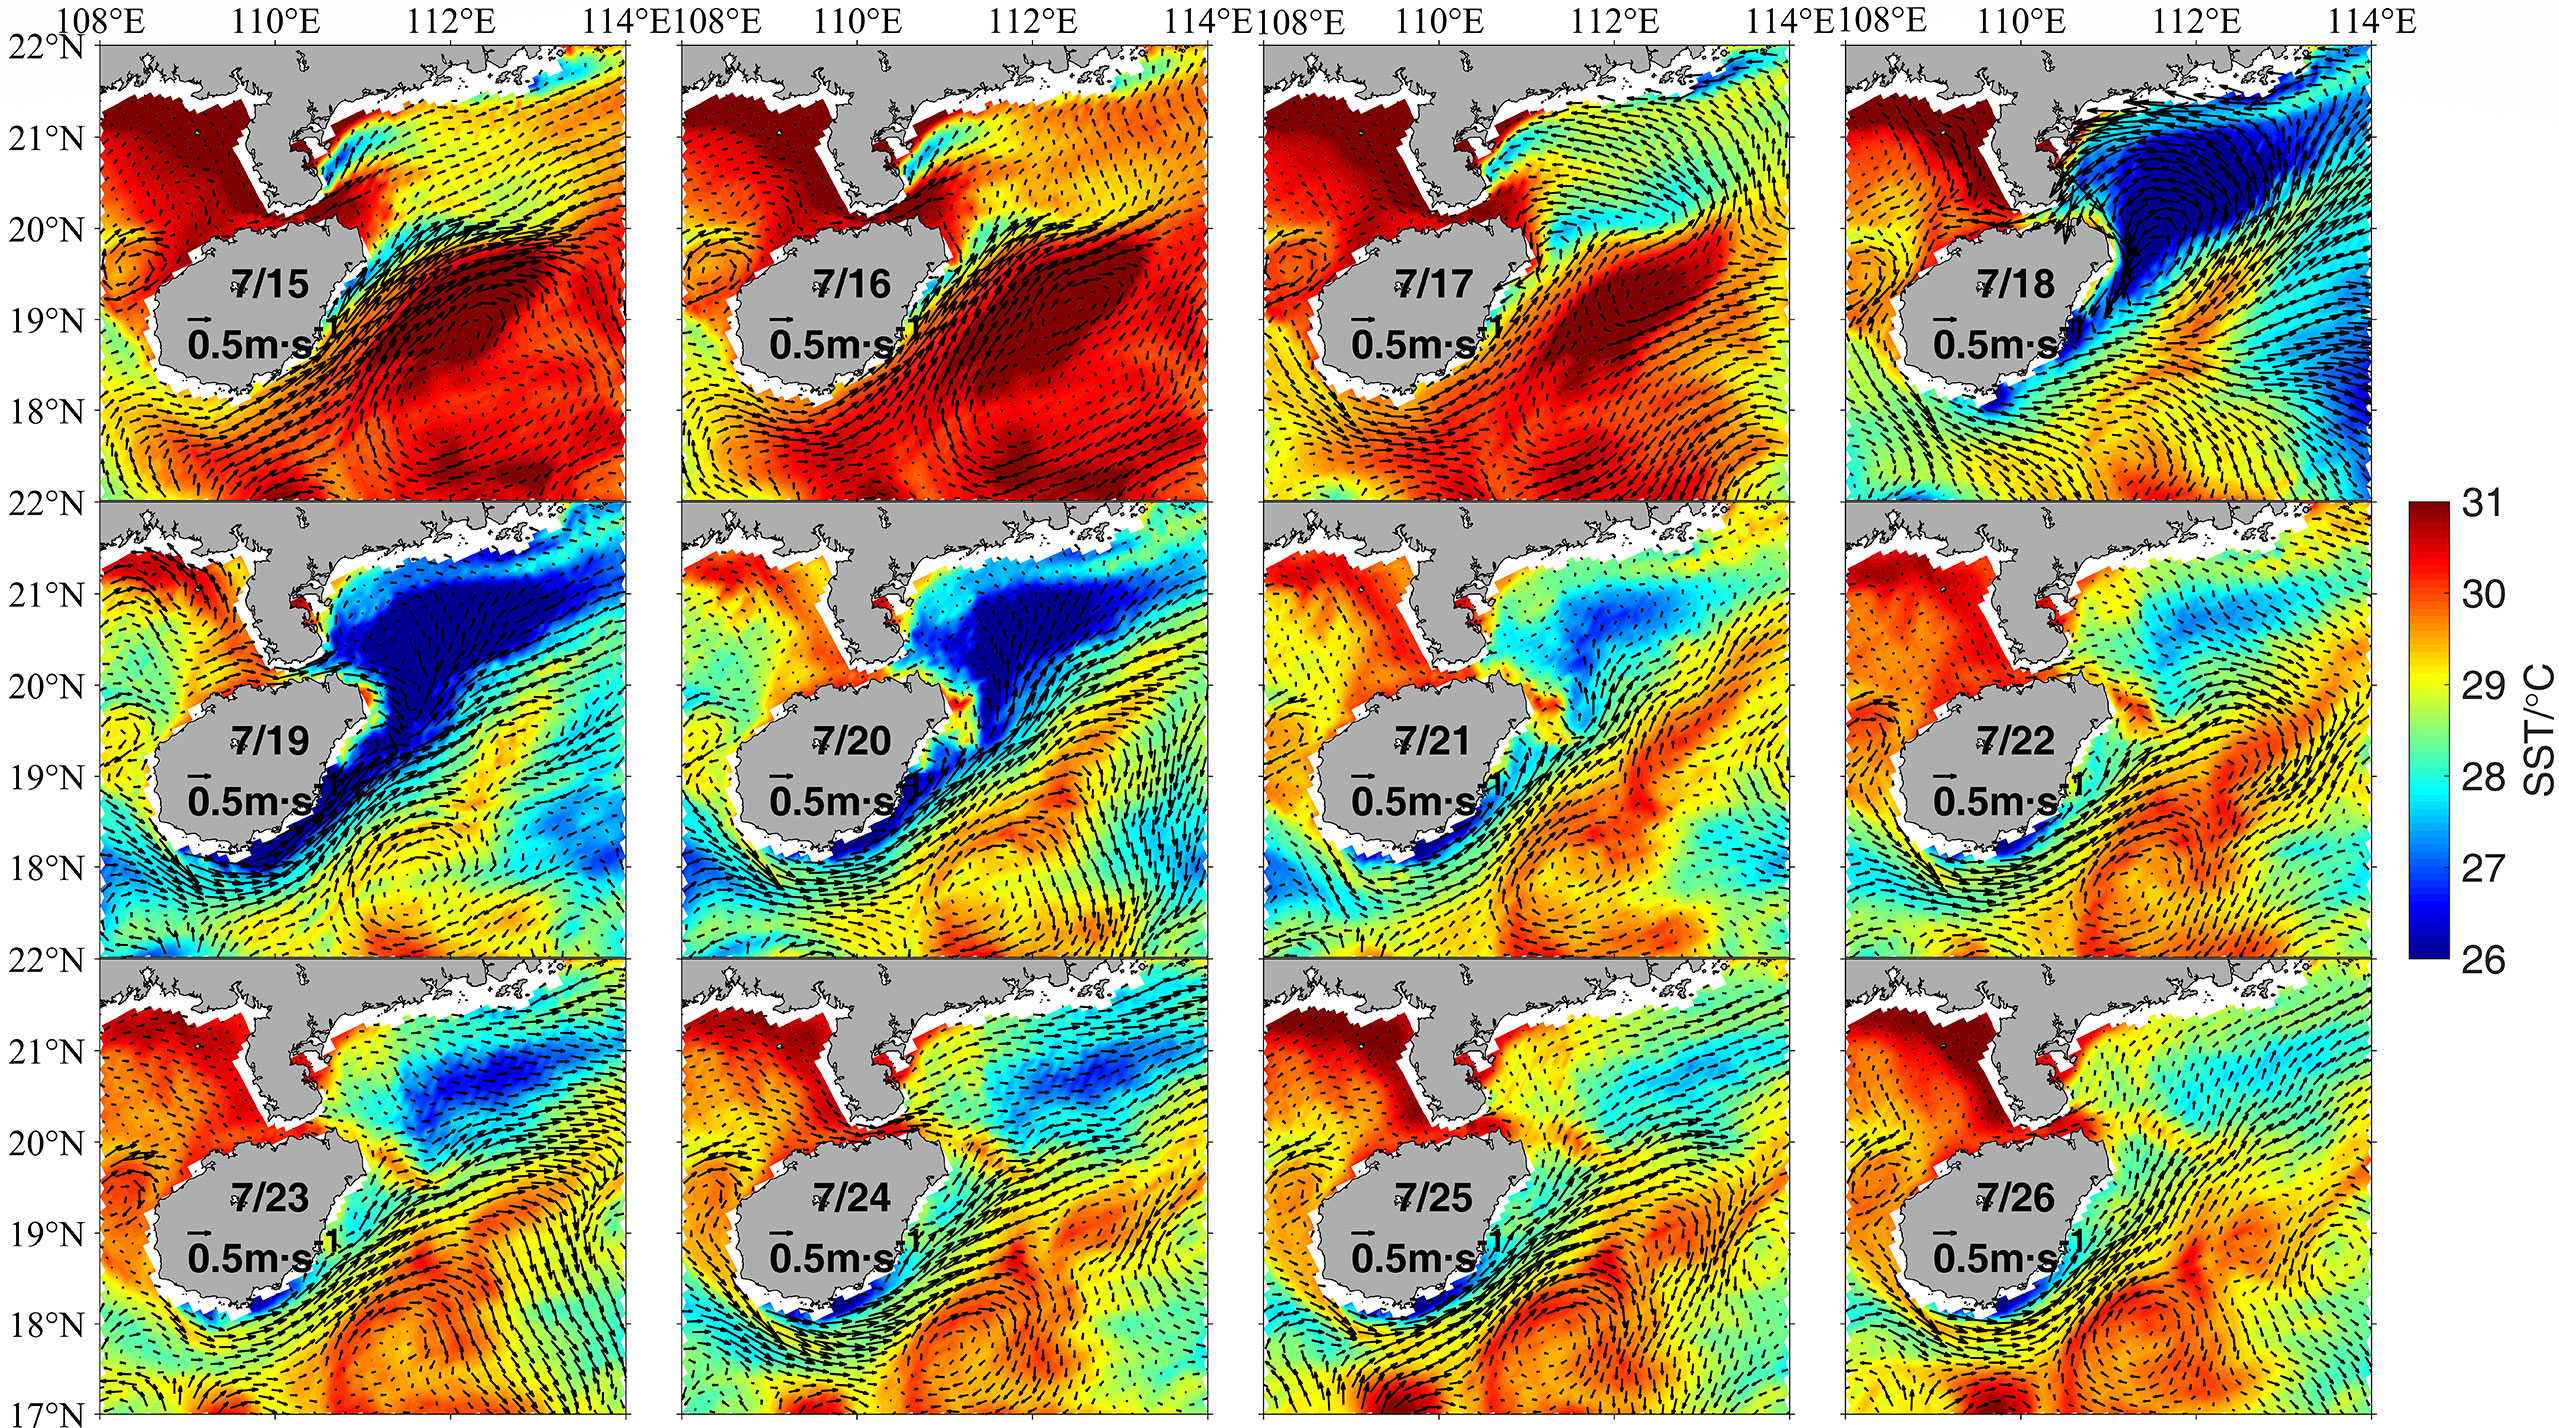
Figure 6 Evolution of daily mean sea surface current (vectors) and SST (shading) from July 15 to 26. The results are outputs from numerical model. The current vectors are plotted in every 2 grids.
Here, a transect across the upwelling zone Transect S is chosen to present the responses of hydrodynamic processes of the HIU to Rammasun (Figure 1B). Figure 7 shows that a well-developed coastal upwelling occurred at the HIU along the transect on July 15. The isotherms were uplifted toward the coast, bottom cold water corresponded to a steady upward velocity (W) in the bottom layer, and a strong offshore current occupied the upper layer. The upwelling was disturbed by Rammasun on July 18 when a downwelling replaced the upwelling at the near-bottom layer. The mixed water column can reach around 20 m. The bottom cold water moved seaward for at least 10 km (taking the 19°C isotherm into account). On July 22, the bottom cold water started to climb along the slope and the coastal upwelling rebuilt a few days later.
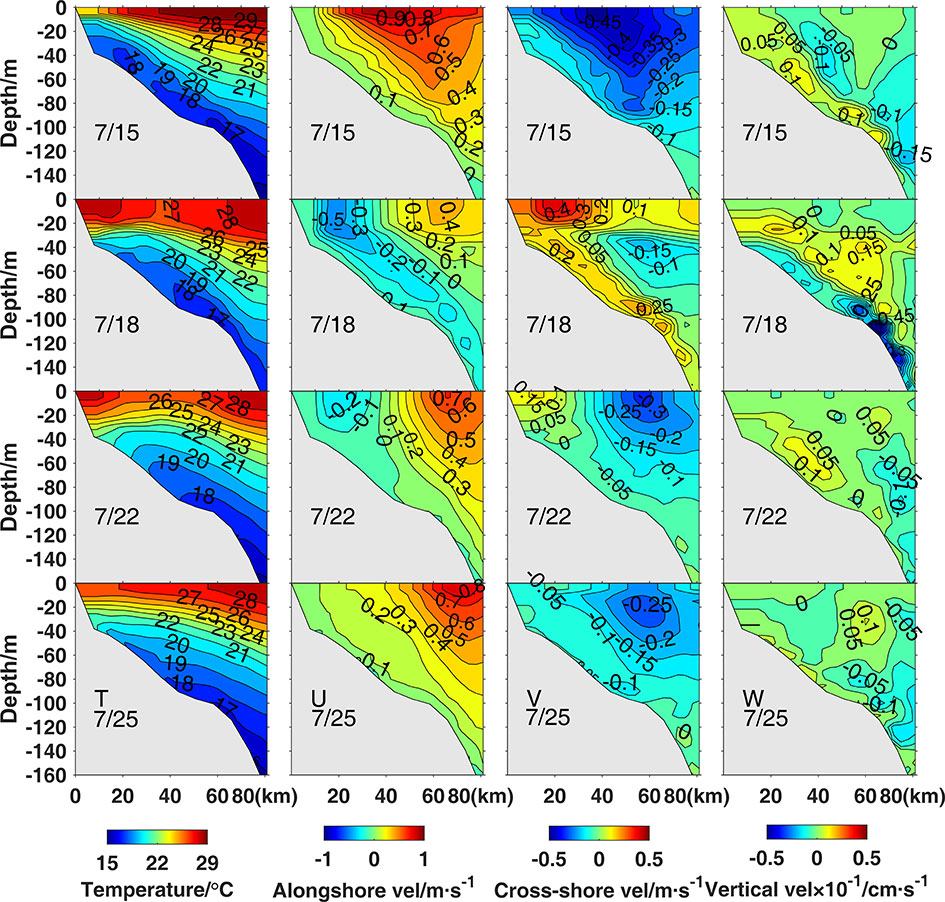
Figure 7 Temperature (T) and velocity in the across-shore (U), along-shore (V), and vertical (W) direction along transect S on July 15, 18, 22, and 25.
Stations A and B are selected to show the time series of the wind field, temperature, salinity, and MLD together with Ekman pumping velocity (EPV) and coastal upwelling velocity (Wc, which is calculated by Wc=τa/ρwfL, here τa is the alongshore wind stress and L is the horizontal length scale of upwelling) in the HIU region (Figure 8). During the passage of Rammasun, wind forcing at station B was much stronger (twice in magnitude) than those at Station A which is deeper and has relatively stronger stratification than Station B. Stronger vertical mixing (deepening of MLD) occurred at Station B around July 18 to 20, which was the fast response of the ocean to the strong wind during the passage of Rammasun. A few hours after the intense vertical mixing, the EPV and Wc increased rapidly and then fell to the normal condition after the typhoon. The horizontal distribution of EPV and MLD (Figure 9) indicates the deepening of MLD lasted a few days but the EPV decreased very fast, which might be due to the fast translation speed of Rammasun. The oceanic adjustment lasted for about two weeks after typhoon landfall. Although Stations A and B are both located offshore from the EHI, their response to Rammasun differs from each other. Further analyses are conducted in the following discussion section to reveal the reason.
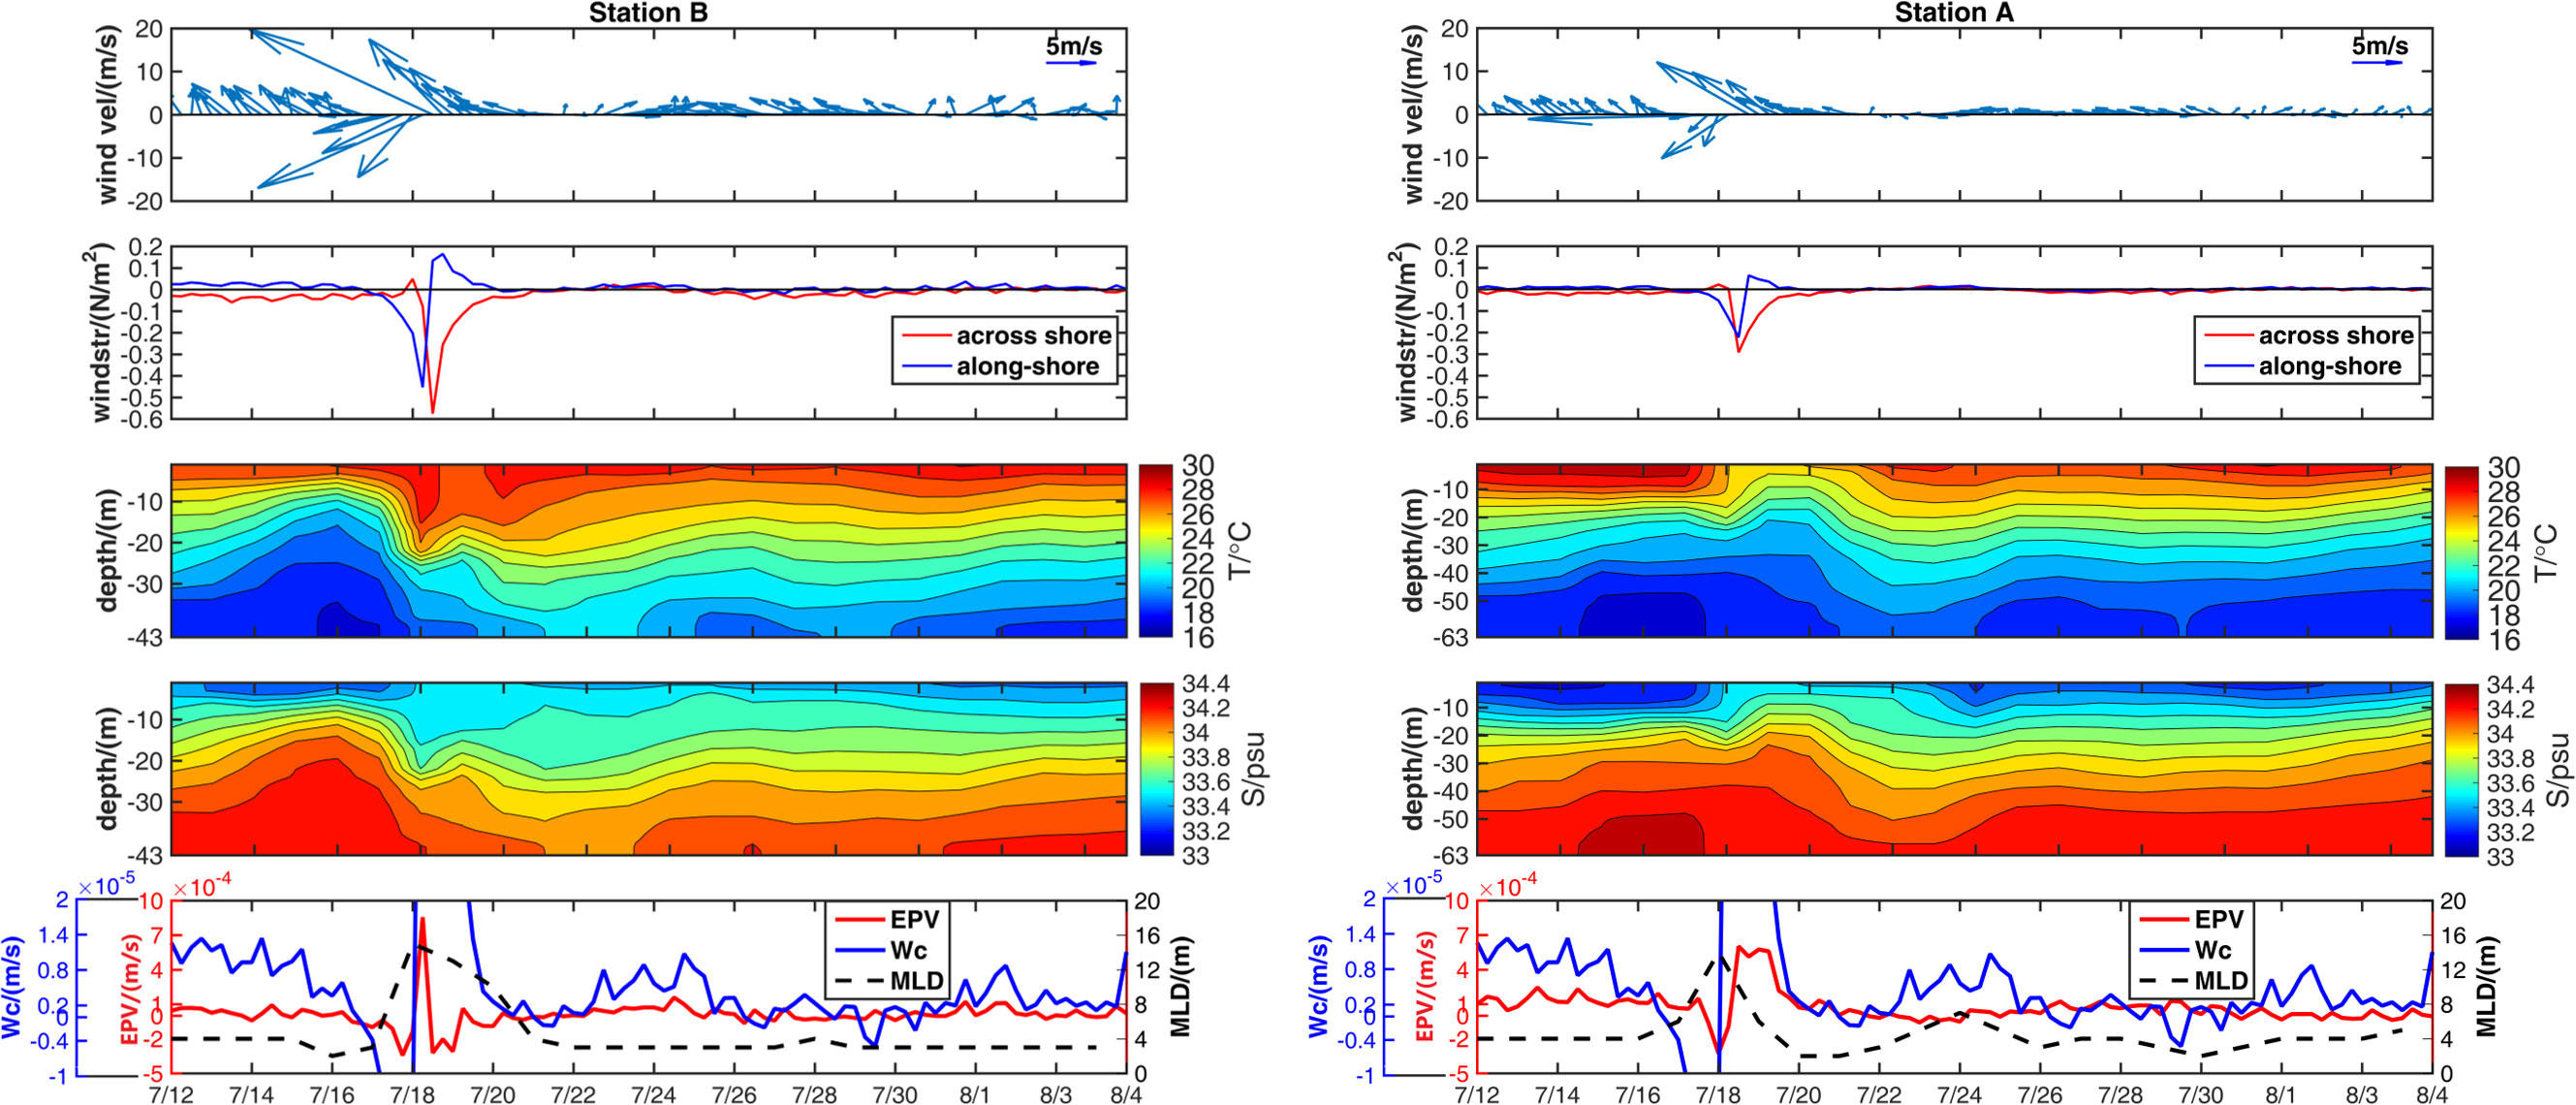
Figure 8 Time series of (from top to bottom) wind vectors, wind stress, modeled vertical profiles of temperature and salinity, and mixed-layer depth together with Ekman pumping velocity (EPV) and coastal upwelling velocity (Wc) at stations (B) (left) and (A) (right).
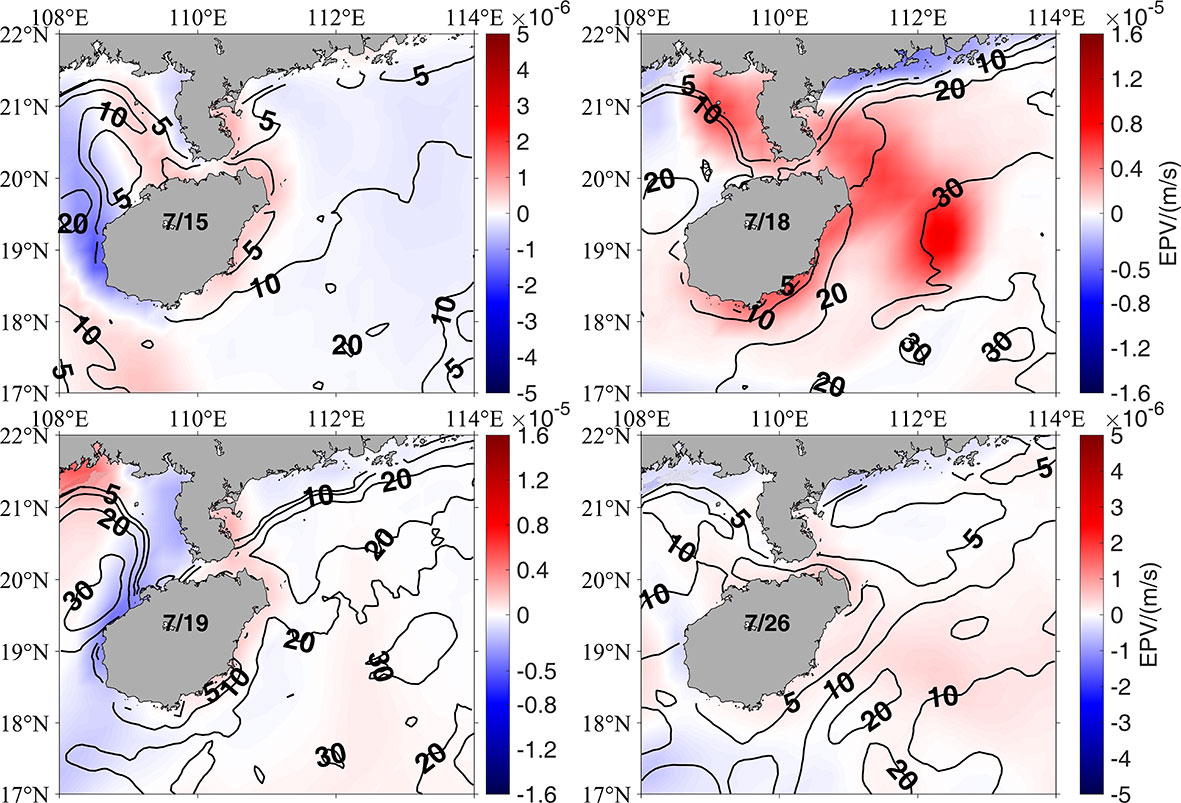
Figure 9 Distributions of Ekman pumping velocity (EPV) (shading) and mixed-layer depth (MLD) (contour) on July 15, 18, 19, and 26.
It is well known that NIWs are usually triggered in pycnocline when typhoons pass the ocean surface with certain translation speeds (Sun et al., 2010; Chen and Tang, 2012; Pan et al., 2017) and the pycnocline can largely determine its generation. Conversely, NIWs can induce strong mixing and disturb pycnocline. The variation of stratification reflects the vertical change of density in the pycnocline that can impact wave behaviors in upwelling regions. Chen et al. (2013) revealed that weak stratification and stronger vertical shear of horizontal flow facilitate the propagation of near-inertial kinetic energy (NIKE). Alford et al. (2016) found that the fast response of ocean stratification could impact the near-inertial energy propagation to the inner ocean. Here, we calculate Brunt-Väisälä frequency () to quantify the variation of water column stratification in the HIU during the typhoon period. Times series of vertical profiles of N at stations A-C in the HIU are shown in Figure 10. The strongest stratifications were located at about 5-10 m depth below the surface pre-typhoon, which is consistent with the in-situ observation by Liu et al. (2020). It can be seen that N changed dramatically at these stations during the passage of Rammasun. The water columns became unstable on July 17, the pycnoclines moved down to 25 m depth on July 18, and then stratification was destroyed completely after July 20 in the HIU. It took at least two weeks for the stratification to be recovered after Rammusun. At the same time, the major upwelling zone of the HIU shifted to the area of the southern coast (Figure 6). We choose Station F to represent the new center of the HIU (Figure 1). Different from Stations A-C, the depth of pycnocline was much deeper (about 15m-20m) at Station F during pre-typhoon. and it was much weakened and lifted to the surface layer after the typhoon passage. The direct impact of Rammasun on Station F was relatively minor than other stations since it was far away from the typhoon path.
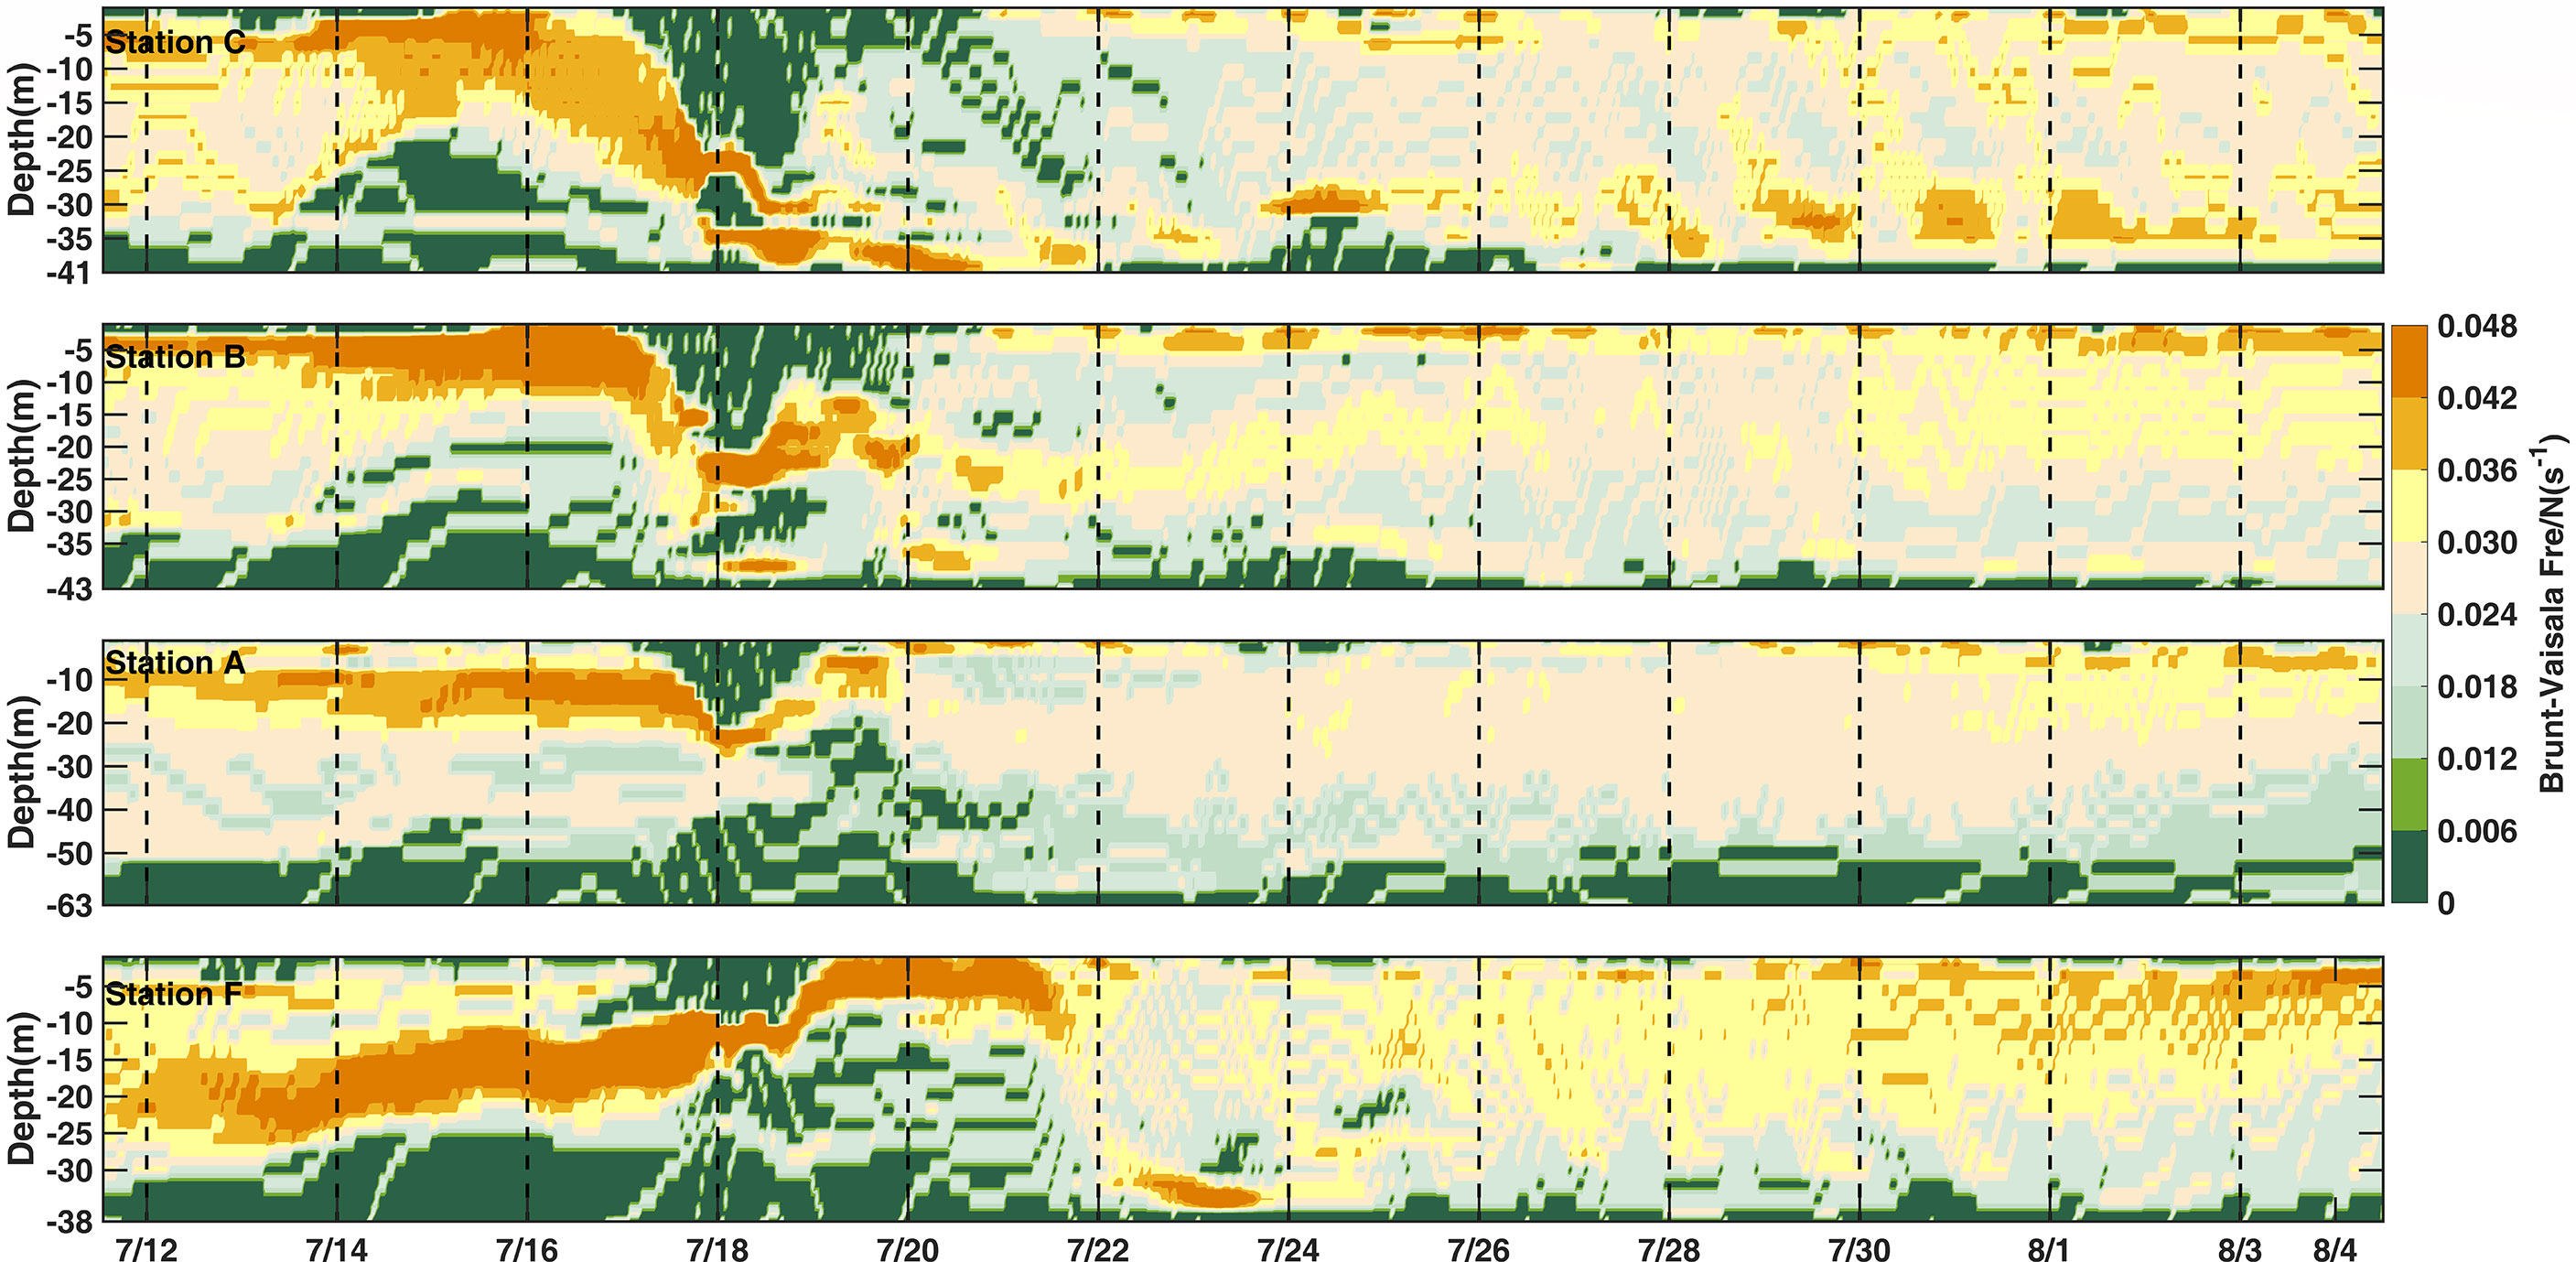
Figure 10 Time series of vertical profiles of Brunt-Väisälä frequency (N) at Stations C, B, A, and F from July 12 to August 4. The model simulated hourly density data are used in the calculation.
Tropical cyclones usually generate energetic near-inertial currents in the upper ocean, which cause vertical mixing through its instabilities (Price, 1981; Shay, 2010). Vertical mixing is a dominant factor for oceanic cooling during typhoon (Sanford et al., 2011, D’Asaro et al., 2014). Emanuel (2001) found that NIW-induced mixing at the mixed layer can help to form a typhoon-induced ‘cold wake’. Jochum et al. (2012), concluded that turbulent mixing from NIWs has a strong effect on tropic SST. Here, spectra analyses of the depth-averaged hourly-velocity are conducted to examine NIWs in the HIU during the typhoon period. Significant peaks at frequency f (about 0.705 cpd in Figure 11A) showed up indicating that strong NIWs were triggered by the typhoon in this area. Similar storm-generated near-inertial oscillations have been reported by many studies (Hormann et al., 2014; Zhang et al., 2014; Alford et al., 2016; Li et al., 2021a; Zhang et al., 2021).
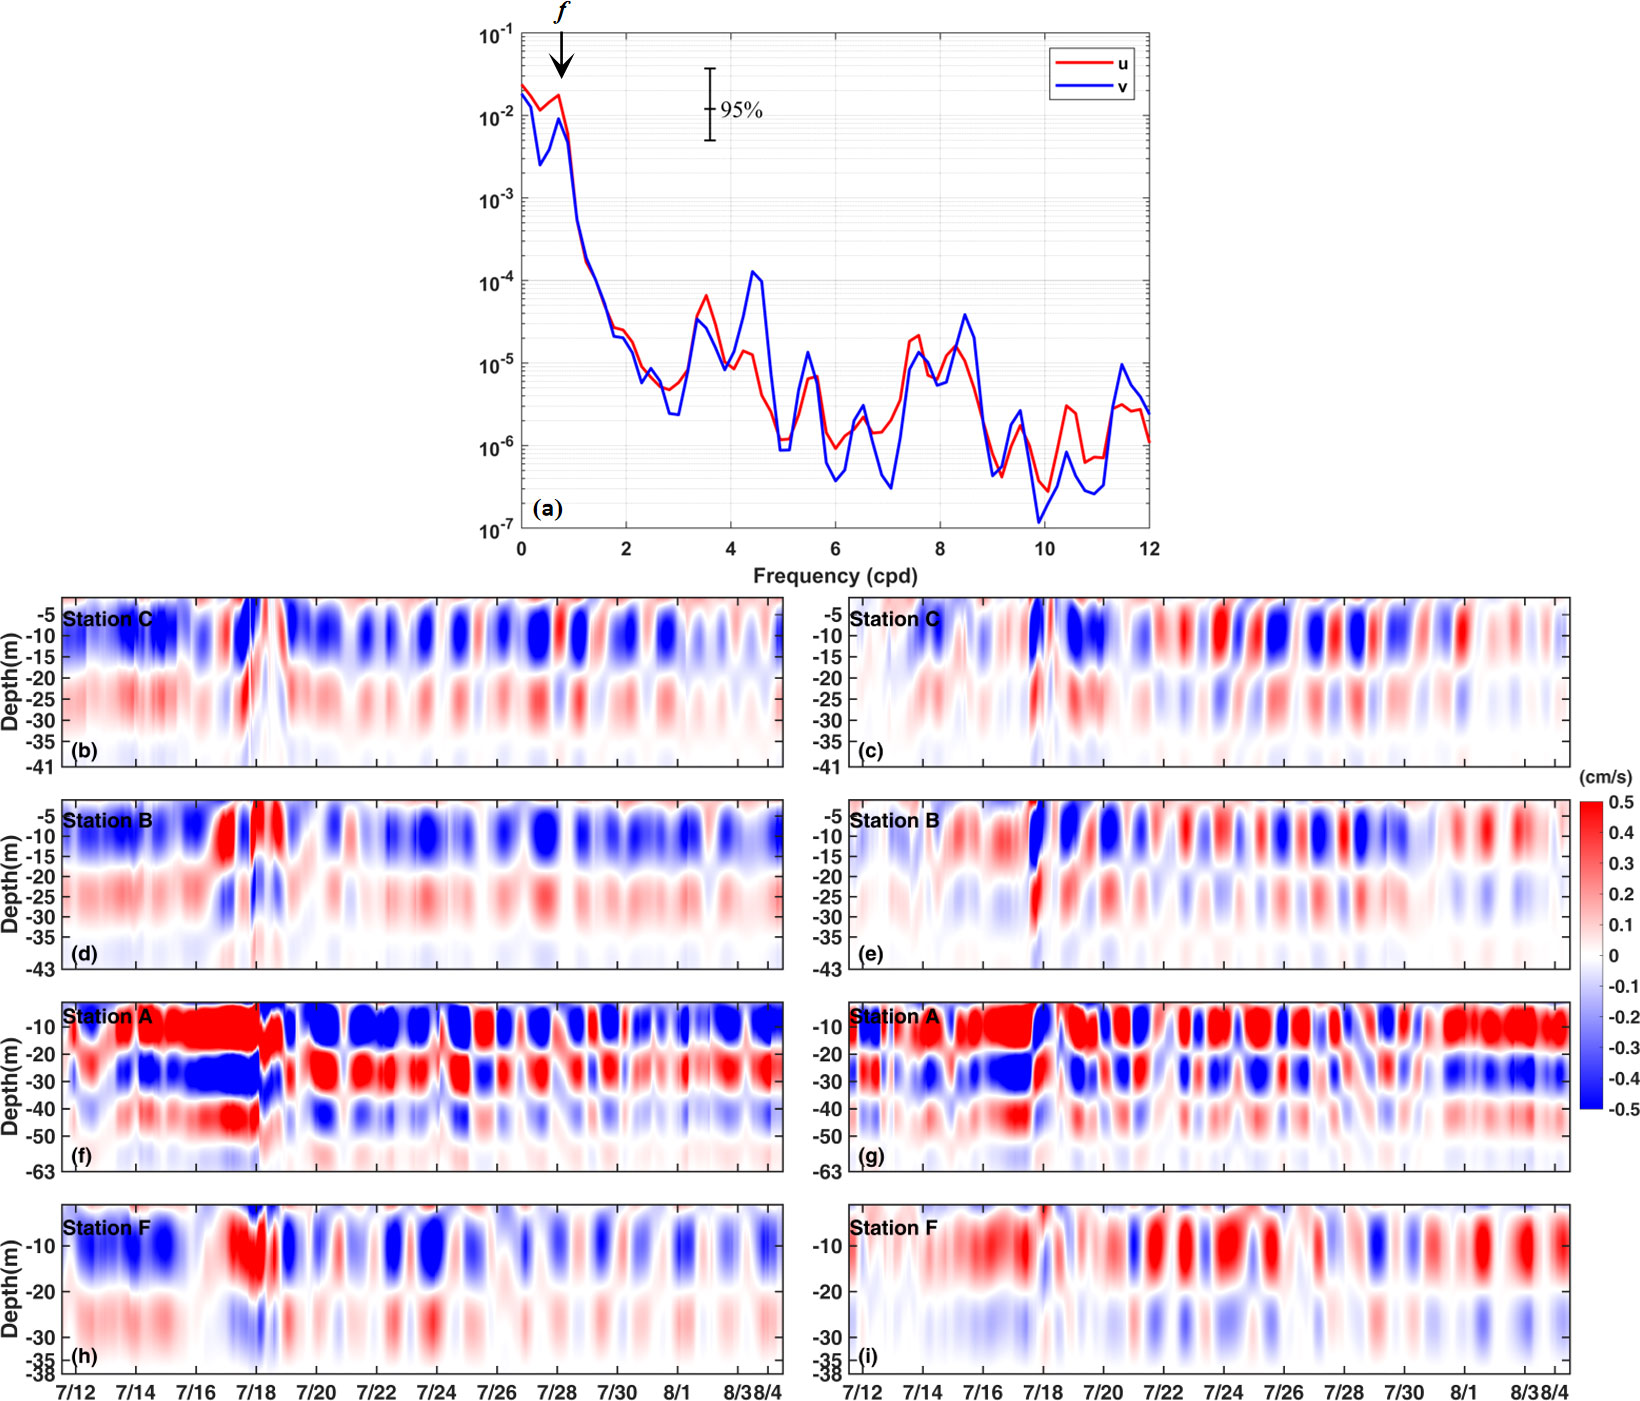
Figure 11 (A) Spectra analyses of modeled depth-averaged hourly velocity at station B. The across-shore (along-shore) component is u (v); (B–I) time series of vertical profiles of near-inertial flow at Stations C, B, A, and F from July 12 to August 4. Here (B, D, F, H) are across-shore component; (C, E, G, I) are along-shore component. The model simulated hourly current data are used in the calculation.
The near-inertial currents at the four stations are extracted and shown in Figures 11B–I. During pre-typhoon, the NIWs driven by the summer monsoon in the HIU were mainly dominated by model-1 with an unfixed period except for Station A, where mode-3 dominated the near-inertial currents. The strongest NIWs occurred at this station compared with other stations due to its topography connecting with the open ocean through a trough where waves can easily propagate landward and create a world-famous surf base. Benefiting from that, strong NIKE reached Station A from the open ocean since July 16 (Figure 12). The NIWs were strengthened and became periodically right after the typhoon passage (Figures 11, 12) in the HIU. The periodic near-inertial oscillations lasted about two weeks and dissipated gradually to cause strong vertical mixing and break pycnocline in the HIU. Figure 4 shows that Chl-a bloom occurred in the HIU during July 20 to 27. Since the coastal upwelling was weakened largely after the typhoon passage, its contribution to the Chl-a bloom was very limited during this period. The intensified NIWs and its induced strong vertical mixing were the main factors in forming this Chl-a bloom in the HIU.
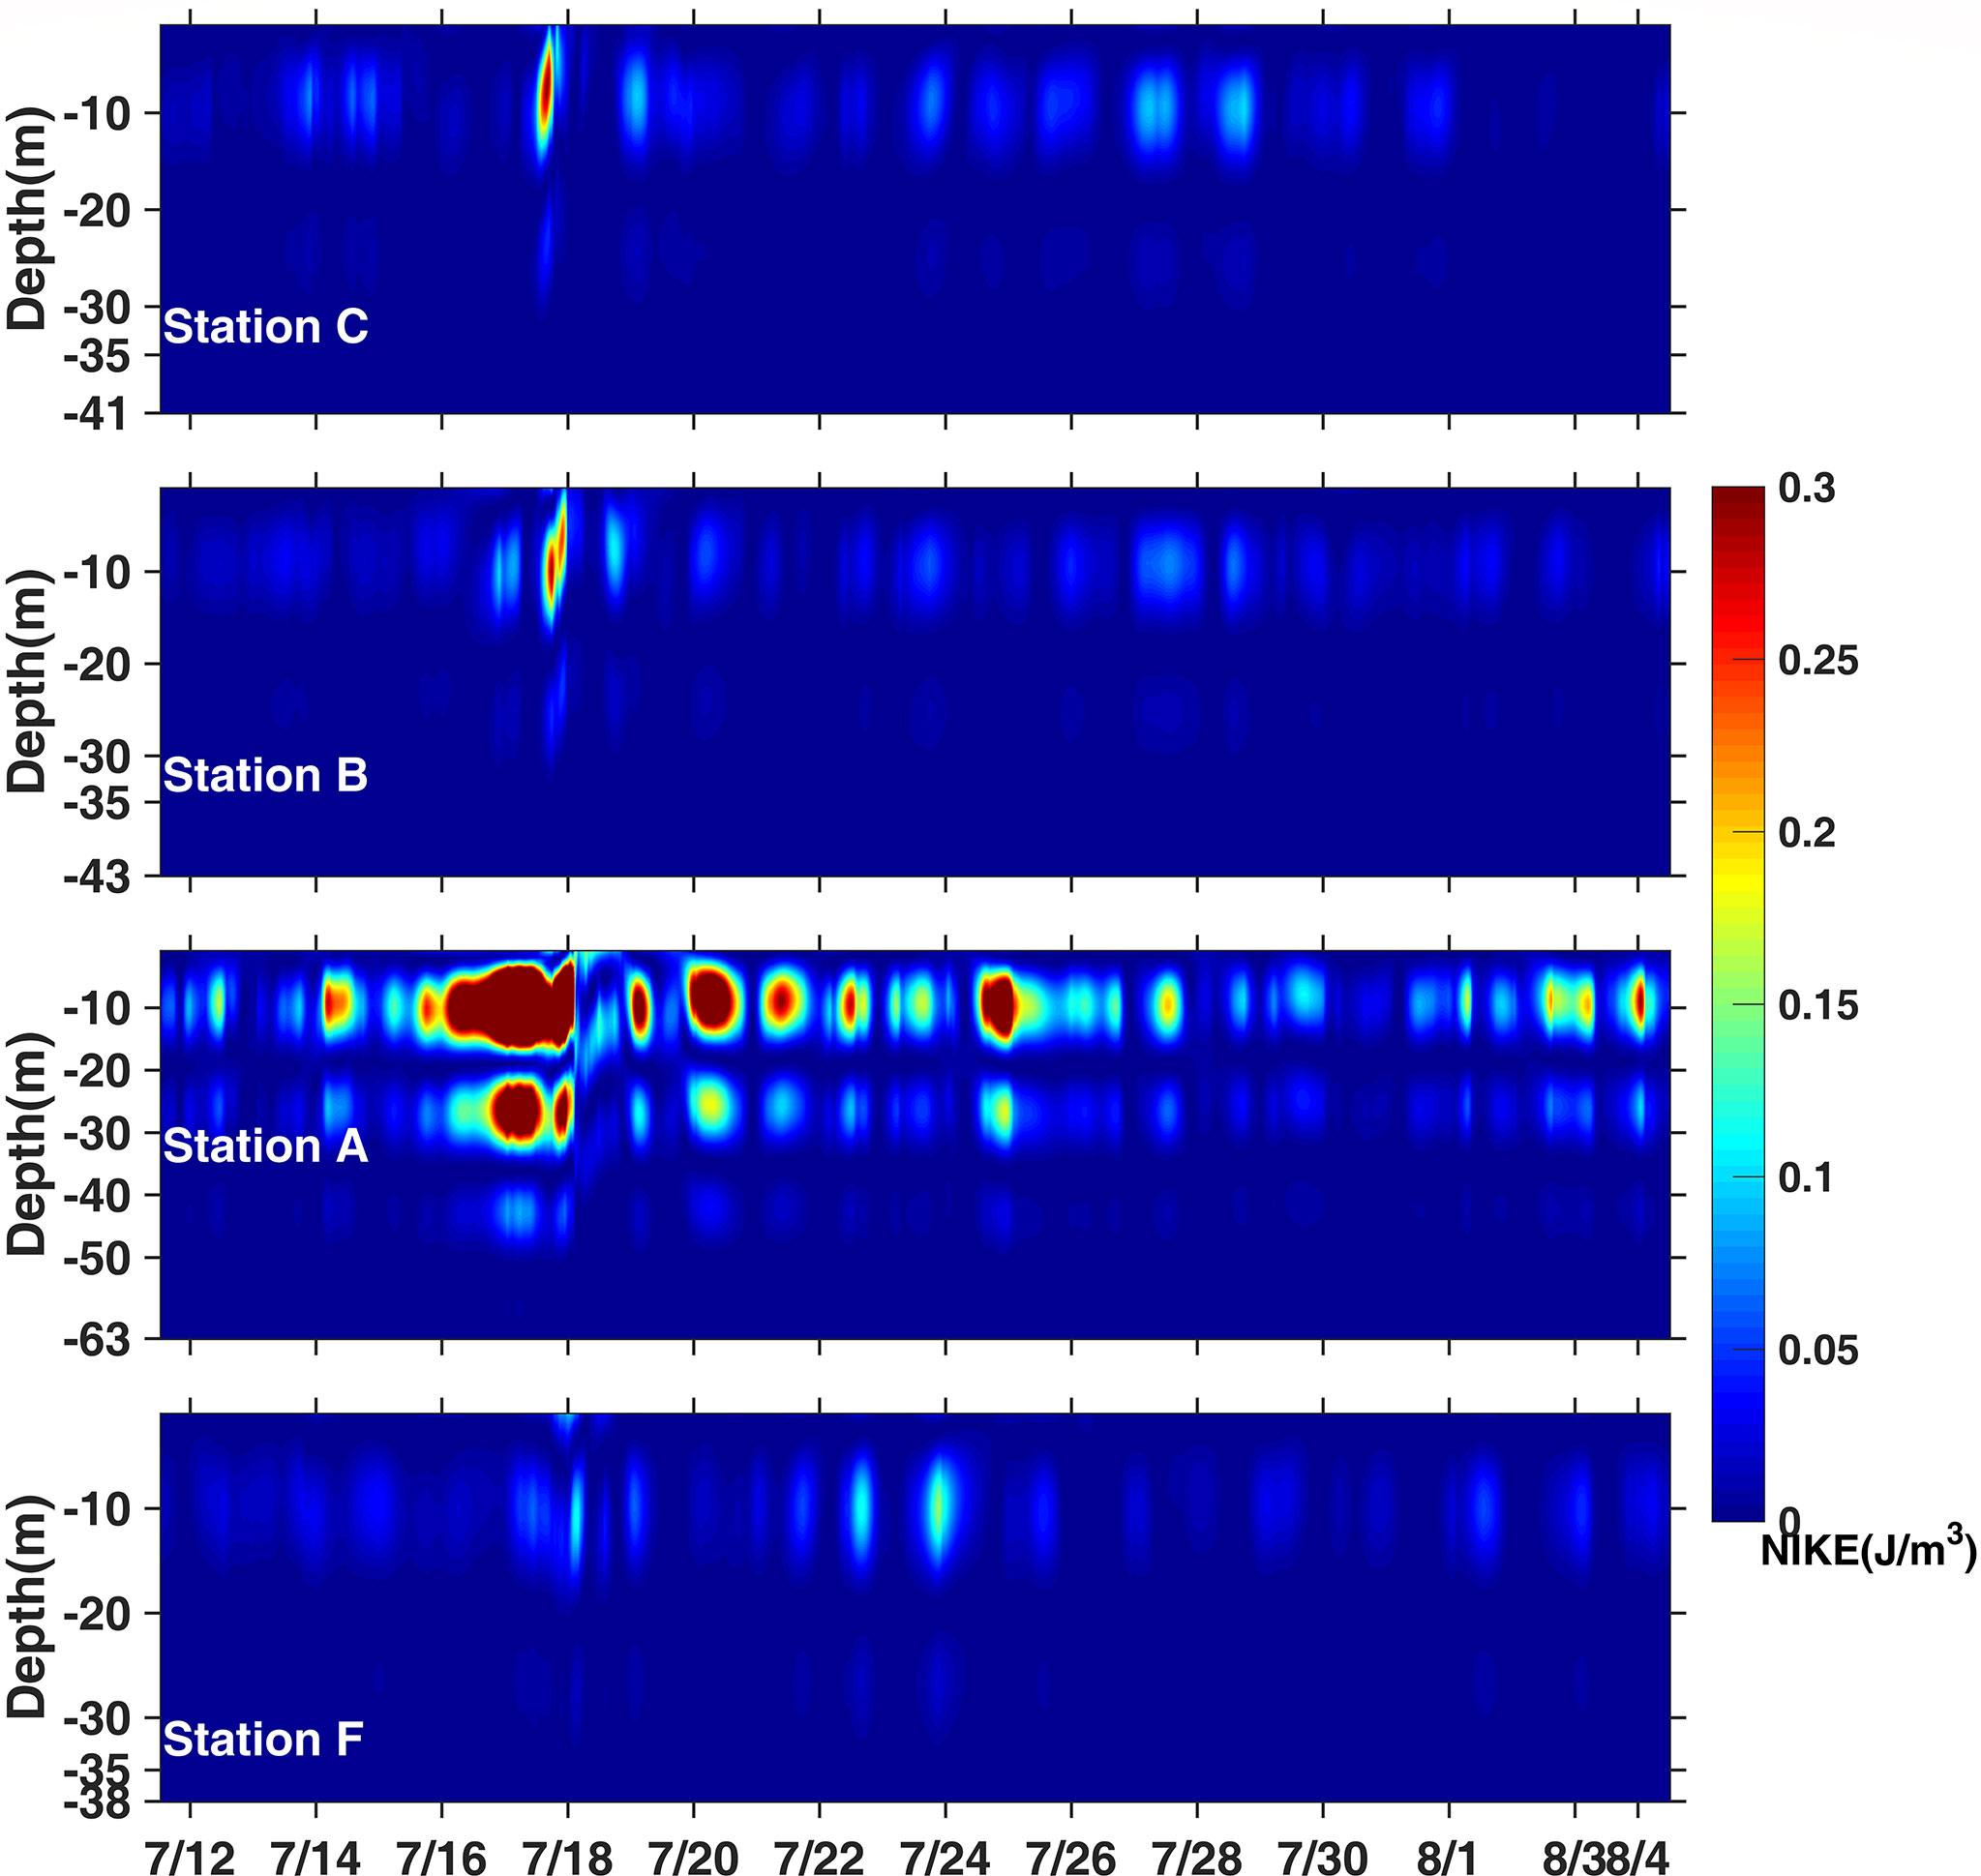
Figure 12 Time series of vertical profiles of near-inertial kinetic energy (J/m3) at stations (C, B, A, and F).
For exploring the response of the temperature transport process to the typhoon passage, decomposition of the temperature controlling equation is applied and analyzed in this section. The temperature change rate can be written as (Mellor, 2004):
In the equation, the local rate of temperature change (Tt) equals a combination of the flow field horizontal (hadv) and vertical (vadv) advective rate of change, the rates of change by horizontal (hdif) and vertical (vdif) diffusion, and short-wave radiation flux, i.e., penetrative radiation (rad). These terms in the temperature equation are used to investigate the relative contribution of each term to thermal changes in the HIU. The time series of vertical profiles of each term at Stations A-B are extracted and plotted in Figure 13.
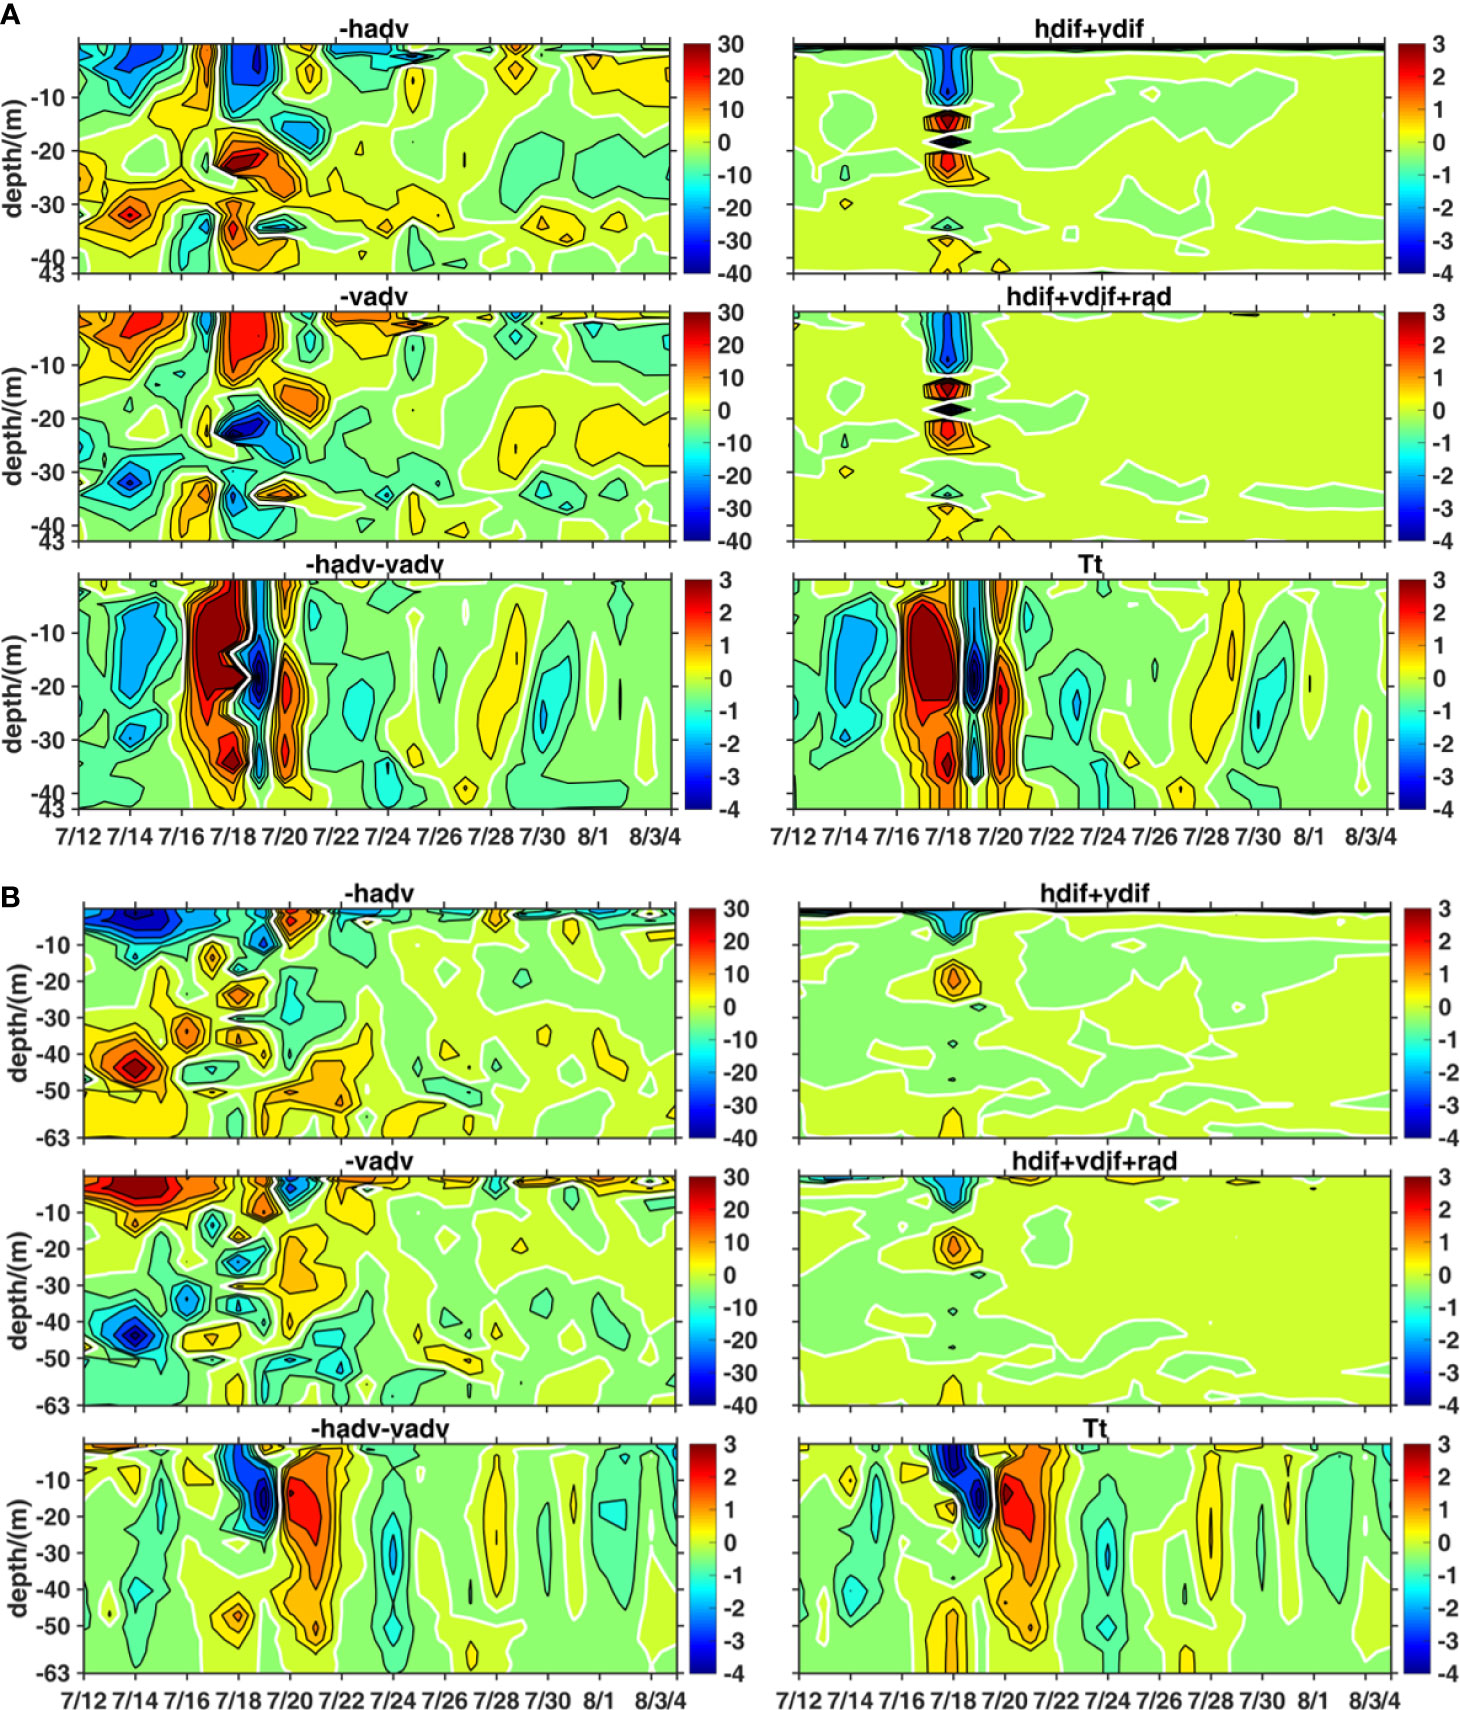
Figure 13 Temperature transport term decomposition at stations B (A) and A (B) from July 12 to August 4. The unit of each term is °C/day.
The horizontal and vertical advective terms were the dominant factors for temperature transport in the HIU during pre-typhoon. The combined advective term (hadv+vadv) accounted for the temperature change of -1.2°C/day and -0.8°C/day in the subsurface layer at Stations B and A, respectively. The combined effect of diffusion term and penetrative radiation (hdif+vdif+rad) was minor. During the typhoon period (around July 18), the combined horizontal and vertical diffusion term (hdif+vdif) became one of the dominating factors and had a comparable magnitude with the combined advection term (hadv+vadv). At Station B, the combined effect of advection and diffusion resulted in a temperature increase in the subsurface layer from July 16 to18. The temperature change rate of 5°C/day can be discerned. This significant temperature change rate was closely related to the synoptic wind variation during the approach of Rammasun when the southerly wind ceased on July 16 and the northeasterly wind dominated on July 17 (Figure 2). Statistics of typhoon cases from 2008 to 2017 indicate that cyclonic wind of typhoons destroyed the upwelling-favorable southwesterly wind field off the EHI, which altered or shut down the local Ekman transport (Liu and Tang, 2020). Their results demonstrated that the HIU does not occur every day during summer and instead, occurs with a mean time interval of 6 days. The short-term variations of upwelling are very active in coastal oceans (Miller and Tziperman, 2017; Yin and Huang, 2019).
The response of the advective terms to this typhoon lasted about 5–6 days which caused a larger local rate of temperate change during this period than in other periods. Conversely, the diffusion term only showed compatible contributions around July 18, which corresponded with the intense mixing induced by the strong wind force of Rammasun. At the surface layer, the advection terms showed significant wave signals along the shelf break off southeastern Hainan Island on July 15 (Figure 14) and the wave signals became much stronger on July 18 and 19 with the passage of the typhoon. This kind of typhoon-induced wave has been observed frequently in the northern SCS (Sun et al., 2015; Zheng et al., 2015; Li et al., 2021a; Li et al., 2022). Li et al. (2021a) found that the storm-generated near-inertial oscillations exhibit a slope-intensified feature on the northern slope of the SCS, regardless of typhoon trajectory and intensity. Su and Pohlmann (2009) pointed out that internal waves can be generated at the shelf break southeast of Hainan Island. Similarly, Li et al. (2022) found that NIWs and coastal shelf waves showed up in the East China Sea after Typhoon Chanhom. After typhoon landfall, the wave signals dissipated gradually and vanished on July 26. For exploring the generation mechanisms of wave signals and their contribution to the temperature transport process off the EHI, long-term observations along the shelf break of the northern SCS are needed in the future.
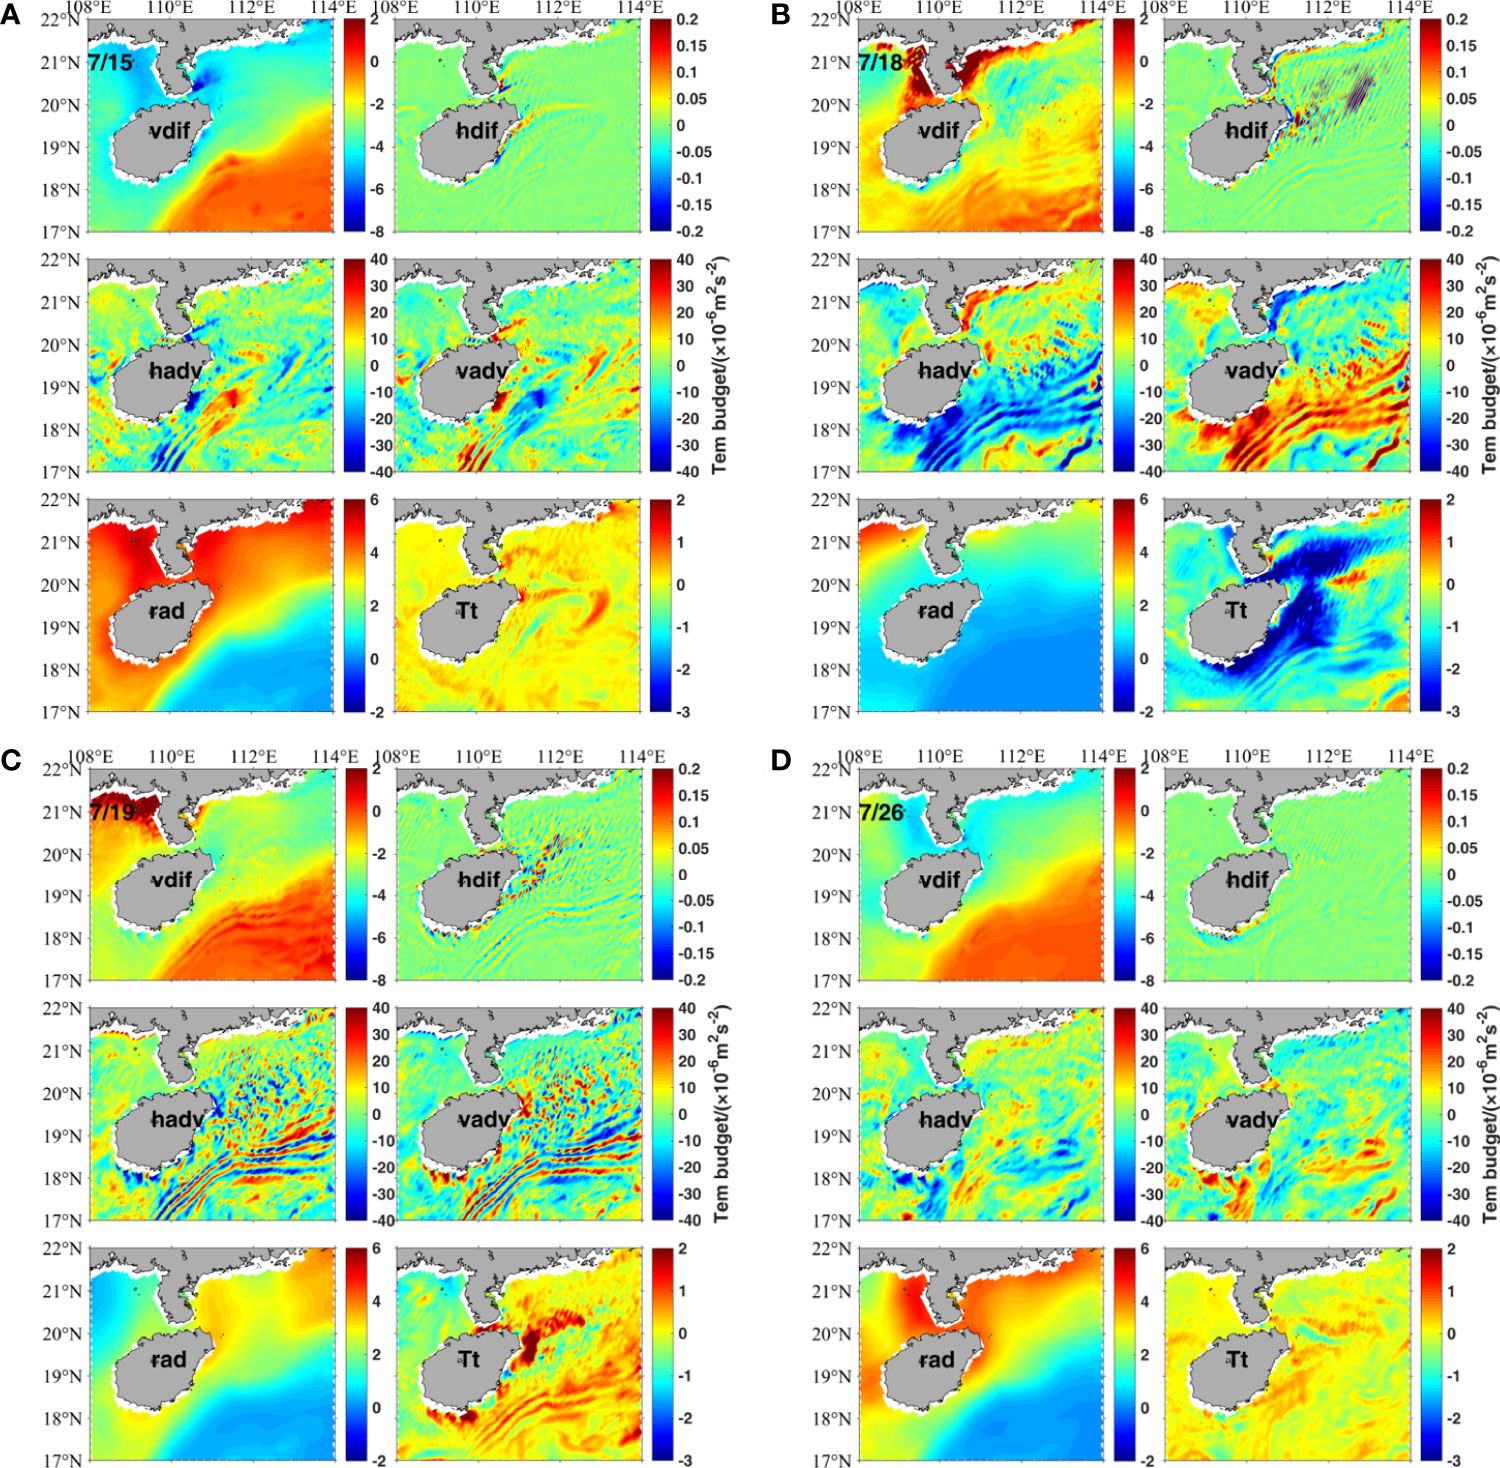
Figure 14 Temperature transport term decomposition on (A) July 15, (B) July18, (C)19, and (D) 26. Each term in the surface layer are plotted.
This study focuses on how a typical fast-moving typhoon, such as Rammasun, influences the coastal upwelling processes and related variations of Cha-a concentration and temperature in the HIU. We give two schematic diagrams of the HIU during pre-typhoon and on-typhoon conditions for comparison (Figure 15). In summary, the HIU was weakened and the climbing of deep water was significantly depressed by Typhoon Rammasun. The typhoon dramatically cooled down surface temperature in a large domain and at the same time, the typhoon triggered periodic NIWs in the HIU. Combining with strong wind curls, NIWs caused strong vertical mixing and deepened the mixing layer. As a result, nutrient waters were brought to the surface from the deep layer which led to a Chl-a bloom in the HIU after typhoon passage. It took at least two weeks for the HIU to recover from this typhoon event.
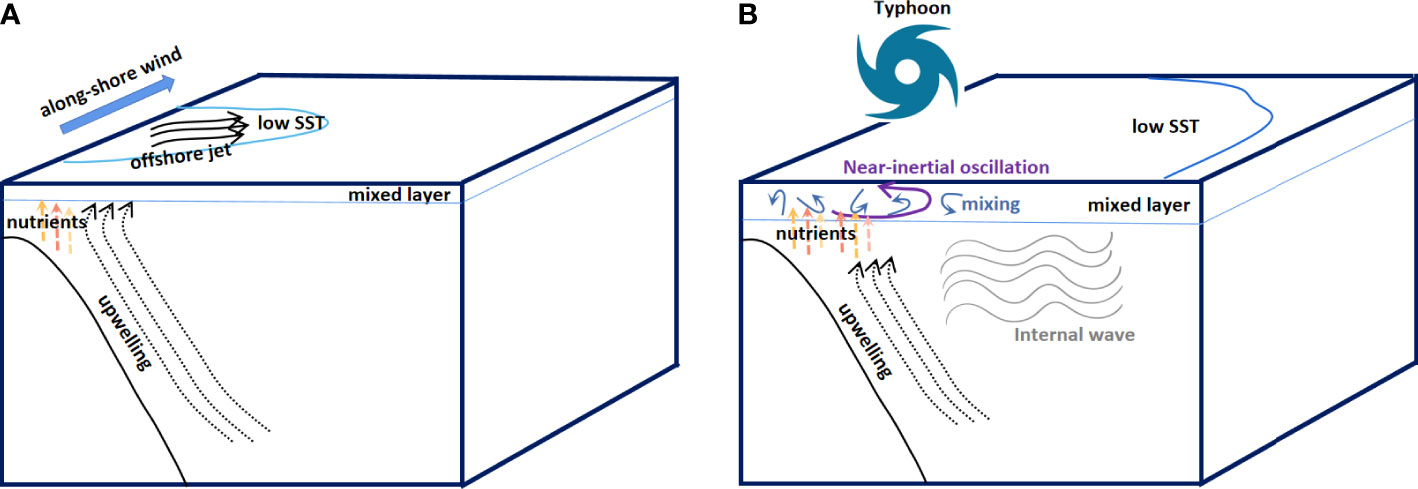
Figure 15 Schematic diagram for typhoon influence on the coastal upwelling off eastern Hainan Island (HIU). (A, B) are used for typical summertime and typhoon period, respectively.
The temperature transport process helps to understand how typhoons impact temperature in the HIU. Model results show that the advective terms were the dominant factors and the diffusion term was the minor factor for controlling temperature transport in the HIU in normal conditions. Once a typhoon arrived, advection terms showed a fast response to the typhoon and lasted about 5–6 days, causing a larger local rate of temperate change during this period than in other periods. Compared to advection terms, the diffusion term showed a compatible contribution to the temperature change during the typhoon passage. In addition, advection terms possessed significant wave signals along the shelf break off southeastern Hainan Island. The wave signals can be found before the typhoon passage and they were greatly intensified during the typhoon passage. After the typhoon made landfall, the waves dissipated gradually. To investigate the wave property in the HIU, long-term ocean current observations along the shelf break off southeastern Hainan Island are needed in future work.
The raw data supporting the conclusions of this article will be made available by the authors, without undue reservation.
BH took part in running model, writing the manuscript draft and result analyses. XH helped to design model grid and analyze data. SL helped to revise manuscript writing and result analyses. HX acted as PI supervisor for guiding the whole theoretic diagnoses and revised the manuscript. All authors contributed to the article and approved the submitted version.
This research was funded by the National Natural Science Foundation of China (grants 41976014 and 42176033), the CAS Frontier Basic Research Project under (grant QYJC201910), the Hainan Provincial Natural Science Foundation of China (grant 421QN0909) and the Youth Innovation Promotion Association CAS (grant 2022373).
The authors declare that the research was conducted in the absence of any commercial or financial relationships that could be construed as a potential conflict of interest.
All claims expressed in this article are solely those of the authors and do not necessarily represent those of their affiliated organizations, or those of the publisher, the editors and the reviewers. Any product that may be evaluated in this article, or claim that may be made by its manufacturer, is not guaranteed or endorsed by the publisher.
The Supplementary Material for this article can be found online at: https://www.frontiersin.org/articles/10.3389/fmars.2022.920825/full#supplementary-material
Supplementary Figure 1 | Model grid (left) and observation stations (right) during 2015 summer cruise. The cruise observations off the EHI were conducted from July 29 to August 7, 2015, and the Argos profiles in the northwestern Pacific are labeled in left panel.
Supplementary Figure 2 | Comparisons of observed (A–E) and modeled (F–J) temperature profiles across the shelf off the EHI. Model results are interpolated to the stations along S1, S4, S5, S6, and S8 transects.
Supplementary Figure 3 | Same as Supplementary Figure 2, except for salinity. (A–E) observed salinity profiles; (F–J) modeled salinity profiles.
Supplementary Figure 4 | Comparisons of modeled (red lines) and Argos (blue dotted lines) vertical temperature profiles. The observation date for these profiles are (A) Aug-13, (B) Dec-30, (C) Nov-23, (D) Aug-25, (E) Aug-27 and (F) Aug-8, 2015.
Supplementary Figure 5 | Same as Supplementary Figure 4, except forthe salinity.
The model domain and in-situ stations are shown in Supplementary Figure 1. Firstly, the model results are compared with cruise data during the summer of 2015. Supplementary Figures 2, 3, show the comparisons between model results and cruise data. The model simulated temperature and salinity and shows a similar pattern with in-situ observations along five transects in the HIU. The uplifting of isotherms and isohalines due to coastal upwelling can be well-reproduced by the model indicating the model is capable of reproducing the intensity and spatial variations of HIU.
There were several Argos profiles available in the northwestern Pacific. As shown in Supplementary Figures 4, 5, observed mixed-layer depth, thermocline, and halocline by Argos show seasonal variations. The model results show good performance in reproducing the open ocean temperature and salinity vertical structures. The variations in the upper ocean can be well reproduced. Based on the above model validations, the model is suitable for simulating temperature-salinity structures in the open ocean and the coastal upwelling region during the typhoon period.
Alford M. H., Mackinnon J. A., Simmons H. L., Nash J. D. (2016). Near-Inertial Internal Gravity Waves in the Ocean. Annu. Rev. Mar. Sci. 8 (1), 95. doi: 10.1146/annurev-marine-010814-015746
Benazzouz A., Pelegrı J. L., Demarcq H., Machın F., Mason E., Orbi A., et al. (2014). On the Temporal Memory of Coastal Upwelling Off NW Africa. J. Geophys. Res. Oceans. 119, 6356–6380. doi: 10.1002/2013JC009559
Blumberg A. F., Mellor G. L. (1987). A Description of a Three-Dimensional Coastal Ocean Circulation Model. Three-Dimensional Coastal Ocean Models Vol. 4. Ed. Heaps N. (Washington, D.C: American Geophysical Union), 1–16. doi: 10.1029/CO004p0001
Bonavita M., Hólm E., Isaksen L., Fisher M. The evolution of the ECMWF hybrid data assimilation system. Q. J. R. Meteorol. Soc. 2016, 142, 287–303. doi: 10.1002/qj.2652
Chen Z., Jiang W., Wang J., Gong W. (2019). Influence of a River Plume on Coastal Upwelling Dynamics: Importance of Stratification. J. Phys. Oceanogr. 49, 2345–2363. doi: 10.1175/JPO-D-18-0215.1
Chen Y., Tang D. (2012). Eddy-Feature Phytoplankton Bloom Induced by a Tropical Cyclone in the South China Sea. Int. J. Remote Sens. 33 (23), 7444–7457. doi: 10.1080/01431161.2012.685976
Chen G., Xue H., Wang D., Xie Q. (2013). Observed Near-Inertial Kinetic Energy in the Northwestern South China Sea. J. Geophys. Res. Oceans. 118 (10), 4965–7977. doi: 10.1002/jgrc.20371
D’Asaro E. A., Black P. G., Centurioni L. R., Chang Y. T., Chen S. S., Foster R. C., et al. (2014). Impact of Typhoons on the Ocean in the Pacifific. Bull. Am. Meteorol. Soc. 95 (9), 1405–1418. doi: 10.1175/BAMS-D-12-00104.1
Emanuel K. (2001). Contribution of Tropical Cyclones to Meridional Heat Transport by the Oceans. J. Geophys. Res. 106, 14771–14781. doi: 10.1029/2000JD900641
Han W., Wang M., Ma K. (1990). On the Lowest Surface Water Temperature Area of China Sea in Summer-the Upwelling Along the East Coast of Hainan Island. Oceanologia. Limnologia Sin. (in Chinese). 21 (3), 267–275.
Hein H., Hein B., Pohlmann T., Long B. H. (2013). Inter-Annual Variability of Upwelling Off the South-Vietnamese Coast and its Relation to Nutrient Dynamics. Global Planet. Change. 110 (SI), 170–182. doi: 10.1016/j.gloplacha.2013.09.009
Hong B., Wang D. (2008). Sensitivity Study of the Seasonal Mean Circulation in the Northern South China Sea. Adv. Atmos. Sci. 25 (5), 824–840. doi: 10.1007/s00376-008-0824-8
Hormann V., Centurioni L. R., Rainville L., Lee C. M., Braasch L. J. (2014). Response of Upper Ocean Currents to Typhoon Fanapi. Geophys. Res. Lett. 41, 3995–4003. doi: 10.1002/2014GL060317
Hu J., Wang X. (2016). Progresson Upwelling Studies in the China Seas. Rev. Geophys. 54, 653–673. doi: 10.1002/2015RG000505
Jing Z., Qi Y., Du Y. (2011). Upwelling in the Continental Shelf of Northern South China Sea Associated With 1997-98 El Niño. J. Geophys. Res. Oceans. 116 (C2), C02033. doi: 10.1029/2010JC006598
Jing Z., Qi Y., Hua Z., Hong Z. (2009). Numerical Study on the Summer Upwelling System in the Northern Continental Shelf of the South China Sea. Cont. Shelf Res. 29 (2), 467–478. doi: 10.1016/j.csr.2008.11.008
Jochum M., Briegleb B. P., Danabasoglu G., Large W. G., Norton N. J., Jayne S. R., et al. (2012). On the Impact of Oceanic Near-Inertial Waves on Climate. J. Clim. 26, 2833–2844. doi: 10.1175/JCLI-D-12-00181.1
Lentz S. J., Chapman D. C. (2004). The Importance of Nonlinear Cross-Shelf Momentum Flux During Wind-Driven Coastal Upwelling. J. Phys. Oceanogr. 34, 2444–2457. doi: 10.1175/JPO2644.1
Li R., Chen C., Dong W., Beardsley R. C., Wu Z., Gong W. (2021a). Slope-Intensified Storm-Induced Near-Inertial Oscillations in the South China Sea. J. Geophys. Res. Oceans. 126, e2020JC016713. doi: 10.1029/2020JC016713
Lin P. G., Cheng P., Gan J. P., Hu J. Y. (2016b). Dynamics of Wind-Driven Upwelling Off the Northeastern Coast of Hainan Island. J. Geophys. Res. Oceans. 121, 1160–1173. doi: 10.1002/2015JC011000
Lin P. G., Hu J. Y., Zheng Q. A., Sun Z. Y., Zhu J. (2016a). Observation of Summertime Upwelling Off the Eastern and Northeastern Coasts of Hainan Island, China. Ocean Dyn. 66 (3), 387–399. doi: 10.1007/s10236-016-0934-2
Lin I. I., Liu W. T., Wu C. C., Chiang J. C. H., Sui C. H. (2003b). Satellite Observations of Modulation of Surface Winds by Typhoon-Induced Upper Ocean Cooling. Geophys. Res. Lett. 30 (3), 1131. doi: 10.1029/2002GL015674
Lin I. I., Liu W. T., Wu C. C., Wong G. T. F., Hu C., Chen Z., et al. (2003a). New Evidence for Enhanced Ocean Primary Production Triggered by Tropical Cyclone. Geophys. Res. Lett. 30 (13), 1718. doi: 10.1029/2003GL017141
Li Y. N., Peng S. Q., Yang W., Wang D. X. (2012). Numerical Simulation of the Structure and Variation of Upwelling Off the East Coast of Hainan Island Using QuikSCAT Winds. Chin. J. Oceanol. Limnol. 30 (6), 1068–1081. doi: 10.1007/s00343-012-1275-8
Liu S., Hong B., Wang G., Wang W., Xie Q., Ni Z., et al. (2020). Physical Structure and Phytoplankton Community Off the Eastern Hainan Coast During Summer 2015. Acta Oceanol. Sin. 39 (11), 103–114. doi: 10.1007/s13131-020-1668-z
Liu Y., Peng Z. C., Wei G. J., Chen T. G., Sun W. D., Jian-Feng H. E. (2009). Variation of Summer Coastal Upwelling at Northern South China Sea During the Last 100 Years. Geochim. (in Chinese) 38 (4), 317–322. doi: 10.1016/S1874-8651(10)60080-4
Liu Y., Tang S. (2020). Study on the Characteristics of High-Requency Variation of Qiongdong Upwelling in Summer (in Chinese With English Abstract). J. Trop. Oceanogr. 39 (4), 1–12. doi: 10.11978/2019080
Li Y., Yang D., Xu L., Gao G., He Z., Cui X., et al. (2022). Three Types of Typhoon-Induced Upwellings Enhance Coastal Algal Blooms: A Case Study. J. Geophys. Res. Oceans. 127, e2022JC018448. doi: 10.1029/2022JC018448
Li Y., Ye X., Wang A., Li H., Chen J., Qiao L. (2013). Impact of Typhoon Morakot on Chlorophyll-a Distribution on the Inner Shelf of the East China Sea. Mar. Ecol. Prog. Ser. 483, 19–29. doi: 10.3354/meps10223
Li X., Zhang X., Fu D., Liao S. (2021b). Strengthening Effect of Super Typhoon Rammasun, (2014) on Upwelling and Cold Eddies in the South China Sea. J. Oceanol. Limnol. 39 (2), 403–419. doi: 10.1007/s00343-020-9239-x
Lü X., Qiao F., Wang G., Xia C., Yuan Y. (2008). Upwelling Off the West Coast of Hainan Island in Summer: Its Detection and Mechanisms. Geophys. Res. Lett. 35 (2), 196–199. doi: 10.1029/2007GL032440
Lu X., Zhou X., Jin G., Chen F., Zhang S., Li Z., et al. (2022). Biological Impact of Typhoon Wipha in the Coastal Area of Western Guangdong: A Comparative Field Observation Perspective. J. Geophys. Res.-biogeo. 127, e2021JG006589. doi: 10.1029/2021JG006589
Mei W., Lien C. C., Lin I. I., Xie S. P. (2015). Tropical Cyclone-Induced Ocean Response: A Comparative Study of the South China Sea and Tropical Northwest Pacifific. J. Clim. 28, 5952–5968. doi: 10.1175/JCLI-D-14-00651.1
Mei W., Xie S. P. (2016). Intensifification of Landfalling Typhoons Over the Northwest Pacific Since the Late 1970s. Nat. Geosci. 9 (10), 753–757. doi: 10.1038/ngeo2792
Mellor G. (2004). User Guide for a Three-Dimensional Primitive Equation, Numerical Ocean Model. Program Atmos. Ocean. Sci. Princeton Univ. 171 (2002), 1. doi: USD349066 S
Miller M. D., Tziperman E. (2017). The Effect of Changes in Surface Winds and Ocean Stratification on Coastal Upwelling and Sea Surface Temperatures in the Pliocene. Paleoceanography 32, 371–383. doi: 10.1002/2016PA002996
Oerder V., Colas F., Echevin V., Codron F., Tam J., Belmadani A. (2015). Peru-Chile Upwelling Dynamicsunder Climate Change. J. Geophys. Res.Oceans. 120, 1152–1172. doi: 10.1002/2014JC010299
Palacios D. M., Hazen E. L., Schroeder I. D., Bograd S. J. (2013). Modeling the Temperature-Nitrate Relationship in the Coastal Upwelling Domain of the California Current. J. Geophys. Res. Oceans. 118, 3223–3239. doi: 10.1002/jgrc.20216
Pan G., Chai F., Tang D., Wang D. (2017). Marine Phytoplankton Biomass Responses to Typhoon Events in the South China Sea Based on Physical-Biogeochemical Model. Ecol. Model. 356, 38–47. doi: 10.1016/j.ecolmodel.2017.04.013
Pauly D., Christensen V. (1995). Primary Production Required to Sustain Global Fisheries. Nature 374, 255–257. doi: 10.1038/374255a0
Pitcher G. C., Figueiras F. G., Hickey B. M., Moita M. T. (2010). The Physical Oceanography of Upwelling Systems and the Development of Harmful Algal Blooms. Prog. Oceanogr. 85, 5–32. doi: 10.1016/j.pocean.2010.02.002
Price J. F. (1981). Upper Ocean Response to a Hurricane. J. Phys. Oceanogr. 11, 153–175. doi: 10.1175/1520-0485(1981)011<0153:UORTAH>2.0.CO;2
Sanford T. B., Price J. F., Girton J. B. (2011). Upper-Ocean Response to Hurricane Frances, (2004) Observed by Profifiling EM-APEX Floats. J. Phys. Oceanogr. 41, 1041–1056. doi: 10.1175/2010JPO4313.1
Shay L. K. (2010). “Air-Sea Interactions in Tropical Cyclones,” in Global Perspectives on Tropical Cyclones. Eds. Chan J. C. L., Kepert J. D. ( World Scientific Publishing), Singapore, 93–131. doi: 10.1142/9789814293488_0003
Siswanto E., Ishizaka J., Yokouchi K., Tanaka K., Tan C. K. (2007). Estimation of Interannual and Interdecadal Variations of Typhoon-Induced Primary Production: A Case Study for the Outer Shelf of the East China Sea. Geophys. Res. Lett. 34, 73–87. doi: 10.1029/2006gl028368
Sun J., Oey L., Wang R., Xu F., Huang S. (2015). Ocean Response to Typhoon Nuri, (2008) in Western Pacific and South China Sea. Ocean dynam. 65, 735–749. doi: 10.1007/s10236-015-0823-0
Sun L., Yang Y. J., Xian T., Lu Z. M., Fu Y. F. (2010). Strong Enhancement of Chlorophyll a Concentration by a Weak Typhoon. Mar. Ecol. Prog. Ser. 404, 39–50. doi: 10.3354/meps08477
Su J., Pohlmann T. (2009). Wind and Topography Influence on an Upwelling System at the Eastern Hainan Coast. J. Geophys. Res. Oceans. 114 (C6), C06017. doi: 10.1029/2008JC005018
Su J., Wang J., Pohlmann T., Xu D. (2011). The Influence of Meteorological Variation on the Upwelling System Off Eastern Hainan During Summer 2007-2008. Ocean Dynam. 61 (6), 717–730. doi: 10.1007/s10236-011-0404-9
Su J., Xu M., Pohlmann T., Xu D., Wang D. (2013). A Western Boundary Upwelling System Response to Recent Climate Variation, (1960- 2006). Cont. Shelf Res. 57, 3–9. doi: 10.1016/j.csr.2012.05.010
Walsh K. J. E., McBride J. L., Klotzbach P. J., Balachandran S., Camargo S. J., Holland G., et al. (2016). Tropical Cyclones and Climate Change. WIRES: Clim. Change 7 (1), 65–89. doi: 10.1002/wcc.371
Wang D., Hong Bo, Gan J., Xu H. (2010). Numerical Investigation on Propulsion of the Counter-Wind Current in the Northern South China Sea in Winter. Deep-Sea. Res. Pt. I: Oceanographic. Res. Papers. 57. 10 (2010), 1206–1221. doi: 10.1016/j.dsr.2010.06.007
Wang D., Shu Y., Xue H., Hu J., Chen J., Zhuang W., et al. (2014). Relative Contributions of Local Wind and Topography to the Coastal Upwelling Intensity in the Northern South China Sea. J. Geophys. Res. Oceans. 119 (4), 2550–2567. doi: 10.1002/2013JC009172
Wang D., Wang H., Li M., Liu G., Wu X. (2013). Role of Ekman Transport Versus Ekman Pumping in Driving Summer Upwelling in the South China Sea. J. Ocean Univ. China 12 (3), 355–365. doi: 10.1007/s11802-013-1904-7
Webster P., Holland G., Curry J., Chang H. (2005). Changes in Tropical Cyclone Number, Duration, and Intensity in a Warming Environment. Science 309, 1844–1846. doi: 10.1126/science.1116448
Xie L., He C., Li M., Tian J., Jing Z. (2017). Response of Sea Surface Temperature to Typhoon Passages Over the Upwelling Zone East of Hainan Island. Adv. Mar. Sci. 35 (1), 8–19. doi: 10.3969/j.issn.1671-6647.2017.01.002
Xie L., Zong X., Yi X., Li M. (2016). The Interannual Variation and Long-Term Trend of Qiongdong Upwelling. Chin. J. Oceanology. Limnology. 47 (1), 43–51. doi: 10.11693/hyhz20150300069
Xu J., Cai S., Xuan L., Qiu Y., Zhu D. (2013). Study on Coastal Upwelling in Eastern Hainan Island and Western Guangdong in Summer 2006. Acta Oceanologica. Sin. (in Chinese) 35 (4), 11–18. doi: 10.3969/j.issn.0253-4193.2013.04.002
Yin W., Huang D. (2019). Short-Term Variations in the Surface Upwelling Off Northeastern Taiwan Observed via Satellite Data. J. Geophys. Res. Oceans. 124 (2), 939–954. doi: 10.1029/2018JC014537
Zhang S., Xie L., Hou Y. (2014). Tropical Storm-Induced Turbulent Mixing and Chlorophyll-A Enhancement in the Continental Shelf Southeast of Hainan Island. J. Mar. Syst. 129 (2), 405–414. doi: 10.1016/j.jmarsys.2013.09.002
Zhang Z., Xu H., Vetter P. A., Xie Q., Xie X., Song W., et al. (2021). High-Frequency Motions in the Southeastern South China Sea During Winter–Spring 2018/2019. Front. Mar. Sci. 8. doi: 10.3389/fmars.2021.681993
Zhao H., Shao J., Han G., Yang D., Lv J. (2015). Influence of Typhoon Matsa on Phytoplankton Chlorophyll-A Off East China. PLoS One 10 (9), e0137863. doi: 10.1371/journal.pone.0137863
Zhao H., Tang D., Wang Y. (2008). Comparison of Phytoplankton Blooms Triggered by Two Typhoons With Different Intensities and Translation Speeds in the South China Sea. Mar. Ecol. Prog. Ser. 365, 57–65. doi: 10.3354/meps07488
Zheng Q., Zhu B., Li J., Sun Z., Xu Y., Hu J. (2015). Growth and Dissipation of Typhoon Forced Solitary Continental Shelf Waves in the Northern South China Sea. Clim. Dynam. 45 (3), 853–865. doi: 10.1007/s00382-014-2318-y
Keywords: coastal upwelling, typhoon Rammasun, Chl-a, SST, NIWs, the eastern Hainan Island
Citation: Hong B, Huang X, Liu S and Xu H (2022) Impact of Typhoon on Coastal Upwelling Off The Eastern Hainan Island: A Case Study of Typhoon Rammasun (2014). Front. Mar. Sci. 9:920825. doi: 10.3389/fmars.2022.920825
Received: 15 April 2022; Accepted: 20 June 2022;
Published: 22 July 2022.
Edited by:
Zhiqiang Liu, Southern University of Science and Technology, ChinaCopyright © 2022 Hong, Huang, Liu and Xu. This is an open-access article distributed under the terms of the Creative Commons Attribution License (CC BY). The use, distribution or reproduction in other forums is permitted, provided the original author(s) and the copyright owner(s) are credited and that the original publication in this journal is cited, in accordance with accepted academic practice. No use, distribution or reproduction is permitted which does not comply with these terms.
*Correspondence: Hongzhou Xu, aHp4dUBpZHNzZS5hYy5jbg==
Disclaimer: All claims expressed in this article are solely those of the authors and do not necessarily represent those of their affiliated organizations, or those of the publisher, the editors and the reviewers. Any product that may be evaluated in this article or claim that may be made by its manufacturer is not guaranteed or endorsed by the publisher.
Research integrity at Frontiers
Learn more about the work of our research integrity team to safeguard the quality of each article we publish.