 Tomas Araya-Schmidt
 Shannon M. Bayse
 Paul D. Winger
94% of researchers rate our articles as excellent or good
Learn more about the work of our research integrity team to safeguard the quality of each article we publish.
Find out more
ORIGINAL RESEARCH article
Front. Mar. Sci., 23 September 2022
Sec. Marine Fisheries, Aquaculture and Living Resources
Volume 9 - 2022 | https://doi.org/10.3389/fmars.2022.920429
This article is part of the Research TopicInnovations in Fishing Technology Aimed at Achieving Sustainable FishingView all 23 articles
A recent rebound of juvenile redfish (Sebastes spp.) in areas where the northern shrimp (Pandalus borealis) bottom trawl fishery in eastern Canada occurs has been challenging the fishing industry to maintain bycatch of this species within acceptable levels. Using self-contained underwater cameras and red lights, this study investigated the behavior of juvenile redfish in response to bycatch reduction devices (BRDs), called Nordmøre grids. Fish behavior was analyzed in grid systems with different bar spacings, including 22- and 19-mm bar spacings. A total of 10.3 h of useable underwater video was collected during commercial fishing conditions, which yielded individual observations of 931 redfish. Generalized linear models (GLMs) and behavioral trees were used to analyze the data. We observed that 52.5% of all redfish passed through the bar spacings and were retained. The duration of the selection process was relatively short (~1.9 s mean), and 57.8% of redfish reacted to the grids by swimming upwards, forward, or towards with respect to the grids. Behaviors exhibited by redfish and redfish retention were similar for both grids. GLM results suggested that as time in front of the grid increased and redfish had upwards or steady grid reactions, retention was drastically reduced. These were important variables that significantly explained the capture fate of redfish. The behavioral sequence that led to higher escape probability was redfish that approached upwards, had no contact with the grid, and reacted to the grid by continuing to move upwards to finally exit through the escape opening. GLM and behavioral trees gave a comprehensive view of redfish behavior, which is extremely useful for perfecting or developing any BRD to address juvenile redfish bycatch.
Nordmøre grids are employed in shrimp bottom trawls to mechanically separate and retain the targeted shrimp from larger animals, such as roundfish, flatfish, and skates (Isaksen et al., 1992). However, relatively small juvenile fish of a similar size as the targeted shrimp can pass through the Nordmøre grid bar spacings, transit to the small mesh codend, and are caught. This can result in considerable amounts of bycatch of commercially important species (Bayse and He, 2017; Pérez Roda et al., 2019). Despite extensive efforts made around the world to reduce bycatch in shrimp fisheries (Broadhurst, 2000; Eayrs, 2007), the incidental catch of juvenile fish persists.
In the 1990s, the Nordmøre grid was introduced in Canada’s east coast northern shrimp (Pandalus borealis) fishery; mandatory maximum bar spacings of 22 and 28 mm are permitted (DFO, 2018), although the majority of the fishing effort uses a 22-mm bar spacing grid. The introduction of Nordmøre grids greatly reduced finfish bycatch from 15% to 2% (>85% reduction by weight) of the total landings of shrimp (ICES, 1998). However, the beaked redfish (Sebastes mentella), Acadian redfish (Sebastes fasciatus), and golden redfish (Sebastes marinus) recruitment index (i.e., the abundance of redfish, with total length (TL)<150 mm) has increased considerably in recent years (DFO, 2020), and their exclusion is problematic at the regulated bar spacings due to their small size (i.e., juveniles). Once juvenile redfish pass through the Nordmøre grid, there is a small chance of escape, as bottom trawls in this fishery are constructed with diamond mesh sizes as small as 40 mm (minimum mesh size authorized) in order to retain small shrimp (DFO, 2018). This can lead to considerable amounts of juvenile redfish being caught depending on their abundance in the fishing area.
The beaked redfish and Acadian redfish are commercially important species off the northeast coast of Canada, while golden redfish are much less abundant (Government of Canada, 2021). They are found along the Northeast Newfoundland and Labrador Shelves (DFO, 2020), and high bycatch rates were reported in 2020 in portions of Davis Strait West and shrimp fishing area (SFA) 4 (DFO, 2021). The directed redfish fishery is currently closed, and it has been under a moratorium since 1997 (DFO, 2021). Both beaked and Acadian redfish were considered threatened under the Committee on the Status of Endangered Wildlife in Canada (COSEWIC) in 2010 and are currently being considered for Schedule 1 classification (Government of Canada, 2021); once in Schedule 1, measures to protect and recover redfish will be implemented. Their slow growth rates, long-lived nature (Campana et al., 1990), and late maturity (Sévigny et al., 2007) make mortality of juvenile redfish of concern, and their incidental catch could have a negative impact on the stock’s recruitment, biomass, recovery, and the future of an emerging redfish fishery. Furthermore, the mortality of juvenile redfish can have an impact on the trophic structures of communities, affecting other important commercial fisheries (Dayton et al., 1995; Devine and Haedrich, 2011).
According to recent conditions of the license, a move-away protocol is triggered, and the vessel must change the fishing area by a minimum of 10 nautical miles from the previous tow if the incidental catch of groundfish exceeds 2.5% by weight of the total catch of shrimp or 100 kg in total weight (DFO, 2018). The movement protocol has unintended negative effects, such as increasing operational costs (e.g., fuel consumption) and environmental impacts (e.g., seabed impact and carbon dioxide emissions). Increased amounts of juvenile redfish bycatch in the catch represent a sorting problem in onboard factories and can physically damage shrimp, reducing the quality and value of the final product.
The performance in terms of catch amount, species, and size selectivity of bycatch reduction devices (BRDs) is assessed based on catch data following robust experimental methodologies and statistical analyses (Wileman et al., 1996). Previous experiments on grid bar spacings (Hickey et al., 1993; CAFID, 1997; He and Balzano, 2012; Silva et al., 2012; Orr, 2018), new grid designs (Grimaldo and Larsen, 2005; Grimaldo, 2006; He and Balzano, 2007; He and Balzano, 2011; He and Balzano, 2013; Veiga-Malta et al., 2020), and sorting grid configurations (Riedel and DeAlteris, 1995; Larsen et al., 2018a; Larsen et al., 2018b) have used these procedures and often provide conclusive results on the catch performance. However, the specifics of how the species in question react to the device are usually unknown.
The increased availability of low-cost and high-quality image underwater cameras in recent years (Madsen et al., 2021) has enabled fishing gear technologists to qualitatively assess fish behavior with the aim of understanding the mechanics behind selection processes (Queirolo et al., 2010; Grimaldo et al., 2018; Larsen et al., 2018c). Even further, many studies have quantitatively analyzed the data gathered from underwater video to assess the selective device or fishing gear performance and species behavior (Bayse et al., 2014; Underwood et al., 2015; Bayse et al., 2016; Queirolo et al., 2019; Santos et al., 2020; Ahumada el al., 2021; Araya-Schmidt et al., 2021; Chladek et al., 2021a; Chladek et al., 2021b). The observed fish behaviors are usually tracked from the first detection to the final outcome of the selection process and categorized in stages. Generalized linear models (Underwood et al., 2015; Bayse et al., 2016) and behavioral trees (Santos et al., 2020; Chladek et al., 2021a; Chladek et al., 2021b) have been used to analyze the observed behaviors and relate them to capture fate. Regression models relate capture fate to all the explanatory variables at once, whereas behavioral trees relate capture fate to the sequences of behaviors throughout the selection process.
Despite juvenile redfish bycatch being an issue in many shrimp trawl fisheries (Broadhurst, 2000; Larsen et al., 2019; Cerbule et al., 2021), there is limited redfish behavioral information in bottom trawls. Larsen et al. (2019) observed that most juvenile redfish come in physical contact with 30° and 45° angle grids, sliding up the grid face until the fish orientate themselves correctly towards the grid and pass through the bar spacings. However, there is evidence that redfish can actively seek outlets by swimming upwards, escaping panel meshes after a sorting grid section (Sistiaga et al., 2017), and that they can also exit sieve panels through the upper escape opening (Larsen et al., 2018c).
The purpose of this study was to investigate the behavior of juvenile redfish in 22- and 19-mm bar spacing Nordmøre grid systems to better understand which behavioral sequences lead to redfish escape and the effects of redfish behavior for different Nordmøre grid bar spacings. The behavioral data were quantitatively assessed using both a generalized linear model (GLM) and a behavioral tree approach. The advantages and disadvantages of both methods are discussed and contrasted.
Two Cosmos 3000 commercial shrimp bottom trawls were used in this study. Each had a 65.4-m headline, 70.1-m fishing line, and 70.1-m roller footgear. The trawls had a four-panel design and were each equipped with a trouser codend with a 40-mm nominal diamond mesh size. These codends were selective for the size range of juvenile redfish (<150-mm TL). The baseline and experimental trawls were identical, except for the Nordmøre grid bar spacing. The baseline bottom trawl was equipped with a 22-mm (mean 21.74 mm, standard error 0.07 mm) bar spacing Nordmøre grid, while the experimental bottom trawl was equipped with a 19-mm (mean 18.83 mm, standard error 0.08 mm) bar spacing Nordmøre grid. The grids were 2.0 m long and 1.0 m wide. Grids were designed to have angles of attack between 53° and 55° at the beginning of the tows. The guiding panel netting had a length of 5 m and was installed at an angle of −15° with respect to the upper panel netting. The guiding panel used a bungee cord weaved through the meshes and attached to each side of the grid 0.72 m from the grid bottom. The netting extended approximately 30 cm beyond the bungee cord and was laid flat against the grid surface during flume tank testing (Figure 1). The vessel uses this guiding panel configuration in order to maximize shrimp contact with the grid.
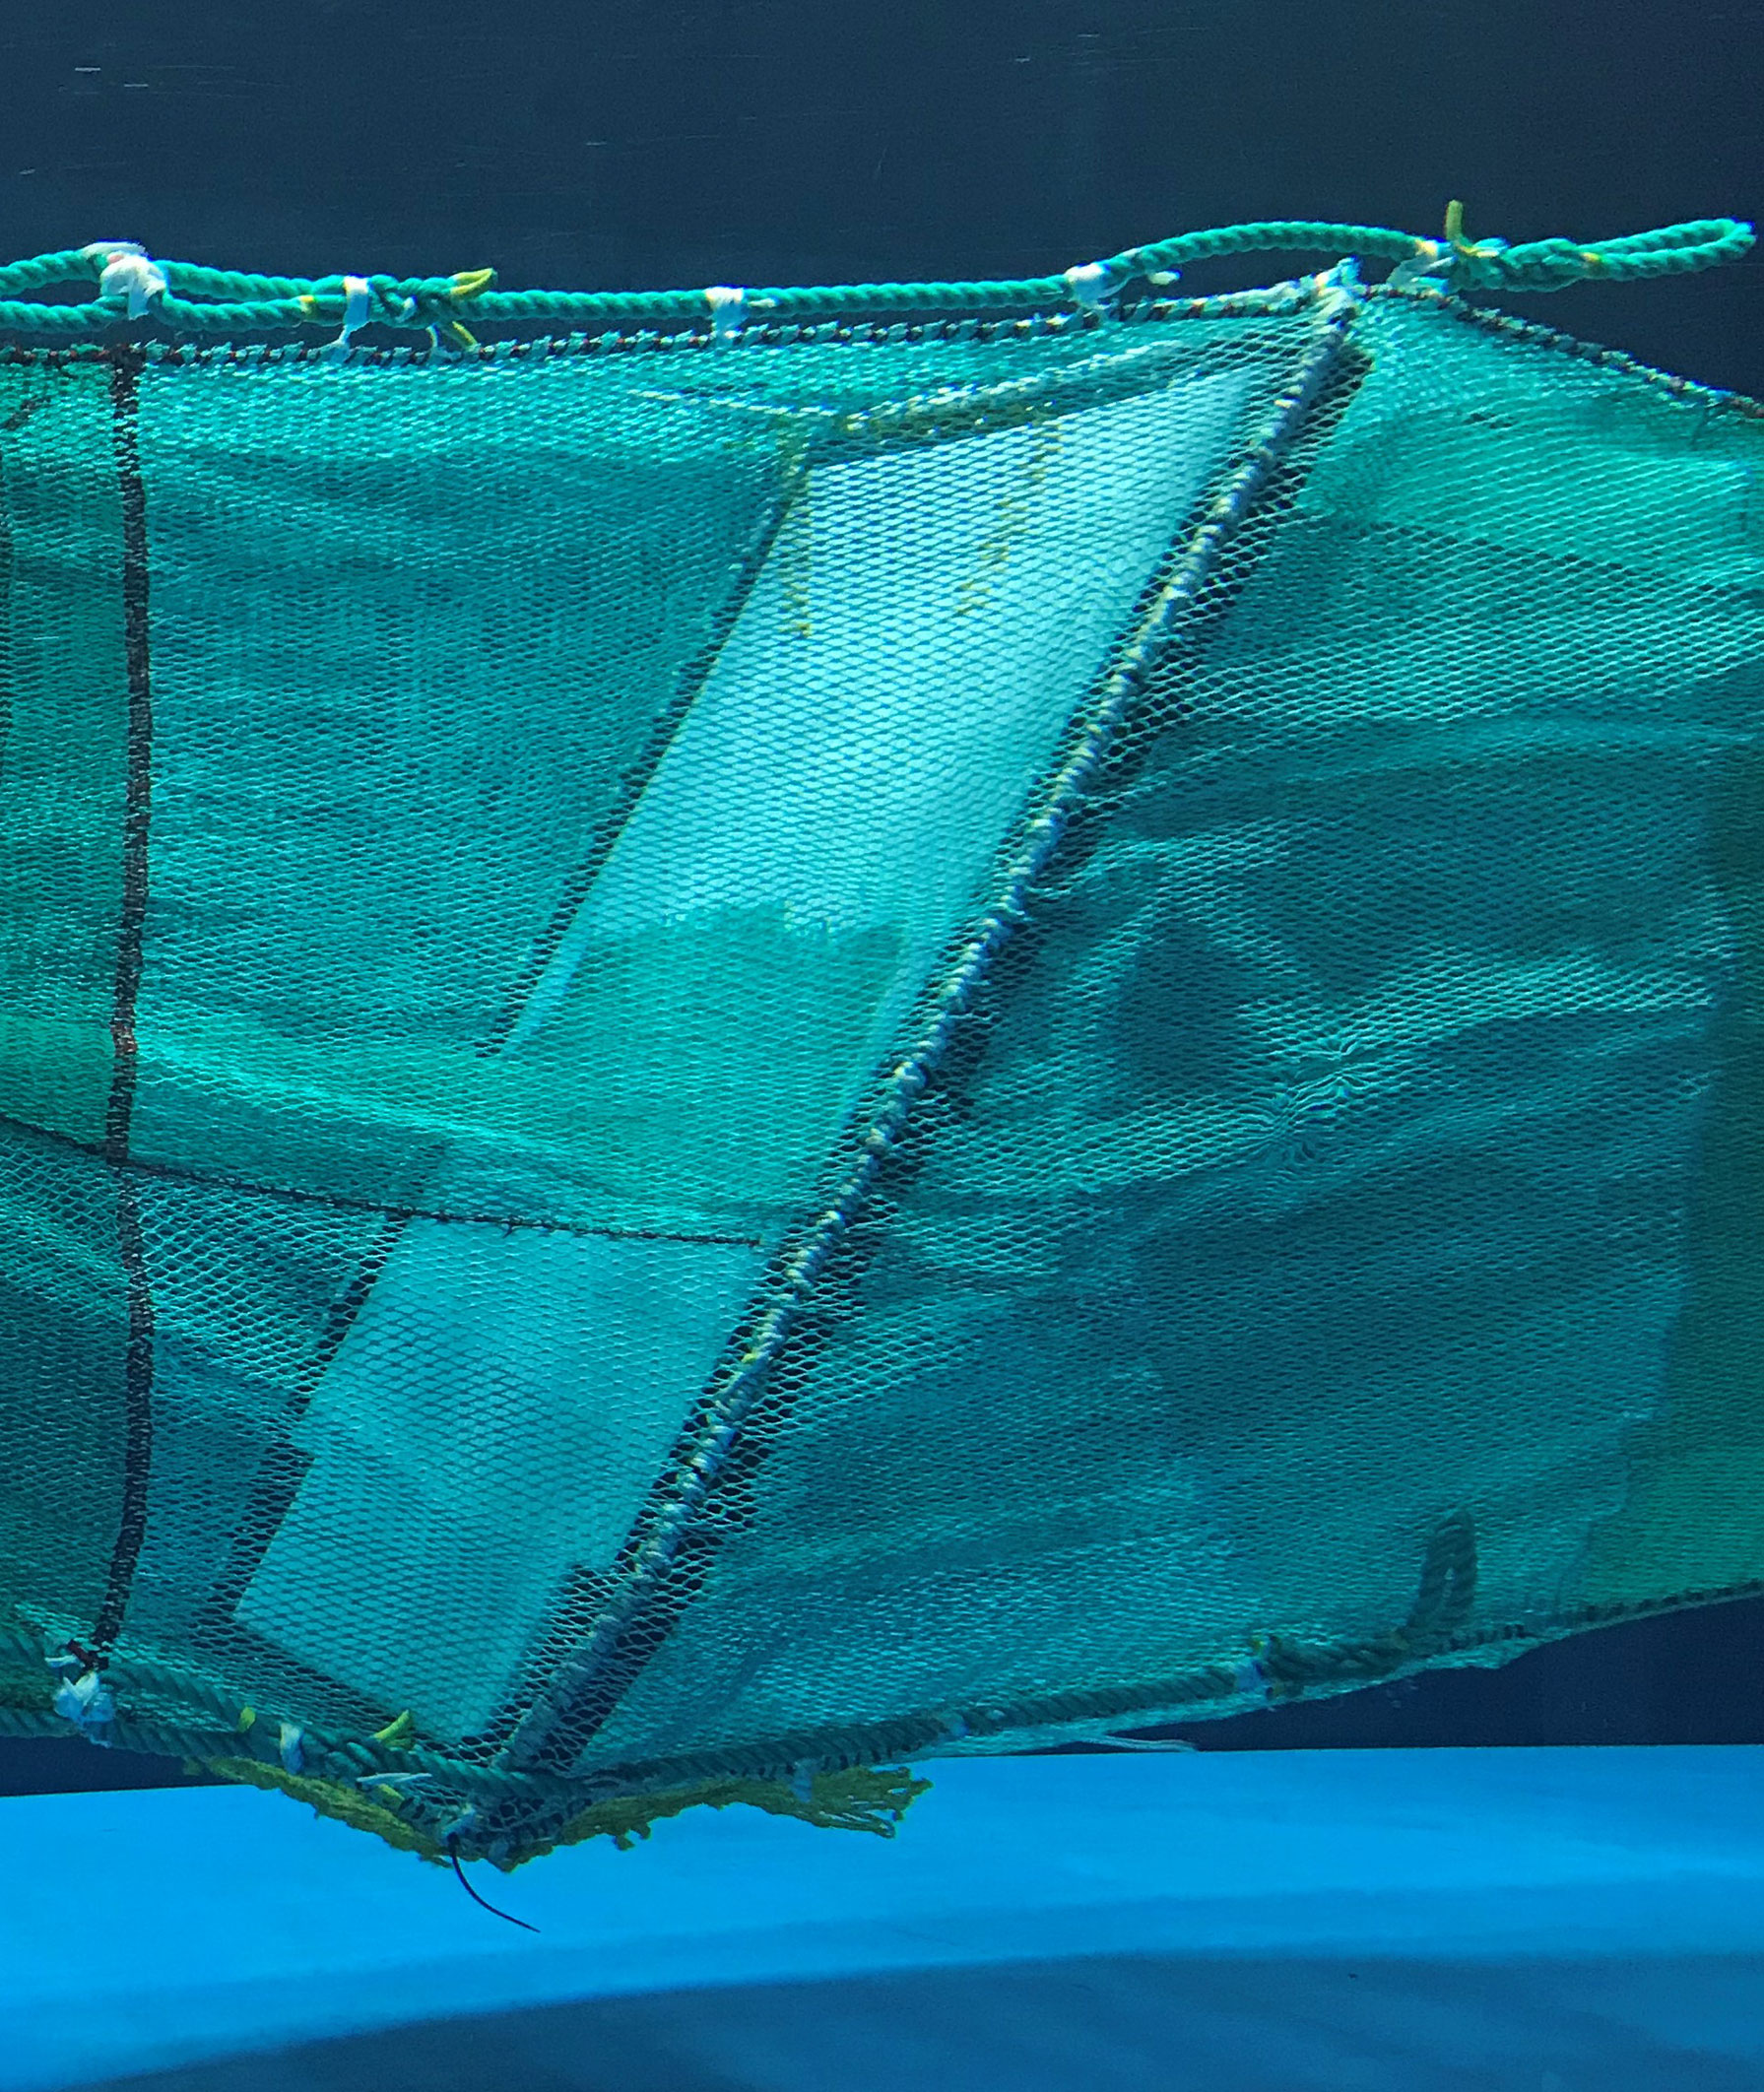
Figure 1 Close-up view of the 19-mm Nordmøre grid system used in the experiment.
Hydrodynamic testing of the full-scale grid systems was conducted prior to sea trials using the flume tank (Figure 2) located in St. John’s, NL, Canada (Winger et al., 2006). For the flume tank testing, a 40-mm mesh size codend section of 4.0 m length was attached to the grid systems (Figure 2). This codend section was significantly smaller and lighter than the extension and trouser codend used by the vessel during commercial fishing, which not only had the added weight of the catch but also the extra netting, including chafer gear. During flume tank testing, flow velocity was set to 0.85 m/s and grid angles were measured for quality control, recorded as 62° and 63° for the 22- and 19-mm grids, respectively. Flow velocity (m/s) was measured along two vertical axes: 1) in front of the grid, at four equidistant points between the front-end of the escape opening (i.e., opening apex) and the guiding panel (F1, F2, F3, and F4), and 2) 0.6 m behind the top of the Nordmøre grids, at five equidistant points between the upper and lower panels (B1, B2, B3, B4, and B5) (Figure 2). Clearance from the netting for points F1 and F4 was 0.27 m, and clearance from the netting was 0.38 m for B1 and B5 points to avoid the upper or lower netting effect on water velocity. Measurements were performed using a two-axis electromagnetic current meter (Valeport Model 802, Valeport, St Peter’s Quay, Totnes, UK). At each point, water velocity measurements were collected for 1 min (96 Hz) and averaged. See Cheng et al. (2022) for a further methodical description.
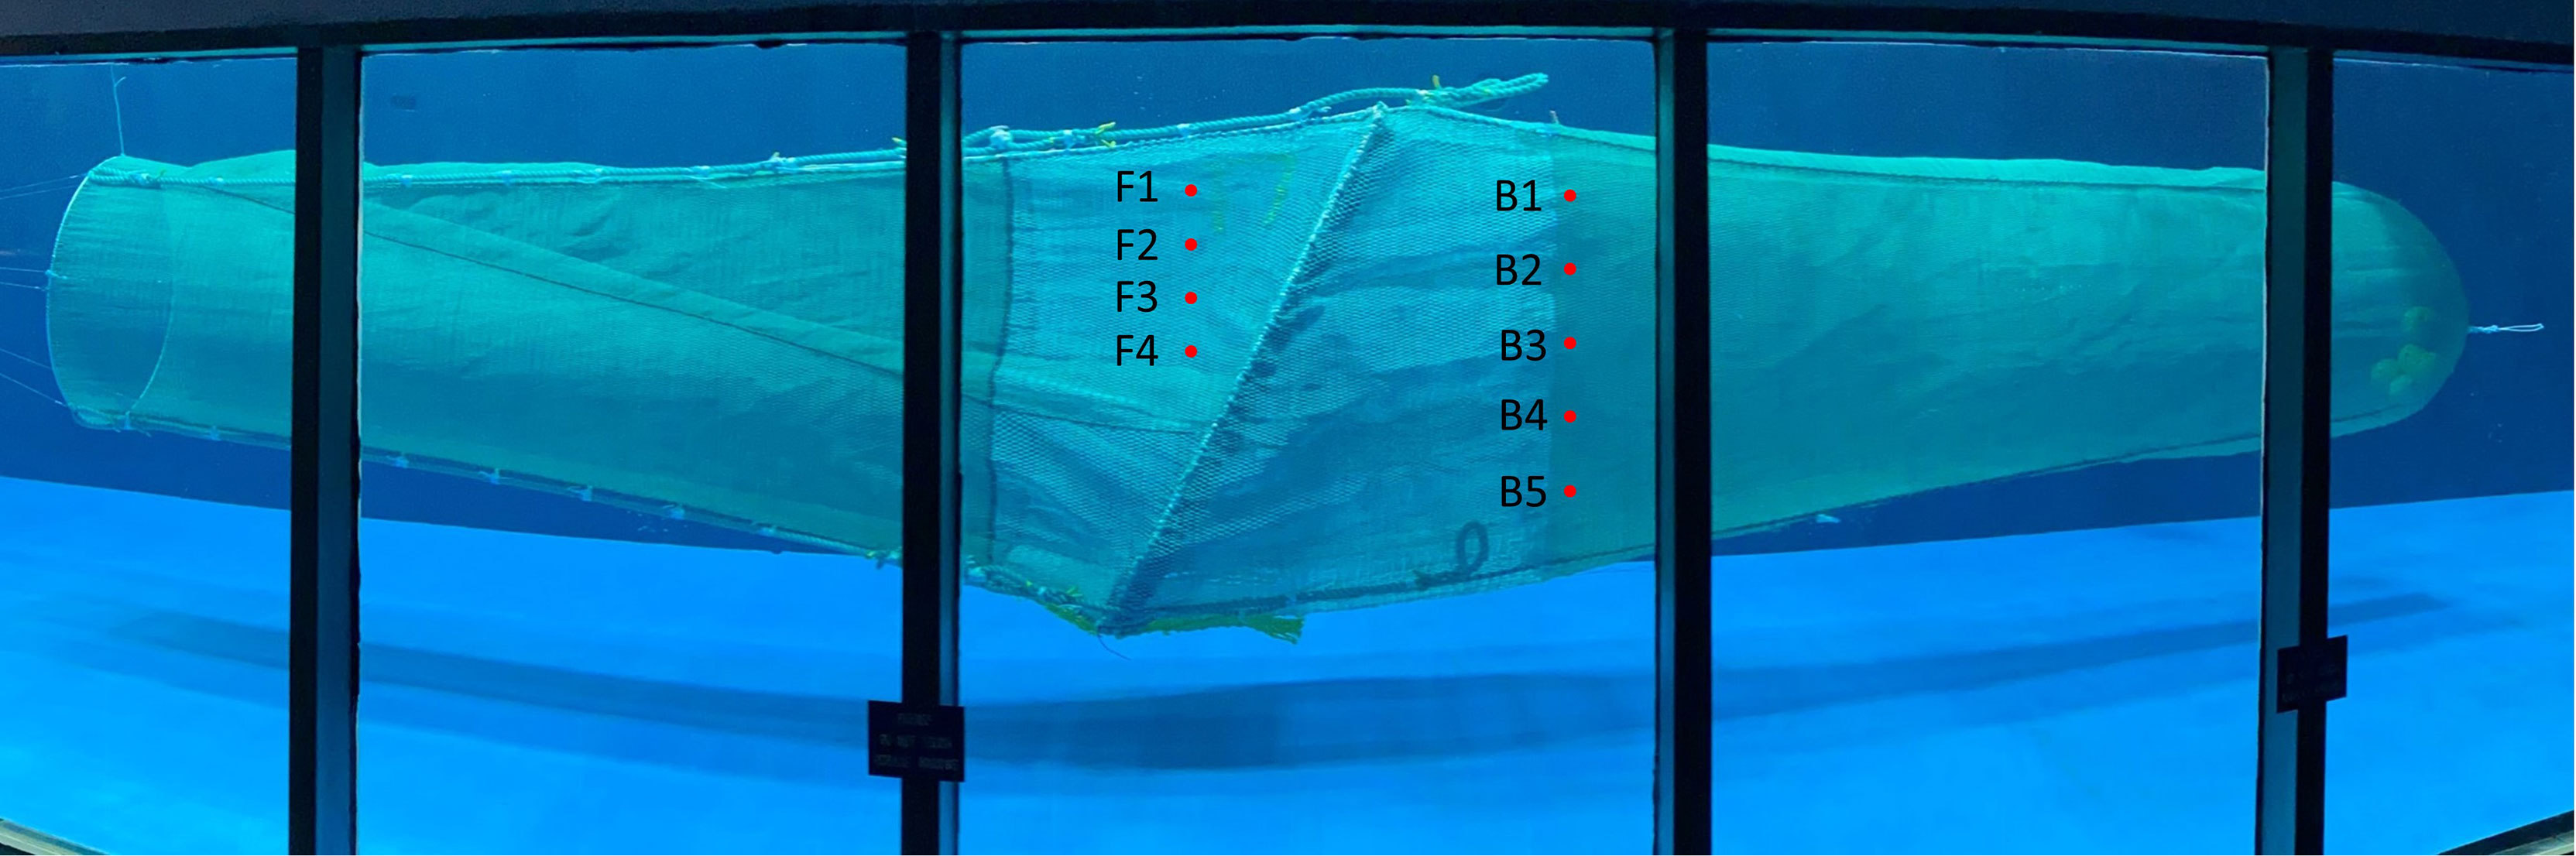
Figure 2 Baseline 22-mm bar spacing Nordmøre grid section during flume tank testing. Points for flow measurements in front (F1, F2, F3, and F4) and behind (B1, B2, B3, B4, and B5) the grid during hydrodynamic testing are shown.
Video recordings were collected on board the commercial factory freezer trawler Newfoundland Lynx (length 67.7 m, width 13.0 m, gross tonnage 2409) during 19 January and 13 February 2021 (winter season), in the offshore SFAs 4, 5, and 6, located off the coast of eastern Canada. However, valid tows used in the analysis were all from SFA 4 (Table 1). Towing speed was 1.49 m/s, which is the standard speed used by the fishing vessel.

Table 1 Information on the video recorded tows used in the video analysis.
The camera system was attached to the top of the Nordmøre grid and consisted of a GoPro Hero4 black action camera, with a GoPro “Bacpac” battery and an external battery (4,000 mAh, 3.7 V) (Figure 3). Two DIV08W diving lights from Brinyte Technology Ltd. were used to illuminate the camera’s field of view. They were located on either side (0.15 m) of the camera. These red lights had a maximum irradiance of 202 mW at 634 nm, and the wavelength range at full width at half maximum (FWHM) was 620–643 nm. The peak wavelength is in the lower spectrum range of red light, and the total wavelength range of the light extends into the orange part of the visible light spectrum. Red lights were used, as studies have shown that they are less visible to deep-water fish and crustaceans due to their longer wavelengths (Widder et al., 2005; Rooper et al., 2015; Nguyen et al., 2017). Underwater housings from CamDo Solutions Inc. and Group B Distribution Inc. were used (certified to a depth of 1,500 m) for the camera and lights, respectively (Figure 3). The camera was attached in a way that the field of view started 0.1 m below the top of the grid, extending to each side of the grid at an angle up to a height of 1.3 m from the bottom of the grid. This resulted in blind spots on each side of the camera on the upper section of the grid that accounted for ~15% of the grid surface area. The camera field of view reached the bottom of the grid, and ~0.5 m of the netting of the lower panel in front of the grid can be seen in the video recordings.
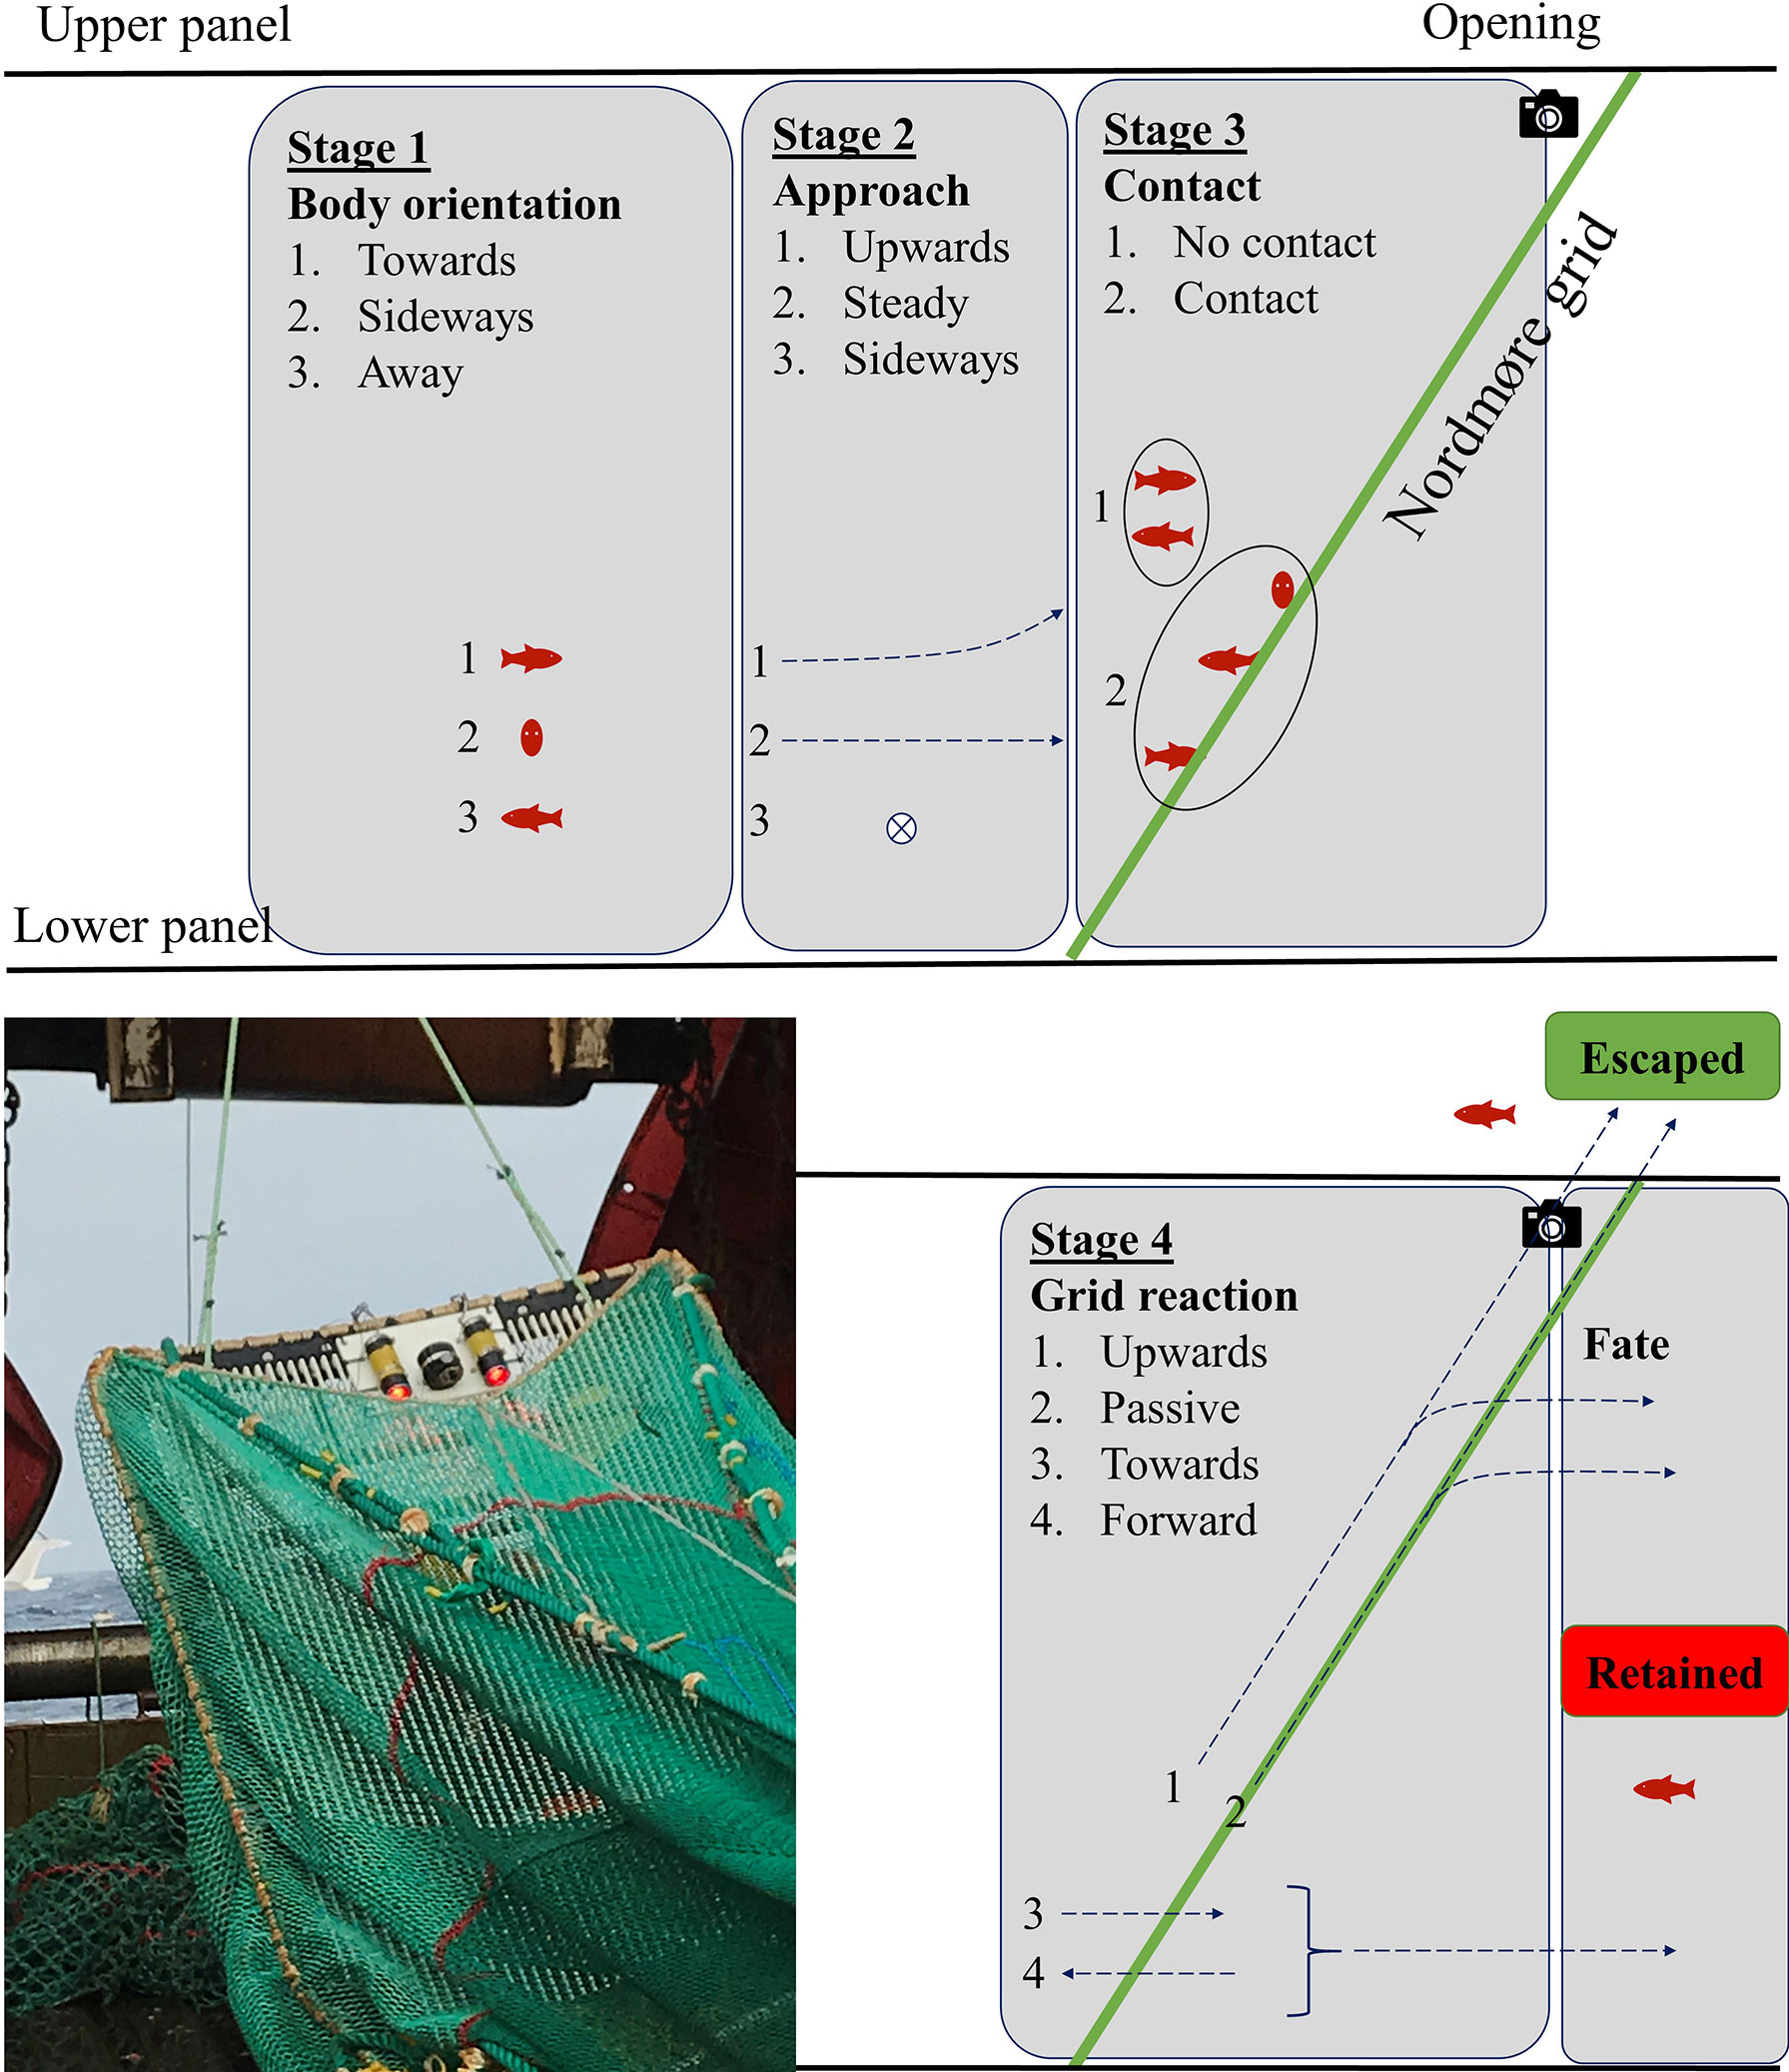
Figure 3 Juvenile redfish behavioral stages in a Nordmøre grid system. The guiding panel was removed from the image for figure readability. An image of the GoPro camera with two Brinyte DIV08W diving torches emitting red light on each side mounted on the 19-mm Nordmøre grid during sea trials is shown.
Information on the video-recorded tows was collected during the fishing trip, including fishing area (SFA), tow duration, time of the day, depth, bottom temperature, starting grid angle, and bar spacings used on the Nordmøre grids. Total shrimp catch was estimated from the total shrimp produced at the factory during each tow, and the total redfish bycatch was collected and weighed for tows 1 and 2 and provided by the at-sea observer for tows 3 and 4 (Table 1).
Behaviors of individual redfish were evaluated at the Nordmøre grid section of the experimental and baseline bottom trawls (i.e., 19- and 22-mm Nordmøre grid bar spacings). Behaviors were recorded within four behavioral stages—1) body orientation, 2) approach, 3) grid contact, and 4) grid reaction—which led to redfish fate (Figure 3). These included the moment the redfish entered the camera field of view, below the guiding panel, up to when the individuals were either retained (i.e., transited to the codend through the Nordmøre grid bars) or escaped through the opening on the upper panel of the grid section (Figure 3). Upon entry of the redfish to the field of view, body orientation was recorded as “towards”, “sideways”, or “away” with respect to the fish’s head orientation in relation to the grid. After entry, the path followed by the fish approaching the grid was recorded; fish were considered to move “upwards”, remain “steady”, or move “sideways” (i.e., port or starboard). Following the approach stage, fish had either “contact” or “no contact” with the Nordmøre grid. Fish that did not contact the grid all moved up towards the escape opening and were considered to have a grid reaction “upwards”; fish that contacted the grid reacted by moving “upwards”, remaining “passive”, moving “towards” the grid (i.e., through the bars), or swimming “forward” in the opposite direction from the grid. Finally, redfish that were positioned on the front side of the grid (towards the vessel) and moved up past the camera field of view were considered “escaped” and exited the grid section through the escape opening; fish that transited to the codend through the grid bars were considered “retained”. The total time elapsed (t) from the redfish’s first detection (i.e., stage 1) to fate was recorded for each individual. Behavioural data were recorded from underwater video using the BORIS software (Friard and Gamba, 2016). The observed probability of redfish escape (%) was calculated for each behavior independently and bootstrapped 1,000 times to obtain 95% percentile confidence intervals (CIs) using the mosaic package in R (Pruim et al., 2017).
A GLM with a binomial error was performed using the lme4 package (Bates et al., 2015). All statistical analyses were performed in R (R Development Core Team, 2017). Redfish fate was the dependent variable (i.e., escaped or retained). Explanatory variables, when appropriate, included “grid type”, “body orientation”, “approach”, “grid contact”, “grid reaction”, “time”, and “haul number”. Model selection was based on the model with the lowest correction to Akaike’s information criterion (AICc) (Akaike, 1974), using the function AICctab in the bbmle package (Bolker and R Development Core Team, 2020). Model fit was assessed with a combination of a quantile–quantile plot, residual investigation, and dispersion test in the DHARMa: residual diagnostics for hierarchical (multi-level/mixed) regression models package (Hartig, 2021).
Following Santos et al. (2020) procedures, the behaviors observed at each stage describe a specific behavioral sequence that could explain the fate of the observed redfish (i.e., escaped or retained). The behaviors collected for each fish at the different behavioral stages were pooled within and between hauls separately for each grid type (i.e., 22- and 19-mm bar spacing Nordmøre grids). The data for each grid were arranged in behavioral trees using data.tree (Glur, 2018) and DiagrammeR (Iannone, 2019) packages. The root represents the total number of redfish observed, which is connected to the nodes counting the number of times a specific behavior occurred. The nodes were organized into four levels following the four behavioral stages, which were connected by the tree branches following the observed behavioral sequences. Finally, the tree leaves at the bottom contain the number of redfish that after following a specific behavioral sequence were retained or escaped (i.e., fate).
Marginal and conditional probabilities were calculated for each of the behavioral trees generated (Santos et al., 2020). Marginal probability (MP) was calculated as follows:
where MPz,j is the marginal probability for a given behavioral event j from behavioral stage z to happen. Nz,j is the node representing the total number of redfish that had a behaviour j in behavioral stage z, while Root is the total number of redfish observed for each Nordmøre grid.
Conditional probability (CP) was calculated as follows:
where CPB,j is the conditional probability that event j from behavioral stage B∈{2,3,4,5} could happen, given that the parent attribute k from behavioral stage B−1 happened.
The rate of observed redfish that escaped at the 22- and 19-mm Nordmøre grid systems was calculated as follows:
where n escaped is the number of redfish that escaped and n retained is the number of redfish retained.
Finally, 95% Efron confidence intervals (95% CIs) (Efron, 1982) were estimated for MP, CP, rate of redfish escaped, and t = time using a double-bootstrap technique (Santos et al., 2020), which produced a total of 1,000 artificial trees.
Mean water velocity recorded during flume tank testing ranged between 0.40 and 0.70 m/s in front of the 19-mm grid and between 0.38 and 0.68 m/s for the 22-mm grid. On average, water velocity was increased by 6.28% in front of the grid, as bar spacings were reduced to 19 mm. For water velocity measurements behind the grid, mean values ranged between 0.48 and 0.60 m/s, and between 0.48 and 0.71 m/s for the 19- and 22-mm grids, respectively. On average, water velocity was reduced by 6.36% behind the grid when bar spacing was reduced to 19 mm (Table 2).
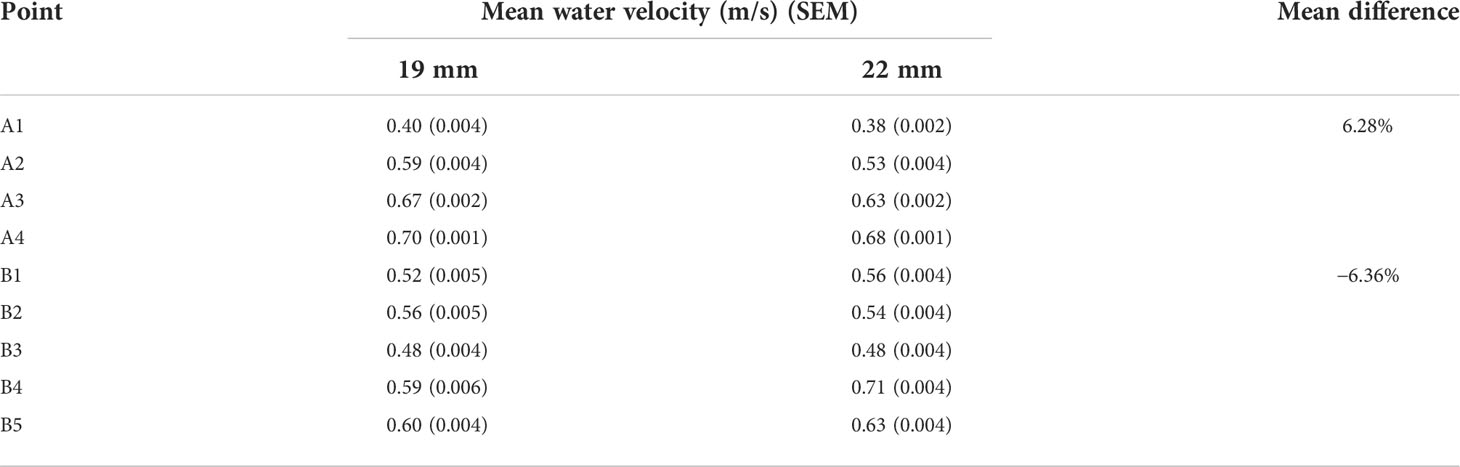
Table 2 Mean water velocity (m/s) and standard error of the mean (SEM) for the different points of measurement, and total mean water velocity difference between grids in front and behind the grids.
During sea trials, grid angles at the beginning of the tows ranged between 53° and 55° and were lower than measured in the flume tank due to the added weight of the full-size codend. The grid systems experienced an increase in the guiding panel exit opening at the beginning of each tow as shrimp, flatfish, and redfish meshed and accumulated in the guiding panel meshes (Figure 4). As the guiding panel opened, the area where fish and shrimps meshed in the netting was no longer seen in the video (i.e., outside the camera’s field of view) (Figure 4, panel #3). The guiding panel extension beyond the bungee cord was in the field of view, but no longer in contact with the grid due to the guiding panel exit opening and because it was being pushed upwards by the water flows directed towards the escape opening (Figure 4, panel #3).
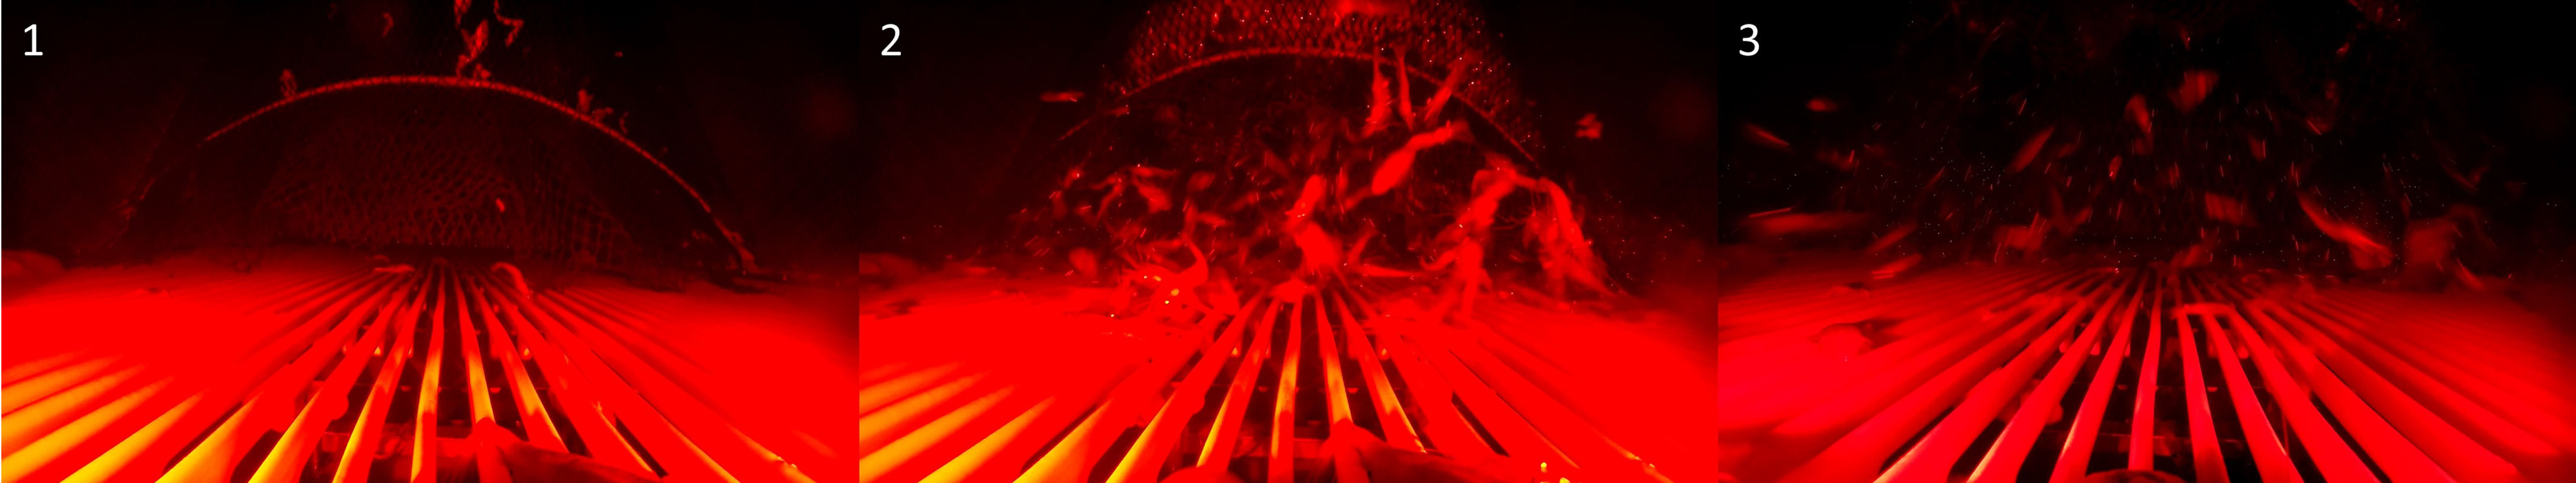
Figure 4 Underwater video screenshots of the 19-mm bar spacing Nordmøre grid during fishing. (1) The guiding panel exit opening on its starting position at the beginning of the tow. (2) Two minutes has elapsed since shrimp and fish reached the grid section, where shrimp and fish are seen meshed in the guiding panel netting. (3) The guiding panel exit has fully opened and remained in this position until the end of the tow.
Redfish behavior was obtained after the guiding panel exit opened for each tow as it remained in this position for the rest of the fishing time (Figure 4, panel #3). Within each tow, some events prevented us from assessing redfish behavior, such as fish in front of the camera blocking the field of view, turbidity, and large amounts of shrimp. In all of these cases, the video was discarded for those periods. The relatively short periods (<10 s) from the redfish’s first detection (i.e., body orientation) to fate prevented any concern of not being able to follow individual redfish throughout all the behavioral stages and fate. Six tows were recorded during the fishing trip with a total fishing time of 16.2 h. The first two tows were discarded due to high turbidity conditions that did not allow us to observe redfish behavior properly. The remainder of the tows were used to assess redfish behavior; two tows used the 22-mm bar spacing Nordmøre grid, and two tows used the 19-mm bar spacing Nordmøre grid, with a total useable fishing time of 6.5 and 3.8 h, respectively (Table 1). Overall, there were 442 redfish recorded for the 22-mm Nordmøre grid and 489 redfish for the 19-mm Nordmøre grid.
Of the 931 fish observed during the experiment, 442 (47.48%) escaped through the opening, and 489 (52.52%) passed through the bar spacings and were retained. The mean observed time from first redfish detection (i.e., behavioral stage 1) to fate was 2.01 s (min 0.52 s, max 9.39 s, and standard error of the mean (SEM) ± 0.06) and 1.70 s (min 0.28 s, max 8.14 s and SEM ± 0.05) for escaped and retained redfish, respectively. Behavioural events that had the highest escape probabilities on each behavioral stage independently were redfish that did not contact the grid, redfish that reacted to the grid upwards, redfish that approached upwards to the grid, and redfish that had a body orientation away from the grid (Table 3). However, the lowest escape probabilities were obtained for fish that reacted to the grid by swimming forward or towards it, redfish that approached steady, redfish that contacted the grid, and redfish that had a body orientation towards the grid (Table 3). Both grids produced similar escape probabilities for the different behaviors observed as shown by the overlap on the 95% CI of the percentage of escape between grids (Table 3). Furthermore, escape differences ranged between −5.20% and +8.73%, with an average of 0.73% (Table 3).
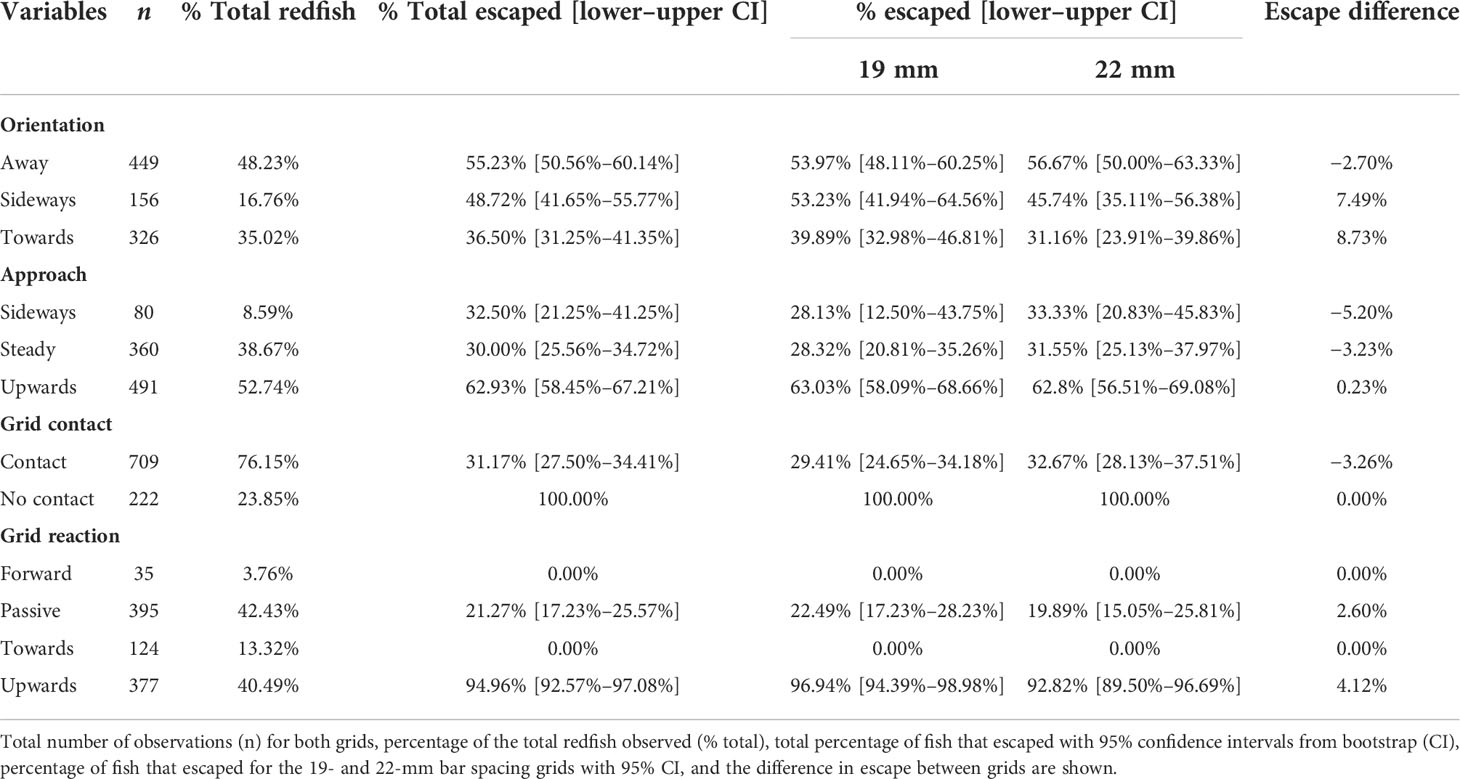
Table 3 Fate of juvenile redfish in 19- and 22-mm bar spacing Nordmøre grids for the different behaviors.
Initially, the data were analyzed using a generalized linear mixed model (GLMM), to incorporate random variation from different tows within the model. However, model fit indicated singularity when the variables’ grid reaction and grid contact were included, together or individually. Thus, a GLMM was not deemed reasonable, as these explanatory variables were important, and the analysis shifted to fitting a GLM. Since tow could not be included as a random effect, we attempted to use it as an explanatory variable; however, large AICc values showed it was not an important variable during the initial data investigation, and it was excluded from the model selection process for simplicity. Additionally, the grid was an independent variable of interest (capture fate between different grids), and generally, its inclusion produced low AICc values during initial data investigation; hence, it was decided to maintain the grid variable in every fitted model. Further, the model fit was improved by reducing the number of categories in the grid reaction variable (i.e., originally it had four categories); forward and towards behaviors were combined, as all redfish were retained when exhibiting these behaviors. The model with the lowest AICc included grid, grid contact, grid reaction, and time as explanatory variables (Table 4).
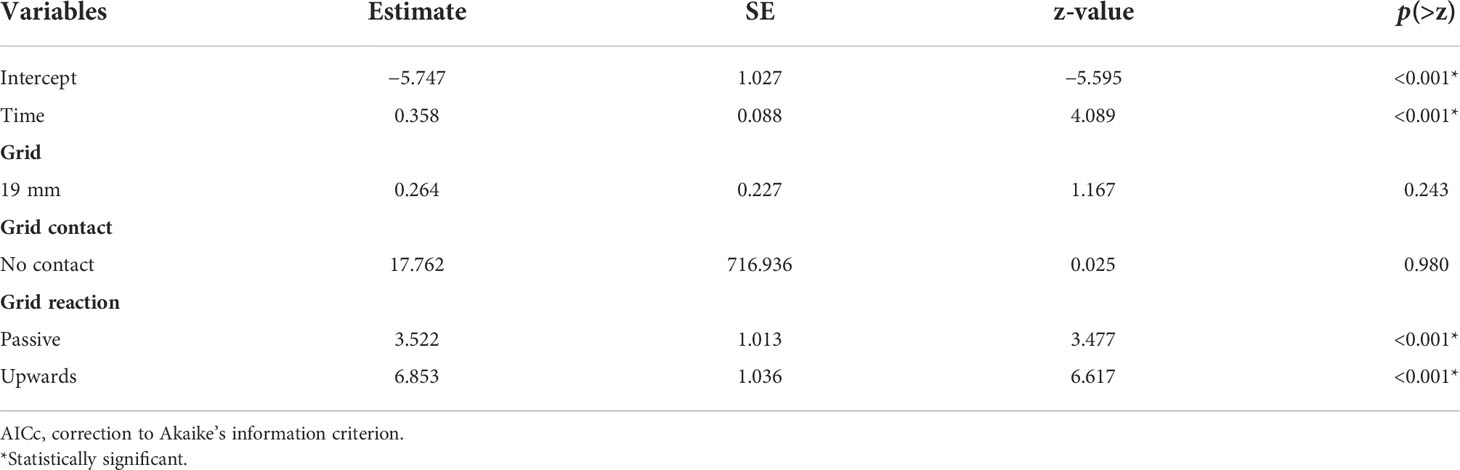
Table 4 Generalized linear model outcome including all variables in the lowest AICc model, estimates, standard error (SE), z-value, and p(>z).
GLM model output suggested that there was a 99.68% probability of retention (or 0.32% of escaping) for redfish that had contact with the 22-mm grid and reacted by swimming forward or towards when the variable time was set to 0 s in the model. If we move to the 19-mm bar spacing grid, the probability of escaping increases by 56.52% (p-value = 0.243), maintaining the other reference groups constant (i.e., grid reaction forward or towards and time = 0 s) (Table 4). Redfish that had no contact with the grids had a 100% probability of escaping (p-value = 0.980). Regarding grid reaction, the model results indicated that the probability of escaping was increased by 97.13% and by 99.90% for redfish that remained steady and reacted by swimming upwards, respectively, when compared to redfish that had towards or forward grid reactions (p-values< 0.001) (Table 4). Finally, for a one-unit increase in the time that redfish spent in front of the grid (i.e., 1 s), the probability of escaping was increased by 58.85% (p-value< 0.001).
Behavioural tree bootstrapping indicated that the rate of redfish that escaped for the 22-mm grid was 46.64% (95% CI: [40.36%–58.51%]), while in the 19-mm grid, 48.47% of the individuals escaped (95% CI: [38.07%–56.16%]). Furthermore, the average duration of the selection process (t) was 1.95 s (95% CI: [1.72–2.44 s]) and 1.75 s (95% CI: [1.39–2.34 s]) for the 22- and 19-mm Nordmøre grids, respectively. The size of the behavioral trees was reduced by excluding stage 1 (i.e., body orientation) in order to improve their readability and raw trees, which include all behavioral stages are found in Supplementary Figures 1 and 2. For both grids, most of the redfish had away or towards body orientations; only 12.7% and 21.3% of redfish were oriented sideways for the 19- and 22-mm grids, respectively. Fish that were oriented away from the grids, approached upwards, had no contact with the grids, and reacted to the grids by continuing to move upwards had the highest number of redfish that escaped the bottom trawl (Figure 5). Conversely, there were multiple behavioral sequences on both grids that led to high retention of redfish (Supplementary Material).
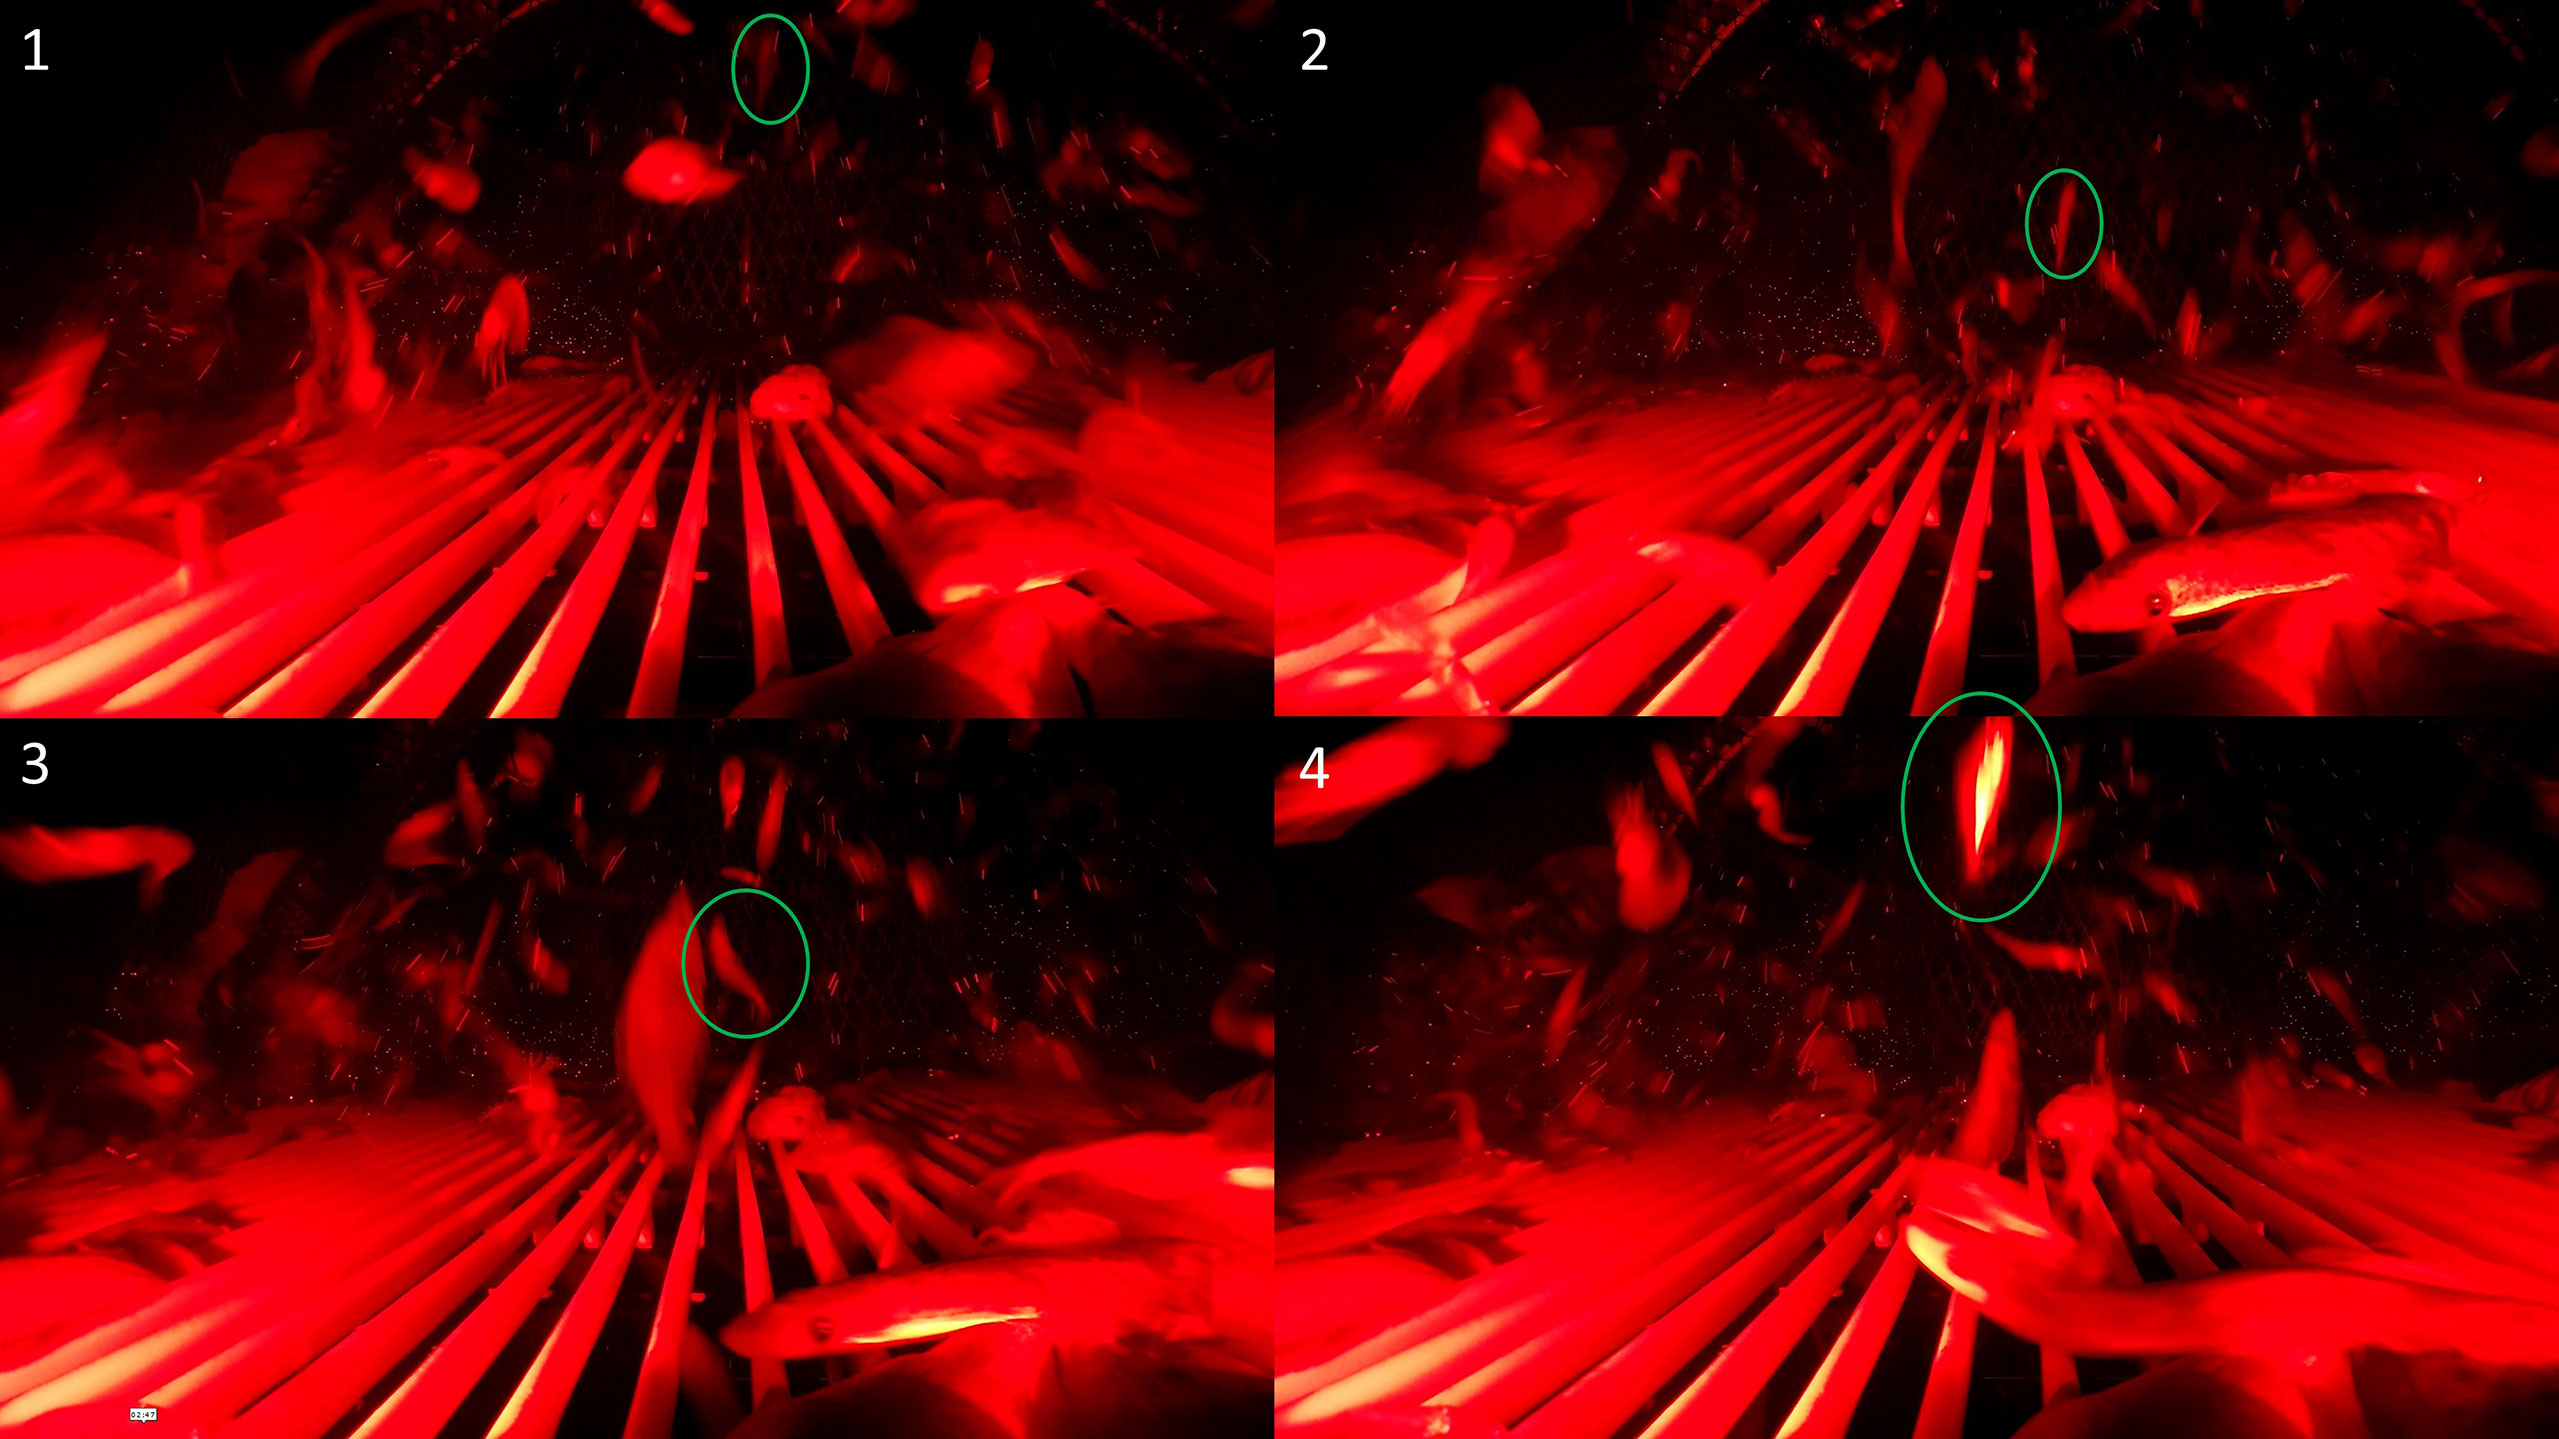
Figure 5 A behavioral sequence leading to escapement. Underwater video screenshot of a redfish that exhibited away body orientation (1), upwards approach (2), upwards grid reaction (3), and escaped the grid system (4).
For the reduced behavioral trees, redfish individuals were pooled from the three different body orientations. Simplified behavioral trees showed that in stage 2, redfish that approached upwards did not contact the grid in stage 3 and reacted by moving upwards in stage 4, escaped from the gear; there were 90 (MP = 20.4%, 95% CI: [16.0%–24.2%], CP = 100%) and 132 (MP = 27.0%, 95% CI: [12.7%–37.8%], CP = 100%) redfish that followed this behavioral sequence for the 22- and 19-mm Nordmøre grids, respectively, and all the remaining fish had contact with the grids (Figure 6). Conversely, redfish that reacted to the grid by swimming forward or towards in stage 4 (i.e., grid reaction) were always retained (CP = 100%) (Figure 7); 75 and 84 redfish exhibited these behaviors in the 22- and 19-mm Nordmøre grids, respectively (Figure 6). Fish that reacted upwards were more likely to escape than the ones that remained passive, after contact with the grids. Behavioural sequences that were more likely to occur (i.e., with the higher marginal probabilities at the leaves) were upwards-no contact-upwards-escaped, steady-contact-passive-retained, and upwards-contact-passive-retained, for both the 22- and 19-mm Nordmøre grids (Figure 6). Redfish that remained passive upon grid contact and were retained slid up the grid until they oriented themselves parallel to the grid and passed through the bar spacings (Figure 8).
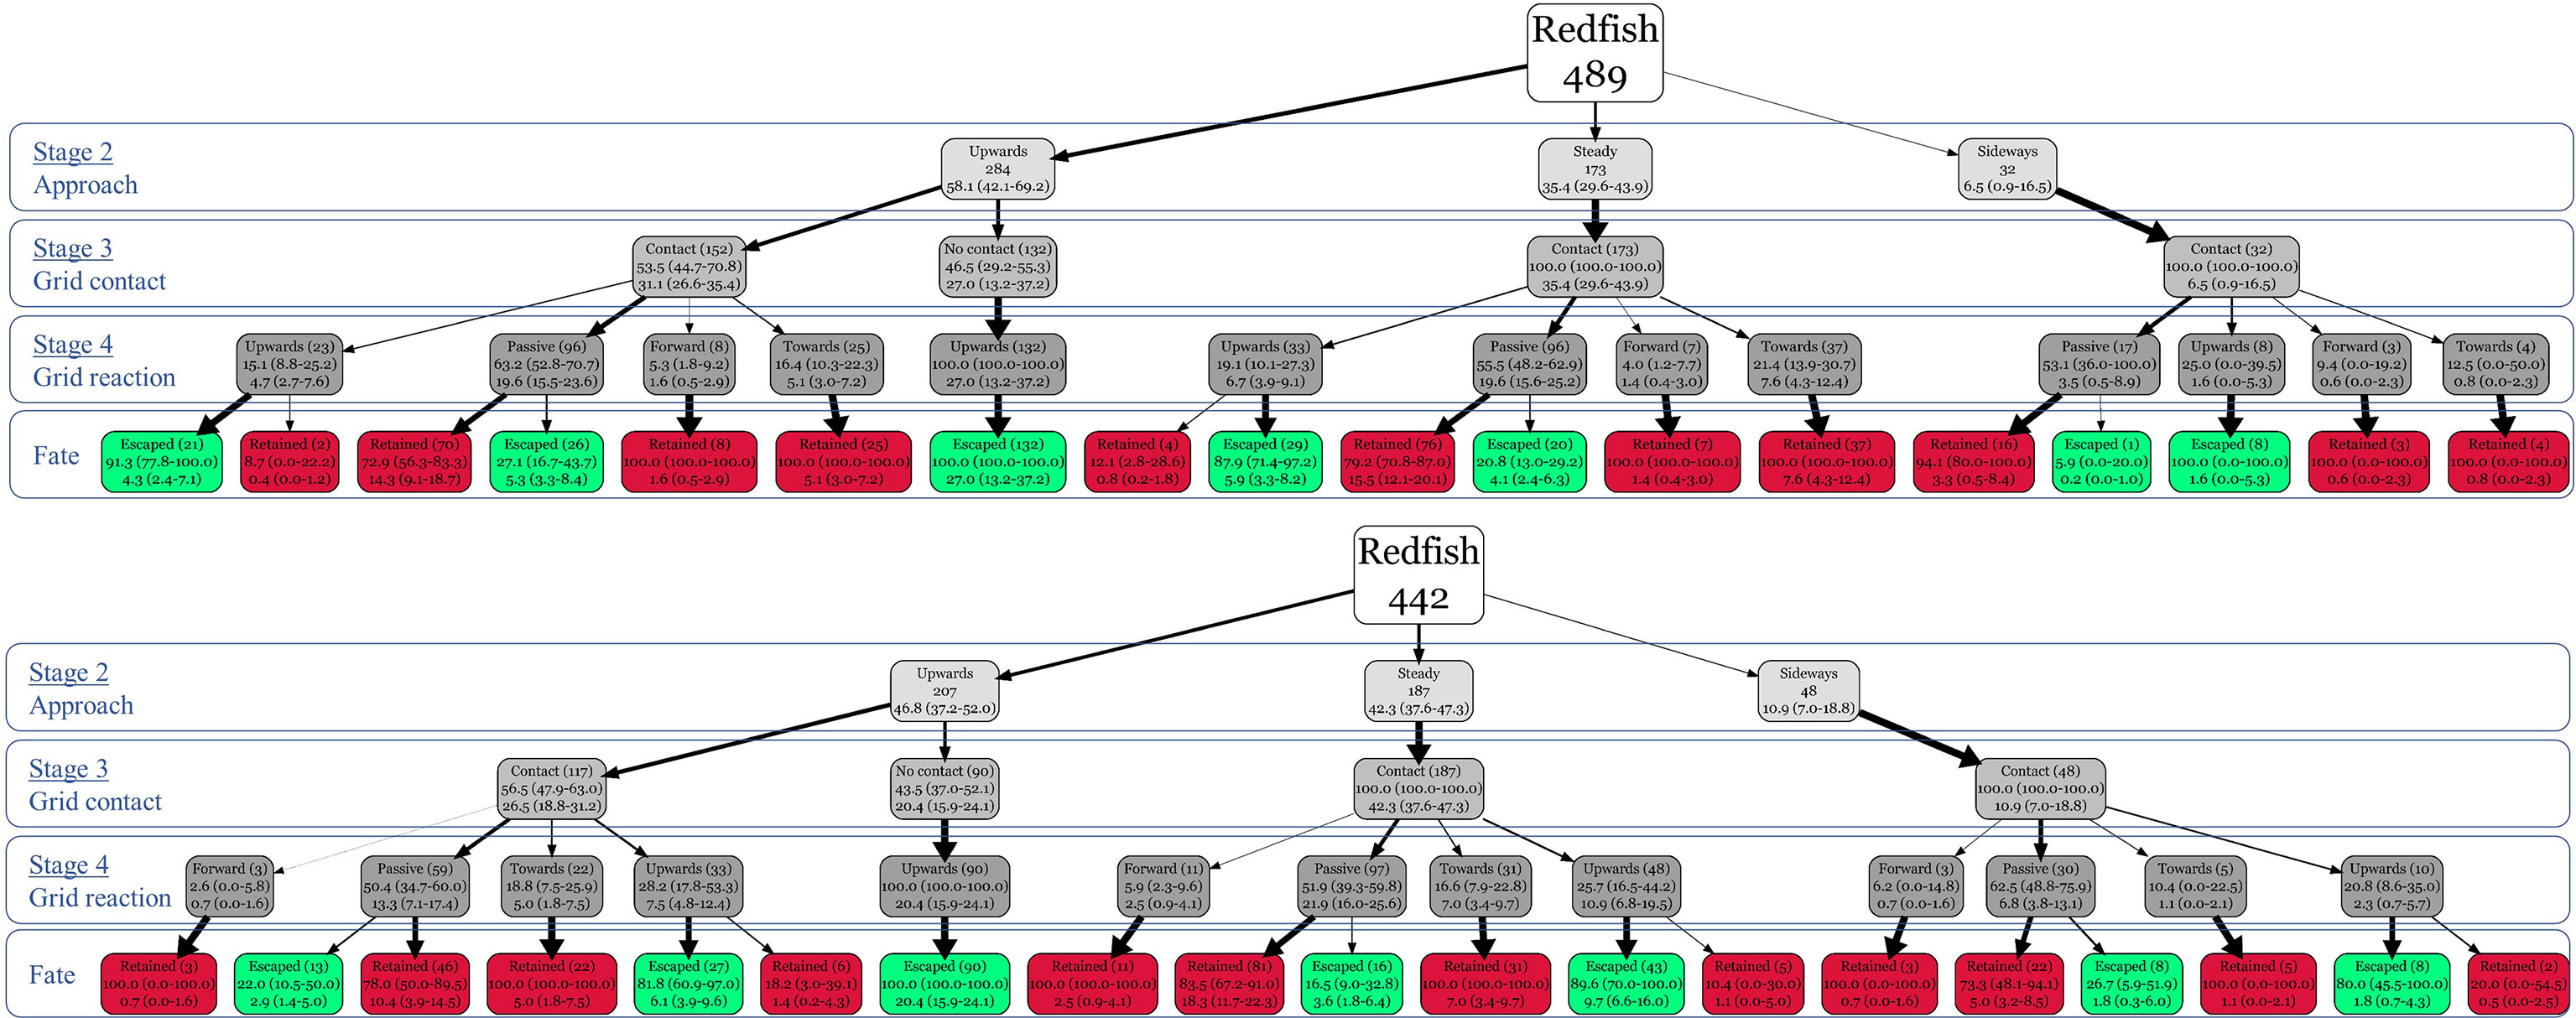
Figure 6 Behavioural trees for the 19-mm (top) and 22-mm (bottom) bar spacing Nordmøre grids. White boxes represent the tree root with the number of redfish observed, grey boxes represent the behaviors at the different behavioral stages (approach, grid contact, and grid behavior), red boxes represent redfish that were retained, and green boxes represent redfish that escaped. On each box, the number of redfish, conditional probability, and marginal probability, with their respective 95% confidence intervals, are shown.
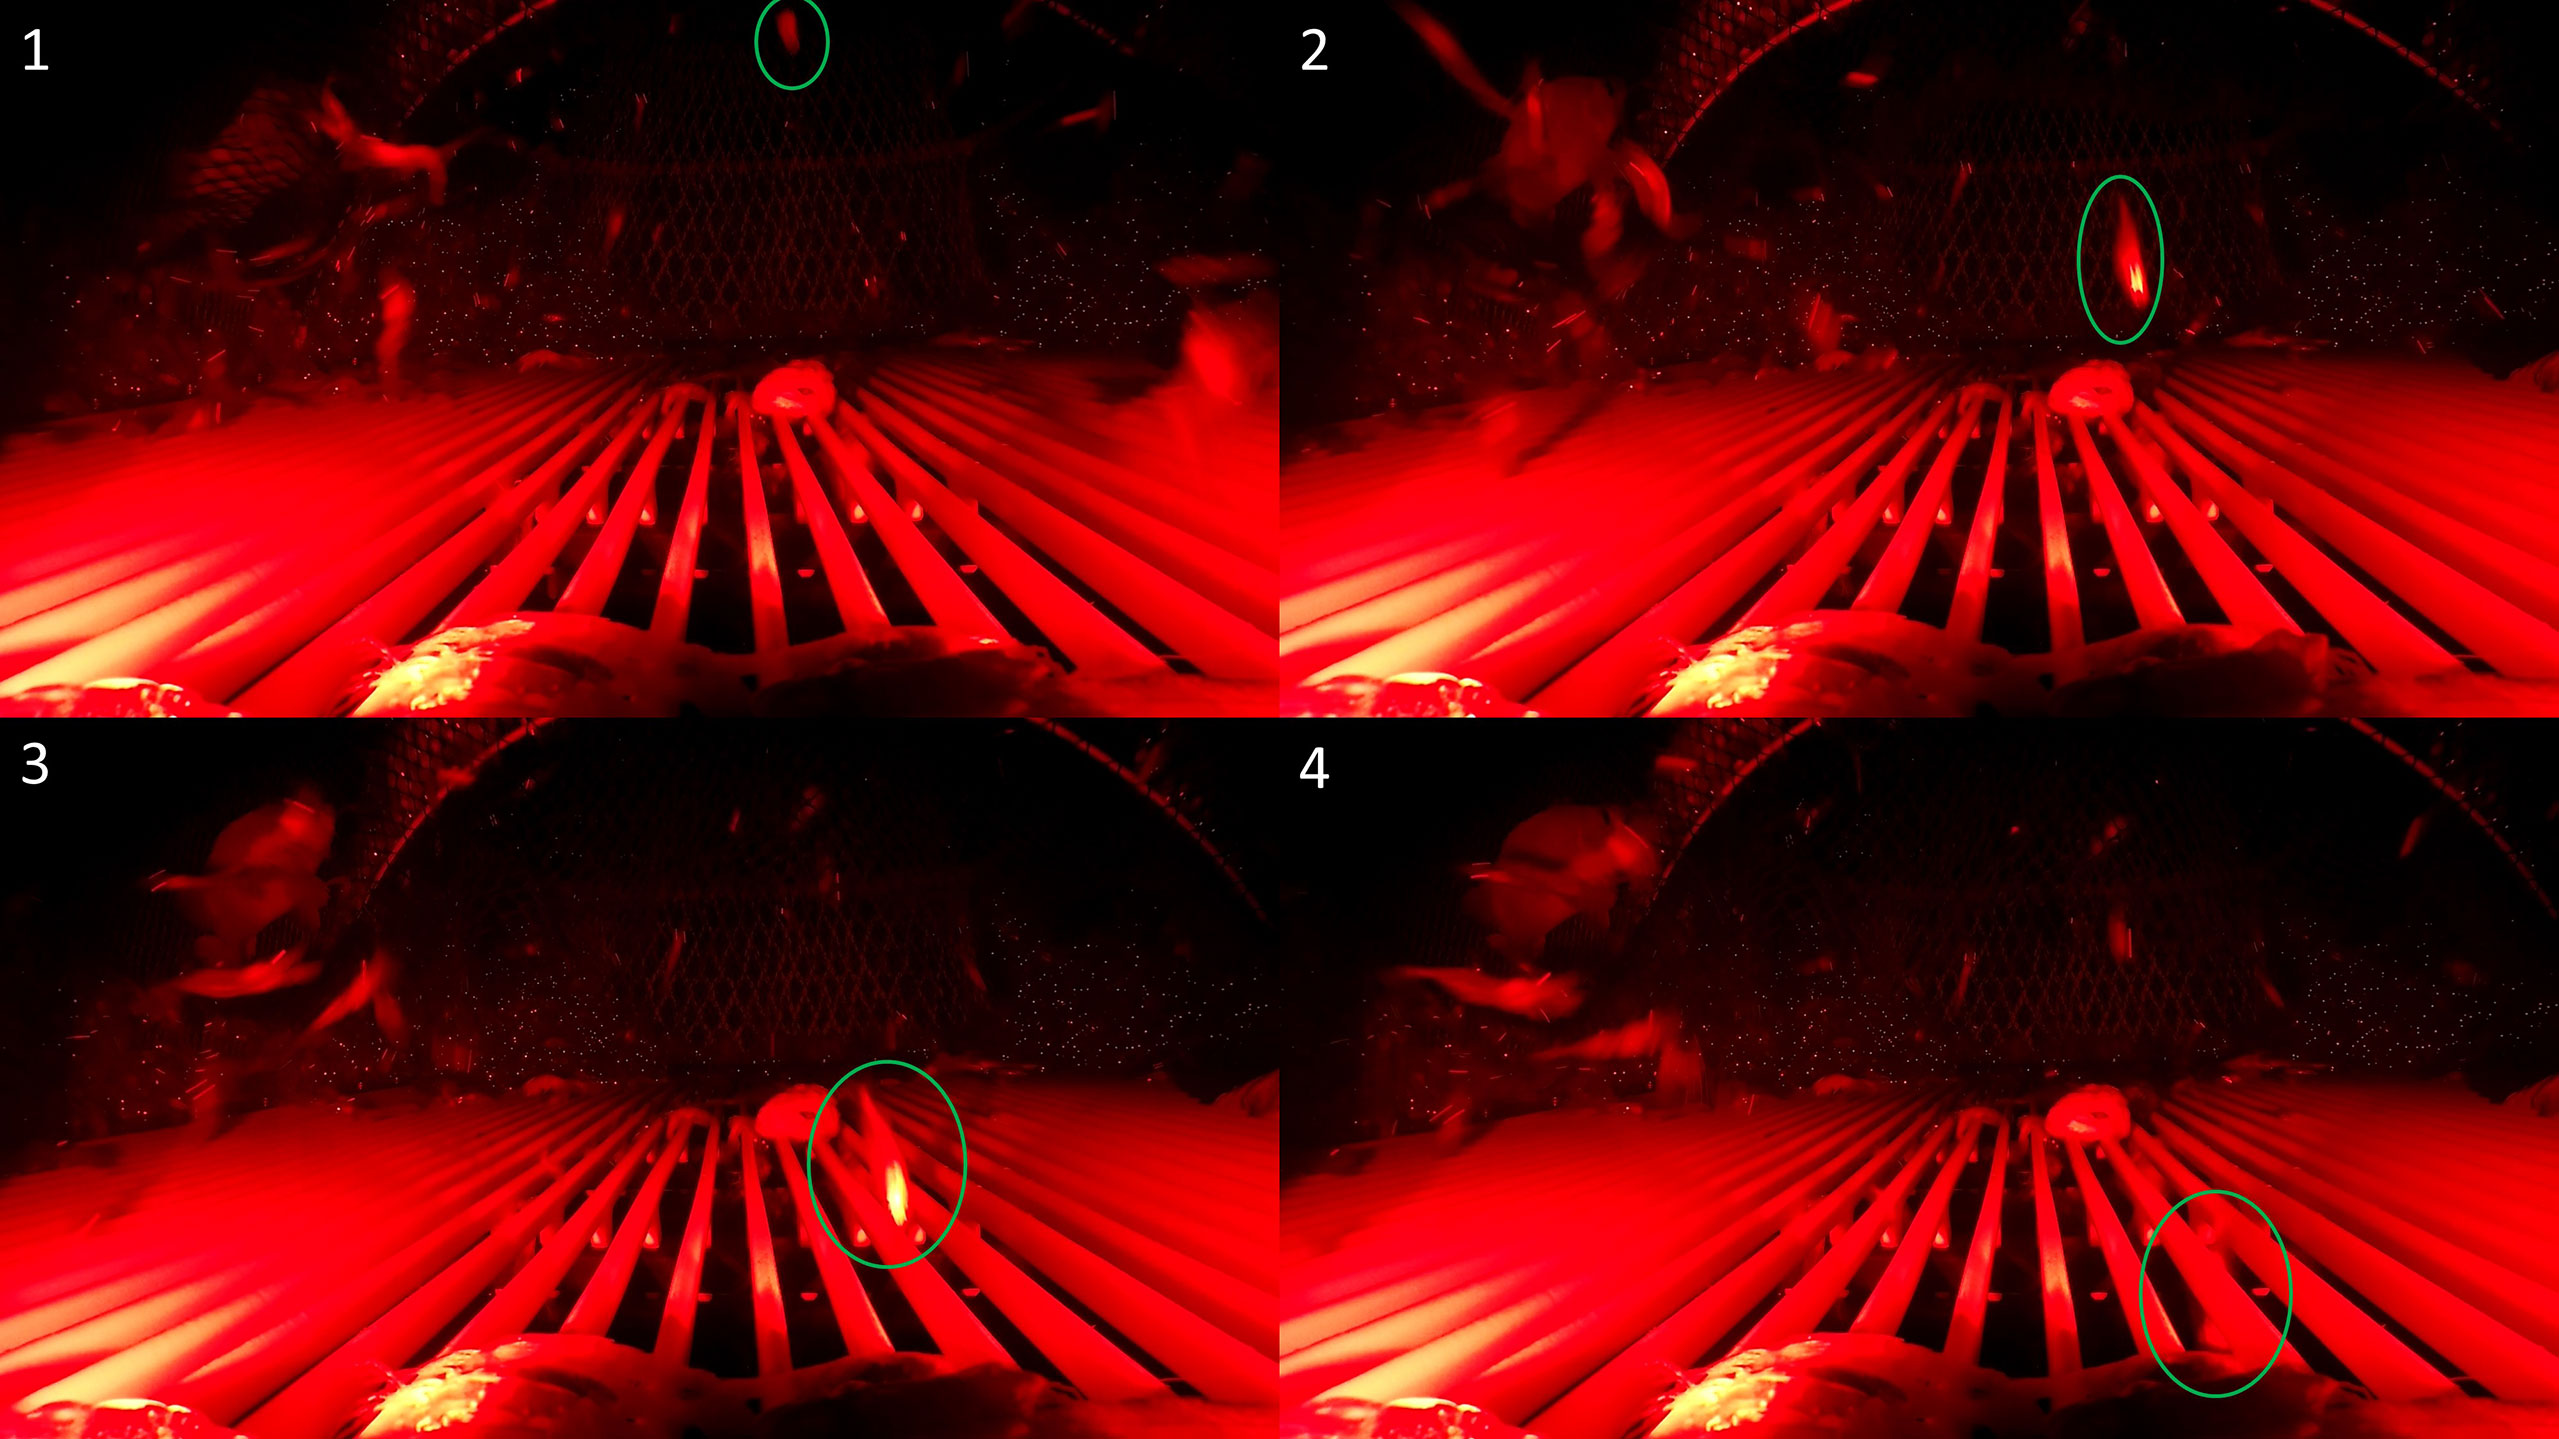
Figure 7 A behavioral sequence leading to retention. Underwater video screenshot of a redfish that exhibited towards body orientation (1), upwards approach (2), contacted the grid (3), continued swimming towards the grid, passed through the grid bar spacings, and was retained (4).
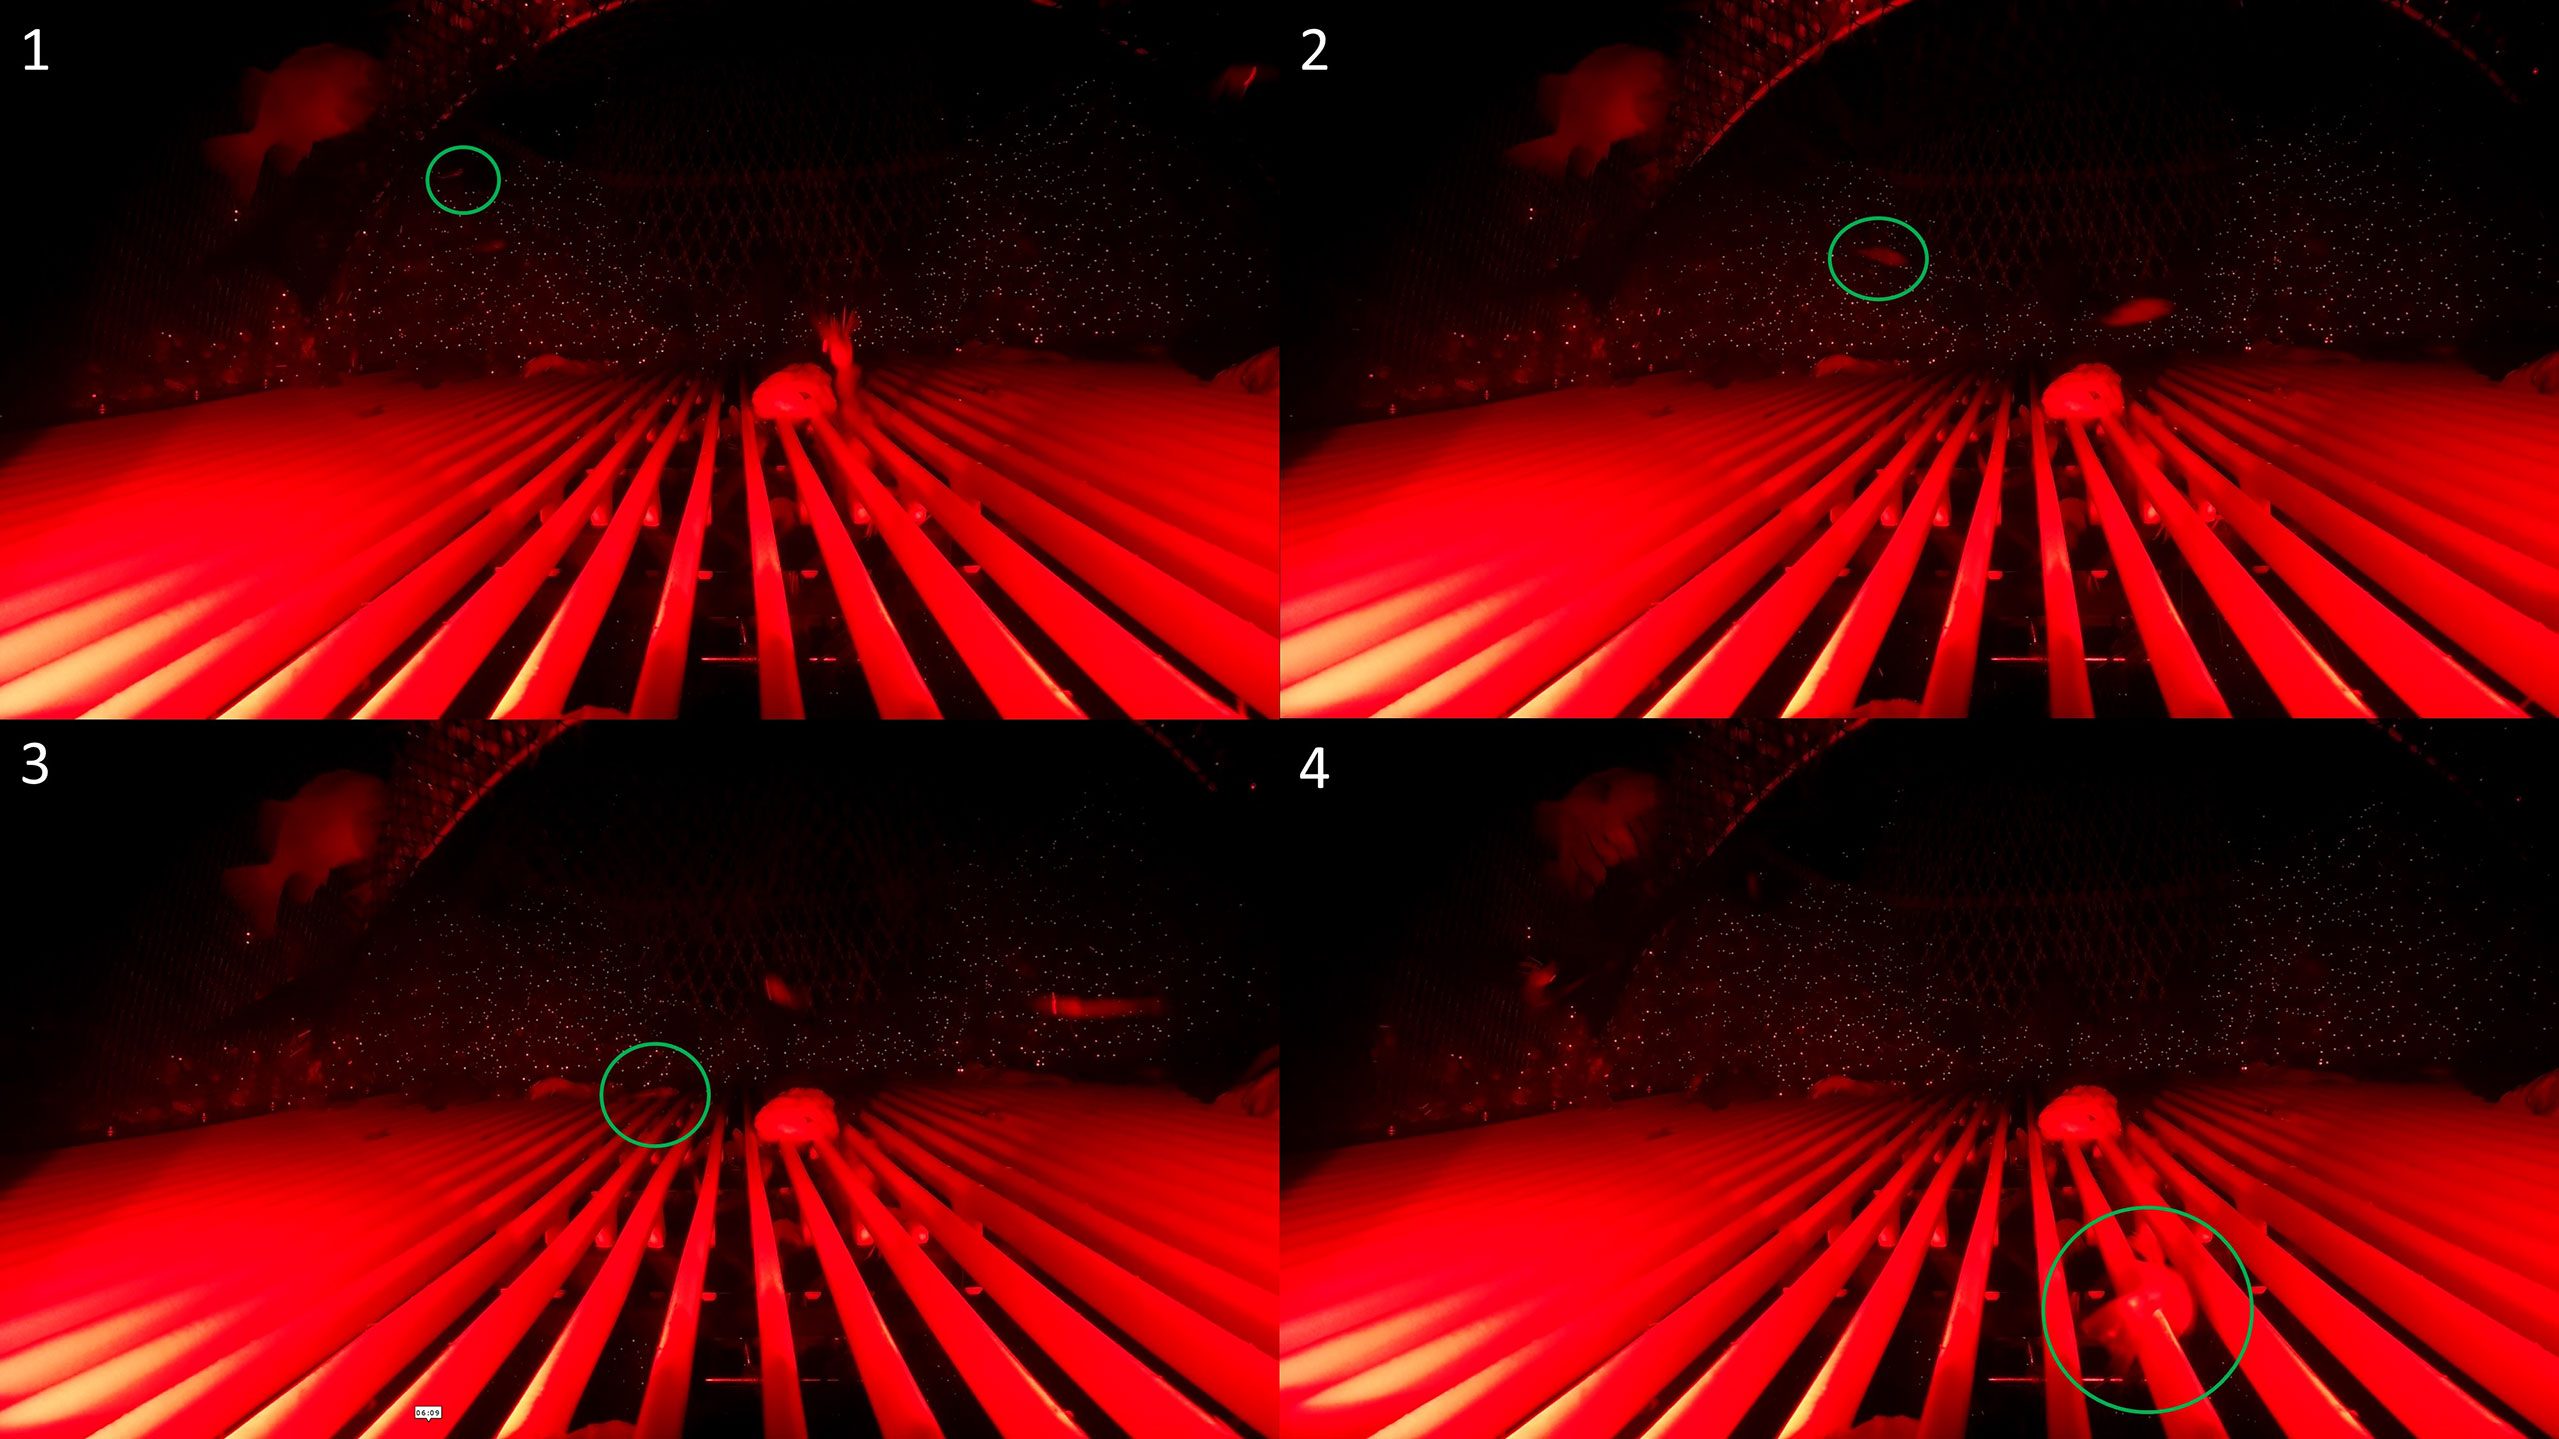
Figure 8 A behavioral sequence leading to retention. Underwater video screenshot of a redfish that exhibited sideways body orientation (1), upwards approach (2), contacted the grid (3), slid up the grid face until the fish orientated itself parallel to the grid, and passed through the bar spacings (4).
This study investigated the behavior of juvenile redfish in 22- and 19-mm Nordmøre grid systems. The underwater video resulted in 931 redfish being observed throughout the behavioral stages to their final fate (i.e., escape or retained). Over half (52.52%) of the redfish observed on the underwater video passed through the Nordmøre grid bar spacings and were retained, which is in line with the considerable amounts of juvenile redfish that fishers are encountering in their catch. Opening of the guiding panel exit was observed for all tows, as animals meshed and accumulated in the guiding panel meshes. Once the guiding panel exit opened, there were no redfish seen contacting the guiding panel netting, which suggests that the redfish could be avoiding the netting. If the guiding panel exit were to remain in its initial position directing catch to the lower section of the grid, redfish retention would likely be even higher than observed in this study, which may explain why Larsen et al. (2017) found a high and constant probability of retention for juvenile redfish when using both long and short guiding funnels with a 19-mm bar spacing grid. Presumably, these funnels, independent of their length, were efficient at directing shrimp and fish to the bottom of the grid. Redfish directed to the lower part of the grid would be less capable of approaching upwards to the escape opening and avoiding contact with the grid and would give passive individuals more time to slide up along the grid and orientate themselves in a way that enables passage through the grid as observed in Larsen et al. (2017). Shrimp behaviors were not quantitatively assessed during our experiment, but the opening of the guiding panel seemed to direct more shrimp to the top of the grid, and at high catch rates, considerable amounts of shrimp were seen exiting the grid.
Redfish were observed to be unable to swim effectively against water flows in the tested Nordmøre grid systems and were rapidly directed towards the grid, which is evidenced by the short time that elapsed from the first detection to fate; less than half (42.19%) of the fish did not exhibit any reaction upon grid contact or in close proximity to the grid, while a fair proportion of redfish (57.81%) reacted to the grid with burst-swimming behaviors (i.e., upwards, forward, and towards the grid), which is typical behavior for fish in crowded spaces (Winger et al., 2010). This shows that despite their small size and limited presumed swimming capabilities, a proportion was still able to swim or react at that point in the bottom trawl. This is especially promising since using other devices to deter or attract redfish out of the bottom trawl could be feasible at such a late stage of the capture process. In line with this principle, Larsen et al. (2018d) attached green LED lights to the lower part of a Nordmøre grid to encourage the upwards behavior of fish species and reduce bycatch. However, the addition of lights did not produce significant improvements. Further investigation of different light colors, intensities, and positions could provide an alternative to reduce fish bycatch.
Most of the fish that remained passive upon grid contact slid up the grid until they oriented themselves parallel to the grid and passed through the bar spacings (78.81% of the passive fish). This finding is consistent with observations by Larsen et al. (2019) using a similar length grid (2.1 m) but with a lower angle (30°). However, there was a proportion (21.19%) of passive fish that continued sliding up the grid face past the camera field of view and escaped through the opening. Perhaps the guiding panel exit opening (i.e., directing the water flows higher in the grid) decreased the sliding area and the chances of correct orientation for these fish, allowing them to escape.
We observed that a significant proportion of juvenile redfish (approx. 24%) did not make contact with the grids. They simply approached the grid, rose, and escaped through the opening at the top of the BRD. We speculate that these redfish may have exited the trawl by following the water that is rejected through the grid opening. The phenomenon of rejected water was first described by Riedel and DeAlteris (1995). The concept was developed further by Grimaldo and Larsen (2005) and has been cited as the possible reason for the escape of shrimp. The probability of no contact was similar for both the 19- and 22-mm grids (only 6.6% higher for the 19-mm grid). This finding coincides with our flume tank observations of the grids, where there was only a minor increase (6.3%) in front and a minor reduction behind (6.4%) in water velocity for the 19-mm grid when compared to the 22-mm grid. Therefore, water flows directed towards the escape opening and through the bar spacings were generally similar, which could explain the similar contact and escape probability of redfish between the grids tested. Alternatively, this could be attributed to the fact that juvenile redfish captured in this study were all smaller than 150-mm TL and able to fit through both grid bar spacings as their body widths were also below 19 mm, according to morphometric measurements performed on redfish individuals from the same fishing area (personal observation).
Understanding how species behave in response to BRD devices is key to enhancing their escape/retention performance (Winger et al., 2010). The GLM analysis showed that the duration of the selection process (t) and grid reaction were important variables; the more time redfish spend in front of the grid, the higher the probability of escaping (1 s increased by 58.85% the probability of escape). This result was expected, as redfish that escaped needed to traverse a larger distance in order to reach the escape opening. Regarding the grid reaction variable, fish that reacted to the grid upwards or passive drastically increased the probability of escaping (99.90% and 93.13%, respectively), when compared to fish that swam forward or towards the grid. GLM analysis was effective at answering these specific research questions relating all explanatory variables at once and allowed the inclusion of continuous variables, such as time. However, it is not possible to understand the different behavioral sequences that redfish followed and their associated escape or retention probabilities using these methods. Thus, behavioral trees were used to show which behavioral sequences led to the highest probability of escaping for both grids, which were away body orientation, upwards approach, no contact with the grid, and upwards grid reaction. A large proportion of redfish (~50%) were initially oriented away from the grid, and approximately 50% of these fish approached the grid upwards, leading to no grid contact for almost half of these fish by continuing moving upwards and consequently escaping through the grid outlet. Even though many fish did not follow this behavioral sequence, it can be seen that escape probability is increased for redfish that exhibited an upwards approach and upwards grid reaction, despite their initial body orientation or grid contact stages. Therefore, designing or modifying a selection device to trigger these behaviors could greatly reduce redfish bycatch. Isaksen et al. (1992) found that in a 19-mm bar spacing grid, angled 48°, all redfish (Sebastes sp.) escaped through the grid outlet, although these fish were admittedly larger than the redfish in this study. Likely, with the grid systems used in this experiment, lower grid angles could reduce the probability of contact with the grid and increase the amount of redfish escaping through the grid outlet. However, this would also depend upon the proportion of fish that have passive rather than active behavior. However, lower grid angles with an inefficient guiding panel, such as the one observed in this experiment, could lead to shrimp escape.
A limitation of this study was the use of light to illuminate the camera’s field of view, as this could affect redfish behavior. Fish that inhabit depths below 50 m have decreased visual sensitivity in the red part of the spectrum, which has been previously shown by Brill et al. (2008) for black rockfish (Sebastes melanops, >620 nm). Furthermore, deep-water fish, such as sablefish (Anoplopoma fimbria) and rockfishes (Sebastes spp.), can detect red LED light, although red is far less disruptive than other light colors (Widder et al., 2005; Rooper et al., 2015). Even though infrared light could be used and is invisible to fish, the visual range is often limited (1 m) (Rooper et al., 2015), and invisible infrared radiation may damage the eyes of the animals, making red light the only feasible option to effectively observe redfish behavior for the distances required in this study. The light used had a peak wavelength in the lower spectrum range of red light, and the total wavelength range of the light extends into the orange part of the visible light spectrum. It has been described that rockfish exhibit weak avoidance behavior to red lights (Rooper et al., 2015). Therefore, the influence of red light on juvenile redfish behavior cannot be discarded and may have biased the results.
In conclusion, this study showed that over half of the redfish observed on the underwater video passed through the Nordmøre grid bar spacings and were retained. The time that redfish spent in front of the grid and grid reaction better explained redfish probability of escaping; one unit increase in time and upwards or steady grid reactions drastically decreased the probability of retention. The most favorable behavioral sequence for redfish to escape was an upwards approach, no contact with the grid, and an upwards grid reaction. The GLM was useful for estimating retention probabilities relating all explanatory variables at once, and behavioral trees showed probabilities accounting for the stepwise nature of the behaviors. Both approaches together gave a comprehensive view of the redfish behavior on Nordmøre grid systems. This important information could guide the future development of BRDs so they can be designed to enhance the most favorable redfish behaviors that led to the escapement. It could also aid in the improvement of the current Nordmøre grid system by increasing the time of redfish in front of the grid and by facilitating upwards behavior, which could ultimately lead to significant reductions in juvenile redfish bycatch.
The raw data supporting the conclusions of this article will be made available by the authors, without undue reservation.
TA-S: conceptualization, methodology, validation, formal analysis, investigation, data curation, writing—original draft, writing—review and editing, and visualization. SB: conceptualization, methodology, validation, formal analysis, writing—review and editing, and visualization. PW: validation, methodology, resources, writing—review and editing, supervision, project administration, funding acquisition, and visualization. MS: investigation and writing—review and editing. All authors contributed to the article and approved the submitted version.
This project was funded by the Canadian Centre for Fisheries Innovation (CCFI), the Canadian Association of Prawn Producers (CAPP), the Nunavut Fisheries Association (NFA), and the Northern Coalition Corp. (NCC).
We thank the vessel crew and staff at Ocean Choice International for their collaboration and for accommodating our research plans by incorporating them into their commercial fishing operations. We thank Hampidjan Canada Ltd. and Selector Systems Inc. for their in-kind contributions. We thank Dr. Juan Santos for sharing the behavioral tree code in R. We thank the reviewers for their contribution, which improved the final version of this manuscript, and for providing light specifications.
The authors declare that the research was conducted in the absence of any commercial or financial relationships that could be construed as a potential conflict of interest.
All claims expressed in this article are solely those of the authors and do not necessarily represent those of their affiliated organizations, or those of the publisher, the editors and the reviewers. Any product that may be evaluated in this article, or claim that may be made by its manufacturer, is not guaranteed or endorsed by the publisher.
The Supplementary Material for this article can be found online at: https://www.frontiersin.org/articles/10.3389/fmars.2022.920429/full#supplementary-material
Ahumada M., Queirolo D., Apablaza P., Wiff R., Flores A. (2021). Catch efficiency of trawl nets used in surveys of the yellow squat lobster (Cervimunida johni) estimated by underwater filming records. Reg. Stud. Mar. Sci. 44, 101744. doi: 10.1016/J.RSMA.2021.101744
Akaike H. (1974). A new look at the statistical model identification. IEEE Trans. Automat. Contr. 19, 716–723. doi: 10.1109/TAC.1974.1100705
Araya-Schmidt T., Winger P. D., Santos M. R., Moret K., DeLouche H., Legge G., et al. (2021). Investigating the performance of a roller footgear in the offshore shrimp fishery of Eastern Canada using underwater video. Fish. Res. 240, 105968. doi: 10.1016/j.fishres.2021.105968
Bates D., Maechler M., Bolker B., Walker S. (2015). Fitting linear mixed-effects models using lme4. J. Stat. Softw. 67 (1), 1–48. doi: 10.18637/jss.v067.i01
Bayse S. M., He P. (2017). Technical conservation measures in new England small-mesh trawl fisheries: Current status and future prospects. Ocean Coast. Manage. 135, 93–102. doi: 10.1016/j.ocecoaman.2016.11.009
Bayse S. M., He P., Pol M. V., Chosid D. M. (2014). Quantitative analysis of the behavior of longfin inshore squid (Doryteuthis pealeii) in reaction to a species separation grid of anotter trawl. Fish. Res. 152, 55–61. doi: 10.1016/j.fishres.2013.03.018
Bayse S. M., Pol M. V., He P. (2016). Fish and squid behaviour at the mouth of a drop-chain trawl: factors contributing to capture or escape. ICES J. Mar. Sci. 73, 1545–1556. doi: 10.1093/icesjms/fsw007
Bolker B., R Development Core Team (2020). Bbmle: Tools for general maximum likelihood estimation. r package version 1.0.23.1.
Brill R., Magel C., Davis M., Hannah R., Rankin P. (2008). Effects of rapid decompression and exposure to bright light on visual function in black rockfish (Sebastes melanops) and pacific halibut (Hippoglossus stenolepis). Fish. Bull. U.S. 106, 427–437. Available at: https://scholarworks.wm.edu/vimsarticles/557
Broadhurst M. K. (2000). Modifications to reduce bycatch in prawn trawls: A review and framework for development. Rev. Fish Biol. Fish. 10, 27–60. doi: 10.1023/A:1008936820089
Campana S. E., Zwanenburg K. C. T., Smith J. N. (1990). 210Pb/226Ra determination of longevity in redfish. Can. J. Fish. Aquat. Sci. 47, 163–165. doi: 10.1139/F90-017
Canada/Newfoundland Cooperative Agreement for Fishing Industry Development (CAFID) (1997). “Project summary. impact of nordmøre grate bar spacing on by-catch reduction in the northern shrimp fishery,”(St. John’s, NL), 4.
Cerbule K., Jacques N., Pettersen H., Ingólfsson Ó.A., Herrmann B., Grimaldo E., et al. (2021). Bycatch reduction in the deep-water shrimp (Pandalus borealis) trawl fishery with a large mesh top panel. J. Nat. Conserv. 61, 126001. doi: 10.1016/J.JNC.2021.126001
Cheng Z., Winger P. D., Bayse S. M., Kelly D. (2022). Hydrodynamic performance of full-scale T0 and T90 codends with and without a codend cover. J. Mar. Sci. Eng. 10 (3), 440. doi: 10.3390/jmse10030440
Chladek J., Stepputtis D., Hermann A., Kratzer I. M. F., Ljungberg P., Rodriguez-Tress P., et al. (2021a). Using an innovative net-pen-based observation method to assess and compare fish pot-entrance catch efficiency for Atlantic cod (Gadus morhua). Fish. Res. 236, 105851. doi: 10.1016/J.FISHRES.2020.105851
Chladek J., Stepputtis D., Hermann A., Ljungberg P., Rodriguez-Tress P., Santos J., et al. (2021b). Development and testing of fish-retention devices for pots: transparent triggers significantly increase catch efficiency for Atlantic cod (Gadus morhua). ICES J. Mar. Sci. 78, 199–219. doi: 10.1093/ICESJMS/FSAA214
Dayton P. K., Thrush S. F., Agardy M. T., Hofman R. J. (1995). Environmental effects of marine fishing. Aquat. Conserv. Mar. Freshw. Ecosyst. 5, 205–232. doi: 10.1002/AQC.3270050305
Devine J. A., Haedrich R. L. (2011). The role of environmental conditions and exploitation in determining dynamics of redfish (Sebastes species) in the Northwest Atlantic. Fish. Oceanogr. 20, 66–81. doi: 10.1111/j.1365-2419.2010.00566.x
DFO (2018) Northern shrimp and striped shrimp – shrimp fishing areas 0, 1, 4-7, the Eastern and Western assessment zones and north Atlantic fisheries organization (NAFO) division 3M. Available at: https://www.dfo-mpo.gc.ca/fisheries-peches/ifmp-gmp/shrimp-crevette/shrimp-crevette-2018-002-eng.htmln7.6 (Accessed July 08, 2021).
DFO (2020). Stock status of redfish in NAFO SA 2 + divs. 3K (Can. Sci. Advis. Sec. Sci. Advis. Rep. 2020/21), 14. Available at: https://waves-vagues.dfo-mpo.gc.ca/library-bibliotheque/40901397.pdf (Accessed February 15, 2022).
DFO (2021) Juvenile redfish (Sebastes mentella and sebastes fasciatus) bycatch in the northern shrimp fishery in the Eastern assessment zone. Available at: https://www.nwmb.com/en/public-hearings-a-meetings/meetings/regular-meetings/2021/rm-001-2021-march-10-2021/english-14/8767-tab9-dfo-bn-march-2021-redfish-bycatch-in-shrimp-eng/file (Accessed February 11, 2022).
Eayrs S. (2007). A guide to bycatch reduction in tropical shrimp - trawl fisheries (Italy: UN Food Agric. Organ. Rome), 108.
Efron B. (1982). The jackknife, the bootstrap and other resampling plans (SIAM J. Appl. Math), 99. doi: 10.1137/1.9781611970319
Friard O., Gamba M. (2016). BORIS: a free, versatile open-source event-logging software for video/audio coding and live observations. Methods Ecol. Evol. 7, 1325–1330. doi: 10.1111/2041-210X.12584
Glur C. (2018) Data.tree: General purpose hierarchical data structure. r package version 0.7.8. Available at: https://CRAN.R-project.org/package=data.tree.
Government of Canada (2021) Species at risk public registry - canada.ca. Available at: https://www.canada.ca/en/environment-climate-change/services/species-risk-public-registry.html (Accessed August 4, 2021).
Grimaldo E. (2006). The effects of grid angle on a modified nordmøre-grid in the Nordic shrimp fishery. Fish. Res. 77, 53–59. doi: 10.1016/J.FISHRES.2005.09.001
Grimaldo E., Larsen R. B. (2005). The cosmos grid: A new design for reducing by-catch in the Nordic shrimp fishery. Fish. Res. 76, 187–197. doi: 10.1016/J.FISHRES.2005.06.010
Grimaldo E., Sistiaga M., Herrmann B., Larsen R. B., Brinkhof J., Tatone I. (2018). Improving release efficiency of cod (Gadus morhua) and haddock (Melanogrammus aeglefinus) in the barents Sea demersal trawl fishery by stimulating escape behaviour. Can. J. Fish. Aquat. 75, 402–416. doi: 10.1139/cjfas-2017-0002
Hartig F. (2021) DHARMa: Residual diagnostics for hierarchical (Multi-Level/Mixed) regression models. r package version 0.4.1. Available at: https://CRAN.R-project.org/package=DHARMa.
He P., Balzano V. (2007). Reducing the catch of small shrimps in the gulf of Maine pink shrimp fishery with a size-sorting grid device. ICES J. Mar. Sci. 64, 1551–1557. doi: 10.1093/ICESJMS/FSM098
He P., Balzano V. (2011). Rope grid: A new grid design to further reduce finfish bycatch in the gulf of Maine pink shrimp fishery. Fish. Res. 111, 100–107. doi: 10.1016/J.FISHRES.2011.07.001
He P., Balzano V. (2012). The effect of grid spacing on size selectivity of shrimps in a pink shrimp trawl with a dual-grid size-sorting system. Fish. Res. 121–122, 81–87. doi: 10.1016/J.FISHRES.2012.01.012
He P., Balzano V. (2013). A new shrimp trawl combination grid system that reduces small shrimp and finfish bycatch. Fish. Res. 140, 20–27. doi: 10.1016/J.FISHRES.2012.11.009
Hickey W. M., Brothers G., Boulos D. L. (1993). Bycatch reduction in the northern shrimp fishery. Can. Tech. Rep. Fish. Aquat. Sci. 41.
Iannone R. (2019) DiagrammeR: Graph/Network visualization. r package version 1.0.1. Available at: https://CRAN.R-project.org/package=DiagrammeR.
ICES (1998). Study group on grid (Grate) sorting systems in trawls, beam trawls and seine nets, ICES working group on fishing technology and fish behaviour. 62.
Isaksen B., Valdemarsen J. W., Larsen R. B., Karlsen L. (1992). Reduction of fish by-catch in shrimp trawl using a rigid separator grid in the aft belly. Fish. Res. 13, 335–352. doi: 10.1016/0165-7836(92)90086-9
Larsen R. B., Herrmann B., Sistiaga M., Brčić J., Brinkhof J., Tatone I. (2018d). Could green artificial light reduce bycatch during barents Sea deep-water shrimp trawling? Fish. Res. 204, 441–447. doi: 10.1016/J.FISHRES.2018.03.023
Larsen R. B., Herrmann B., Sistiaga M., Brinkhof J., Grimaldo E. (2018a). Bycatch reduction in the Norwegian deep-water shrimp (Pandalus borealis) fishery with a double grid selection system. Fish. Res. 208, 267–273. doi: 10.1016/j.fishres.2018.08.007
Larsen R. B., Herrmann B., Sistiaga M., Brinkhof J., Santos J. (2018c). Catch and release patterns for target and bycatch species in the northeast Atlantic deep-water shrimp fishery: Effect of using a sieve panel and a nordmøre grid. PloS One 13, e0209621. doi: 10.1371/JOURNAL.PONE.0209621
Larsen R. B., Herrmann B., Sistiaga M., Brinkhof J., Tatone I., Langård L. (2017). Performance of the nordmøre grid in shrimp trawling and potential effects of guiding panel length and light stimulation. Mar. Coast. Fish. 9, 479–492. doi: 10.1080/19425120.2017.1360421
Larsen R. B., Herrmann B., Sistiaga M., Grimaldo E., Tatone I., Brinkhof J. (2018b). Size selection of cod (Gadus morhua) and haddock (Melanogrammus aeglefinus) in the northeast Atlantic bottom trawl fishery with a newly developed double steel grid system. Fish. Res. 201, 120–130. doi: 10.1016/j.fishres.2018.01.021
Larsen R. B., Sistiaga M., Herrmann B., Brinkhof J., Tatone I., Santos J. (2019). The effect of nordmøre grid length and angle on codend entry of bycatch fish species and shrimp catches. Can. J. Fish. Aquat. 76, 308–319. doi: 10.1139/cjfas-2018-0069
Madsen N., Pedersen M., Jense K. T., Møller P. R., Ern R., Moeslund T. B. (2021). Fishing with c-TUCS (cheap tiny underwater cameras) in a sea of possibilities. J. Ocean Technol. 16 (2), 19–30.
Nguyen K. Q., Winger P. D., Morris C., Grant S. M. (2017). Artificial lights improve the catchability of snow crab (Chionoecetes opilio) traps. Aquac. Fish. 2, 124–133. doi: 10.1016/j.aaf.2017.05.001
Orr D. (2018). An experiment to determine the appropriateness of reducing the nordmøre grate spacing from 28 mm to 22 mm. Fish. Oceans Canada (St. John’s), 68.
Pérez Roda M. A., Gilman E., Huntington T., Kennelly S. J., Suuronen P., Chaloupka M., et al. (2019). A third assessment of global marine fisheries discards. FAO fisheries and aquaculture technical paper no. 633 (Rome: FAO), 78.
Pruim R., Kaplan D. T., Horton N. J. (2017). The mosaic package: helping students to ‘think with data’ using r. R J. 9 (1), 77–102. doi: 10.32614/RJ-2017-024
Queirolo D., Couto-Ziezkowski A. L., Cusba J., Apablaza P., Ahumada M. (2019). Jumbo squid behaviour in response to a rigid grid in the Chilean hake trawl fishery. Fish. Res. 216, 1–5. doi: 10.1016/j.fishres.2019.03.012
Queirolo D., Montenegro I., Gaete E., Plaza G. (2010). Direct observation of Chilean hake (Merluccius gayi gayi) behaviour in response to trawling in a south central Chilean fishery. Fish. Res. 102, 327–329. doi: 10.1016/j.fishres.2009.12.005
R Development Core Team (2017). R: A language and environment for statistical computing (Vienna, Austria: R Foundation for Statistical Computing). Available at: http://www.R-project.org.
Riedel R., DeAlteris J. (1995). Factors affecting hydrodynamic performance of the nordmøre grate system: a bycatch reduction device used in the gulf of Maine shrimp fishery. Fish. Res. 24, 181–198. doi: 10.1016/0165-7836(95)00375-K
Rooper C., Williams K., De Robertis A., Tuttle V. (2015). Effect of underwater lighting on observations of density and behavior of rockfish during camera surveys. Fish. Res. 172, 157–167. doi: 10.1016/j.fishres.2015.07.012
Russell V. L. (2021) Emmeans: Estimated marginal means, aka least-squares means. r package version 1.7.0. Available at: https://CRAN.R-project.org/package=emmeans.
Santos J., Herrmann B., Stepputtis D., Kraak S. B. M., Gökçe G., Mieske B. (2020). Quantifying the performance of selective devices by combining analysis of catch data and fish behaviour observations: methodology and case study on a flatfish excluder. ICES J. Mar. Sci. 77, 2840–2856. doi: 10.1093/icesjms/fsaa155
Sévigny J.-M., Méthot R., Bourdages H., Power D., Comeau P. (2007). Review of the structure, the abundance and distribution of sebastes mentella and s. fasciatus in Atlantic Canada in a species-at-risk context: an update. DFO can. sci. advis. sec. res. doc. 2007/085.
Silva C. N. S., Broadhurst M. K., Dias J. H., Cattani A. P., Spach H. L. (2012). The effects of nordmøre-grid bar spacings on catches in a Brazilian artisanal shrimp fishery. Fish. Res. 127–128, 188–193. doi: 10.1016/J.FISHRES.2012.01.004
Sistiaga M., Herrmann B., Grimaldo E., Larsen R. B., Olsen L., Brinkhof J., et al. (2017). Combination of a sorting grid and a square mesh panel to optimize size selection in the north-East Arctic cod (Gadus morhua) and redfish (Sebastes spp.) trawl fisheries. ICES J. Mar. Sci. 75 (3), 1105–1116. doi: 10.1093/icesjms/fsx231
Underwood M., Winger P. D., Fernø A., Engås A. (2015). Behavior-dependent selectivity of yellowtail flounder (Limanda ferruginea) in the mouth of a commercial bottom trawl. Fish. Bull. 113, 430–441. doi: 10.7755/FB.113.4.6
Veiga-Malta T., Breddermann K., Feekings J. P., Krag L. A., Paschen M. (2020). Understanding the hydrodynamics of a size sorting grid in a crustacean fishery. Ocean Eng. 198, 106961. doi: 10.1016/J.OCEANENG.2020.106961
Widder E. A., Robison B. H., Reisenbichler K. R., Haddock S. H. D. (2005). Using red light for in situ observations of deep-sea fishes. Deep-Sea Res. I: Oceanogr. Res. Pap. 52 (11), 2077–2085. doi: 10.1016/j.dsr.2005.06.007
Wileman D. A., Ferro. R. S. T., Fonteyne R., Millar R. B. (1996). Manual of methods of measuring the selectivity of towed fishing gears. ICES coop. research rep. no. 215. 126.
Winger P. D., DeLouche H., Legge G. (2006). Designing and testing new fishing gears: The value of a flume tank. Mar. Technol. Soc. J. 40 (3), 44–493. 10.4031/002533206787353240
Keywords: bycatch, bottom trawl, morphometric, video, bar spacing
Citation: Araya-Schmidt T, Bayse SM, Winger PD and Santos MR (2022) Juvenile redfish (Sebastes spp.) behavior in response to Nordmøre grid systems in the offshore northern shrimp (Pandalus borealis) fishery of Eastern Canada. Front. Mar. Sci. 9:920429. doi: 10.3389/fmars.2022.920429
Received: 14 April 2022; Accepted: 05 September 2022;
Published: 23 September 2022.
Edited by:
Valentina Melli, Technical University of Denmark, DenmarkReviewed by:
Roger B. Larsen, UiT The Arctic University of Norway, Norway;Junita D. Karlsen, Technical University of Denmark, DenmarkCopyright © 2022 Araya-Schmidt, Bayse, Winger and Santos. This is an open-access article distributed under the terms of the Creative Commons Attribution License (CC BY). The use, distribution or reproduction in other forums is permitted, provided the original author(s) and the copyright owner(s) are credited and that the original publication in this journal is cited, in accordance with accepted academic practice. No use, distribution or reproduction is permitted which does not comply with these terms.
*Correspondence: Tomas Araya-Schmidt, VG9tYXMuU2NobWlkdEBtaS5tdW4uY2E=
Disclaimer: All claims expressed in this article are solely those of the authors and do not necessarily represent those of their affiliated organizations, or those of the publisher, the editors and the reviewers. Any product that may be evaluated in this article or claim that may be made by its manufacturer is not guaranteed or endorsed by the publisher.
Research integrity at Frontiers
Learn more about the work of our research integrity team to safeguard the quality of each article we publish.