 Konstantinos Tsagarakis1*
 Simone Libralato2
 Marianna Giannoulaki3Konstantinos Touloumis4
 Stylianos Somarakis3
 Athanassios Machias1
 Constantin Frangoulis5
 Georgia Papantoniou1
 Stefanos Kavadas1
 Maria Th. Stoumboudi1
- 1Institute of Marine Biological Resources and Inland Waters, Hellenic Centre for Marine Research, Attica, Greece
- 2Section of Oceanography, National Institute of Oceanography and Applied Geophysics - OGS, Trieste, Italy
- 3Institute of Marine Biological Resources and Inland Waters, Hellenic Centre for Marine Research, Heraklion, Greece
- 4Fisheries Research Institute, Hellenic Agricultural Organization - DIMITRA, Kavala, Greece
- 5Institute of Oceanography, Hellenic Centre for Marine Research, Heraklion, Greece
Ecosystem models are important tools for the implementation of Ecosystem Based Fisheries Management (EBFM), especially in highly exploited ecosystems affected by climate change, such as the Mediterranean Sea. Herein, we present the development of an Ecopath ecosystem model for the North Aegean Sea (Eastern Mediterranean) in the early 1990s, as well as the parameterization of the temporal dynamic module (Ecosim) after fitting to catch and relative biomass time series for the period 1993-2020. The Ecosim model included as drivers (i) fishing, assuming a technology creep factor of 2% annual increase (0.79% for bottom trawls), (ii) Sea Surface Temperature, (iii) trophic interactions and (iv) a Primary Production (PP) Anomaly which was positively correlated with the North Atlantic Oscillation of the previous year, highlighting the synergistic effect of environmental and anthropogenic processes during the three-decades hindcast period. Trends in biomasses, catches and ecosystem indicators were characterized by a decline from 1993 to 2010 and a strong recovery thereafter. Sea warming scenarios for the period 2021-2050 indicated contrasting responses to increased temperature among the main commercial groups, while simulations of changes in productivity had relatively straightforward effects. Two scenarios of 10% and 25% reduction in fishing effort revealed quick increases in the biomass of most commercial species, though coupled with lower catches due to reduced fishing, except for few groups that their population increase was remarkably high. Although the 25% effort reduction resulted in high recoveries in the short term, it didn’t necessarily lead to constantly high biomasses resulting in reduced catches towards the end of the forecast period for some groups, in contrast to the 10% reduction. When impacts of reduced productivity were added to temperature effects, the model forecasted lower biomass increases for the winners of sea warming and even higher decreases for the losers. Biomass losses were compensated by a 10% reduction in fishing effort, but this was not overall enough to counterbalance losses in catches. The model developed here contributes to better elucidate observed changes in the past and to hind directions of change in future simulations, as well as to advance EBFM in the area.
1 Introduction
The inclusion of ecosystem considerations in fisheries contributes to more effective management and enables accounting for trade-offs (Link, 2010a; Bundy et al., 2017). Although there is a lack of global consensus on the exact meaning of Ecosystem Based Fisheries Management (EBFM) (Trochta et al., 2018), it is often perceived as a holistic approach which integrates in its core concept the consideration of multispecies interactions, anthropogenic stresses and ecosystem processes (e.g. climate, habitats and other environmental factors), relies on good governance and scientific advice and aims in maintaining biodiversity and productivity while achieving sustainable yields (e.g. Larkin, 1996; Link, 2002; Pitcher et al., 2009; Trochta et al., 2018).
In the Mediterranean Sea, the implementation of EBFM is relatively poor (Lockerbie et al., 2020), fisheries resources are characterized by poor management effectiveness (e.g. Melnychuk et al., 2021) and governance quality (Bundy et al., 2017) and the majority of stocks are overexploited (Colloca et al., 2017; FAO, 2020). Mediterranean fisheries are mainly multi-species and multi-gear, operated by a mixture of relatively few semi-industrial and numerous artisanal vessels (FAO, 2020), resulting in a management system very different from the adjacent Northeast Atlantic (Smith and Garcia, 2014). Therefore, fisheries management in the Mediterranean is challenging and needs to be reconsidered, despite some recent signs of improvement (FAO, 2020).
In addition, the Mediterranean region is considered one of the most vulnerable areas to climate change (Giorgi and Lionello, 2008) with documented effects on specific stocks (Colloca et al., 2014), total landings (Tzanatos et al., 2014), landings’ traits (Tsimara et al., 2021) and marine ecosystems (Corrales et al., 2017). Apart from the increase in sea water temperature, climate change is expected to affect precipitation and river runoffs, increase stratification in the basin and alter water circulation (e.g. Reale et al., 2020) with impacts on productivity and species composition (Hidalgo et al., 2018). In the Western Mediterranean these changes seem to lead to more oligotrophic conditions, while in the eastern basin the productivity is likely to increase and the ecosystem seems to be more impacted by species invasions and direct effects of the temperature increase (e.g. Macias et al., 2015; Hidalgo et al., 2018). However, the uncertainty related to such projections is high and there are studies which conclude that productivity is likely to decrease in the eastern basin as well (e.g. Richon et al., 2019).
Taking these into account, the implementation of EBFM is even more necessary as it can help maintain resource resilience and avoid climate-driven collapses (Holsman et al., 2020). In this framework, ecosystem models are important tools as they can simulate a large set of ecosystem processes and fishing impacts in a tailor-made approach for the ecosystem(s) under consideration (Geary et al., 2020). The Ecosim with Ecopath (EwE) modelling approach has been used in numerous applications for supporting EBFM worldwide (Colléter et al., 2015) and in the Mediterranean (Coll and Libralato, 2012). Among others, policy simulations have been applied to explore the ecological and economic effects of the Landing Obligation in the Adriatic Sea (Celić et al., 2018), environmental scenarios have been set to explore possible effects of climate change in the Eastern Mediterranean (Corrales et al., 2018) and several applications aimed at exploring the effect of fishing, including in regions of the Aegean Sea (e.g. Papapanagiotou et al., 2020; Papantoniou et al., 2021; Dimarchopoulou et al., 2022).
The Aegean Sea (Eastern Mediterranean Sea) ecosystem and fisheries have undergone considerable changes during the past decades. A peak in official landings was observed in 1994 followed by a decline which persisted for several years (ELSTAT, 2021). A climate-related regime shift in the early 1990s, reflected in the evolution of landings, has been recently reported (Damalas et al., 2021). In addition, despite the reduction of the fleet since 1990s vs gradual retraction of vessels with the aim to controlling fishing effort, fisheries resources have been heavily exploited (Tsikliras et al., 2013). Disentangling the effect of the factors that have contributed toward the observed directions is important not only for deciding on short-term management measures but also for the design of long-term strategies after taking into account the changing environmental conditions.
In this work we developed and applied an ecosystem model for the North Aegean Sea with the aim to (i) explain part of the changes observed during the hindcast period (1993-2020), and (ii) perform climate change simulations and fishing effort scenarios. To this end, we present the development of an Ecopath mass-balance model (Christensen and Walters, 2004) for the early 1990s (setting 1993 as the base year), based on a model previously built for a data rich period (mid-2000s; Tsagarakis et al., 2010). Furthermore, the time-dynamic module (Ecosim) was developed and calibrated after fitting to catch and relative biomass time series and by exploring Sea Surface Temperature (SST), fishing and a model-derived Primary Production (PP) Anomaly as ecosystem drivers.
2 Materials and Methods
2.1 Updated Ecopath Model
The Ecopath with Ecosim approach (EwE) (Christensen and Walters, 2004) version 6 was used to describe the North Aegean Sea ecosystem (Eastern Mediterranean, Greece). Ecopath is a mass-balance model which provides a snapshot of an ecosystem and the initial conditions for the time dynamic simulations with Ecosim. Ecopath has been widely used to describe ecosystem structure and functioning. The energy balance within each Functional Group (FG, composed of single species, group of species sharing similar ecological features or different developmental stages of a species) is ensured through two linear equations:
Respiration in eq. (2) does not represent the physiological respiration but the part of the consumption that is not used for production or recycled as feces or urine (Christensen et al., 2008). For each FG, the input required is diet, exports by different fishing activities including by-catch and discards, as well as three out of the four basic parameters: biomass (B), production rate (P/B), consumption rate (Q/B), and Ecotrophic Efficiency (EE; fraction of the production that is used within the system). More details on the Ecopath equations and methodology are provided in the Supplementary material Section A.
The modeled ecosystem (North Aegean Sea: Strymonikos Gulf and Thracian Sea; Figure 1) covers 8374 km2 and is the major fishing ground in Greece, where ~30% of the Greek capture fisheries are produced (ELSTAT, 2021). The area boundaries include the continental shelf (>20 m) and the upper slope (<300 m) of the North Aegean Sea, limited by national borders in the east. We used an Ecopath model describing the ecosystem in the mid-2000s (i.e. 2003-2006; Tsagarakis et al., 2010; NAS2000 model hereafter) as a basis to construct a model representing the ecosystem in the early ‘90s (1991-1993; NAS1990 model hereafter). The mid 2000s represent a relatively data rich period as the Greek Data Collection Program (under Data Collection Regulation, DCR - Regulation (EC) 1543/2000 - and later Data Collection Framework, DCF - Regulation (EC) 199/2008) was established providing good quality information for several aspects of the fisheries sector (e.g. landings and discards quantities and composition, species composition and abundance from research surveys) in contrast to the earlier period when most surveys were sporadic, and information was relying on short-term projects. Therefore, a considerable amount of the parameters used to construct the data rich NAS2000 model were complementary used with information on species abundance and catches from earlier surveys (Supplementary Material Table S1) to set the basis for model development in an earlier time period. The rationale behind the construction of the NAS1990 Ecopath model was to improve the calibration of the Ecosim model (Heymans et al., 2016) by extending at maximum the hindcast period and thus exploiting the existence of survey and fisheries data since the early ‘90s. This permits to create a robust tool able to explore research questions especially in respect to large scale climatic patterns (see below the description of Ecosim).
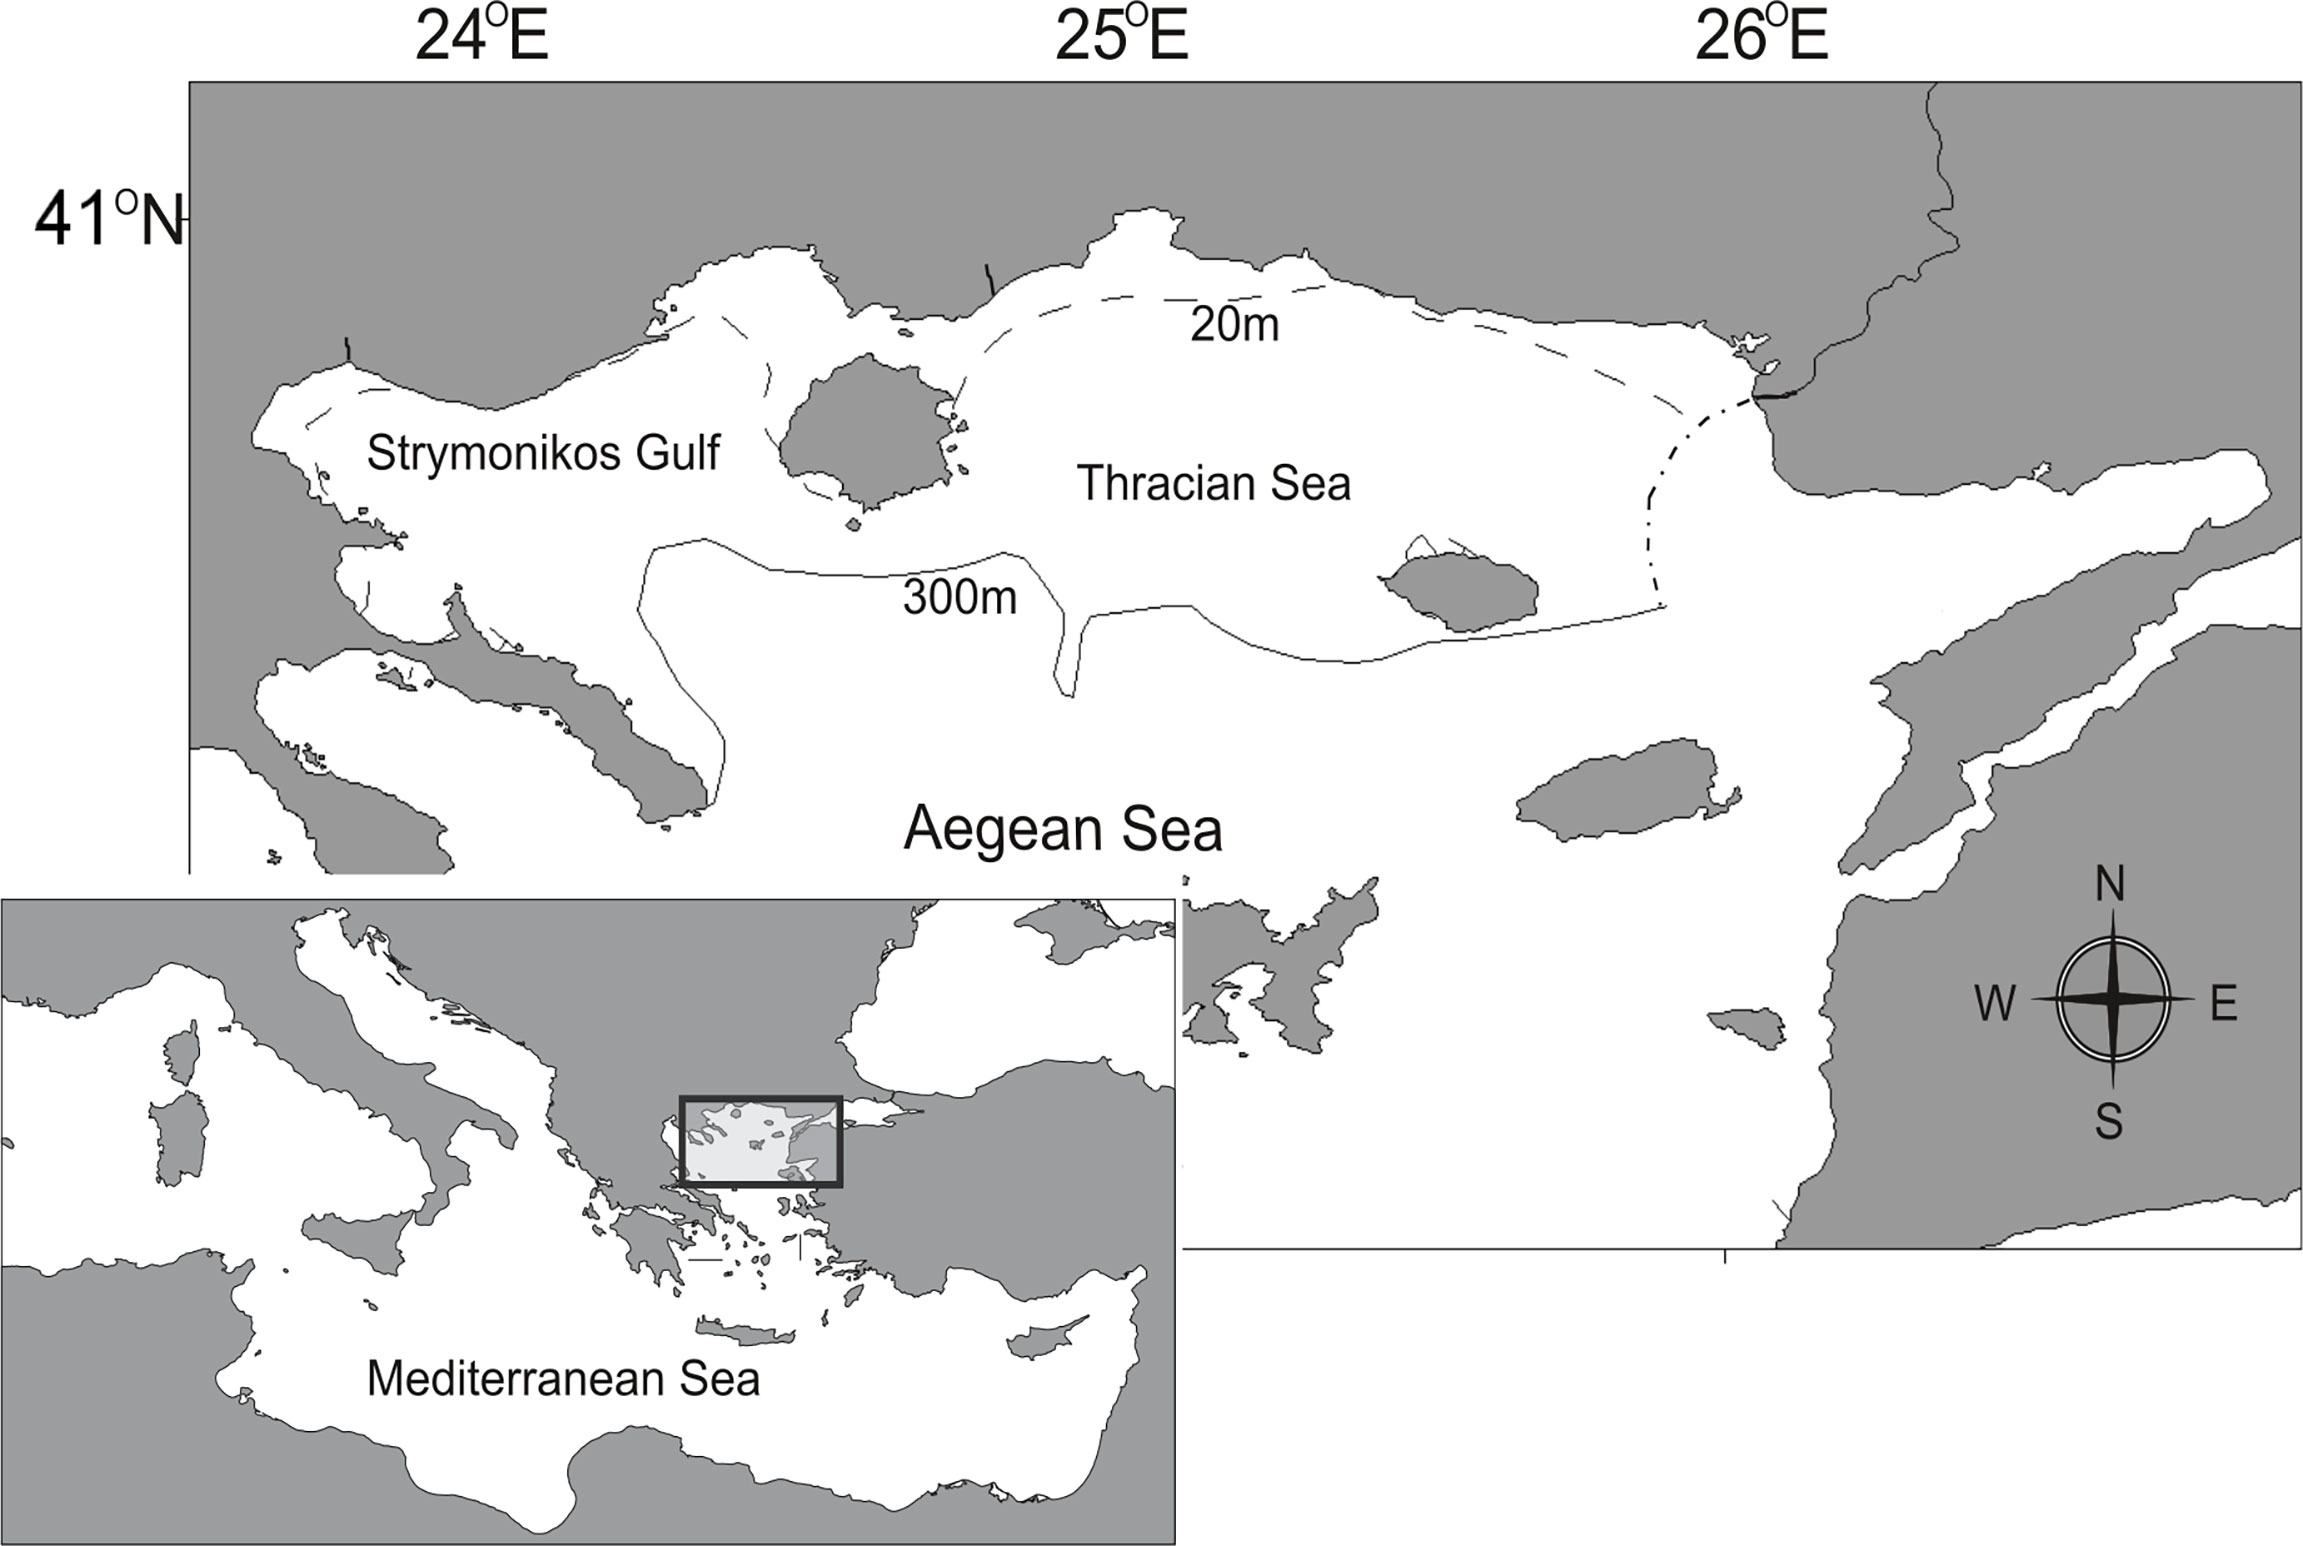
Figure 1 The North Aegean Sea (Strymonikos Gulf and Thracian Sea) model area.
Biomass flows of the N. Aegean model were expressed as t·km-2·yr-1 and biomasses as t·km-2 of wet weight. For all modelled groups, EE was the missing parameter and was estimated by EwE solving the system of equations on the basis of known input values for B, (P/B) and (Q/B) as suggested by best practices on EwE model development (Christensen and Walters, 2004; Heymans et al., 2016). The NAS1990 model parameterization is shown in Table 1.
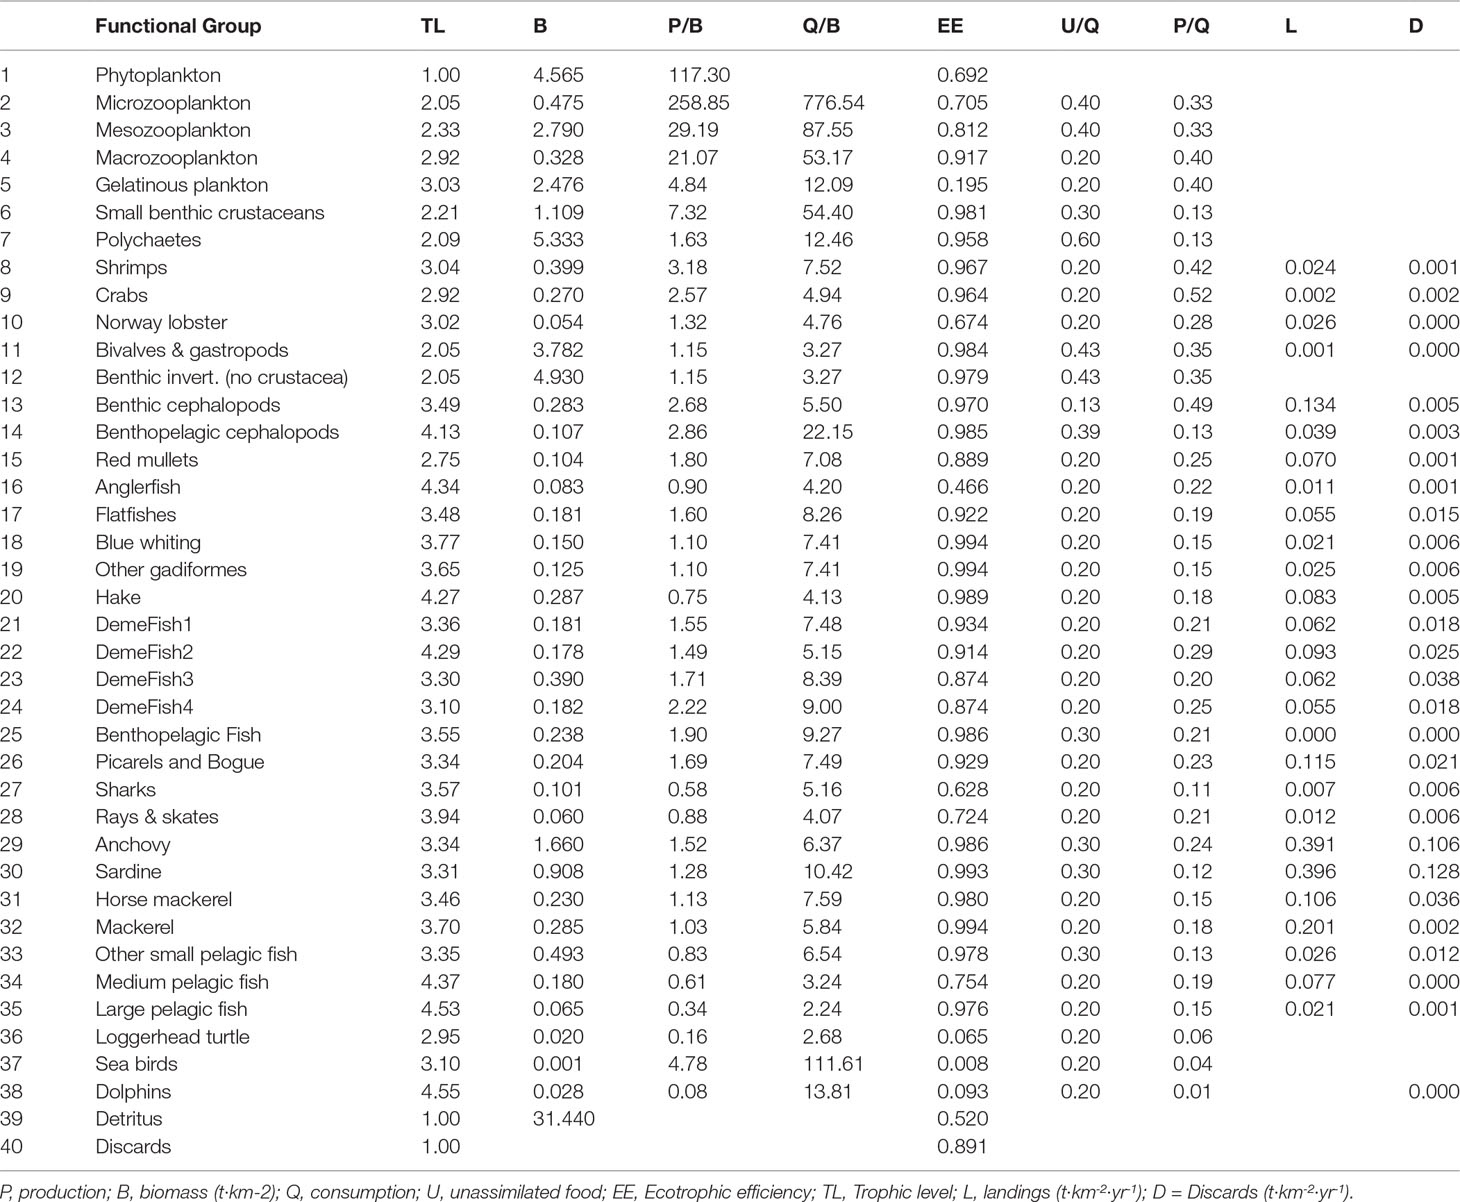
Table 1 Functional groups and basic parameters of the Ecopath model.
The NAS1990 model has 40 FGs with emphasis on commercial species (5 planktonic FGs, 9 commercial and non-commercial demersal and benthic invertebrate FGs, 21 fish FGs, seabirds, dolphins, sea turtles, detritus and discards). The definition of FGs was mainly based on habitat (e.g., demersal/pelagic), taxonomic and feeding (grouping based on diet information) criteria, as described in Tsagarakis et al. (2010) and has an only slightly modified structure in comparison to the NAS2000 model. Specifically, contrary to Tsagarakis et al. (2010), the NAS1990 model (Table 1) (i) considered no multi-stanza groups for anchovy and sardine, (ii) described Blue whiting and Gastropods & Bivalves in dedicated groups and (iii) included cuttlefish in the Benthopelagic cephalopods group instead of the Benthic cephalopods.
The origin of information for the updated model is summarized in the Supplementary Material Table S1. Data from seasonal bottom trawl surveys from the period 1991-1993 (Labropoulou and Papaconstantinou, 2000; Labropoulou and Papaconstantinou, 2004), were used to estimate the biomass of demersal and benthic fish as well as that of some megafaunal benthic/demersal invertebrates using the swept-area method (i.e., estimation of biomass per area sampled by trawling), in line with Tsagarakis et al. (2010). For small pelagic fish, in the absence of surveys during the model period, average biomass estimates were extrapolated from acoustic surveys in a succeeding period (Tsagarakis et al., 2015; Leonori et al., 2021). Dolphins’ biomass was updated with recent estimates from aerial surveys (Tsagarakis et al., 2021), macrozooplankton biomass was updated based on Frangoulis et al. (2017), while biomass values from the 2000s model were retained for the few remaining FGs (mainly some plankton groups, benthic invertebrate groups and Loggerhead turtle and Sea birds; Supplementary Material Table S1).
For each species, production (P/B) and consumption (Q/B) values were retrieved from the literature or estimated based on empirical equations (Pauly, 1980; Innes et al., 1987; Pauly et al., 1990; Trites et al., 1997; ICES, 2000) as described in detail in Tsagarakis et al. (2010), while for multispecies FGs these values were weighted with the relative biomass (or with relative landings when biomass information was not available) of each species within the FG during the period 1991-1993. Input for diet composition was based on literature (for details, see: Tsagarakis et al., 2010) updated with more recent published information when available (e.g. for sardine and anchovy diet: Nikolioudakis et al., 2012; Nikolioudakis et al., 2014). The resulting diet matrix of the 1990s Ecopath model is shown in the Supplementary Material Table S2.
The model includes five commercial fishing fleets (trawls, purse seines, static nets, longlines & troll baits and pots & traps). Fisheries production in the region derived from the Hellenic Statistical Authority (ELSTAT, 2021) which reports annual catch per species or group, explicitly for bottom trawls and purse seines but aggregated for all artisanal gears. Therefore, breakdown into separate gears was done for artisanal gears using catch composition information from a later period, collected under the DCR (Kavadas et al., 2013). DCR information was also used for the estimation of discard quantities, through species- and gear-specific discard ratios from data collected onboard commercial vessels (e.g. Tsagarakis et al., 2012; Tsagarakis et al., 2017).
The pre-balance (PREBAL) diagnostics (Link, 2010b) were inspected to ensure that the Ecopath model complies with ecological rules. The FGs with the higher EE values before balancing (Supplementary Material Table S3) mainly included (i) FGs the biomass of which may be underestimated in bottom trawl surveys (Benthopelagic fish and Cephalopods), ii) relatively small-sized fish and commercial invertebrates (shrimps, crabs, mixed fish groups), as well as iii) FGs with poor biomass data for the specific period or area (e.g., Horse mackerels, Polychaetes). To achieve mass-balance we corrected our inputs mainly concerning (a) the diet matrix, by also taking into account expert knowledge especially for groups for which information was not originally from the modelled area, and (b) biomasses, especially for groups for which the sampling method is known to produce an underestimate. The model was considered balanced when (a) estimated EE values were realistic (<1), (b) gross food conversion efficiency was<0.5 (usually >0.1 and<0.35 with the exception of some fast-growing species or groups with higher values, and top predators with lower ones), and (c) values of Respiration/Biomass were consistent with the group’s activities with high values for small organisms and top predators (Christensen et al., 2008; Link, 2010b; Heymans et al., 2016). The Pedigree routine, which allows the user to mark the data origin using pre-defined tables and can provide input for uncertainty analysis in Ecosim (Christensen and Walters, 2004), was used to categorize data quality for each parameter according to the sources of information.
2.2 Ecosim
Ecosim is the time dynamic simulation of the initial parameters of the base Ecopath model. This is achieved through a series of coupled differential equations derived from the Ecopath master equation which take the form (Christensen et al., 2008):
where dBi/dt represents the growth rate during the time interval dt of group (i) in terms of its biomass Bi, gi is the net growth efficiency (production/consumption ratio), Q is the consumption flow, MOi the non-predation (‘other’) natural mortality rate, qik is the catchability term of fleet k on species i, Ek is the relative effort of fleet k, ei is emigration rate and Ii is immigration rate. For primary producers the positive term on the right side of Eq. 3 is represented by a function of production rate (P/B), biomass of autotrophs and production anomaly over time. Usually, primary production anomaly and effort by gear over time are main forcings used in time dynamic Ecosim simulations (see Araújo et al., 2006).
The two summations estimate consumption rates, the first expressing the total consumption by group (i) on all of its preys (j), and the second the predation by all predators (j) on the same group (i). The consumption rates, Qji, are calculated based on the ‘foraging arena’ concept:
where prey biomasses Bi’s over time (t) are divided dynamically into “vulnerable” and “invulnerable” components, and it is the transfer rate (vij; vulnerability parameter) between these two components that determines if control is top-down, bottom-up, or of an intermediate type (Christensen et al., 2008). The default vulnerability value is 2 (mixed control), while low values (close to 1) indicate bottom-up control and high values top-down effect. Regarding the remaining terms of eq. (4), aij is the effective search rate for prey (i) by predator (j), Pj is the predator abundance over time (t), Ti and Tj is the prey and predator relative feeding time, Mij is mediation effects, and Dj effects of handing time as a limit to consumption rate (Christensen and Walters, 2004; Ahrens et al., 2012).
2.2.1 Model Fitting and Parameterization
The aim of the Ecosim development was twofold: first, to explore which factors have contributed to the observed changes during the hindcast period (1993-2020), and second, to apply the calibrated model for future projections under different environmental and fisheries scenarios. Therefore, climate change, environmental variations, fisheries and their synergistic effect were tested as potential drivers, together with tuned trophic interactions among FGs. The North Aegean Sea Ecosim module was parameterized after fitting the model to time series for the hindcast period. Specifically, the time series included (i) relative biomass for 17 fish, decapod and cephalopod FGs from bottom trawl (MEDITS; Spedicato et al., 2019) and acoustic (MEDIAS; Leonori et al., 2021) surveys in the area, as well as (ii) catches for 25 FGs which were estimated from landings (ELSTAT, 2021) and discard ratios from DCR/DCF (Supplementary Material Table S4).
The model was fitted by modifying trophic interactions which are based on the foraging arena theory (Ahrens et al., 2012): the software’s routines were used to carry out i) a sensitivity analysis to identify the most sensitive vulnerabilities by predator (i.e., one vulnerability was used for all preys of the same predator, in order to reduce the number of estimated parameters) and ii) to alter the most sensitive vulnerabilities in order to best fit the observations in terms of time series of biomasses and catches by species. Different fittings were tried considering different sets of forcings in terms of fishing effort, temperature effects and Primary Production (PP) Anomaly.
Actual estimates of fishing effort (e.g., annual days-at-sea) were not available for the whole hindcast period, therefore, three indices of fishing capacity (i.e., number of vessels, total GT and total KW per fleet) were tested as proxies of the fishing effort. A considerable reduction (by 35-40%) in the number of vessels operating in the area has been observed since 1993 for bottom trawls, static nets, longlines & troll baits, while pots & traps show a 5-fold increase and purse seines have remained relatively stable (Supplementary Material Figure S1). To take into account the possible improvement in the efficiency of fishing gears due to any form of technological development (known as “technology creep”), a factor of +0.79% per year was assumed for bottom trawls (as estimated by Damalas et al., 2014) and added to the proxy for effort of each year. For the remaining fishing gears for which no information on gear efficiency improvement was available in the study area, alternative levels of the technology creep factor (0%, 1% and 2% per year) were tested based on available literature for the Mediterranean fisheries (Sartor et al., 2011) and elsewhere (Cardinale et al., 2009). The fishing effort for the hindcast period under different levels of technology creep is shown in Figure 2 as relative values (i.e., relative to the value in 1993 used as baseline year). Therefore, nine sets of fishing effort time series (3 indices of capacity X 3 technology creep factors) were applied to select the one best describing the changes within the hindcast period, in terms of components’ biomasses and catches.
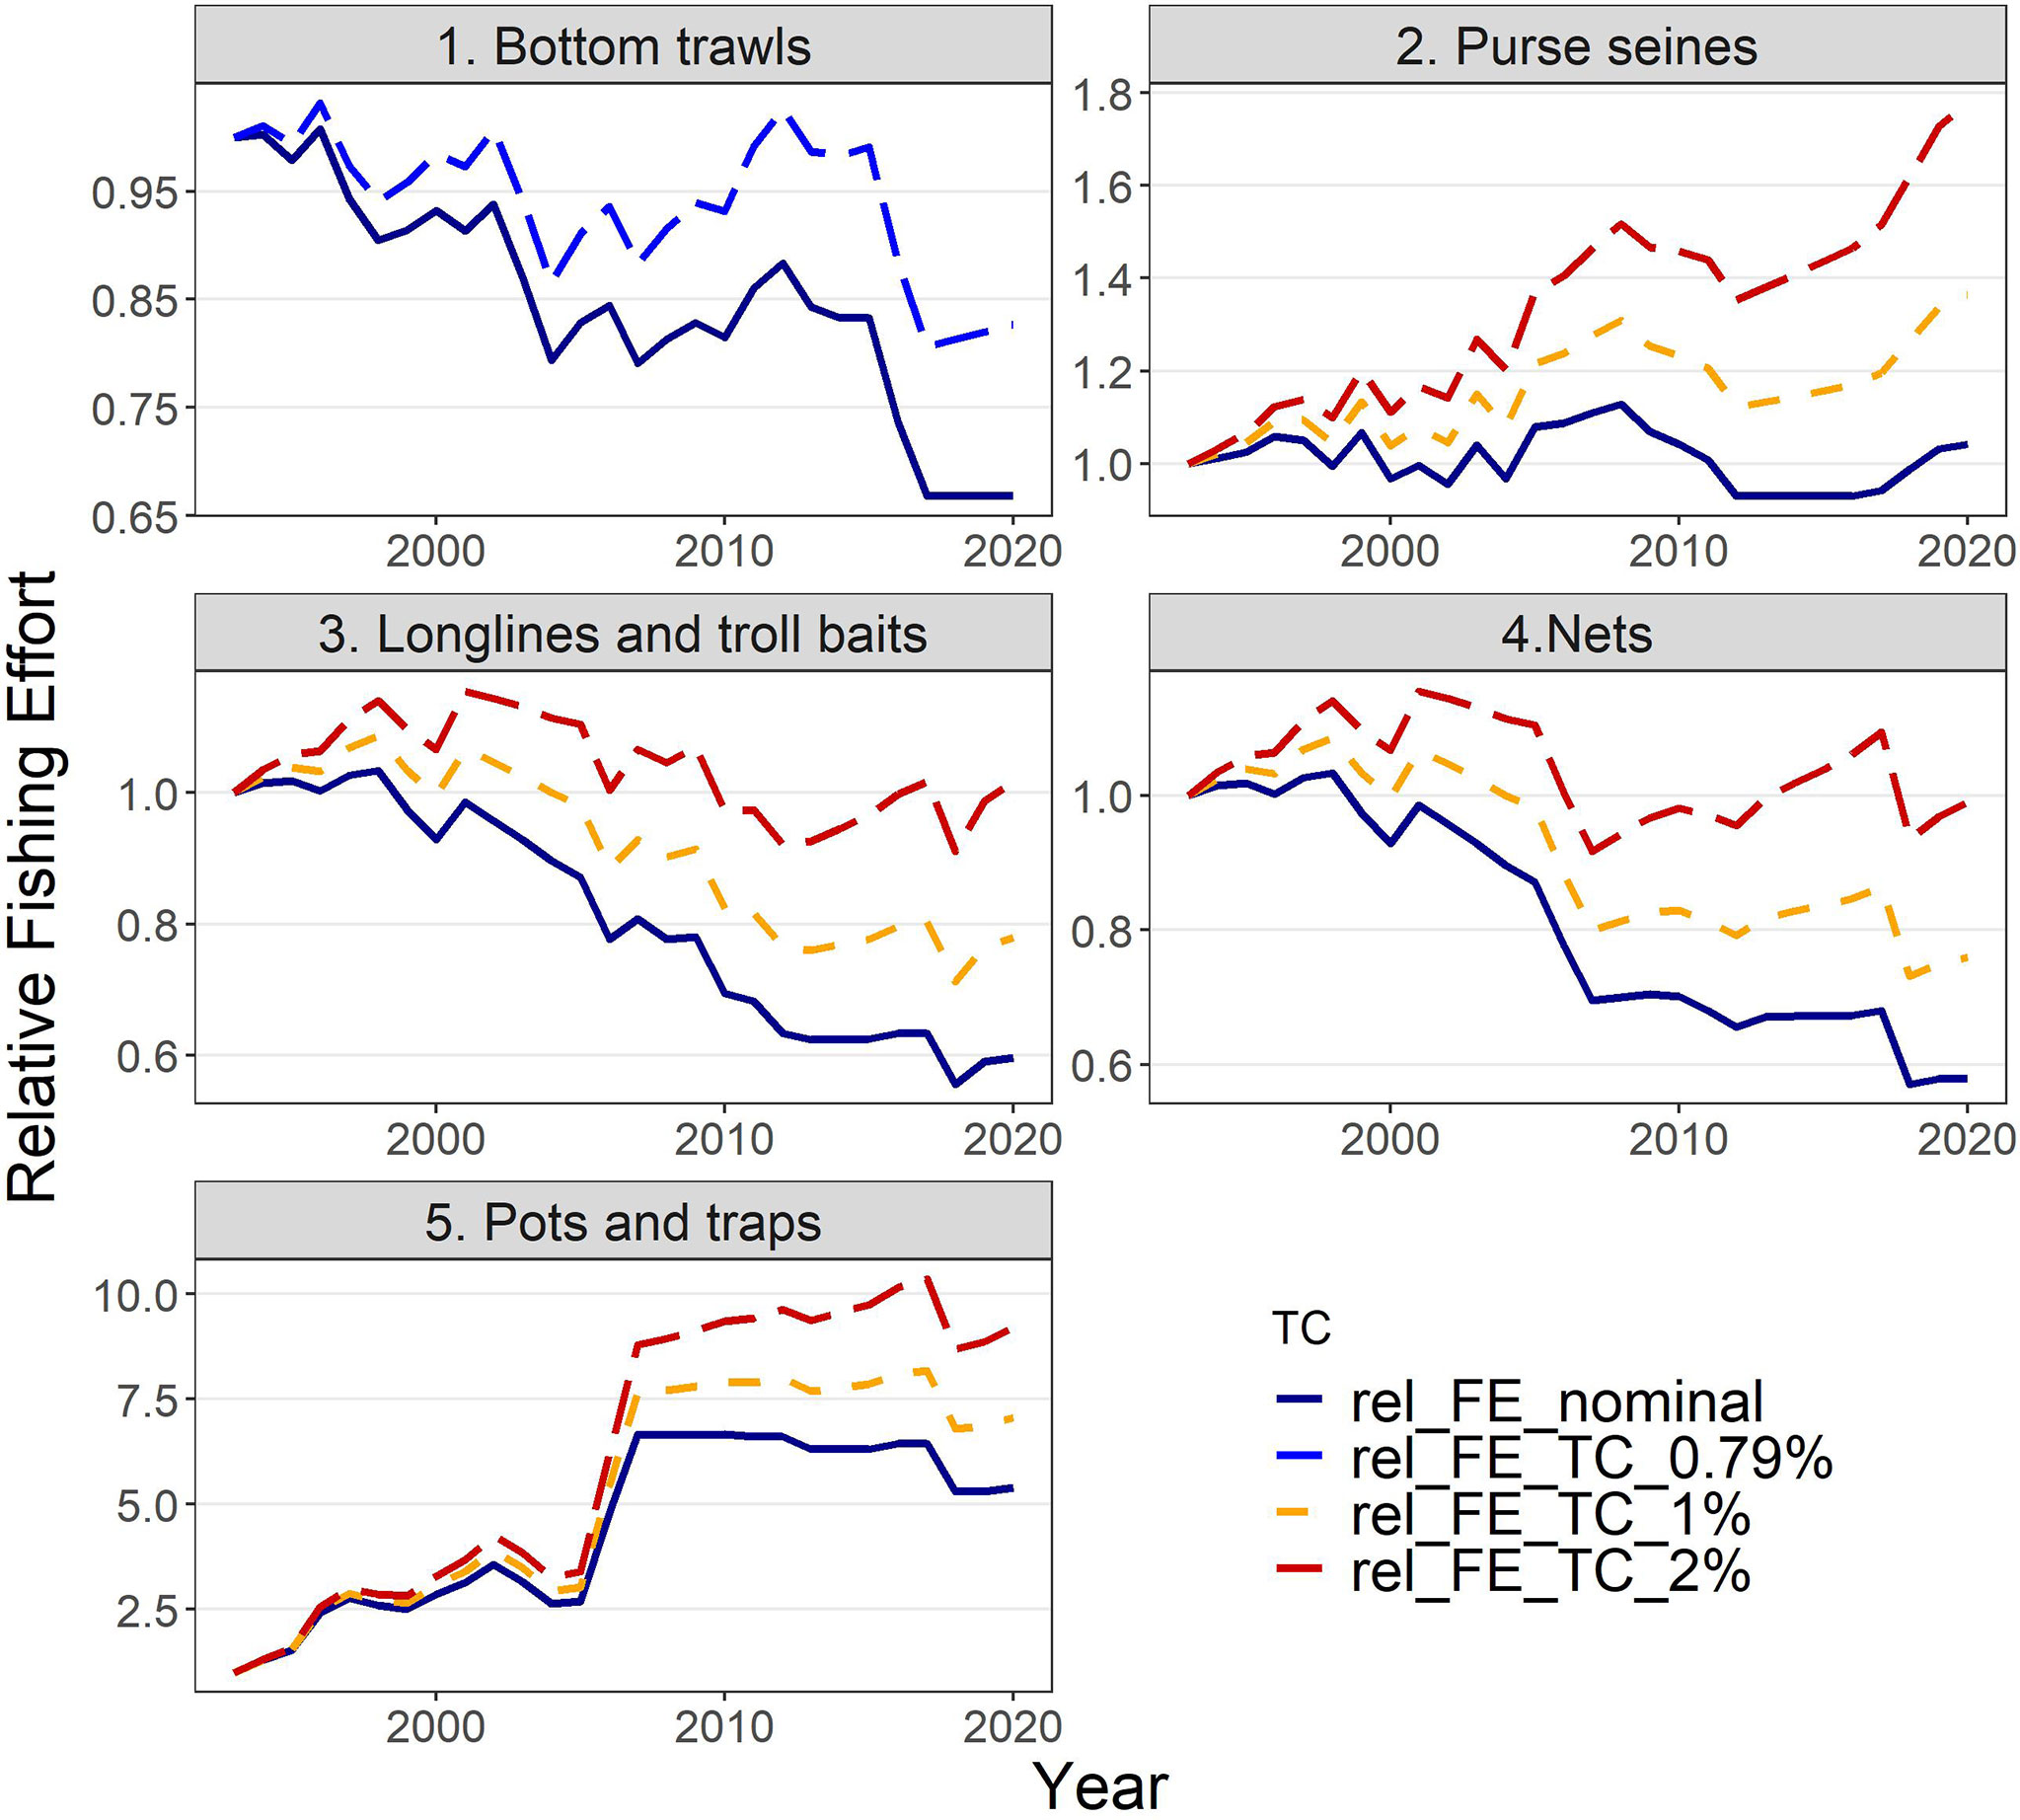
Figure 2 Relative fishing effort (rel_FE; in total GT) used to drive the model under different factors of technology creep (TC): (i) no technology creep (nominal), (ii) 0.79% annually only for bottom trawls, based on Damalas et al. (2014), (iii) 1% annually and (iv) 2% annually for the remaining fishing fleets.
Sea Surface Temperature (SST) foraging responses (Bentley et al., 2017) were incorporated in Ecosim for 28 out of 38 living FGs. AquaMaps (Kaschner et al., 2021) provides model-based predictions of species distribution using large sets of occurrence data to derive estimates of environmental preferences for a series of parameters, including temperature. Although in AquaMaps each species response function has a trapezoidal shape, the effect of SST in the N. Aegean Sea model was assumed to have a Gaussian-based shape, which has been widely used to describe thermal responses (Angilletta, 2006), including in similar studies (Bentley et al., 2017; Serpetti et al., 2017). Temperature preferences and limits for each species were retrieved from AquaMaps (Kaschner et al., 2021): optimum temperatures were estimated by averaging the 10th and 90th percentiles of the observed species-specific temperature variation, while minimum and maximum temperatures were used to build the range of thermal tolerance, which was not necessarily symmetric around the optimal (Figure 3). To simulate the latter in Ecosim, the SD left and SD right estimates were input in the response function leading to composite Gaussian-based responses with modified ranges. For multi-species FGs, the temperature parameters were estimated after weighing with the biomasses of individual species (or landings when biomass estimates were not available), for the species with at least 98% cumulative contribution of the total FGs biomass (Supplementary Material Table S5).
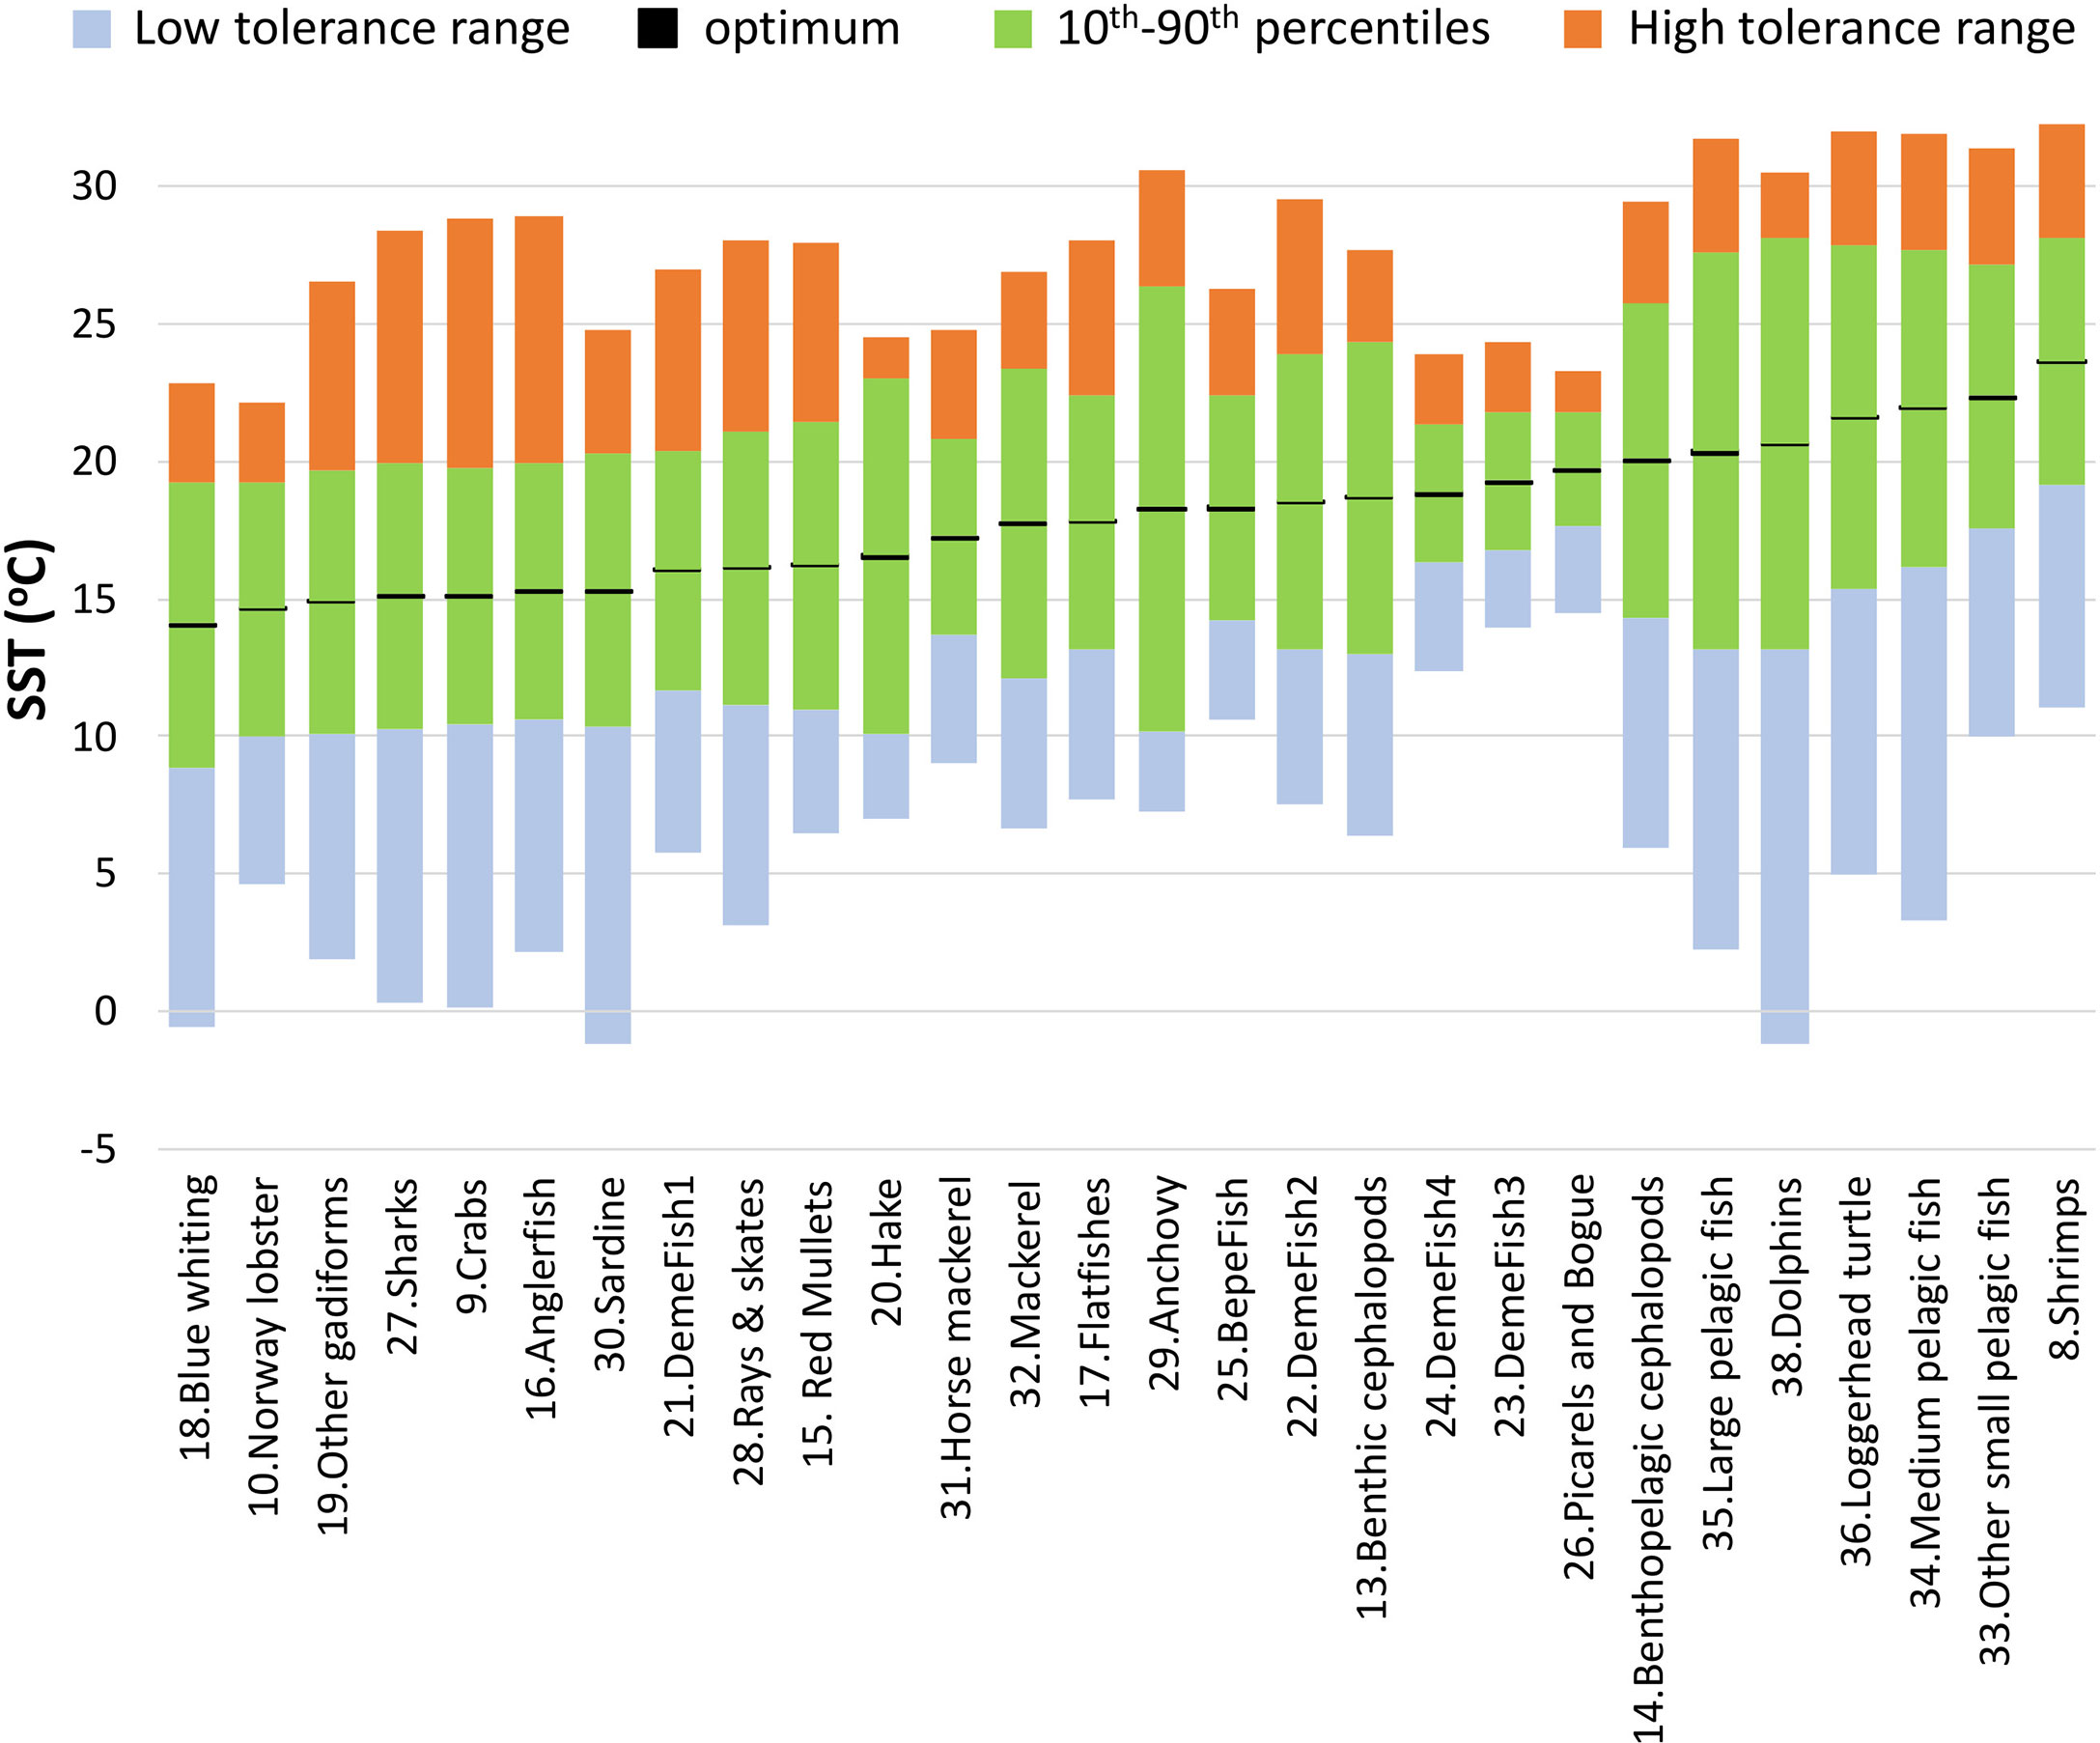
Figure 3 Optimum temperatures (black lines), 10th – 90th preference range (green bars), lower tolerance range (blue bars) and higher tolerance range (orange bars) that were used to parameterize thermal responses for each FG in the Ecosim model. FGs are ranked by increasing optimal temperature.
A PP Anomaly forcing function was applied to primary producers (i.e., Phytoplankton) and the software’s routine was used to search for the shape that urged the model to best describing the observations for the whole food web components (i.e., relative biomass and catch time series).
The automated stepwise fitting procedure (Scott et al., 2016) was applied to inspect model results for every possible combination of the parameters driving and affecting the model, namely (i) SST, (ii) Fishing effort, (iii) PP Anomaly (testing for different spline points but always ≥2, Heymans et al., 2016) - and (iv) Trophic Interactions (i.e. vulnerabilities; testing for different number of predators with altered vulnerability). The number of parameters (i.e. vulnerabilities and PP anomaly spline points) to be estimated never exceeded K-1 (where K is the number of independent time series available, i.e. 42 in the N. Aegean Sea model) in order to avoid overfitting under the general assumption of autocorrelation existing within each time series (Heymans et al., 2016). The best model was selected based on the minimization of the Akaike Information Criterion corrected for small number of observations (AICc), which takes into account the Sum of Squares (SS) among observed and predicted model outputs as well as parsimony in number of estimates as a goodness of fit criteria (Heymans et al., 2016).
In order to connect the model-derived PP Anomaly with environmental processes during the hindcast period, we explored its correlation with SST and with a series of large scale climatic indices which are known to affect the Mediterranean Sea (e.g. Katara et al., 2011; Tsikliras et al., 2019; Criado-Aldeanueva and Soto-Navarro, 2020), namely the Mediterranean Oscillation Index (MOI), the North Atlantic Oscillation (NAO) (accessed through the Climatic Research Unit, University of East Anglia: https://www.uea.ac.uk/groups-and-centres/climatic-research-unit) and the Atlantic Multi-decadal Oscillation (AMO) (Trenberth et al., 2019).
2.2.2 Monte Carlo Routine
The Monte-Carlo routine was used to take into account model uncertainty by exploring the effect of alternative Ecopath input (B, P/B, Q/B and Diets) on Ecosim best fitted simulations. The Ecosampler routine (Steenbeek et al., 2018) was used to record Ecopath models having alternative balanced initial conditions, to be used on the final selected best fitted Ecosim model and subsequently estimate the range of dispersion of the simulations. In total, 100 Monte-Carlo simulations were performed. The CV allowed to vary the Ecopath input parameters for B, P/B and Q/B was obtained from the Ecopath Pedigree (Supplementary Material Table S6). For Diets, the Dirichlet distribution method was used, setting a multiplier equal to 30, which was selected after plotting the Dirichlet distributions for different values of the multiplier (between 1 and 100) (for details see Steenbeek et al., 2018).
2.2.3 Climate, Productivity and Fishing Scenarios
After fitting the model (hindcast), eight scenarios representing future conditions were applied to explore the effect of the different drivers of the Ecosim model, i.e., SST, PP Anomaly and Fishing as well as selected combinations of them (Table 2). In order to identify potential winners and losers of climate change and management practices in different scenarios, predicted average biomasses and catches of the FGs in the medium (year 2030) and the long term (period 2046-2050) under each scenario were compared against the baseline one (with constant conditions as in 2020 for the whole projection period). In addition, the changes in the following ecosystem indicators was explored to detect possible effects in ecosystem structure, functioning and/or services: (i) total biomass of living FGs, (ii) total catch, (iii) Fishing-in-Balance (FiB) index (Christensen, 2000), (iv) Shannon diversity index, and (v) mean Trophic level of the catch (TLc).

Table 2 Scenarios applied for the future projections.
SST projections for the geographical boundaries of the model area were obtained from the CMIP5 (Coupled Model Intercomparison Project Phase 5) runs, accessed through the Royal Netherlands Meteorological Institute (KNMI) (KNMI Climate Explorer tool: https://climexp.knmi.nl/selectfield_cmip5.cgi?#ocean). The projections were used for the representation of temperature effects under climate change and were applied as forcing functions to SST foraging responses (Bentley et al., 2017). The MPI-ESM-LR model (Giorgetta et al., 2013) was chosen as giving a better representation of the ensemble (CERES, 2018) and as practiced in other Mediterranean studies (e.g. Chefaoui et al., 2018). Two SST scenarios (Table 2) were simulated based on Representative Concentration Pathways (RCP) of the Intergovernmental Panel on Climate Change (IPCC), with SST according (i) to RCP 4.5 (scenario RCP45 in Table 2), a moderate climate change scenario which assumes that some actions against climate change are taken, and (ii) to RCP 8.5 (scenario RCP85) which is the worst-case scenario as it assumes that no actions are taken. An increase in temperature has been already observed during the hindcast period and continues after 2020 in both RCP scenarios (Figure 4). The SST predictions between RCP 4.5 and RCP 8.5 diverge more after 2050 when the temperature increase slows down in the former contrary to the latter scenario. Nevertheless, we chose to simulate the effects up to 2050 because the uncertainty associated with temperature predictions as well as with adaptations of organisms to extreme temperatures of the RCP 8.5 scenario after 2050 may lead to unrealistic forecasts.
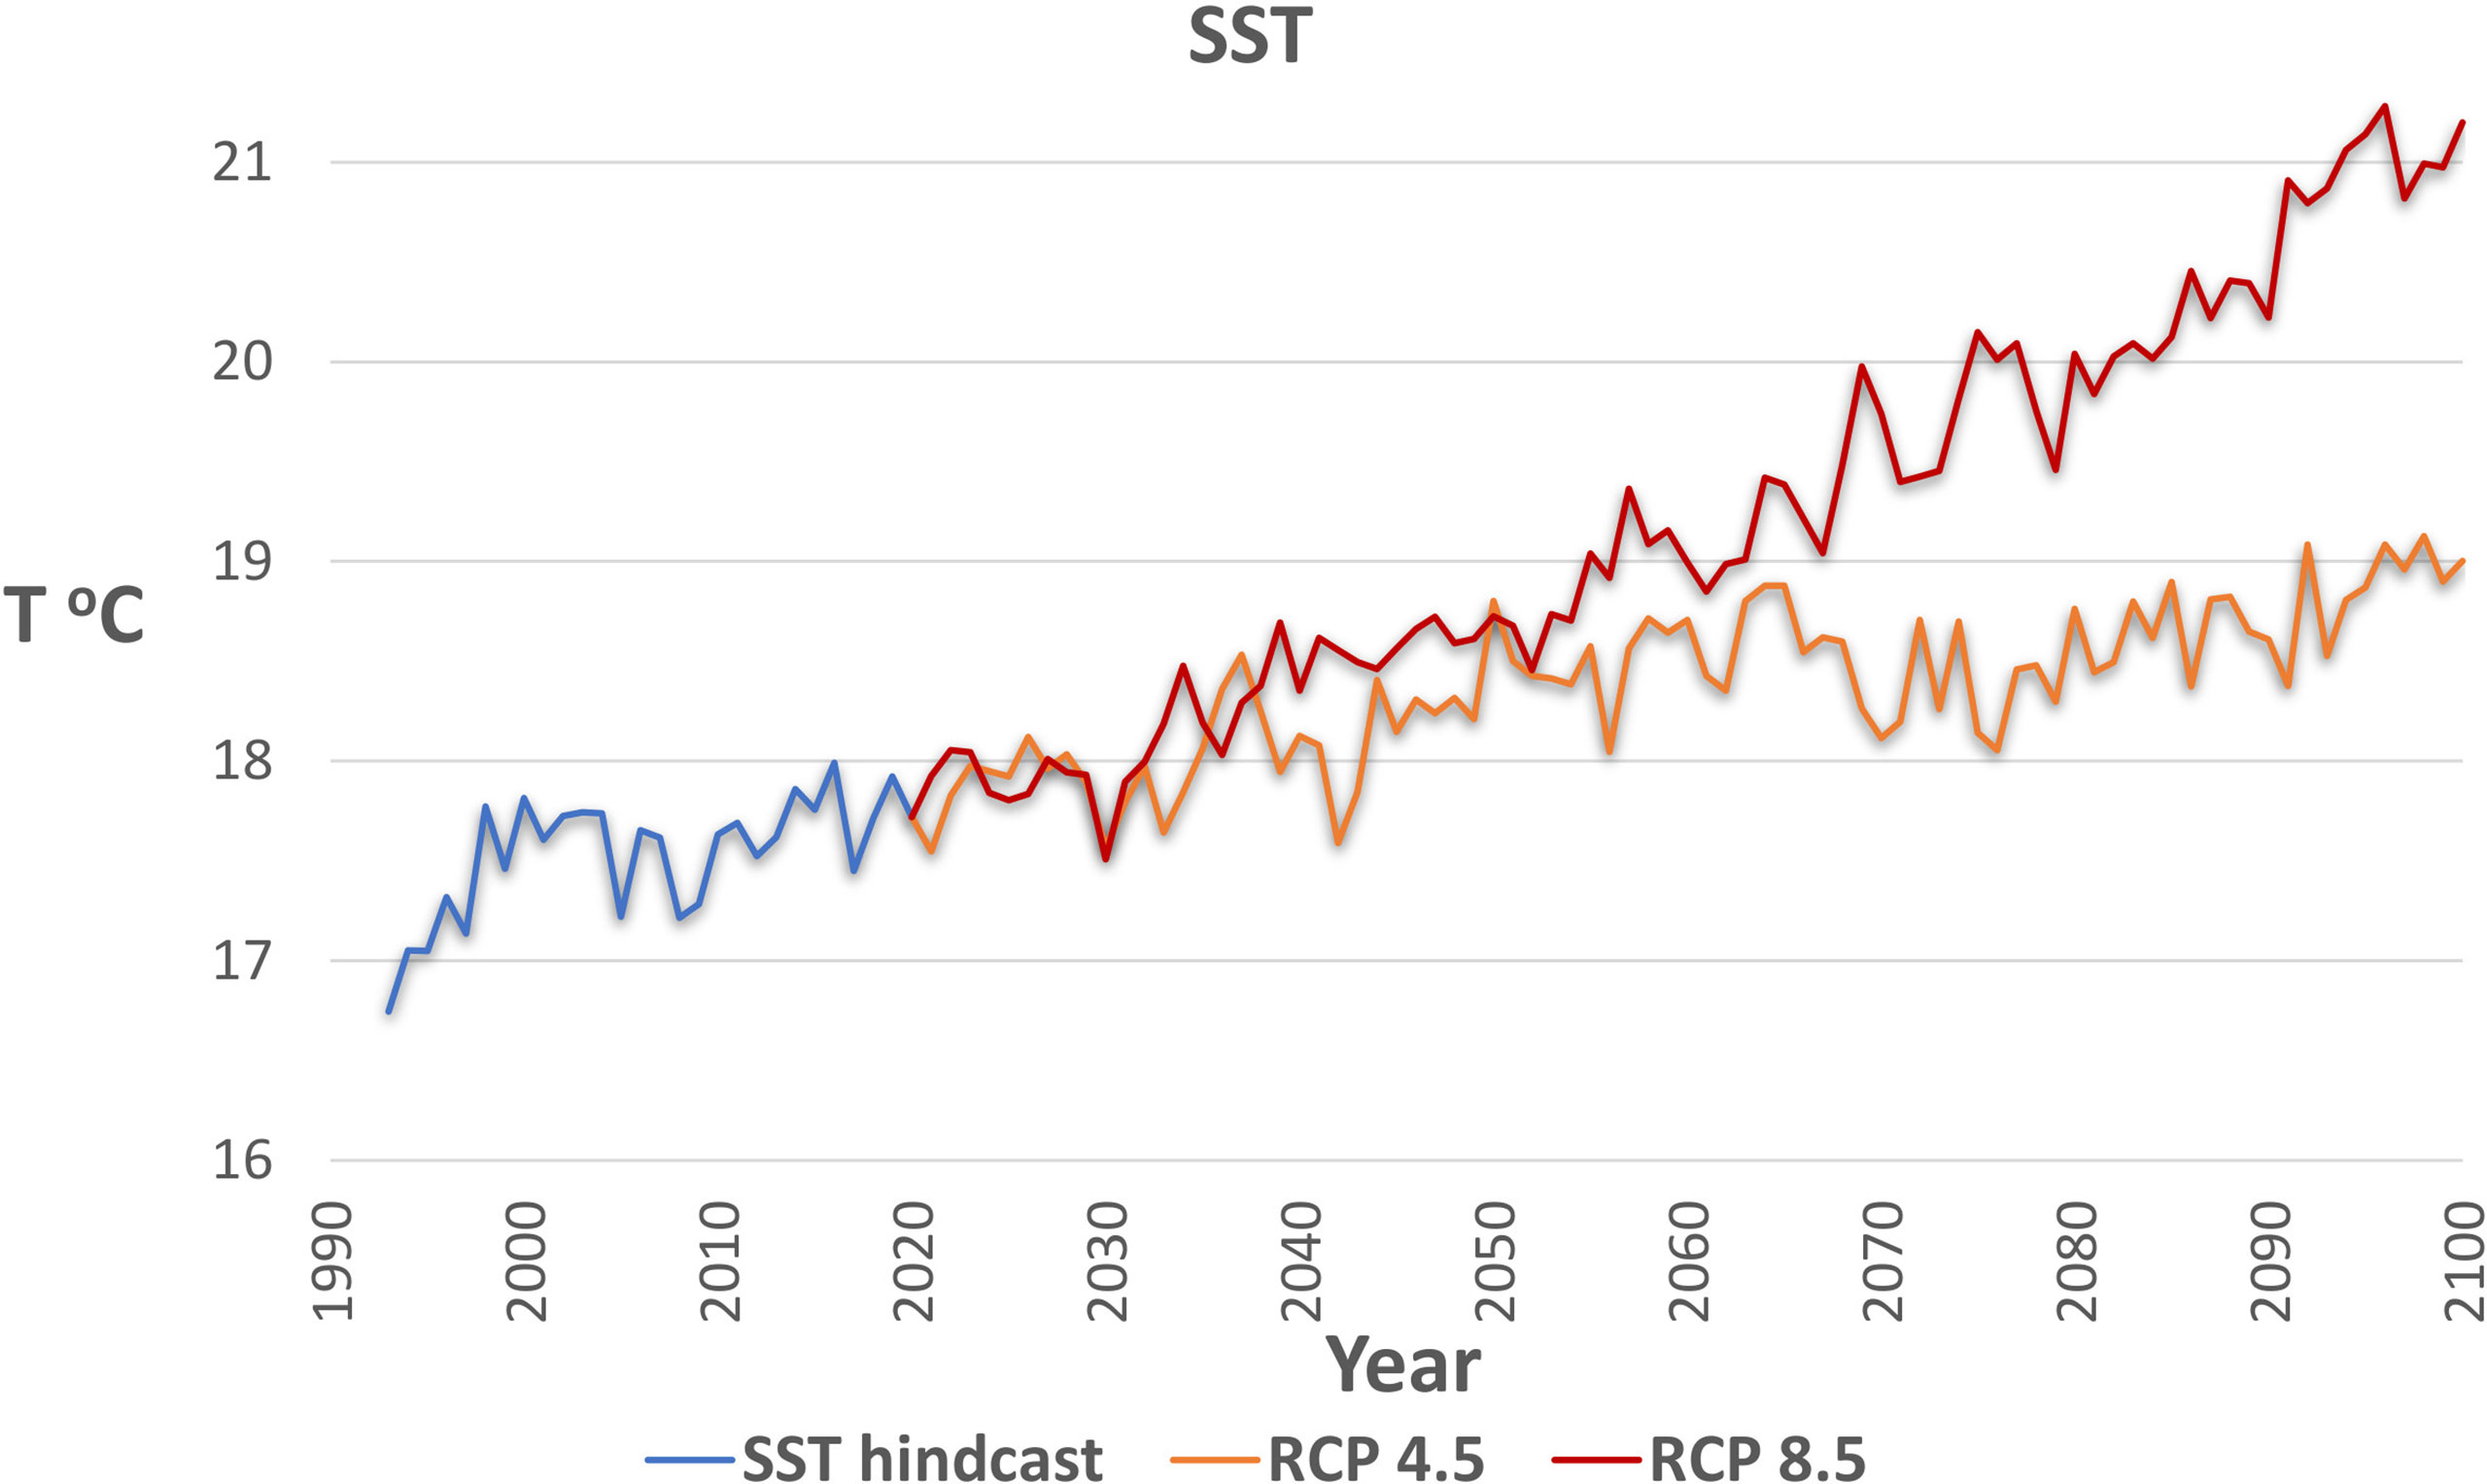
Figure 4 Sea Surface Temperature (SST) of the model area during the hindcast period (1993-2020) and under the two climate scenarios considered (RCP 4.5 and RCP 8.5) for the period 2021-2100.
Contrasting patterns in trends of primary productivity under climate change have been forecasted for the Eastern Mediterranean Sea. Most studies foresee substantial increases in productivity (e.g. Lazzari et al., 2014; Adloff et al., 2015; Macias et al., 2015), while others show that the basin will become more oligotrophic (e.g. Richon et al., 2019). In all studies however, it is evident that productivity changes are less severe in the model area compared to the rest of the Aegean Sea or to the whole Eastern Mediterranean basin. Therefore, based on levels of change indicated in other simulation studies (e.g., Lazzari et al., 2014; Richon et al., 2019) we simulated moderate changes in future productivity by means of two synthetic linear trends in PP Anomaly (one increasing and one decreasing), progressively reaching ±5% by 2050 (scenarios PP+5% and PP-5%; Table 2).
Given that reductions of fishing effort and further retraction of vessels are probable to continue in the near future as the main management strategies aiming to improve stock status in the area, two short-term fishing effort reduction scenarios were applied (Table 2). The scenarios simulated decreases by 10% (FE10) and 25% (FE25) for all fleets within 5 years (from 2021 to 2025) and thereafter assume constant fishing effort at levels reached in 2025.
Finally, two scenarios based on the combination of drivers were tested (Table 2). The first (ENV), a moderately negative environmental scenario was developed by considering SST increase under RCP 4.5 occurring simultaneously with a 5% decrease in PP Anomaly. The second scenario (ENV_FE10), explored the above environmental conditions accompanied by a 10% reduction in fisheries, to explore if the effects of environmental conditions could be compensated by applying moderate horizontal fisheries management measures.
3 Results
3.1 Ecopath
The flow diagram of the NAS1990 Ecopath model is shown in the Supplementary Material Figure S2. Large pelagic fish, dolphins and medium pelagic fish were the top predators of the pelagic compartment, while hake, demersal fish 2 and anglerfish had the higher Trophic Level among the demersal groups (Table 1). Regarding the commercial FGs, small pelagics (anchovy and sardine) were dominant in terms of biomass while shrimps, demersal fish 3 and hake were the most abundant FGs among the demersal commercial ones (Table 1). The PREBAL diagnostics for the Ecopath model (Supplementary Material Figure S3) show that biomass spectra span 5 orders of magnitude, with a slope 5.7% decline (on a log scale) with increasing trophic level; the slopes for Production/Biomass (P/B) and Consumption/Biomass (Q/B) with increasing trophic level were 8.6% and 5.1% decline respectively, i.e., within the expected range. The Gross Efficiency (P/Q) values were physiologically realistic (0.1 - 0.3 for most groups) (Christensen et al., 2008; Link, 2010b).
The pedigree index was 0.64, while the model’s summary flows, common indices and statistics are provided in the Supplementary Material Table S7. The mean Trophic Level of the catch was 3.499, the mean Transfer Efficiency was 17.66%, the Primary Production Required to sustain the fishery (PPR, from primary producers) was 9.72%, while the probability for the ecosystem to be sustainably fished was very low, i.e., 25%. This was in line with the high fishing mortalities (F) and exploitation rates (F/Z) of some FGs, especially apex predators (e.g., hake, demersal fishes 2, large and medium pelagics), sardine and mackerels (Supplementary Material Table S8).
3.2 Ecosim
3.2.1 Model Parameterization and Hindcast Runs
The stepwise fitting approach indicated that the best model (with the lowest SS and AIC) was capable to reduce SS by 46.3% compared to the baseline model and included as drivers fishing, SST and PP Anomaly with calibrated trophic interactions (Table 3). Total GT with a technology creep factor of 2% annual increase (but 0.79% for bottom trawls) proved to be the best proxy of fishing effort as it improved the fit more than the other series of fishing effort (i.e., number of vessels or total KW and technology creep factors 0% or 1%). The optimization of the trophic interactions by estimating vulnerabilities for 34 predators greatly improved model fit (Table 3). Seventeen FGs had vulnerabilities equal to one (most of them low and medium trophic level organisms, e.g., micro- and macro-zooplankton, polychaetes, shrimps, benthic invertebrates, red mullets, anchovy, other small pelagic fish), indicating bottom-up effects, four FGs (small benthic crustaceans, benthopelagic fish, medium and large pelagic fish) showed very high vulnerabilities (>1000) while the remaining FGs had intermediate values (2-30.47) (Supplementary Material Table S9). The PP Anomaly function selected with the stepwise fitting had 6 spline points and showed a decreasing trend (with some fluctuations) from the starting period (1993) until 2010 and a relatively steep increase during the last decade of the hindcast period. The Spearman correlation of the PP Anomaly with SST and the climatic indices revealed a significant positive correlation only with NAO (r=0.45, p=0.016; Figure 5) and correlation increased when including a 1-year lag for NAO (r=0.56, p=0.002; Figure 5).
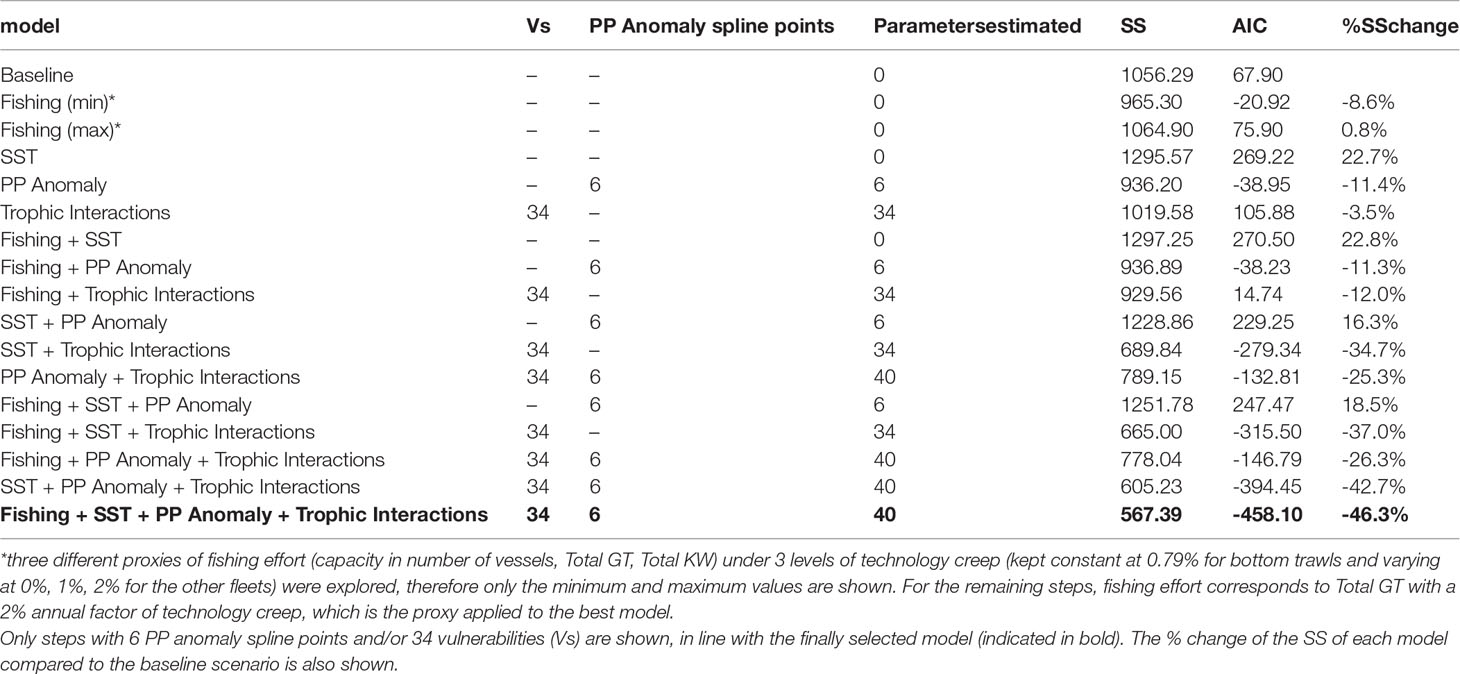
Table 3 Description, Sum of Squares (SS) and Akaike Information Criterion (AIC) of selected steps of the stepwise fitting.
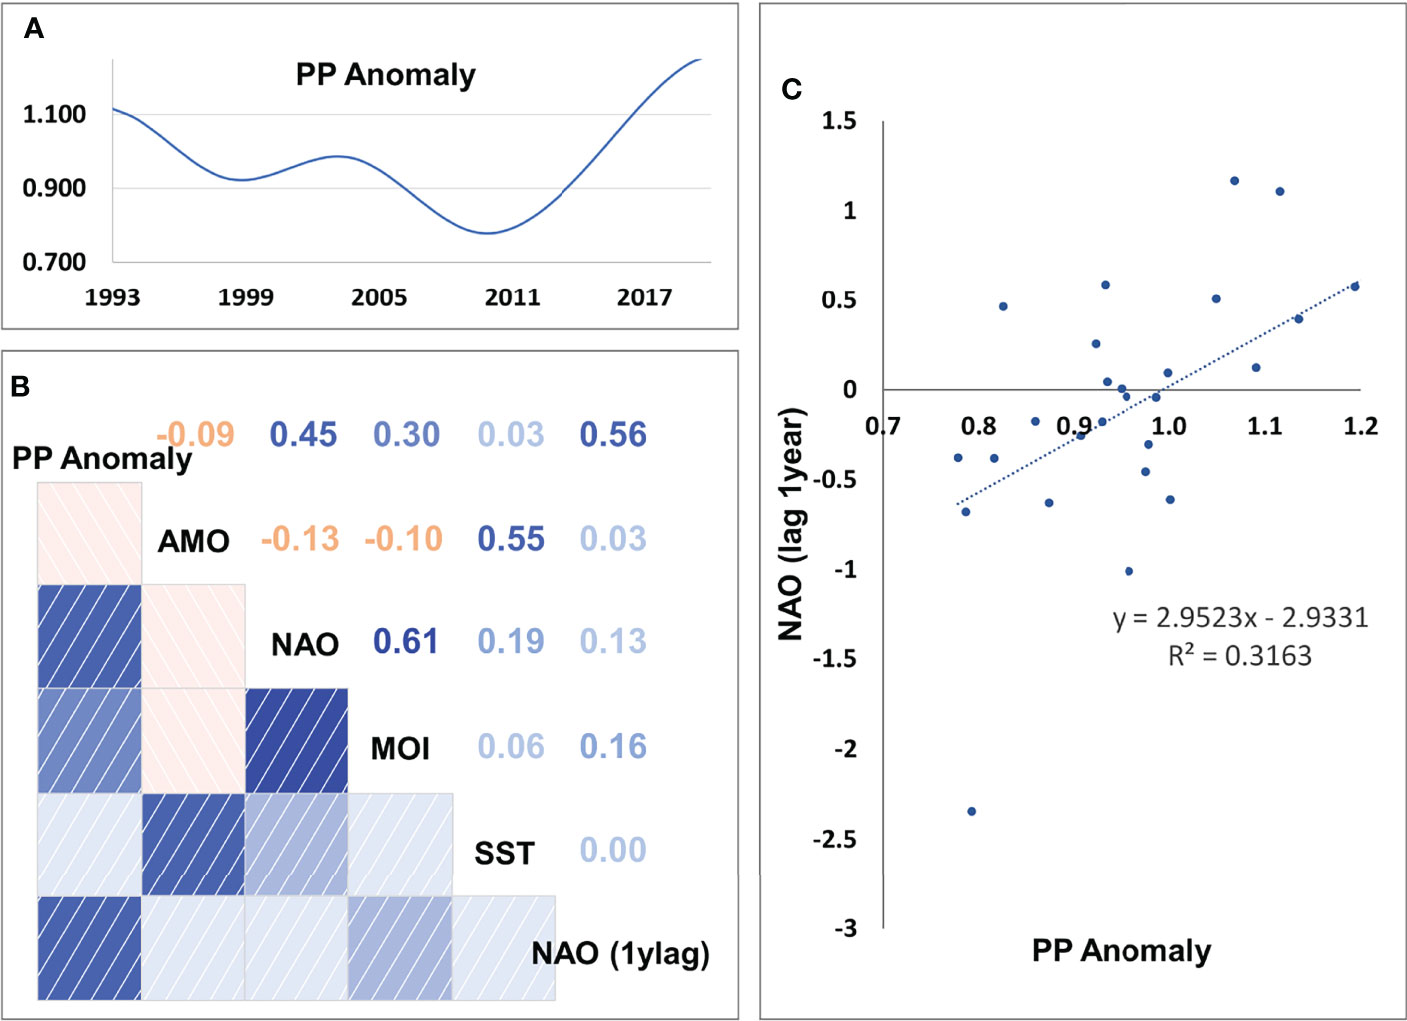
Figure 5 (A) Estimated values of PP Anomaly, (B) correlation coefficients among PP Anomaly, Sea Surface Temperature (SST) and climatic indices (MOI, Mediterranean Oscillation Index; AMO, Atlantic Multi-decadal Oscillation; NAO, North Atlantic Oscillation; NAO (1ylag), NAO with lag of 1 year), and (C) scatterplot of annual mean PP Anomaly and NAO with lag of 1 year.
The model’s fit to biomass observations was very satisfactory for some groups (e.g., shrimps, benthic cephalopods, hake, demersal fish 2, 3 and 4, picarels & bogue and sardine) and less for others (e.g., red mullets, demersal fish 1, sharks and rays & skates) (Figure 6). Similarly, for catches, the model’s predictions reproduced relatively well the observed time series for benthic cephalopods, other gadiformes, horse mackerel and mackerel, but not very well for shrimps and rays & skates (Figure 7). Overall, the model slightly overestimated catches in the last 3-5 years of the time series (Figure 7), as it seems to be driven mainly by biomass increases observed for several FGs (e.g., cephalopods, red mullets, demersal fish 2 and 4, rays & skates) during the same period (Figure 6). Compared to the starting period, substantial declines in catches and biomasses at the end of the hindcast period were simulated for Norway lobster, other gadiformes, horse mackerels, mackerels and medium pelagics. On the other hand, catches of demersal fish 2 and 4, benthic and benthopelagic cephalopods as well as anchovy were increasing; however, for the three latter, the increase in catches was much higher than the increase in biomass (Figures 6, 7).
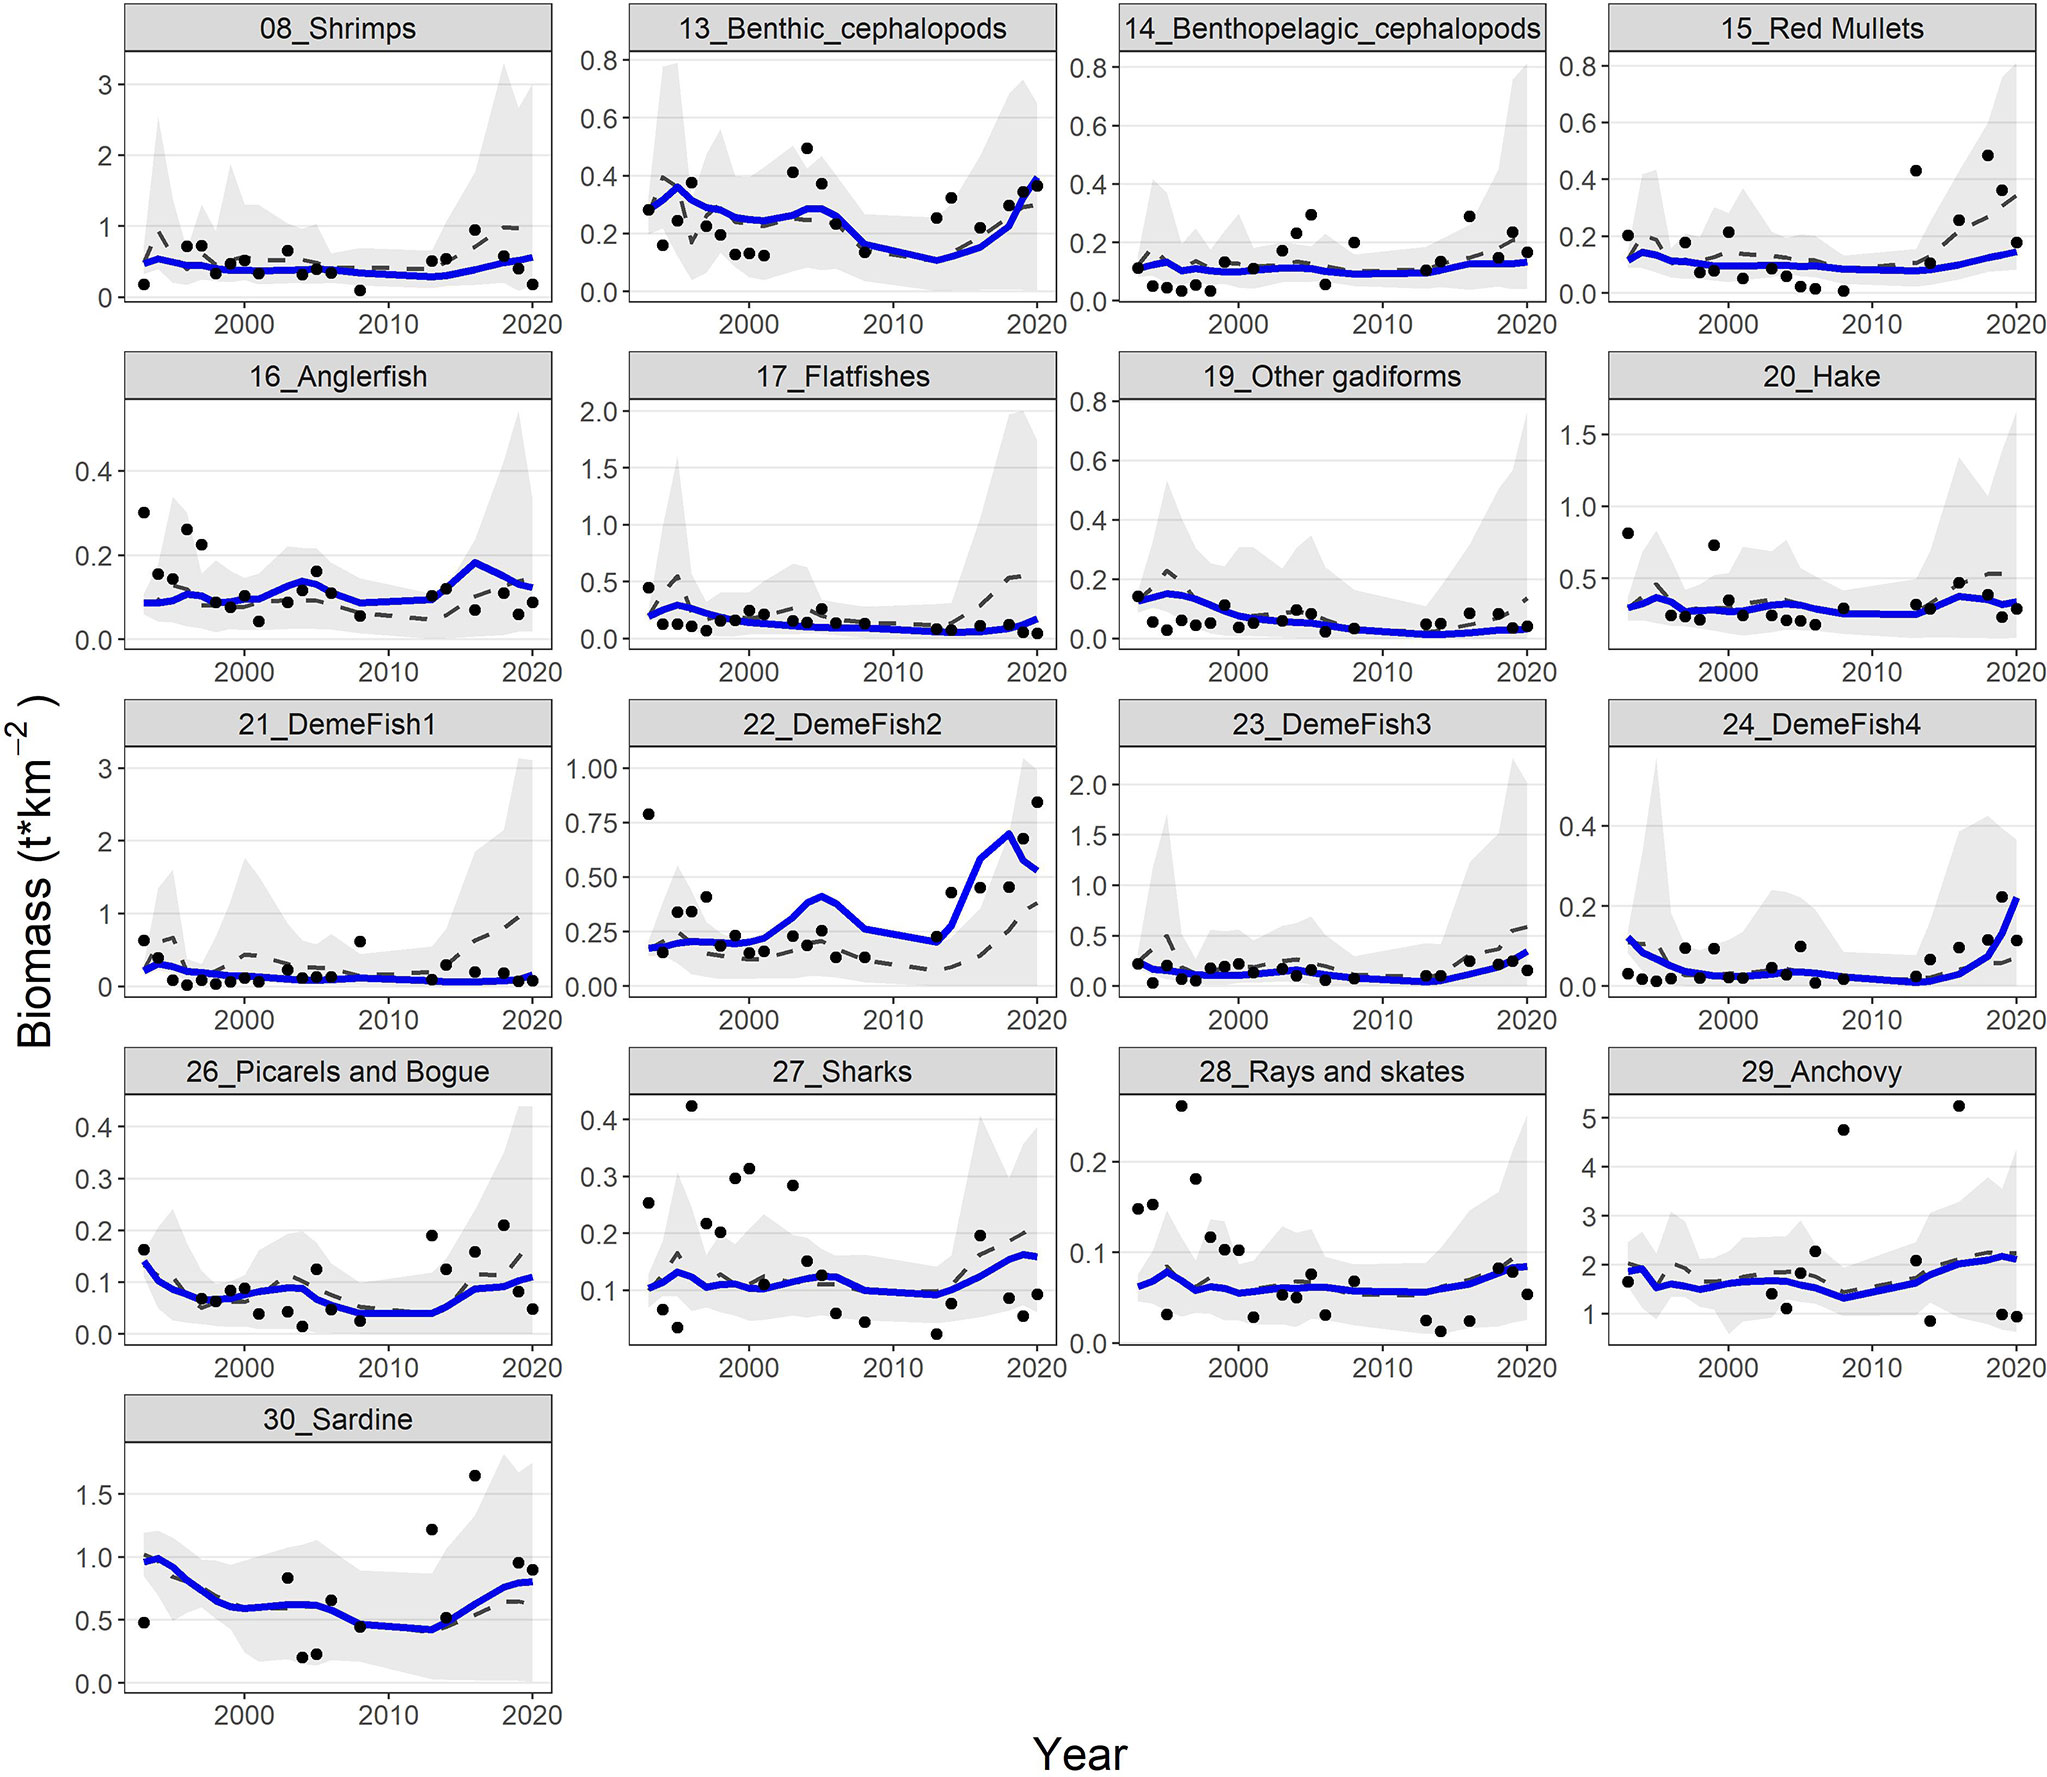
Figure 6 Predicted (blue lines) and observed (dots) biomasses for 17 FGs with available biomass time series. The dashed grey lines and shaded areas are the mean and the 5%-95% percentiles of the 100 Monte-Carlo simulations respectively.
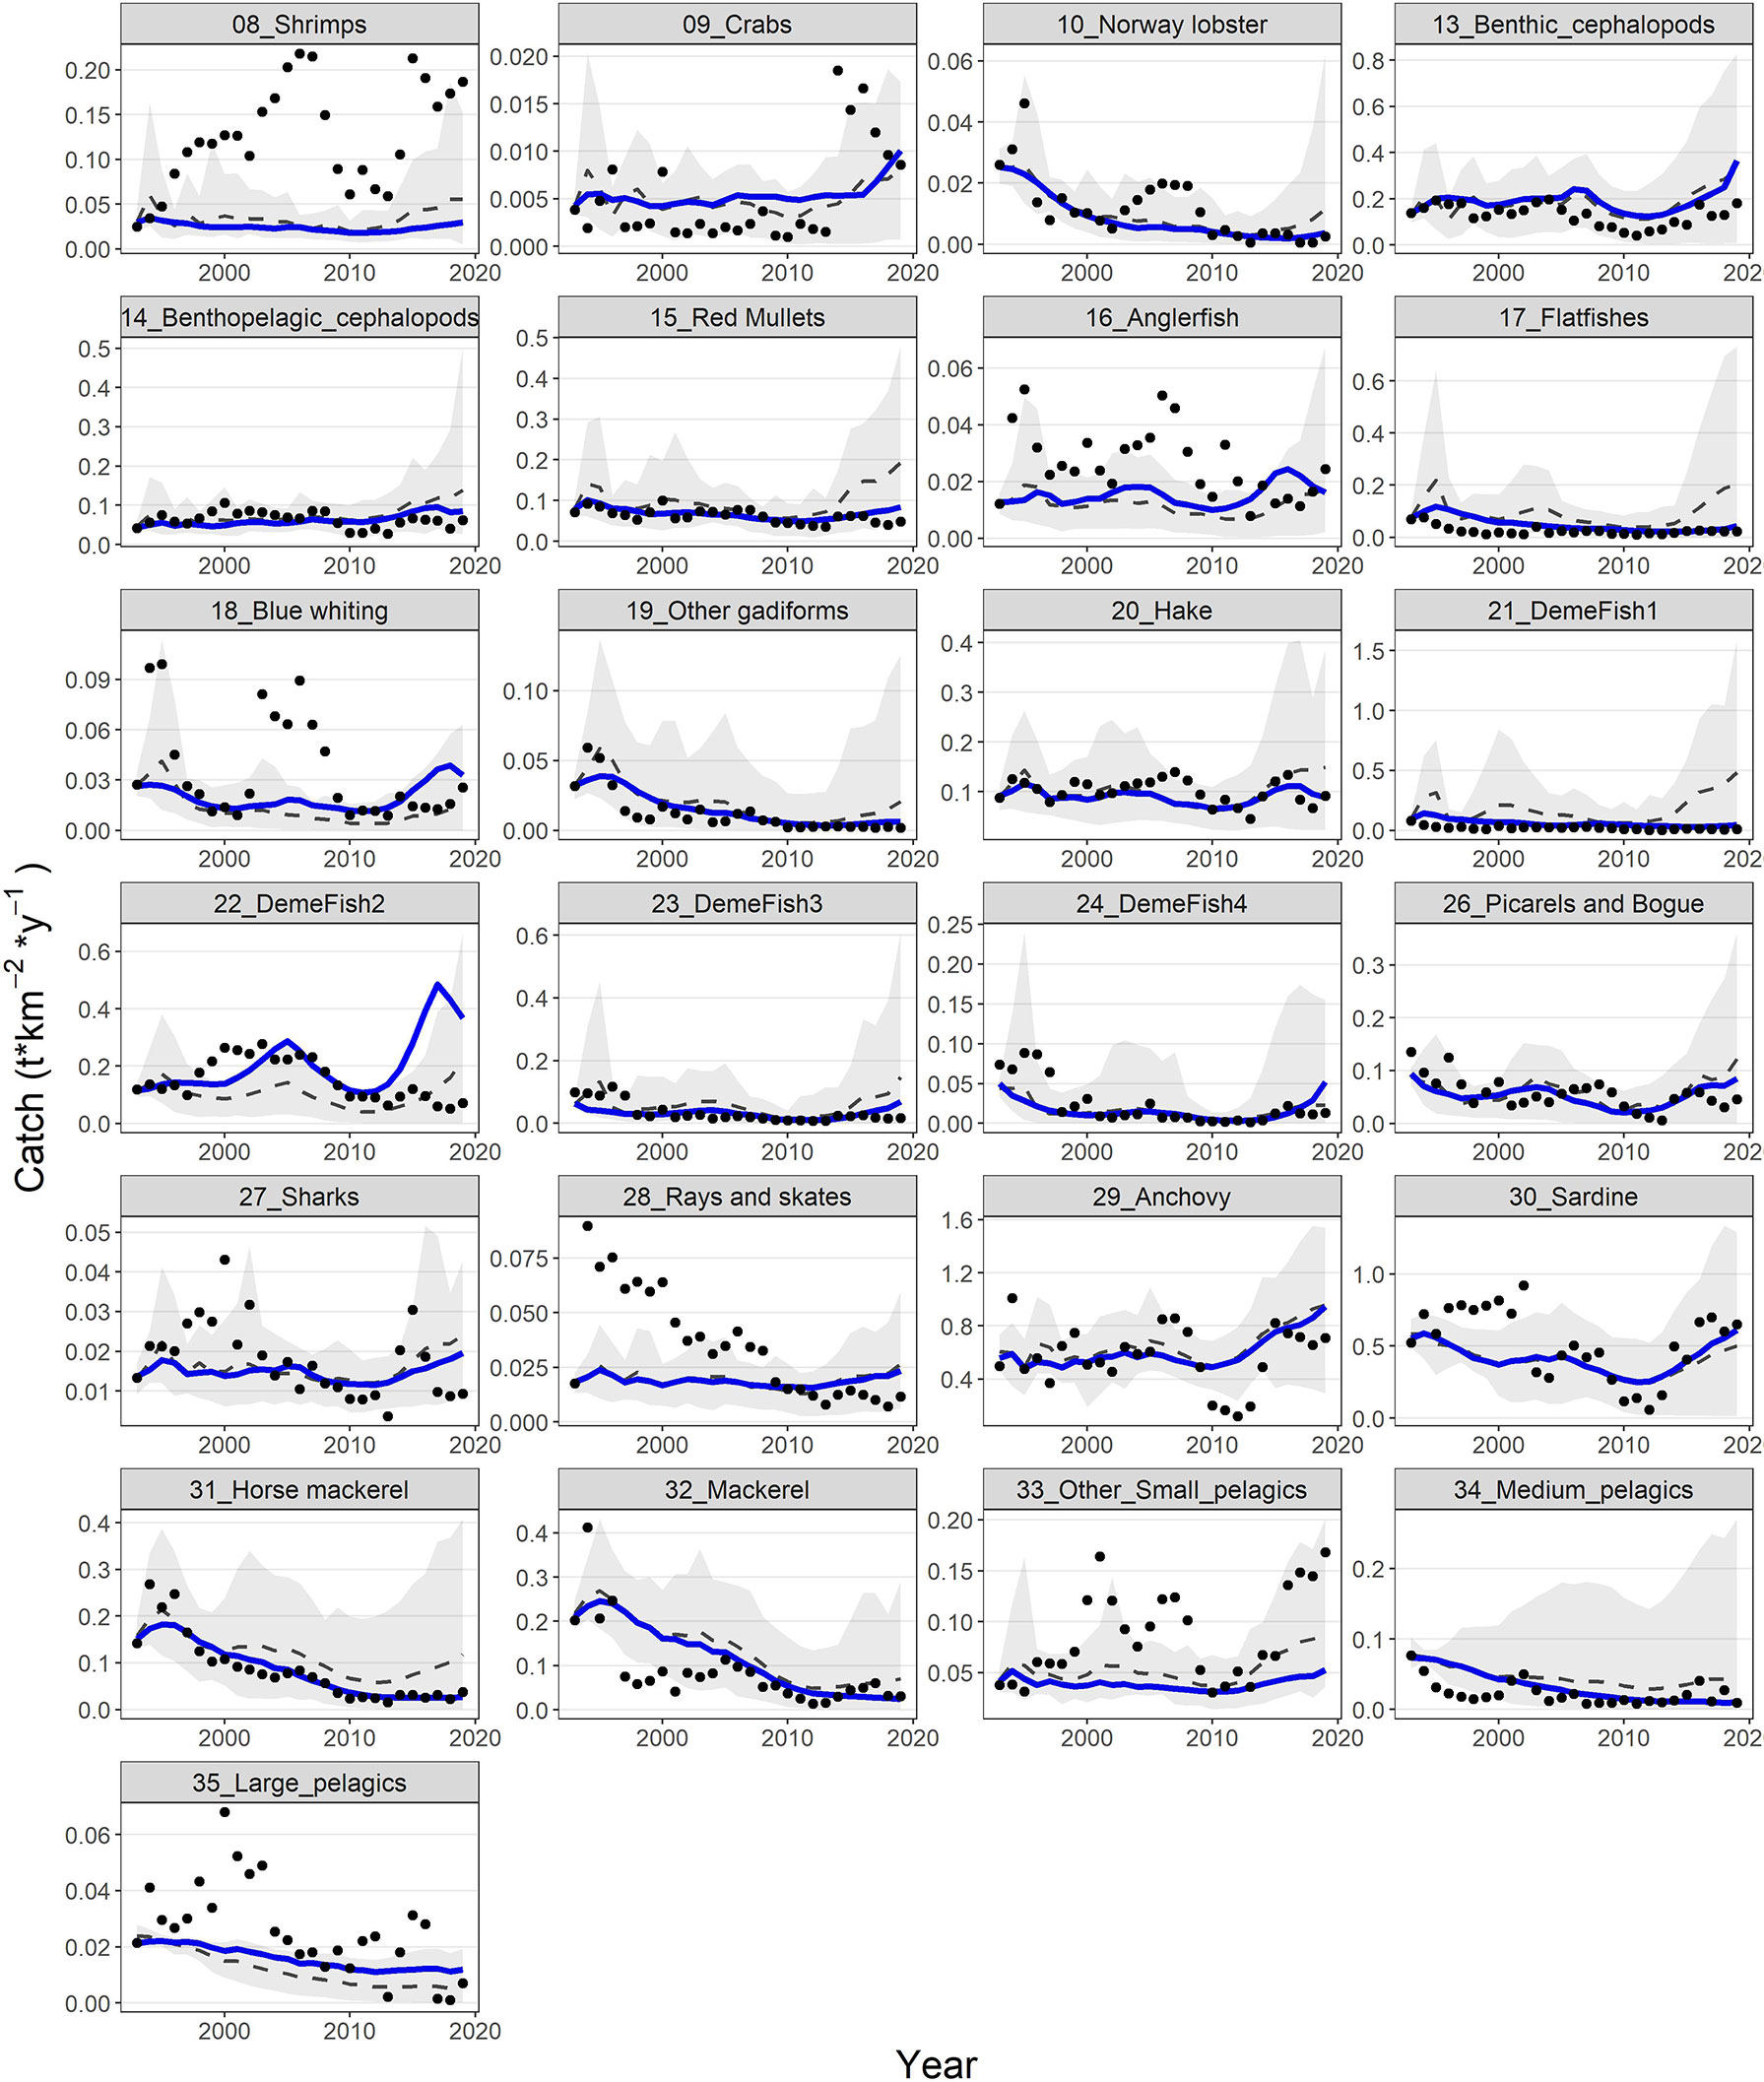
Figure 7 Predicted (blue lines) and observed (dots) catches for 25 FGs with available catch time series. Dashed grey lines and shaded areas are the mean and the 5%-95% percentiles of the 100 Monte-Carlo simulations respectively.
Model’s predictions were (with very few exceptions) within the 5%-95% percentiles of the Monte-Carlo simulations and generally close to their mean, both for biomasses and catches. In addition, the observations fall usually within the 5%-95% percentiles but not for all FGs/periods (Figures 6, 7). The Monte-Carlo simulations did not identify any alternative Ecopath input that explained the Ecosim time series (i.e., in terms of SS reduction) better than the current setup.Ecosystem indicators revealed that substantial changes have been observed during the hindcast period; the trends of total biomass, total catches and FiB index were similar, with all three metrics showing a decline from 1994 to 2010 and a strong recovery, thereafter, exceeding the levels of the baseline period (Supplementary Material Figure S4). The Shannon diversity index had a very similar response but with some delay compared to the abovementioned metrics and with a more moderate recovery. Finally, the mean Trophic Level of the catch (TLc) increased slightly, with some fluctuations from 1994 to 2017 and returned to the early 1990s levels within just 3 years (Supplementary Material Figure S4).
3.2.2 Future Scenarios
The IPCC temperature scenarios indicated contrasting responses to increased temperature among FGs. Compared to the baseline scenario the highest increases in mean biomass were forecasted for the benthopelagic fish FG, and demersal fish 4 and 2 (Figure 8). In the medium term (year 2030; Figure 8 and Supplementary Table S10), all increases were moderate, not exceeding +16%, but in the long term (average for 2046-2050) they were amplified, with the aforementioned groups exceeding +100% and the benthopelagic fish FG showing an extreme increase (Figure 8 and Supplementary Table S11). Positive effects were also identified for medium and large pelagic fish, sea turtles and dolphins. For most groups, the changes were larger in the RCP85 compared to RCP45, however this was not true for all FGs, especially for the ones with moderate climate responses (e.g., the benthic cephalopods increased by +7.1% in RCP45 but only +5.3% in RCP85 in the long term; Figure 8 and Supplementary Table S10). Main losers of climate change were the other gadiformes, horse mackerels and Norway lobster (Figure 8) for which the forecasted decline reached -89.4%, -75.6% and -74.7% respectively in RCP85 during the 2046-2050 period. The climate change effect on catches for each FG (in terms of proportional change) was identical to the effect on biomasses (Supplementary Material Figure S5 and Tables S11, S12) because of linear effects as explicit in Eq. 3. Biomass and catch trends of the main commercial FGs are illustrated in the Figures 9A, 10A respectively: shrimps, red mullets and sardine were negatively affected, especially after year 2035, hake and anglerfish showed clear increases, while for anchovy, practically very low positive effects were identified.
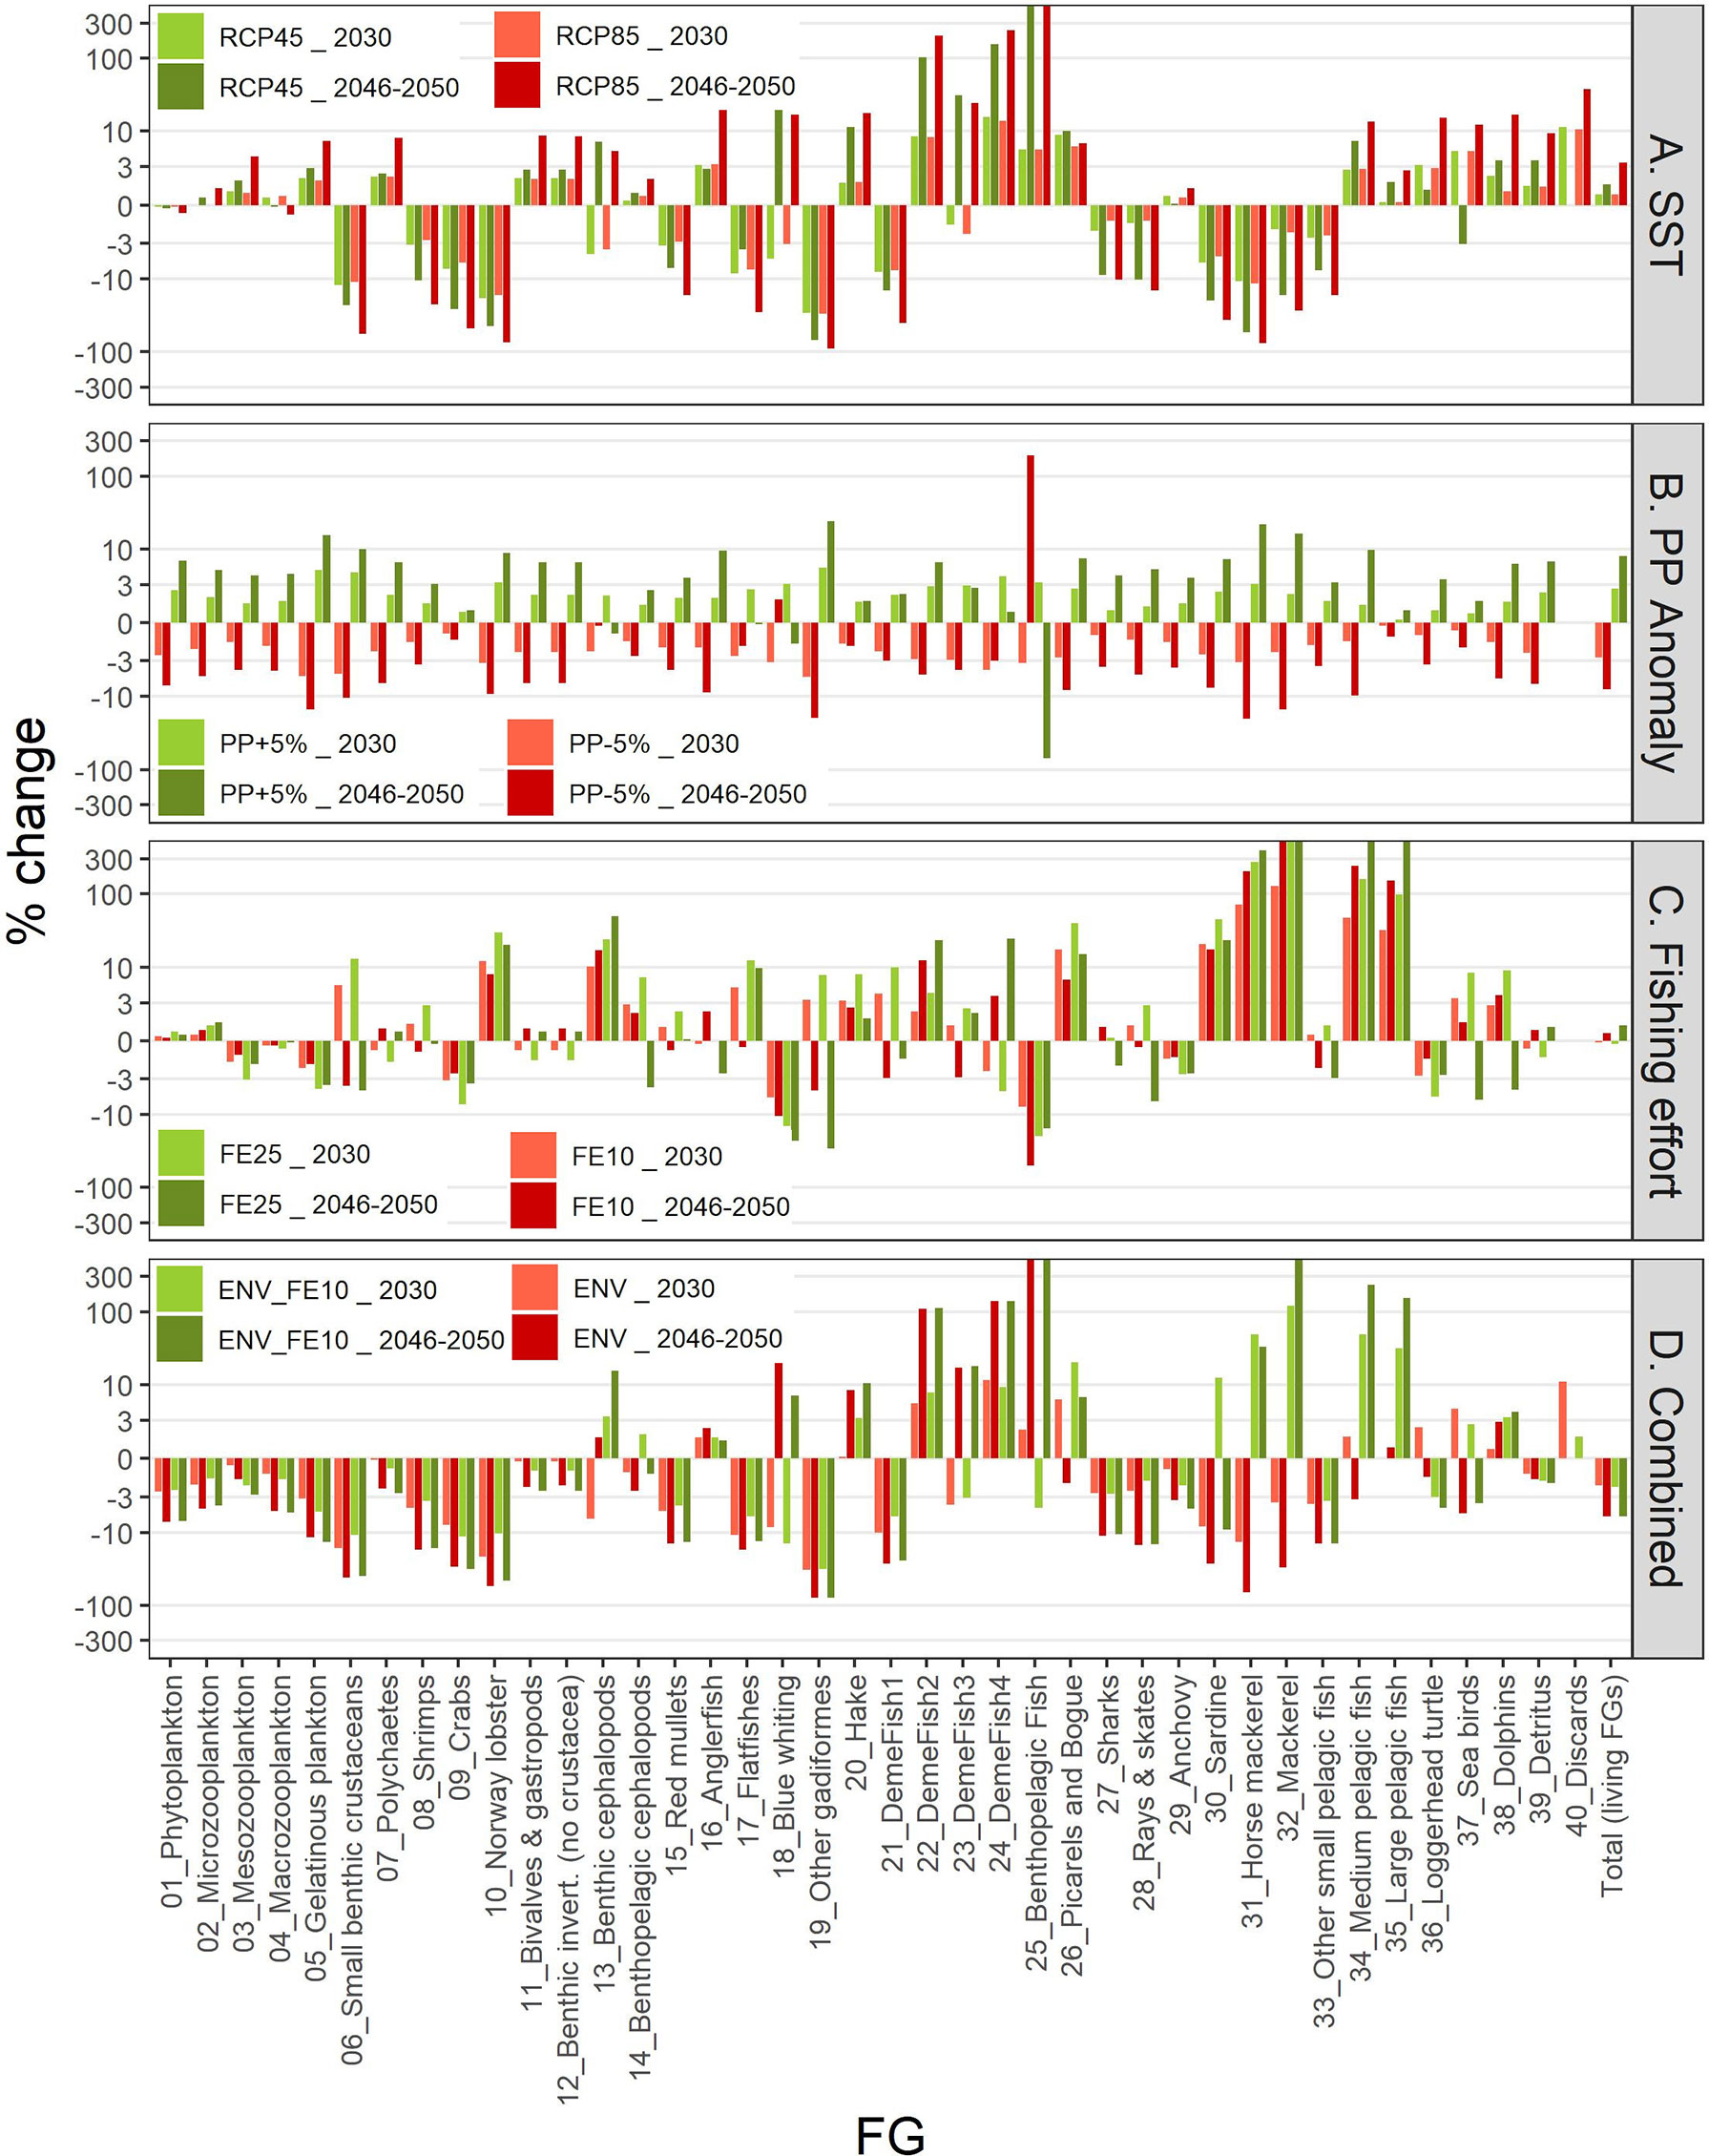
Figure 8 Graphical representation of differences (%) in biomasses in 2030 and average biomasses in the period 2046-2050 for each FG under each scenario compared to the baseline scenario. Y-axis scale is pseudo-logarithmic for better representation. The description of the scenarios is provided in Table 2.
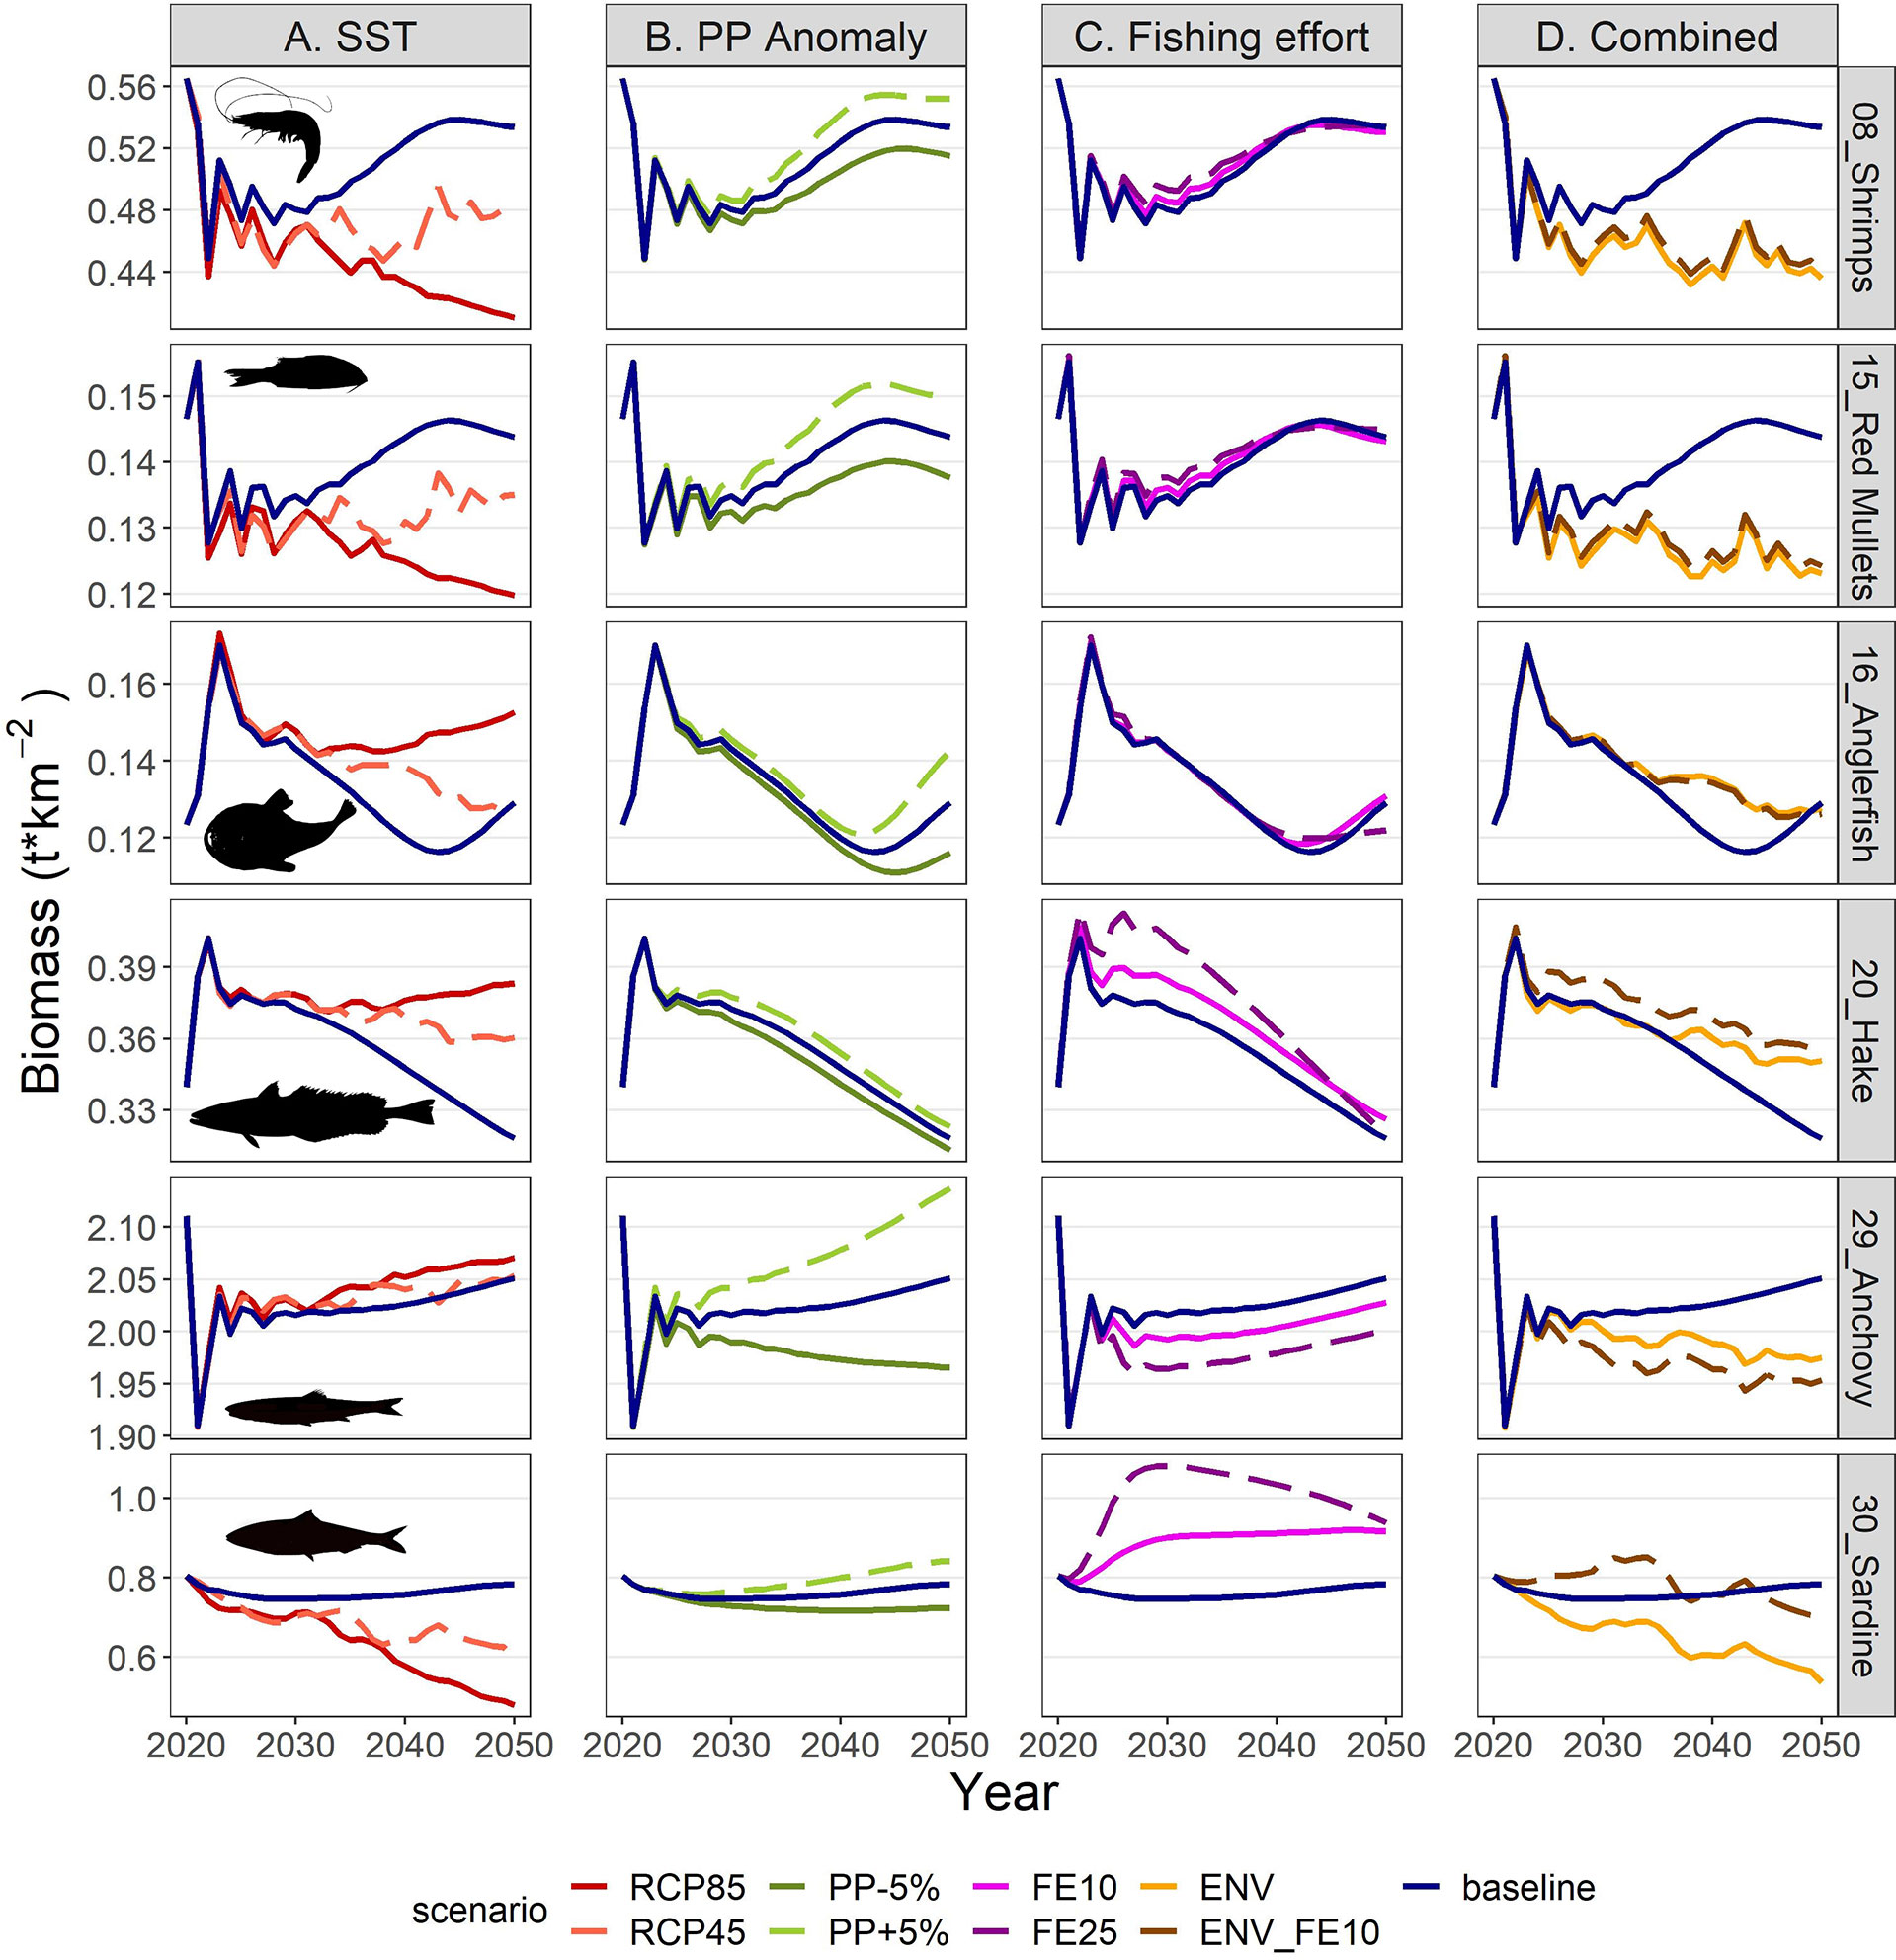
Figure 9 Biomass projections for selected FGs in the period 2021-2050 under scenarios related to (A) SST, (B) PP Anomaly, (C) fishing effort and (D) combination of drivers. The description of the scenarios is provided in Table 2.
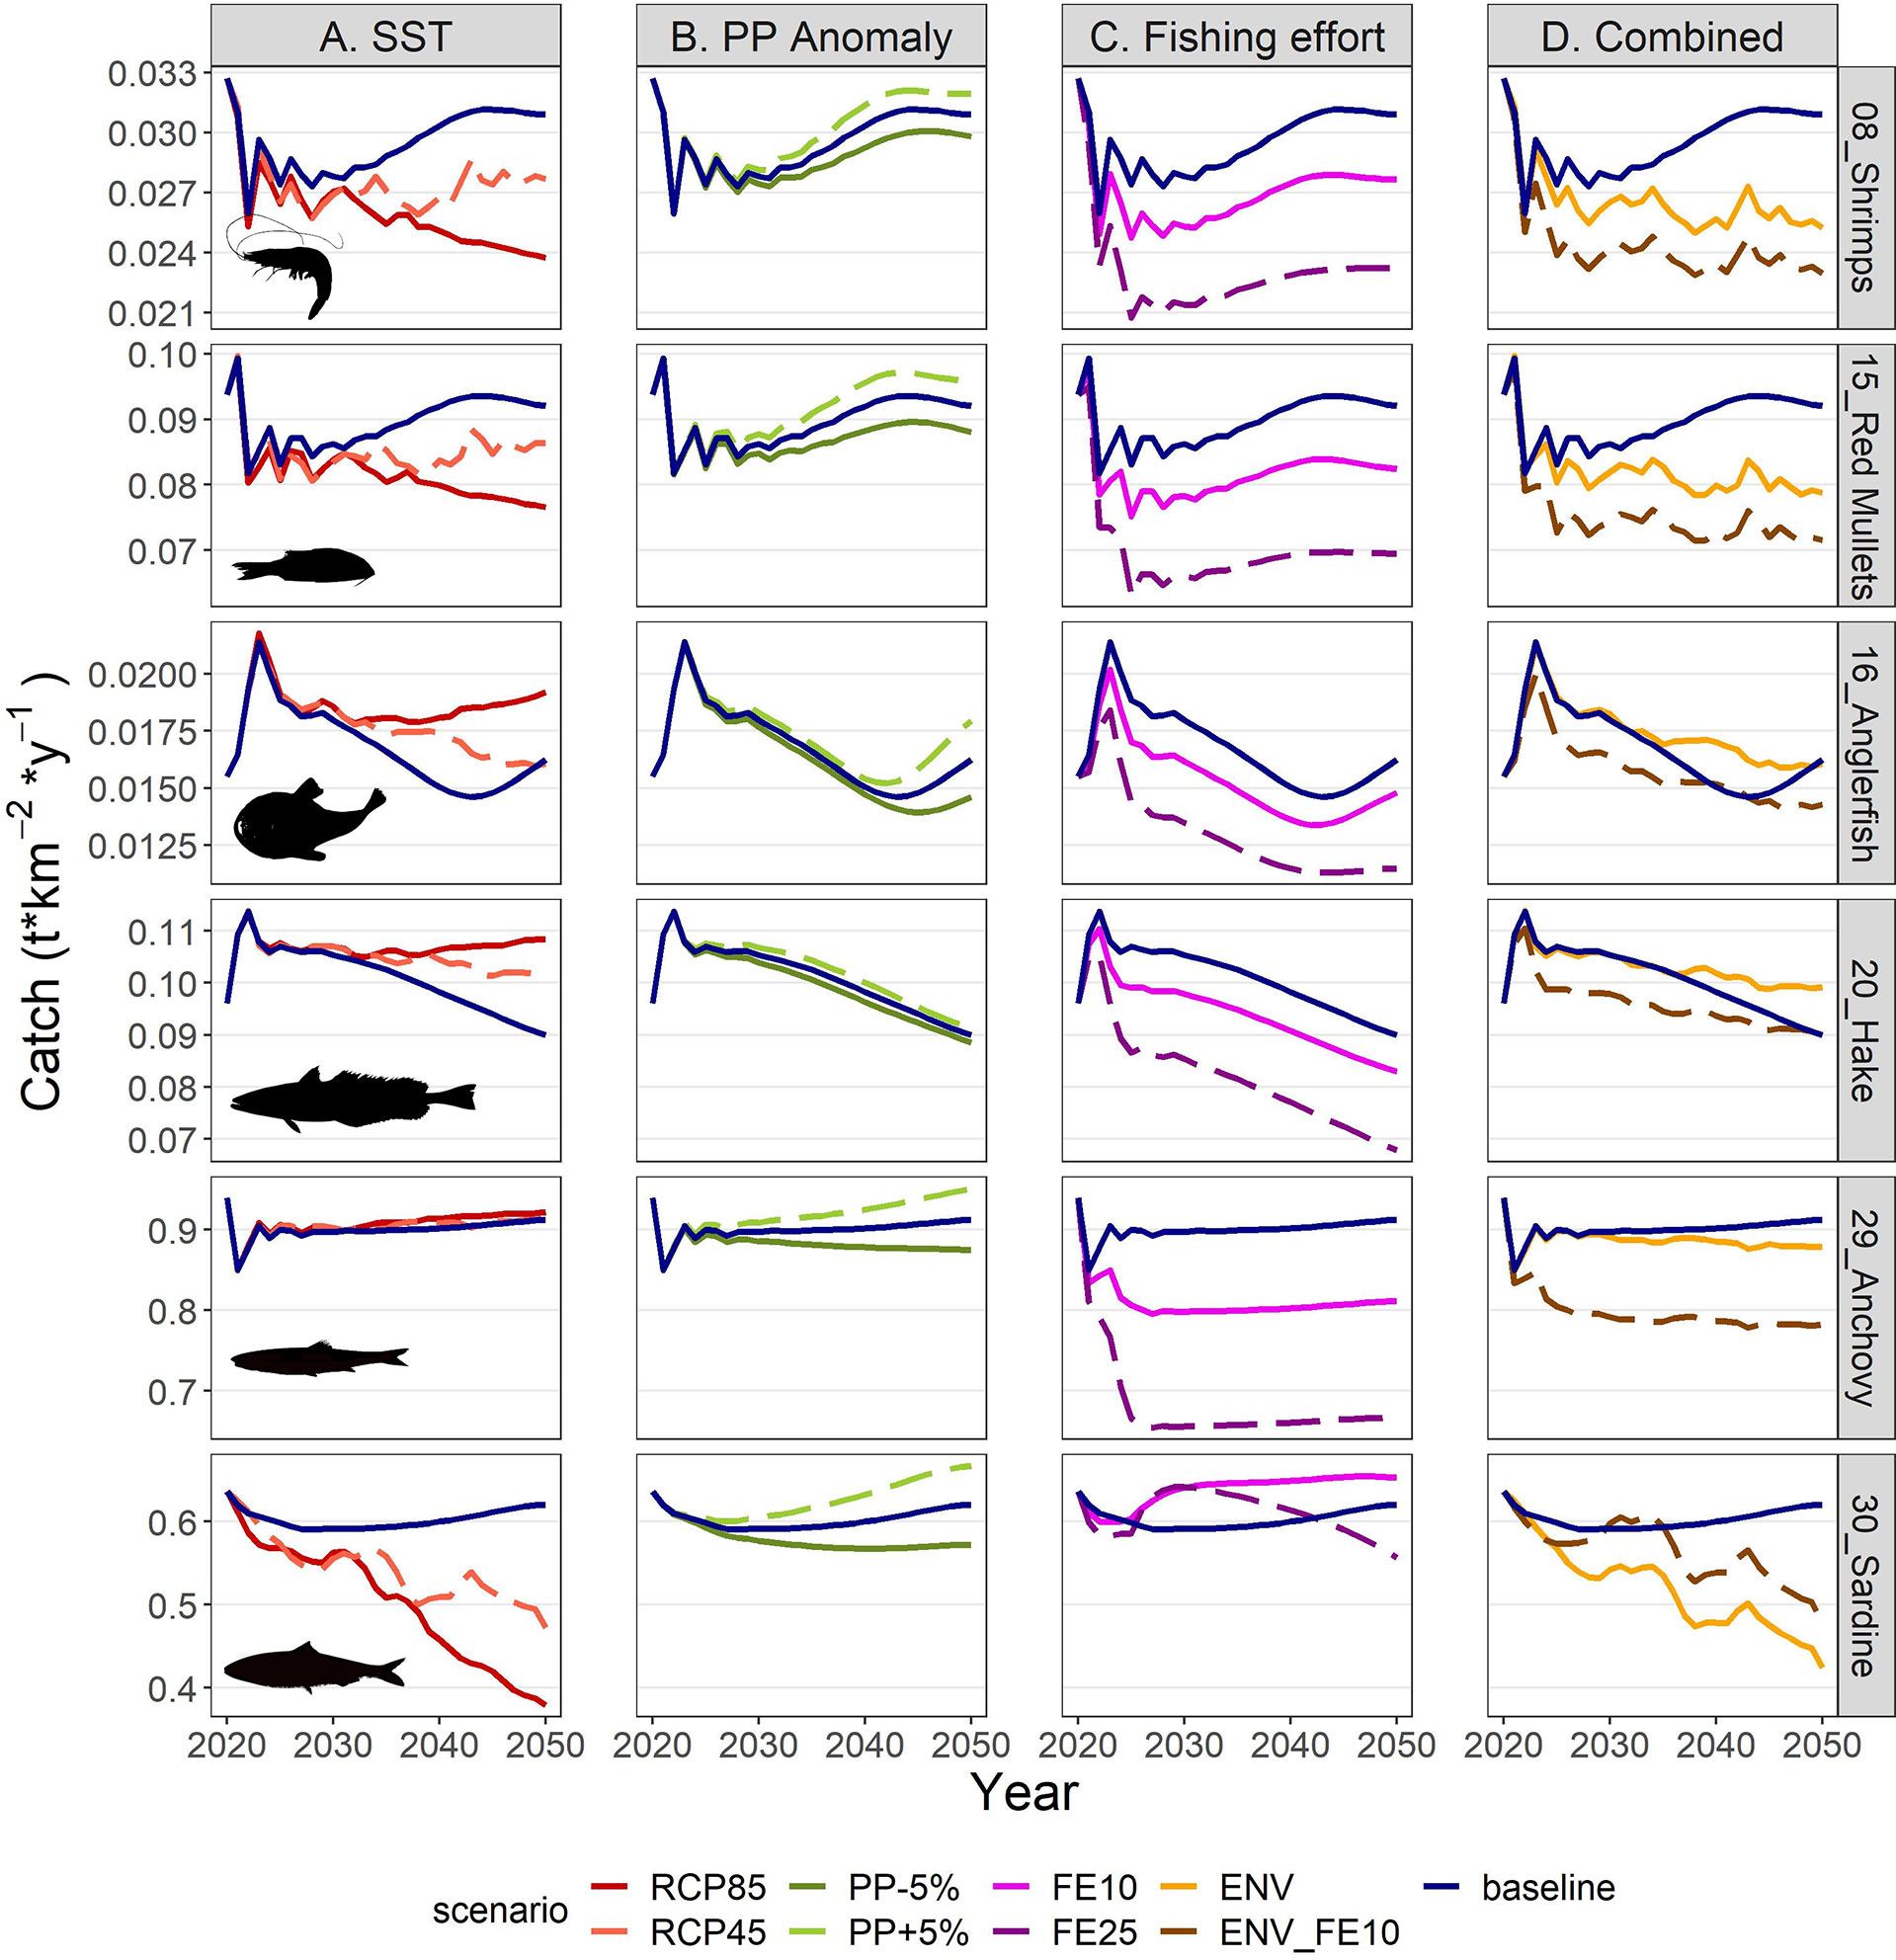
Figure 10 Catch projections for selected FGs in the period 2021-2050 under scenarios related to (A) SST, (B) PP Anomaly, (C) fishing effort and (D) combination of drivers. The description of the scenarios is provided in Table 2.
Total biomass of all living groups was forecasted to increase after 2030, either continuously under RCP85 or with some fluctuations in the RCP45, while the effect of temperature scenarios on total catches was very low (Figure 11A). Specifically, gains and losses were balanced until 2030 (Supplementary Material Table S12) and a 1.4-3.5% increase was shown for the long term (Supplementary Material Table S13). The FiB index remained relatively unchanged by increasing temperature for the first 20 years in the future but started to be lower than the baseline scenario after 2040 (Figure 11A). The Shannon diversity index showed high responsiveness to climate change, fluctuating in RCP45 and decreasing in RCP85, while the Trophic Level of the catch (TLc) was slightly higher in the climate scenarios compared to the baseline (Figure 11A).
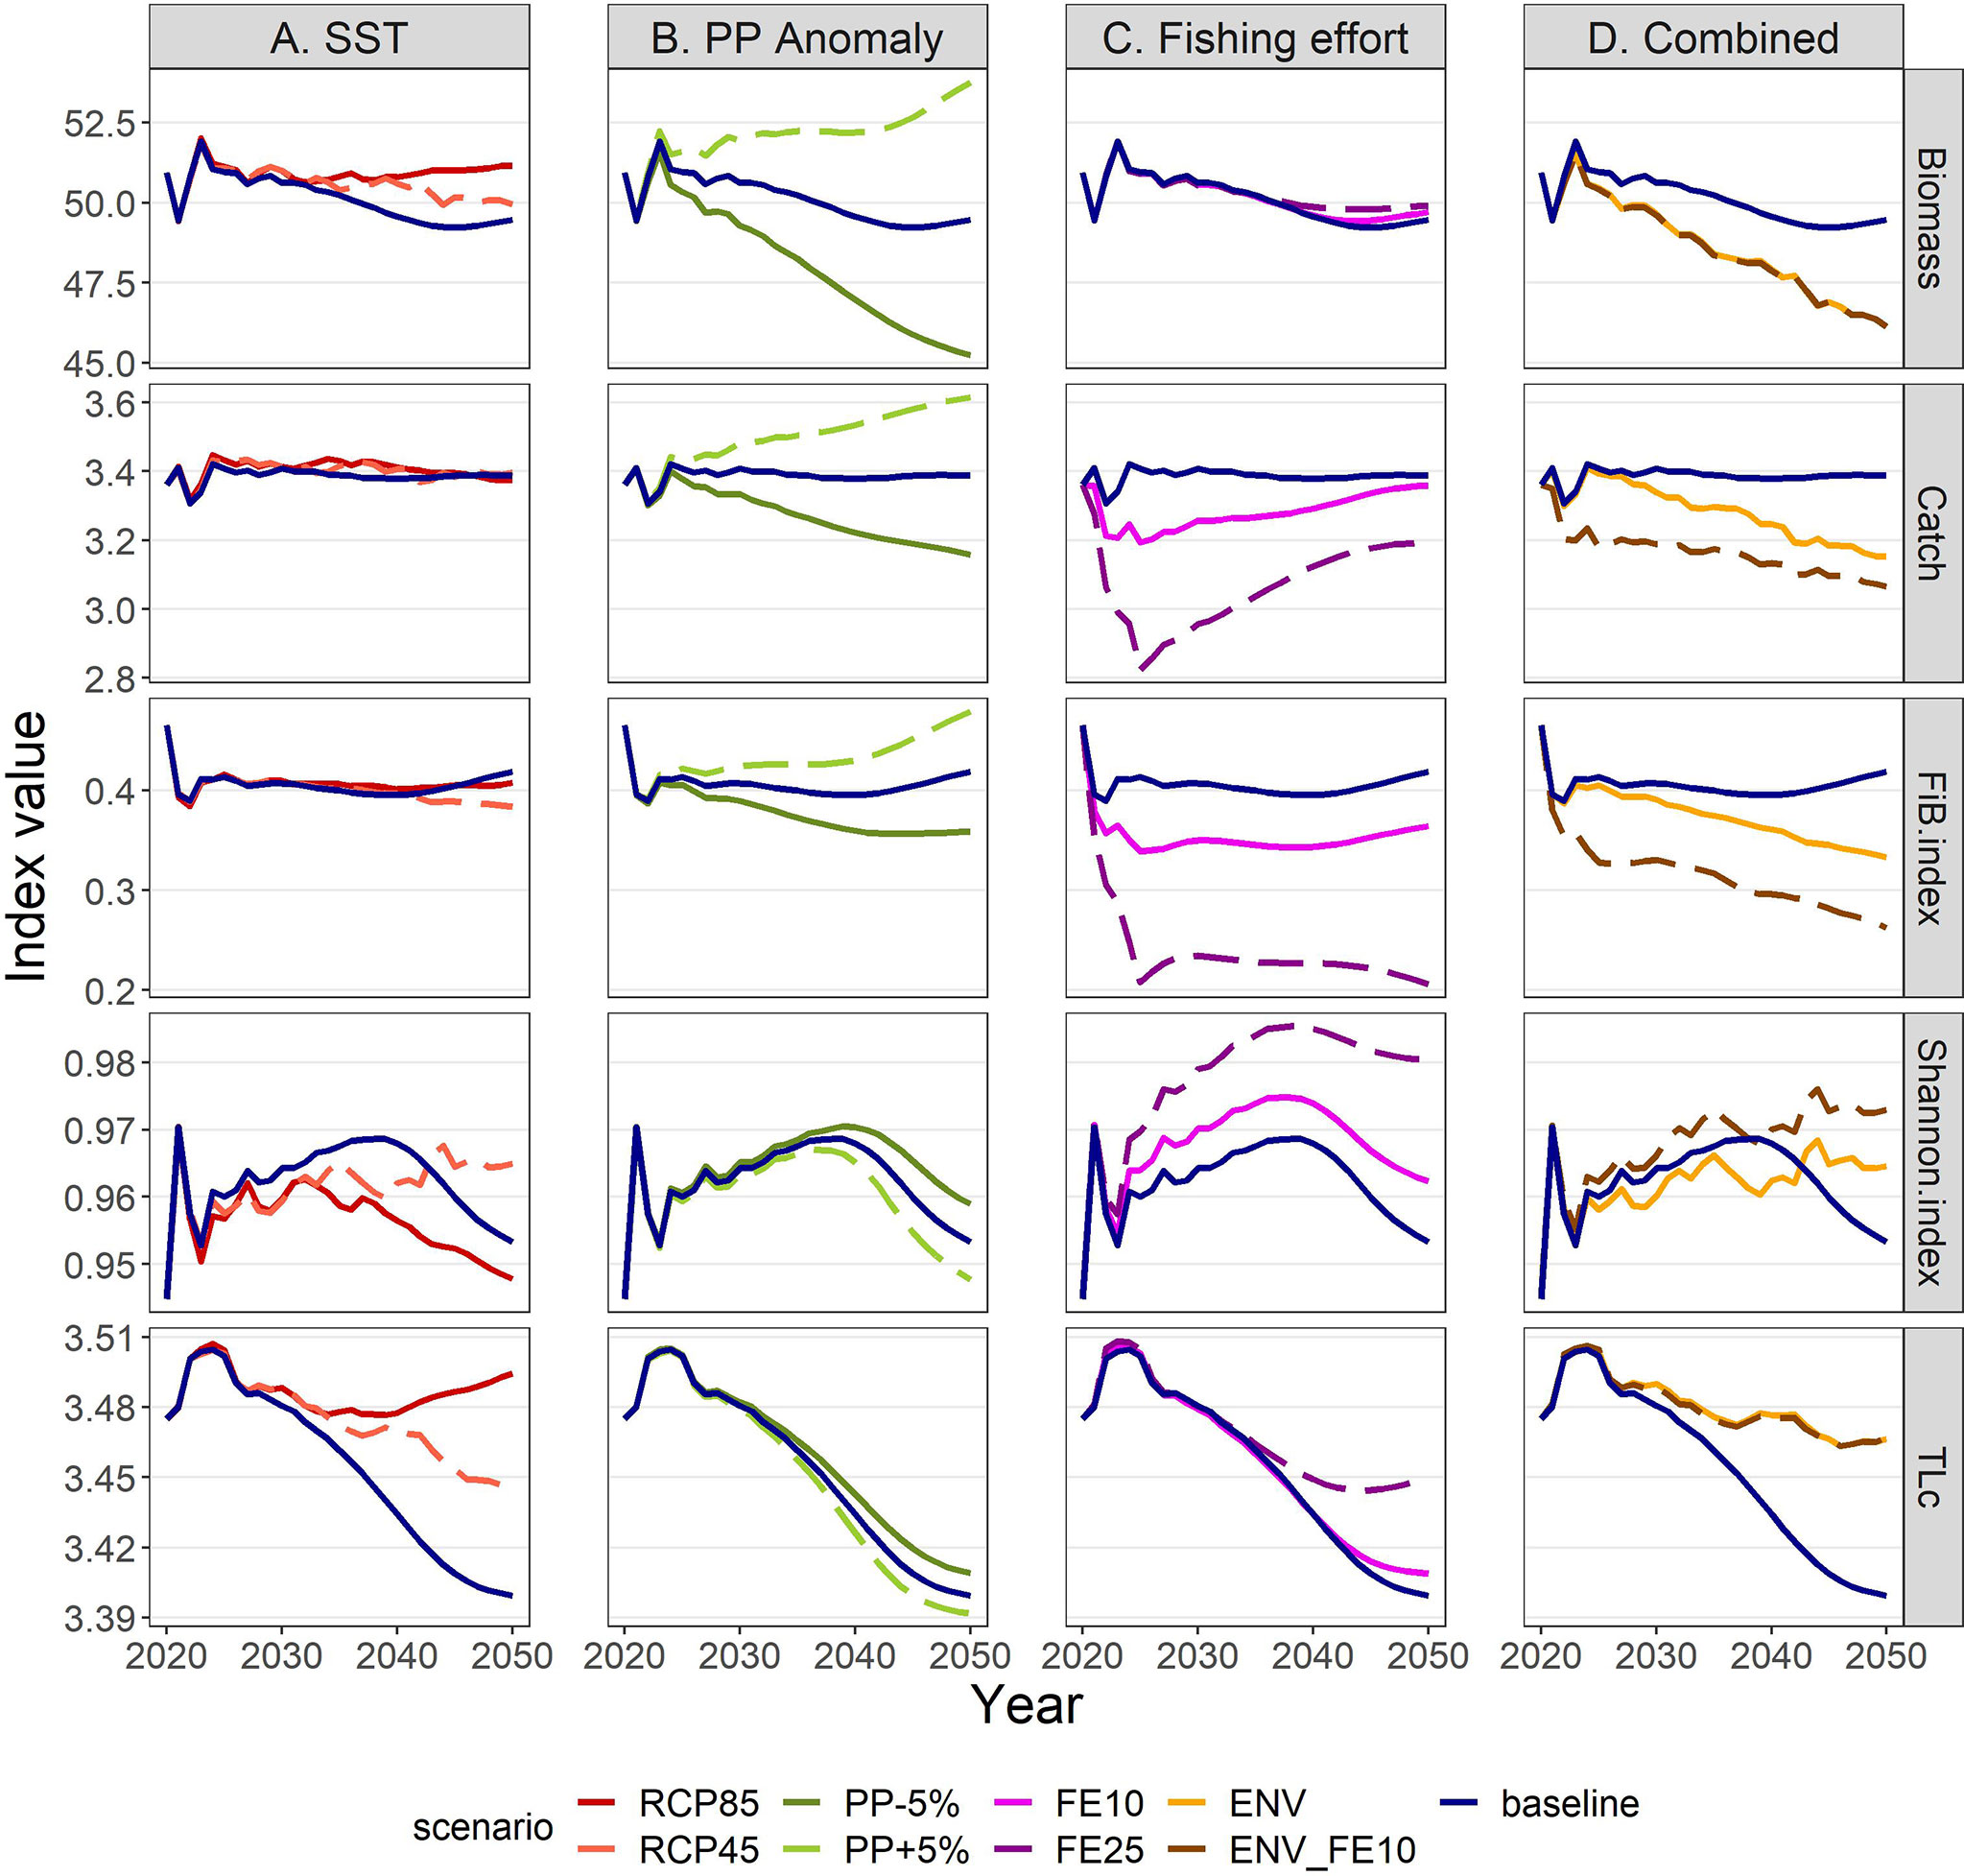
Figure 11 Ecological and exploitation indices under scenarios related to (A) SST, (B) PP Anomaly, (C) fishing effort and (D) combination of drivers. The description of the scenarios is provided in Table 2. Biomass in t*km-2; Catch in t*km-2*y-1.
The future scenarios with PP Anomaly had more straightforward effects on the FGs’ biomasses and catches. In the medium term, almost all FGs showed limited increases in biomasses under increasing trends of PP Anomaly (PP+5%), with other gadiformes, gelatinous plankton and small benthic crustaceans increasing ~5% in the medium term (Figure 8 and Supplementary Material Table S10). In the long term, as PP progressively increased, these changes were even higher (e.g., reaching 24% for other gadiformes); however, few FGs showed slight (blue whiting -1.4%, benthic cephalopods -0.7%) or substantial (benthopelagic fish -69.6%; Figure 8, Supplementary Material Table S11) decrease due to trophic interactions. Under decreasing PP Anomaly (PP-5%), the opposite patterns were evident (biomass: Figure 8; catches: Supplementary Material Figure S5). Among the main commercial FGs, anglerfish and sardine were affected the most, with changes exceeding ±7% by 2050, both in biomass and in catches (Figures 9B, 10B). As expected, total biomass of living groups, total catch as well as the FiB index followed the trends of the PP Anomaly, while the Shannon index and TLc were negatively related to them (i.e., they increased when PP Anomaly decreased and vice versa; Figure 11B).
The horizontal (for all gears) reduction of fishing effort favored mainly the pelagic species, especially mackerels, horse mackerels, medium and large pelagics, sardine, and picarels & bogue. For all these FGs the biomass increase was 2.2 (sardine) to 5.3 (mackerels) times higher in the scenario of 25% effort reduction (FE25) compared to 10% reduction (FE10) in 2030 (Figure 8), while their catches also substantially increased despite the reduced fishing (Supplementary Material Figure S5). A population increase was also forecasted for 19 out of 27 fished FGs, including demersal groups, but was accompanied by a decrease in their catches (Figure 8 and Supplementary Material Figure S5). A neutral or negative impact was identified for prey (e.g., anchovy, benthopelagic fish, blue whiting, mesozooplankton) or scavenging FGs (e.g., Loggerhead turtle, crabs), probably affected by discards reduction (Figure 8). In all cases, the FGs’ response to fishing was quick after changes were applied; however, despite that the changes in fishing effort were restricted to the first five years of the simulations, changes in the FGs’ biomass continued until 2050 and for some of them the biomasses in the two fishing scenarios converged (e.g., sardine) or were even reversed (e.g., anglerfish, hake) (Figure 9C). Therefore, large declines in fishing effort (FE25) did not lead to constantly high biomasses for all species that were initially favored, and this was reflected in their reduced catches towards the end of the forecast period when they diverged more from the baseline and the FE10 scenarios (Figure 10C). FE25 and FE10 led to reduction of total catches by 13.2% and 4.4% respectively in 2030 (Supplementary Table S12), however, in the long term (2046-2050), divergence from the baseline scenario was reduced to -5.9% and -1% respectively (Supplementary Table S13). Total catch, FiB and Shannon indices changed abruptly in the first five years but followed almost parallel trajectories with the baseline scenario when fishing was stabilized to new levels (i.e., in 2025; Figure 11). On the other hand, total biomass and TLc were close to the baseline in the early years and started to diverge after 2035. The FiB index was higher in the baseline scenario compared to less fishing, while the contrary was forecasted for Shannon diversity index and TLc which increased at relaxed fishing effort (Figure 11).
In the combined environmental scenario (ENV), impacts of reduced productivity were added to temperature effects, resulting in lower biomass increases for winners of sea warming (e.g., demersal fish 2, 4 and benthopelagic fish) and even higher decreases for losers (e.g., other gadiformes, horse mackerels and Norway lobster), both in medium and long term basis (Figure 8). Losses were high in terms of biomass (Figure 9D) and catches (Figure 10D) for shrimps, red mullets, sardine and even anchovy (which responded positively to temperature increase alone), while for anglerfish and hake, gains were only temporary and/or lower than in the RCP45 scenario. The loss in total catches reached 6.5% in the period 2046-2050 (Supplementary Table S13). Biomass losses were compensated when applying a 10% reduction in fishing effort (ENV_FE10 scenario) which resulted in improving the population trends for most FGs and reversing negative trends for a limited number of FGs such as sardine in the short term and mackerels, horse mackerels, picarels & bogue for the whole forecast period (Figures 8, 9D). However, compared to the baseline scenario, total catches declined even more (by 9%) than they did in the ENV scenario, since the higher catches for few pelagic groups were not enough to balance losses from the remaining groups (Supplementary Figure S5). At the ecosystem level, Shannon diversity index was higher in ENV_FE10 compared to the baseline and to ENV, the opposite was observed for the FiB index, while total biomass of living groups and TLc were almost identical in the two combined scenarios (Figure 11D).
4 Discussion
4.1 Hindcast Period
A novel Ecopath model for the N. Aegean Sea considering 1993 as the starting year was developed by updating a previously published model for the mid-2000s (Tsagarakis et al., 2010). This model forms the basis for the development of the time dynamic Ecosim module that was able to describe food web changes in the N. Aegean Sea ecosystem after fitting to observed time series for the period 1993-2020. The available time series concerned mainly fish and commercial invertebrate groups and were largely missing for low trophic level groups such as plankton, benthic invertebrates and other preys (e.g., benthopelagic/mesopelagic fish); regular monitoring for such groups could help to fine-tune trophic interactions in the food web and lead to better representation of ecosystem processes and more effective models for operational use.
The hindcast period is characterized by a reduction in the fishing fleets, increase in sea water temperature (Skliris et al., 2011; Stergiou et al., 2016) as well as shifts in the biological components (Damalas et al., 2021) such as catches and biomasses, both at community and species level (e.g. Farriols et al., 2019; Tserpes et al., 2019). The Ecosim model best fitted to observations included trophic interactions (estimated vulnerabilities), which improved the model fit more than any other driver in all steps of the fitting procedure. Overall, the observed changes in the hindcast period were a result of the synergistic effect of fishing and environmental variability (SST and PP Anomaly).
The best model included dynamics of total GT assuming an annual technology creep factor of 0.79% for bottom trawls and 2% for the remaining gears, as proxy for the fishing effort. The technology creep factor reflects in practice changes in catchability due to improvement of fishing gears and other equipment. The application of this level of technology creep, which is often neglected in fisheries management (Eigaard et al., 2014), leads to lower rate of reduction of the nominal fishing capacity, or even to increases in some fleets, despite the long-lasting efforts to reduce the number of vessels in all Mediterranean waters (Eurostat, 2021). This was observed also in other systems (see Fortibuoni et al., 2017) and should be carefully taken into account for policy design and enforcement, especially in a management system based on effort control, like the Mediterranean Sea (Bellido et al., 2020).
In addition to fishing effort, the inclusion of thermal responses and SST as a driver for the period 1993-2020 improved the model fit. This result supports the findings that climate change has already affected the communities and/or composition of catches in several Mediterranean ecosystems (e.g. Corrales et al., 2017) and the Mediterranean as a whole (Tzanatos et al., 2014), as well as the composition of landings and demersal communities in the Aegean Sea (Tsikliras et al., 2015). The incorporation of FGs’ responses to climate change within the N. Aegean Sea model, apart from improving its explanatory power, it also provided the possibility of using the model as a tool to explore the directions of change in climate simulations.
The inclusion of a model-derived PP Anomaly in the final selected Ecosim model confirms the importance of productivity trends in the Mediterranean ecosystems (Piroddi et al., 2017). This PP Anomaly showed positive correlation with the North Atlantic Oscillation (NAO) of the previous year (1 year lag). NAO is a large-scale climatic oscillation which can affect fisheries in the North Atlantic region and the Mediterranean Sea, with effects on abundance, recruitment, catchability and body condition (Báez et al., 2021). In the Aegean Sea, it has been shown to affect the anchovy/sardine catch ratio with one year lag (Katara et al., 2011), similarly to our findings, and which is possibly explained by a lag in recruitment or other processes (Báez et al., 2021).
Several FGs were heavily fished at the beginning of the hindcast period (see F/Z estimated ratios for NAS1990, Table S8). A peak in total landings has been recorded in 1994, followed by a decreasing trend for many years, not only in the study area but for the whole of Greek landings (Moutopoulos et al., 2014). Lower landings were accompanied by decreasing biomass trends for several FGs, and by decline in nominal fishing capacity which took place mostly after the late 1990s. These dynamics are coherent with an overexploitation process that was likely taking place in the Mediterranean fisheries (Vasilakopoulos et al., 2014) and/or the effect of environmental processes and climate that reduced carrying capacity. A regime shift linked to such processes, mainly climate change, has been identified in the Aegean Sea for the early 1990s (Damalas et al., 2021). Similarly, in the Adriatic Sea, multivariate analysis showed that the species composition of landings during 1994-2008 differed from the previous (1986–1993) and the following (2009-2015) periods (Fortibuoni et al., 2017). This time frame (i.e., 1994-2008) is very similar with the period of decreasing biomasses and landings in the N. Aegean Sea observed in our study (i.e., 1994-2010). Further considering the timing (i.e. early 1990s) of the shift identified by Damalas et al. (2021), it is probable that these environmental effects concern a wider scale, for at least part of the Mediterranean Sea. In the Aegean Sea, the overexploited status of fisheries resources at that period may have contributed to this shift by reducing their resilience (Damalas et al., 2021). Even though the authors consider unlikely for the ecosystem to return to its pre-1990s state (Damalas et al., 2021), our study reveals that the N. Aegean Sea showed signs of quick recovery in terms of total biomass, catches and other ecosystem indicators in the last decade (2011-2020). However, this doesn’t mean that the previous state is met, since differences in the relative biomass (and catches) of FGs are evident at the end of the hindcast period in relation to the early 1990s. This partial recovery might be the result of reduction of fishing effort - which resulted in some fleets (e.g., bottom trawls) even after accounting for technology creep – and of some technical measures that have been applied in the past decade, such as the increase in cod-end mesh size and the partial reallocation of fishing effort from shallow to deeper waters for bottom trawls (Council Regulation (EC) No 1967/2006). These measures are not considered adequate to ensure the sustainability of the stocks (Vasilakopoulos et al., 2020; Lucchetti et al., 2021), but they may have contributed to the observed improvement, at least for some species (e.g. red mullets; Tserpes et al., 2019).
4.2 Climate Simulations and Fishing Scenarios
Future scenarios incorporating IPCC temperature projections forecasted substantial changes in the North Aegean Sea communities. Positive effects were most frequent for demersal FGs, contrary to what was predicted by a Mediterranean-wide multi-species model (Moullec et al., 2019). In addition, pelagic predators such as medium and large pelagic fish, and dolphins, were favored like in other works (Libralato et al., 2015). The changes observed for each FG resulted from a combination of direct thermal responses and trophic cascading effects. Certain FGs (e.g., blue whiting, demersal fish 3, benthic cephalopods) showed less severe changes under the most extreme climate simulation (RCP85), which seems to be an outcome of complex trophic effects rather than direct impact of temperature, highlighting the importance of using multi-species models to detect possible ecosystem and resource responses.
According to the increasing SST simulations, total catches didn’t seem to be substantially affected, in line with Moullec et al. (2019). However, important changes were observed at the FG level, with some of the main commercial groups (hake, benthic cephalopods) increasing and others (shrimps, red mullets) decreasing. Recently, using an hydrodynamic/biogeochemical low-trophic level model coupled with an individual-based (IBM) model, Gkanasos et al. (2021) forecasted negative climate effects on both anchovy and sardine in the North Aegean Sea due to reduced zooplankton concentrations under IPCC scenarios. Their results also showed that anchovy was impacted more than sardine because of great overlap between anchovy spawning and larval growth periods with the period of maximum yearly temperature and low prey concentration (Gkanasos et al., 2021). On the other hand, at the Mediterranean scale, positive response to climate change have been predicted for both small pelagic species (Moullec et al., 2019). Contrasting predictions on species responses is not uncommon in ecological research, not only as an outcome of the variety of methodologies applied, data used and assumptions made, but also due to different responses in each ecosystem. As an example for the latter, hake was found to be threatened by seawater warming in the Israeli Mediterranean continental shelf, contrary to the N. Aegean Sea, but SST in the southeast Mediterranean is 4-5°C warmer than in the N. Aegean and devstes much more than hake’s optimal temperature based on AquaMaps data (Corrales et al., 2018).
One limitation of the current modelling approach is that for multi-species FGs, the model cannot appropriately take into account contrasting specific thermal responses of species composing the FG. One approach to deal with this issue could be to define FGs according to a wider suite of ecological traits (e.g. Papapanagiotou et al., 2020) including responses to temperature, or even using them as the main criterion. Such an approach would be very useful in studies placing more focus on climate change, but it might limit the potential when other factors (e.g., fisheries, trophic relationships) need to be examined, therefore the model structure (including FG definition) should depend on the specific questions sought.
The increase in primary productivity (PP+5%), which is currently considered the most likely direction (Lazzari et al., 2014; Macias et al., 2015), will result to be beneficial to the ecosystem biomasses and fisheries production in the area. However, recent studies suggest that the productivity trend in the Eastern Mediterranean may be decreasing (Richon et al., 2019) and climate risks for marine ecosystems are globally higher than previously thought (Tittensor et al., 2021). In this direction, simulations of reduced productivity (PP-5%) showed adverse impacts on almost all groups and most ecosystem indicators resulting in declining trends, as expected. However, when the declining PP Anomaly trend was explored simultaneously with the RCP 4.5 temperature simulation (ENV scenario), biomasses, catches and ecosystem indicators showed more complex responses, more negative than the increasing temperature alone (RCP45), but less than the reduction in primary productivity alone (PP-5%). Using results from physical-biogeochemical climatic scenarios (e.g. Reale et al., 2020) might help to directly embed in ecosystem models main bottom-up effects of climatic changes in plankton community due to several factors that spam from modification of nutrient inputs, general circulation and mixing, and plankton responses to temperature changes. Thus, future efforts to produce realistic climate scenarios of bottom-up effects might account forcings obtained from coupled physical and biogeochemical models’ scenarios.
Apart from temperature and productivity, climate change effects include several features that cannot be directly taken into account in our approach, such as shifts in species distributions, species invasions, changes in water circulation, increased acidification and hypoxia. Therefore, the climate simulations applied in the current study aim to explore the directions of change and their possible magnitude rather than to predict the precise levels of change. The reduction of fishing effort (ENV_FE10 scenario) reduces the climate impacts to some extend by leading to increased biodiversity (Shannon index) and by mitigating biomass decreases or even reversing the negative trends for some FGs. Although this comes with a moderate loss in total fisheries production, this may be a price worth paying in order to preserve ecosystem structure and functioning under continuous environmental changes. These results support the expectations that ecosystems in good environmental status with high diversity and which are exploited sustainably show higher resilience to climate change (Gaines et al., 2018). Thus sustainable fisheries production, even under climate change, mainly depends on the effectiveness of the fisheries management (Barange, 2019).
When explored under constant environmental conditions, the fishing simulations produced relatively similar results as in other Eastern Mediterranean ecosystems (e.g. the adjacent Thermaikos Gulf; Dimarchopoulou et al., 2022). The reduction of fishing effort leads to quick and substantial biomass increase for most species, but also to reduced catches. However, for some of the most exploited FGs (e.g., medium pelagics, sardine) this increase was so high that was able to compensate for the lower levels of fishing and to lead to higher catches. An abrupt (25%, FE25) decrease in fishing resulted in large changes in relative biomass in the medium term, characterized by impressive recovery for most of the exploited predatory FGs and decline of their preys (fish and invertebrates), in line with other similar exercises; however, these changes did not result in a new equilibrium of high biomasses for commercial species and the medium-term increases were not fully sustained in the long term, at least not for all benefitted species. Contrary, the more moderate (10%, FE10) decrease in fishing effort resulted in fewer fluctuations throughout the forecast period, but still with important gains for commercial species in terms of biomass and very small losses in catches in the long term. In addition, since for many FGs the reduction in effort is relatively proportional to the reduction in catches, a horizontal effort reduction might not be the best strategy; instead, targeted effort reduction in gears whose target species are more exploited, might yield the best results and is worth exploring in a management strategy evaluation framework. In a further step, taking into account species traits and permitting more effort for gears that exploit species that may be favored by new environmental conditions, could be a tool to mitigate ecosystem impacts under climate risk (Papapanagiotou et al., 2020).
Data Availability Statement
The data analyzed in this study is subject to the following licenses/restrictions: all data can be found in freely available databases, except data for scientific surveys which are subject to restrictions and a specific request should be addressed to DG MARE and/or DCF National correspondents. Requests to access these datasets should be directed to https://datacollection.jrc.ec.europa.eu/.
Author Contributions
KTs, SL, AM, MG, and SS designed the study. KTo, SK, MG, GP, and CF processed and provided data and contributed to the analysis. MS acquired funding and coordinated the project. KTs performed the analysis and wrote the first draft. All authors interpreted results, contributed to writing and/or editing and approved the final draft.
Funding
The current work was supported by the research project “ANATHALLOI - Development of management tools for marine and freshwater ecosystems” MIS 5002500, funded by Greece and the European Regional Development Fund under the Operational Program “Competitiveness, Entrepreneurship and Innovation, NSRF 2014–2020”. Earlier versions of the models were developed under the projects “PERSEUS: Policy-oriented marine Environmental Research for the Southern European Seas” (European Commission’s 7th Framework Research Program (FP7); Grant Agreement No. 287600), “DISCATCH: Pilot project Catch and discard composition including solutions for limitation and possible elimination of unwanted bycatches in trawl net fisheries in the Mediterranean” (DG MARE/2012/24-Lot 2 SI2.672370) and “MINOUW: Science, Technology and Society Initiative to minimize Unwanted Catches in European Fisheries” (European Commission’s Horizon 2020 Research and Innovation Program; Grant Agreement No. 634495).
Conflict of Interest
The authors declare that the research was conducted in the absence of any commercial or financial relationships that could be construed as a potential conflict of interest.
Publisher’s Note
All claims expressed in this article are solely those of the authors and do not necessarily represent those of their affiliated organizations, or those of the publisher, the editors and the reviewers. Any product that may be evaluated in this article, or claim that may be made by its manufacturer, is not guaranteed or endorsed by the publisher.
Acknowledgments
Part of the data used in this work, were collected under Greece’s Data Collection Framework (National Program for the Collection of Fisheries Data), funded by Greece (Ministry of Rural Development and Food, Directorate General of Fisheries) and the European Union. We also thank the three reviewers for their comments and suggestions that helped improve the manuscript.
Supplementary Material
The Supplementary Material for this article can be found online at: https://www.frontiersin.org/articles/10.3389/fmars.2022.919793/full#supplementary-material
References
Adloff F., Somot S., Sevault F., Jordà G., Aznar R., Déqué M., et al. (2015). Mediterranean Sea Response to Climate Change in an Ensemble of Twenty First Century Scenarios. Clim. Dyn. 45, 2775–2802. doi: 10.1007/s00382-015-2507-3
Ahrens R. N. M., Walters C. J., Christensen V. (2012). Foraging Arena Theory. Fish. Fisheries. 13, 41–59. doi: 10.1111/j.1467-2979.2011.00432.x
Angilletta M. J. (2006). Estimating and Comparing Thermal Performance Curves - ScienceDirect. J. Thermal. Biol. 31, 541–545. doi: 10.1016/j.jtherbio.2006.06.002
Araújo J. N., Mackinson S., Stanford R. J., Sims D. W., Southward A. J., Hawkins S. J., et al. (2006). Modelling Food Web Interactions, Variation in Plankton Production, and Fisheries in the Western English Channel Ecosystem. Mar. Ecol. Prog. Ser. 309, 175–187. doi: 10.3354/meps309175
Báez J. C., Gimeno L., Real R. (2021). North Atlantic Oscillation and Fisheries Management During Global Climate Change. Rev. Fish. Biol. Fisheries. 31, 319–336. doi: 10.1007/s11160-021-09645-z
Barange M. (2019). Avoiding Misinterpretation of Climate Change Projections of Fish Catches. ICES. J. Mar. Sci. 76, 1390–1392. doi: 10.1093/icesjms/fsz061
Bellido J. M., Sumaila U. R., Sánchez-Lizaso J. L., Palomares M. L., Pauly D. (2020). Input Versus Output Controls as Instruments for Fisheries Management With a Focus on Mediterranean Fisheries. Mar. Policy 118, 103786. doi: 10.1016/j.marpol.2019.103786
Bentley J. W., Serpetti N., Heymans J. J. (2017). Investigating the Potential Impacts of Ocean Warming on the Norwegian and Barents Seas Ecosystem Using a Time-Dynamic Food-Web Model. Ecol. Model. 360, 94–107. doi: 10.1016/j.ecolmodel.2017.07.002
Bundy A., Chuenpagdee R., Boldt J. L., de Fatima Borges M., Camara M. L., Coll M., et al. (2017). Strong Fisheries Management and Governance Positively Impact Ecosystem Status. Fish. Fisheries. 18, 412–439. doi: 10.1111/faf.12184
Cardinale M., Linder M., Bartolino V., Maiorano L., Casini M. (2009). Conservation Value of Historical Data: Reconstructing Stock Dynamics of Turbot During the Last Century in the Kattegat-Skagerrak. Mar. Ecol. Prog. Ser. 386, 197–206. doi: 10.3354/meps08076
Celić I., Libralato S., Scarcella G., Raicevich S., Marčeta B., Solidoro C., et al. (2018). Ecological and Economic Effects of the Landing Obligation Evaluated Using a Quantitative Ecosystem Approach: A Mediterranean Case Study. ICES. J. Mar. Sci. 75, 1992–2003. doi: 10.1093/icesjms/fsy069
CERES (2018). “Deliverable D1.3. Projections of Physical and Biogeochemical Parameters and Habitat Indicators for European Seas, Including Synthesis of Sea Level Rise and Storminess,” in EU H2020 CERES Project. “Climate Change and European Aquatic RESources”. Available at: https://ec.europa.eu/research/participants/documents/downloadPublic?documentIds=080166e5b9fdf8fb&appId=PPGMS.
Chefaoui R. M., Duarte C. M., Serrão E. A. (2018). Dramatic Loss of Seagrass Habitat Under Projected Climate Change in the Mediterranean Sea. Global Change Biol. 24, 4919–4928. doi: 10.1111/gcb.14401
Christensen V. (2000). Indicators for Marine Ecosystems Affected by Fisheries. Mar. Freshw. Res. 51, 447–450. doi: 10.1071/mf99085
Christensen V., Walters C. J. (2004). Ecopath With Ecosim: Methods, Capabilities and Limitations. Ecol. Model. 172, 109–139. doi: 10.1016/j.ecolmodel.2003.09.003
Christensen V., Walters C. J., Pauly D., Forrest R. (2008). “Ecopath With Ecosim Version 6 User Guide,” in Lenfest Ocean Futures Project, vol. 2008. .
Colléter M., Valls A., Guitton J., Gascuel D., Pauly D., Christensen V. (2015). Global Overview of the Applications of the Ecopath With Ecosim Modeling Approach Using the EcoBase Models Repository. Ecol. Model. 302, 42–53. doi: 10.1016/j.ecolmodel.2015.01.025
Coll M., Libralato S. (2012). Contributions of Food Web Modelling to the Ecosystem Approach to Marine Resource Management in the Mediterranean Sea. Fish. Fisheries. 13, 60–88. doi: 10.1111/j.1467-2979.2011.00420.x
Colloca F., Mastrantonio G., Lasinio G. J., Ligas A., Sartor P. (2014). Parapenaeus Longirostris (Lucas 1846) an Early Warning Indicator Species of Global Warming in the Central Mediterranean Sea. J. Mar. Syst. 138, 29–39. doi: 10.1016/j.jmarsys.2013.10.007
Colloca F., Scarcella G., Libralato S. (2017). Recent Trends and Impacts of Fisheries Exploitation on Mediterranean Stocks and Ecosystems. Front. Mar. Sci. 4. doi: 10.3389/fmars.2017.00244
Corrales X., Coll M., Ofir E., Heymans J. J., Steenbeek J., Goren M., et al. (2018). Future Scenarios of Marine Resources and Ecosystem Conditions in the Eastern Mediterranean Under the Impacts of Fishing, Alien Species and Sea Warming. Sci. Rep. 8, 14284. doi: 10.1038/s41598-018-32666-x
Corrales X., Coll M., Ofir E., Piroddi C., Goren M., Edelist D., et al. (2017). Hindcasting the Dynamics of an Eastern Mediterranean Marine Ecosystem Under the Impacts of Multiple Stressors. Mar. Ecol. Prog. Ser. 580, 17–36. doi: 10.3354/meps12271
Criado-Aldeanueva F., Soto-Navarro J. (2020). Climatic Indices Over the Mediterranean Sea: A Review. Appl. Sci. 10, 5790. doi: 10.3390/app10175790
Damalas D., Maravelias C. D., Kavadas S. (2014). Advances in Fishing Power: A Study Spanning 50 Years. Rev. Fisheries. Sci. Aquaculture. 22, 112–121. doi: 10.1080/10641262.2013.839620
Damalas D., Sgardeli V., Vasilakopoulos P., Tserpes G., Maravelias C. (2021). Evidence of Climate-Driven Regime Shifts in the Aegean Sea’s Demersal Resources: A Study Spanning Six Decades. Ecol. Evol. 11, 16951–16971. doi: 10.1002/ece3.8330
Dimarchopoulou D., Tsagarakis K., Sylaios G., Tsikliras A. C. (2022). Ecosystem Trophic Structure and Fishing Effort Simulations of a Major Fishing Ground in the Northeastern Mediterranean Sea (Thermaikos Gulf). Estuarine. Coast. Shelf. Sci. 264, 107667. doi: 10.1016/j.ecss.2021.107667
Eigaard O. R., Marchal P., Gislason H., Rijnsdorp A. D. (2014). Technological Development and Fisheries Management. Rev. Fisheries. Sci. Aquaculture. 22, 156–174. doi: 10.1080/23308249.2014.899557
ELSTAT (2021) Quantity of Fish Landed by Fishing Area and Fishing Tools. Available at: http://www.statistics.gr.
Eurostat (2021) Fishing Fleet by Type of Gear and Engine Power. Available at: https://ec.europa.eu/eurostat.
FAO (2020). The State of Mediterranean and Black Sea Fisheries 2020 (Rome, Italy: FAO). doi: 10.4060/cb2429en
Farriols M. T., Ordines F., Carbonara P., Casciaro L., Lorenzo M. D., Esteban A., et al. (2019). Spatio-Temporal Trends in Diversity of Demersal Fish Assemblages in the Mediterranean. Scientia. Marina. 83, 189–206. doi: 10.3989/scimar.04977.13A
Fortibuoni T., Giovanardi O., Pranovi F., Raicevich S., Solidoro C., Libralato S. (2017). Analysis of Long-Term Changes in a Mediterranean Marine Ecosystem Based on Fishery Landings. Front. Mar. Sci. 4. doi: 10.3389/fmars.2017.00033
Frangoulis C., Grigoratou M., Zoulias T., Hannides C. C. S., Pantazi M., Psarra S., et al. (2017). Expanding Zooplankton Standing Stock Estimation From Meso- to Metazooplankton: A Case Study in the N. Aegean Sea (Mediterranean Sea). Continental. Shelf. Res. 149, 151–161. doi: 10.1016/j.csr.2016.10.004
Gaines S. D., Costello C., Owashi B., Mangin T., Bone J., Molinos J. G., et al. (2018). Improved Fisheries Management Could Offset Many Negative Effects of Climate Change. Sci. Adv. 4, eaao1378. doi: 10.1126/sciadv.aao1378
Geary W. L., Bode M., Doherty T. S., Fulton E. A., Nimmo D. G., Tulloch A. I. T., et al. (2020). A Guide to Ecosystem Models and Their Environmental Applications. Nat. Ecol. Evol., 4:1459–1471. doi: 10.1038/s41559-020-01298-8
Giorgetta M. A., Jungclaus J., Reick C. H., Legutke S., Bader J., Böttinger M., et al. (2013). Climate and Carbon Cycle Changes From 1850 to 2100 in MPI-ESM Simulations for the Coupled Model Intercomparison Project Phase 5. J. Adv. Modeling. Earth Syst. 5, 572–597. doi: 10.1002/jame.20038
Giorgi F., Lionello P. (2008). Climate Change Projections for the Mediterranean Region. Global Planetary. Change 63, 90–104. doi: 10.1016/j.gloplacha.2007.09.005
Gkanasos A., Schismenou E., Tsiaras K., Somarakis S., Giannoulaki M., Sofianos S., et al. (2021). A Three Dimensional, Full Life Cycle, Anchovy and Sardine Model for the North Aegean Sea (Eastern Mediterranean): Validation, Sensitivity and Climatic Scenario Simulations. Mediterr. Mar. Sci. 22, 653–668. doi: 10.12681/mms.27407
Heymans J. J., Coll M., Link J. S., Mackinson S., Steenbeek J., Walters C., et al. (2016). Best Practice in Ecopath With Ecosim Food-Web Models for Ecosystem-Based Management. Ecol. Model. 331, 173–184. doi: 10.1016/j.ecolmodel.2015.12.007
Hidalgo M., Mihneva V., Vasconcellos M., Bernal M. (2018). “Climate Change Impacts, Vulnerabilities and Adaptations: Mediterranean Sea and the Black Sea Marine Fisheries,” in Impacts of Climate Change on Fisheries and Aquaculture FAO Fisheries and Aquaculture Technical Paper (FAO) Rome, Italy, vol. 139. ( FAO).
Holsman K. K., Haynie A. C., Hollowed A. B., Reum J. C. P., Aydin K., Hermann A. J., et al. (2020). Ecosystem-Based Fisheries Management Forestalls Climate-Driven Collapse. Nat. Commun. 11, 4579. doi: 10.1038/s41467-020-18300-3
ICES (2000) Report of the Working Group on Seabird Ecology. Available at: http://www.ices.dk/reports/occ/2000/.
Innes S., Lavigne D. M., Earle W. M., Kovacs K. M. (1987). Feeding Rates of Seals and Whales. J. Anim. Ecol. 56, 115–130. doi: 10.2307/4803
Kaschner K., Kesner-Reyes K., Garilao C., Segschneider J., Rius-Barile J., Rees T., et al. (2021). AquaMaps: Predicted Range Maps for Aquatic Species. Aquamaps.
Katara I., Pierce G., Illian J., Scott B. (2011). Environmental Drivers of the Anchovy/Sardine Complex in the Eastern Mediterranean. Hydrobiologia 670, 49–65. doi: 10.1007/s10750-011-0693-5
Kavadas S., Damalas D., Georgakarakos C., Maravelias C. D., Tserpes G., Papaconstantinou C., et al. (2013). IMAS-Fish: Integrated Management System to Support the Sustainability of Greek Fishery Resources. A Multidisciplinary Web-Based Database Management System: Implementation, Capabilities, Utilization and Future Prospects for Fisheries Stakeholders. Mediterr. Mar. Sci. 14, 109–118. doi: 10.12681/mms.324
Labropoulou M., Papaconstantinou C. (2000). Community Structure of Deep-Sea Demersal Fish in the North Aegean Sea (Northeastern Mediterranean). Hydrobiologia 440, 281–296. doi: 10.1023/a:1004199917299
Labropoulou M., Papaconstantinou C. (2004). Community Structure and Diversity of Demersal Fish Assemblages: The Role of Fishery. Scientia. Marina. 68, 215–226. doi: 10.3989/scimar.2004.68s1215
Larkin P. A. (1996). Concepts and Issues in Marine Ecosystem Management. Rev. Fish. Biol. Fisheries. 6, 139–164. doi: 10.1007/BF00182341
Lazzari P., Mattia G., Solidoro C., Salon S., Crise A., Zavatarelli M., et al. (2014). The Impacts of Climate Change and Environmental Management Policies on the Trophic Regimes in the Mediterranean Sea: Scenario Analyses. J. Mar. Syst. 135, 137–149. doi: 10.1016/j.jmarsys.2013.06.005
Leonori I., Tičina V., Giannoulaki M., Hattab T., Iglesias M., Bonanno A., et al. (2021). The History of Hydroacoustic Surveys on Small Pelagic Fishes in the European Mediterranean Sea. Mediterr. Mar. Sci. 22, 751−768. doi: 10.12681/mms.26001
Libralato S., Caccin A., Pranovi F. (2015). Modelling Species Invasions Using Thermal and Trophic Niche Dynamics Under Climate Change. Front. Mar. Sci. 2. doi: 10.3389/fmars.2015.00029
Link J. S. (2002). Ecological Considerations in Fisheries Management: When Does it Matter? Fisheries 27, 10–17. doi: 10.1577/1548-8446(2002)027<0010:ECIFM>2.0.CO;2
Link J. (2010a). Ecosystem-Based Fisheries Management: Confronting Tradeoffs (Cambridge: Cambridge University Press). doi: 10.1017/CBO9780511667091
Link J. S. (2010b). Adding Rigor to Ecological Network Models by Evaluating a Set of Pre-Balance Diagnostics: A Plea for PREBAL. Ecol. Model. 221, 1580–1591. doi: 10.1016/j.ecolmodel.2010.03.012
Lockerbie E., Shannon L., Lynam C., Coll M., Jarre A. (2020). A Comparative Framework to Support an Ecosystem Approach to Fisheries in a Global Context. Ecol. Soc. 25. doi: 10.5751/ES-11508-250216
Lucchetti A., Virgili M., Vasapollo C., Petetta A., Bargione G., Veli D. L., et al. (2021). An Overview of Bottom Trawl Selectivity in the Mediterranean Sea. Mediterr. Mar. Sci. 22, 566–585. doi: 10.12681/mms.26969
Macias D. M., Garcia-Gorriz E., Stips A. (2015)Productivity Changes in the Mediterranean Sea for the Twenty-First Century in Response to Changes in the Regional Atmospheric Forcing (Accessed February 12, 2022).
Melnychuk M. C., Kurota H., Mace P. M., Pons M., Minto C., Osio G. C., et al. (2021). Identifying Management Actions That Promote Sustainable Fisheries. Nat. Sustainability. 4, 440–449. doi: 10.1038/s41893-020-00668-1
Moullec F., Barrier N., Drira S., Guilhaumon F., Marsaleix P., Somot S., et al. (2019). An End-To-End Model Reveals Losers and Winners in a Warming Mediterranean Sea. Front. Mar. Sci. 6. doi: 10.3389/fmars.2019.00345
Moutopoulos D. K., Libralato S., Solidoro C., Erzini K., Stergiou K. (2014). Effect of Landings Data Disaggregation on Ecological Indicators. Mar. Ecol. Prog. Ser. 509, 27–38. doi: 10.3354/meps10856
Nikolioudakis N., Isari S., Pitta P., Somarakis S. (2012). Diet of Sardine Sardina Pilchardus: An ‘End-to-End’ Field Study. Mar. Ecol. Prog. Ser. 453, 173–188. doi: 10.3354/meps09656
Nikolioudakis N., Isari S., Somarakis S. (2014). Trophodynamics of Anchovy in a non-Upwelling System: Direct Comparison With Sardine. Mar. Ecol. Prog. Ser. 500, 215–229. doi: 10.3354/meps10604
Papantoniou G., Giannoulaki M., Stoumboudi M., Lefkaditou E., Tsagarakis K. (2021). Food Web Interactions in a Human Dominated Mediterranean Coastal Ecosystem. Mar. Environ. Res. 172, 105507. doi: 10.1016/j.marenvres.2021.105507
Papapanagiotou G., Tsagarakis K., Koutsidi M., Tzanatos E. (2020). Using Traits to Build and Explain an Ecosystem Model: Ecopath With Ecosim Modelling of the North Aegean Sea (Eastern Mediterranean). Estuarine. Coast. Shelf. Sci. 236, 106614. doi: 10.1016/j.ecss.2020.106614
Pauly D. (1980). On the Interrelationships Between Natural Mortality, Growth Parameters, and Mean Environmental Temperature in 175 Fish Stocks. J. du. Conseil. Conseil. Int. pour. l’Exploration. la. Mer. 39, 175–192. doi: 10.1093/icesjms/39.2.175
Pauly D., Christensen V., Sambilay V. (1990). Some Features of Fish Food Consumption Estimates Used by Ecosystem Modellers.
Piroddi C., Coll M., Liquete C., Macias D., Greer K., Buszowski J., et al. (2017). Historical Changes of the Mediterranean Sea Ecosystem: Modelling the Role and Impact of Primary Productivity and Fisheries Changes Over Time. Sci. Rep. 7, 44491. doi: 10.1038/srep44491
Pitcher T. J., Kalikoski D., Short K., Varkey D., Pramod G. (2009). An Evaluation of Progress in Implementing Ecosystem-Based Management of Fisheries in 33 Countries. Mar. Policy 33, 223–232. doi: 10.1016/j.marpol.2008.06.002
Reale M., Salon S., Somot S., Solidoro C., Giorgi F., Crise A., et al. (2020). Influence of Large-Scale Atmospheric Circulation Patterns on Nutrient Dynamics in the Mediterranean Sea in the Extended Winter Season (October-March) 1961-1999. Climate Res. 82, 117–136. doi: 10.3354/cr01620
Richon C., Dutay J.-C., Bopp L., Le Vu B., Orr J. C., Somot S., et al. (2019). Biogeochemical Response of the Mediterranean Sea to the Transient SRES-A2 Climate Change Scenario. Biogeosciences 16, 135–165. doi: 10.5194/bg-16-135-2019
Sartor P., Sbrana M., Chato Osio G., Ligas A., Reale B., Colloca F., et al. (2011). The 20th Century Evolution of Mediterranean Exploited Demersal Resources Under Increasing Fishing Disturbance and Environmental Change, EVOMED.
Scott E., Serpetti N., Steenbeek J., Heymans J. J. (2016). A Stepwise Fitting Procedure for Automated Fitting of Ecopath With Ecosim Models. SoftwareX 5, 25–30. doi: 10.1016/j.softx.2016.02.002
Serpetti N., Baudron A. R., Burrows M. T., Payne B. L., Helaouët P., Fernandes P. G., et al. (2017). Impact of Ocean Warming on Sustainable Fisheries Management Informs the Ecosystem Approach to Fisheries. Sci. Rep. 7, 13438. doi: 10.1038/s41598-017-13220-7
Skliris N., Sofianos S. S., Gkanasos A., Axaopoulos P., Mantziafou A., Vervatis V. (2011). Long-Term Sea Surface Temperature Variability in the Aegean Sea. Adv. Oceanography. Limnology. 2, 125–139. doi: 10.1080/19475721.2011.601325
Smith A. D. M., Garcia S. M. (2014). Fishery Management: Contrasts in the Mediterranean and the Atlantic. Curr. Biol. 24, R810–R812. doi: 10.1016/j.cub.2014.07.031
Spedicato M. T., Massutí E., Mérigot B., Tserpes G., Jadaud A., Relini G. (2019). The MEDITS Trawl Survey Specifications in an Ecosystem Approach to Fishery Management. Scientia. Marina. 83, 9–20. doi: 10.3989/scimar.04915.11X
Steenbeek J., Corrales X., Platts M., Coll M. (2018). Ecosampler: A New Approach to Assessing Parameter Uncertainty in Ecopath With Ecosim. SoftwareX 7, 198–204. doi: 10.1016/j.softx.2018.06.004
Stergiou K. I., Somarakis S., Triantafyllou G., Tsiaras K. P., Giannoulaki M., Petihakis G., et al. (2016). Trends in Productivity and Biomass Yields in the Mediterranean Sea Large Marine Ecosystem During Climate Change. Environ. Dev. 17, 57–74. doi: 10.1016/j.envdev.2015.09.001
Tittensor D. P., Novaglio C., Harrison C. S., Heneghan R. F., Barrier N., Bianchi D., et al. (2021). Next-Generation Ensemble Projections Reveal Higher Climate Risks for Marine Ecosystems. Nat. Clim. Change 11, 973–981. doi: 10.1038/s41558-021-01173-9
Trenberth K., Zhang R., National Center for Atmospheric Research Staff (2019) The Climate Data Guide: Atlantic Multi-Decadal Oscillation (AMO). Available at: https://climatedataguide.ucar.edu/climate-data/atlantic-multi-decadal-oscillation-amo.
Trites A. W., Christensen V., Pauly D. (1997). Competition Between Fisheries and Marine Mammals for Prey and Primary Production in the Pacific. J. Northwest. Atlantic. Fishery. Sci. 22, 173–187. doi: 10.2960/J.v22.a14
Trochta J. T., Pons M., Rudd M. B., Krigbaum M., Tanz A., Hilborn R. (2018). Ecosystem-Based Fisheries Management: Perception on Definitions, Implementations, and Aspirations. PLoS One 13, e0190467. doi: 10.1371/journal.pone.0190467
Tsagarakis K., Carbonell A., Brčić J., Bellido J., Carbonara P., Casciaro L., et al. (2017). Old Info for a New Fisheries Policy: Discard Ratios and Lengths at Discarding in EU Mediterranean Bottom Trawl Fisheries. Front. Mar. Sci. 4. doi: 10.3389/fmars.2017.00099
Tsagarakis K., Coll M., Giannoulaki M., Somarakis S., Papaconstantinou C., Machias A. (2010). Food-Web Traits of the North Aegean Sea Ecosystem (Eastern Mediterranean) and Comparison With Other Mediterranean Ecosystems. Estuarine. Coast. Shelf. Sci. 88, 233–248. doi: 10.1016/j.ecss.2010.04.007
Tsagarakis K., Giannoulaki M., Pyrounaki M. M., Machias A. (2015). Species Identification of Small Pelagic Fish Schools by Means of Hydroacoustics in the Eastern Mediterranean Sea. Mediterr. Mar. Sci. 16, 151–161. doi: 10.12681/mms.799
Tsagarakis K., Panigada S., Machias A., Giannoulaki M., Foutsi A., Pierantonio N., et al. (2021). Trophic Interactions in the “Small Pelagic Fish - Dolphins – Fisheries” Triangle: Outputs of a Modelling Approach in the North Aegean Sea (Eastern Mediterranean, Greece). Ocean. Coast. Manage. 105474. doi: 10.1016/j.ocecoaman.2020.105474
Tsagarakis K., Vassilopoulou V., Kallianiotis A., Machias A. (2012). Discards of the Purse Seine Fishery Targeting Small Pelagic Fish in the Eastern Mediterranean Sea. Scientia. Marina. 76, 561–572. doi: 10.3989/scimar.03452.02B
Tserpes G., Massutí E., Fiorentino F., Facchini M. T., Viva C., Jadaud A., et al. (2019). Distribution and Spatio-Temporal Biomass Trends of Red Mullets Across the Mediterranean. Scientia. Marina. 83, 43–55. doi: 10.3989/scimar.04888.21A
Tsikliras A. C., Licandro P., Pardalou A., McQuinn I. H., Gröger J. P., Alheit J. (2019). Synchronization of Mediterranean Pelagic Fish Populations With the North Atlantic Climate Variability. Deep. Sea. Res. Part II.: Topical. Stud. Oceanography. 159, 143–151. doi: 10.1016/j.dsr2.2018.07.005
Tsikliras A. C., Peristeraki P., Tserpes G., Stergiou K. I. (2015). Mean Temperature of the Catch (MTC) in the Greek Seas Based on Landings and Survey Data. Front. Mar. Sci. 2. doi: 10.3389/fmars.2015.00023
Tsikliras A. C., Tsiros V. Z., Stergiou K. I. (2013). Assessing the State of Greek Marine Fisheries Resources. Fisheries. Manage. Ecol. 20, 34–41. doi: 10.1111/j.1365-2400.2012.00863.x
Tsimara E., Vasilakopoulos P., Koutsidi M., Raitsos D. E., Lazaris A., Tzanatos E. (2021). An Integrated Traits Resilience Assessment of Mediterranean Fisheries Landings. J. Anim. Ecol. 90, 2122–2134. doi: 10.1111/1365-2656.13533
Tzanatos E., Raitsos D., Triantafyllou G., Somarakis S., Tsonis A. (2014). Indications of a Climate Effect on Mediterranean Fisheries. Climatic. Change 122, 41–54. doi: 10.1007/s10584-013-0972-4
Vasilakopoulos P., Jardim E., Konrad C., Rihan D., Mannini A., Pinto C., et al. (2020). Selectivity Metrics for Fisheries Management and Advice. Fish. Fisheries. 21, 621–638. doi: 10.1111/faf.12451
Keywords: climate change, food web, ecosystem modelling, ecosystem approach to fisheries (EAF), trophic interactions, fisheries management, Mediterranean Sea, mixed fisheries
Citation: Tsagarakis K, Libralato S, Giannoulaki M, Touloumis K, Somarakis S, Machias A, Frangoulis C, Papantoniou G, Kavadas S and Stoumboudi MT (2022) Drivers of the North Aegean Sea Ecosystem (Eastern Mediterranean) Through Time: Insights From Multidecadal Retrospective Analysis and Future Simulations. Front. Mar. Sci. 9:919793. doi: 10.3389/fmars.2022.919793
Received: 13 April 2022; Accepted: 13 June 2022;
Published: 15 July 2022.
Edited by:
Neil R. Loneragan, Murdoch University, AustraliaReviewed by:
Zhongxin Wu, Dalian Ocean University, ChinaAngela Cuttitta, Institute for Studies on the Mediterranean, National Research Council (CNR), Italy
Hector Lozano-Montes, Murdoch University, Australia
Copyright © 2022 Tsagarakis, Libralato, Giannoulaki, Touloumis, Somarakis, Machias, Frangoulis, Papantoniou, Kavadas and Stoumboudi. This is an open-access article distributed under the terms of the Creative Commons Attribution License (CC BY). The use, distribution or reproduction in other forums is permitted, provided the original author(s) and the copyright owner(s) are credited and that the original publication in this journal is cited, in accordance with accepted academic practice. No use, distribution or reproduction is permitted which does not comply with these terms.
*Correspondence: Konstantinos Tsagarakis, a29udHNhZ0BoY21yLmdy