 Kitack Lee
 Ja-Myung Kim
 Gyeong-Seok Lee1
 Jin-Yong Jeong
 Jaeik Lee
- 1Division of Environmental Science and Engineering, Pohang University of Science and Technology, Pohang, South Korea
- 2Ocean Research Division, Korea Hydrographic and Oceanographic Agency, Busan, South Korea
- 3Marine Domain Management Research Division, Korea Institute of Ocean Science and Technology, Busan, South Korea
- 4Ocean Climate and Ecology Research Division, National Institute of Fisheries Science, Busan, South Korea
Hourly (2017–2021) to seasonal (2015–2021) inorganic C data were collected at the Ieodo Ocean Research Station (32.07°N and 125.10°E) in the northern East China Sea (ECS), located under the influence of the nutrient-rich Changjiang Diluted Water (CDW). An increase in phytoplankton biomass from April to mid-August (the warming period) equalized much of the temperature-driven increase in the surface pCO2 and thus, made the northern ECS a moderate sink of atmospheric CO2. From November to March (the cooling period), a large pCO2 reduction, driven by a temperature reduction, and a high air–sea CO2 exchange rate, because of high windspeeds, transformed the basin into a substantial CO2 sink, yielding an annual net C uptake of 61.7 g C m–2 yr–1. The effects of biological production and temperature change on seawater pCO2 (and thus, the net air–sea CO2 flux) were decoupled each season and acted in concert to increase the net annual CO2 sink by the region. The present study provided the observational and mechanistic lines of evidence for confirming “continental shelf C pump”—a mechanism in the shallow waters of the continental shelves that accumulate a significant amount of C (via reinforced cooling and promoted biological C uptake) that is transported from the basin surface waters to the interior of the adjacent deep ocean. In the future, an increasing input of anthropogenic nutrients into the northern ECS is likely to make the region a stronger CO2 sink.
Introduction
Unlike major ocean basins, the role of coastal and marginal seas as an anthropogenic CO2 reservoir has been studied less because the small surface area of the global marginal seas (only 7% of the world’s ocean area) may only store small amounts of anthropogenic CO2. Contrary to this paradigm, the marginal seas can absorb substantial amounts of anthropogenic CO2 because the primary producers in those locations use high nutrient loads from adjacent continents and hence, accelerate CO2 transfer by substantially reducing the concentration of surface C (Lee et al., 2011; Najjar et al., 2018). Moreover, the interaction between the resultant planktonic organic matter deposited onto the shallow sediments and the overlying seawater can generate alkalinity, facilitating the transfer of additional anthropogenic CO2 (Thomas et al., 2009). Intrinsically, the air–sea CO2 flux in the coastal and marginal seas is subject to large variabilities with time and location because the complex interactions between natural (e.g., tidal cycle, upwelling, wind-driven mixing, freshwater input, eutrophication, and biological activity) and anthropogenic (e.g., inputs of anthropogenic C and nutrients and ocean temperature increase) factors make estimating the air–sea CO2 flux challenging and often unsuccessful (Park et al., 2006; Dai et al., 2013; Cao et al., 2019). A major hurdle in carrying out such estimates is our inability to capture all major variabilities in the air–sea CO2 flux over the extensive periods covering all seasons.
No exception to this generalization is the East China Sea (ECS), which has an extensive continental shelf covering two-thirds of its area and is surrounded by populated countries (i.e., China, Korea, and Japan). The CO2 emissions from these countries fall within the top tier; however, the successful execution of reforestation in these countries has led to a substantial C uptake by the terrestrial biosphere (Choi et al., 2002; Piao et al., 2009). The ECS is teeming with plankton as a result of nutrient input by the Changjiang River. The addition of these river-borne nutrients has divided the ECS into two distinct regions in terms of nutrient concentration: the northern ECS, which is characterized more by the nutrient input from the Changjiang River (anthropogenic influence), and the central and southern basins, which are more influenced by water exchange with the Kuroshio Current, which lacks nutrients (natural influence) (Zhang et al., 2021). Tropical cyclones are also common in the ECS in summer and fall. To determine if the entire ECS is a net sink or source of atmospheric CO2, the determination of the amount of CO2 that enters the northern ECS (i.e., the areas located between 28.5–33.0°N and 122.5–126.0°E) is critical because this area can be a large C sink as a result of the proliferation of phytoplankton.
Another factor equally acute in determining seawater pCO2 (and thereby net air–sea CO2 flux) in the northern ECS is the seasonal temperature change. The seasonal temperature extremes in the ECS and the adjacent Yellow Sea ranged from 10°–20°C (colors in Figure 1), which are likely the largest seasonal temperature swings in the world’s oceans and arise from a seasonal switchover between a hot and humid North Pacific air mass governing the summertime temperature of the ECS (also the Yellow Sea) and a cold and dry Siberian air mass governing the winter temperature of the same basins (Chang, 2004). From a thermodynamics perspective, a pCO2 change of up to 190 µatm can occur when transitioning from summer to winter.
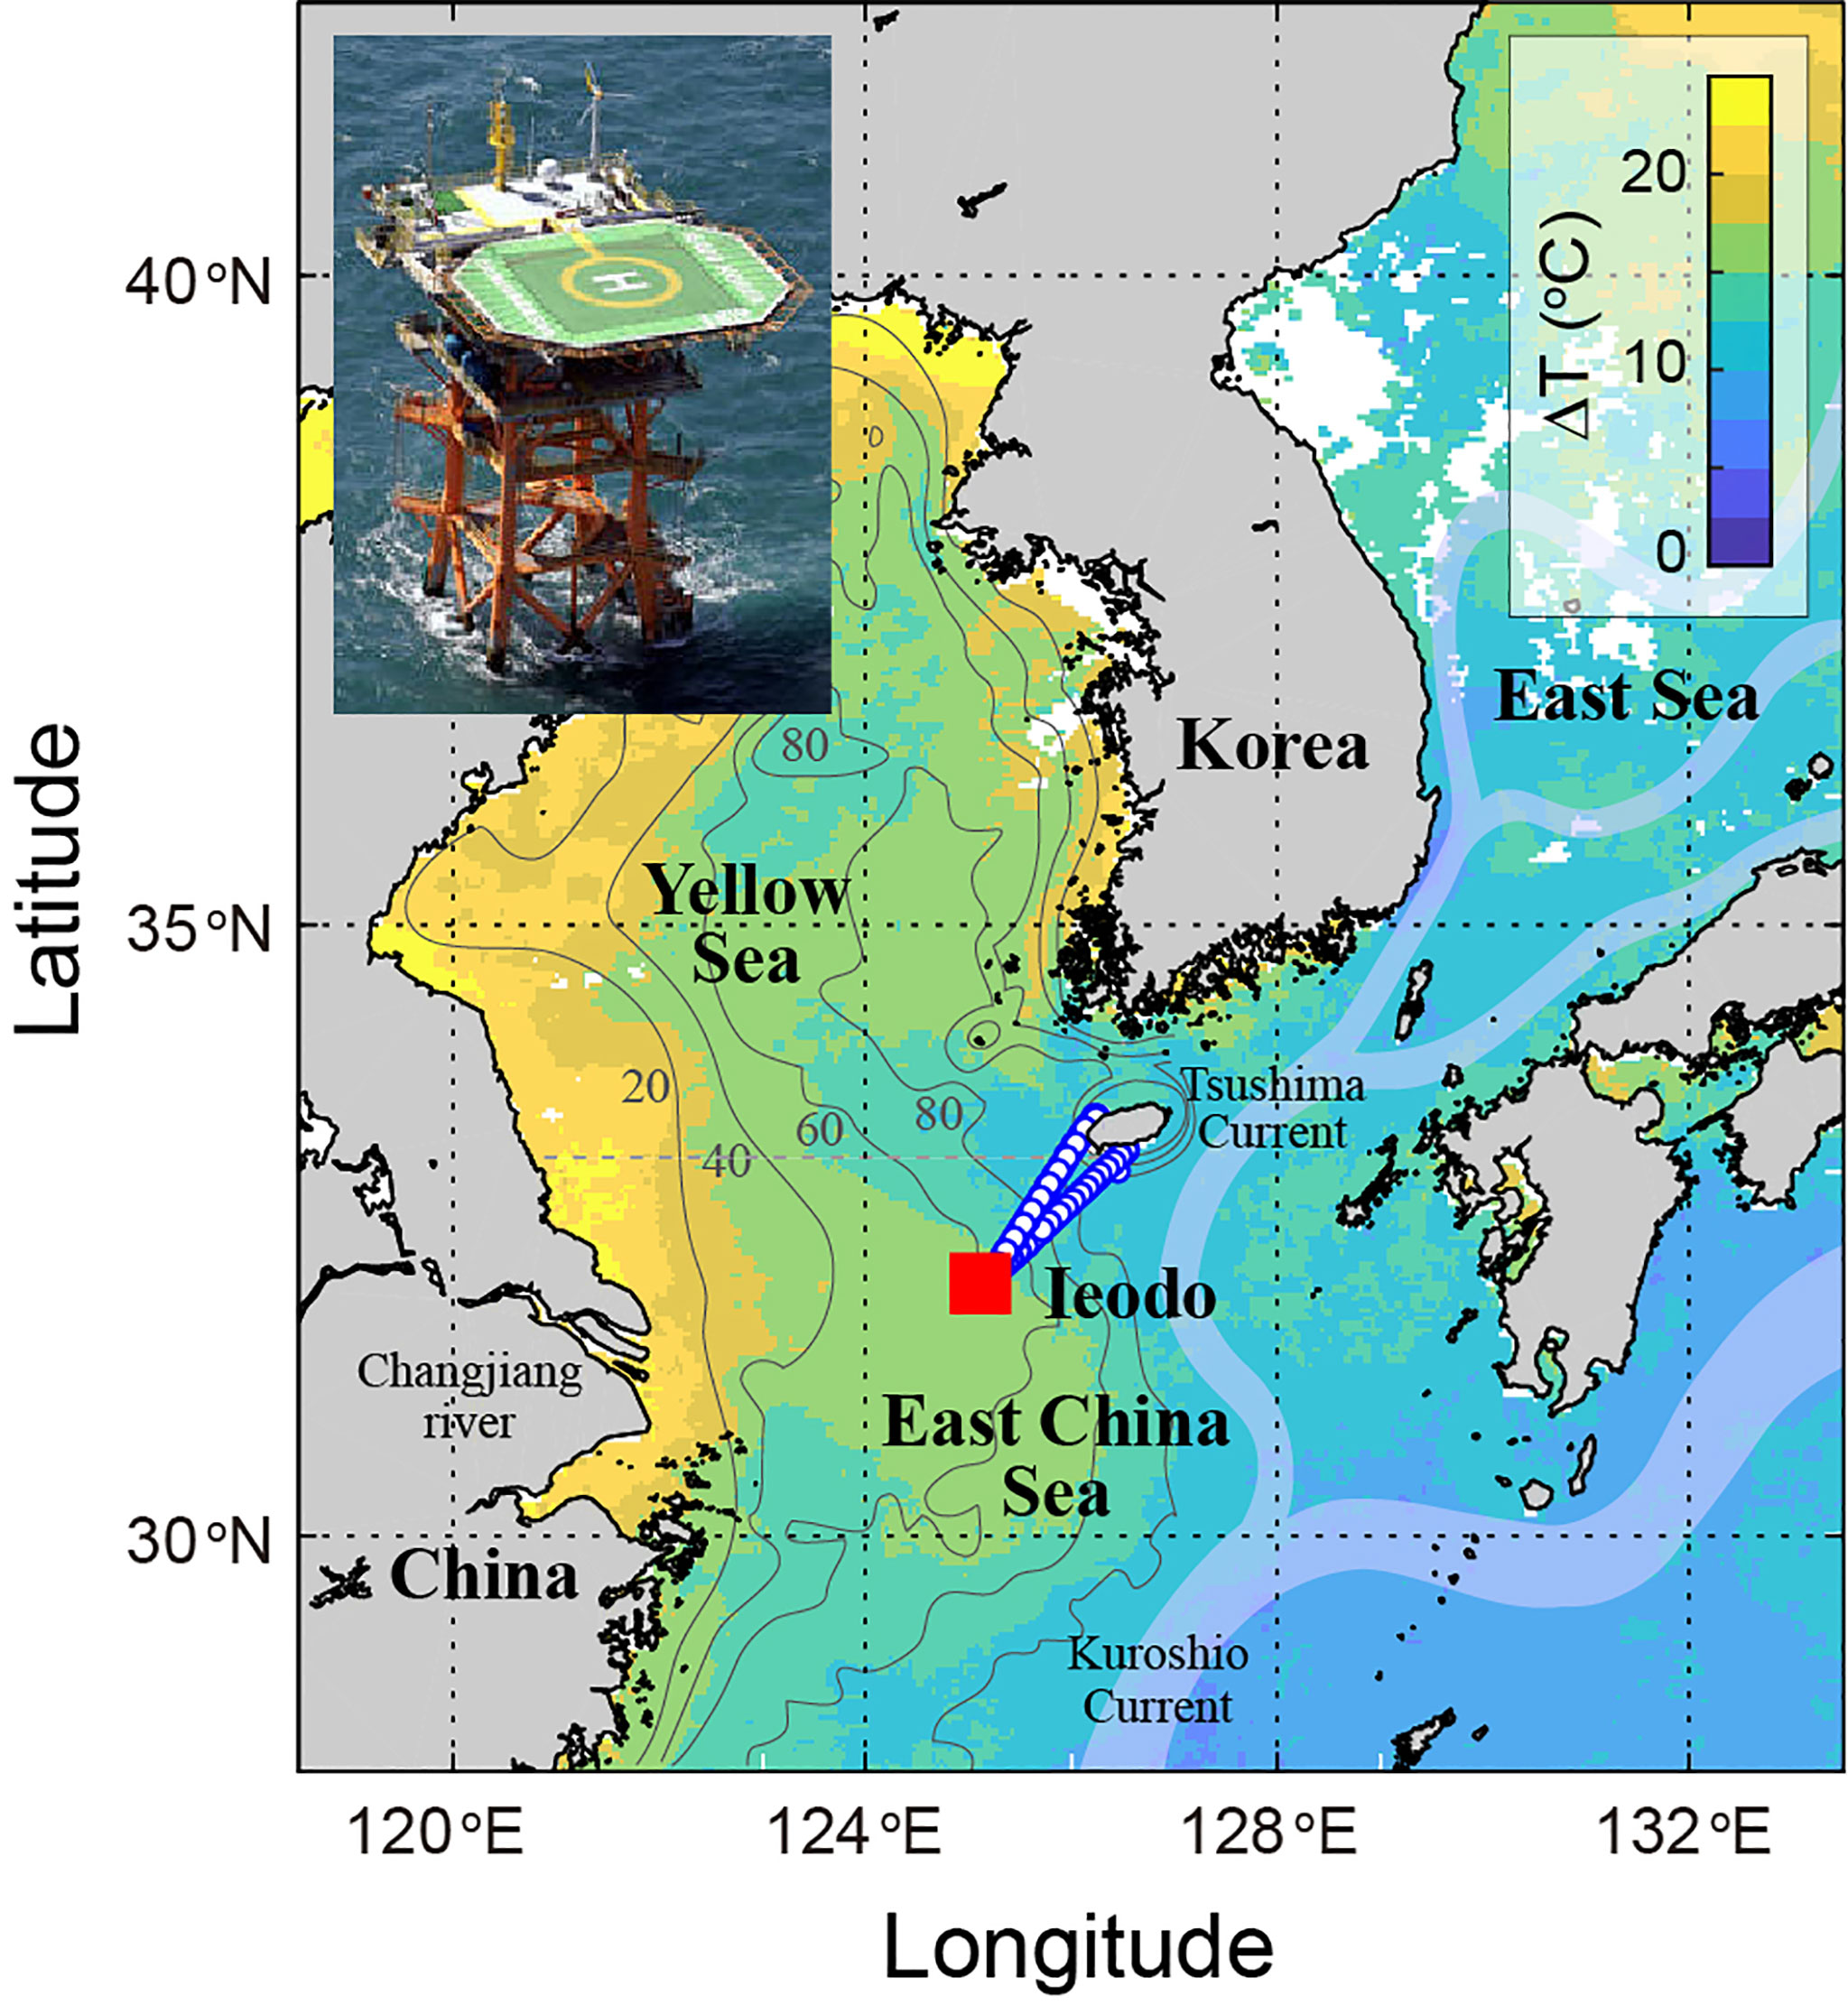
Figure 1 Sampling locations for continuous pH measurements (red square: the Ieodo Ocean Research Station) and for discrete measurements of C parameters between Jeju Island and Ieodo (blue circles). Colors indicate the seasonal temperature extremes (August values minus February values) for 2020. Arrows indicate the path of the Kuroshio Current with its branch (Tsushima warm current) into the East Sea. The contour lines indicate the bathymetry (m).
This study reports the results of 5 years (2017–2021) of high-frequency (obtained at 1 h intervals) C data collected at a midpoint (the Ieodo Ocean Research Station, also known as Socotra Rock and Suyan Islet) between the mouth of the Changjiang River and Jeju Island, located downstream of the Changjiang freshwater plume in the northern ECS. The results of 7 years (2015–2021) of seasonal data obtained between Jeju Island and the Ieodo Ocean Research Station were added to substantiate the interpretation of the high frequency data. In parallel, we examined published data covering the northern ECS and concluded a basin-wide status of C sink. We also explored the key drivers of the C-sink status.
Materials and Methods
Measurements of Total Alkalinity (AT), Total Dissolved Inorganic Carbon (CT), and pH
During the study period (2015-2021), at more than 50 locations between Jeju Island and the Ieodo Ocean Research Station (32.07°N and 125.10°E; halfway between the Changjiang River estuary, China and Jeju, Korea; hereafter referred to as “Ieodo”; Figure 1), we collected surface samples at seasonal intervals (April to December with no samples taken from January to March) for measurements of seawater C parameters. The measured C parameters were total alkalinity , total dissolved inorganic carbon , and pH. The concentrations of AT and CT were determined using potentiometric and coulometric titrations, respectively. The precision of the AT and CT measurements were determined to be ± 1.8 μmol kg−1 for AT and ± 2.2 μmol kg−1 for CT (Supplementary Figure 1) by titrating reference materials with certified AT and CT values (provided by A. Dickson, Scripps Institution of Oceanography, USA). Small deviations of the measured AT and CT values on the reference materials from their certified values were either subtracted or added for sample measurements conducted during the same period in which the reference materials were analyzed. The pH was measured at 25°C spectrophotometrically using the m-cresol purple indicator following the procedure documented elsewhere (Clayton and Byrne, 1993; Lee et al., 1996).
Other CO2 parameters (i.e., CO2 partial pressure, pCO2; seawater saturation state with respect to aragonite, Ωarag) were calculated from the values of AT and CT using the set of the thermodynamic constants, including the carbonic acid dissociation constants reported by Mehrbach et al. (1973) and other ancillary constants proposed by Millero (1995). The thermodynamic model, including these dissociation constants, led to the best agreement between measurements and calculations involving all three measured parameters (AT, CT, and pH), as demonstrated in previous studies (McElligott et al., 1998; Lee et al., 2000; Lueker et al., 2000; Millero et al., 2006; Fong and Dickson, 2019). The agreement was compelling evidence for insignificant biases in AT derived from organic acids (Cai et al., 1998; Kim and Lee, 2009; Ko et al., 2016) and phytoplankton and bacteria cells (Lee et al., 2021). The B:Cl ratio of 0.2414 confirmed for the open ocean (Lee et al., 2010) was shown to be accurate in the study area and in experiments designed to predict the borate contribution to AT (Lee et al., 2019).
Continuous Seawater pH Measurements
Beginning in September 2017, seawater pH was measured at a depth of 4 m at 1 h intervals using a pH sensor package equipped with an ion-sensitive field effect transistor (ISFET), which produces stable pH signals; the sensor package also included a data logger based on a Honeywell Durafet pH sensor. The ISFET sensor was determined to be precise within ±0.005 pH units over periods of weeks to months. The pH sensor package (including temperature and salinity) was protected by a perforated copper guard, which deterred biofouling. The pH values were determined on the total scale at in situ temperature and salinity. During the period of deployment, we visited the site at seasonal intervals to check for signs of sensor drift. At each visit, we sampled seawater in close proximity (within the 10 m) of the sensor package 3 to 5 times per day over 2 days and analyzed their pH and salinity in the laboratory. A total of 70 samples were collected at Ieodo during a total of 8 visits over a 4 year period. A comparison between the sensor-based and laboratory-based pH measurements indicated that the sensor-based pH data showed no sign of drift over 6 months and were consistent with the laboratory measurements to within ±0.03 pH units (Supplementary Figure 2). During each site visit, we downloaded the pH, salinity, and temperature data from the data logger, thoroughly cleaned the sensor package, and then redeployed it.
Polynomial Model for Predicting AT
Empirical algorithms that relate AT to sea surface salinity (S) and sea surface temperature (T) have been used to construct the distribution of AT in regions (Lee et al., 2006) and have greatly facilitated predictions of the CO2 flux across the air–sea interface, where it combines with another carbon parameter. A functional form for fitting AT data was derived from datasets obtained within the 10 km of Ieodo (n = 162) by testing its polynomial form (first or second order) with two predictor variables (S and T) which gave a fit.
where 31.2 and 21.8 represent the mean values of S and T (°C) values, respectively. We found that the second-order polynomial model yielded the lowest value of the root-mean-square error (RMSE: the standard deviation of the predicted errors; 9.8), the highest value of r2 (0.92), and the lowest value of p (< 0.05) (Figure 2). Because the AT data (used to derive the fit) covered four seasons and seven years, the fit would represent seasonal and interannual variations in AT.
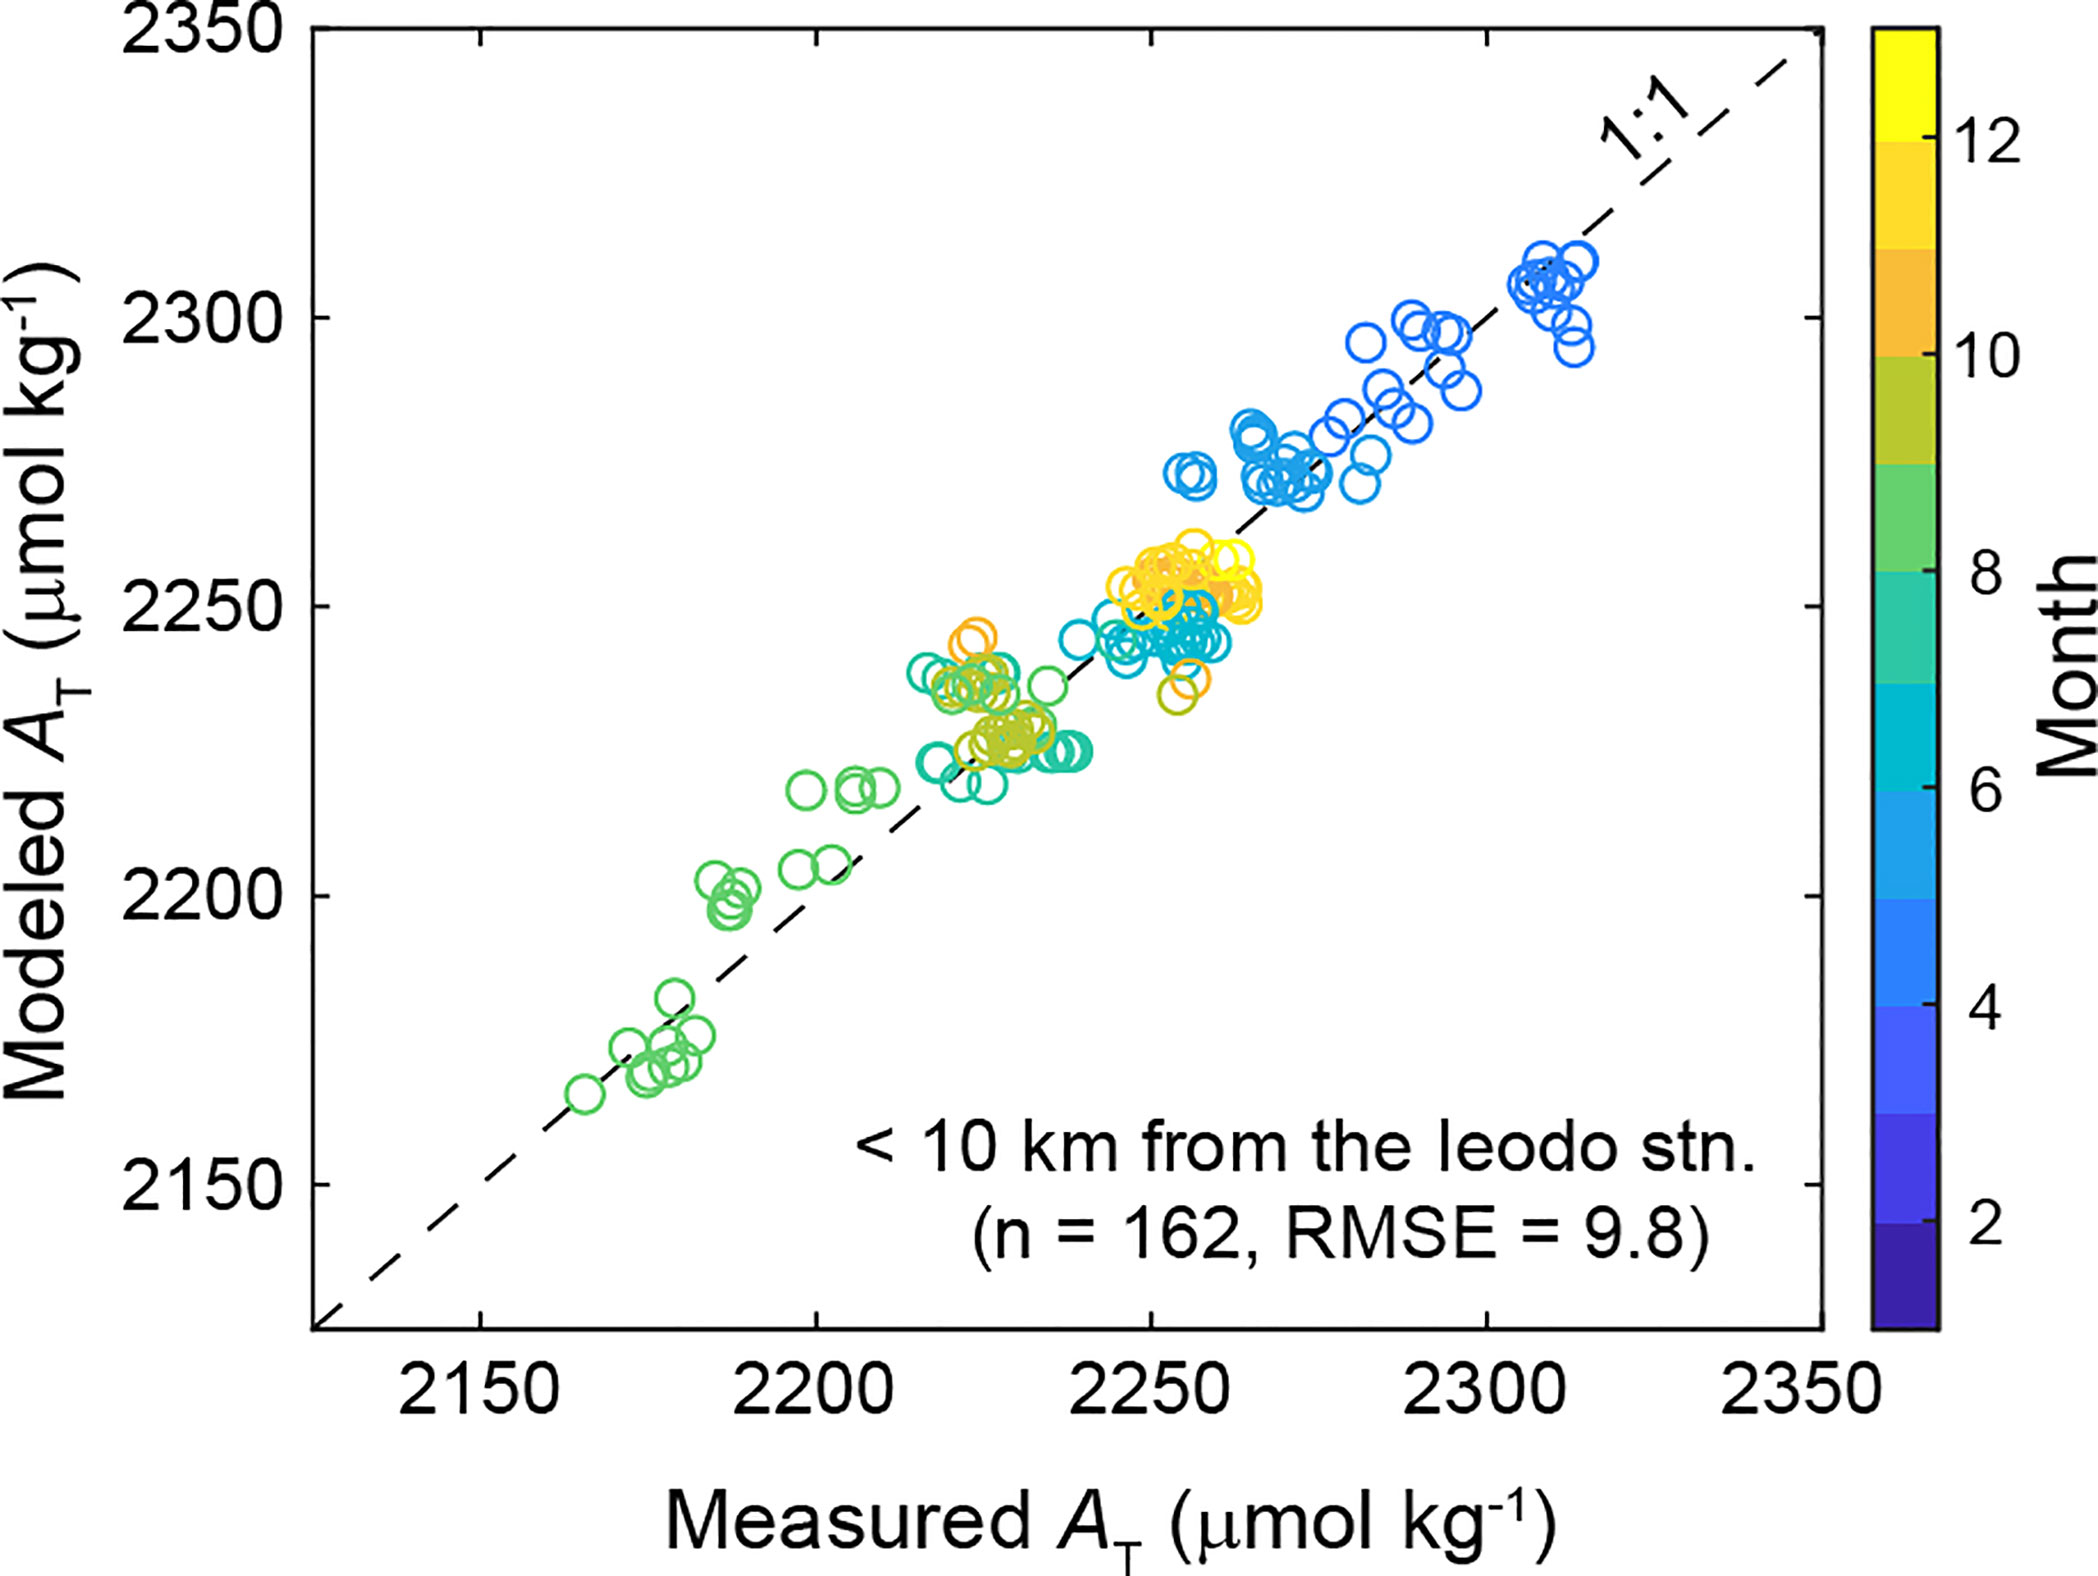
Figure 2 Comparison between the measured and modeled surface AT in close proximity (< 10 km) to the Ieodo Ocean Research Station. The color of the symbols corresponds to the month.
Air–Sea CO2 flux
The air–sea CO2 flux (mol C area−1 time−1) across the air–water interface was calculated using the formula: . In this formula K0 (mol L−1 atm−1) is the CO2 gas solubility, and k (cm hr−1) is equal to 0.251 (Sc/660)−0.5, where U10 (m s−1) is the windspeed at 10 m above sea level and Sc is the Schmidt number (Wanninkhof, 2014). Windspeed data measured at 33.08°N and 126.03°E, in the vicinity of the sampling site, are available at the National Climate Data Center. Air data were obtained from the observatory at Anmyeondo (36.54°N, 126.33°E), which is operated by the Korea Meteorological Administration. Seawater data were calculated from pH measurements and AT values derived from Equation (1), and thus had a probable error of < 30 µatm because of pH and AT errors (±0.03 and ±10 µmol kg−1, respectively). The resulting error was directly translated into a flux error of ±0.002 g C m−2 hr−1.
Results
Variations in Seawater C Parameters between Ieodo and Jeju Island
A notable feature found between Ieodo and Jeju Island in the northern ECS, located downstream of the Changjiang Diluted Water (CDW), is the large seasonal variability in salinity (26–35) (Figure 3A). Much of the seasonal variability is directly associated with changes in the intrusion of the CDW sourced from the Changjiang Estuary. Specifically, the values of salinity at Ieodo decreased by as much as S = 9, which corresponds to the maximum intrusion of the CDW into the study area between July and August. The decrease in salinity also varied considerably interannually and was found to be the highest at Ieodo and to decrease toward Jeju Island. This salinity decrease was broadly proportional to the increase in intrusion of the CDW. The intrusion of the CDW into the study area was particularly pronounced in the summer of 2017, when the CDW propagated eastward and even reached the coastal waters near Jeju Island, close to southern Korea.
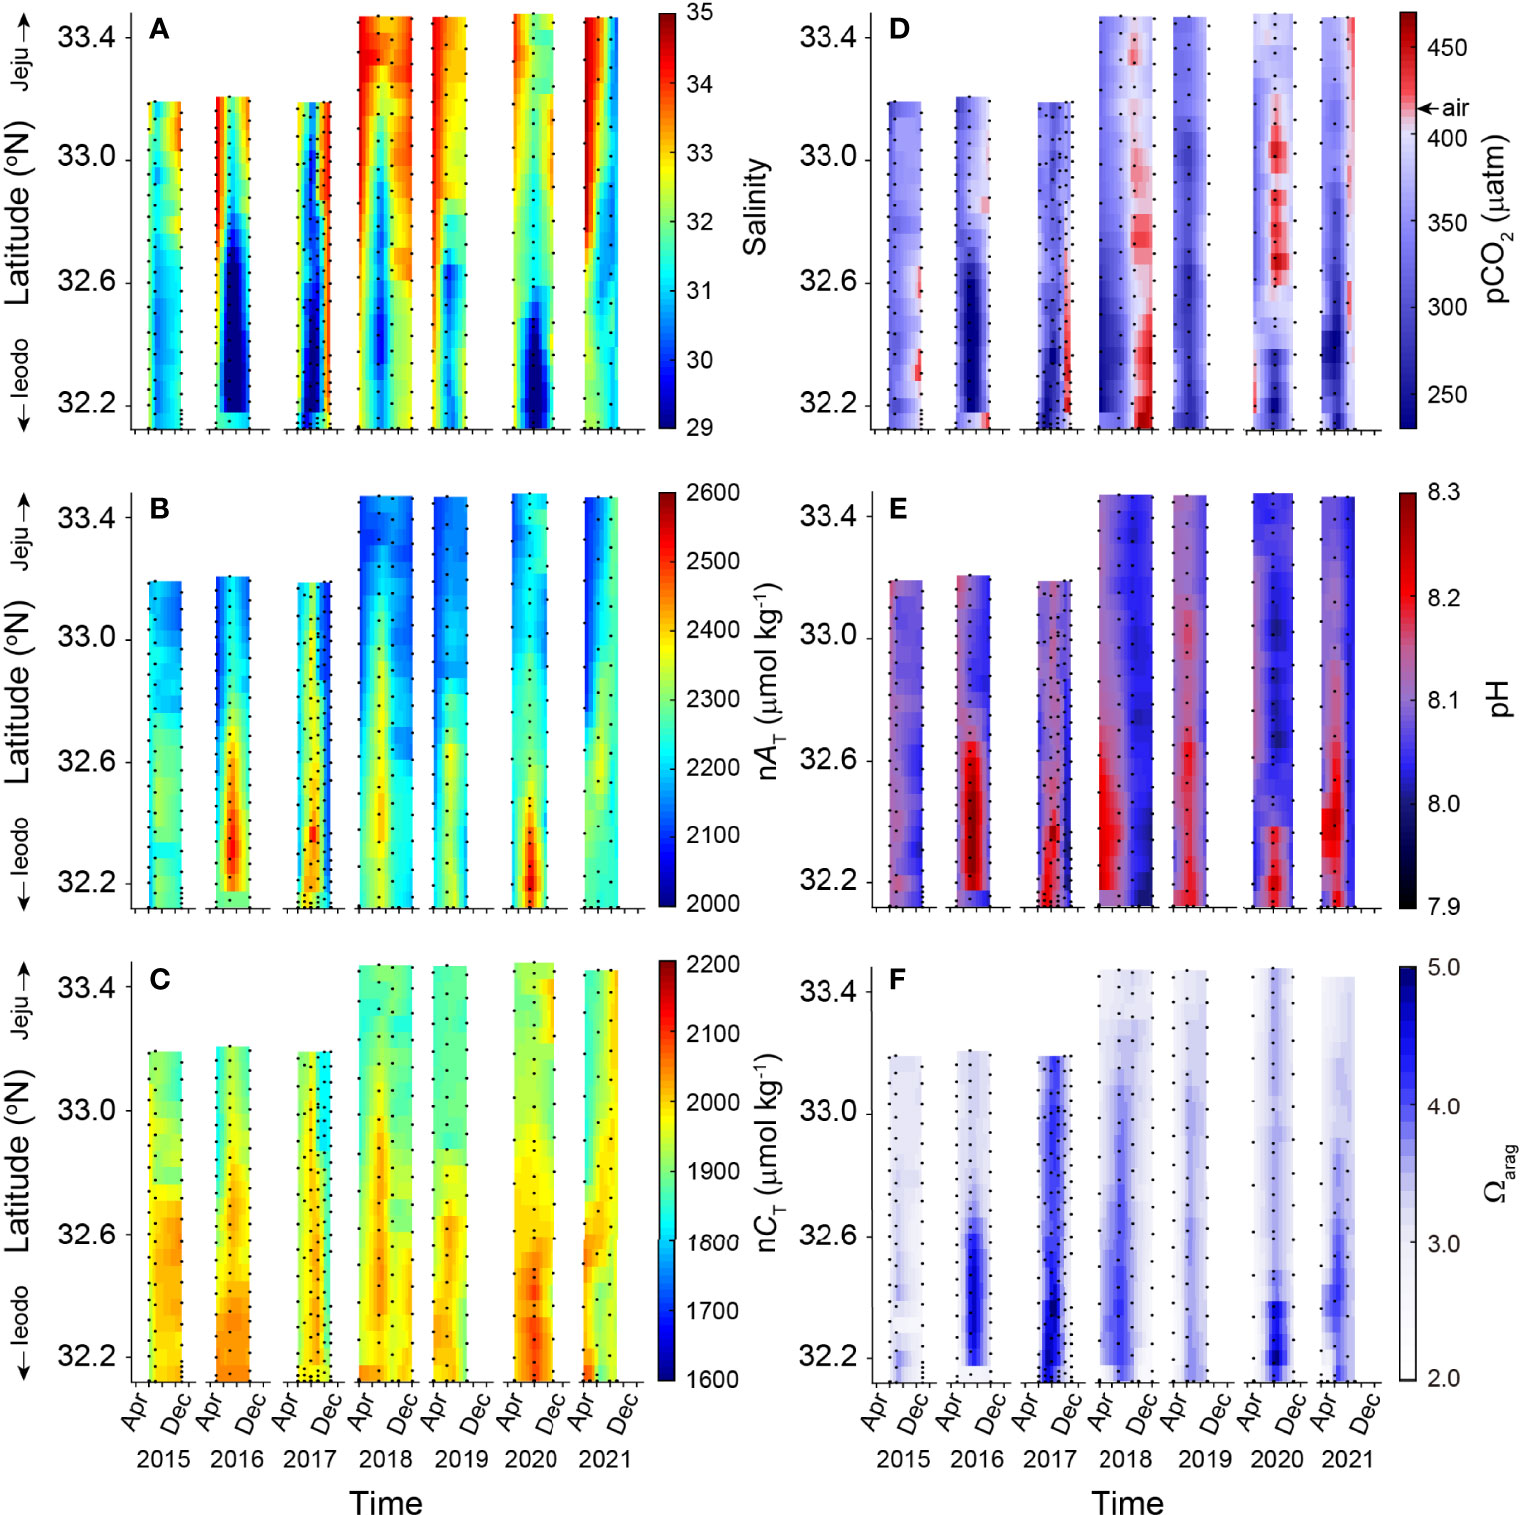
Figure 3 Meridional distributions of (A) salinity, (B) salinity-normalized AT (nAT), (C) salinity-normalized CT (nCT), (D) seawater pCO2, (E) pH, and (F) aragonite saturation state (Ωarag). Longitudes covary along the survey line (125.17–126.55°E) between Ieodo and Jeju Island. The lower the latitude, the closer to Ieodo.
The intrusion of CDW into the northern ECS affected not only the salinity but also all of the C parameters, including in situ pCO2 (175–490 µatm), pH (8.0–8.3), and Ωarag (2.0–5.8) (Figures 3D–F). The gradients in four C parameters observed between Ieodo and Jeju Island were particularly pronounced during the summer months (June–August). The summertime pCO2 values at Ieodo often remained less than 300 µatm, considerably lower than the current atmospheric pCO2 of ~420 µatm and thus, the air–sea pCO2 disequilibrium was highest at Ieodo and decreased toward Jeju Island (Figure 3D). The summertime pH distribution was opposite to that of pCO2 because both parameters changed in opposite directions in response to changes in the same environmental factors (e.g., temperature, salinity, photosynthesis, and respiration) (Figure 3E). The highest Ωarag values were observed at Ieodo and decreased toward Jeju Island (Figure 3F). One striking characteristic of the CDW was unusually high values of the salinity-normalized AT (nAT) and salinity-normalized CT (nCT) (Figures 3B, C), which were a direct consequence of high AT and CT values of the Changjiang River at salinity ≈ 0. The greater contribution of the Changjiang River led to the higher nAT and nCT values of the CDW. Conversely, with increasing distance from the Changjiang Estuary, the values of nAT and nCT in the CDW rapidly decreased as a result of mixing with the warm current of Tsushima with low nAT and nCT values. In other months, the Ieodo–Jeju gradients in salinity and all of the CO2 parameters either substantially decreased or disappeared completely.
Seawater pCO2 and Net Air–Sea CO2 Flux at Ieodo
The low levels of summertime pCO2, between Ieodo and Jeju, were further substantiated by continuous pCO2 measurements at Ieodo (Figure 4C). During the warming period (from April to mid-August), the surface pCO2 values at Ieodo remained ~125 µatm lower than the atmospheric pCO2. The magnitude of the air–sea disequilibrium differed slightly by year. However, the basin switched to a neutral condition in terms of the seawater pCO2 level from September to October, with large temporal variability, which made the status of the basin as a net C sink or a net C source ambiguous. Moreover, the timing of the switchover from the lower-than-atmospheric pCO2 condition to the higher-than-atmospheric pCO2 condition differed by year. The switchover occurred in early September in 2019 (Figure 5C); however, it occurred late August in 2020, when the site was hit by Typhoon Bavi (Figure 5D).
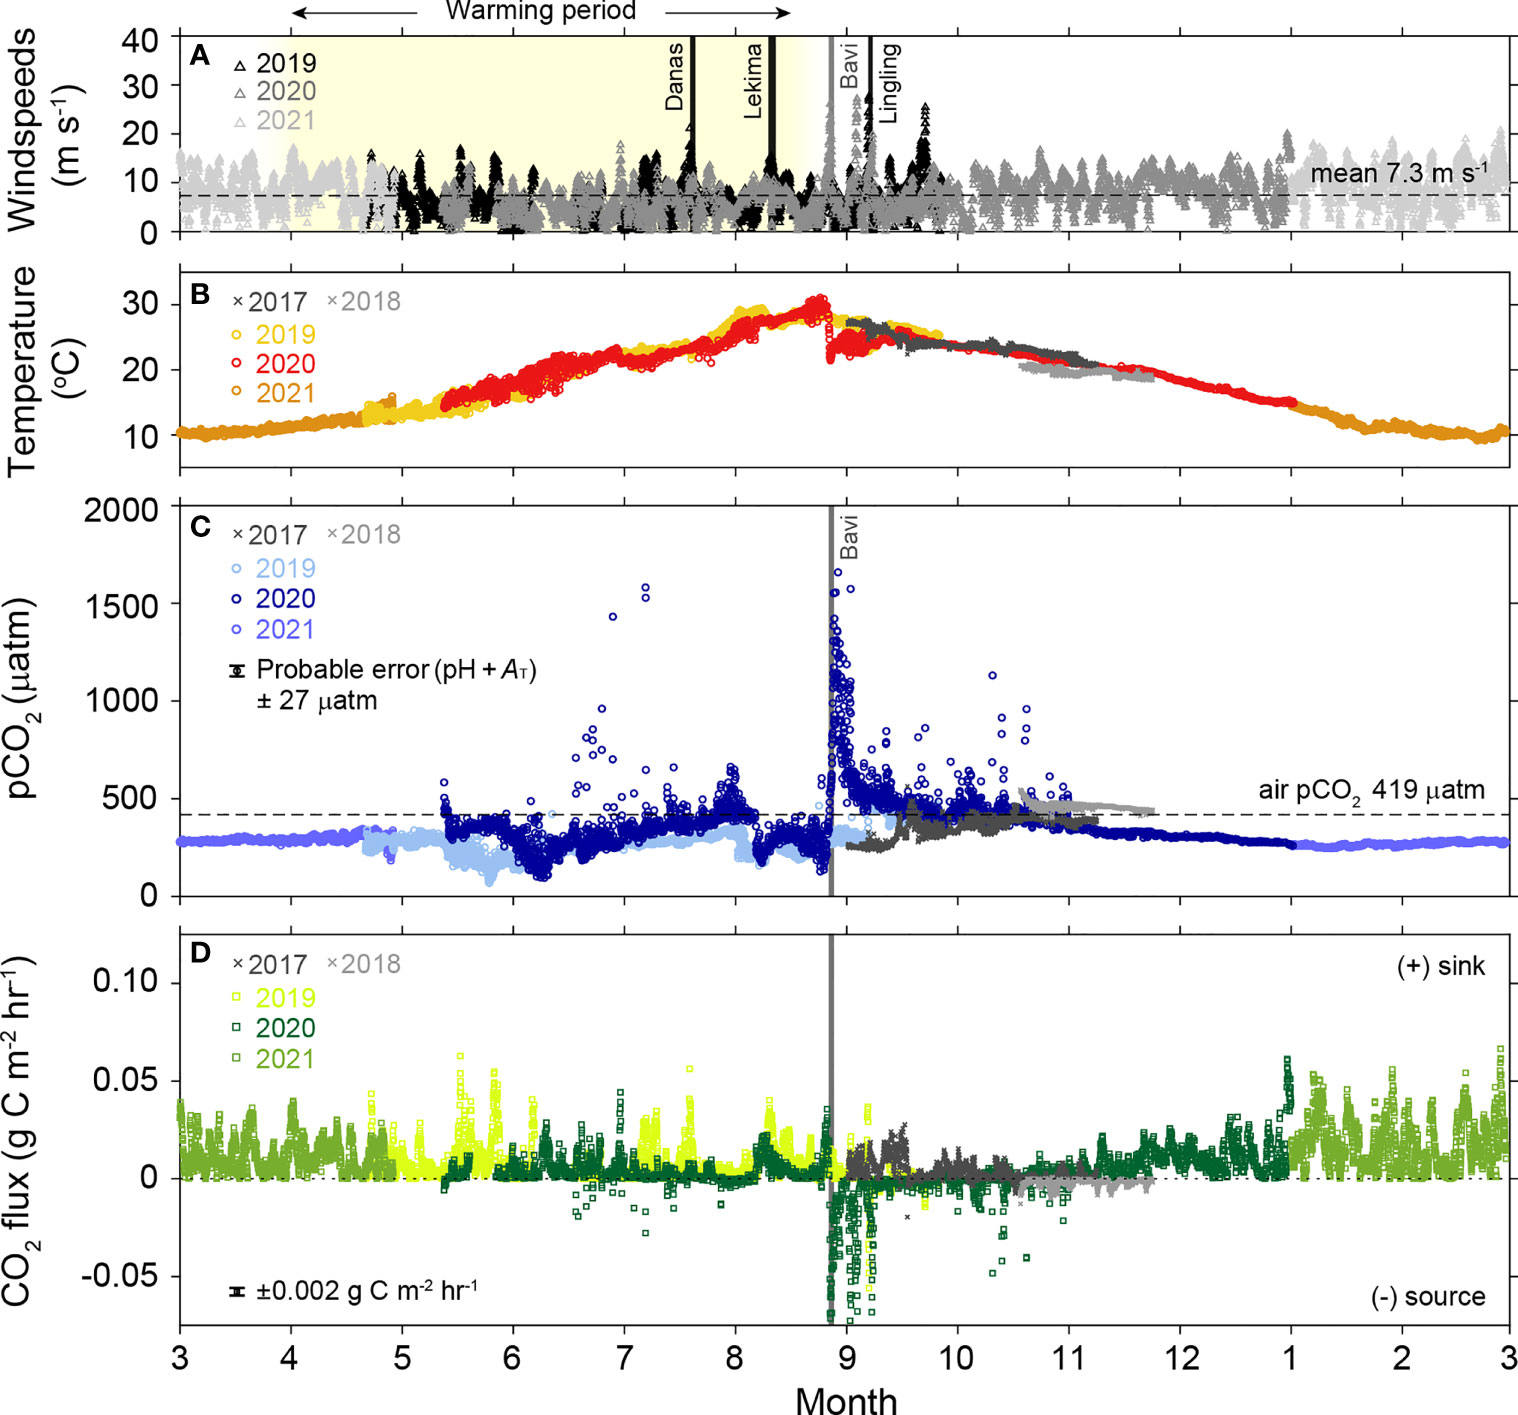
Figure 4 Changes in (A) windspeeds, (B) sea surface temperature, (C) seawater pCO2, and (D) air–sea CO2 flux for the period 2017–2021. Shaded area in (A) indicates the warming period from April to mid-August. Vertical lines in black represent the landing periods of major typhoons. The solid horizontal line in (C) indicates the level of mean pCO2 of the air. The probable error in pCO2 is the square root of the sum of the squared errors associated with measurements of pH and AT. The error in the CO2 flux was propagated from the pCO2 error.
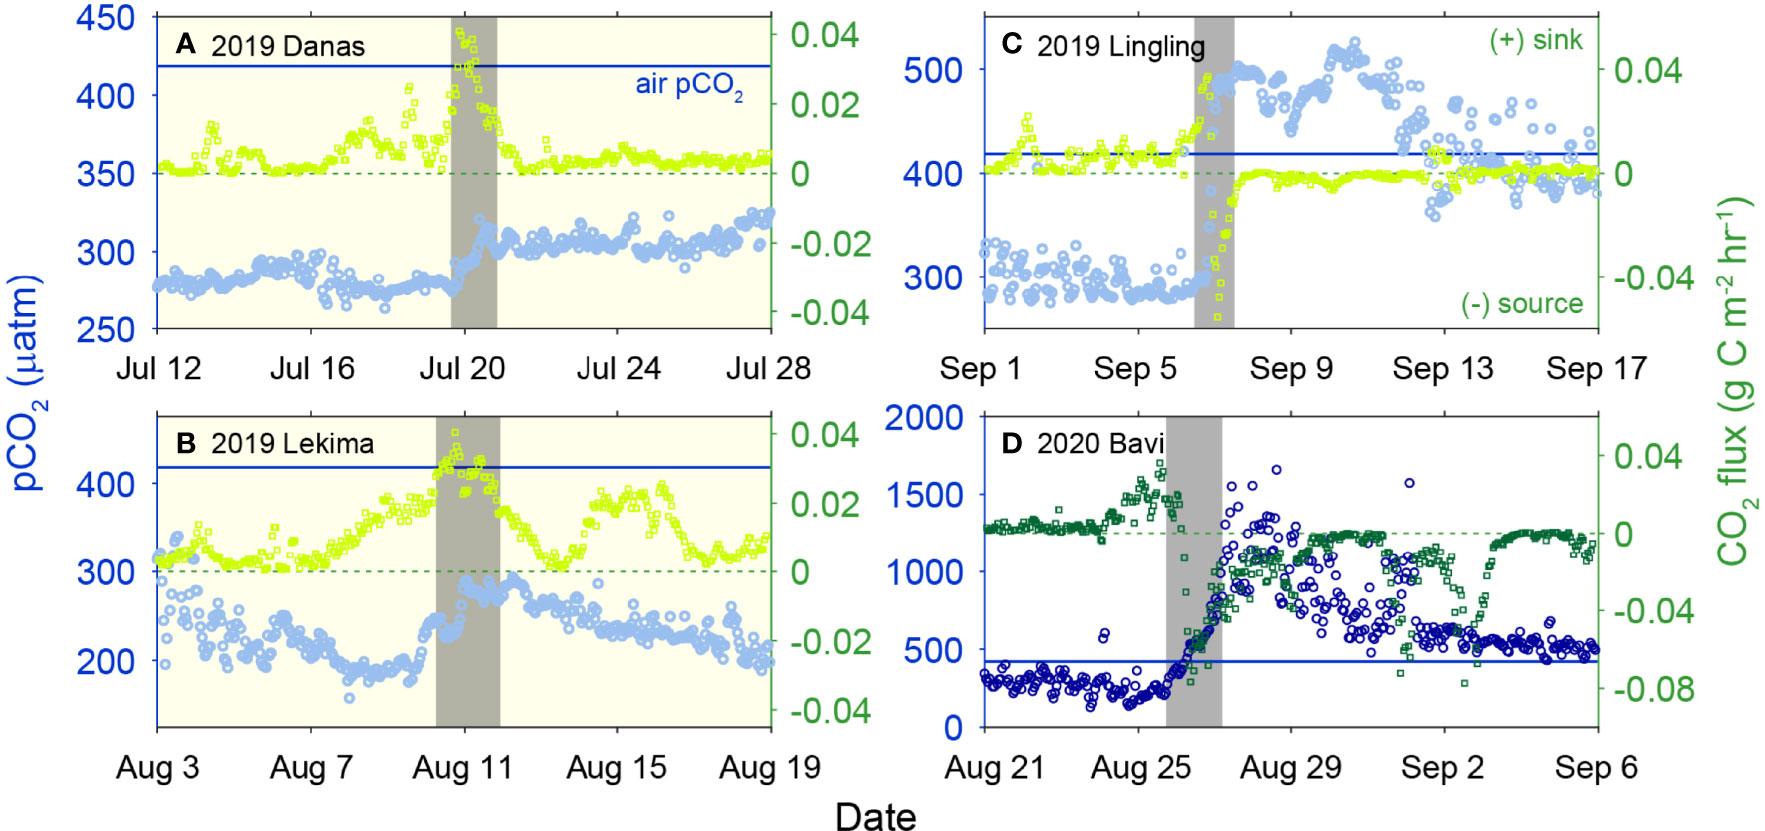
Figure 5 Changes in seawater pCO2 (left y-axis) and air–sea CO2 flux (right y-axis; positive and negative values represent fluxes of C from atmosphere to ocean and from ocean to atmosphere, respectively) near the landing period of typhoons: (A) Danas (2019), (B) Lekima (2019), (C) Lingling (2019), and (D) Bavi (2020). Vertical shades (in black) represent the period of the typhoon landfall. Solid horizontal lines (in blue) indicate the level of mean pCO2 of the air (419 µatm).
Following this short transition period, the surface pCO2 levels progressively decreased as the season transitioned to a full winter condition and were persistently 35–130 µatm lower than the atmospheric pCO2 levels during the cooling period (November–March), with small temporal variations (Figure 4C). The measured decrease in surface pCO2 from the late-summer condition to the full winter condition was approximately consistent with thermodynamic predictions based on the seasonal temperature decrease (Figure 6B). Both the under-saturated pCO2 condition and high windspeeds led to a persistent C sink status of the basin (Figure 4A, D). Collectively, the year-round continuous data (2020–2021) show that the perennial C sink during both the warming (0.13 g C m−2 d−1; from April to mid-August) and the majority of the cooling periods (0.32 g C m−2 d−1; from November to March), along with a small source for a short transition period, led the region to a strong annual sink of atmospheric CO2 (61.7 g C m−2 yr−1).
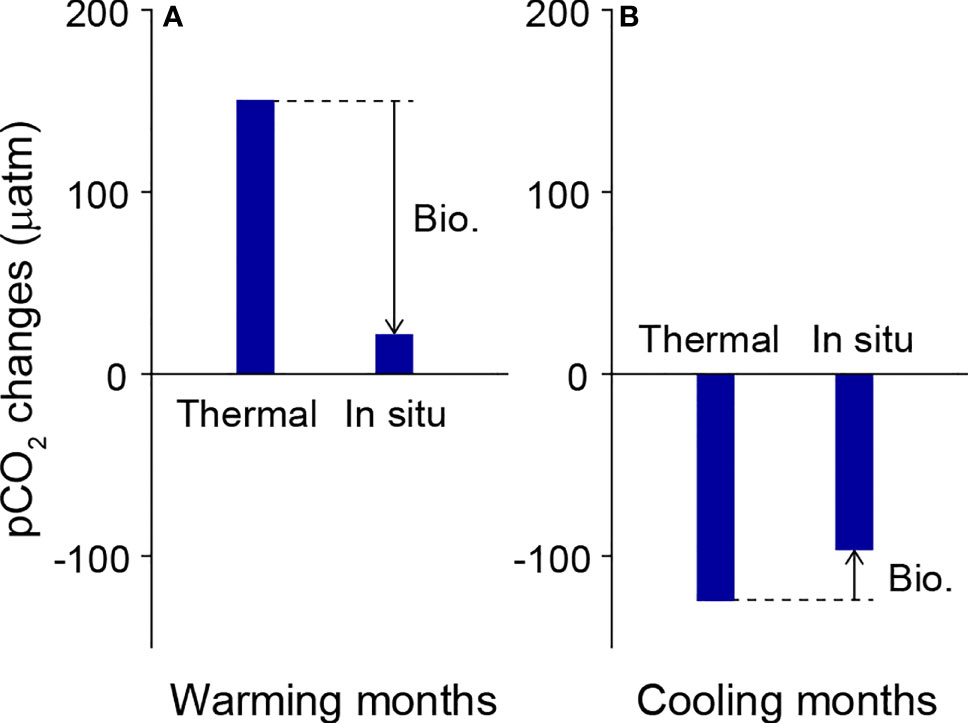
Figure 6 Estimated temperature-driven changes in seawater pCO2 (4% pCO2 increase °C-1) and those measured at in situ condition during (A) the warming months (mid-July values minus April values; excluding the landing period of typhoons) versus (B) the cooling months (March values minus November values) for the period 2017–2021. The differences between temperature-driven changes in pCO2 and in situ values indicate the changes caused by nonthermal factors, mostly biology.
Effects of Typhoons on Net Air–Sea CO2 Flux at Ieodo
In the period 2019–2020, Ieodo was hit by seven major typhoons (four typhoons in 2019 and three in 2020). The ocean CO2 system responded to those typhoons differently, depending on the timings of the typhoons’ passage. The three typhoons that struck the site during the warming period accelerated ocean CO2 uptake during their passages (see Figures 5A, B). The warming-period enhancement of ocean CO2 uptake during the typhoon passage was an order of magnitude greater than those for periods either before or after the typhoon passage. The greater ocean CO2 uptake during the typhoon passage was a consequence of the combined effects of sustained low pCO2 levels and a high rate of CO2 exchange. To our surprise, typhoons exerted the opposite effect on the net air–sea CO2 flux during the cooling period, when oceanic pCO2 levels were higher than the atmospheric levels (Figures 5C, D). The typhoon-induced high surface pCO2 levels resulted in unusually high effluxes (~7 times greater than the CO2 fluxes that occurred during the typical cooling period).
Discussion
Status of C Uptake by the ECS
In the ECS, the major controls of the seasonality in terms of the air–sea CO2 flux differed regionally: the northern ECS was dominated by biological activities and ventilation of water, whereas the central and southern ECS were mainly determined by seawater temperature (Guo et al., 2015; Deng et al., 2021). With regard to the status of net air–sea CO2 flux across the entire ECS, mixed conclusions have been reported in literature, in part because the datasets that led to differing conclusions did not cover time and space extensively (Deng et al., 2021 and references therein). Specifically, the datasets were skewed to either the Chinese coastal waters under the direct influence of the nutrient-rich CDW (Li et al., 2021; Wu et al., 2021) or the offshore waters distant from the CDW influence (Shim et al., 2007; Kim et al., 2013). Overall, the entire ECS appeared to be a slight C sink on an annual scale (Wang et al., 2000; Zhai and Dai, 2009; Guo et al., 2015; Wu et al., 2021), although it can be a weak C source when seasonal dynamics of river input and physical mixing occasionally induce C release in summer and fall in the inner shelves of the ECS (the Changjiang freshwater plume).
In comparison with the previous estimates based on either the data in a specific month or an empirical model (Wang et al., 2000; Tseng et al., 2011; Guo et al., 2015), our year-round measurements (2020–2021) in the northern ECS yielded the annual net air–sea CO2 flux of 61.7 g C m−2 yr−1 (= 14.1 mmol C m−2 d−1 from air to sea), which was 2-3 times higher than the values reported for the adjacent regions. The air–sea CO2 influx in summer (4.7 mmol C m−2 d−1) from these year-round measurements agreed with the reported results of 6.5 to 4.6 mmol C m−2 d−1 (4.9 to 3.4 mmol C m−2 d−1 using the same k used in this study) associated with the river plum and the outer estuary, respectively (Guo et al., 2015). However, we found large differences in the net air–sea CO2 fluxes for spring and winter: the net air–sea CO2 fluxes for spring (20.3 mmol C m−2 d−1) and winter (31.5 mmol C m−2 d−1) were 2–4 times higher than the previous estimates (Tseng et al., 2011; Guo et al., 2015).
Mechanisms Responsible for C Uptake by the ECS
Both high plankton biomass in spring and summer and a large temperature drop from summer to winter, collectively, contributed to the substantial C sink by the northern ECS; their effects on the net air–sea CO2 flux were decoupled in terms of season. An increase in planktonic biomass during the growing season spread vertically into the shallow shelf water (< 70 m depth) and the resultant organic matter was either buried into the shallow sediments or moved laterally. These biological activities lowered the water-column pCO2 levels, which were lower than the atmospheric pCO2 levels throughout the warming months (April–August), except for a short transition time to the cooling period, during which the surface pCO2 reached levels similar to or slightly greater than the atmospheric levels. In particular, a rapid increase in planktonic biomass during the warming period counteracted nearly all the temperature-driven pCO2 increase (~ 85%, Figure 6A). As the season developed into a full winter condition, the water column was substantially cooled by as much as 17°C (August–March, Figure 4B) and this temperature drop lowered the water column pCO2 values by as much as 175 µatm at Ieodo. The observed reduction of the surface pCO2 during the cooling months was surprisingly consistent with the thermodynamic expectations (> 75%, Figure 6B). In particular, during the winter, both the low pCO2 levels and high air–sea CO2 exchange rates, driven by a large temperature drop and high windspeeds, respectively, acted in concert to increase the C uptake by the northern ECS and made the basin an even stronger C sink.
Reported water properties of the northern ECS appeared to be an additional favorable factor for the northern ECS to be a perennial C sink—the continental shelf pump (Tsunogai et al., 1999). Isopycnal mixing (via diffusive and advective flows) in the ECS tends to transport the shelf waters to the deeper layers of the Kuroshio region, which transports dissolved inorganic C to the open ocean. A large temperature drop from summer to winter in the shallow continental shelf zone, including our study area, resulted in greater CO2 flux into the ocean (resulting from high CO2 solubility at low temperatures) and the rapid formation of dense water (resulting from rapid heat loss while cooling). Both of these factors enable the effective transport of C from the shallow northern ECS to the open ocean. The C export from the northern ECS to the open ocean was also reported by Chen and Wang (1999) to be in the form of both particulate and dissolved organic C. The organic C produced by phytoplankton on the ECS shelf was exported as DOC (8%) to the offshore water column or exported as POC (10%) to the shelf and offshore sedimentary environments to the shelf and offshore sedimentary environments. The downslope transport of POC accounted for ~40% of the inorganic C transport to offshore. The transport of the shelf water to the open ocean via isopycnal flow greatly facilitated the transport of both inorganic and organic C to the open ocean, which contributed to substantial uptake of atmospheric CO2 by the northern ECS shelf region.
Future Projections of C Uptake by the ECS
How the C uptake status of the northern ECS has evolved and how it will change are noteworthy. Because the northern ECS has increasingly received anthropogenic nutrients over the past 40 years via the CDW and, to a lesser extent, atmospheric deposition (Kim et al., 2020; Zheng and Zhai, 2021), the region has grown fertile in phytoplankton and thus, removed surface C in the form of organic matter. Much of the organic matter has likely been buried in the shallow marine sediments there. Increasing organic C production and the corresponding burial of organic C in shallow sediments have probably strengthened the northern ECS as a C sink over the past 40 years, particularly in summer (Chou et al., 2013). Moreover, the nutrient-reinforced C-rich bottom water may have affected the interannual variations in the winter C uptake status (Chou et al., 2011). However, the C sink of the northern ECS will not increase indefinitely in proportion to the increasing input of nutrients from the Changjiang River but is likely to increase until nitrate (N) acts as a limiting nutrient for organic C production (i.e., until N increases to the levels estimated on the basis of phosphate (P) concentrations multiplied by 16) (Moon et al., 2021). Further increase in seawater N concentration exceeding an N:P ratio of 16 will no longer enhance the biological production in the northern ECS. Instead, excess N (= [N] – 16 × [P]) spreads into adjacent regions that are still N deficient and progressively makes them fertile. Eventually, it could expand the C sink area in the ECS. The increasing input of nutrients will make the entire ECS a stronger C sink. Conversely, a scenario of the C sink weakening by the northern ECS is equally feasible because of a reduction of nutrient supply to this area by controlling the Changjiang river discharge via the operation of the Three Gorges Dam (Tseng et al., 2011).
Another factor that has yet to be fully explored is the effect of typhoons on the net air–sea CO2 flux in the entire ECS. Year-round data collected from a mooring at the central ECS located outside the influence of the CDW showed that a large CO2 efflux induced by typhoons dictated the overall C status of the central and southern ECS by switching the basin from a weak C sink to a weak C source (Wu et al., 2021). Unlike the typhoons in the central and southern ECS, those in the northern ECS exerted contrasting effects on the net air–sea CO2 flux, depending on the levels of seawater pCO2 at the time of typhoon passage (Figure 5). When the typhoon passage occurs during the warming period, low pCO2 levels (resulting from phytoplankton growth) and a high rate of CO2 exchange (because of high windspeeds) would greatly enhance CO2 uptake. By contrast, during the cooling period, higher oceanic pCO2 levels (because of the addition of CO2-rich bottom water to the surface by the increased vertical mixing) would result in considerable CO2 effluxes. Over the two years (2019–2020), two competing effects of typhoon passage on the net air–sea CO2 fluxes approximately canceled out each other because typhoons meeting the two different cases were equal in number during the observational period. However, the entire ECS will likely be struck by typhoons more frequently in the future as the sea surface temperature in the region increases at an unprecedented rate. With the increasing frequency of typhoon passage, the future status of the ECS as a C sink or a C source will depend on the timing of typhoon passage.
Conclusion
Using discrete surface C measurements between Ieodo and Jeju Island (2015–2021) and in situ continuous measurements at Ieodo (seasonal coverage for 2017–2019 and the year-round coverage for 2020–2021), we concluded that the northern ECS was a substantial sink of atmospheric CO2 during most seasons (December to August). Such large C uptake by the northern ECS shifted the entire ECS toward a moderate C sink on an annual basis. The competing effects (reinforcing the C-sink vs. inducing the C-source) of episodic typhoon passage depending on the bottom water C accumulation by the timing of typhoon passages transiently deviated the CO2 system. Nonetheless, the northern ECS is likely to remain as a large C sink unless the current input of anthropogenic nutrients to the northern ECS shows a sudden change. The present study provides observational and mechanistic lines of evidence for confirming the continental shelf C pump (Tsunogai et al., 1999).
Data Availability Statement
The datasets presented in this study can be found in online repositories. The names of the repository/repositories and accession number(s) can be found below: Time series data on temperature, salinity, and seawater pH are available at Global Ocean Acidification Observing Network (http://portal.goa-on.org/Explorer?action=oiw:mobile_platform: STS_667:observations:). Data on daily mean air pCO2 (https://data.kma.go.kr/data/gaw/selectGHGsRltmList.do?pgmNo=587) and hourly mean windspeeds (https://data.kma.go.kr/data/sea/selectBuoyRltmList.do?pgmNo=52&tabNo=1) are available online at the National Climate Data Center supported by the Korea Meteorological Administration. The seasonal sea surface temperature data for 2020 were derived from the MODIS-AQUA satellite remote sensing maintained by the National Aeronautics and Space Administration (https://oceandata.sci.gsfc.nasa.gov).
Author Contributions
KL formulated the research question. KL, J-MK and G-SL analyzed the data, and J-MK and KL wrote the paper together. G-SL, EL, J-YJ, JL and I-SH contributed to C measurements for this paper. All authors contributed to the article and approved the submitted version.
Funding
This study was primarily supported by the Korea Hydrographic and Oceanographic Agency, and the National Research Foundation (NRF) of Korea (NRF-2020R1A4A1018818 for the Basic Research Program; NRF-2021M316A1089658 for the Carbon Cycle between Oceans, Land, and Atmosphere). Partial supports were provided by the National Institute of Fisheries Science (R2022056), and the project "Establishment of the Ocean Research Station in the Jurisdiction Zone and Convergence Research" funded by the Korea Ministry of Oceans and Fisheries (J.-Y.J.).
Conflict of Interest
The authors declare that the research was conducted in the absence of any commercial or financial relationships that could be construed as a potential conflict of interest.
Publisher’s Note
All claims expressed in this article are solely those of the authors and do not necessarily represent those of their affiliated organizations, or those of the publisher, the editors and the reviewers. Any product that may be evaluated in this article, or claim that may be made by its manufacturer, is not guaranteed or endorsed by the publisher.
Acknowledgments
We acknowledge financial and logistic support from the Korea Hydrographic and Oceanographic Agency and staff of the Ieodo Ocean Research Station Program, which made measurements possible.
Supplementary Material
The Supplementary Material for this article can be found online at: https://www.frontiersin.org/articles/10.3389/fmars.2022.919249/full#supplementary-material
References
Cai W.-J., Wang Y., Hodson R. (1998). Acid-Base Properties of Dissolved Organic Matter in the Estuarine Waters of Georgia, USA. Geochim. Cosmochim. Acta 62, 473–483. doi: 10.1016/S0016-7037(97)00363-3
Cao Z., Yang W., Zhao Y., Guo X., Yin Z., Du C., et al. (2019). Diagnosis of CO2 Dynamics and Fluxes in Global Coastal Oceans. Natl. Sci. Rev. 7 (4), 786–797. doi: 10.1093/nsr/nwz105
Chen C.-T. A., Wang S.-L. (1999). Carbon, Alkalinity and Nutrient Budgets on the East China Sea Continental Shelf. J. Geophys. Res. 104 (C9), 20675–20686. doi: 10.1029/1999JC900055
Choi S.-D., Lee K., Chang Y.-S. (2002). Large Rate of Uptake of Atmospheric Carbon Dioxide by Planted Forest Biomass in Korea. Global Biogeochem. Cycle. 16 (4), 1089. doi: 10.1029/2002GB001914
Chou W. C., Gong G. C., Cai W. J., Tseng C. M. (2013). Seasonality of CO2 in Coastal Oceans Altered by Increasing Anthropogenic Nutrient Delivery From Large Rivers: Evidence From the Changjiang–East China Sea System. Biogeosciences 10 (6), 3889–3899. doi: 10.5194/bg-10-3889-2013
Chou W.-C., Gong G.-C., Tseng C.-M., Sheu D. D., Hung C.-C., Chang L.-P., et al. (2011). The Carbonate System in the East China Sea in Winter. Mar. Chem. 123 (1), 44–55. doi: 10.1016/j.marchem.2010.09.004
Clayton T. D., Byrne R. H. (1993). Spectrophotometric Seawater pH Measurements: Total Hydrogen Ion Concentration Scale Calibration of M-Cresol Purple and at-Sea Results. Deep. Sea. Res. Part I.: Oceanog. Res. Pap. 40 (10), 2115–2129. doi: 10.1016/0967-0637(93)90048-8
Dai M., Cao Z., Guo X., Zhai W., Liu Z., Yin Z., et al. (2013). Why Are Some Marginal Seas Sources of Atmospheric CO2? Geophys. Res. Lett. 40 (10), 2154–2158. doi: 10.1002/grl.50390
Deng X., Zhang G.-L., Xin M., Liu C.-Y., Cai W.-J. (2021). Carbonate Chemistry Variability in the Southern Yellow Sea and East China Sea During Spring of 2017 and Summer of 2018. Sci. Tot. Environ. 779, 146376. doi: 10.1016/j.scitotenv.2021.146376
Fong M. B., Dickson A. G. (2019). Insights From GO-SHIP Hydrography Data Into the Thermodynamic Consistency of CO2 System Measurements in Seawater. Mar. Chem. 211, 52–63. doi: 10.1016/j.marchem.2019.03.006
Guo X. H., Zhai W. D., Dai M. H., Zhang C., Bai Y., Xu Y., et al. (2015). Air–Sea CO2 Fluxes in the East China Sea Based on Multiple-Year Underway Observations. Biogeosciences 12 (18), 5495–5514. doi: 10.5194/bg-12-5495-2015
Kim D., Choi S.-H., Shim J., Kim K. H., Kim C.-H. (2013). Revisiting the Seasonal Variations of Sea-Air CO2 Fluxes in the Northern East China Sea. Terres. Atmosph. Ocean. Sci. 24, 409. doi: 10.3319/TAO.2012.12.06.01(Oc
Kim H.-C., Lee K. (2009). Significant Contribution of Dissolved Organic Matter to Seawater Alkalinity. Geophys. Res. Lett. 36 (20), L20603. doi: 10.1029/2009gl040271
Kim J.-M., Lee K., Han I.-S., Lee J.-S., Choi Y.-H., Lee J. H., et al. (2020). Anthropogenic Nitrogen-Induced Changes in Seasonal Carbonate Dynamics in a Productive Coastal Environment. Geophys. Res. Lett. 47 (17), e2020GL088232. doi: 10.1029/2020GL088232
Ko Y. H., Lee K., Noh J. H., Lee C. M., Kleypas J. A., Jeong H. J., et al. (2016). Influence of Ambient Water Intrusion on Coral Reef Acidification in the Chuuk Lagoon, Located in the Coral-Rich Western Pacific Ocean. Geophys. Res. Lett. 43 (8), 3830–3838. doi: 10.1002/2016gl068234
Lee K., Chris S., Tanhua T., Kim T.-W., Feely R., Kim H.-C. (2011). Roles of Marginal Seas in Absorbing and Storing Fossil Fuel CO2. Energy Environ. Sci. 4, 1133–1146. doi: 10.1039/C0EE00663G
Lee K., Kim T.-W., Byrne R. H., Millero F. J., Feely R. A., Liu Y.-M. (2010). The Universal Ratio of Boron to Chlorinity for the North Pacific and North Atlantic Oceans. Geochim. Cosmochim. Acta 74 (6), 1801–1811. doi: 10.1016/j.gca.2009.12.027
Lee C.-H., Lee K., Ko Y. H., Lee J.-S. (2021). Contribution of Marine Phytoplankton and Bacteria to Alkalinity: An Uncharacterized Component. Geophys. Res. Lett. 48 (19), e2021GL093738. doi: 10.1029/2021GL093738
Lee K., Lee C.-H., Lee J.-H., Han I.-S., Kim M. (2019). Deviation of Boron Concentration From Predictions Using Salinity in Coastal Environments. Geophys. Res. Lett. 46 (9), 4809–4815. doi: 10.1029/2019gl082520
Lee K., Millero F. J., Byrne R. H., Feely R. A., Wanninkhof R. (2000). The Recommended Dissociation Constants for Carbonic Acid in Seawater. Geophys. Res. Lett. 27 (2), 229–232. doi: 10.1029/1999gl002345
Lee K., Millero F. J., Campbell D. M. (1996). The Reliability of the Thermodynamic Constants for the Dissociation of Carbonic Acid in Seawater. Mar. Chem. 55 (3), 233–245. doi: 10.1016/S0304-4203(96)00064-3
Lee K., Tong L. T., Millero F. J., Sabine C. L., Dickson A. G., Goyet C., et al. (2006). Global Relationships of Total Alkalinity With Salinity and Temperature in Surface Waters of the World's Oceans. Geophys. Res. Lett. 33 (19):L19605. doi: 10.1029/2006GL027207
Li D., Ni X., Wang K., Zeng D., Wang B., Jin H., et al. (2021). Biological CO2 Uptake and Upwelling Regulate the Air-Sea CO2 Flux in the Changjiang Plume Under South Winds in Summer. Front. Mar. Sci. 8 (1207). doi: 10.3389/fmars.2021.709783
Lueker T. J., Dickson A. G., Keeling C. D. (2000). Ocean Pco2 Calculated From Dissolved Inorganic Carbon, Alkalinity, and Equations for K1 and K2: Validation Based on Laboratory Measurements of CO2 in Gas and Seawater at Equilibrium. Mar. Chem. 70 (1), 105–119. doi: 10.1016/S0304-4203(00)00022-0
McElligott S., Byrne R. H., Lee K., Wanninkhof R., Millero F. J., Feely R. A. (1998). Discrete Water Column Measurements of CO2 Fugacity and pHT in Seawater: A Comparison of Direct Measurements and Thermodynamic Calculations. Mar. Chem. 60 (1), 63–73. doi: 10.1016/S0304-4203(97)00080-7
Mehrbach C., Culberson C. H., Hawley J. E., Pytkowicx R. M. (1973). Measurement of the Apparent Dissociation Constants of Carbonic Acid in Seawater at Atmospheric Pressure. Limnol. Oceanog. 18 (6), 897–907. doi: 10.4319/lo.1973.18.6.0897
Millero F. J. (1995). Thermodynamics of the Carbon Dioxide System in the Oceans. Geochim. Cosmochim. Acta 59 (4), 661–677. doi: 10.1016/0016-7037(94)00354-O
Millero F. J., Graham T. B., Huang F., Bustos-Serrano H., Pierrot D. (2006). Dissociation Constants of Carbonic Acid in Seawater as a Function of Salinity and Temperature. Mar. Chem. 100 (1), 80–94. doi: 10.1016/j.marchem.2005.12.001
Moon J.-Y., Lee K., Lim W.-A., Lee E., Dai M., Choi Y.-H., et al. (2021). Anthropogenic Nitrogen Is Changing the East China and Yellow Seas From Being N Deficient to Being P Deficient. Limnol. Oceanog. 66 (3), 914–924. doi: 10.1002/lno.11651
Najjar R. G., Herrmann M., Alexander R., Boyer E. W., Burdige D. J., Butman D., et al. (2018). Carbon Budget of Tidal Wetlands, Estuaries, and Shelf Waters of Eastern North America. Global Biogeochem. Cycle. 32 (3), 389–416. doi: 10.1002/2017GB005790
Park G.-H., Lee K., Tishchenko P., Min D.-H., Warner M. J., Talley L. D., et al. (2006). Large Accumulation of Anthropogenic CO2 in the East (Japan) Sea and its Significant Impact on Carbonate Chemistry. Global Biogeochem. Cycle. 20 (4):GB4013. doi: 10.1029/2005GB002676
Piao S., Fang J., Ciais P., Peylin P., Huang Y., Sitch S., et al. (2009). The Carbon Balance of Terrestrial Ecosystems in China. Nature 458 (7241), 1009–1013. doi: 10.1038/nature07944
Shim J., Kim D., Kang Y. C., Lee J. H., Jang S.-T., Kim C.-H. (2007). Seasonal Variations in Pco2 and Its Controlling Factors in Surface Seawater of the Northern East China Sea. Continent. Shelf. Res. 27 (20), 2623–2636. doi: 10.1016/j.csr.2007.07.005
Thomas H., Schiettecatte L.-S., Suykens K., Koné M., Shadwick E., Prowe A. E. F., et al. (2009). Enhanced Ocean Storage From Anaerobic Alkalinity Generation in Coastal Sediments. Biogeosciences 6, 267–274. doi: 10.5194/bg-6-267-2009
Tseng C.-M., Liu K.-K., Gong G.-C., Shen P.-Y., Cai W.-J. (2011). CO2 Uptake in the East China Sea Relying on Changjiang Runoff Is Prone to Change. Geophys. Res. Lett. 38 (24), L24609. doi: 10.1029/2011GL049774
Tsunogai S., Watanabe S., Sato T. (1999). Is There a “Continental Shelf Pump” for the Absorption of Atmospheric CO2? Tellus. B. 51 (3), 701–712. doi: 10.3402/tellusb.v51i3.16468
Wang S.-L., Arthur Chen C.-T., Hong G.-H., Chung C.-S. (2000). Carbon Dioxide and Related Parameters in the East China Sea. Continent. Shelf. Res. 20 (4), 525–544. doi: 10.1016/S0278-4343(99)00084-9
Wanninkhof R. (2014). Relationship Between Wind Speed and Gas Exchange Over the Ocean Revisited. Limnol. Oceanog.: Methods 12 (6), 351–362. doi: 10.4319/lom.2014.12.351
Wu Y., Dai M., Guo X., Chen J., Xu Y., Xu D., et al. (2021). High-Frequency Time-Series Autonomous Observations of Sea Surface Pco2 and pH. Limnol. Oceanog. 66, 588–606. doi: 10.1002/lno.11625
Zhai W., Dai M. (2009). On the Seasonal Variation of Air–Sea CO2 Fluxes in the Outer Changjiang (Yangtze River) Estuary, East China Sea. Mar. Chem. 117 (1), 2–10. doi: 10.1016/j.marchem.2009.02.008
Zhang J., Guo X., Zhao L. (2021). Budget of Riverine Nitrogen Over the East China Sea Shelf. Environ. Pollut. 289, 117915. doi: 10.1016/j.envpol.2021.117915
Keywords: East China Sea, Ieodo Ocean Research Station, net air-sea CO2 flux, continental shelf C pump, anthropogenic nitrogen deposition, riverine nitrate, Changjiang Diluted Water
Citation: Lee K, Kim J-M, Lee G-S, Lee E, Jeong J-Y, Lee J and Han I-S (2022) Persistent Continental Shelf Carbon Sink at the Ieodo Ocean Research Station in the Northern East China Sea. Front. Mar. Sci. 9:919249. doi: 10.3389/fmars.2022.919249
Received: 13 April 2022; Accepted: 19 May 2022;
Published: 28 June 2022.
Edited by:
Wen-Chen Chou, National Taiwan Ocean University, TaiwanReviewed by:
Chen-tung Arthur Chen, National Sun Yat-sen University, TaiwanXinping Hu, Texas A&M University Corpus Christi, United States
Copyright © 2022 Lee, Kim, Lee, Lee, Jeong, Lee and Han. This is an open-access article distributed under the terms of the Creative Commons Attribution License (CC BY). The use, distribution or reproduction in other forums is permitted, provided the original author(s) and the copyright owner(s) are credited and that the original publication in this journal is cited, in accordance with accepted academic practice. No use, distribution or reproduction is permitted which does not comply with these terms.
*Correspondence: Ja-Myung Kim, amFteXVuZ0Bwb3N0ZWNoLmFjLmty