- 1State Key Laboratory of Tropical Oceanography, South China Sea Institute of Oceanology, Chinese Academy of Sciences, Guangzhou, China
- 2Fujian Provincial Key Laboratory of Marine Physical and Geological Processes, Third Institute of Oceanography, Ministry of Natural Resources, Xiamen, China
- 3College of Earth and Planetary Sciences, University of Chinese Academy of Sciences, Beijing, China
- 4Southern Marine Science and Engineering Guangdong Laboratory (Guangzhou), Guangzhou, China
- 5College of the Environment and Ecology, Xiamen University, Xiamen, China
We herein report the observation of a slope undercurrent beneath the winter western boundary current of the northwestern South China Sea (SCS), and its spatiotemporal variation. The possible underlying dynamics are also discussed. In situ observations reveal that the northeastward undercurrent is located above the upper slope with a core velocity exceeding 20 cm/s, which extends from 200 m to 800 m in depth with a width of 30–50 km and an along-slope length of approximately 200 km in deep winter of 2006-2007, and is characterized with interseasonal and interannual variabilities. The existence of this undercurrent is also supported by Hybrid Coordinate Ocean Model (HYCOM) results. We find that the slope undercurrent is probably driven by the along-slope pressure gradient associated with the sea level set-up off the continental slope of south Hainan Island and modulated by mesoscale eddies and Rossby waves. This study will renew our knowledge of the deep slope currents in the northwestern SCS.
Introduction
As a semi-enclosed basin forced by the East Asian monsoon, the upper layer circulation in the South China Sea (SCS) is highly seasonal and western intensified (Wyrtki, 1961; Qu, 2000; Li et al., 2000). In winter, the circulation is generally cyclonic forming a strong western boundary current in the upper layer, which flows along the continental slope all the way southward from the northwestern SCS until reaching the Sunda shelf (Fang et al., 2012; Wang et al., 2013; Fang et al., 2015; Zhu et al., 2015; Shu et al., 2016; Zhao and Zhu, 2016; Li et al., 2018) (Figure 1A). It is also noted that, as the beginning area of the winter western boundary current of the SCS (SCSwwbc), the northwestern SCS is subject to influences of near surface inflows from the Luzon Strait (Li et al., 2000; Centurioni et al., 2004; Centurioni et al., 2009) and mesoscale eddies detached from the Kuroshio (Li et al., 1998; Wang et al., 2013; Wang et al., 2019; Wang et al., 2020a).
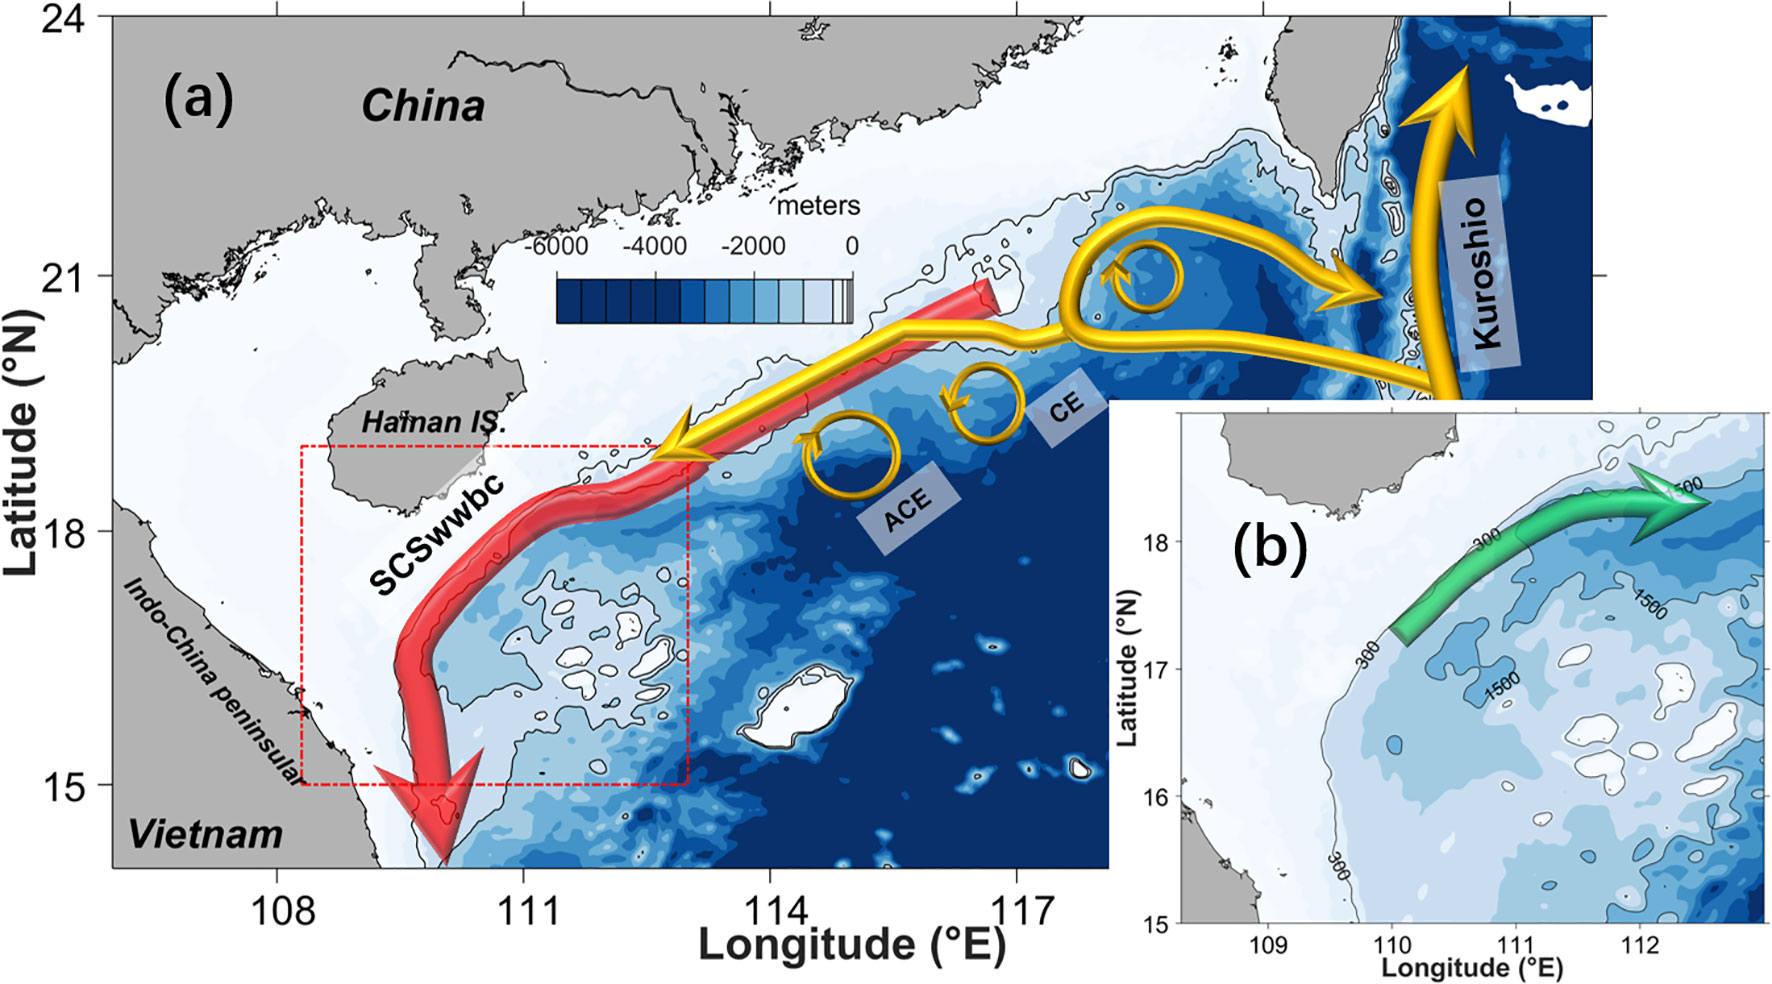
Figure 1 (A) Schematic diagram of the circulation in the northern SCS. SCSwwbc: winter western boundary current of the SCS; ACE, anticyclonic (warm) eddy; CE, cyclonic (cold) eddy. (B) The geographical extent of the study region which is delineated by red dotted box in (A); the green arrow represents the slope undercurrent; the solid black curves depict the 300 and 1500 m isobaths.
Below the upper layer, several model studies have suggested that large scale circulation in the intermediate layer is generally anticyclonic (Yuan, 2002; Gan et al., 2016; Wei et al., 2016; Cai and Gan, 2020), which implies that, in contrast to the upper layer, current over the western slope of the SCS may flow northward beneath the SCSwwbc, though no observational evidence is available yet over the continental slopes of the northwestern SCS and that further south. Hence, our understanding of the slope current beneath the upper layer is still very limited.
The northwestern SCS has a unique submarine topography, where the deep basin is bounded by Hainan Island on the northwest and by the continental slope of the Indo-China peninsular on the west (Figure 1A). There is a northeast-southwest oriented trough with the depth over 1,500 m and the width of 120 km, extending westward toward the Indo-China peninsular and is terminated by the continental slope (Figure 1B). In general, the SCSwwbc flows southwestward along the continental slope off Hainan Island and then turns southward while encountering the continental margin off Vietnam (Figure 1), where the 300 m isobath turns anti-clockwise by around 60 degrees. This special topography has a great influence on the circulation dynamics while turning of the SCSwwbc around the corner, especially when it is fluctuating.
In this study, it is found that SCSwwbc interacts strongly with the topography, apparently when it passes through the northwestern SCS, reduced by changes of the above-mentioned shelf-edge, the flow direction in the upper layers was greatly deflected (Figure 1A). Impressively, it generates an along-slope pressure gradient (APG) which favorable for the slope undercurrent beneath the SCSwwbc. This study is to report that a slope undercurrent probably exists in the northwestern SCS below the winter western boundary current. Based on in situ observations, the structure and variability of this undercurrent is presented, and the possible forcing is discussed.
Data
In Situ Observations
Current measurements were available from two mooring stations and one more station anchored in daytime, equipped with acoustic Doppler current profilers (ADCPs) located on the upper slope of the northwestern SCS (Figure 2). Both two moorings at stations Q1 and Q2 were deployed twice, the sampling time interval was 1 hour, with the time span of the synchronized data covering 37 days from 26 December 2006 to 31 January 2007 and another 36 days from 12 April to 17 May 2007 (Table 1). The daytime-anchored station Q3 was deployed from 30 November to 3 December 2018 which acquired the vertical profiles of currents with 2-minute intervals. Detailed information on those current-observation stations is shown in Table 1. All ADCP data at mooring station Q1 and Q2 were low-pass filtered with a PL33 digital symmetric filter with a cutoff period of 33 hours (Alessi et al., 1985) to obtain the subtidal time series. To facilitate the analysis, the mooring period was reset to the number of days after (and including) 26 December 2006, i.e., from day 0 to day 36 for the first mooring period (from day 107 to day 144 for the second mooring period).
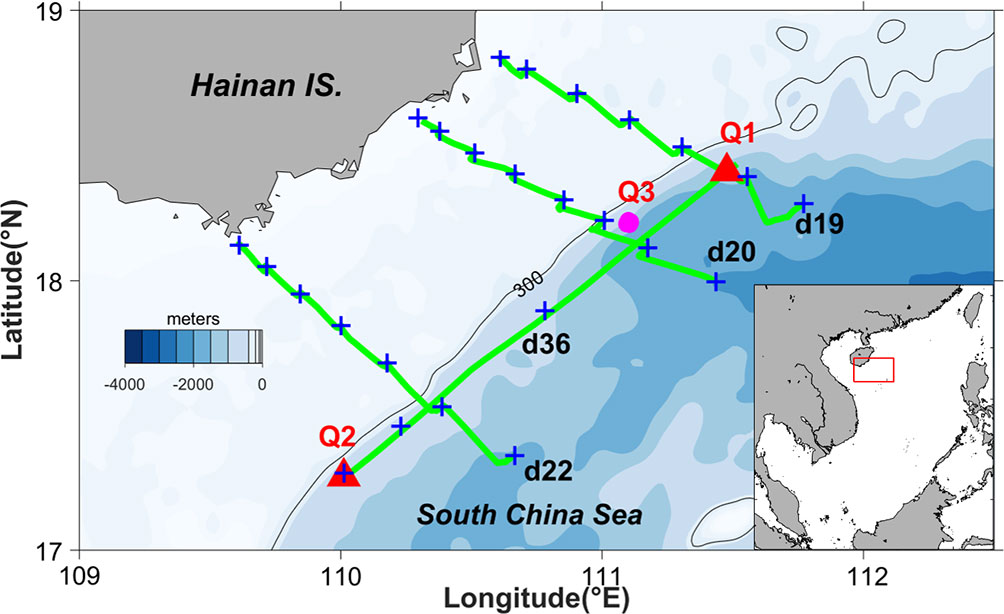
Figure 2 Topography of the northwestern SCS with the locations of the CTD stations (blue crosses), along-track ADCP transects (green curves), mooring stations (red triangles), and the day-time anchored station (purple solid circle). The inset at the lower right is a location map of the SCS with simplified bathymetry, and the red box is the focus region of this study.
Hydrographic observations were also obtained during the mooring period in deep winter of 2006-2007. Data were acquired from four transects (including three cross-slope transects and one along-slope transect) with 25 particular conductivity-temperature-depth (CTD) casts together with along-track ADCP measurements conducted at days 19, 20, 22 and 36 (hereafter abbreviated as transects d19, d20, d22 and d36, respectively; Figure 2). The CTD and ship-board ADCP data were processed with quality control procedures. The final CTD sampling interval is 1 m, and the ship-board ADCP velocity data cover the depth range of 33–800 m with a 16-m vertical resolution.
The trajectory of an ARGO buoy (No-2901436) was also used, which transits the slope region of the northwestern SCS from 25 October to 26 November 2013. Because it will suspend in nearly 800 m depth when it was in standby mode, the circulation characteristics of the deep layers can be determined by its moving direction.
Reanalysis Data and Satellite Altimeter
The Hybrid Coordinate Ocean Model + Navy Coupled Ocean Data Assimilation (HYCOM+NCODA) analysis product (Cummings & Smedstad, 2013), which has been widely used in studies throughout the SCS (Shu et al., 2014; Xie et al., 2015; Chen et al., 2020; Wang et al., 2020b), supplies variables with a 1/12° horizontal resolution with 33 vertical levels and a three-hourly or daily temporal resolution. Three-hourly data of the surface elevation and current velocity from 26 December 2006 to 31 January 2007 and the daily velocity field in October to March (the months of winter monsoon) from 2005 to 2014 were employed in this study. In addition, the daily ERA5 reanalysis wind product on a 0.125° grid was also obtained by averaging in the domain from 16° to 20°N and from 106° to 114°E.
Daily merged sea level anomaly (SLA) data gridded at a spatial resolution of 0.25° from the French Archiving, Validation and Interpretation of Satellite Oceanographic Data+ (AVISO+) (Ducet et al., 2000) were utilized to identify mesoscale eddies. Absolute dynamic topography (ADT) data which was derived from along-track SLA and mean dynamic topography with satellites Jason-1 and Envisat, was also applied to identify the variation of sea level along the continental slope of northern SCS.
Results
An Episodic Slope Undercurrent From In Situ Observations
The velocity data from mooring stations Q1 and Q2 located on the upper slope in deep winter of 2006-2007 clearly reveal a northeastward undercurrent beneath the surface flow field dominated by the southwestward SCSwwbc; this undercurrent becomes evident at depths below 150 m and features a core with a velocity exceeding 20 cm/s at a depth of approximately 300 m (Figures 3A, B).
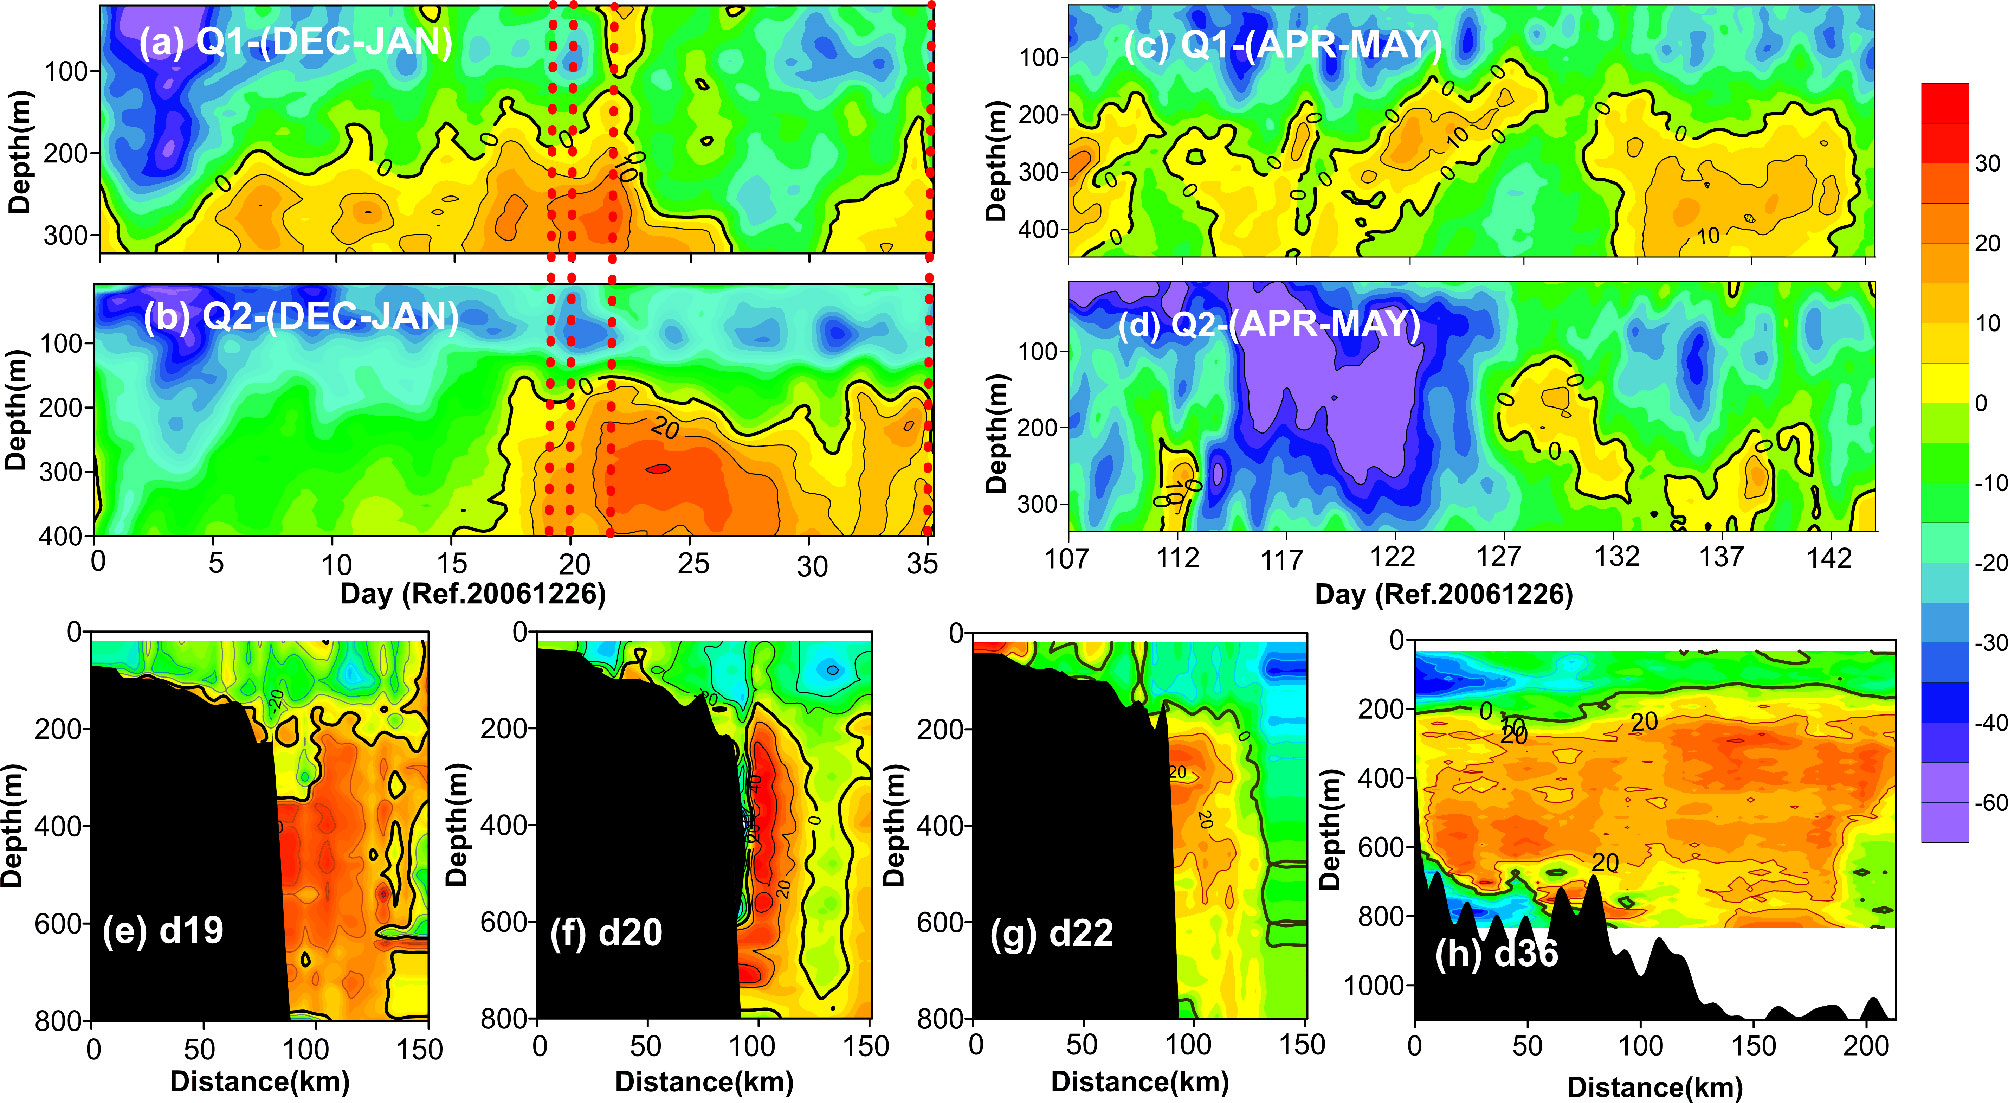
Figure 3 (A–D) Low-pass filtered along-slope component of the subtidal current (cm/s, positive for northeastward) at mooring stations Q1 (A, C) and Q2 (B, D). The horizontal axis starts on 26 December 2006 (Beijing Time, UTC+8), and the red dashed lines indicate the times at which the along-track ADCP measurements were conducted. (E–H) Distributions of the along-slope current (cm/s) along transects d19, d20, d22 and d36. The bold black contours in each panel indicate zero flow speed. The Cartesian coordinates are rotated clockwise by 60° to enable the coordinates to better fit our study area.
Moreover, the durations of this undercurrent were quite different from one another between the two stations. At station Q1 (Figure 3A), the undercurrent was cut off twice during the 37-day observation period in deep winter, with the longest duration reaching 24 days. At station Q2 (Figure 3B), the undercurrent only appeared in the second half of the mooring period, lasting about 18 days. Accordingly, the observed undercurrent appears to be an episodic phenomenon.
Limited by mooring settings, only current profiles above the upward looking ADCP were observed; furthermore, the along-track ADCP observations from all four along- and cross-slope transects (Figures 3E–H) suggest that the undercurrent extended from 200 m to 800 m depth with a width of 30–50 km and an along-slope length scale of approximately 200 km.
Another in situ observation further indicates that the undercurrent is characterized with interseasonal and interannual variabilities. In the middle spring of 2007, the undercurrent is significantly different from that in deep winter of 2006-2007. As shown in Figures 3C, D, the undercurrent still existed below the depth of approximately 200 m at mooring station Q1, but its velocity significantly decreased compared with that in the deep winter period; the peak velocity was found locating at the depth around 300-400 m, which was as low as only 10 cm/s. Meanwhile, the undercurrent was weak and only occurred occasionally at station Q2 in the southern part of the study area.
The spatial distribution pattern of this undercurrent in the winter of 2018 was significantly different from that in the winter of 2007. Specifically, the along-slope current observed by a day-time anchored station Q3 for four consecutive days (during November 30 to December 3, 2018) indicates that the undercurrent extends from the depth of around 200 m down to the depth of only 500 m (Figure 4A), and the mean daytime current profile depicts a maximum velocity of approximate 20 cm/s at the depth of 232 m (Figure 4B).

Figure 4 (A) Along-slope current (cm/s, positive for northeastward) obtained from anchored station Q3 (the purple solid circle in Figure 2) the data was cutoff at night-time when the ship was in free drift; the black contours indicate zero flow speed. (B) The mean daytime current profile of the four days.
approximately 20 cm/s at the depth of 232 m (Figure 4B).
In addition, it is found that an ARGO buoy traveled nearly 350 km northeastward along the slope of the northwestern SCS in the early winter of 2013 (Figure 5). Since the buoy was floating at depth of 800 m when it finished the up and down profile observations, it can be speculated that the undercurrent would reach the 800-m depth during this period.
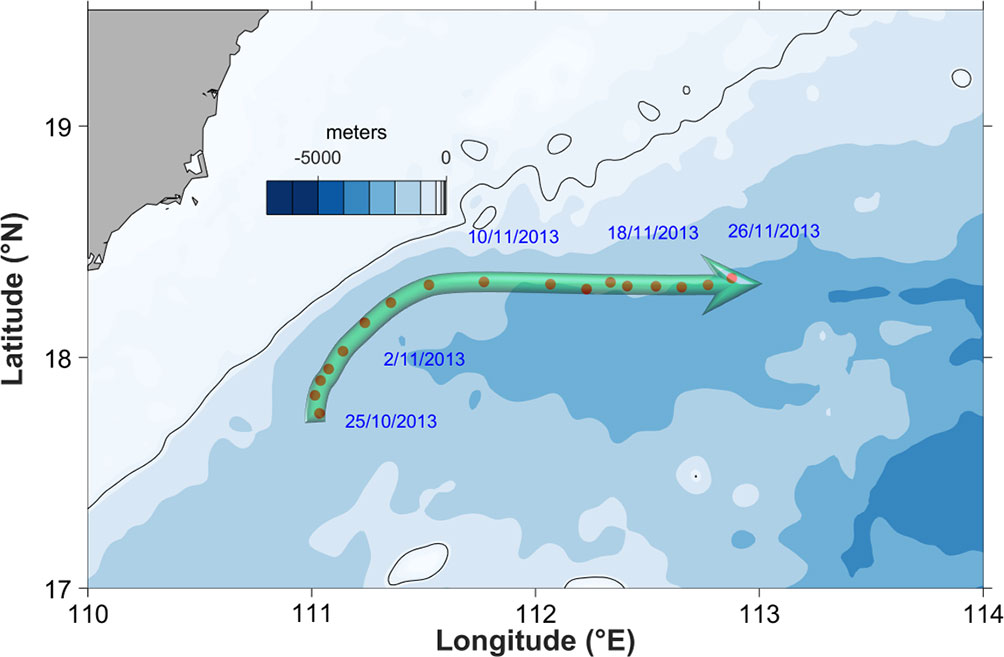
Figure 5 The trajectory of the ARGO buoy (No-2901436) from October 25 to November 26, 2013, where the red cycles with dates show the locations and times (dd/mm/yy), respectively. The green arrow represents the slope undercurrent.
Hydrographic Features and Geostrophic Velocity
In contrast to the current measurements in deep winter of 2006-2007, our hydrographic observation depicted another image of geostrophic undercurrent along all three cross-slope transects (Figures 6A–C). The density distributions along these cross-slope transects clearly show that the water is lighter above the shelf than farther offshore, and the isopycnals tilt down toward the slope in the full water column along transect d19 and above 600 and 300 m along transects d20 and d22, respectively, implying a southwestward geostrophic flow (Figures 6E–G). Note that estimates of geostrophic velocity over the continental shelf (shallower than 300m) may cause large errors due to dynamic height extrapolation from deeper water, and thus are not discussed here. Comparisons of in situ observed and geostrophic velocity distribution at each of the three cross-shelf sections (see Figures 3E–G, 6E–G) indicate that the baroclinic structure of the SCSwwbc has largest geostrophic component from surface to 150 m depth over the slope while the geostrophic component for undercurrent is weaker, and gradually decreases from south to north in the study region. The direction of geostrophic flow in undercurrent region is not consistent with in situ current measurements (Figures 3E–G) except for transect d22. Whether the undercurrent in the upper slope is ageostrophic, more observations are needed to verify. In addition, hydrographic structure along the slope shows a local raise in isopycnal (Figure 6D), which may contribute to the variation of the undercurrent in the region (the details will be shown in the follow-up discussion).
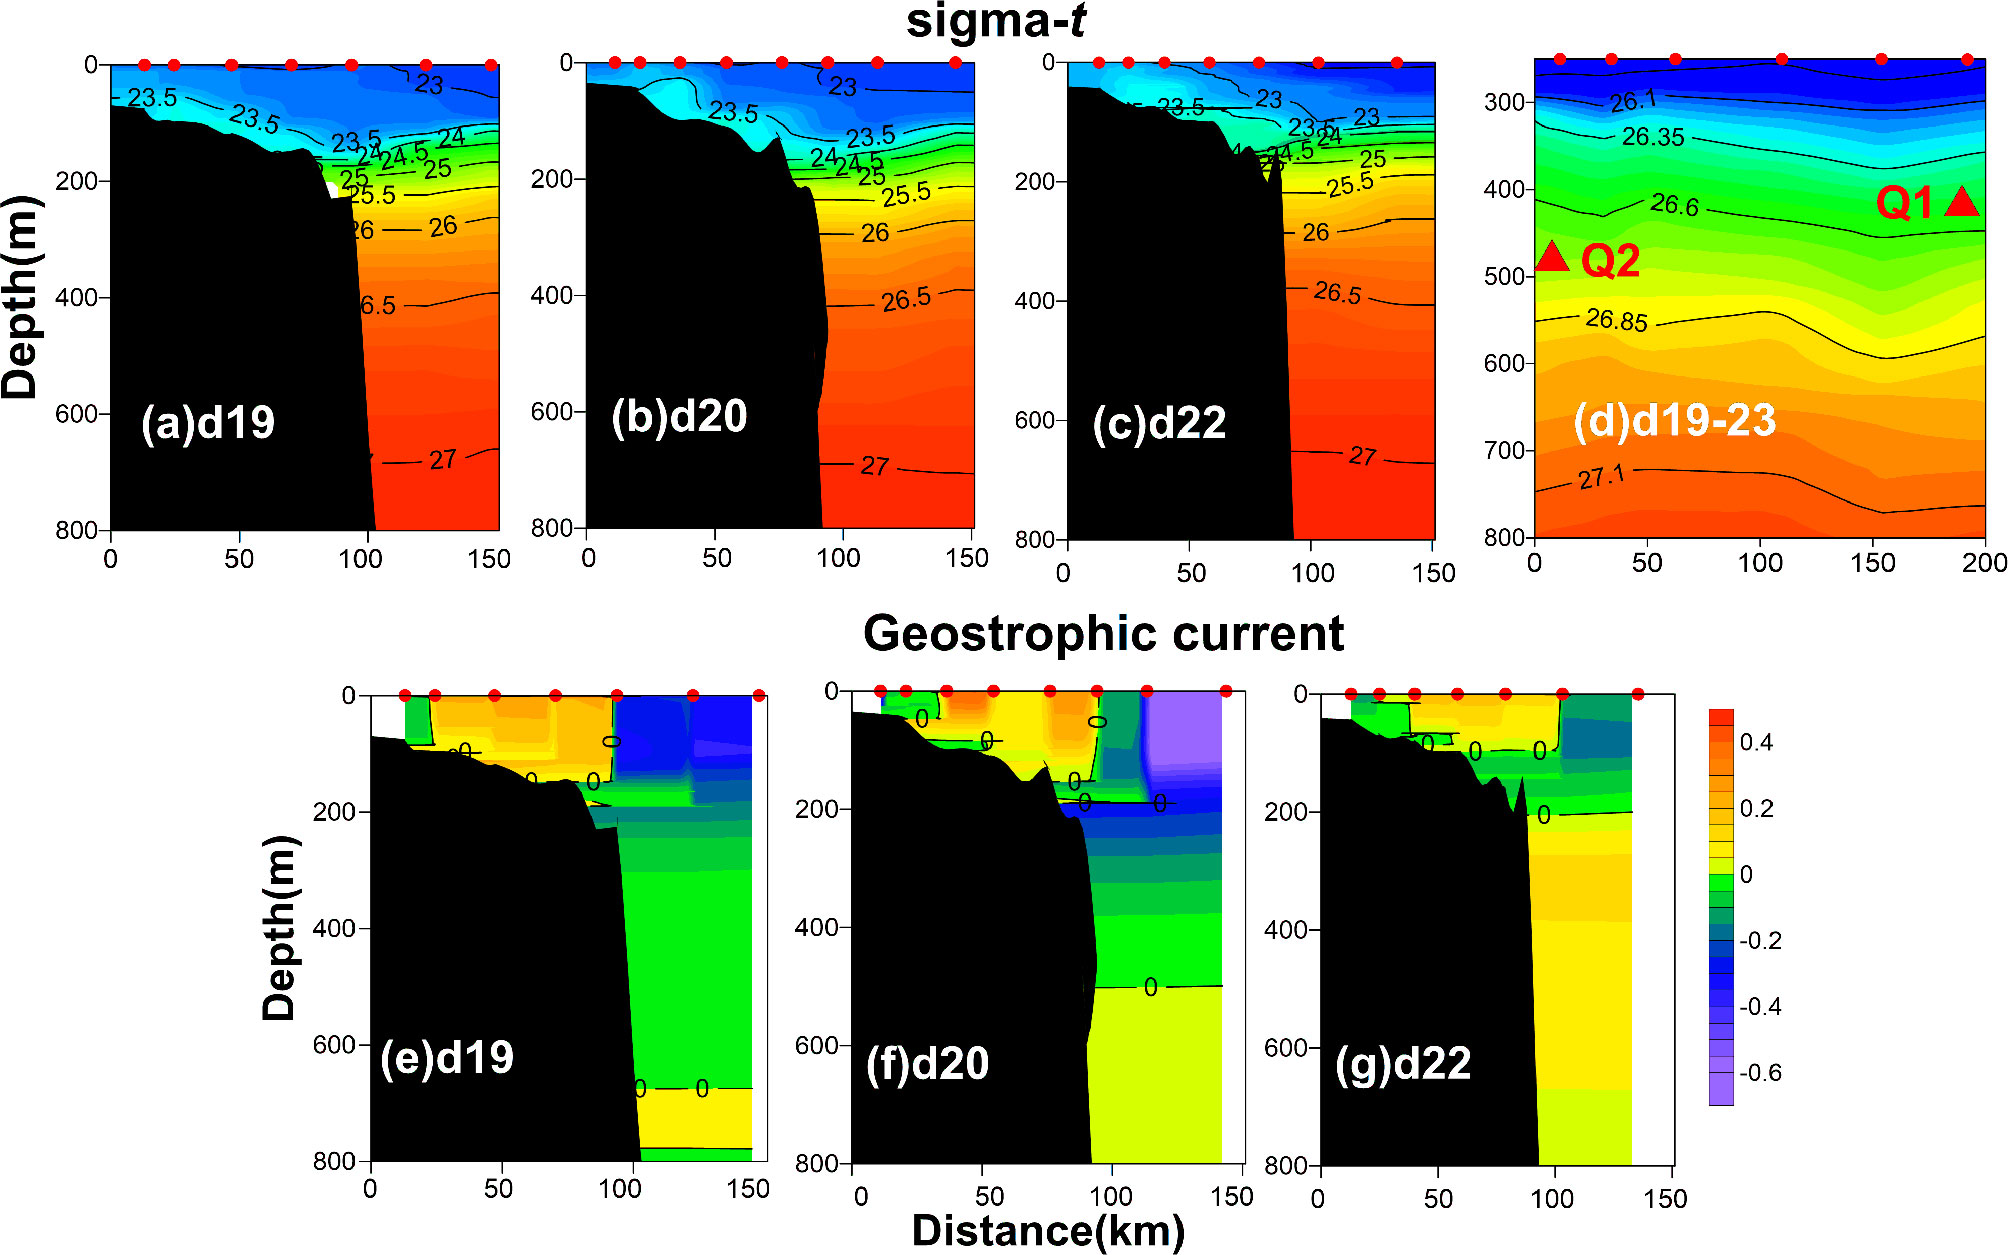
Figure 6 Distribution of the potential density sigma-t (kg m-3) (A–C) and geostrophic current (m s-1) (E–G) on cross-slope transects d19, d20, and d22; sigma-t along-slope transect d19-23 (only at depths from 200 to 800 m) (D). Note that the geostrophic current is referred to 1000 dbar; the along-slope transect is close to mooring stations Q1 and Q2 (red triangles). The accompanying CTD castings (red dots) at the stations were performed on days 19, 20, 22 and 19–23.
The Mean Slope Undercurrent and Its Variation From the HYCOM Output
The climatological pattern of the subsurface circulation from the HYCOM shows that the undercurrent probably exists in the upper-slope region of the northwestern SCS during the months of winter monsoon (indicated by the northeasterly wind) (Figure 7), though its spatial distribution is not stable, indicating inter-seasonal and inter-annual variations (Figures 8, 9). Specifically, the mean along-slope current from the HYCOM output over the 10-years (2005-2014) of winter monsoon reveals that the undercurrent could further extend beyond a depth of 1400 m with a width of 70 km and an along-slope length of approximately 300 km (Figures 7B, C). The mean along-slope current over each individual month of the 10-years of winter monsoon indicates that the undercurrent reaches its peak in deep winter (i.e., January); and then gradually declines in the early spring. Moreover, in January for the years from 2005 to 2014, the undercurrent always resided within the lower layer near station Q1, and may extend southwestward to Q2 in some years (Figure 9). In addition, it would extend to the surface ocean in some years, which was induced by the warm eddy intruding into the region (see Figure 11 for a similar example).
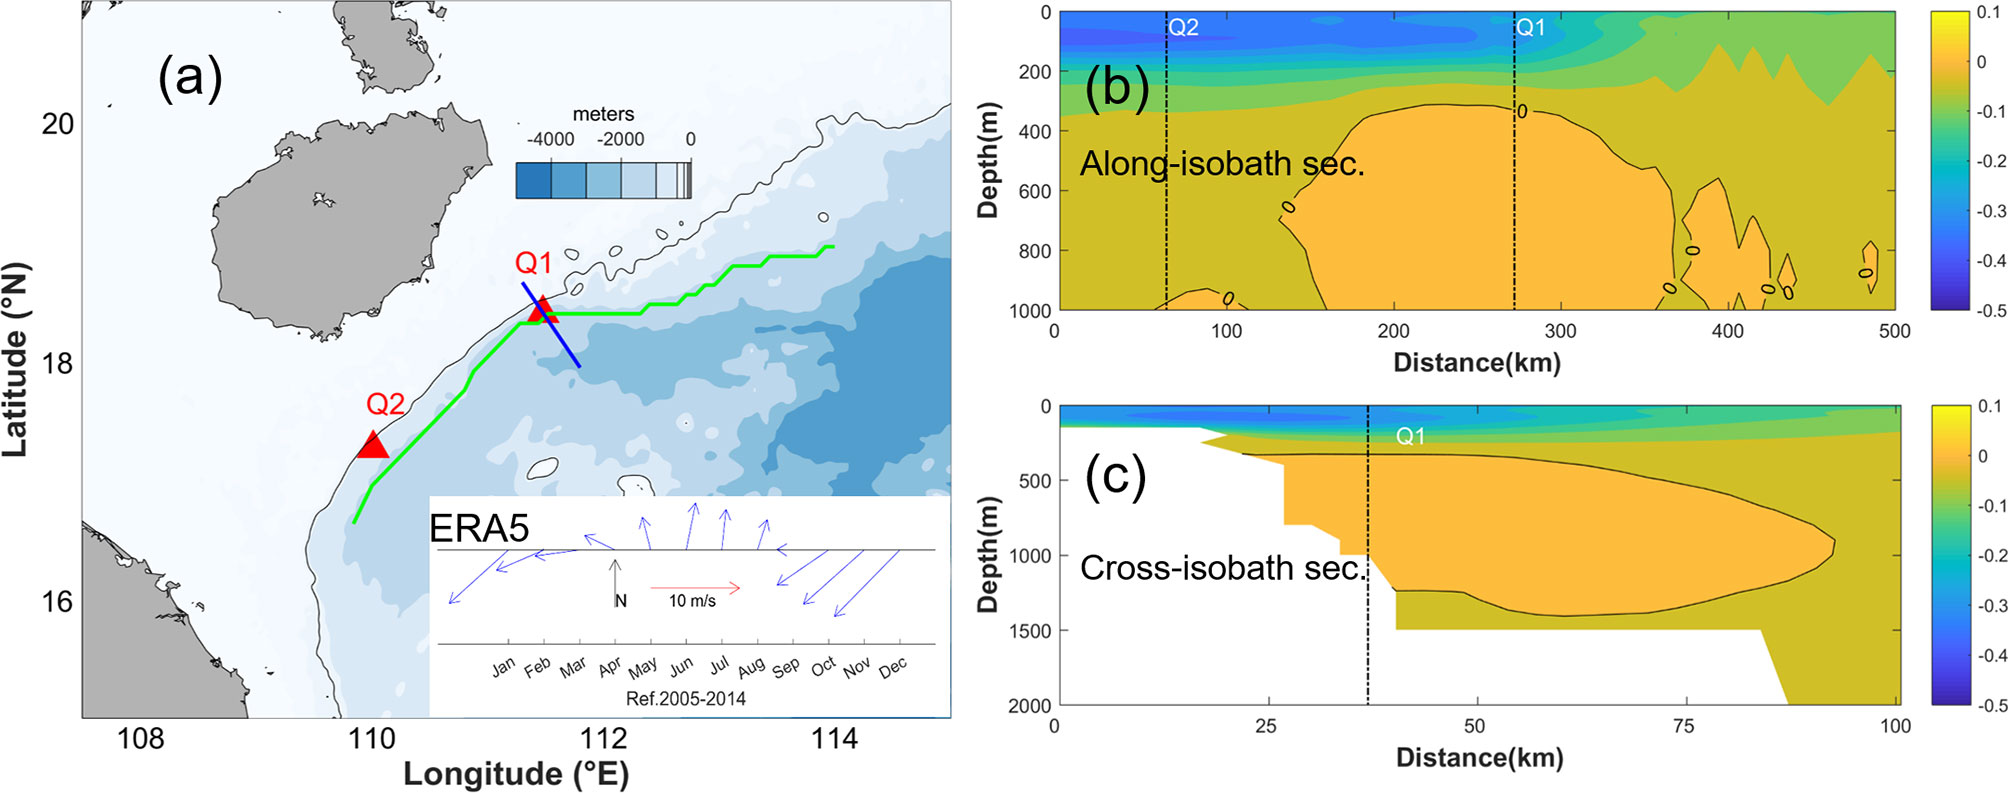
Figure 7 (A) Transects for the flow field from the HYCOM output along the 1000-m isobath (green curve) and cross-isobath (blue curve); the inset at the lower right is the stick diagram of monthly mean wind velocity averaged over ten years (2005-2014) in the study region. Mean along-slope current (m/s) from HYCOM output along the 1000-m isobath (B) and cross-isobath (C) in the months (from October to March) of winter monsoon for the years from 2005 to 2014. The black contours in panels B and C indicate zero flow speed; the along-isobath (off-isobath) distances of mooring stations Q1 and Q2 are indicated with black dotted lines.
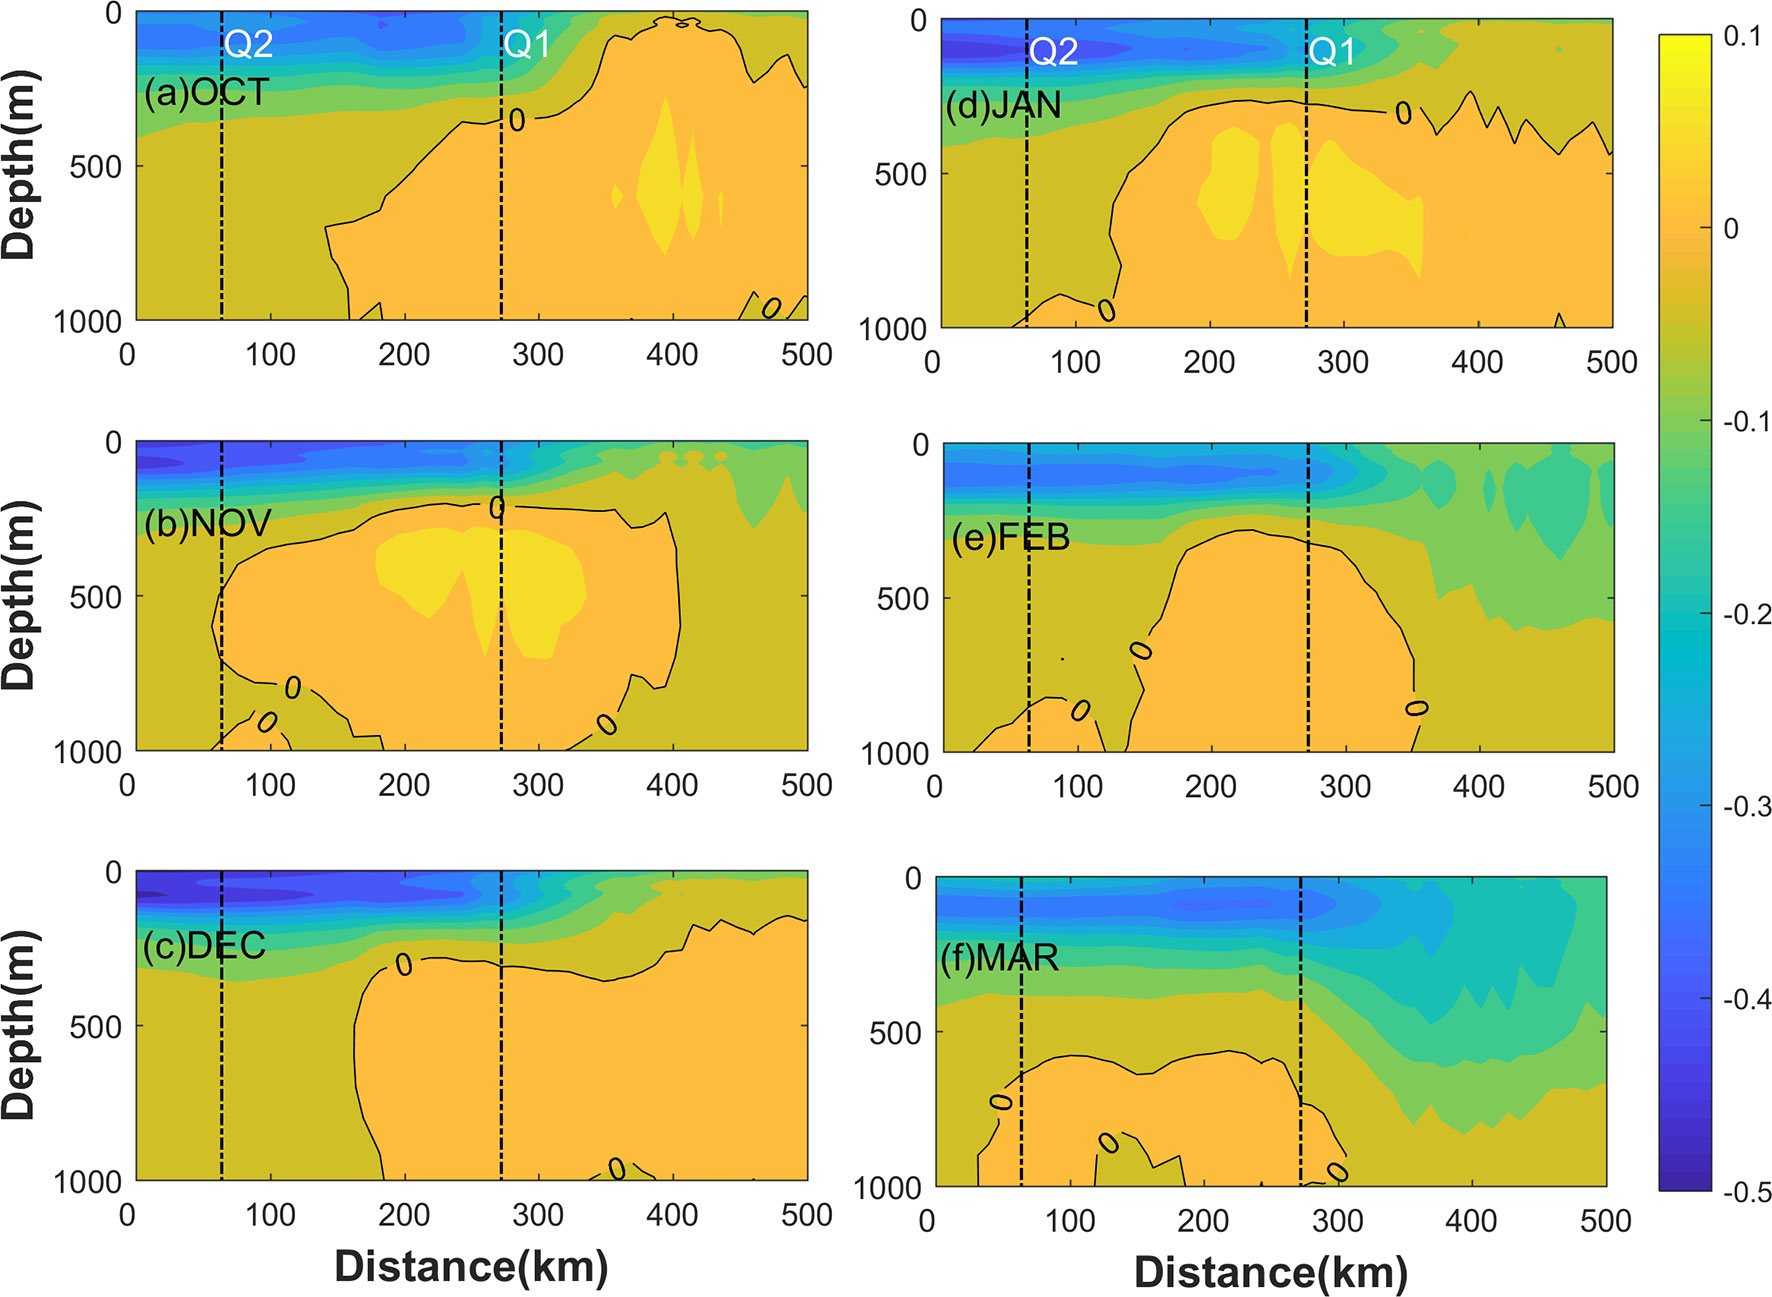
Figure 8 The 10-yr mean along-slope current (m/s) from HYCOM output along the 1000-m isobath in the months of winter monsoon: Oct. (A), Nov. (B), Dec. (C), Jan. (D), Feb. (E) and Mar. (F). The black contours indicate zero flow speed. The along-isobath distances of mooring stations Q1 and Q2 are indicated with black dotted lines.
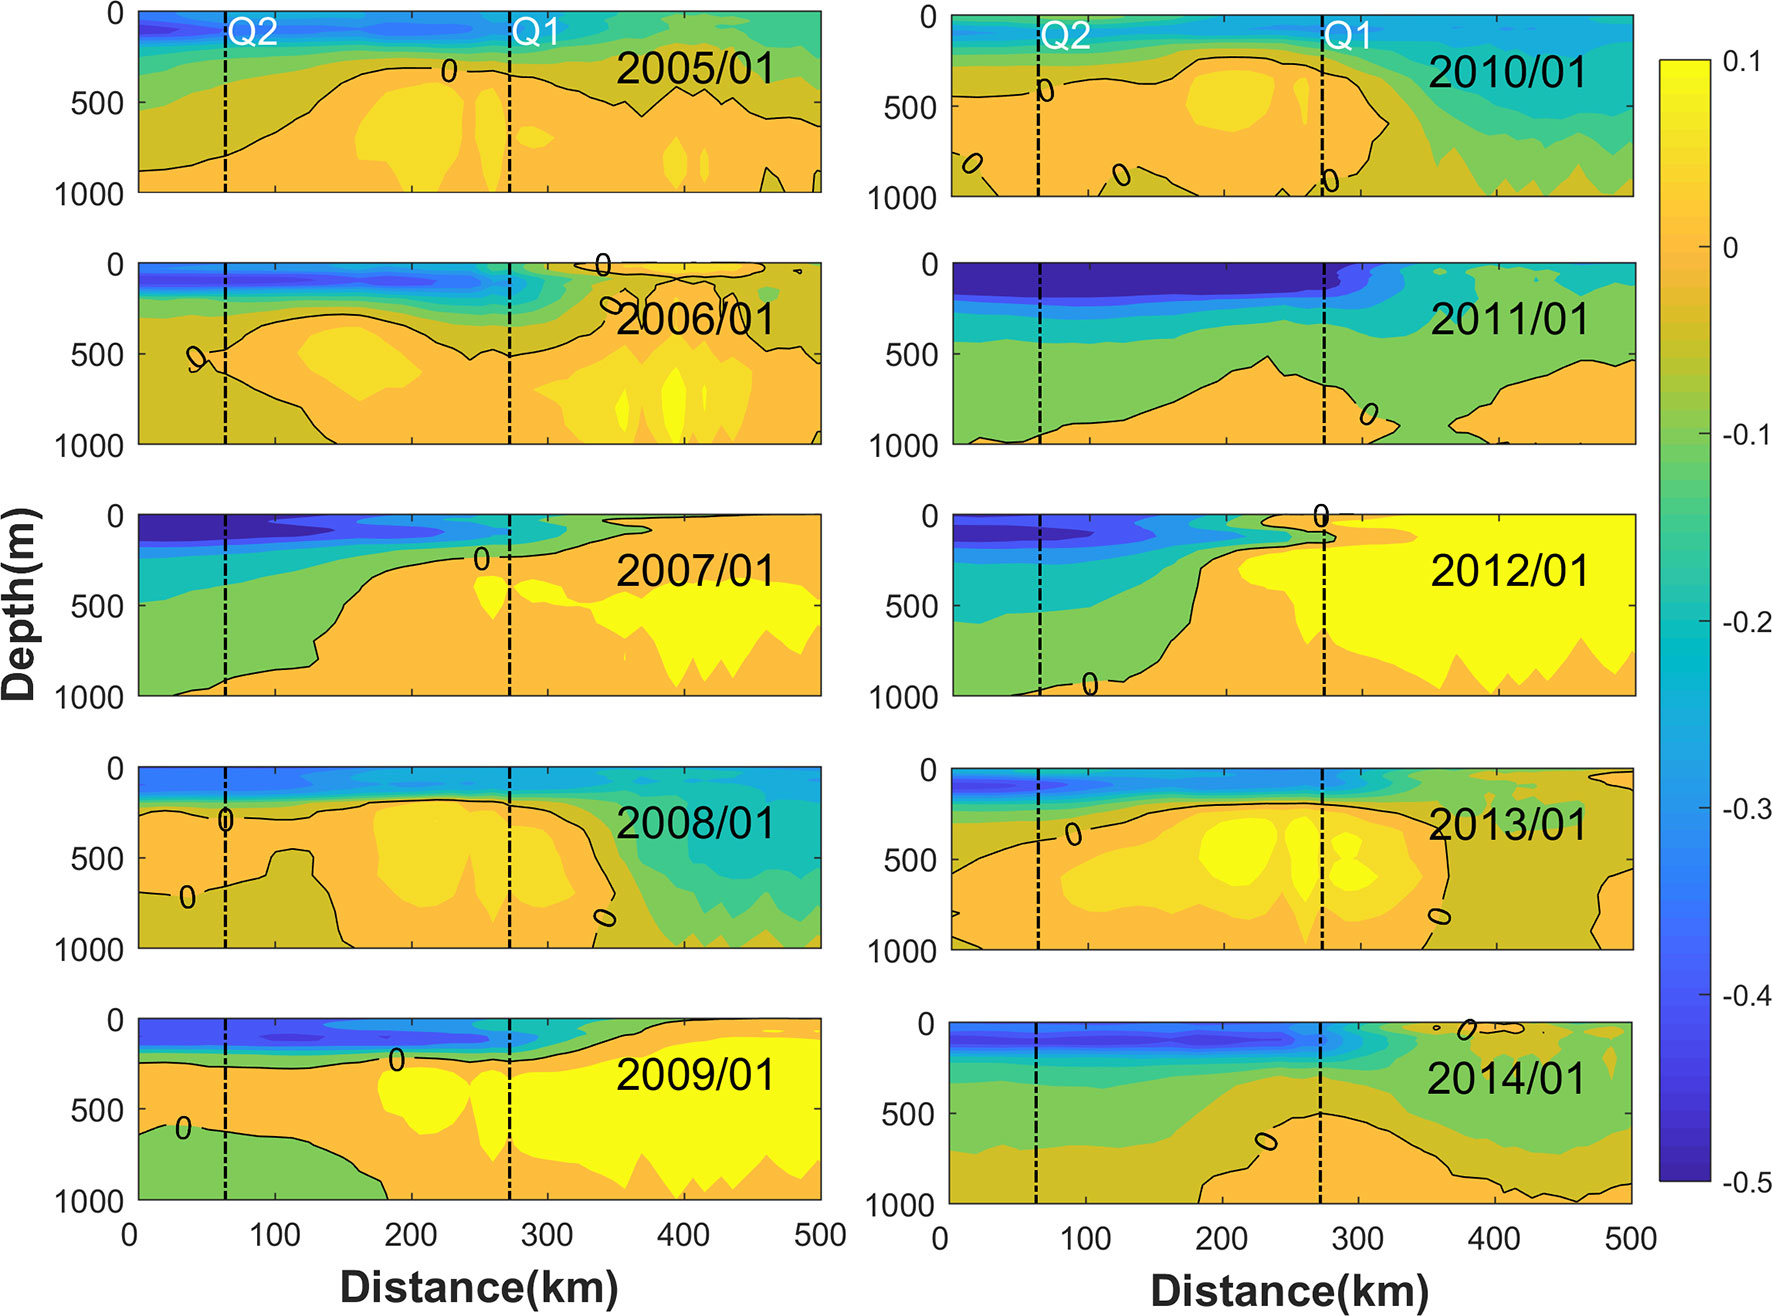
Figure 9 Mean along-slope current (m/s) from HYCOM output along the 1000-m isobath in January for the years from 2005 to 2014. The black contours indicate zero flow speed. The along-isobath distances of mooring stations Q1 and Q2 are indicated with black dotted lines.
Discussion
Possible Forcing Provided by the Along-Slope Sea Level Gradient
The undercurrent in the upper-slope region has been observed in many areas, mainly along the eastern ocean boundary (Thompson, 1984; Connolly et al., 2014) and in certain terranes (Dahl, 1978; Church and Boland, 1983). It is worth mentioning that these undercurrents were forced by the APG, although the corresponding causes differed considerably. In our case, the northeastward undercurrent observed in most of the upper slope region is ageostrophic. Hence, the observed slope undercurrent may not be driven by the cross-slope pressure gradient although more observations are needed to further verify. It is important to note that a local sea level set-up triggered by the interaction of the SCSwwbc and topography was found in the continental slope region which induced an APG (Figure 10A).
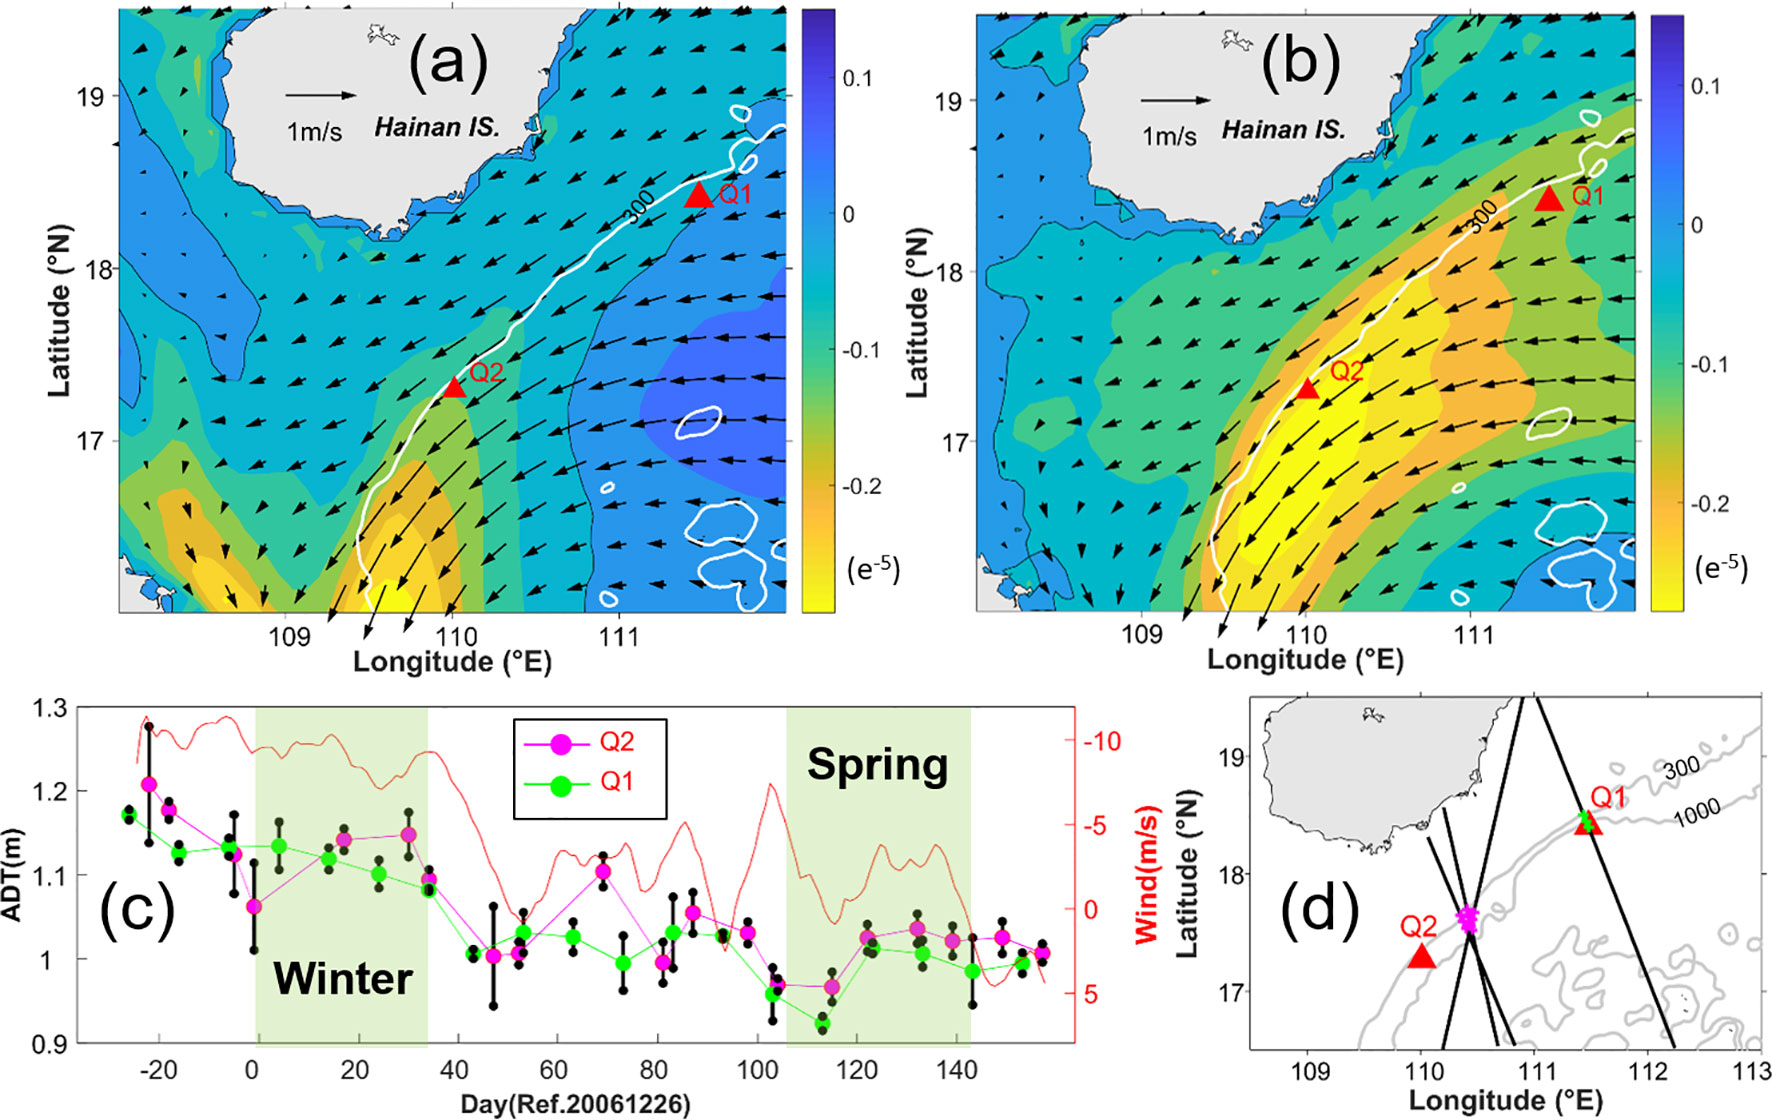
Figure 10 The along-slope (A) and cross-slope (B) of mean sea level gradient (the positive values correspond to the northeast and off-shore directions, respectively); the mean surface velocity field was overlayed around northwestern SCS, derived from the HYCOM output during the mooring period in deep winter of 2006-2007. The mean ADT (C) near the stations Q1 (green dotted line) and Q2 (magenta dotted line) derived from satellite along-track data (black lines) (D), to show the variation of sea level along the slope region; the error bars correspond to standard deviation of the ADT; the blue shading in (C) highlights the two mooring periods; and the along-shore component of the wind (red line) in the study region is overlayed.
Figure 10A depicts the spatial distribution of the along-slope sea level gradient (SLG) which derived from the HYCOM output during the mooring period in deep winter of 2006-2007. It shows that a significant along-slope SLG was built which tilt downward from northeast to southwest with a huge local increase at corner of the slope where the SCSwwbc turns follow the topography. Meanwhile, to maintain the geostrophic balance, a significant sea level set-up was built along the slope region off south Hainan Island which in turn result in a cross-slope SLG tilt downward from southeast to northwest providing additional centripetal acceleration for the SCSwwbc which turns southward (Figure 10B). More importantly, the observed slope undercurrent lied in the downstream of this significant sea level set-up; and the associated along-slope SLG will provide the barotropic component of the APG which probably acts as the key forcing.
Further, the along-track ADT data around the mooring stations Q1 and Q2 depicts the variation of sea level around the slope region (Figures 10C, D). In general, the ADT at Q2 was larger than the one at Q1, i.e., there is a sea level set-up along the slope region. This sea level set-up has inter-seasonal variability which appears to fluctuate with the strength of the northeasterly wind. In winter the amplitude of wind is obviously greater than that in spring; a similar variation pattern of undercurrent velocity was revealed at mooring stations Q1 and Q2 (Figures 10C, 3A–D), indicating an underlying connection between the two elements. Moreover, the sea level set-up also appears to be intermittent in winter, which seems highly coincident with the observed undercurrent at station Q2 (Figures 3B, 10C): both of which disappeared during the first half of the mooring period in deep winter of 2006-2007; when the sea level set-up was rebuilt, the undercurrent at station Q2 appeared during the second half of the mooring period. From this, the APG associated with the sea level set-up could probably drive the undercurrent.
Effects of the Mesoscale Eddies and Rossby Waves
Caused by the wind stress curl (Qu, 2000; Wang et al., 2008) and the strong baroclinic instability (Wang et al., 2020a), the slope intrusion mesoscale eddies are active in the northern SCS (Wang et al., 2019; Su et al., 2020). The undercurrent appears to be intermittent rather than constant phenomenon during the mooring period in deep winter of 2006-2007, which is likely modulated by mesoscale eddies that intruding into the area.
The SLA data depict that both cold and warm eddies intruded into the continental slope during the mooring period (Figures 11A–D). In late December, the Luzon cold eddy significantly deviated from the west side of Luzon Island, and its core extended laterally and approached the continental slope of the northwestern SCS (Figure 11A). Then a low SLA pattern was formed on the northwest side of this cold eddy which probably led to the disappearance of sea level set-up during the first half of the mooring period in deep winter. This cold eddy retreated in the middle of January, while the warm eddy remained over the continental slope throughout January.
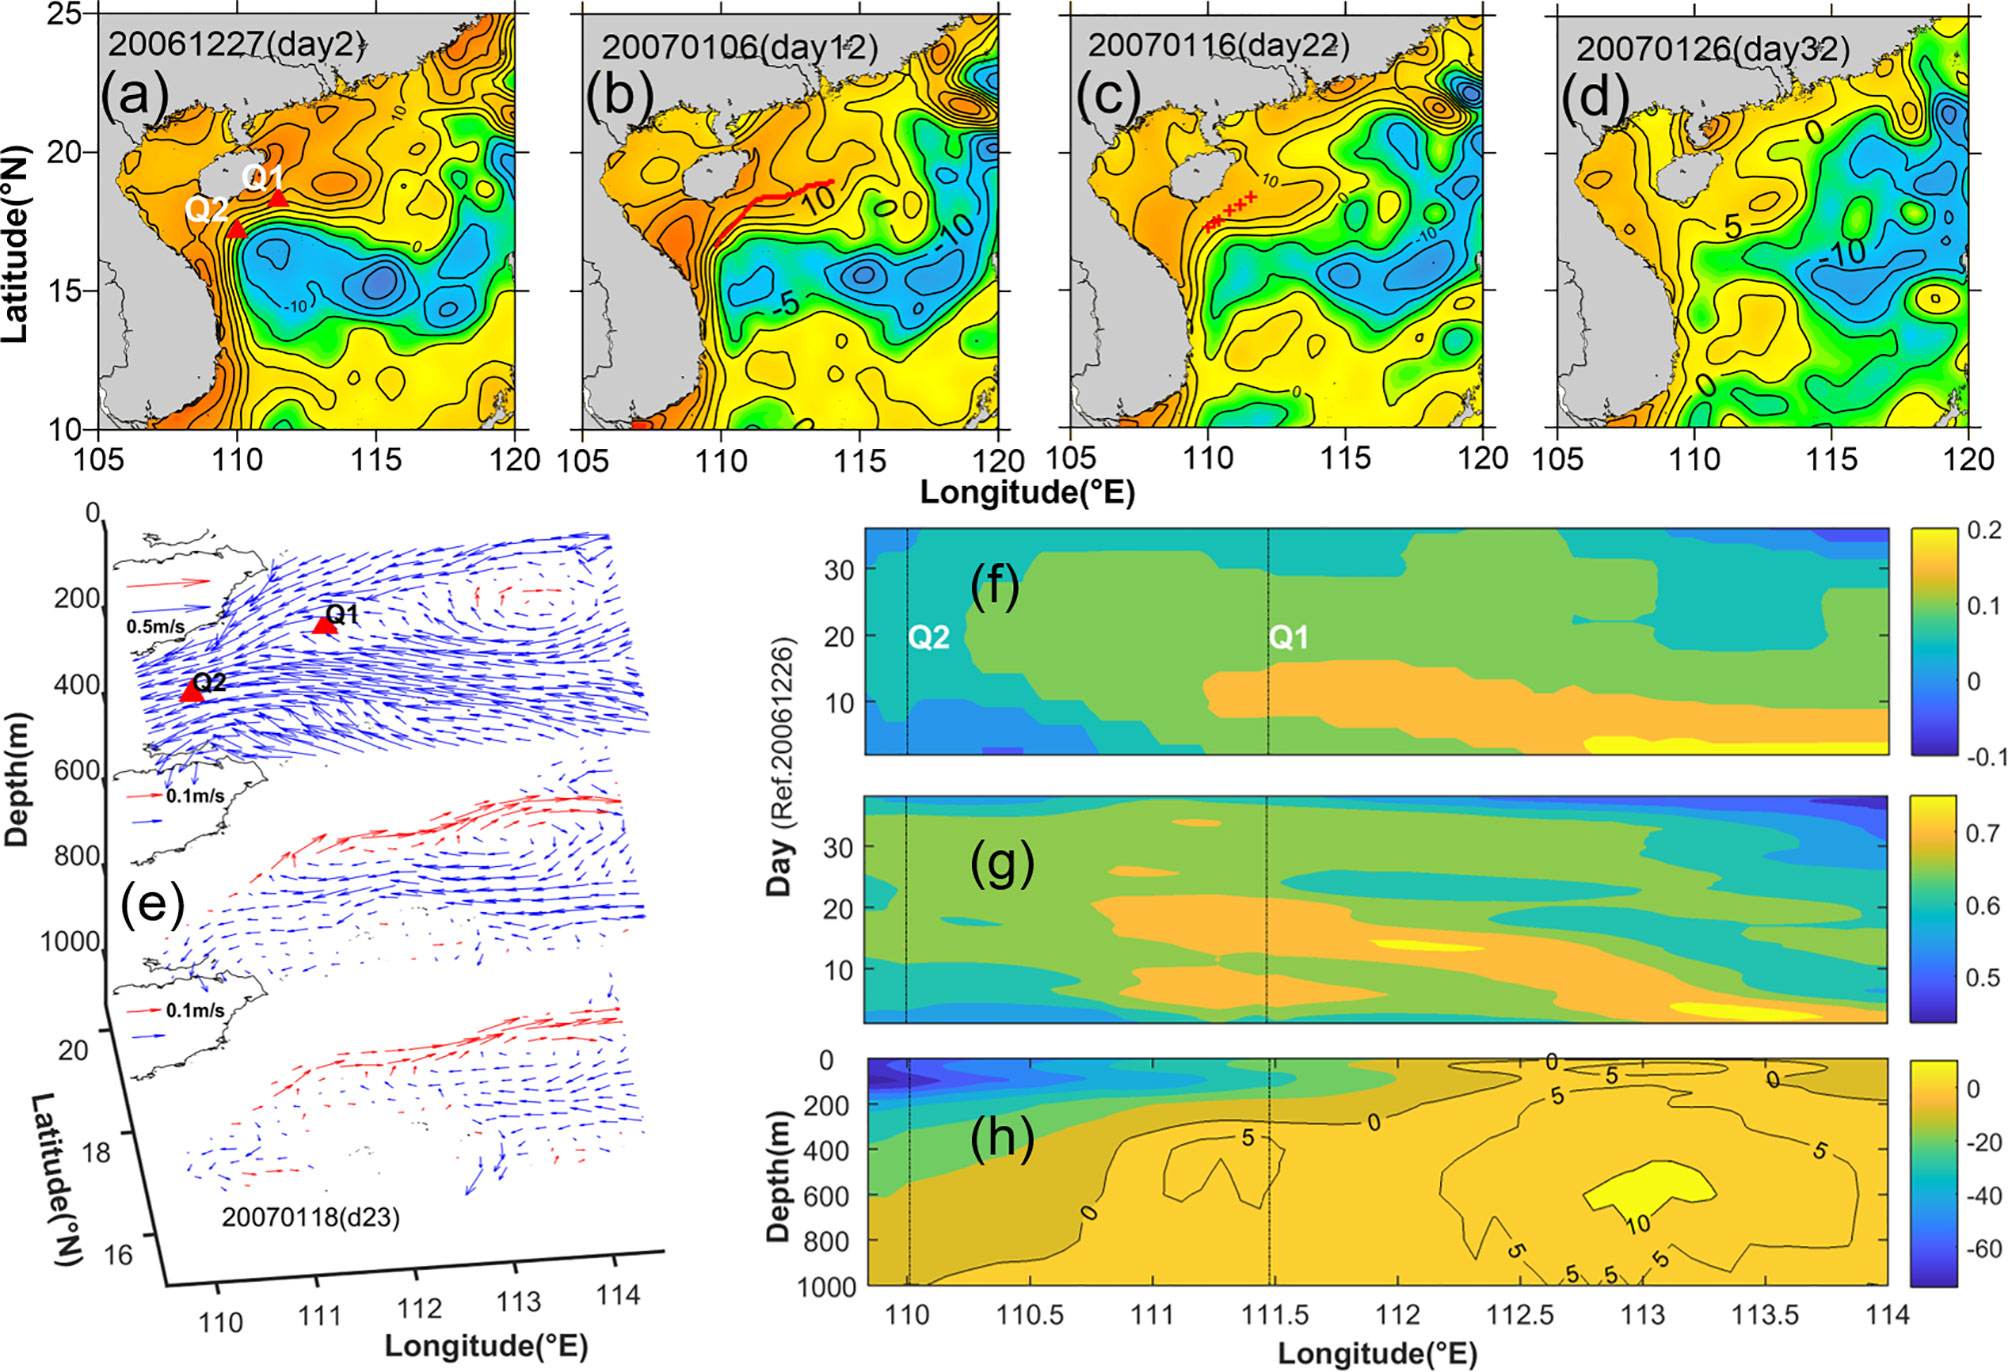
Figure 11 (A–D) The sea level anomaly (cm) from altimetry observed with 10-days interval from day 2 to day 32. The red triangles in (A), red line in (B) and red crosses in (C) denote the mooring stations, the 1000-m isobath and the CTD stations, respectively. (E) HYCOM-output 3D velocity field within the 1000-m depth; the slope undercurrent was highlighted with red arrows. The spatiotemporal evolution of the observed sea level anomaly (F) and the simulated sea level (G) along the 1000-m isobath (F, G with unit: m); vertical axis starts at 26 December 2006 (Beijing Time, UTC+8). (H) The mean along-slope current (cm/s) simulated by HYCOM along the 1000-m isobath during the mooring period in deep winter of 2006-2007.
The HYCOM-output velocity field reveals that the anti-cyclonic circulation accompanied by the warm eddy interfered with the SCSwwbc and the undercurrent (Figure 11E). Moreover, as the warm eddy moves southwestward, the northeastward flow extended to the surface ocean and the undercurrent seemed to be strengthen (Figures 11F–H). Particularly, as the warm eddy went along the slope, an along-slope density gradient was observed at undercurrent depths, which would also induce a baroclinic component of the APG (Figure 6D). Specifically, the field hydrological observations indicate the occurrence of a local raise in isopycnal along the slope, with a maximum upward displacement found at sigma-t values of approximately 26.3–26.5 kg m-3 between stations Q1 and Q2 (Figure 6D). Consequently, an along-slope density gradient was resulted in, which further led to a poleward pressure-gradient force, a likely cause responsible for the strengthening of the undercurrent observed at stations Q1 and Q2 during day 19 and day 22 (Figures 3A, B).
As discussed above, the APG, associated with the sea level set-up off the continental slope of south Hainan Island, is the possible forcing of the slope undercurrent. We further found that the APG may be affected by Rossby waves transiting from the east. Figure 12 depicts the along-track SLA which is averaged within 0.3 latitude beyond 300 m isobath of the northern continental slope of SCS for the years from 2005 to 2014. It can be seen that around each autumn, a high sea level signal appears in the northeast of the SCS which spreads westward; moreover, it mostly reaches our study area in the January of the following year and forms an APG along the slope. Our preliminary analysis shows that its group velocity is about 12 cm/s, which is consistent with the propagation characteristics of the annual Rossby wave forced by the wind stress curl in the northern SCS (Lin et al., 2016). It is worth noting that the undercurrent appears to reach its maximum in January; nevertheless, whether it is directly related to the transit of this wave process shall be further studied.
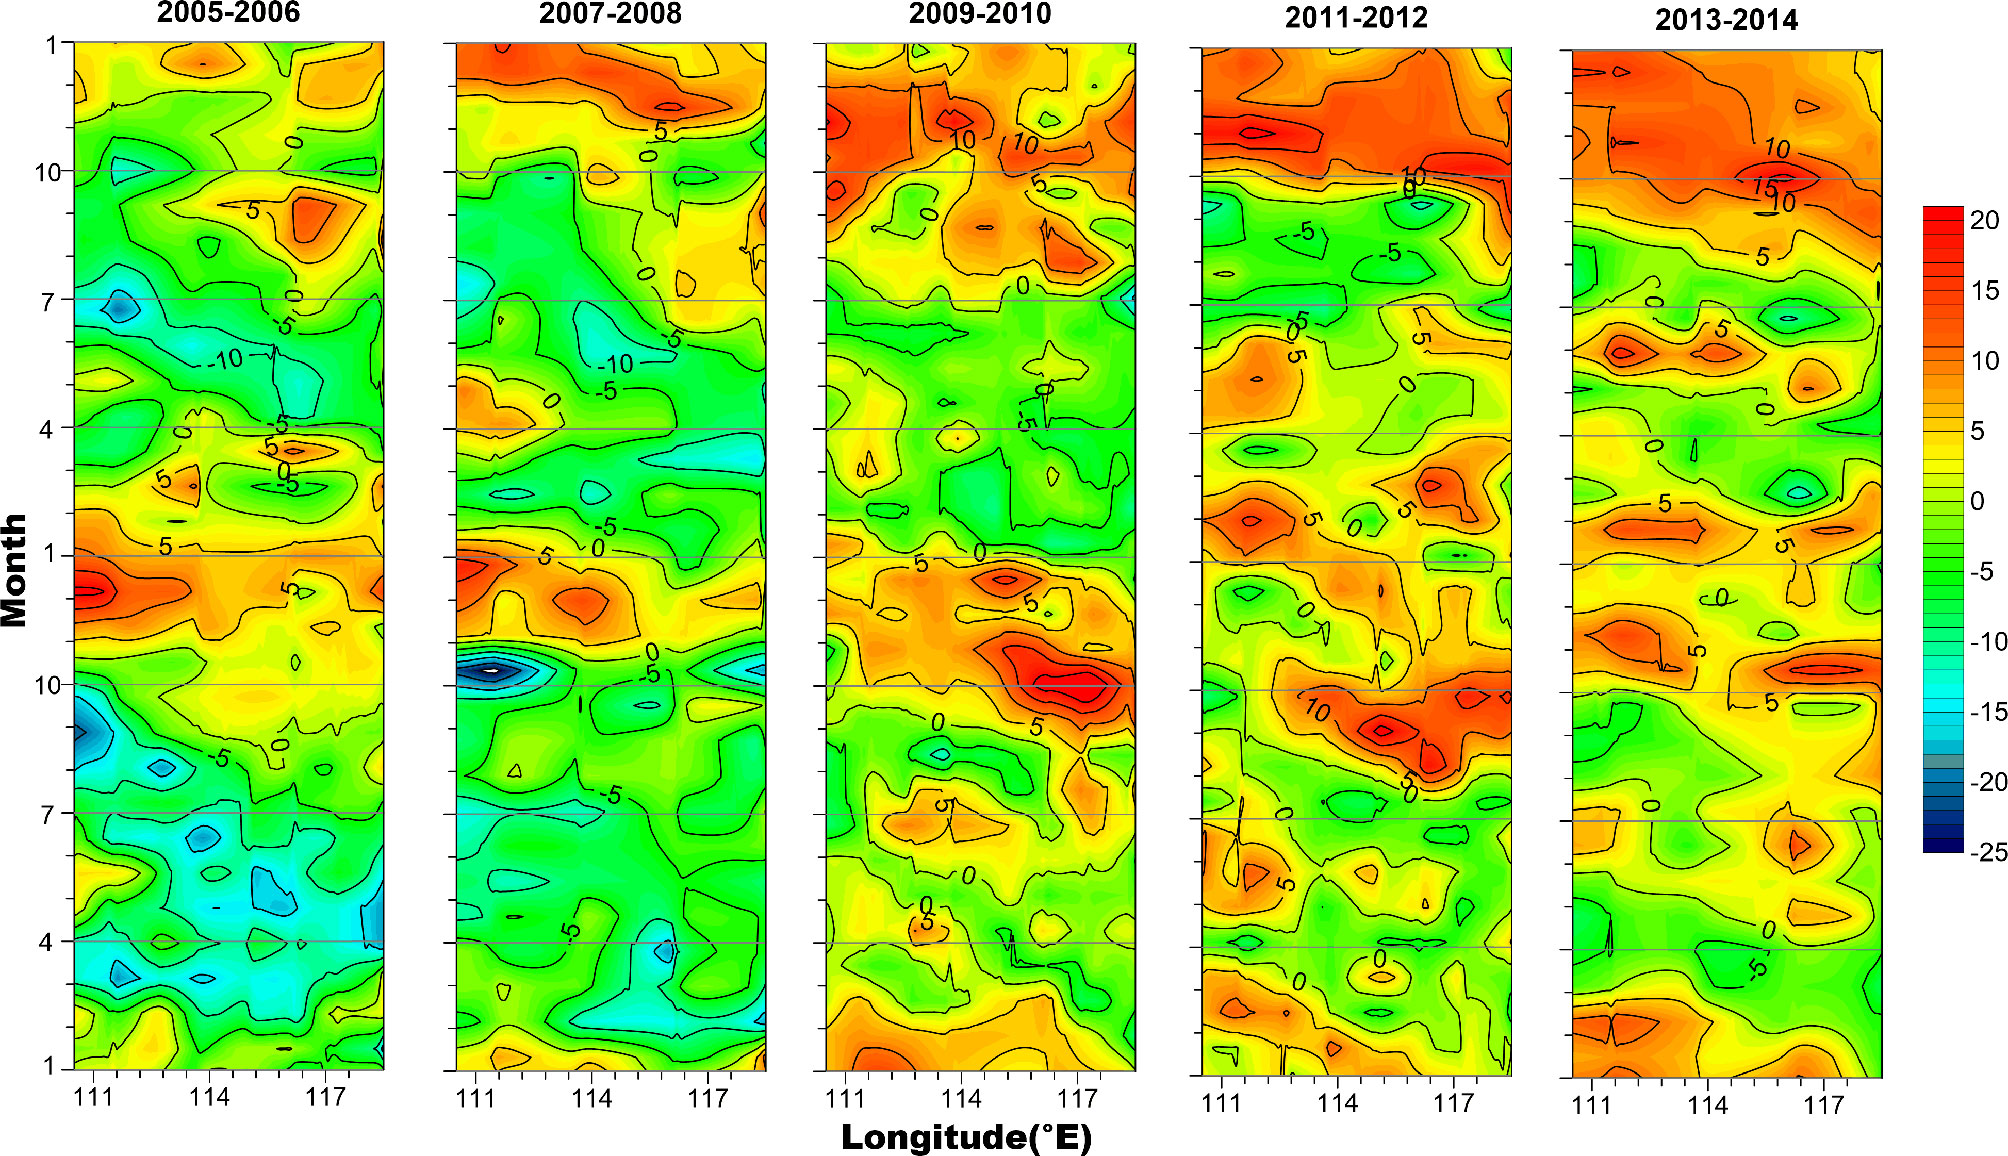
Figure 12 The time/longitude distribution of the mean sea level anomaly (unit in cm, averaged within 0.3 latitude beyond 300 m isobath) on the slope of the northern SCS in the years from 2005 to 2014, derived from satellite along-track data.
Contrast to the South China Sea Warm Current
There are significant differences between the slope undercurrent and the South China Sea Warm Current (SCSWC) (Guan and Fang, 2006; Chiang et al., 2008). The observed undercurrent in this study is a component of the slope circulation while the SCSWC appears at the continental shelf off northern Dongsha Island. A typical feature of the SCSWC is the counterwind property because it can reach the sea surface; in contrast, the slope undercurrent is mainly distributed below the SCSwwbc. The latest studies (e.g., Yu et al., 2021) indicated that the SCSWC is a synoptic phenomenon but not a persistent flow and is only caused by wind relaxation. Based on the climatological pattern of the subsurface velocity from the HYCOM output, the undercurrent might be a seasonal persistent current although longer-period in situ observations is needed to further verify its persistence.
Conclusion
An episodic slope undercurrent beneath the SCSwwbc, appearing above the upper slope with a velocity core exceeding 20 cm/s at a depth of approximately 300 m, was observed in the northwestern SCS in deep winter of 2006-2007. Moreover, along-track ADCP measurements suggest that the undercurrent can extend beyond a depth of 800 m, with a width of 30–50 km and an along-slope length of approximately 200 km. Other in situ observations, such as the current measurements from ADCP and the trajectory of ARGO buoy, also indicate that this undercurrent has significant variability from interseasonal to interannual time scale.
Our finding is further supported by the HYCOM result. This study indicates that the northeastward undercurrent in most of the upper slope region is probably ageostrophic. Moreover, it shows that this current flowed northeastward along the slope which lied in the downstream of a significant sea-level set-up off the continental slope of south Hainan Island; and the associated along-slope SLG provides the barotropic component of the APG which probably acts as the key forcing. In addition, we also found that the undercurrent could be modulated by mesoscale eddies and Rossby wave; particularly, when the warm eddy transit, this undercurrent would be strengthened.
Nevertheless, owing to the short-term observations, our knowledge of this undercurrent is still fragmental. More details need to be explored by long-term current measurements. Furthermore, its forcing mechanism remains unknown, which will be investigated by the momentum balance diagnostic framework in the follow-up work.
Data Availability Statement
The raw data supporting the conclusions of this article will be made available by the authors, without undue reservation.
Author Contributions
Conceptualization: SJQ, FWD, LL; numericl computation and analysis: SJQ, XZ, ZJP resources: GXG; funding acquisition: SJQ,FWD and QY; writing: SJQ, FWD and LL led the writing with intellectual contributions from all coauthors.
Funding
This work is supported by the Scientific Research Foundation of Third Institute of Oceanography, Ministry of Natural Resources (2022013 and 2019018); the Natural Science Foundation of Fujian Province (2019J01119); the National Natural Science Foundation of China (42130404, 41776014, 42130406 and 41506014); the Southern Marine Science and Engineering Guangdong Laboratory (Guangzhou) (GML2019ZD0304); and the National Key Research and Development Program of China (2016YFC1402607).
Conflict of Interest
The authors declare that the research was conducted in the absence of any commercial or financial relationships that could be construed as a potential conflict of interest.
Publisher’s Note
All claims expressed in this article are solely those of the authors and do not necessarily represent those of their affiliated organizations, or those of the publisher, the editors and the reviewers. Any product that may be evaluated in this article, or claim that may be made by its manufacturer, is not guaranteed or endorsed by the publisher.
Acknowledgments
We would like to thank the officers and crew of the mooring cruises and the research vessel managers for their support. We thank Mr. Yu Yang for providing the data of daytime-anchored station Q3.
References
Alessi C.A., Beardsley R.C., Limeburner R., Rosenfeld L. K., Lentz S. J., Send U., Winant C. D., Allen J. S., et al. (1985). “CODE-2: Moored Array and Large-Scale Data Report,” in Woods Hole Oceanographic Institution. WHOI85-35.234.
Cai Z., Gan J. (2020). Dynamics of the Cross-Layer Exchange for the Layered Circulation in the South China Sea. J. Geophysical Research: Oceans. 125, e2020JC016131. doi: 10.1029/2020JC016131
Centurioni L. R., Niiler P. N., Lee D. K. (2004). Observations of Inflow of Philippine Sea Surface Water Into the South China Sea Through the Luzon Strait. J. Phys. Oceanography 34 (1), 113–121. doi: 10.1175/1520-0485(2004)034<0113:OOIOPS>2.0.CO;2
Centurioni L. R., Niiler P. N., Lee D. K. (2009). Near-Surface Circulation in the South China Sea During the Winter Monsoon. Geophysical Res. Lett. 36 (6), L06605. doi: 10.1029/2008GL037076
Chen D., Lian E., Shu Y., Yang S., Li Y., Li C., et al. (2020). Origin of the Springtime South China Sea Warm Current in the Southwestern Taiwan Strait: Evidence From Seawater Oxygen Isotope. Sci. China Earth Sci. 63, 1564–1576. doi: 10.1007/s11430-019-9642-8
Chiang T. L., Wu C. R., Chao S. Y. (2008). Physical and Geographical Origins of the South China Sea Warm Current. J. Geophysical Res. Oceans 113, 328–340. doi: 10.1029/2008JC004794
Church J. A., Boland F. M. (1983). A Permanent Undercurrent Adjacent to the Great Barrier Reef. J. Phys. Oceanography 13 (9), 1747–1747. doi: 10.1175/1520-0485(1983)013<1747:APUATT>2.0.CO;2
Connolly T. P., Hickey B. M., Shulman I., Thomson R. E. (2014) Coastal Trapped Waves, Alongshore Pressure Gradients, and the California Undercurrent. J. Phys. Oceanography 44 (1), 319–342. doi: 10.1175/JPO-D-13-095.1
Cummings J. A., Smedstad O. M. (2013). “Variational Data Assimilation for the Global Ocean,” in Data Assimilation for Atmospheric, Oceanic and Hydrologic Applications, Vol. II. (Berlin, Heidelberg: Springer), 303–343.
Dahl F. E. (1978). On the Existence of a Deep Countercurrent to the Norwegian Coastal Current in Skagerrak. Tellus 30, 552–556. doi: 10.3402/tellusa.v30i6.10401
Ducet N., Traon P. Y., Reverdin G. (2000). Global High Resolution Mapping of Ocean Circulation From TOPEX/Poseidon and ERS-1 and -2. J. Geophysical Res. 105 19, 477–498. doi: 10.1029/2000JC900063
Fang W., Guo P., Liu C., Fang G., Li S. (2015). Observed Sub-Inertial Current Variability and Volume Transport Over the Continental Shelf in the Northern South China Sea. Estuar. Coast. Shelf Sci. Vol. 157. 19–31.
Fang G. H., Wang G., Fang Y., Fang W. D. (2012). A Review on the South China Sea Western Boundary Current. Acta Oceanologica Sin. 31 (5), 1–10. doi: 10.1007/s13131-012-0231-y
Gan J. P., Liu Z. Q., Hui C. R. (2016). A Three-Layer Alternating Spinning Circulation in the South China Sea. J. Phys. Oceanography 46 (8), 2309–2315. doi: 10.1175/jpo-d-16-0044.1
Guan B. X., Fang G. H. (2006). Winter Counter-Wind Currents Off the Southeastern China Coast: A Review. J. Oceanography 62, 1–24. doi: 10.1007/s10872-006-0028-8
Li L., Guo X., Wu R. (2018). The Winter Western Boundary Current of the South China Sea: Physical Structure and Volume Transport in December 1998. Acta Oceanologica Sin. 37 (3), 1–7. doi: 10.1007/s13131-018-1195-3
Li L., Nowlin W. D., Su J. (1998). Anticyclonic Rings From the Kuroshio in the South China Sea. Deep Sea Res. Part I 45 (9), 1469–1482. doi: 10.1016/S0967-0637(98)00026-0
Li L., Wu R. S., Guo X. G. (2000). Seasonal Circulation in the South China Sea—A TOPEX/Poseidon Satellite Altimetry Study. Acta Oceanologica Sin. (in Chinese) 22 (6), 13–26.
Lin Y., Oey L., Wang J., Liu K. (2016). Rossby Waves and Eddies Observed at a Temperature Mooring in Northern South China Sea. J. Phys. Oceanography 46, 517–535. doi: 10.1175/JPO-D-15-0094.1
Qu T. D. (2000). Upper-Layer Circulation in the South China Sea. J. Phys. Oceanography 30, 1450–1460. doi: 10.1175/1520-0485(2000)030<1450:ULCITS>2.0.CO;2
Shu Y., Xue H., Wang D., Chai F., Xie Q., Yao J., et al (2014). Meridional Overturning Circulation in the South China Sea Envisioned From the High-Resolution Global Reanalysis Data Glba0.08. J. Geophysical Research: Oceans 119, 3012–3028. doi: 10.1002/2013JC009583
Shu Y., Xue H., Wang D., Xie Q., Chen J., Li J., et al. (2016). Observed Evidence of the Anomalous South China Sea Western Boundary Current During the Summers of 2010 and 2011. J. Geophysical Res. Oceans 121, 1145–1159. doi: 10.1002/2015JC011434
Su D., Lin P., Mao H., Wu J., Liu H., Cui Y., et al. (2020). Features of Slope Intrusion Mesoscale Eddies in the Northern South China Sea. J. Geophysical Research: Oceans 125, e2019JC015349. doi: 10.1029/2019JC015349
Thompson O. R. Y. (1984). Observations of the Leeuwin Current Off Western Australia. J. Phys. Oceanography 14 (12), 623–628. doi: 10.1175/1520-0485(1984)014<0623:OOTLCO>2.0.CO;2
Wang G., Chen D., Su J. (2008). Winter Eddy Genesis in the Eastern South China Sea Due to Orographic Wind Jets. J. Phys. Oceanography 38, 726–732. doi: 10.1175/2007JPO3868.1
Wang X., Fang W., Chen R. (2019). Intra-Seasonal Variability of Sea Level Anomalies and Their Propagation Features in the Northern South China Sea From 25 Years of Satellite Altimetry Data. J. Trop. Oceanography (in Chinese) 38 (3), 1–12. doi: 10.11978/2018086
Wang D. X., Liu Q. Y., Xie Q., He Z., Zhuang W., Shu Y., et al. (2013). Progress of Regional Oceanography Study Associated With Western Boundary Current in the South China Sea. Chin. Sci. Bull. 58, 1205–1215. doi: 10.1007/s11434-012-5663-4
Wang Q., Zeng L., Chen J., He Y., Zhou W., Wang D. (2020a). The Linkage of Kuroshio Intrusion and Mesoscale Eddy Variability in the Northern South China Sea: Subsurface Speed Maximun. Geophysical Res. Lett. 46, e2020GL087034. doi: 10.1029/2020GL087034
Wang Q., Zeng L., Shu Y., Liu Q., Zu T., Li J., et al. (2020b). Interannual Variability of South China Sea Winter Circulation: Response to Luzon Strait Transport and El Niño Wind. Climate Dynamics. 54 (1), 1145–1159. doi: 10.1007/s00382-019-05050-2
Wei Z. X., Fang G. H., Xu T. F., Wang Y. G., Lian Z. (2016). Seasonal Variability of the Isopycnal Surface Circulation in the South China Sea Derived From a Variable-Grid Global Ocean Circulation Model. Acta Oceanologica Sin. 35 (1), 11–20. doi: 10.1007/s13131-016-0791-3
Wyrtki K. (1961). “Physical Oceanography of the Southeast Asian Waters,” in NAGA Report 2 (San Diego: Scripps Institute of Oceanography, University of California).
Xie J., Zhu J., Bertino L., Counillon F. (2015). Analysis of the Northern South China Sea Counter-Wind Current in Winter Using a Data Assimilation Model. Ocean Dynamic 65, 523–538. doi: 10.1007/s10236-015-0817-y
Yuan D. L. (2002). A Numerical Study of the South China Sea Deep Circulation and its Relation to the Luzon Strait Transport. Acta Oceanologica Sinica. 21 (2), 187–202.
Yu Z. T., Metzger E., Fan Y. L. (2021). Generation Mechanism of the Counter-Wind South China Sea Warm Current in Winter. Ocean Model. 167, 101875. doi: 10.1016/j.ocemod.2021.101875
Zhao R., Zhu X.-H. (2016). Weakest Winter South China Sea Western Boundary Current Caused by the 2015– 2016 El Nino Event. J. Geophysical Res. Oceans 121, 7673–7682. doi: 10.1002/2016JC012252
Keywords: slope undercurrent, South China Sea, mesoscale eddies, Western boundary current, along-slope pressure gradient, Rossby waves
Citation: Shen J, Fang W, Li L, Qiu Y, Xiao Z, Zhang J and Guo X (2022) Slope Undercurrent in the Northwestern South China Sea Beneath the Winter Western Boundary Current. Front. Mar. Sci. 9:918077. doi: 10.3389/fmars.2022.918077
Received: 12 April 2022; Accepted: 30 May 2022;
Published: 07 July 2022.
Edited by:
Zhiqiang Liu, Southern University of Science and Technology, ChinaReviewed by:
Xiaohui Liu, Ministry of Natural Resources, ChinaLingling Xie, Guangdong Ocean University, China
Copyright © 2022 Shen, Fang, Li, Qiu, Xiao, Zhang and Guo. This is an open-access article distributed under the terms of the Creative Commons Attribution License (CC BY). The use, distribution or reproduction in other forums is permitted, provided the original author(s) and the copyright owner(s) are credited and that the original publication in this journal is cited, in accordance with accepted academic practice. No use, distribution or reproduction is permitted which does not comply with these terms.
*Correspondence: Wendong Fang, d2RmYW5nQHNjc2lvLmFjLmNu; Li Li, bGlsaUB0aW8ub3JnLmNu
 Junqiang Shen
 Wendong Fang
 Li Li2*