 Igor V. Polyakov
 Kimmo Tikka
 Jari Haapala
 Matthew B. Alkire
 Pekka Alenius
 Harri Kuosa
- 1International Arctic Research Center and College of Natural Science and Mathematics, University of Alaska Fairbanks, Fairbanks, AK, United States
- 2Marine Research Unit, Finnish Meteorological Institute, Helsinki, Finland
- 3Polar Science Center, Applied Physics Lab and School of Oceanography, University of Washington, Seattle, WA, United States
- 4Marine Research Centre, Finnish Environment Institute, Helsinki, Finland
Glider observations conducted between 2016 and 2021 were combined with shipborne surveys from the 1950s through the 2010s to provide critically important information about changes in the Bothnian Sea. Particularly, we evaluated the rate of warming and freshening in several layers of the basin and showed that warming of 0.3°C/decade in the upper 25m was sufficient to explain ~40% of the oxygen depletion since the mid-1950s. This depletion was driven by limited saturation of the surface mixed layer (SML), caused by warming and a (related) weakening of the surface oxygen flux during spring blooms. Below the SML, the role of warming in oxygen depletion decreased to less than 30%, whereas the role of freshening became increasingly important via establishing stronger stratification that reduced local ventilation across the basin’s halocline. The observed values in this study are not critical for the ecological system of the Bothnian Sea. However, the presented trends towards oxygen depletion should be considered as an early warning sign as future projections of the oxygen levels in the Bothnian Sea suggest further severe losses of the dissolved oxygen in the next decades. Thus, enhancement of both observational networks and the current physical and biogeochemical models is a high priority if we are to mitigate the potential impact of oxygen loss and develop a reliable monitoring system of the Bothnian Sea.
Introduction
Oxygen depletion of bottom water masses has been a distinct feature of the Baltic Sea for a century, but areas of hypoxia have expanded over the last decades (Jokinen et al., 2018; Meier et al., 2019). Presently, hypoxic water masses occupying roughly 70,000 km2 (or 18.5%) of the Baltic Sea area are found below 100 meters depth in the central Baltic Sea (Conley et al., 2002; Conley et al., 2009; Carstensen et al., 2014; Kõuts et al., 2021). Primary reasons for hypoxic conditions include a strong haline stratification that effectively reduces vertical mixing and suppresses the oxygen flux from surface to deeper layers as well as a restricted inflow of oxygen-rich waters from the North Sea into the Baltic Sea (Kuliński et al., 2022). In fact, the recent expansion of hypoxia from the central Baltic to the Gulf of Finland (Kõuts et al., 2021) has been attributed to an increased eutrophication and reduction of major inflows from the North Sea to the Baltic Sea (Meier et al., 2018).
In contrast, the northern limb of the Baltic Sea, the Gulf of Bothnia, including the Bothnia Sea and the Bay of Bothnia (Figure 1), has not yet exhibited hypoxic conditions (Kuosa et al., 2017). Primary reasons for this reprieve include shallow sill depths between the Gulf of Bothnia and the Central Baltic that restrict advection of anoxic water masses into the northern basins, ventilation of deep water with more saline water from the Baltic Sea proper, relatively weak haline stratification, and lower nutrient loads from land to sea (reduced eutrophication potential).
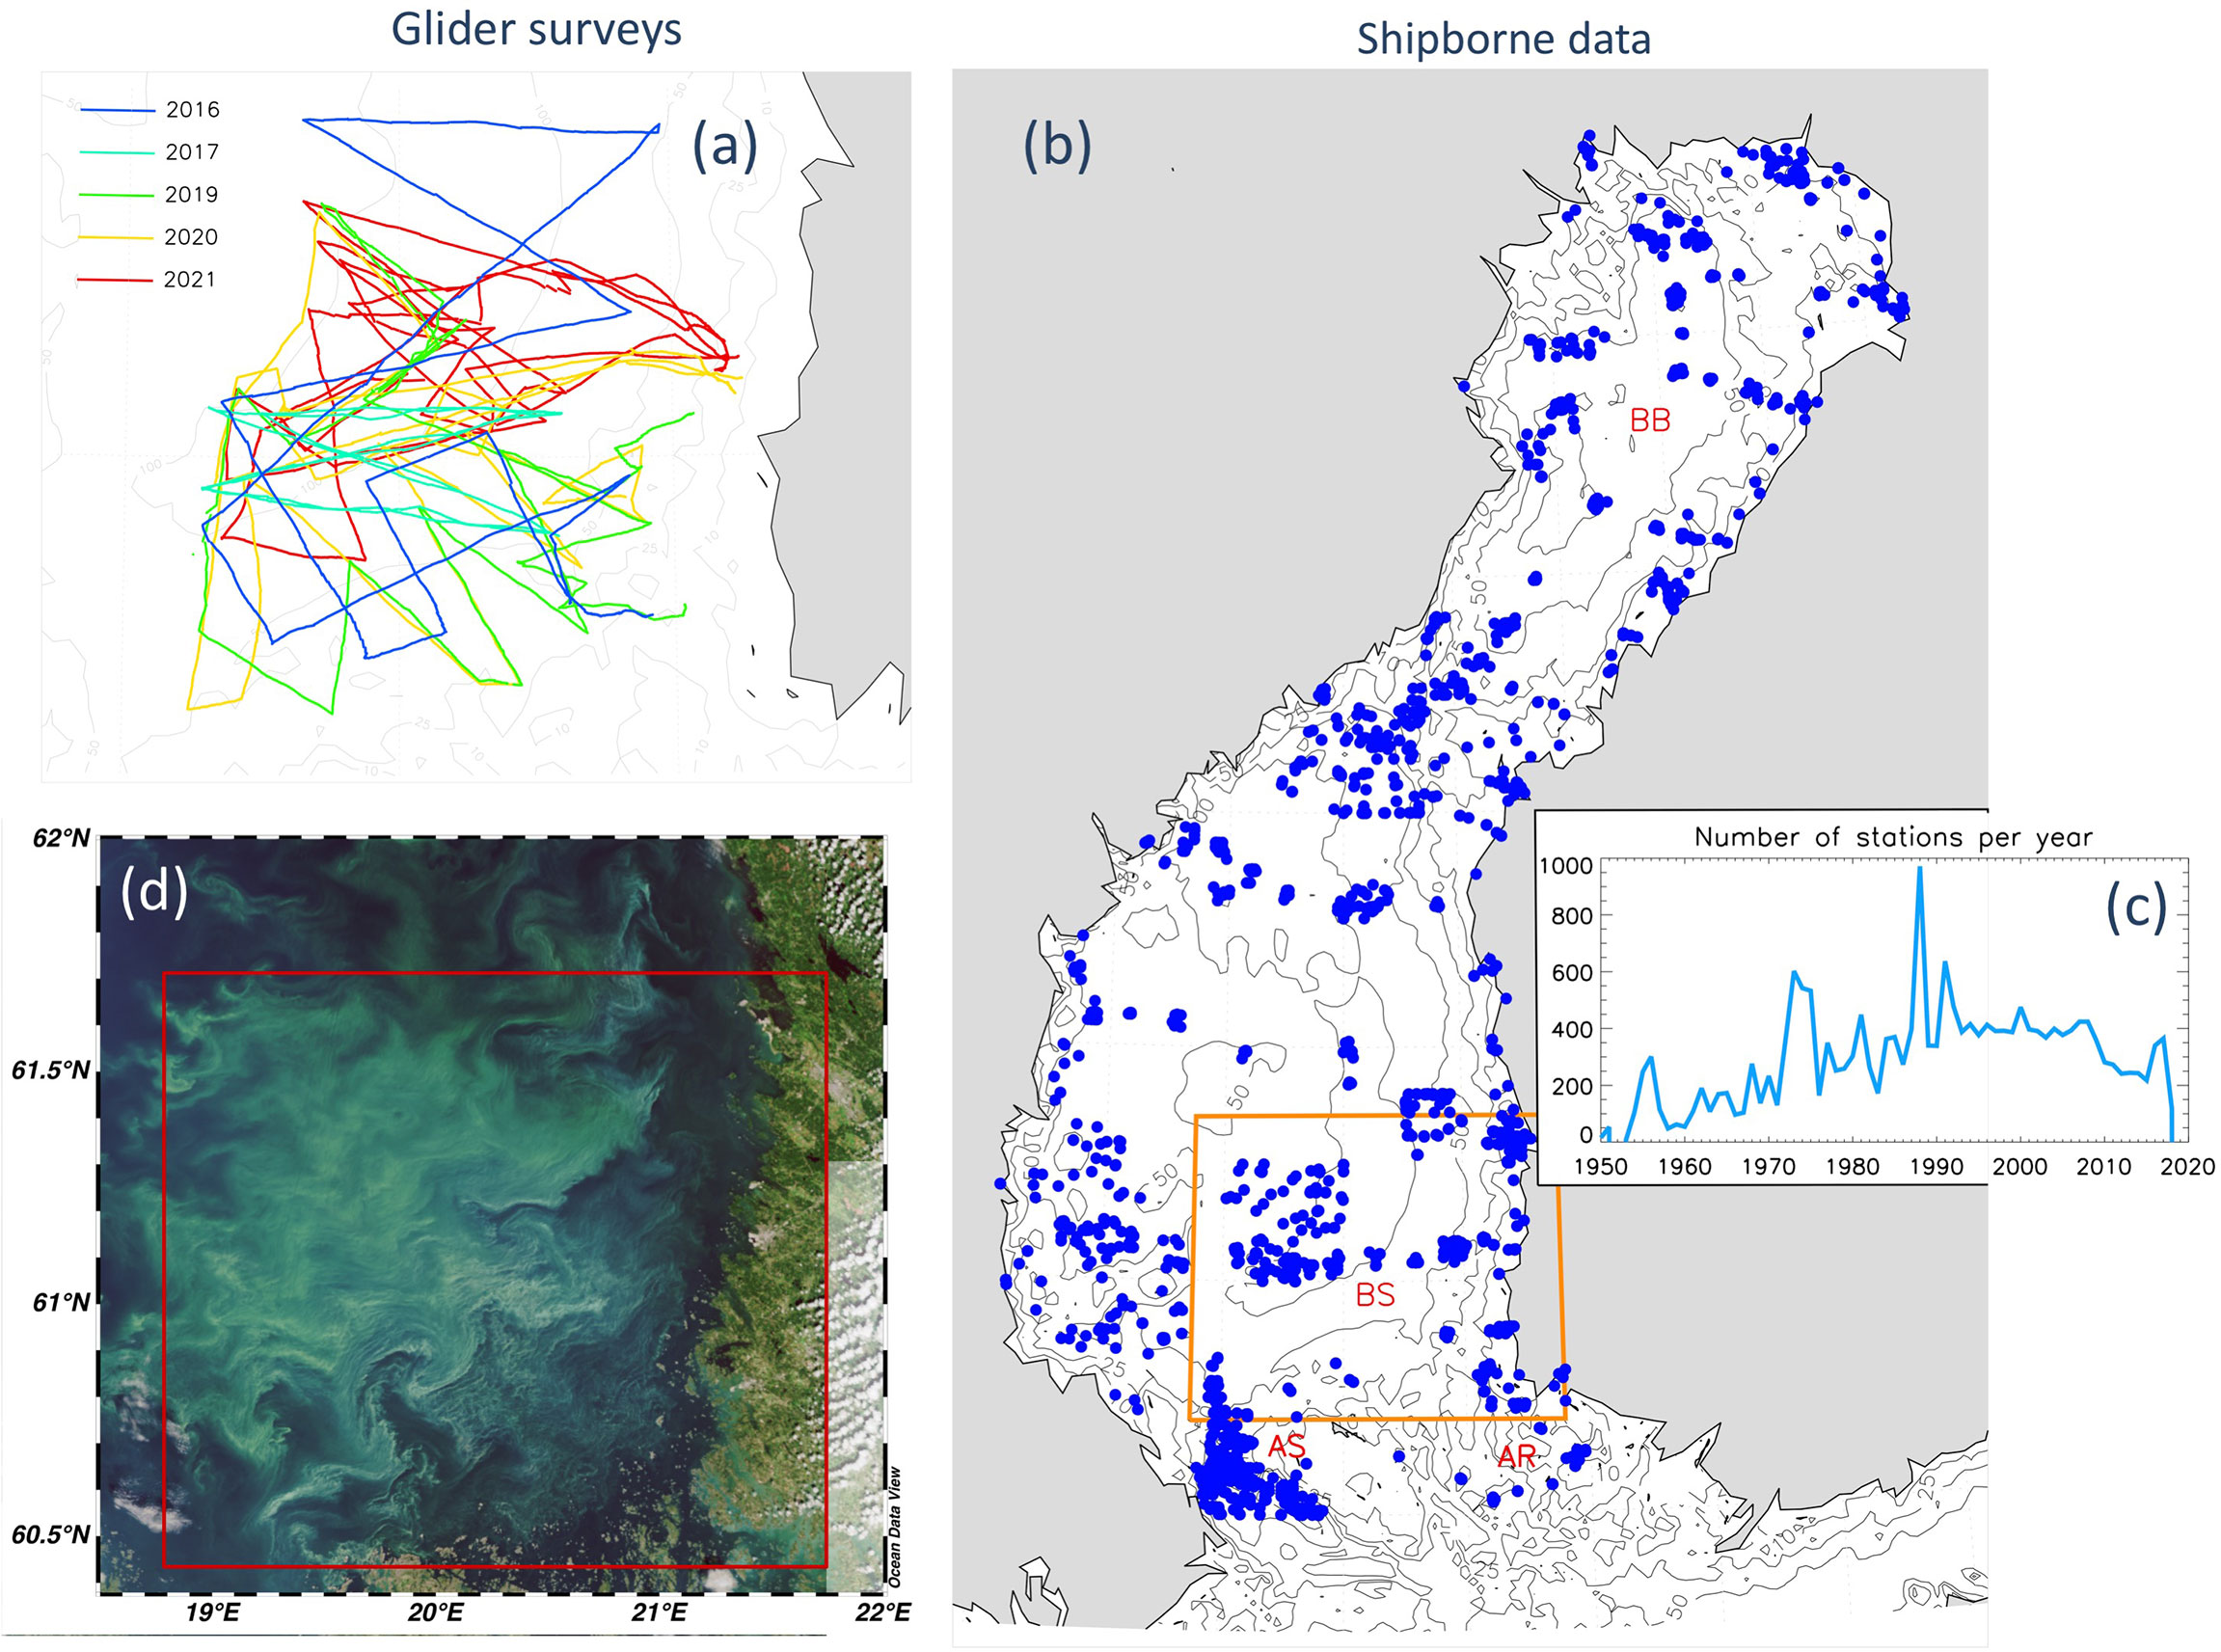
Figure 1 (A) Glider and (B, C) shipborne data used in this study and (D) summer bloom in the Bothnian Sea captured by satellite observations on August 7, 2020. (A) Glider survey trajectories in 2016, 2017, 2019, 2020 (two surveys), and 2021 (three surveys). (B, C) Spatiotemporal data coverage used to develop climatology of the Gulf of Bothnia. Orange box in (B) indicates the area with glider observations. The Bothnian Bay (BB), Bothnian Sea (BS), Åland Sea (AS) and Archipelago Sea (AR) are indicated in (B). (D) True color satellite image made on August 7th, 2020 from TARKKA service of Finnish Environment Institute (SYKE) containing modified Copernicus data (SYKE 2020). Red box indicates the area with glider observations.
However, the warming climate is gradually changing this situation. The Gulf of Bothnia is an area where the impact of climate change is well pronounced. The most apparent evidence for these ongoing changes is the rampant sea ice reduction: the annual maximum sea ice extent has decreased at a rate of –6,400 km2 per decade during the last 100 years (1921-2020) and the sea ice season has shrunk by ~6 days per decade over this same time period (Meier et al., 2022b). The most recent 30-year period (1991-2020) has exhibited the lowest sea ice extent since 1720 (Uotila et al., 2015; Meier et al., 2022a), with record low sea ice extent observed in 2020. The mean Baltic Sea surface temperature increased at a rate of 0.6°C/decade between 1990 and 2018; in the Bothnian Sea, the surface temperature trend was even steeper, reaching 0.6-0.7°C/decade and driven by seasonal sea ice loss (Siegel and Gerth, 2020). A new state of marine climate change was reached when, in summer 2018, a marine heat wave was recorded in all Baltic Sea sub-basins (Humborg et al., 2019; Rutgersson et al., 2022). This wave was associated with exceptionally high water temperatures; for example, the maximum Bothnian Sea surface temperature was a record-high 23 – 25°C (Siegel and Gerth, 2020). There are reasons to believe that these changes will continue (and even escalate) in the future. The projected state of the Baltic Sea for the 21 century suggests significant changes in oxygen conditions in the Gulf of Bothnia, driven by warming of the surface layers that reduces oxygen solubility capacity and by enhanced surface stratification that reduces the ventilation of deeper layers (Meier et al., 2022a).Despite substantial progress in documenting and explaining the current state of the Baltic Sea and its basins, there are still significant gaps in available observations and understanding of the causes of the observed changes. New technologies open exciting opportunities for expanding data coverage and developing new insights into the nature of regional climate changes. Our study utilizes these technological advances, making it very timely. Here, we combine newly available data collected by the glider missions (2016-2021) conducted in an area of the Bothnian Sea known for its active spring and summer blooms (Figure 1D) with historical, shipborne observations made across the Bothnian Sea since the mid-1950s to document and understand the recent changes in dissolved oxygen concentrations using corresponding hydrographic conditions.
Data and Method Description
Archive of Shipborne Data
Shipborne oceanographic data from the Baltic Sea are available since 1898 in the International Council for the Exploration of the Sea (ICES) data portals (https://www.ices.dk/data/data-portals/pages/default.aspx). In this study, we use Bothnian Sea observations collected, with a few exceptions, from 1950 to 2018 (Figures 1B, C). In the limited “glider” area (Figure 1B), the total number of available stations was 7128 (which constitutes 28% of the total number of stations shown). In this study, these data were used primarily to place changes in the Bothnian Sea detected by glider observations between 2016 and 2021 into a broader spatial and temporal context; however, the Bothnian Sea monthly climatology that has been produced is freely available to potential users.
The temperature, salinity, and oxygen observations prior to the late 1990s were made using Nansen bottles. The bottle data were collected from standard observational depths with additional near-bottom samples. Typical measurement errors are 0.01°C for temperature and 0.02 for titrated salinity. Since the late 1990s, temperature and salinity measurements were collected using SeaBird 911plus CTD (Conductivity-Temperature-Depth) instruments that provide good vertical resolution (1 m) and accuracy of temperature (0.001°C) and salinity (0.003 psu) measurements. Sensor-based measurements of dissolved oxygen began in 1999 using a Seabird SBE43 sensor. According to our estimate, the absolute difference between sensor-based oxygen concentrations and those derived from water samples (via Winkler titration) were 0.3 mL L-1.
Glider Data
The recent observational program was initiated by the Finnish Meteorological Institute (FMI) in the fall of 2016. The primary goal of the program was the utilization of gliders to target processes in the Bothnian Sea of the Gulf of Bothnia (the northernmost part of the Baltic Sea). The Finnish research vessel (RV) Aranda visits the Bothnian Sea regularly (3-4 times a year) with monitoring cruises; however, the network of CTD stations remains sparse, and the aim of the glider missions was to add a substantial number of measurements to this area. By 2021, eight missions were completed, including 178 days of glider operations covering an along-trajectory distance of 4000 km and the collection of 28,324 profiles. The missions covered both shallow and deep areas of the Bothnian Sea (Figures 1 and S4). The five autumnal missions of 2016-2021 lasted from three weeks to one month each. The spring mission of 2021 and summer missions of 2020 and 2021 were shorter, lasting two to three weeks.
The length of glider dives (segments with no surfacing) varied depending on the depth and number of yo’s programmed (one yo is a downcast - upcast pair). On average, each dive lasted 1.4 hours, with six yo’s covering ~1.7 km. The average turning depth below the surface was 4.6 m, and the average vertical speed of each dive was 0.16 m/s.The Slocum G2 glider ‘Uivelo’ was equipped with a pumped Glider Payload CTD (GPCTD), Aanderaa Oxygen Optode 4831, and a fluorometer. In 2016-2017, the glider was also equipped with a Wetlabs BBFL2S fluorometer. Since 2019, a new instrument array, comprising a new SeaBird pumped CTD and a SeaBird SeaOWL fluorometer, was installed. In 2018, the original optode was also changed to a similar Aanderaa optode during routine maintenance. The CTD and the oxygen optode provide observations with 0.5Hz frequency. For the BBFL2S and SeaOWL fluorometers, maximum observation frequencies are 0.25Hz and 1Hz, respectively. The oxygen optode has a response time of 25 sec, which may vary due to changing conditions. The time lag due to the sensor response time was corrected by minimizing the difference in the oxygen concentrations between the descent and ascent phases of each yo. Following lag corrections, calibration corrections were made (by comparison to bottle/Winkler measurements) and then measurements provided by each upcast and downcast profile were averaged into 1 dbar bins.
The original CTD, oxygen optode and fluorometer sensors were factory calibrated in 2015 (and there was no calibration at sea using shipborne calibration casts in 2016) and sensors of the newer instrument array (CTD and fluorometer) were factory calibrated before delivery in 2018. The replacement optode was calibrated in 2018 and recalibrated by the manufacturer in February 2021. For most of our missions, we deployed and recovered the glider with a small boat with no possibility of collecting reference casts with independently calibrated CTD or oxygen sensors. However, glider measurements were compared against shipborne data collected by RV Aranda during close passes; the ship’s instrument package included an SBE911plus CTD and a SeaBird SBE-43 oxygen sensor. During each cruise,Aranda’s oxygen sensors were compared to Winkler titration values of bottle water samples. Glider CTD measurements were always consistent. The oxygen optode measurements from the glider were consistent with those obtained from Aranda in 2019 and 2020 but showed biased concentrations in 2017 and 2021 (ca. 1.5 mL L-1). Similar biases were reported in Drucker and Riser (2016). Due to these biased concentrations, we applied phase-domain recalculation of all glider data. For this procedure, we used phase values (tcphase) and temperature measurements collected by the optode, factory-supplied calibration coefficients, and Volterra-Stern-Uchida functions (Thierry et al., 2021). With these corrections, the error associated with the resulting oxygen data was estimated to be 0.12 mL L-1 (Figure 2). Further extensive comparisons of glider and shipborne observations are made available in the Supplementary Materials (e.g., Figure S7).
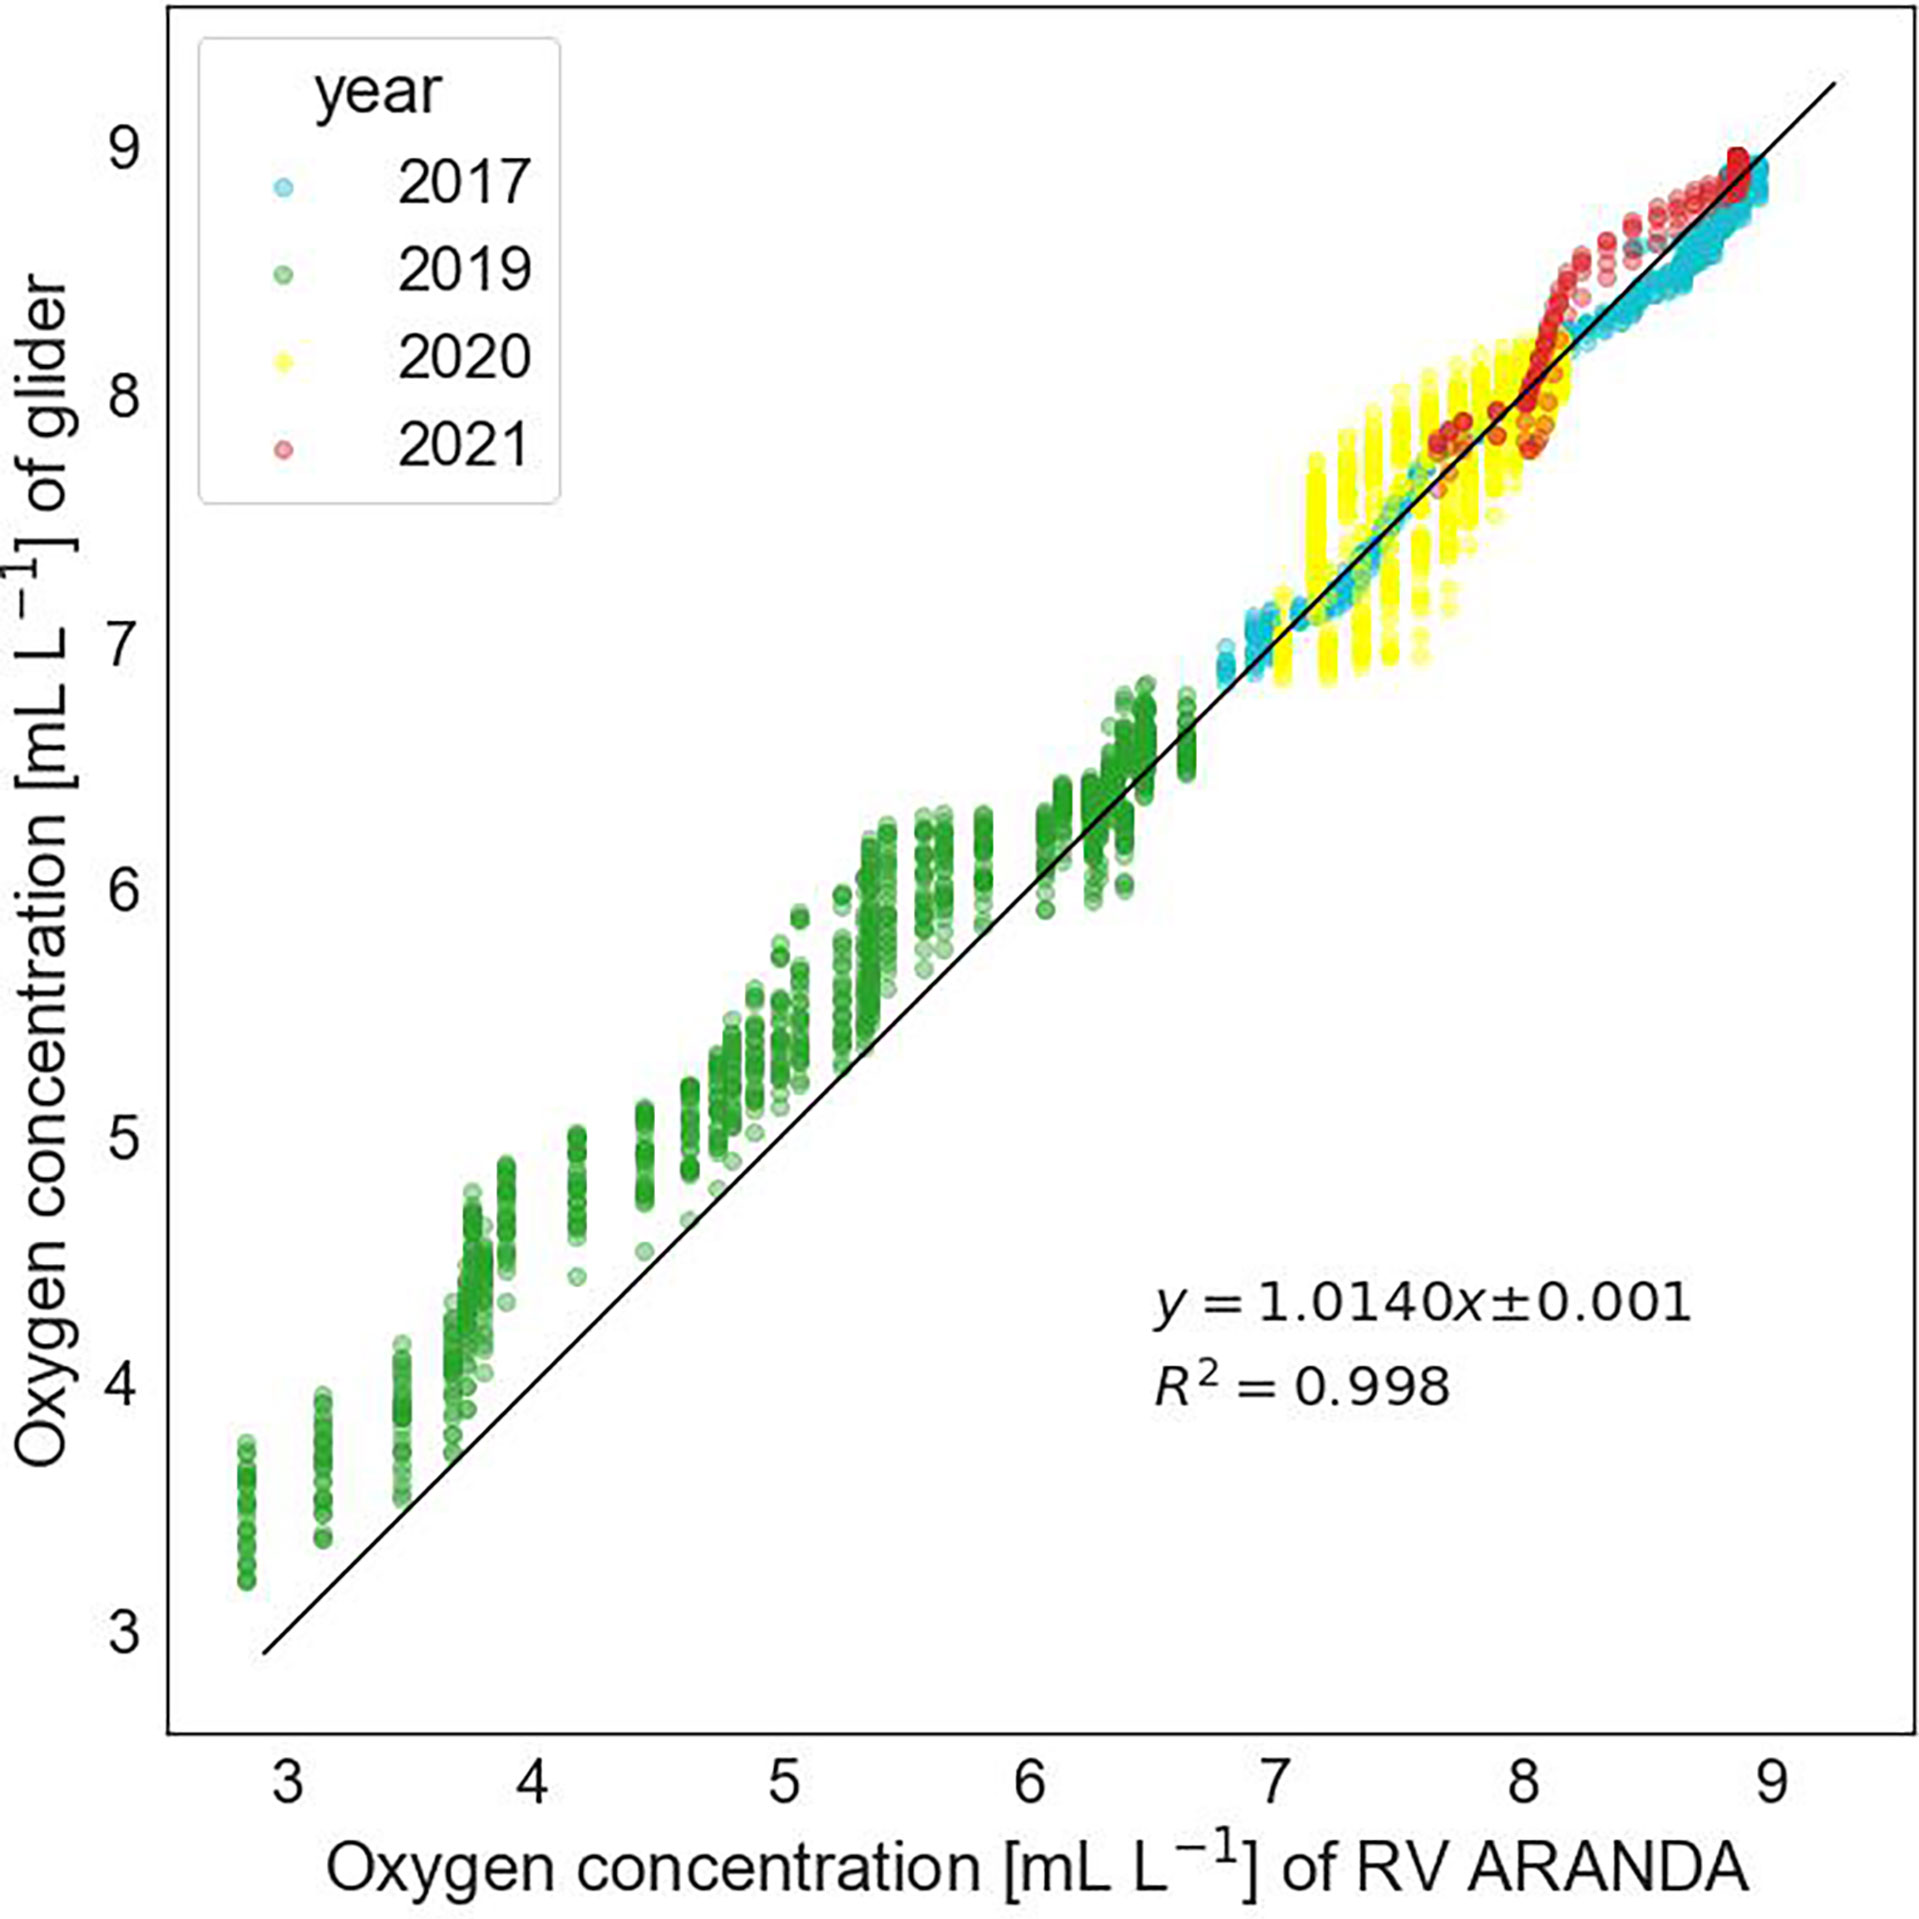
Figure 2 Linear regression between glider and RV Aranda dissolved oxygen from simultaneous profiles. Comparisons were made at 59.78N and 20.11E (Åland Sea/Lågskär Deep) in 2017, at 59.53N and 23.28E (Gulf of Finland, explaining low O2 concentrations) in 2019, at 61.08N and 19.58E (Bothnian Sea) in 2020, and at 60.03N and 20.16E (Bothnian Sea) in 2021. The regression equation adequately describes each year intercalibration indicating good quality of glider oxygen observations.
Climatology
Regional Gulf of Bothnia climatologies were composed from water temperature, salinity, and dissolved oxygen measurements collected over the 1950–2018 period (Figure 1B) to place the recent (2016-2021) glider observations in longer-term climatological context. The data were linearly interpolated onto a grid with 0.1° (latitude) × 0.2° (longitude) horizontal steps and 21 vertical levels with 5m resolution in the upper 30m and 10m resolution in the deeper part of the water column. To compose monthly climatologies, all available data for each specific month found within a 50km search radius of each grid point were linearly interpolated while taking into account the distance between the grid and data points; this radius was selected after several experiments using different search radii. Though a 50km radius is relatively small, it provides sufficient spatial smoothing to eliminate noise in the climatological fields and is of a similar size to the 30’x1° (latitude x longitude) search box used by Haapala and Alenius (1994) to calculate 1961-1990 temperature and salinity statistics for selected open sea stations around Finland. They chose their radius after extensive sensitivity experiments. Results are shown in Figures 3–10 and S1–S3.
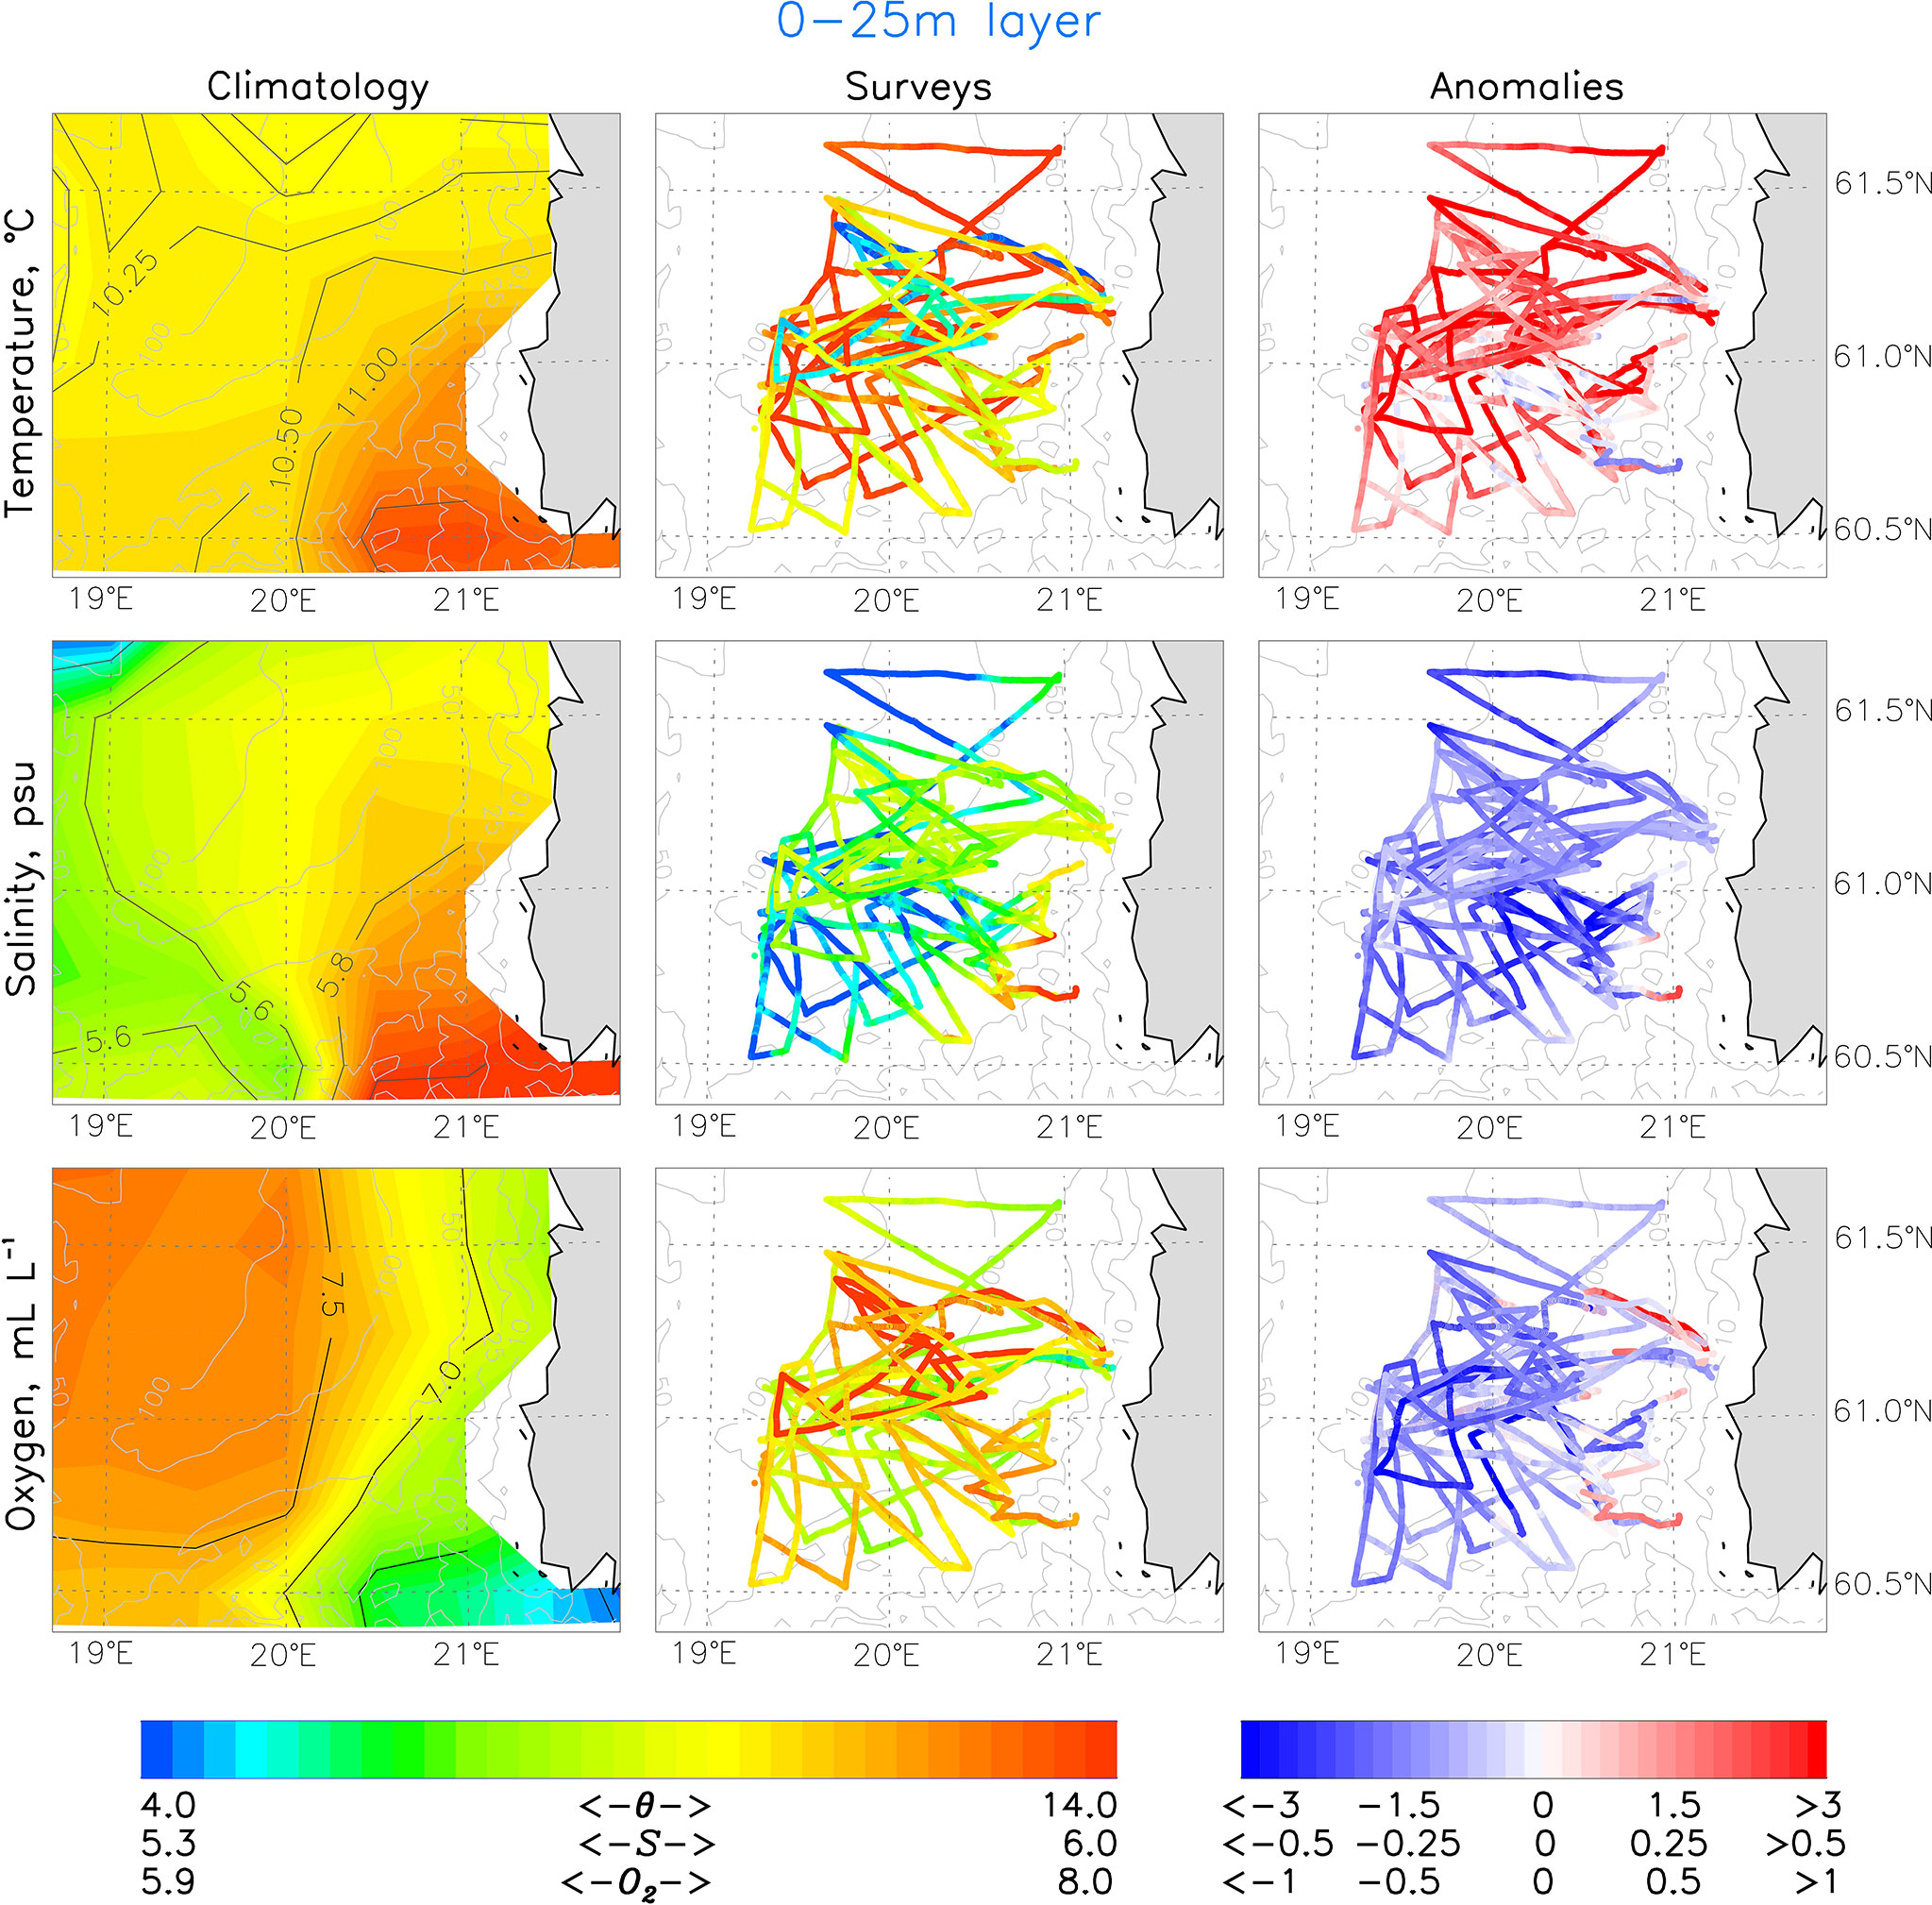
Figure 3 Maps of 0-25m mean water temperature, salinity and dissolved oxygen from (left) July-October climatology, (middle) glider observations, and (right) anomalies computed as differences between glider observations minus climatology taken for the month corresponding to each individual glider observation.
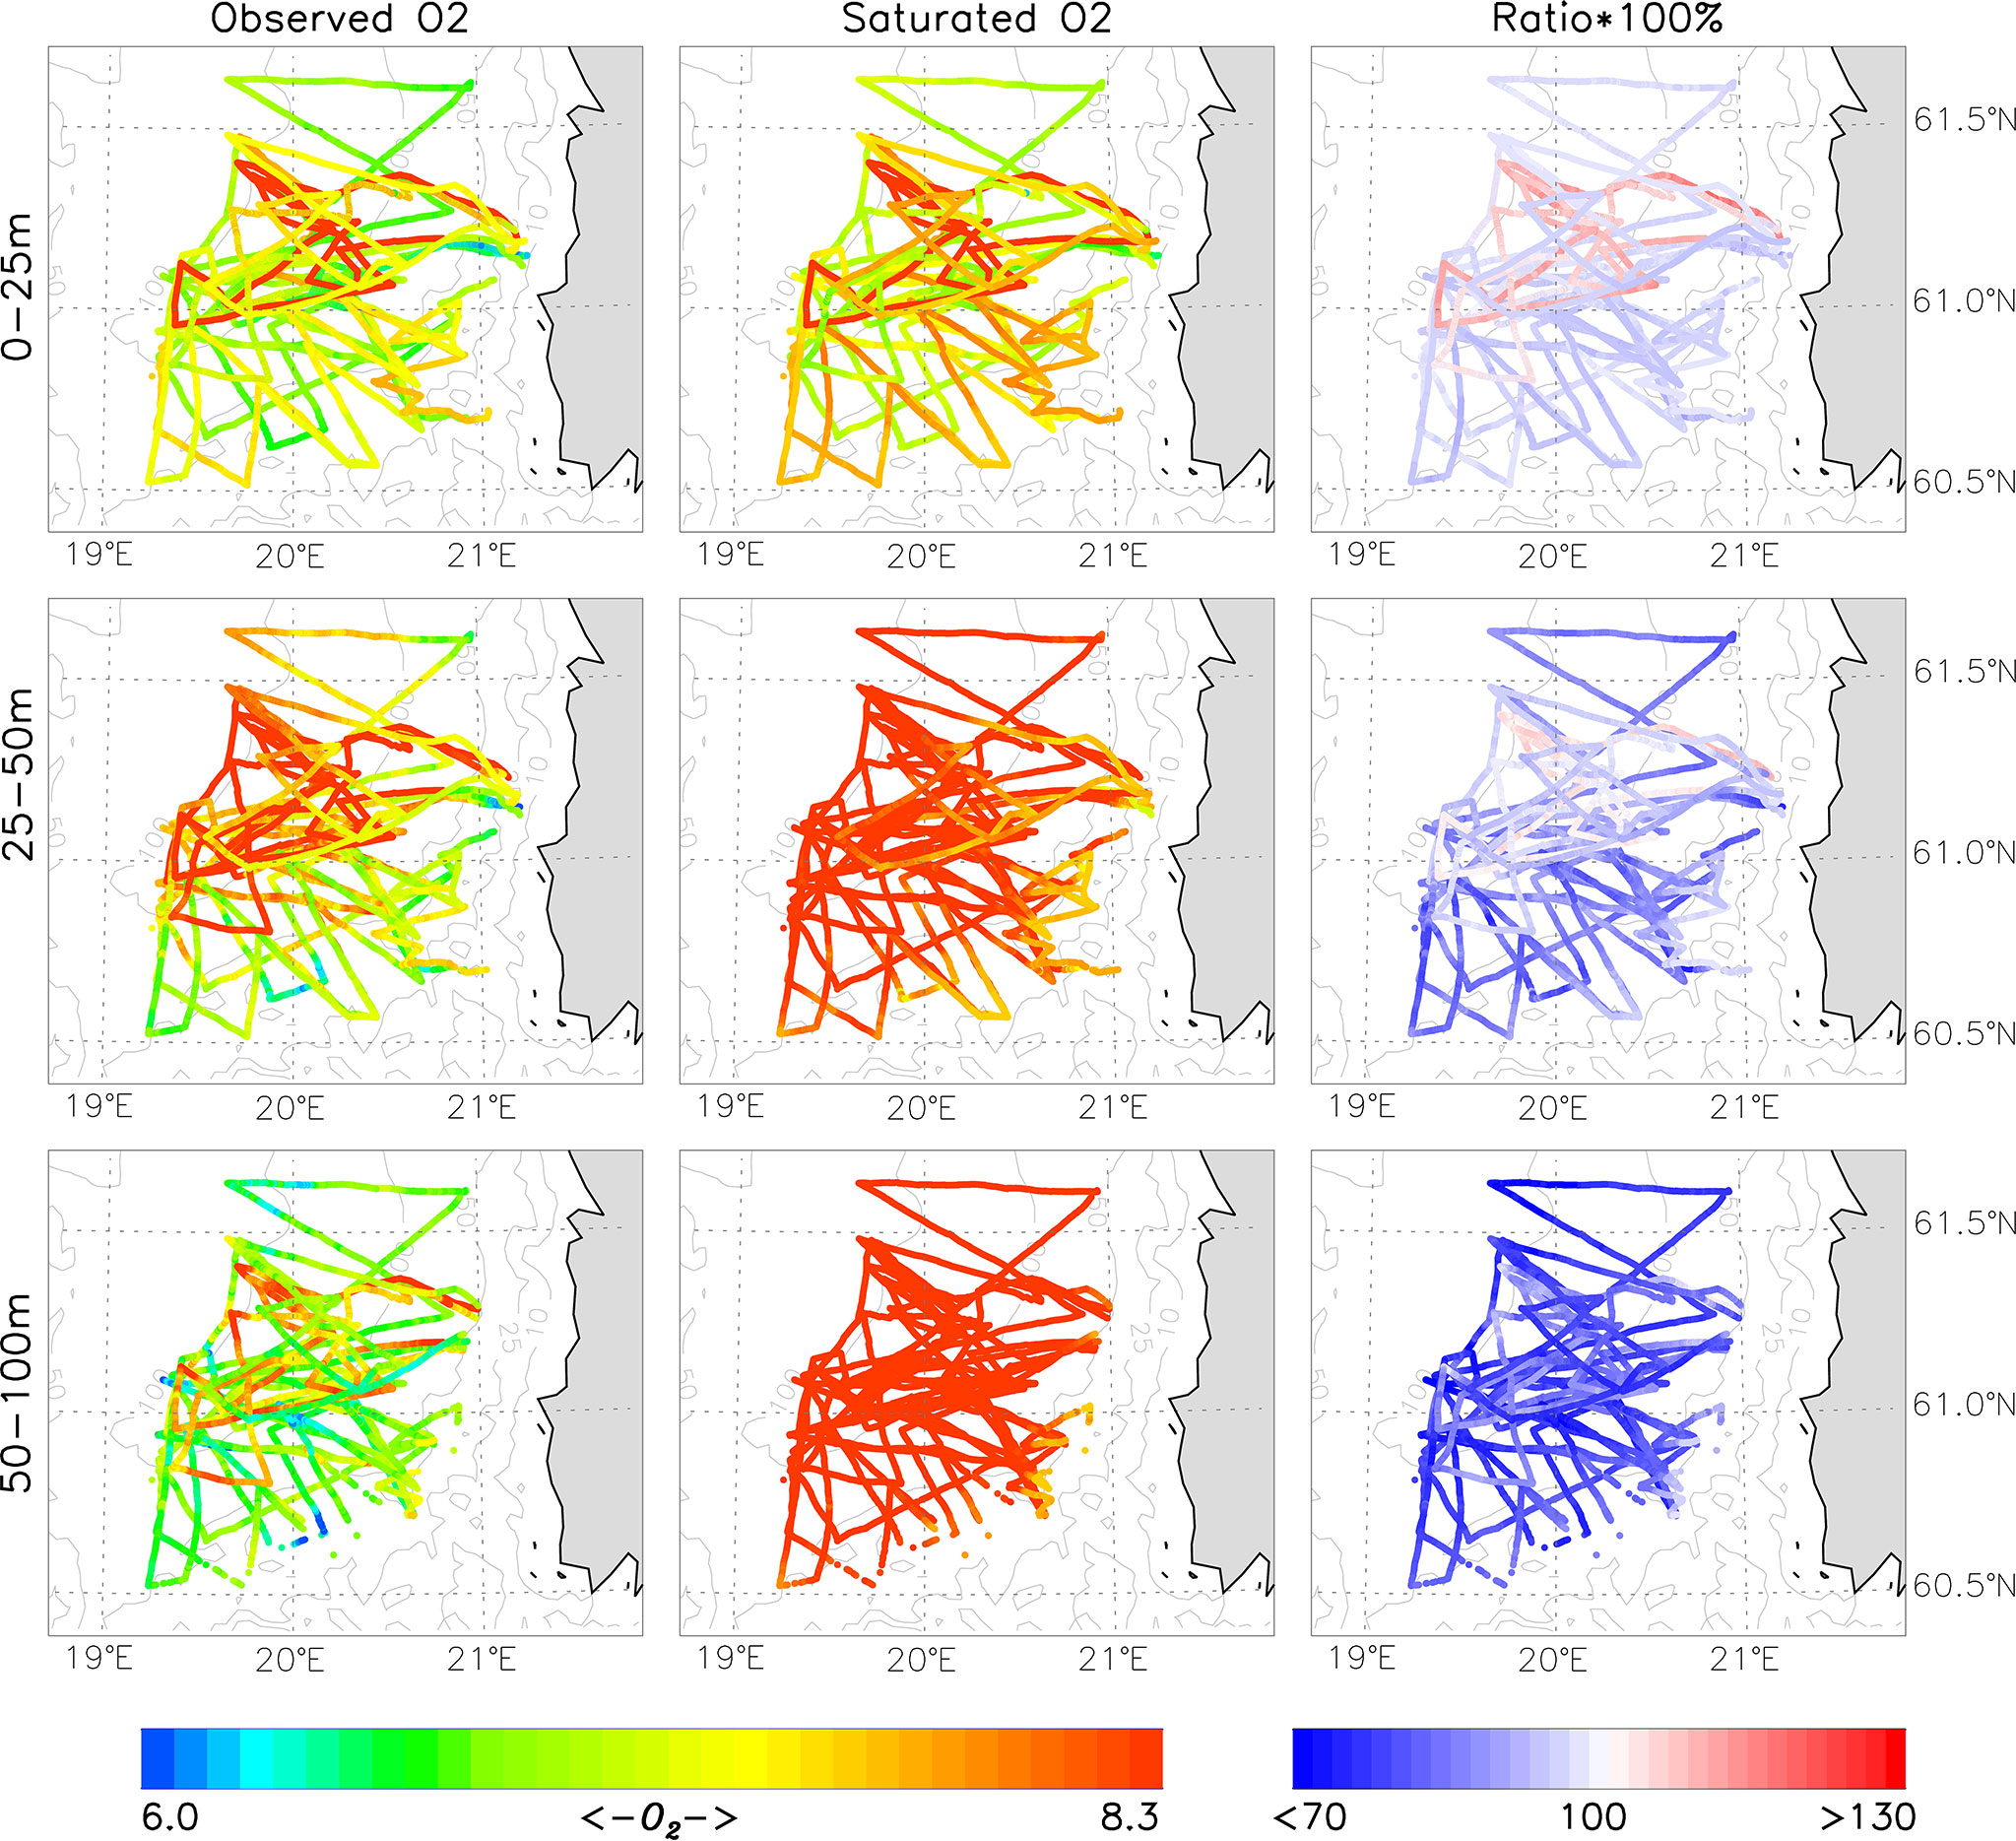
Figure 4 Observed oxygen concentrations (mL L-1, left), expected oxygen saturation (mL L-1, middle), and observed percent oxygen saturation [(observed O2 concentration)/(expected O2 saturation)*100%] from 2016-2021 glider surveys in the Bothnian Sea.
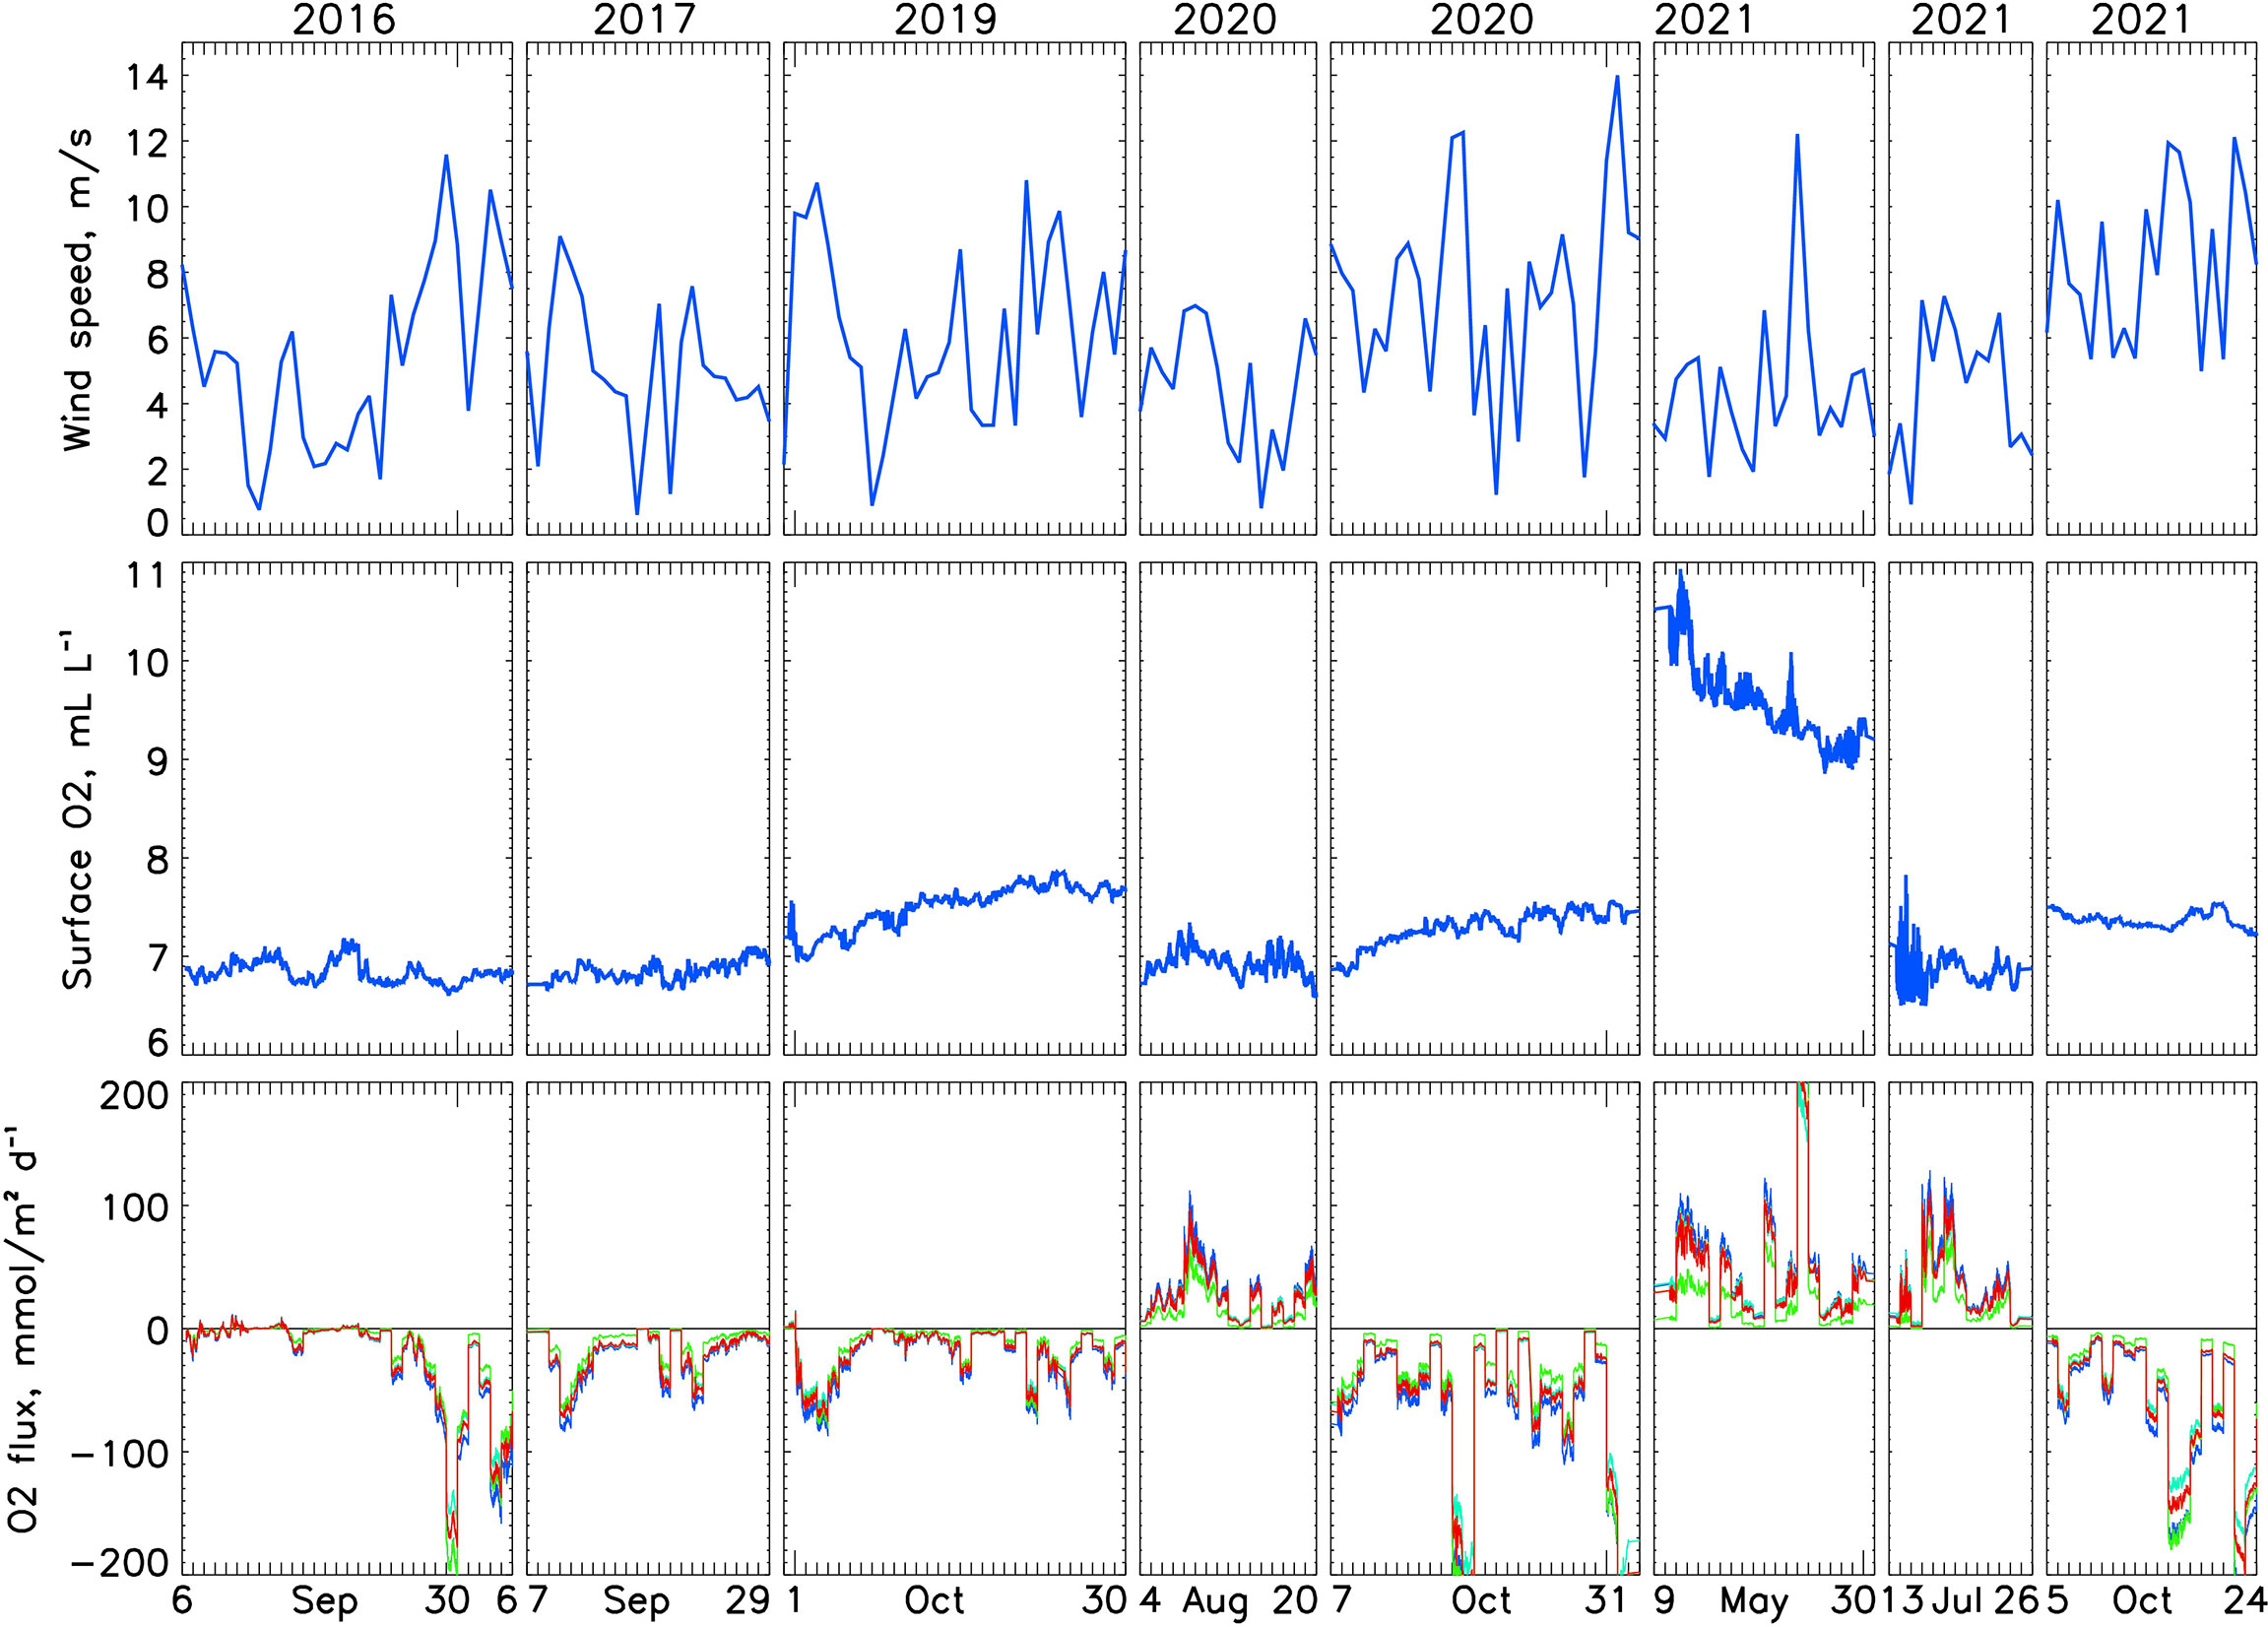
Figure 5 Time series of (top) daily wind speed from ERA5 reanalysis, (middle) oxygen concentrations at 5m measured during eight glider surveys, and (bottom) estimated surface O2 fluxes FASE computed using five wind-based parameterizations for gas transfer velocity explained in Section 3e.
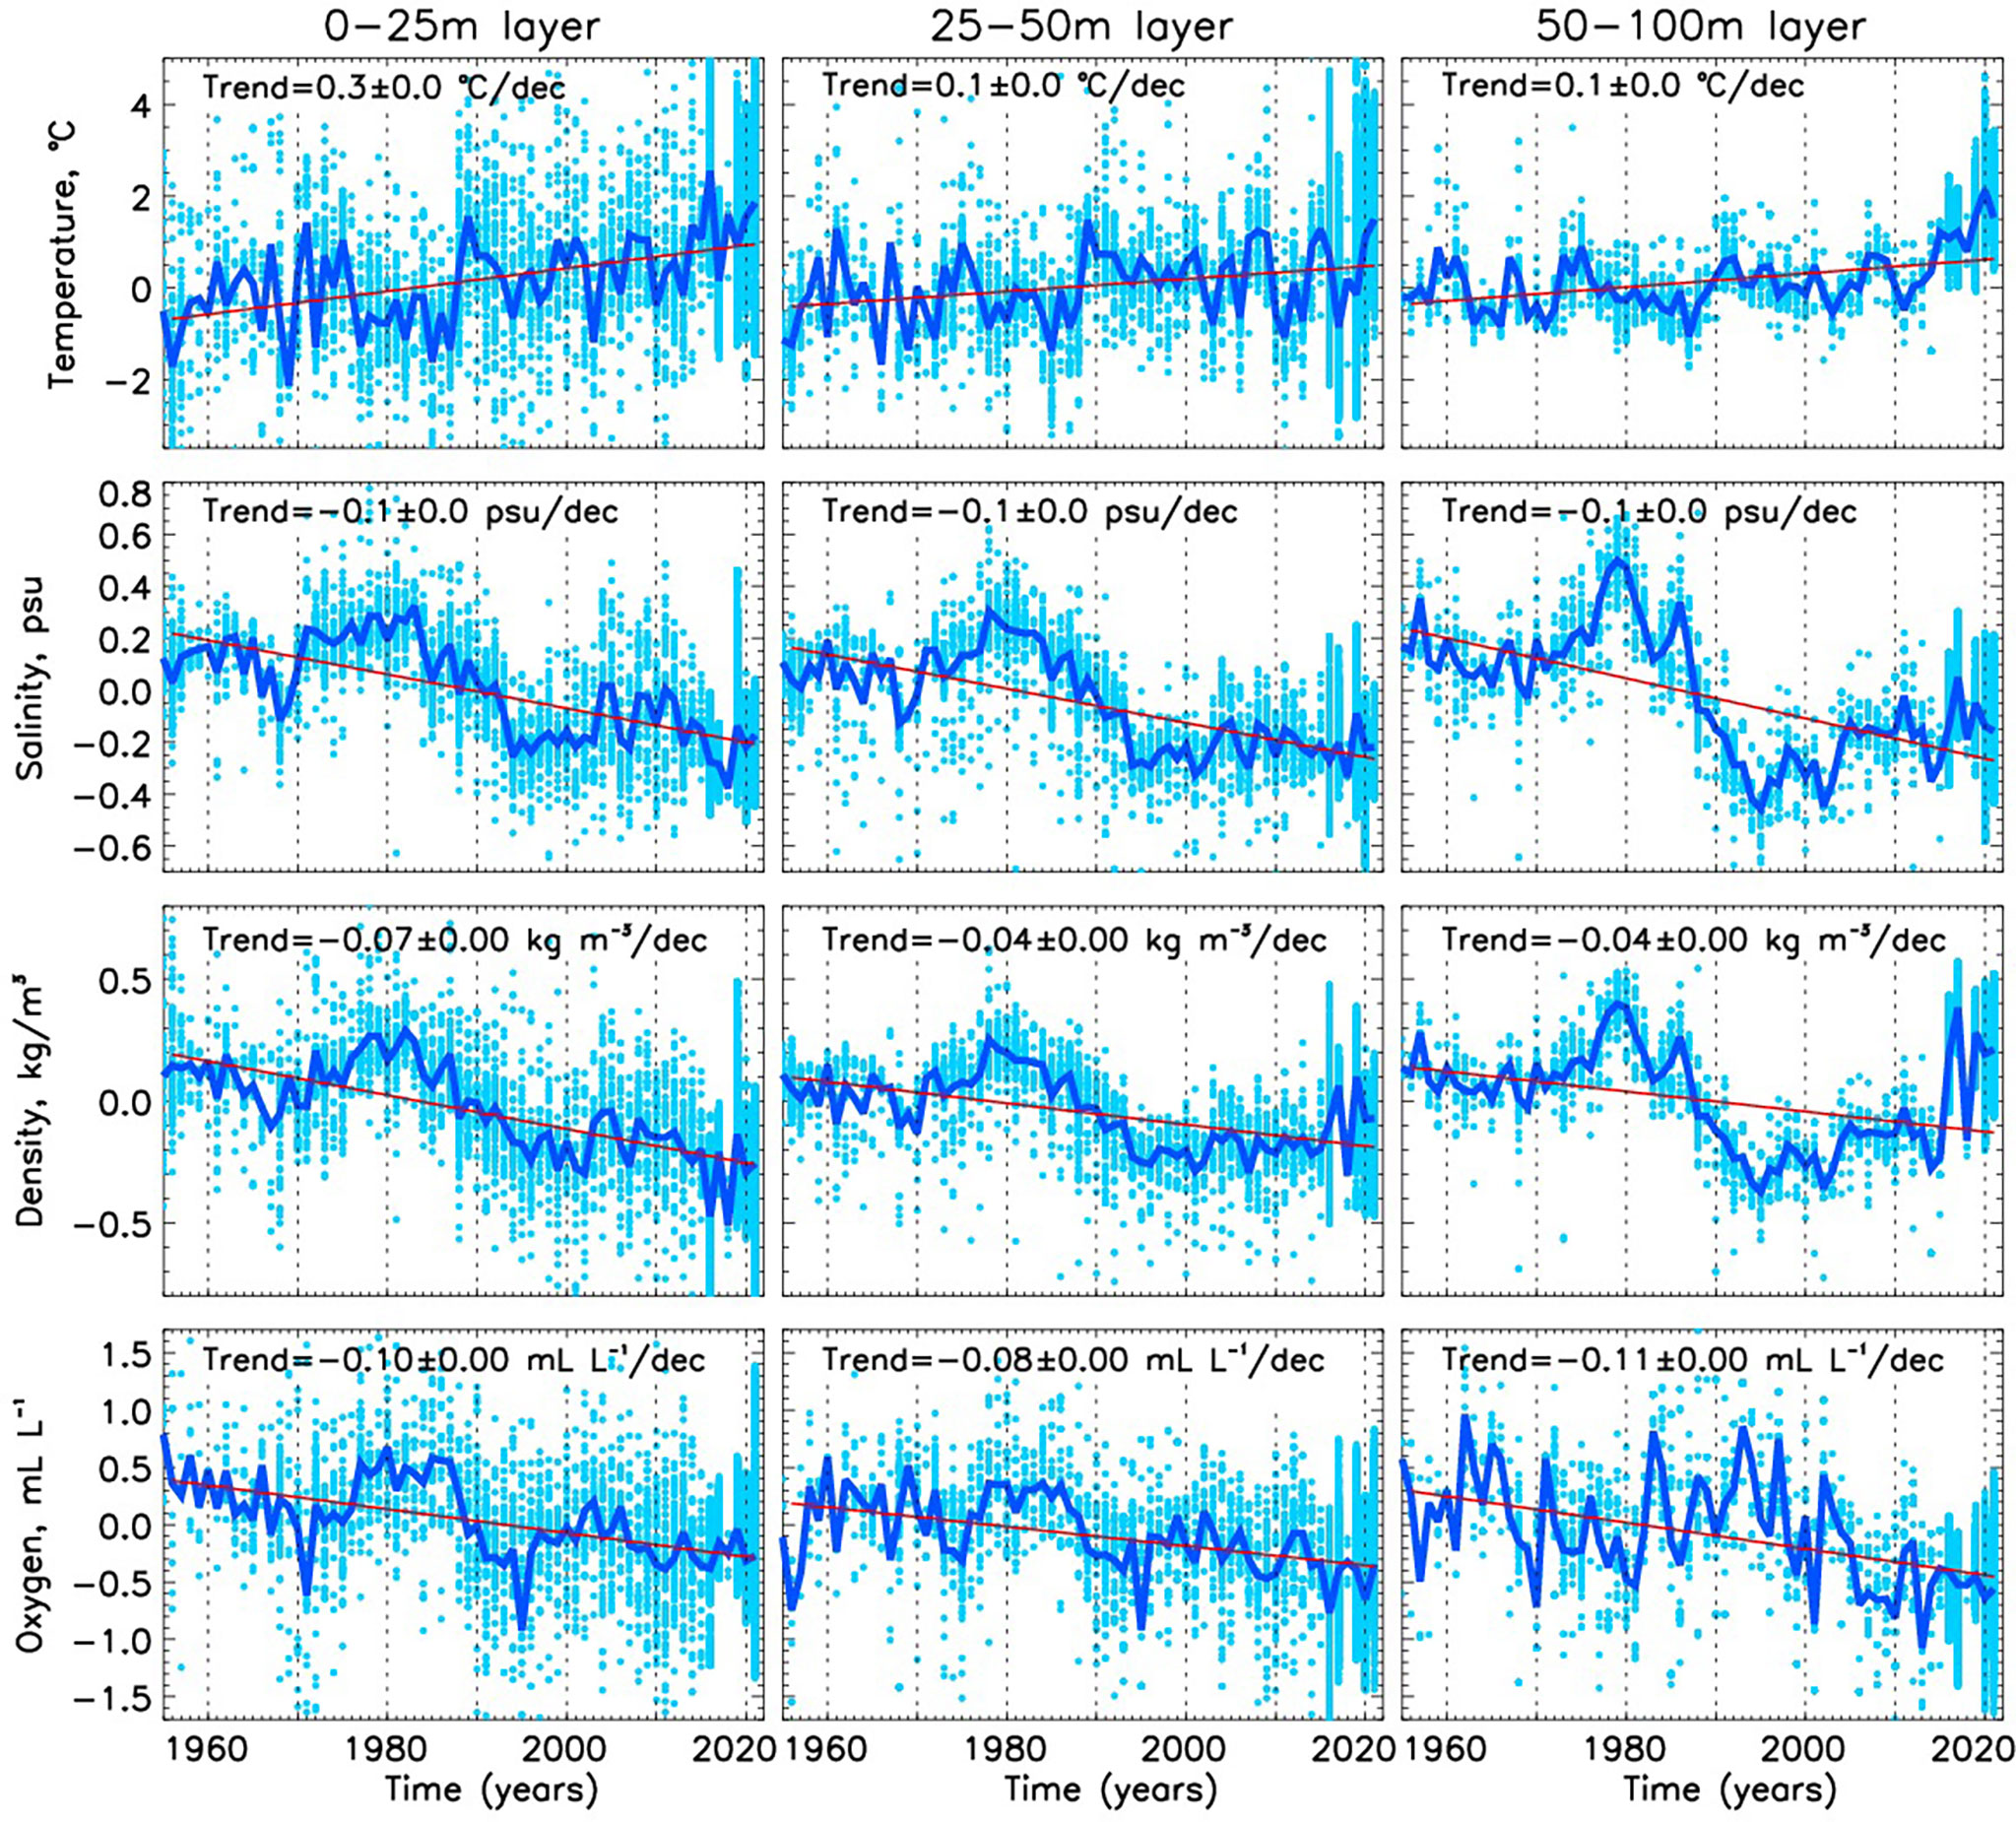
Figure 6 Time series of annual spatially averaged water temperature, salinity, density, and dissolved oxygen anomalies relative to their monthly climatologies based on 1955-2015 and 2018 shipborne observations complemented by 2016, 2017 and 2019-2021 glider observations in the Bothnian Sea. Blue dots are anomalies derived from the individual vertical profiles, blue lines are annual means, red lines show trends computed as linear fit to the blue time series.
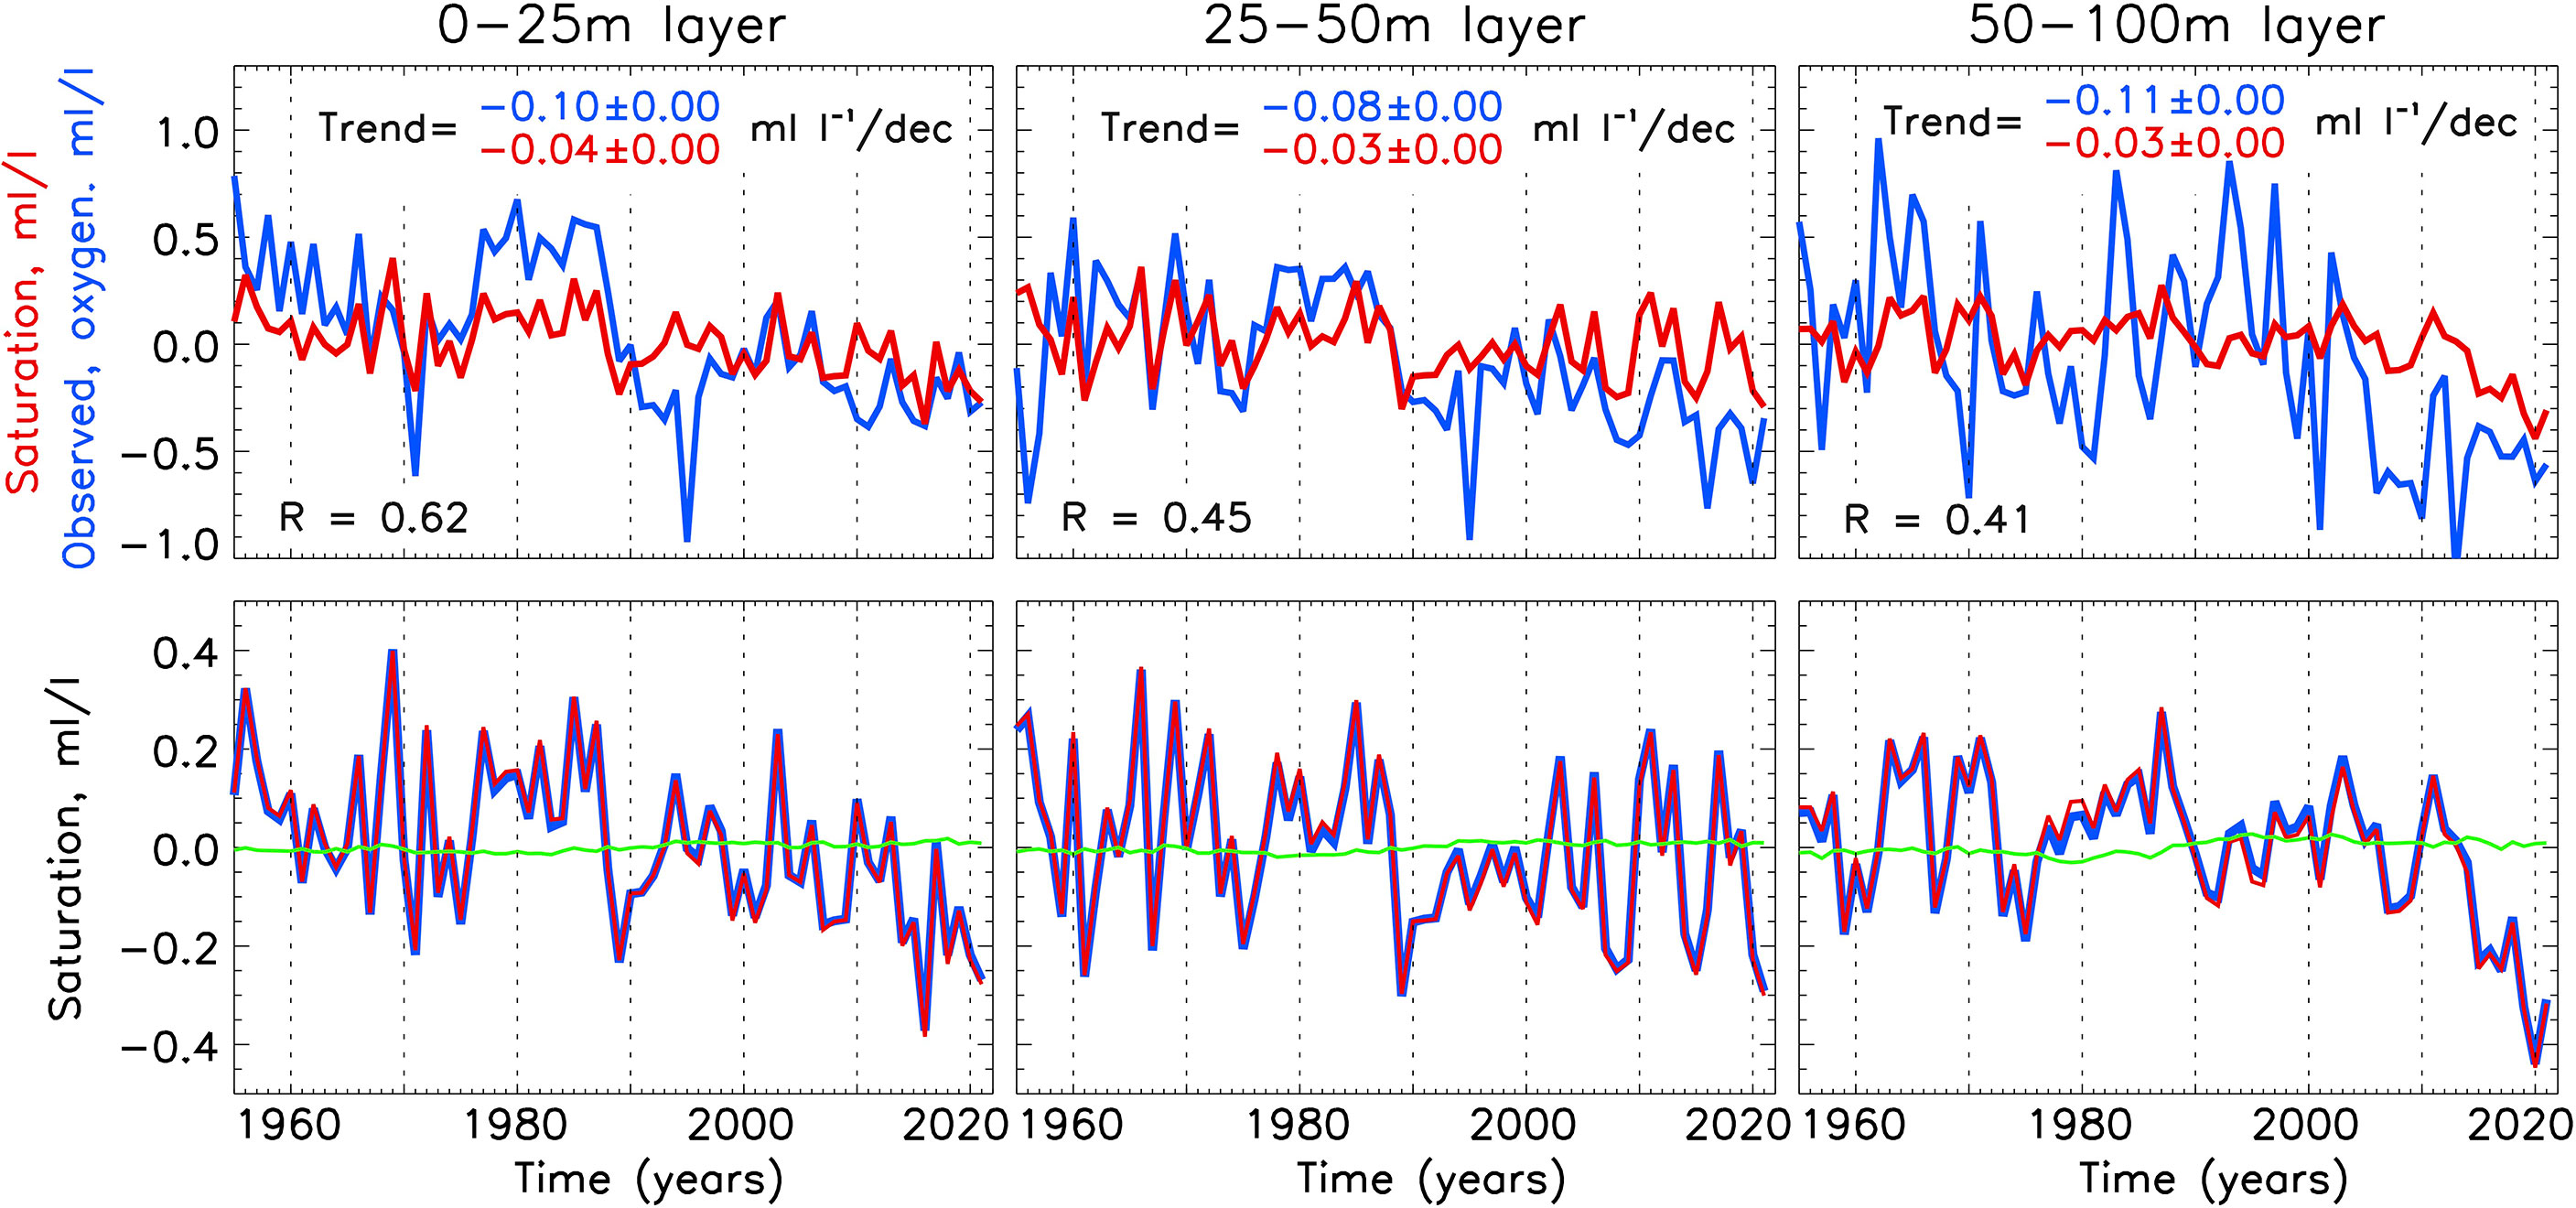
Figure 7 (Top) Time series of the observed oxygen concentrations (mL L-1, blue) and expected oxygen saturation (mL L-1, red) anomalies from shipborne and glider observations in the Bothnian Sea. (Bottom) Time series of the observed oxygen concentrations (blue), expected oxygen saturation anomalies due to temperature (red) and salinity (green).
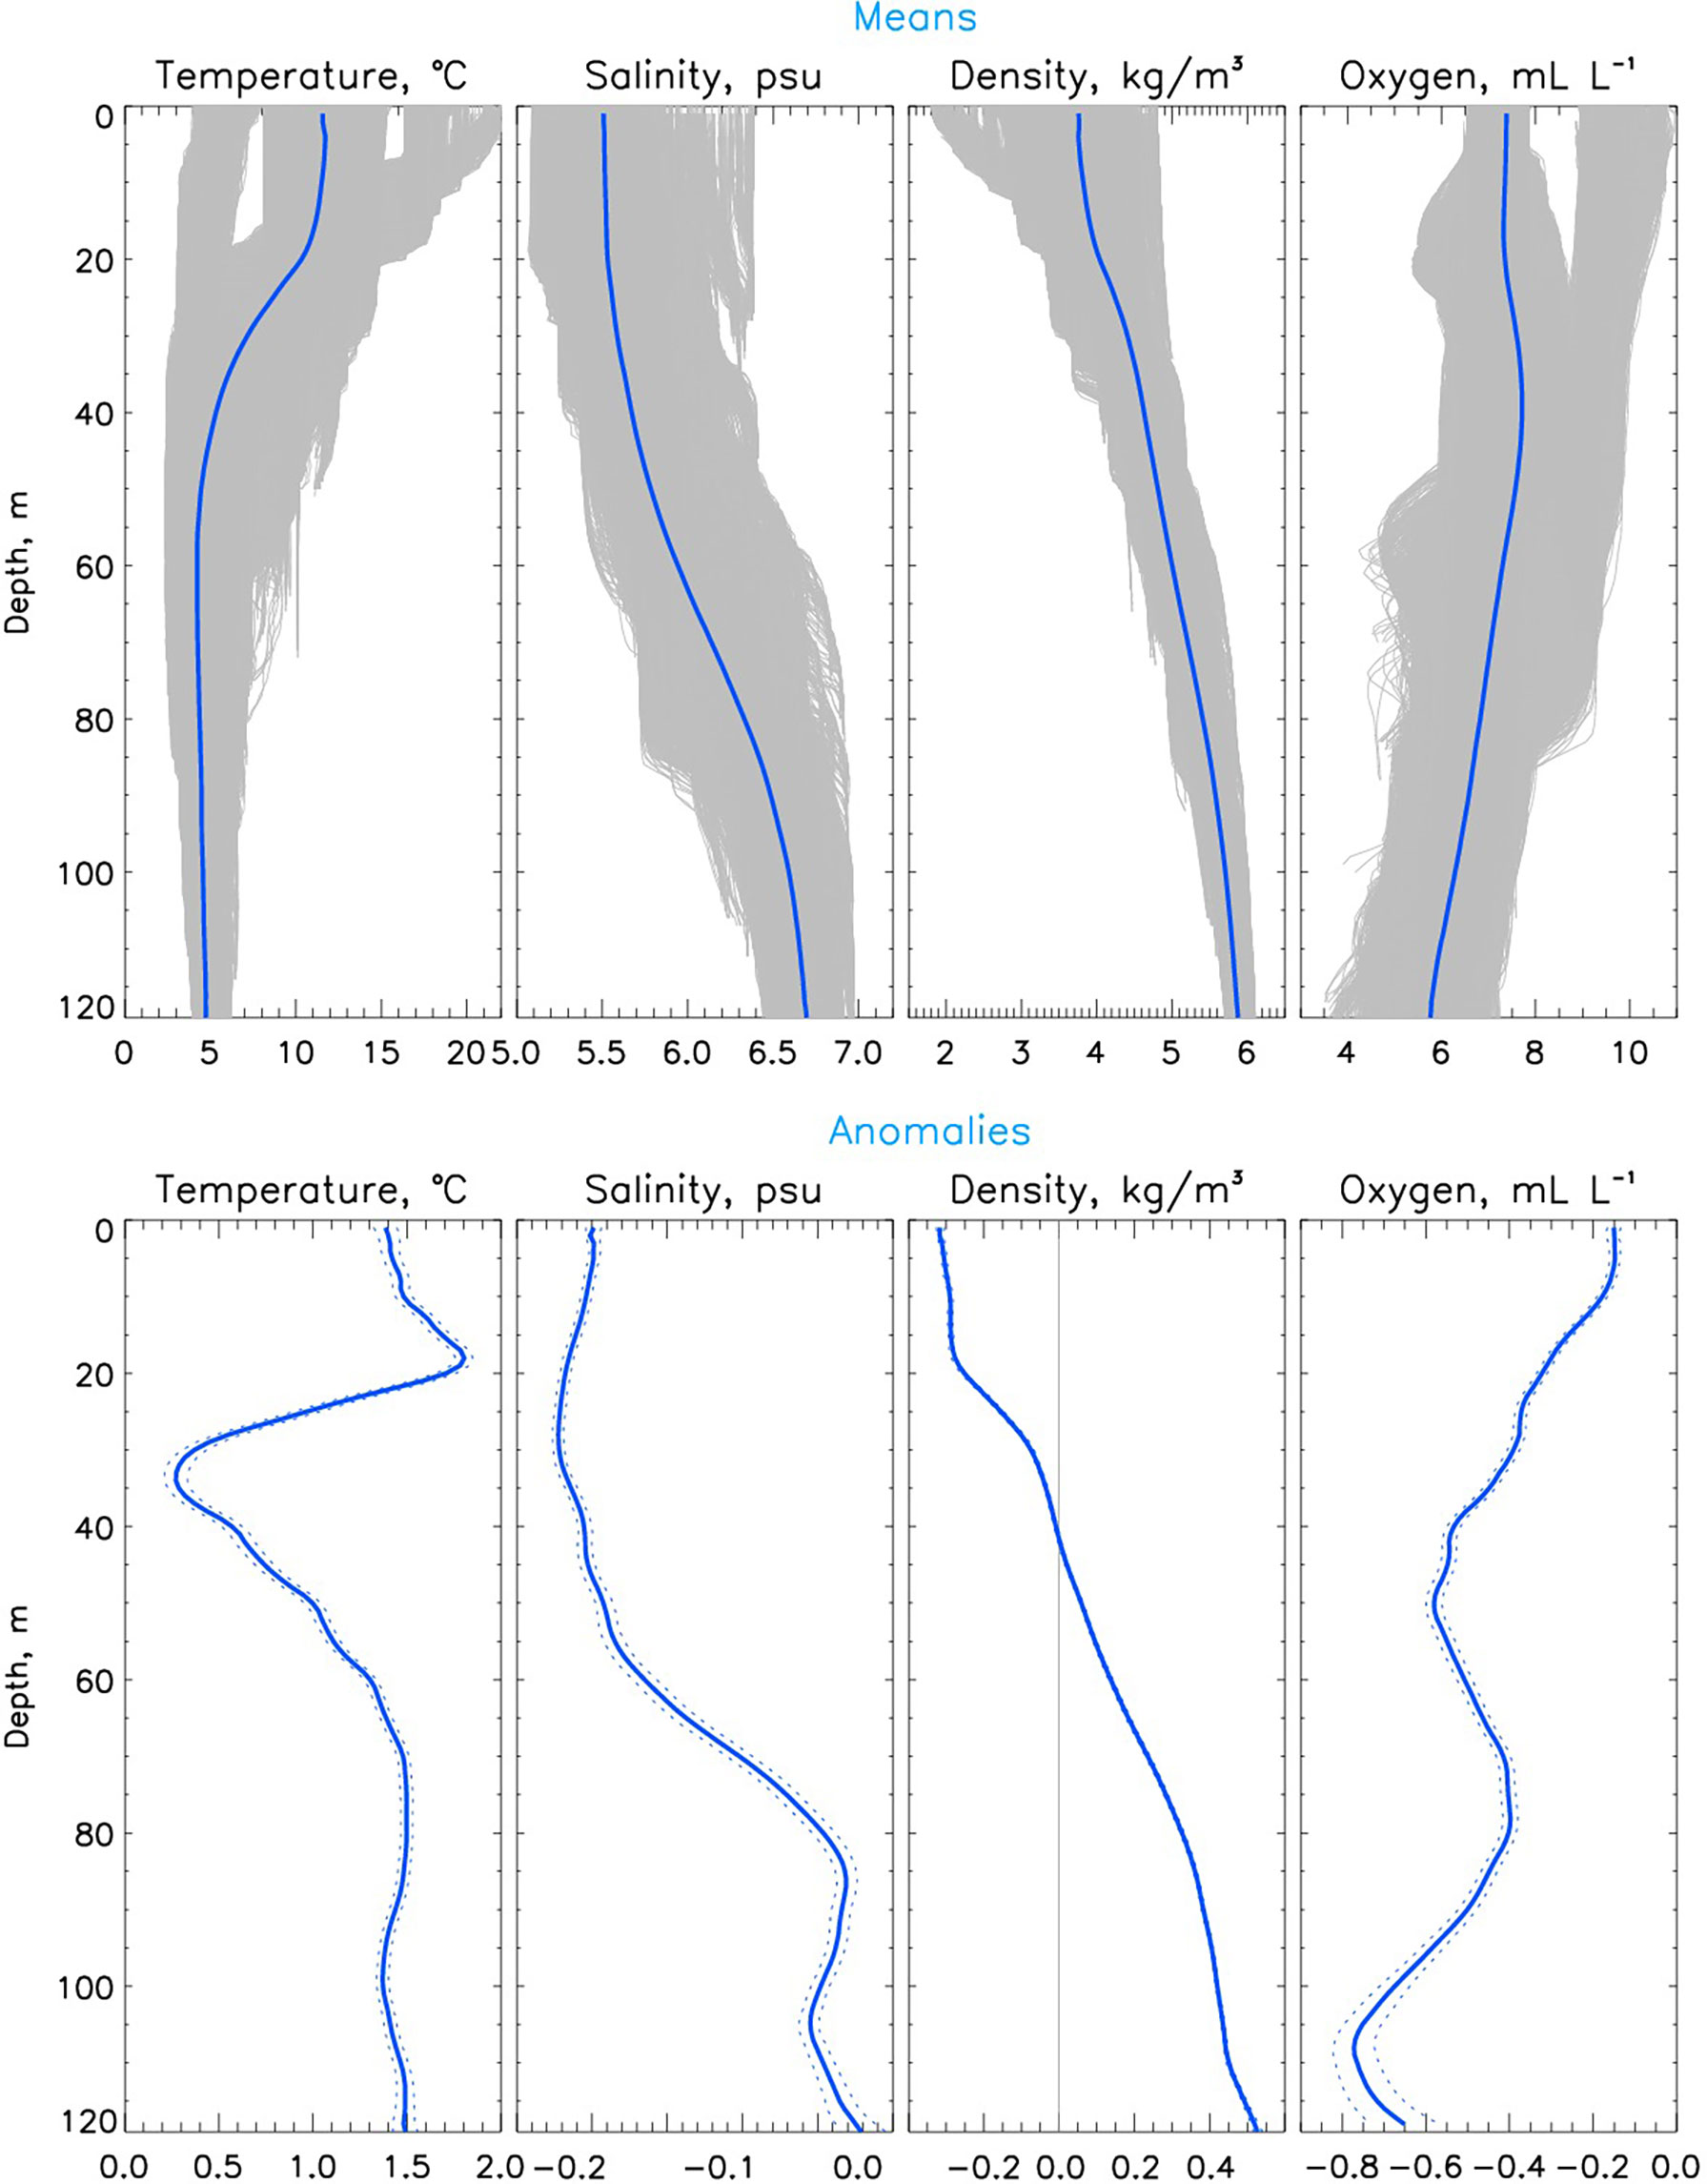
Figure 8 (Top) mean and (bottom) anomalous vertical profiles of spatially and temporally averaged water temperature, salinity, density, and dissolved oxygen based on 2016-2021 glider observations in the Bothnian Sea. In the upper row, grey lines show individual profiles whereas blue lines show their averages. Temperature, salinity and dissolved oxygen anomalies are computed relative to their monthly climatologies; dotted lines show five Standard Errors.
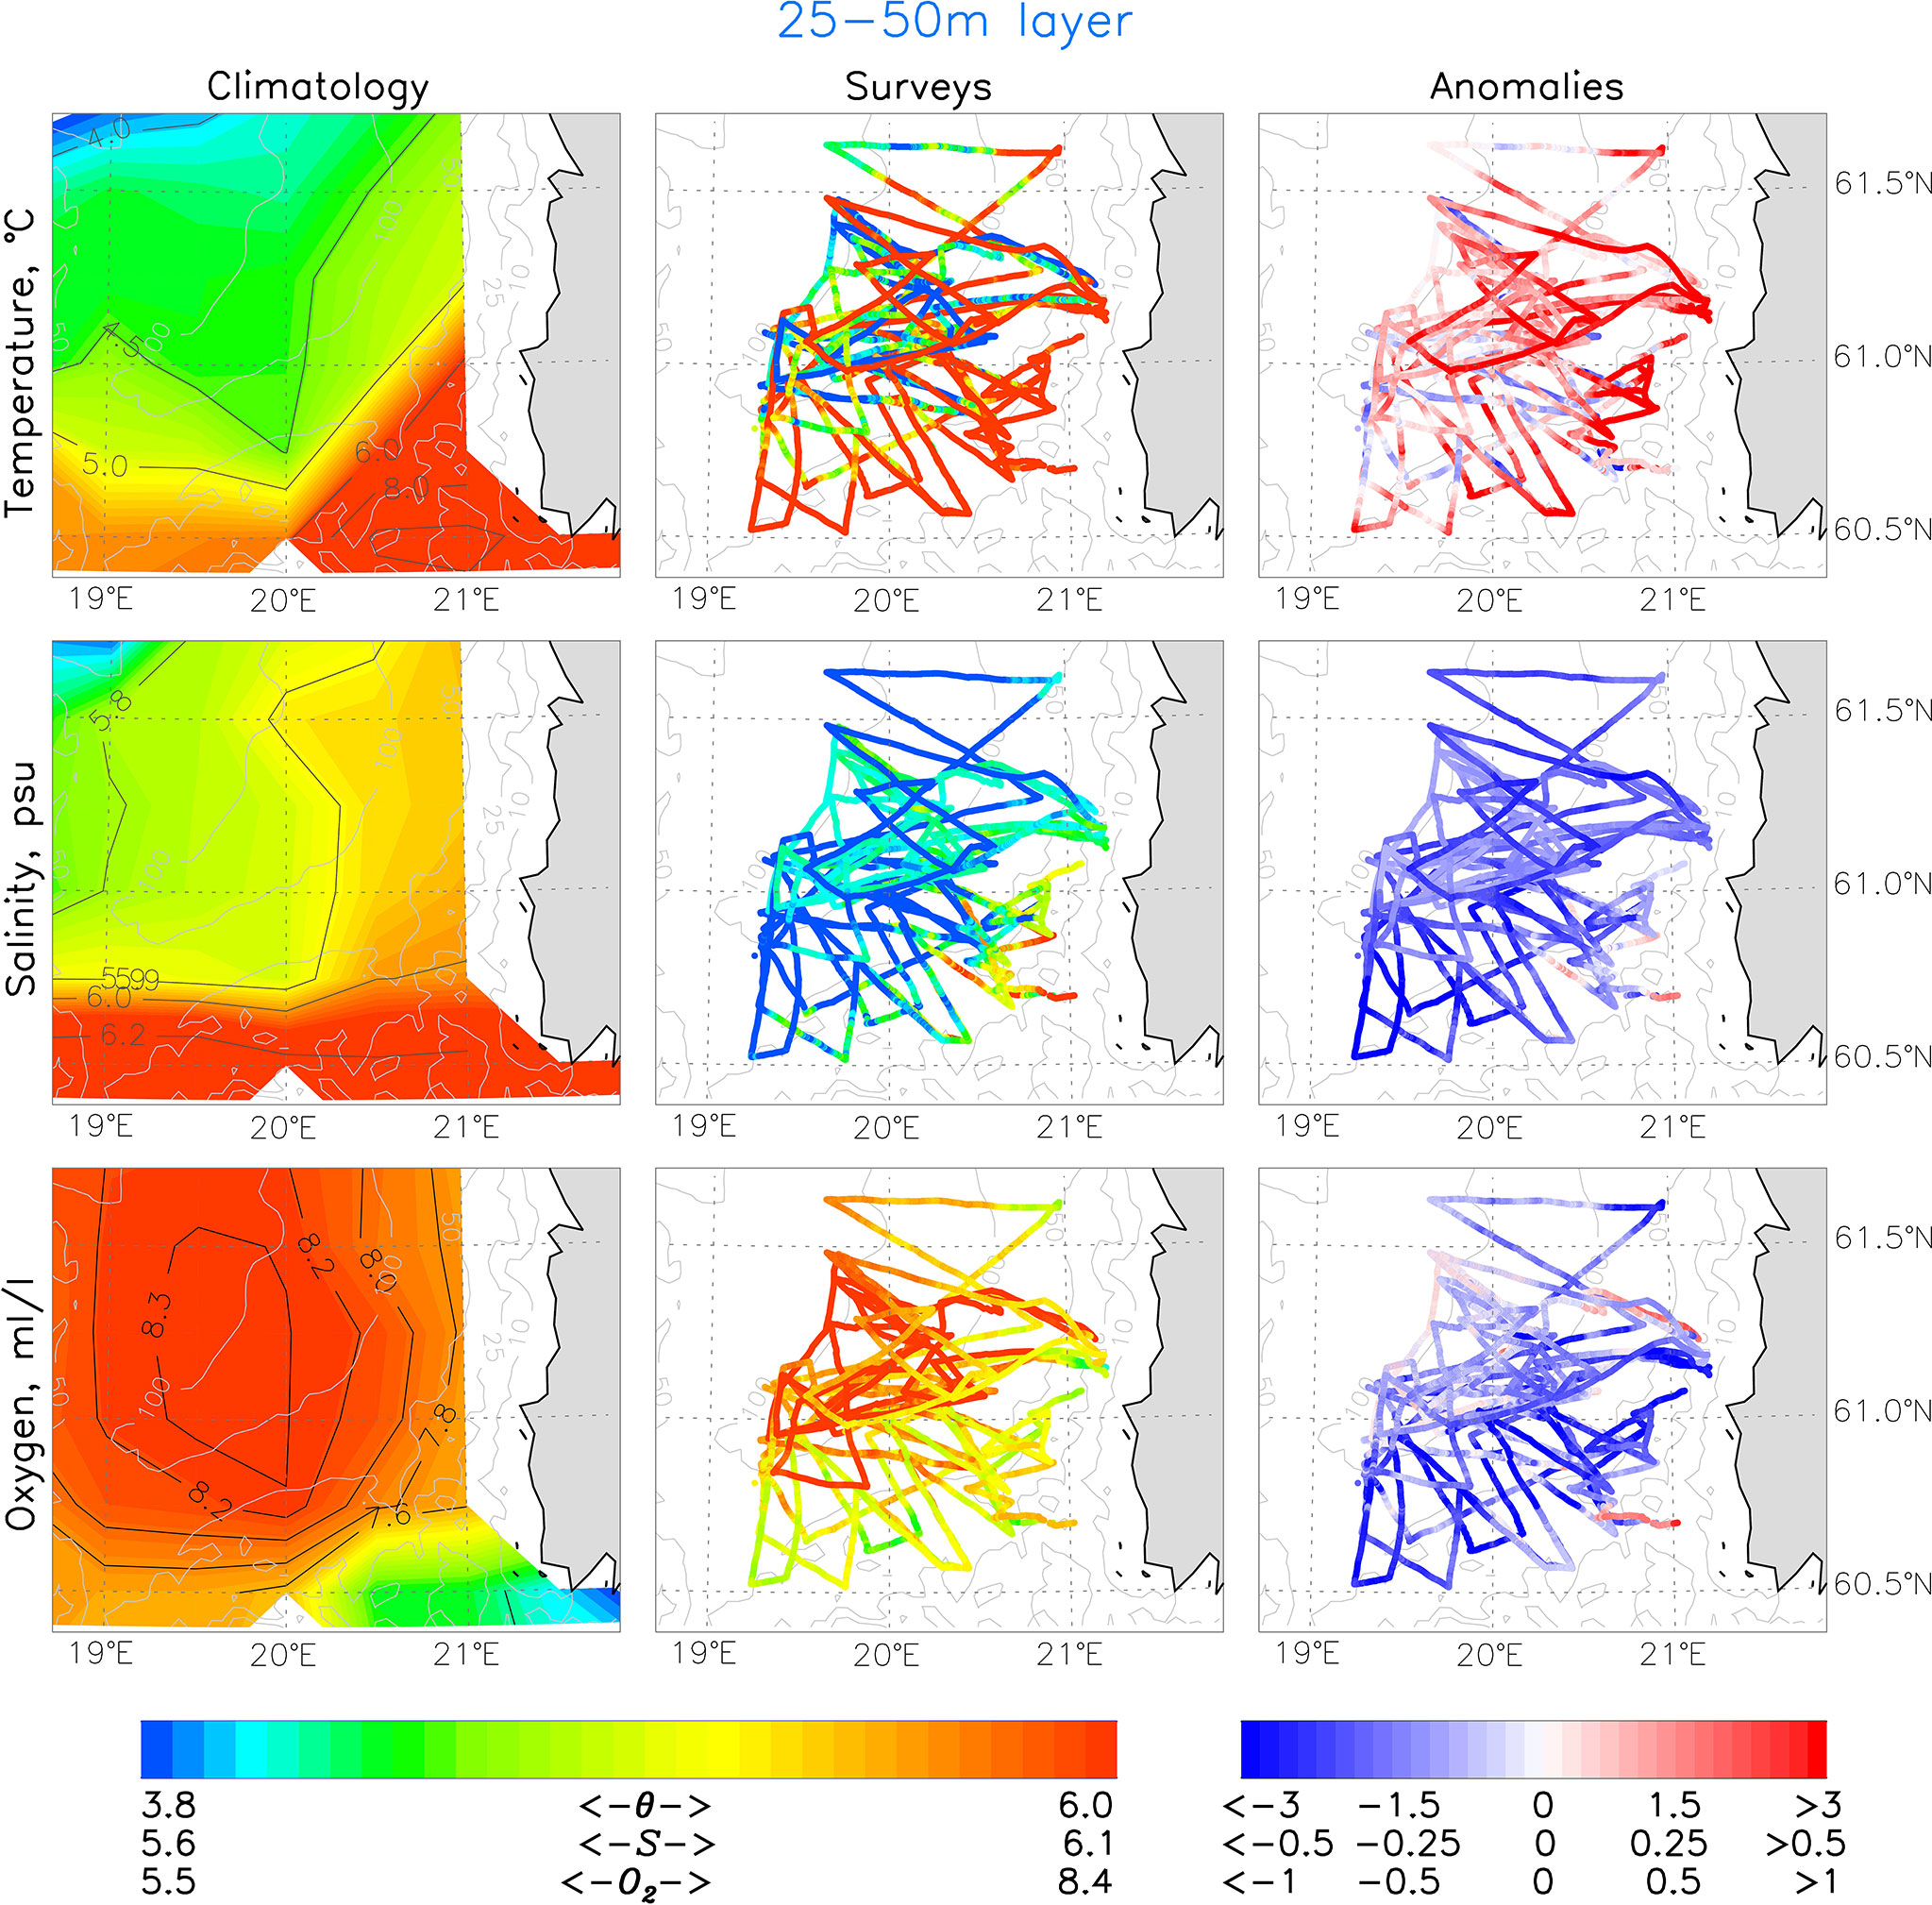
Figure 9 Maps of 25-50m mean water temperature, salinity and dissolved oxygen from (left) July-October climatology, (middle) glider observations, and (right) anomalies computed as differences between glider observations minus climatology taken for the month corresponding to each individual glider observation.
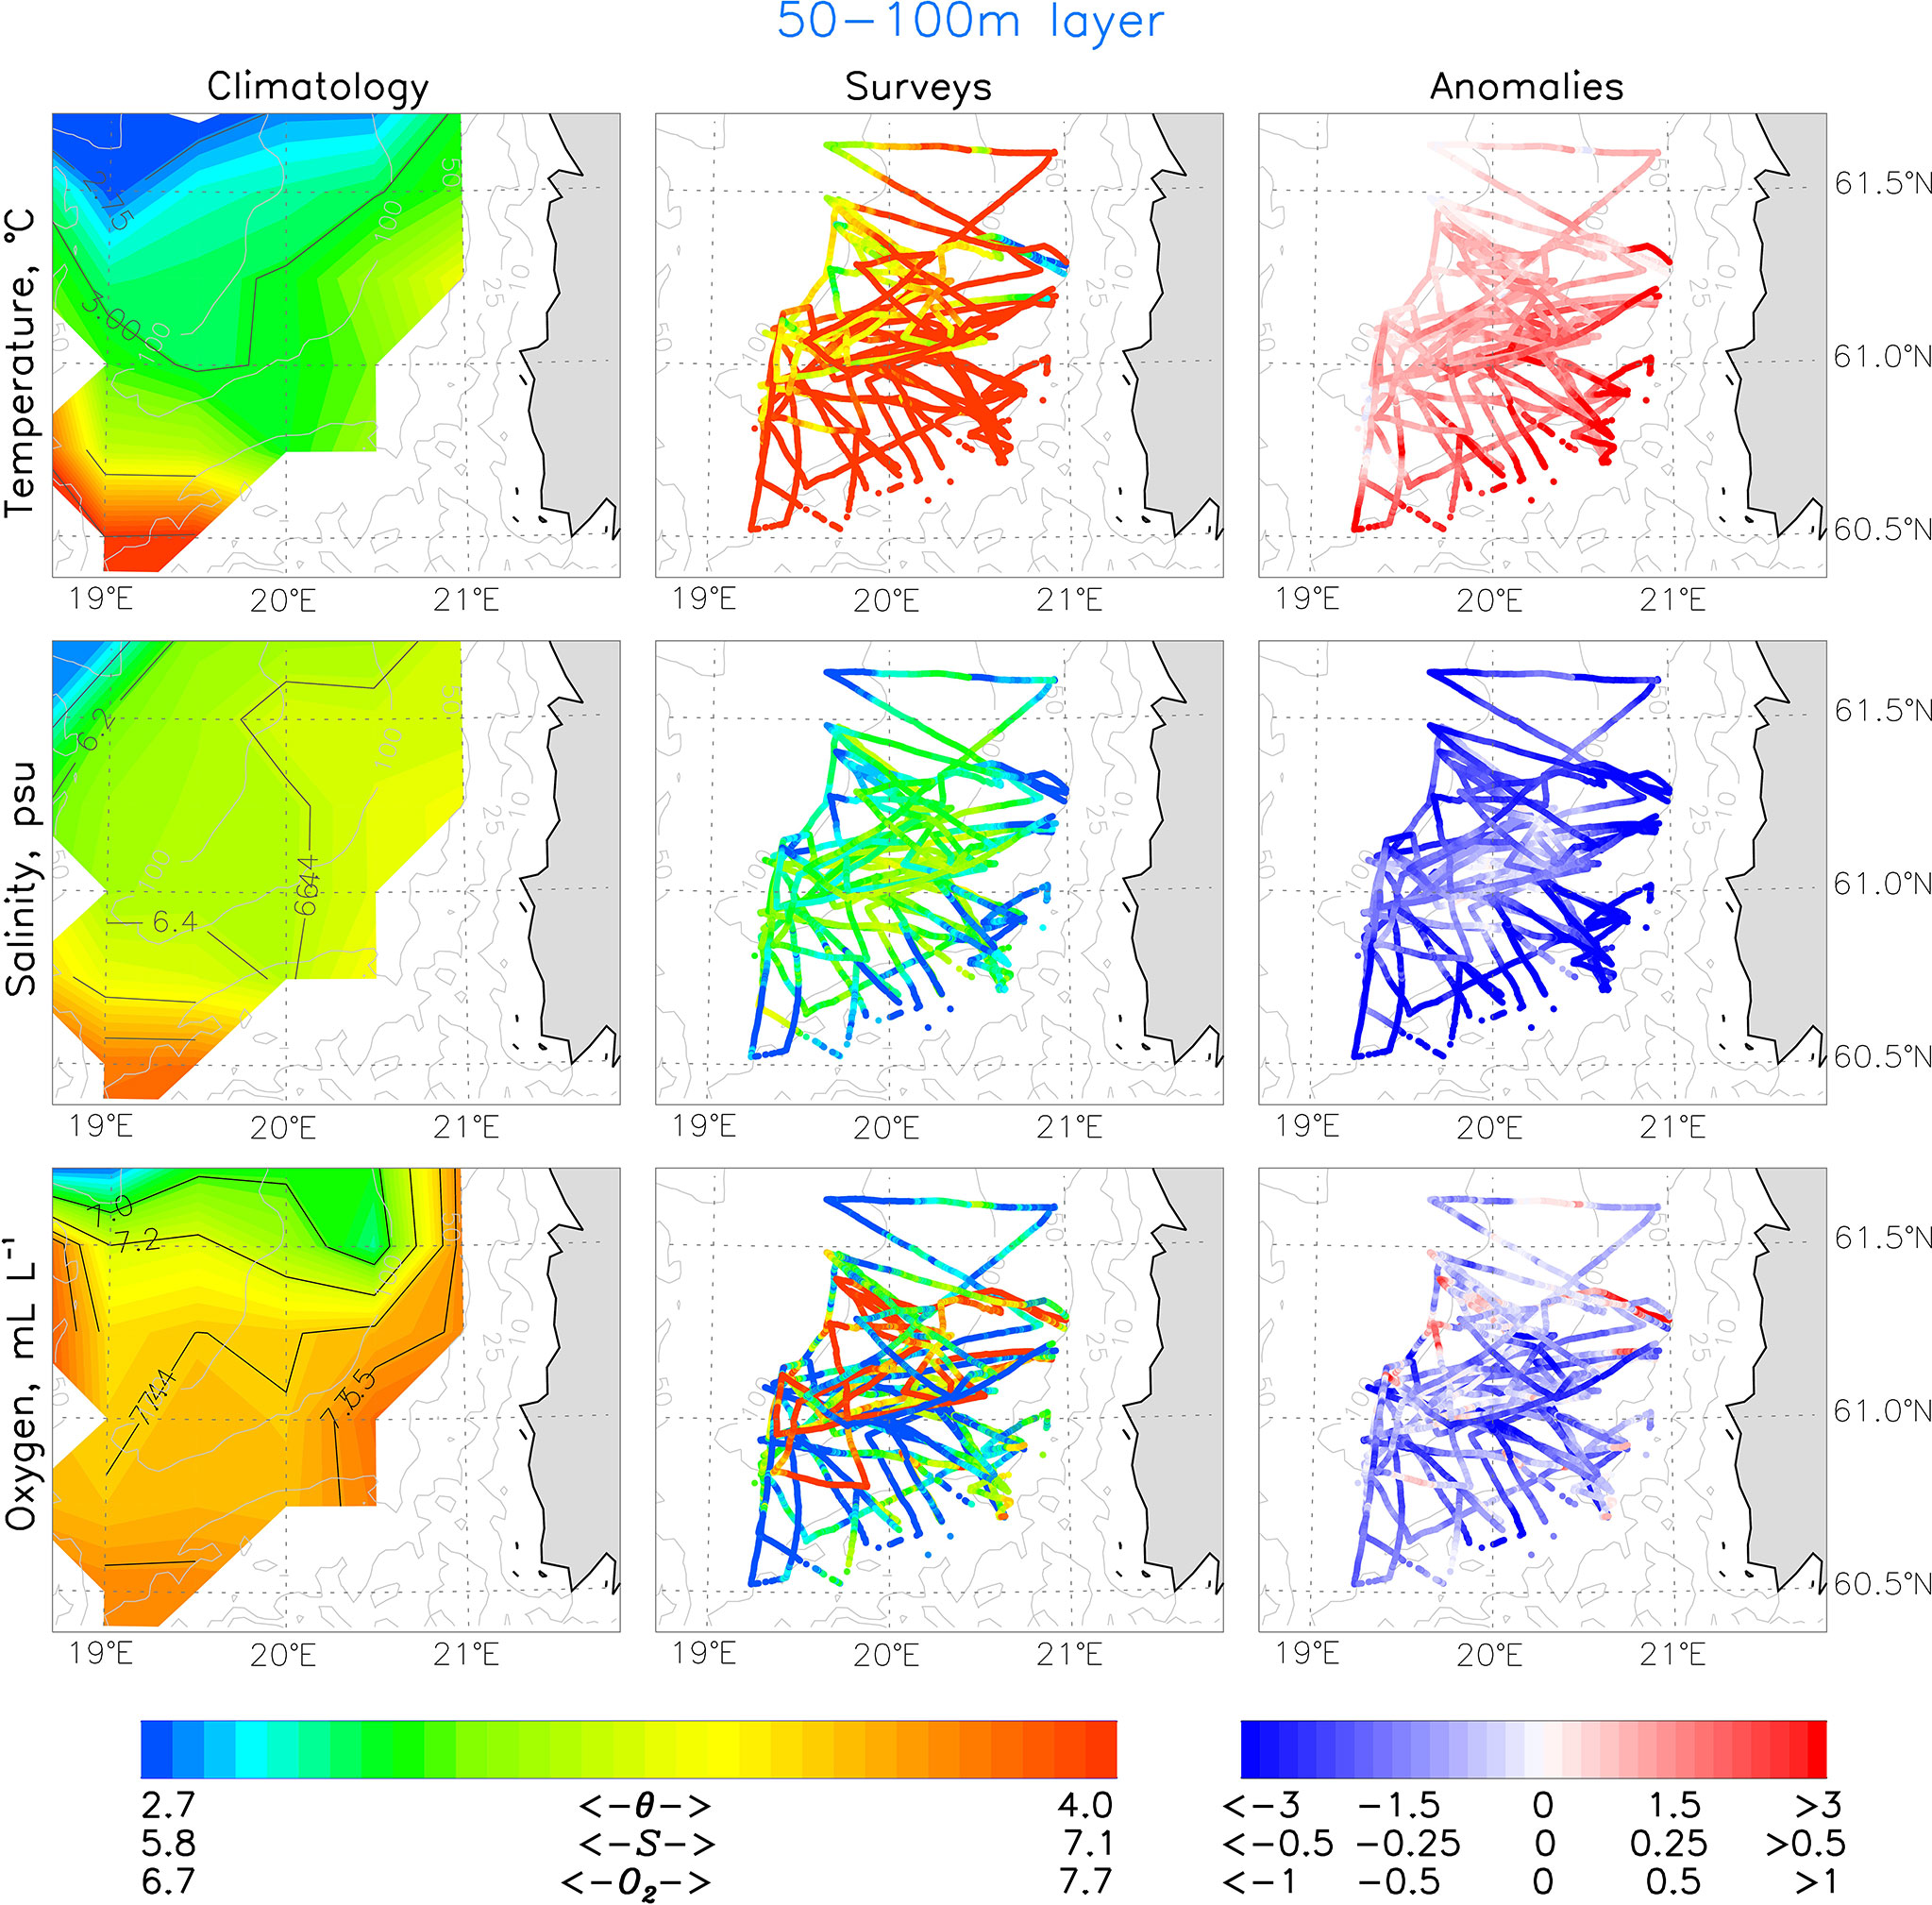
Figure 10 Maps of 50-100m mean water temperature, salinity and dissolved oxygen from (left) July-October climatology, (middle) glider observations, and (right) anomalies computed as differences between glider observations minus climatology taken for the month corresponding to each individual glider observation.
Making Regional Anomalous Time Series, Horizontal Maps, and Vertical Profiles
The regional maps, vertical profiles, and time series were constructed using original values of the individual parameters after they have been de-seasoned by subtracting corresponding monthly climatological values from the nearest climatic grid point. These de-seasoned values were spatially (within the entire region) and temporally (for each year) averaged to produce annual time series. Temporal and spatial averaging (using all de-seasoned glider data) was used to compose vertical profiles of anomalous temperature, salinity, and dissolved oxygen. This technique of using simple averaging of all points within the selected region provides an accurate spatial representation of area-averaged parameters, since the area of the region is relatively small and the selected parameters do not show much spatial variability within the region (Figures 3–10, S1ߝS3). Spatial distributions (maps) of parameter anomalies are presented in Figures 3–5 as individual colored circles, thus avoiding potential errors associated with spatial interpolation.
Estimating O2 Budget Inventories
Changes in the O2 budget inventories in the surface mixed layer (SML) are estimated using glider observations following Stigebrandt et al. (1996) and Alkire et al. (2012) as
where changes in time of oxygen concentration in the SML are balanced by Net Community Production (NCP) FNCP (which is a combination of net biological production minus respiration), by the air-sea exchange (ASE) O2 flux FASE, and by the diffusive flux FDIFF at the base of the SML. The FASE is calculated using glider observations as
where kgas is the gas transfer velocity, is the oxygen concentration in the near-surface layer (5m is used here), is the oxygen saturation computed using the algorithms of Garcia and Gordon (1992), and W10 is the wind speed at 10m height. Bubble injection increases the oxygen saturation and is taken into account via the Δ term (Woofle and Thorpe, 1991). For the Baltic Sea proper, it was estimated as ~0.025 based on historical hydrographic data (Stigebrandt, 1991). This approach yields negative air–sea fluxes for the intake of O2 from the atmosphere by the seawater. FNCP is computed as a residual using Eq. 1.
The gas transfer velocity kgas (m/day) is calculated by taking the mean (± 1 σ) of five commonly used wind speed parameterizations (see Table S1) and employing daily wind speeds from ERA5 reanalysis (https://cds.climate.copernicus.eu/cdsapp#!/dataset/reanalysis-era5-single-levels?tab=overview). In a similar analysis of air-sea fluxes in the Baltic Sea region, Gutiérrez-Loza et al. (2021) used additional parameterizations for kgas including effects of water-side convection, precipitation, and biological surfactant suppression. Although these various parameterizations are not applied in the present study, we note that the range of kgas estimates reported by Gutiérrez-Loza et al. (2021) for May-October (months covered by glider observations) is within the envelope of values given by the wind-based parameterizations (Table S1) for the Baltic Sea. Regional estimates provided by Gutiérrez-Loza et al. (2021) for the Bothnian Sea are also within the envelope for May-August, but their estimates for September-October, based on water-side convection, differ from the mean wind-based kgas estimate applied in this study by approximately 20%. Since the Gutiérrez-Loza et al. (2021) analysis does not provide an opinion regarding the accuracy of these new parameterizations, we have chosen to utilize only the wind-based parameterizations, while keeping in mind uncertainties related to the potential impact of autumnal convection.The balance of fluxes in the r.h.s. of Eq. 1 neglects horizontal advection which, averaged over the entire study area, is small in the region compared to other terms as evidenced by relatively weak spatial oxygen gradients between the Bothnian Sea and the surrounding basins (Figure S3). Vertical diffusive flux FDIFF at the base of the SML is computed as a function of constant diapycnal diffusivity coefficient kz = 10-4 m2/s times the oxygen concentration gradient at the SML base. The value of kz used in this study is typical for oceanic conditions (e.g. Bushinsky and Emerson, 2015). We note, however, that the uncertainty in this estimate is high (~100%) and we lack any direct measurements of mixing/diffusivity. We also note that FDIFF are impacted by stratification. For example, Figure S5 shows monthly vertical profiles of buoyancy (N2) derived from shipborne and glider observations. The maximum of N2 identifies the depth with strongest stratification. Figure S5 demonstrates that in May (the earliest month with glider observations), the N2 maximum is located at ~60m – an indicator of winter convective mixing depth. Starting from June through October, a shallower maximum is developed at 15-20m, which is the depth of the SML. Both these N2 maxima indicate the depth where vertical exchanges between the upper and lower layers of the Bothnian Sea are expected to be minimal. Entrainment (the rate of deepening of the SML) is represented by an oxygen flux between the SML and lower layer following Bushinsky and Emerson (2015). If the mixed layer is deepening, it entrains water from below; if the mixed layer is shoaling, oxygen is added to the box below. We note that this term of the gas balance is small compared with other terms of the balance equation (1) (e.g. averaged over glider surveys, it varied from 0.4% to 3.2% compared to the changes in time of oxygen concentration in the SML and thus neglected here.
Oxygen inventories were estimated for the variable depth SML (which is identified by the depth at which the water density exceeds that at the surface by 0.125 kg/m3, Monterey and Levitus, 1997) and for a constant 25m depth upper layer. Since the mean SML depth of 22.2m is very close to 25m, both estimates produced similar results (not shown) and we report estimates based on the variable SML.Data collected by a moving glider blend spatial and temporal variability; however, we are primarily interested in temporal changes in the O2 concentrations. The effect of spatial variability was mitigated in our analyses of O2 inventories by removal of the spatial signal from each glider observation using spatial anomalies derived from the O2 climatology. The latter were calculated relative to the central point of the polygon covered by glider surveys using linear interpolation. Averaged over the polygon area, the mean correction at the surface was -0.1 mL L-1. The rates of change in the oxygen inventory were then estimated for each glider survey by calculating linear trends using oxygen concentrations integrated over the SML. This approach produced similar estimates compared with the one based on the difference in oxygen inventories over a time divided by length of the episode used by Alkire et al. (2012). However, we find our approach superior since it uses all available oxygen concentrations from the survey and not just two estimates at the beginning and end of the time interval. Errors of the method were estimated using the Student t-test for linear trends.The estimated air–sea fluxes FASE were averaged over each glider survey and the resultant mean fluxes were added to the total corresponding O2 inventory changes to compute net community production FNCP.
Changes of Oxygen Concentration and Their Causes
Documenting Changes in Recent Years and Since the Mid-1950s
Analysis of 2016-2021 glider observations clearly demonstrates that Bothnian Sea waters have rapidly warmed and freshened, and concentrations of dissolved oxygen have noticeably reduced (Figures 3–10 and Table 1). The magnitude of these changes is dramatic, with regional temperature, salinity and oxygen concentration anomalies exceeding 2°C, 0.6 psu, and 0.5 mL L-1, respectively. However, we found rather contrasting patterns of changes in the upper 25m and deeper layers. For example, the strongest warming, freshening and oxygen depletion in the upper 25m was found in the central basin whereas, in sub-surface layers, these tendencies were amplified in the shallower areas, closer to the shore (Table 1). This resembles a two-layer pattern of changes, with the upper and lower layers separated by a halocline reaching ~50-60m by the end of winter, and is consistent with the two-layer circulation found in observations and modeling experiments (Westerlund et al., 2022).
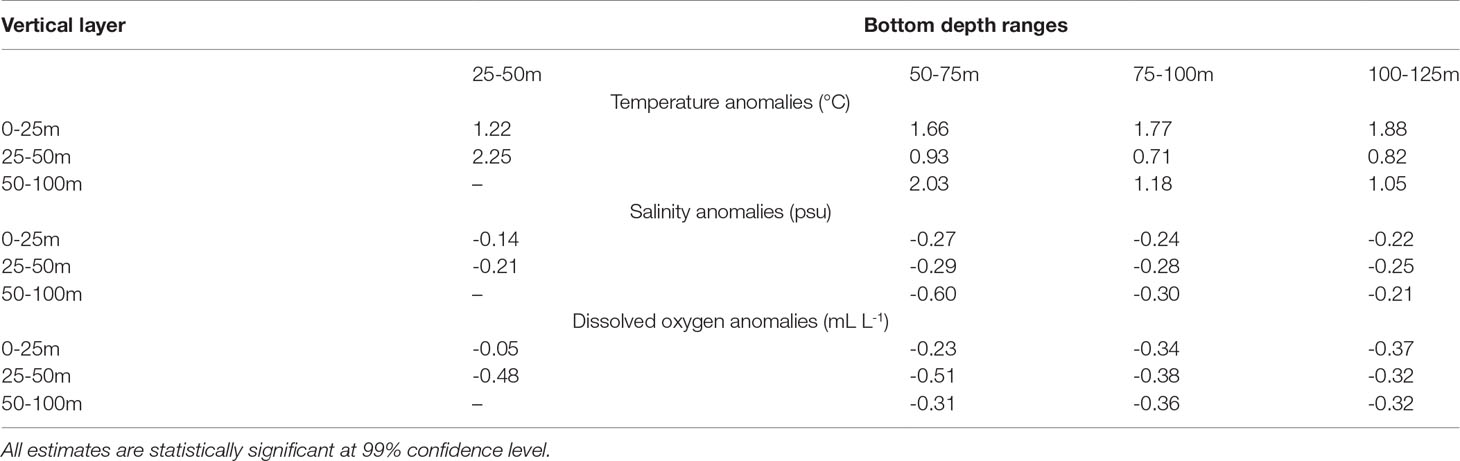
Table 1 Water temperature, salinity, and dissolved oxygen anomalies from glider observations in the deeper and shallower parts of the Bothnian Sea.
Vertical profiles of anomalous water temperature, salinity, density, and dissolved oxygen provide additional insight into the recent changes in the Bothnian Sea (Figure 8). Particularly, anomalous summer warming of surface waters in 2016-2021 lowered the saturation and drove a net flux of oxygen out of the water, thus decreasing the saturation capacity of the water and reducing the oxygen concentrations in the upper mixed layer as evident by the negative correlation R = –0.64 between annual time series of the upper 25m temperature and oxygen (Figure 6). At the same time, increased summer stratification in the upper ~30m layer was consistent with earlier reports for 1979-2012 (Kuosa et al., 2017) and 1982-2016 (Liblik and Lips, 2019) and coupled, we speculate, with continued biological production and sinking of organic matter, increased respiration deeper in the water column, drawing down dissolved oxygen. This hypothesis is supported by a positive correlation of R = 0.57 between annual time series of upper ocean salinity and intermediate depth range oxygen (Figure 6). Thus, strengthening of upper sea stratification may be a factor driving a larger decline of oxygen concentrations in the deeper layers than in the upper layers, as evident in the vertical profile of anomalous dissolved oxygen derived from glider observations (Figure 8).Time series based on both shipborne and glider observations place recent changes in a longer climatologic context (Figure 6). The pan-basin time series show that oxygen depletion is the dominant signal since the mid-1950s and is associated with a statistically significant linear trend of approximately –0.1 mL L-1 per decade (evaluated by the least-squares best-fit method) in all layers of the Bothnian Sea (Figure 6). In that, recent years do not stand out from the overall multidecadal tendency towards lower oxygen concentrations. Note that our estimates of trends are more conservative than the previous ones of 0.7 mL L-1 per decade made for the near-bottom oxygen saturation at an offshore station of the Bothnian Sea (see Fig. 4 from Raateoja, 2013), which may be attributed to the role of spatial averaging in our estimates. These long- and short-term tendencies for oxygen depletion are highly consistent with the observed warming trends since the mid-1950s (Figure 6). In that, warming rates evident from recent glider observations are not distinct from the background, longer warming trends. Warming in the deep Bothnian Bay from 1979 through 2012 was also previously reported by Kuosa et al. (2017); however, freshening of the Bothnian Sea was not uniform, with abrupt freshening in the 1980s and the lack of a significant trend in the upper ocean and even a reverse (salinification) trend starting from the mid-1990s in the 50-100m layer. In that, salinity changes dominate long-term density trends, consistent with the earlier study by Raateoja (2013).
Major Drivers of the Documented O2 Changes
Now we consider factors controlling the observed oxygen depletion in the Bothnian Sea since the mid-1950s. The maximum amount of oxygen that can be dissolved in a water body decreases with increasing temperature and salinity (i.e., warm, salty waters can hold the least O2). Thus, the observed warming can explain at least a part of the oxygen depletion (Figure 6). Indeed, Figure 4 shows that, in the upper 25m, the oxygen concentrations observed during 2016-2021 were close to their saturation levels so that the percent oxygen saturation was close to 100% (and even oversaturated in May 2021). In the deeper parts of the water column the percent oxygen saturation was lower, at ~80-90%. Figure 7 provides further evidence that a significant (~40%) portion of oxygen depletion in the upper 25m layer was due to a change in oxygen saturation caused by warming. It is indicated by modestly high correlation R = 0.62 between time series of the observed O2 concentrations and saturation and by their decreasing, statistically significant linear trends. Figure 7 also demonstrates that the salinity contribution to changes in oxygen saturation was negligible. Other reasons for oxygen depletion could include more pronounced respiration, even in deeper layers and the sediments, that ultimately impact the mixed layer through vertical mixing in fall and winter. But, temperature changes affecting the saturation are the most important. In the deeper layers, the role of warming in oxygen depletion decreased to less than 30% (as evidenced by the ratio of the linear trends of the observed O2 concentrations and saturation).
Next, we explore the observed changes of oxygen concentrations in the SML of the Bothnian Sea using the oxygen budget inventories derived from 2016-2021 glider observations (see Section 2e for details of the method). Time series of winds, surface O2 concentrations, and the surface oxygen fluxes (FASE) are shown in Figure 5. Summer warming of surface waters lowered the saturation (Figure 4) and drove a net flux of O2 out of the water (positive FASE in May-August), thereby lowering the O2 concentration at 5 m (Figures 5, 11). The positive NCP in May-July partially balanced the outflux of oxygen from the sea but the tendency towards lower O2 concentrations in the upper sea persisted (Figure 11). Diffusive fluxes FDIFF at the base of the SML do not play a significant role in the budget (e.g. if we neglect them, the distribution of other budget constituents would qualitatively remain the same). Monthly vertical profiles (Figure S5) and phase diagrams (Figure S6) show this seasonal progression in both shipborne and glider observations quite clearly, with a kink in the temperature-salinity and temperature-oxygen concentrations diagrams corresponding to the depth of the SML (Figure S6). We note also a subsurface oxygen minimum that was particularly pronounced in late summer at the thermocline (Figure S5).Autumnal cooling resulted in the invasion of oxygen from the air into the water (negative fluxes) thus increasing its concentration in the SML. This process progresses well into the winter so that the data in salinity-O2 concentration diagram are almost linear in January-May, extending from low salinity/high oxygen concentration at the surface to higher salinity/lower O2 concentration at the bottom (Figure S6). However, for the most autumnal glider surveys the influx of oxygen into the water was balanced by a predominance of net community respiration over production so that changes of the oxygen concentrations were negligible and statistically indistinguishable from zero (Figure 11). We speculate that the highly negative respiration rates implied by the O2 budgets might be explained by the entrainment of deeper, relatively O2-depleted waters as the mixed layer deepens in autumn and/or remineralization of organic matter supplied to the study area from surrounding rivers. It has been shown that the Gulf of Bothnia releases CO2 to the atmosphere mainly due to the high organic input from the northern rivers (Algesten et al., 2004). The net heterotrophy of the Bothnian Sea is also considerable, though somewhat less than that of the Bothnian Bay, due to its higher primary production (Algesten et al., 2004). The net heterotrophy is mostly caused by bacterial mineralization of organic carbon (Algesten et al., 2006). There are indications of eutrophication in the Bothnian Sea resulting in higher primary production (Kuosa et al., 2017). For example, water transparency in the Gulf of Bothnia, measured as Secchi depth and indicative of the amount of dissolved organic matter in the water (Harvey et al., 2019), has steadily decreased from 1980’s (Fleming-Lehtinen and Laamanen, 2012)., However, it seems the balance has moved further towards increased bacterial respiration (Figure 6). Additional observations are needed to test these hypotheses.The glider surveys lacked observations in winter months so this analysis of the O2 seasonal cycle in recent years remains incomplete. Despite that, our observations suggest that a warming climate will increase the outflux of oxygen from the upper sea in spring and early summer when increasing water temperatures simultaneously lower the saturation in the surface and increase stratification, which could result in severely reduced oxygen concentrations in the subsurface that can negatively affect fish and benthic organisms.Since the rate of O2 depletion captured by glider observations in 2016-2021 was preserved at approximately the same level starting from the early 1990s (Figure 7), we hypothesize that similar tendencies dominated changes of the oxygen concentrations in the SML over this extended period. Increasing temperatures lower the saturation in the surface and increase stratification, which could result in severely reduced oxygen concentrations in the subsurface that can negatively affect fish and benthic organisms due to low oxygen levels or anoxic conditions.Our analysis of trends in 1955-2021 suggests that warming in the deeper (>25m) Bothnian Sea explains about 30% of the observed oxygen depletion, and the remaining ~70% are caused by other processes. The role of lateral exchanges across the Archipelago Sea and northern boundary of the Bothnian Sea is difficult to evaluate using very limited available information (e.g., Tuomi et al., 2018). However, their sill depths are limited by ~70m, and the circulation through the Archipelago is sluggish (Myrberg and Andrejev, 2006); thus, exchanges through these openings likely cannot explain significant oxygen depletion found at greater depths of the Bothnian Sea (Figure 8). The role of lateral ventilation of the basin from the south through the Åland Sea was explored in a modeling study by Westerlund et al. (2022), who showed a ~15% decrease of northward water transports entering the Bothnian Sea in 2013-2018. Moreover, they provided estimates of water transports from observations made in the 1970s; upon comparison, it follows that the rate of slowing down of the northward transport into the Bothnian Sea in the 2010s was consistent with that for the 1970s-2010s. Since oxygen concentrations below the SML are higher in the central basin (see Figures 9, 10), decreased water influxes cannot explain the observed oxygen depletion in the Bothnian Sea.Consequently, the most plausible explanation for the observed oxygen depletion in the deeper layers would be an increase of stratification dominated by changes in salinity. Stronger stratification reduces the coupling between the processes in the upper and deeper parts of the Bothnian Sea, reducing vertical exchanges and oxygen supply to the basin interior during spring and autumn blooms. In an earlier study, Ahlgren et al. (2017) argued that the decline of oxygen concentrations in 1994-2012 was mostly driven by warming and an increase of dissolved organic carbon (DOC). Our analysis over an extended time period, though not conclusive, demonstrates the important role of warming but, at the same time, suggests that reduced local ventilation across the basin’s halocline was probably the main driver of the observed oxygen depletion in the deeper Bothnian Sea.
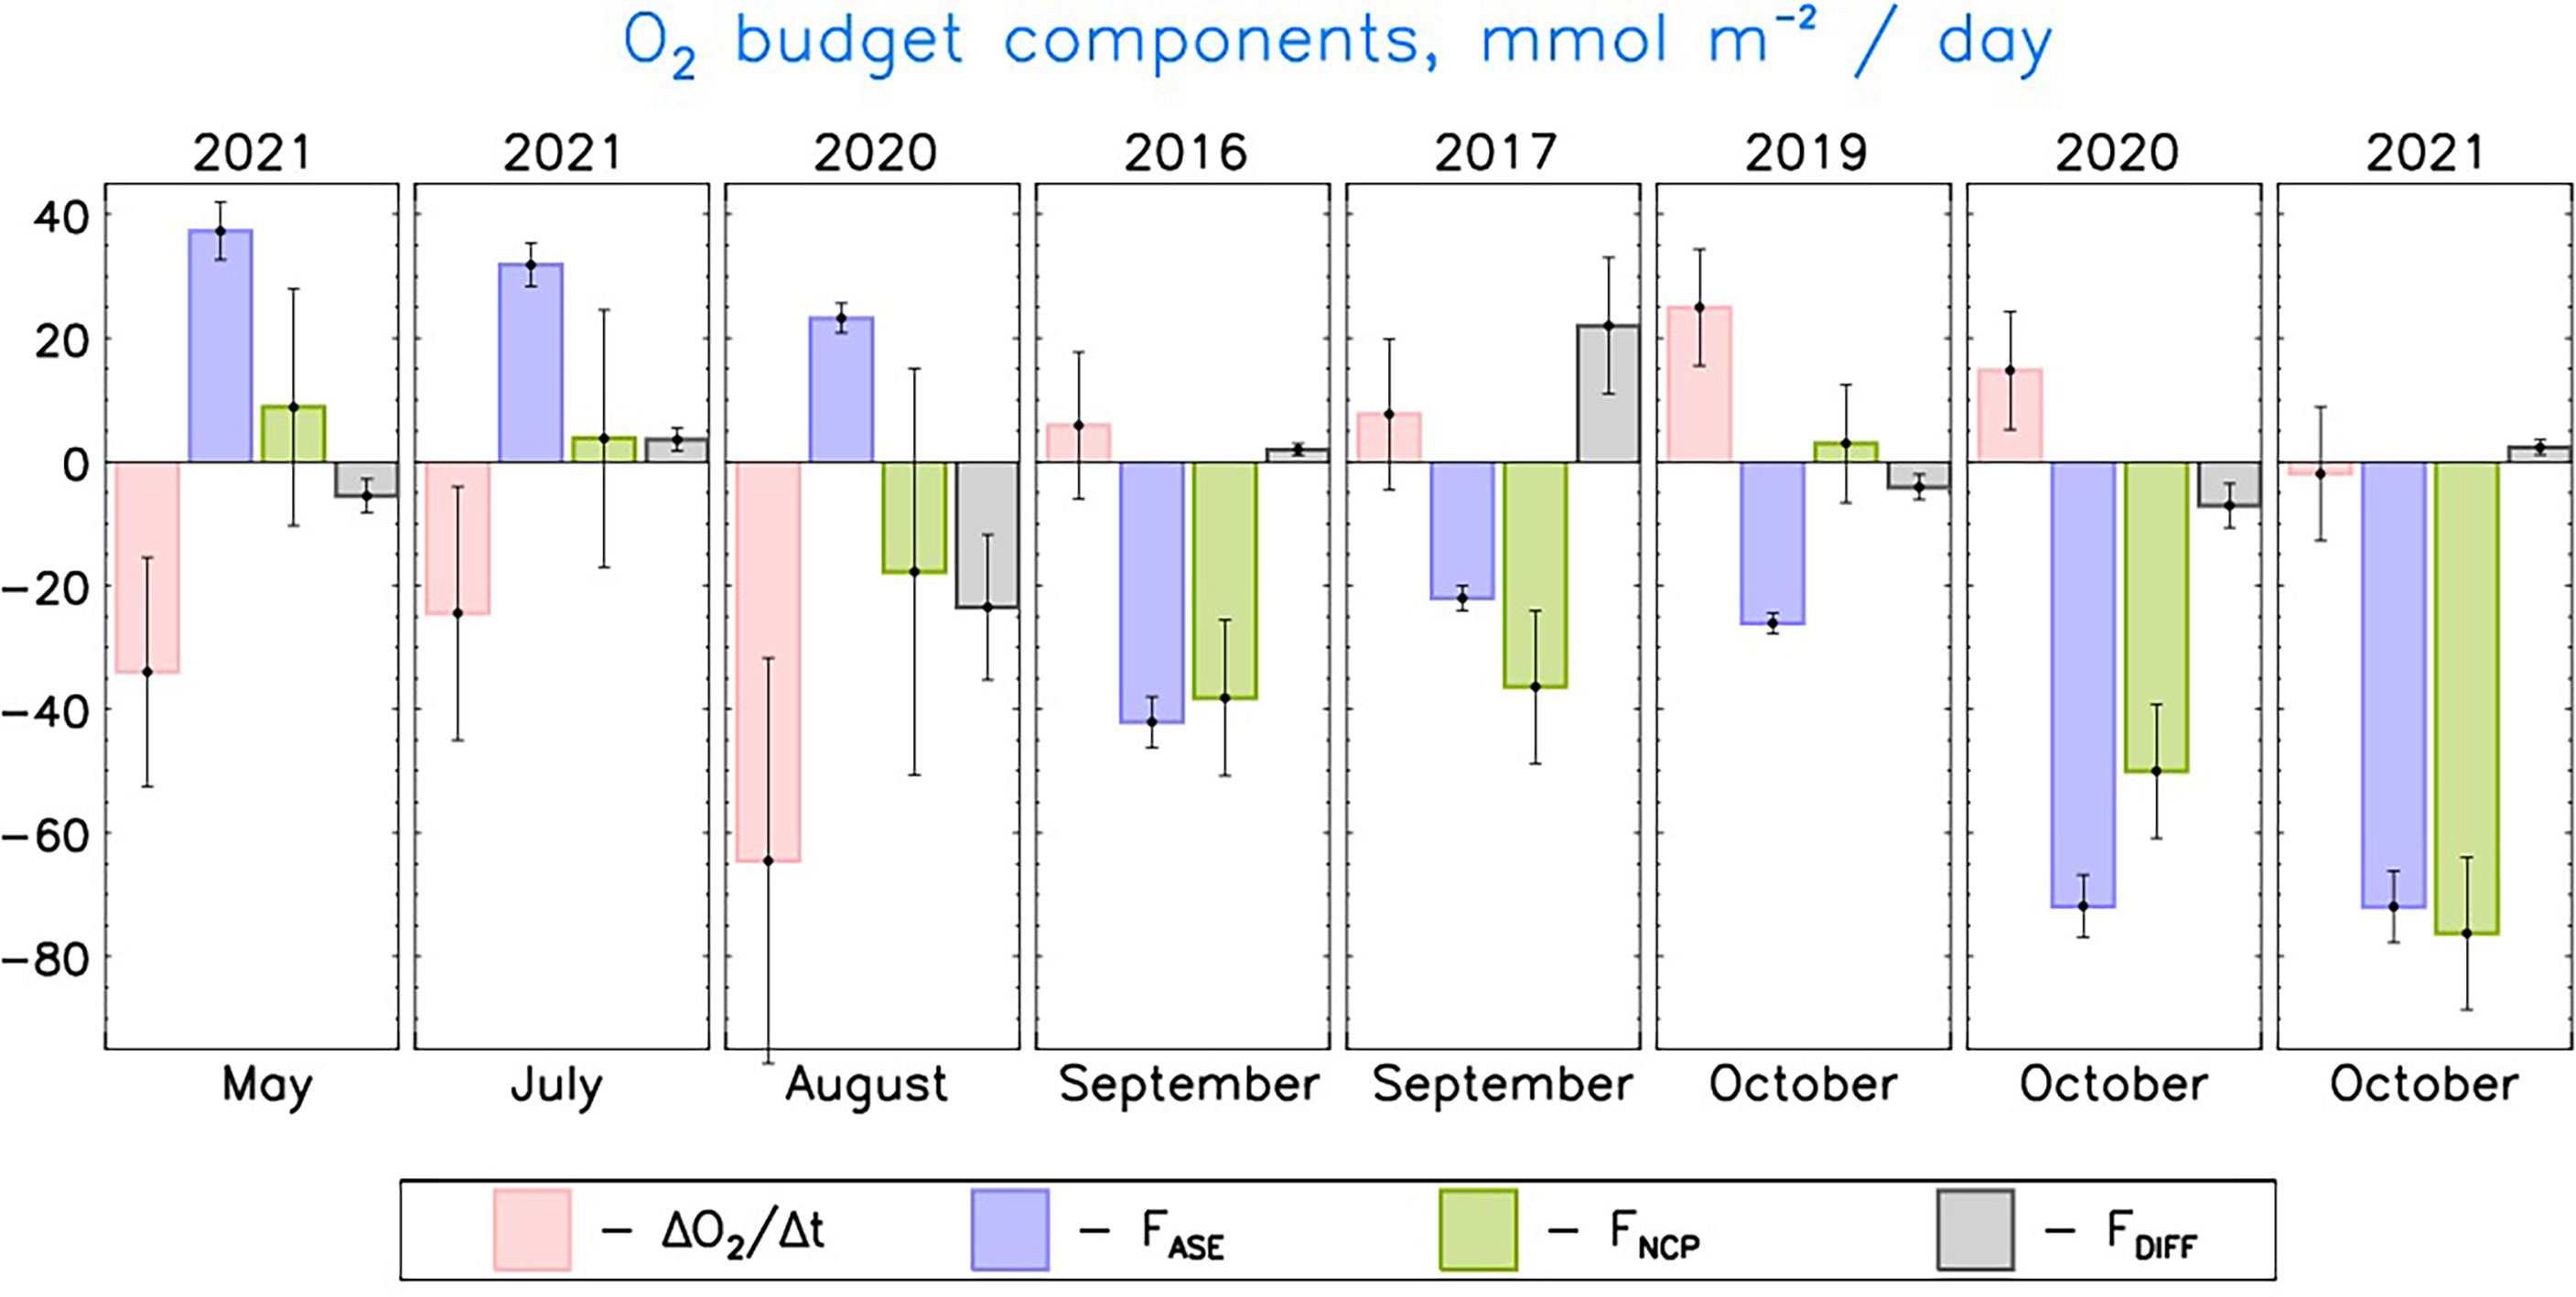
Figure 11 O2 budget inventories in the surface mixed layer for eight glider surveys. At the bottom of each panel, month identifies time with maximum data coverage during each survey. The order of panels is chosen to follow the seasonal cycle. Estimates of surface fluxes are means based on five parameterizations of gas transfer velocity (Section 3e). Note that negative FASE results in a positive addition of oxygen to the surface mixed layer; this sign convention is illustrated as follows: May 2021 shows a small positive FNCP (contributing positive to that is counterbalanced by a positive FASE (contributing negative to that results in a net negative .Negative FDIFF results in a positive addition of oxygen to the surface mixed layer from the deeper layers.
Discussion and Concluding Remarks
Recent (2016-2021) glider observations complemented by shipborne surveys from the 1950s-2010s provided critically important information about changes in the Bothnian Sea. Particularly, we evaluated the rate of warming and freshening in several layers of the basin and showed that upper ocean warming of 0.3°C/decade was sufficient to explain ~40% of the oxygen depletion since the mid-1950s. This depletion was driven by limited saturation capacity of the SML waters caused by warming and weakening of the surface oxygen flux during the spring bloom (see Figure 11). Below the SML, the role of warming in oxygen depletion decreased to less than 30% whereas the role of freshening in establishing stronger stratification that presumably reduced local ventilation across the basin’s halocline became an increasingly important driver of the observed oxygen depletion.
Another potentially important finding that was revealed by the glider data was the observation of a subsurface oxygen minimum that was particularly pronounced in late summer at the thermocline (Figure S5). The existence of such a minimum zone has been indicated in the past (Raateoja et al., 2010), but glider data shows its temporal and spatial variability. This phenomenon deserves more detailed research as it may be useful, if linked with production periods like the cyanobacterial blooms, as an important biochemical indicator showing, for example, active remineralization of nutrients, which can promote the growth of mobile phytoplankton species at the surface (Raateoja et al., 2010). This phytoplankton community change may have direct consequences on higher trophic levels through zooplankton, but the specific pathways of this process remain largely unknown.We should note that the findings reported here are subject to several caveats. For example, strong spatial variability blended with temporal changes limits the utility of our oxygen inventory analysis based on snapshots of spatially distributed glider observations. We mitigated this effect by removing spatial anomalies derived from oxygen climatology; however, the residuals caused by particular spatial distributions of oxygen concentrations during each glider survey may still be significant. Another potential weakness of our analysis is the lack of reliable long-term observations of exchanges through lateral boundaries of the basin that makes our analysis of potential causes of the oxygen depletion in the deeper layers of the Bothnian Sea difficult. This is particularly true, considering a wide seasonal range of salinities found in the deeper part of the water column which may be attributed to increased influx of saltier, denser, and less oxygenated waters of the Baltic Sea proper into the Bothnian Sea in fall and winter months (Figures S5, S6). Lack of winter observations precluded us from establishing the complete seasonal cycle of oxygen in the SML and, as a result, limited our ability to properly deduce the role of surface oxygen fluxes in oxygen depletion in the Bothnian Sea in recent years.These limitations and lack of consensus on the driving forces for the observed oxygen depletion (discussed in the previous section) may be partially reduced via expanded multidisciplinary observations and advanced modeling efforts. The current state of modeling allows meaningful estimates of water exchanges between the Bothnian Sea and surrounding basins. Modeling results may also be critical in separating spatial and temporal variations. Biogeochemical modeling may help establish a seasonal cycle of oxygen and other important geochemical constituents of the basin. Modeling is widely used to examine the future evolution of the physical and biogeochemical components of the global and regional climate systems (e.g., Meier et al., 2011; Meier et al., 2022a) and to separate the effect of climate change from natural variations (e.g., Meier et al., 2021b). Thus, a synergistic combination of modeling and extensive observational approaches should be utilized in future studies to refine the effects of climate change in the Bothnian Sea.Considering the control of eutrophication effects in the Bothnian Sea, our results deliver an important message in relation to the potential ecosystem changes. The Baltic Sea target values for minimum oxygen conditions are based on the disturbance to the life of benthic animals by hypoxia, and, in the extreme case, by the massive internal loading of nutrients from sediments by severe hypoxia and total anoxia (Carstensen et al., 2014). The threshold for effective hypoxia in the Baltic Sea is considered to be about 1.5 mL L-1 (2 mg L-1) for the benthos (Carstensen et al., 2014). Carstensen et al. (2014) also pointed out the relevance of episodic hypoxic conditions to benthic communities. As the concentrations of dissolved oxygen have noticeably reduced in the Bothnian Sea, and a considerable part of this decline is due to physical factors, there is less room for biological oxygen consumption in the deep layers and sediment. The Bothnian Sea phytoplankton biomass has doubled during recent decades (Kuosa et al., 2017). Furthermore, the loading of dissolved organic matter from land has a connection to deep water oxygen in the Bothnian Sea (Ahlgren et al., 2017). Thus, the present threshold values for the Bothnian Sea primary productivity, which are related to the amount of settling matter and bacterial respiration, may be too high considering the recent trend in oxygen conditions. Dissolved organic matter has no target value as we know too little about its dynamics.
The observed values in deep layers, even the lowest ones, are not critical as they are well above the 2 mL L-1 threshold for hypoxia (e.g., Levin et al., 2009). However, the trend should be considered as an early warning sign to be carefully heeded, particularly because the existing future projections of the oxygen levels in the Bothnian Sea suggest the loss of several mL L-1 of the dissolved oxygen by 2099 (Meier et al., 2012). Moreover, we present data, in addition to oxygen trends and the effect of physical changes on them, regarding the oxygen deficit (missing oxygen relative to a fully saturated water column). This is an important aspect of Bothnian Sea protection as deep layer oxygen status can only be controlled by effective measures against excessive eutrophication on the segment of non-physical changes. At the same time, episodic, annually occurring, or persistent oxygen depletion may have crucial impacts on the Bothnian Sea ecosystem if hypoxia in the deep eater layers reaches severe levels. If we fail to manage the nutrient and dissolved carbon status of the basin, the decline of oxygen conditions may reach critical values during the next decades. The response of the system is very sluggish, which means turning the trend back takes a long time. In fact, some estimates suggest a good environmental status in the Bothnian Sea is not yet achievable until the year 2100 with the present nutrient loading target setting (Murray et al., 2019). Thus, enhancement of observational networks and the current physical and biogeochemical models is a high priority if we are to meet these challenges and develop a reliable monitoring system of the Bothnian Sea.
Data Availability Statement
The original contributions presented in the study are included in the article/Supplementary Material. Further inquiries can be directed to the corresponding author. The data associated with this paper are available from the authors upon request.
Author Contributions
All authors contributed to research and writing the manuscript.
Funding
The United States NSF grants (AON-1203473, AON-1724523, AON-1947162, and 1708427), ONR grant (N00014-21-1-2577), and the Academy of Finland project WindySea (348587).
Conflict of Interest
The authors declare that the research was conducted in the absence of any commercial or financial relationships that could be construed as a potential conflict of interest.
Publisher’s Note
All claims expressed in this article are solely those of the authors and do not necessarily represent those of their affiliated organizations, or those of the publisher, the editors and the reviewers. Any product that may be evaluated in this article, or claim that may be made by its manufacturer, is not guaranteed or endorsed by the publisher.
Acknowledgments
IP acknowledges support from Fulbright Finland Foundation. The Finnish Environment Ministry financed the participation of HK from its Water Protection Programme project ‘Maameri’. The study utilized FMI marine research infrastructure as part of the national FINMARI RI consortium as well as the Euro-Argo and GROOM research infrastructures. We acknowledge the use of ICES, HELCOM COMBINE, and SeaDataNet data.
Supplementary Material
The Supplementary Material for this article can be found online at: https://www.frontiersin.org/articles/10.3389/fmars.2022.917879/full#supplementary-material
References
Ahlgren J., Grimvall A., Omstedt A., Rolff C., Wikner J. (2017). Temperature, DOC Level and Basin Interaction Explain Declining Oxygen Concentrations in the Bothnian Sea. J. Mar. Syst. 170, 22–30. doi: 10.1016/j.jmarsys.2016.12.010
Algesten G., Brydsten L., Jonsson P., Kortelainen P., Löfgren S., Rahm L., et al. (2006). Organic Carbon Budget for the Gulf of Bothnia. J. Mar. Syst. 63, 155–161. doi: 10.1016/j.jmarsys.2006.06.004
Algesten G., Wikner J., Sobek S., Tranvik L. J., Jansson M. (2004). Seasonal Variation of CO2 Saturation in the Gulf of Bothnia: Indications of Marine Net Heterotrophy. Global Biogeochemical Cycles 18, GB4021. doi: 10.1029/2004GB002232
Alkire M. B., D’Asaro E., Lee C., Perry M. J., Gray A., Cetinic I., et al. (2012). Estimates of Net Community Production and Export Using High-Resolution, Lagrangian Measurements of O2, NO3-, and POC Through the Evolution of a Spring Diatom Bloom in the North Atlantic. Deep-Sea Res. I 64, 157–174. doi: 10.1016/j.dsr.2012.01.012
Bushinsky S. M., Emerson S. (2015). Marine Biological Production From in Situ Oxygen Measurements on a Profiling Float in the Subarctic Pacific Ocean. Global Biogeochem Cycles 29, 2050–2060. doi: 10.1002/2015GB005251
Carstensen J., Conley D. J., Bonsdorff E., Gustafsson B. G., Hietanen S., Janas U., et al. (2014). Hypoxia in the Baltic Sea: Biogeochemical Cycles, Benthic Fauna, and Management. Ambio 43 (1), 26–36. doi: 10.1007/s13280-013-0474-7
Conley D. J., Björck S., Bonsdorff E., Carstensen J., Destouni G., Gustafsson B. G., et al. (2009). Hypoxia Related Processes in the Baltic Sea. Environ. Sci. Technol. 43, 3412–3420. doi: 10.1021/es802762a
Conley D. J., Humborg C., Rahm L., Savchuk O. P., Wulff F. (2002). Hypoxia in the Baltic Sea and Basin-Scale Changes in Phosphorus Biogeochemistry. Environ. Sci. Technol. 36, 5315–5320. doi: 10.1021/es025763w
Drucker R., Riser S. C. (2016). In Situ Phase-Domain Calibration of Oxygen Optodes on Profiling Floats. Methods Oceanography 17, 296–318. doi: 10.1016/j.mio.2016.09.007
Fleming-Lehtinen V., Laamanen M. (2012). Long-Term Changes in Secchi Depth and the Role of Phytoplankton in Explaining Light Attenuation in the Baltic Sea. Estuarine Coast. Shelf Sci. 102–103, 1–10. doi: 10.1016/j.ecss.2012.02.015
Garcia H. E., Gordon L. I. (1992). Oxygen Solubility in Seawater: Better Fitting Equations. Limnol. Oceanogr. 37, 1307–1312. doi: 10.4319/lo.1992.37.6.1307
Gutiérrez-Loza L., Wallin M. B., Sahlée E., Holding T., Shutler J. D., Rehder G., et al. (2021). Air–sea CO2 Exchange in the Baltic Sea—A Sensitivity Analysis of the Gas Transfer Velocity. J. Mar. Syst. 222, 103603. doi: 10.1016/j.jmarsys.2021.103603
Haapala J., Alenius P. (1994). Temperature and Salinity Statistics for the Northern Baltic Sea 1961 – 1990. Finnish Mar. Res. 262, 51–121.
Harvey E. T., Walve J., Andersson A., Karlson B., Kratzer S. (2019). The Effect of Optical Properties on Secchi Depth and Implications for Eutrophication Management. Front. Mar. Sci. 5. doi: 10.3389/fmars.2018.00496
Humborg C., Geibel M. C., Sun X., McCrackin M., Mörth C.-, Stranne C., et al. (2019). High Emissions of Carbon Dioxide and Methane From the Coastal Baltic Sea at the End of a Summer Heat Wave. Front. Mar. Sci. 6. doi: 10.3389/fmars.2019.00493
Jokinen S. A., Virtasalo J. J., Jilbert T., Kaiser J., Dellwig O., Arz H. W., et al. (2018). A 1500-Year Multiproxy Record of Coastal Hypoxia From the Northern Baltic Sea Indicates Unprecedented Deoxygenation Over the 20th Century. Biogeosciences 15, 3975–4001. doi: 10.5194/bg-15-3975-2018
Kõuts M., Maljutenko I., Elken J., Liu Y., Hansson M., Viktorsson and U. Raudsepp L. (2021). Recent Regime of Persistent Hypoxia in the Baltic Sea.Environmental Research Communications, 3, 075004. doi: 10.1088/2515-7620/ac0cc4
Kuliński K., Rehder G., Asmala E., Bartosova A., Carstensen J., Gustafsson B., et al. (2022). Biogeochemical Functioning of the Baltic Sea. Earth Syst. Dynam. 13, 633–685. doi: 10.5194/esd-13-633-2022
Kuosa H., Fleming-Lehtinen V., Lehtinen S., Lehtiniemi M., Nygard H., Raateoja M., et al. (2017). A Retrospective View of the Development of the Gulf of Bothnia Ecosystem. J. Mar. Syst. 167, 78–92. doi: 10.1016/j.jmarsys.2016.11.020w
Levin L. A., Ekau W., Gooday A. J., Jorissen F., Middelburg J. J., Naqvi W., et al. (2009). Effects of Natural and Human-Induced Hypoxia on Coastal Benthos. Biogeosciences Discussions 6, 3563–3654. doi: 10.5194/bgd-6-3563-2009
Liblik T., Lips U. (2019). Stratification has Strengthened in the Baltic Sea – an Analysis of 35 Years of Observational Data. Front. Earth Sci. 7, 174. doi: 10.3389/feart.2019.00174
Meier H. E. M., Andersson H. C., Eilola K., Gustafsson B. G., Kuznetsov I., Müller-Karulis B., et al. (2011). Hypoxia in Future Climates: A Model Ensem- Ble Study for the Baltic Sea. Geophys. Res. Lett. 38, : Volume 13, pages 457–593. L24608. doi: 10.1029/2011GL049929
Meier H. E. M., Dieterich C., Groüger M. (2021b). Natural Variability is a Large Source of Uncertainty in Future Projections of Hypoxia in the Baltic Sea. Commun. Earth Environ. 2, 50. doi: 10.1038/s43247-021-00115-9
Meier H. E. M., Dietrich C., Groüger M., Dutheil C., Boürgel F., Safonova K., et al. (2022a). Oceanographic Regional Climate Projections for the Baltic Sea Until 2100. Earth System Dynamics 13, 159–199. doi: 10.5194/esd-13-159-2022
Meier H. E. M., Eilola K., Almroth-Rosell E., Schimanke S., Kniebusch M., Höglund A., et al. (2019). Disentangling the Impact of Nutrient Load and Climate Changes on Baltic Sea Hypoxia and Eutrophication Since 1850. Clim. Dyn. 53, 1145–1166. doi: 10.1007/s00382-018-4296-y
Meier H. E. M., Hordoir R., Andersson H. C., Dieterich C., Eilola K., Höglund A., et al. (2012). Modeling the Combined Impact of Changing Climate and Changing Nutrient Loads on the Baltic Sea Environment in an Ensemble of Transient Simulations for 1961–2099. Clim. Dyn. 39, 2421–2441. doi: 10.1007/s00382-012-1339-7
Meier H. E. M., Kniebusch M., Dieterich C., Gröger M., Zorita E., Elmgren R., et al. (2022b). Climate Change in the Baltic Sea Region: A Summary. Earth Syst. Dynam. 13, 457–593. doi: 10.5194/esd-13-457-2022
Meier H. E. M., Väli G., Naumann M., Eilola K., Frauen C. (2018). Recently Accelerated Oxygen Consumption Rates Amplify Deoxygenation in the Baltic Sea. J. Geophys. Res. Oceans 123, 3227–3240. doi: 10.1029/2017JC013686
Murray C. J., Müller-Karulis B., Carstensen J., Conley D. J., Gustafsson B. G., Andersen J. H. (2019). Past, Present and Future Eutrophication Status of the Baltic Sea. Front. Mar. Sci. 6. doi: 10.3389/fmars.2019.00002
Myrberg K., Andrejev O. (2006). Modelling of the Circulation, Water Exchange and Water Properties of the Gulf of Bothnia. Oceanologia 48 (S), 55–74.
Raateoja M. (2013). Deep-Water Oxygen Conditions in the Bothnian Sea. Boreal Environ. Res. 18, 235–249.
Raateoja M., Kuosa H., Flinkman J., Pääkkönen J.-P., Perttilä M. (2010). Late Summer Metalimnetic Oxygen Minimum Zone in the Northern Baltic Sea. J. Mar. Syst. 80, 1–7. doi: 10.1016/j.jmarsys.2009.06.005
Rutgersson A., Kjellström E., Haapala J., Stendel M., Danilovich I., Drews M., et al. (2022). Natural Hazards and Extreme Events in the Baltic Sea Region. Earth Syst. Dynam. 13, 251–301. doi: 10.5194/esd-13-251-2022
Siegel H., Gerth M., 2016. Development of Sea Surface Temperature in the Baltic Sea in 2018. HELCOM Baltic Sea Environment Fact Sheets2020. http://www.helcom.fi/baltic-seatrends/environment-fact-sheets/.
Stigebrandt A. (1991). Computations of Oxygen Fluxes Through the Sea Surface and the Net Production of Organic Matter With Application to the Baltic and Adjacent Seas. Limnology Oceanography 36, 444–454. doi: 10.4319/lo.1991.36.3.0444
Stigebrandt A., Aure J., Molver J. (1996). Oxygen Budget Methods to Determine the Vertical Flux of Particulate Organic Matter With Application to the Coastal Waters Off Western Scandinavia. Deep-Sea Res. II 43 (1), 7–21. doi: 10.1016/0967-0645(95)00077-1
Thierry V., Bitting H., Gilbert D., Kobayashi T., Kanako S., Schmid C. (2021). Processing Argo Oxygen Data at the DAC Level. Argo. v2.3.2 doi: 10.13155/39795
Tuomi L., Miettunen E., Alenius P., Myrberg K. (2018). Evaluating Hydrography, Circulation and Transport in a Coastal Archipelago Using a High-Resolution 3D Hydrodynamic Model. J. Mar. Syst. 180, 24–36. doi: 10.1016/j.jmarsys.2017.12.006
Uotila P., Vihma T., Haapala J., & (2015). Atmospheric and oceanic conditions and the extremely low Bothnian Bay sea ice extent in 2014/2015. Geophysical Research Letters, 42(18), 7740–7749. doi:10.1002/2015GL064901
Westerlund A., Miettunen E., Tuomi L., Alenius P. (2022). Refined Estimates of Water Transport Through the Åland Sea in the Baltic Sea. Ocean Sci. 18, 89–108. doi: 10.5194/os-18-89-2022
Keywords: Bothnian Sea, oxygen depletion, mechanisms, climate change, physical environment
Citation: Polyakov IV, Tikka K, Haapala J, Alkire MB, Alenius P and Kuosa H (2022) Depletion of Oxygen in the Bothnian Sea Since the Mid-1950s. Front. Mar. Sci. 9:917879. doi: 10.3389/fmars.2022.917879
Received: 11 April 2022; Accepted: 06 June 2022;
Published: 19 July 2022.
Edited by:
Qiang Wang, Alfred Wegener Institute Helmholtz Centre for Polar and Marine Research (AWI), GermanyReviewed by:
Urmas Lips, Tallinn University of Technology, EstoniaGermo Väli, Tallinn University of Technology, Estonia
Copyright © 2022 Polyakov, Tikka, Haapala, Alkire, Alenius and Kuosa. This is an open-access article distributed under the terms of the Creative Commons Attribution License (CC BY). The use, distribution or reproduction in other forums is permitted, provided the original author(s) and the copyright owner(s) are credited and that the original publication in this journal is cited, in accordance with accepted academic practice. No use, distribution or reproduction is permitted which does not comply with these terms.
*Correspondence: Igor V. Polyakov, aXZwb2x5YWtvdkBhbGFza2EuZWR1