 Munandar Samidon1,2
 Nanda Muhammad Razi3
 Muhammad Agustiar3
 Puad Batari Harahap3
 Nurul Najmi2
 Samsul Bahri2
 Shang Yin Vanson Liu1,4,5*
- 1Department of Marine Biotechnology and Resources, National Sun Yat-sen University, Kaohsiung City, Taiwan
- 2Department of Marine Science, Teuku Umar University, Aceh Barat, Indonesia
- 3Ocean Diving Club, Faculty of Marine and Fisheries, Syiah Kuala University, Banda Aceh, Indonesia
- 4Doctoral Degree Program in Marine Biotechnology, National Sun Yat-Sen University, Kaohsiung City, Taiwan
- 5Graduate Institute of Natural Products College of Pharmacy, Kaohsiung Medical University, Kaohsiung City, Taiwan
Calcium carbonate (CaCO3) is the main component of the skeleton of scleractinian corals and is a preferable substrate for attachment and growth. An electro-stimulation method based on the electrolysis of seawater, which generates calcium and magnesium minerals as a crystalline coating over artificial metal structures, was used to boost coral growth during the 1970s. Few studies have attempted to compare survival and growth between electro-stimulated corals and non-electro-stimulated corals in situ. In this study, we used 2D image analysis to quantify the growth of branching and massive corals on electro-stimulated structures. Among four metallic structures that were deployed in Sabang, Aceh, Indonesia, three were electro-stimulated (12 V) and one was used as a control. Two branching corals (Acropora gemmifera and Pocillopora verrucosa) and two massive coral species (Porites murrayensis and Porites lobata) were selected. A total of 256 fragments, comprising 128 fragments derived from two branching species and 128 fragments derived from two massive species, were randomly dispatched to each structure. Underwater photographs were taken at three intervals from August 2019 to December 2020. The results showed that the survival rates (excluding lost fragments) of branching corals under electro-stimulation were approximately 19% higher than massive. However, no significant difference was found between the survival rates of the treatment and control groups for both branching and massive corals. Furthermore, we found that under electro-stimulation, branching corals grew faster than controls but not massive. Our study provides pieces of evidence for the potential use of electrochemical processes in stimulating the growth of branching corals.
1 Introduction
Coral reefs are one of the most productive and diverse ecosystems in shallow water, providing important ecological services for the benefit of humans, including coastal protection, sources of new drugs derived from natural compounds of marine organisms, and tourism (Hoegh-Guldberg et al., 2007; Coutinho et al., 2016). However, this ecosystem is currently suffering a dramatic decline due to anthropogenic and environmental threats (Gardner et al., 2003). Consequently, more efforts have been focused on various methods of reef rehabilitation and management. Of these methods, coral transplantation is one of the most cost-effective options (Edwards, 2010).
When reef ecosystems are threatened by pollution, reclamation, or other human activities, coral transplantation can be useful in efforts to promote ecosystem recovery (Edwards and Clark, 1999). Transplantation activities have been carried out by practitioners, researchers, and government agencies coupled with different approaches to rehabilitate coral reefs, including direct transplantation from healthy reefs to artificial structures or degraded habitats, coral gardening (the culture of coral larvae or fragments prior to transplantation), and the use of electro-stimulated structures to boost coral growth on the structure (Goreau, 2012).
Among these methods, the electro-stimulated method, invented and developed by Prof. Wolf Hilbertz and Dr. Thomas J. Goreau, has demonstrated the formation of a calcium and magnesium crystalline coating over artificial structures, which can enhance the growth of coral transplants attached to the structure (Hilbertz and Goreau, 1996). The mineral coating, largely consisting of aragonite (CaCO3) and brucite (Mg(OH)2), is similar to reef limestone in terms of chemical and physical properties, perhaps providing a suitable artificial substrate for coral growth. Ambient pH is a crucial factor in determining whether the polymorph coating on the structure will be deposited. Additionally, higher currents caused the growth of the mineral brucite, or magnesium hydroxide, which is soft and tends to easily break off. Minerals formed at a low electric rate could generate robust limestone rather than soft brucite (Goreau, 2012). Several investigations have shown an increasing growth rate of corals on the electro-stimulated structures (Goreau et al., 2004; Goreau and Hilbertz, 2005; Terlouw, 2012). Other studies have shown an increase in the survival rates of coral and oyster species (Piazza et al., 2009; Jompa et al., 2012).
Various methods have been developed to quantify coral growth, including dried weight, buoyant weight, planar area, and volume estimation. For the dried weight estimation, it must sacrifice the fragments to obtain the calcification rate as a proxy to represent coral growth rate (Roik et al., 2016). Therefore, it is unsuitable for studies that aim to monitor the growth of living corals. Alternatively, the buoyant weight estimation is a less invasive method to measure the coral growth (Herler and Dirnwöber, 2011). Nevertheless, this approach is not suitable for corals that are fixed on the substrate as the fragment must be detached for the following measurement (Orejas et al., 2011). Other non-invasive methods, such as measuring the volume of a colony by using computed tomography (CT) or 3D modeling (Laforsch et al., 2008; Naumann et al., 2009), require costly equipment such as a CT scanner or computing workload, which may not be readily available (Lavy et al., 2015). In contrast, linear measurements (length, breadth, and height) are widely used and reported as they are easy to conduct (Mohammed et al., 2017). However, the linear growth measurement may not represent the actual growth, and measurement with a vernier caliper underwater lacks accuracy. Additionally, this approach may overestimate growth while the colonies suffer partial mortality (Kikuzawa et al., 2018). In comparison with the linear measurement method, two-dimensional image analysis is an alternative method to counteract the downsides of the linear method (Bythell et al., 2001; Burns et al., 2015).
Previously, attempts to quantify the effect of electro-stimulated structures on coral growth have mainly used vernier calipers to measure the increment of fragment length to infer the growth of coral transplants on electro-stimulated structures (Romatzki, 2014; Natasasmita et al., 2016). Measuring length using a vernier caliper in situ is of limited accuracy and may overlook the effect of partial mortality on coral growth. Although using 3D approach on coral growth in situ is a global trend (House et al., 2018), 2D approach could still act as a practical proxy for rapid, inexpensive, remote field studies (Neal et al., 2015). In this study, we designed and installed four metallic structures in Sabang, Aceh. Three of the structures were equipped with an electrical stimulation system (12V), and one structure was without electrical stimulation as a control. This study used 2D image analysis to measure the effect of electro-stimulation on coral growth. In total, 256 coral fragments originated from two branching and two massive coral species were transplanted onto metallic structures.
2 Materials and methods
2.1 Study area
This study was conducted in a sea ecotourism park (Taman Wisata Alam Laut-TWAL), Sabang, province of Aceh (Figure 1), which covers an area of 2,600 ha. The coral reefs in Sabang waters are in good condition, with an average coral coverage of 41.99% (Utama and Budiyanto, 2017). Eighty-two species, 31 genera, and 13 families of coral were recorded by Utama and Hadi (2018). In the SW monsoon period, the average sea surface temperature varies in the range of 29 to 30.2°C. Meanwhile, the average SST during the NE monsoon is in the range of 28.6 to 29°C (Imanullah et al., 2019).
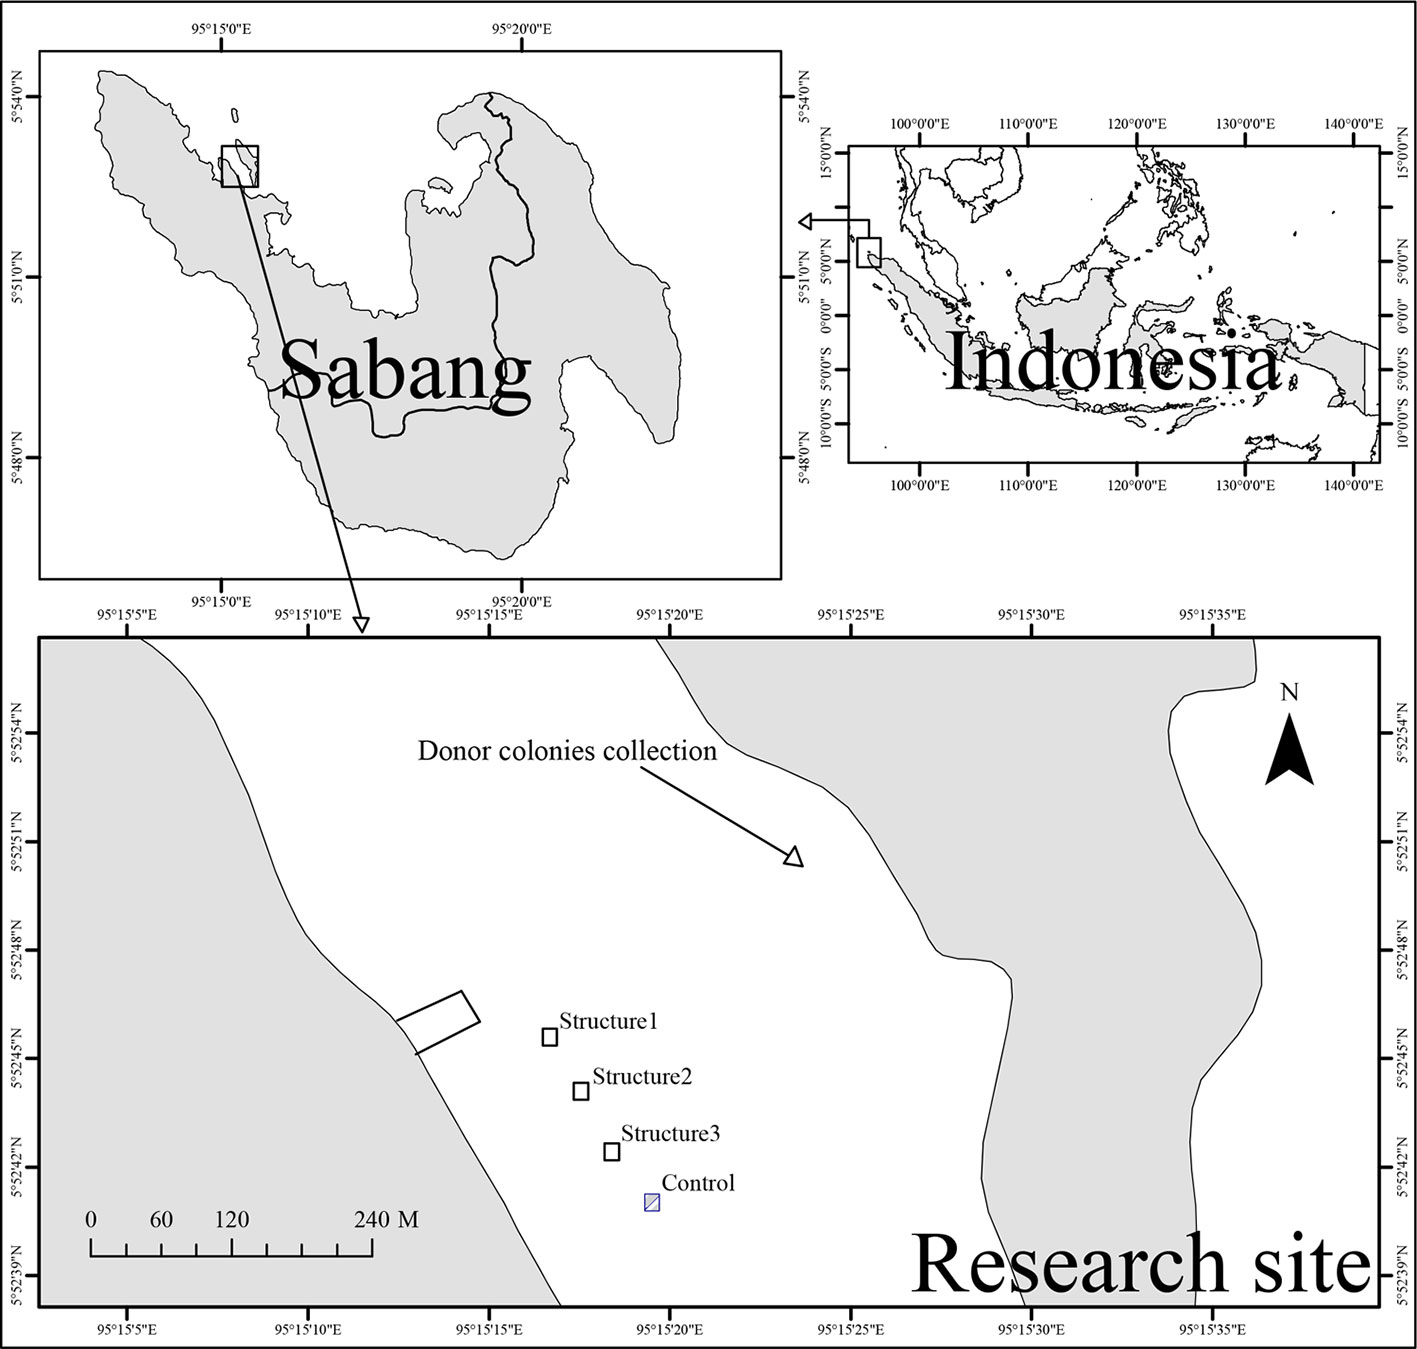
Figure 1 Map of experimental location.
2.2 Experimental design
2.2.1 Electrical stimulation modules
We used a power source that was generated from three solar modules, DEKADE 100WP 12 V Monocrystalline. This provides a constant feed of electricity to charge the three batteries. Then, batteries will supply the power to the structure through the controller. We used a controller to regulate the amount of voltage and current that flowed to the structure, with a 12 V and 3 A output setting. The module can run constantly throughout the study period. This project collaborated with local villagers who helped do the maintenance during the experimental period. The metallic structure served as the cathode and titanium mesh (1 m × 1 m) placed underneath the metallic structure was used as the anode (as shown in Figures 2A, B). Four metallic structures (5.4 m × 5 m × 0.8 m) were assembled and installed on a sandy bottom at 5 m depth (Figures 3C, D), paralleling the coastline. The metallic structures of B1, B2, and B3 were used as electro-stimulation structures, and they served as a replication in this system, while one structure (C) served as a control (no electrical stimulation). The distance between the metallic structures was approximately 10 m. Unfortunately, due to the limited funding we got and the limited resources on the remote island, we were unable to set up an additional control structure to exclude the potential effect from the environment.
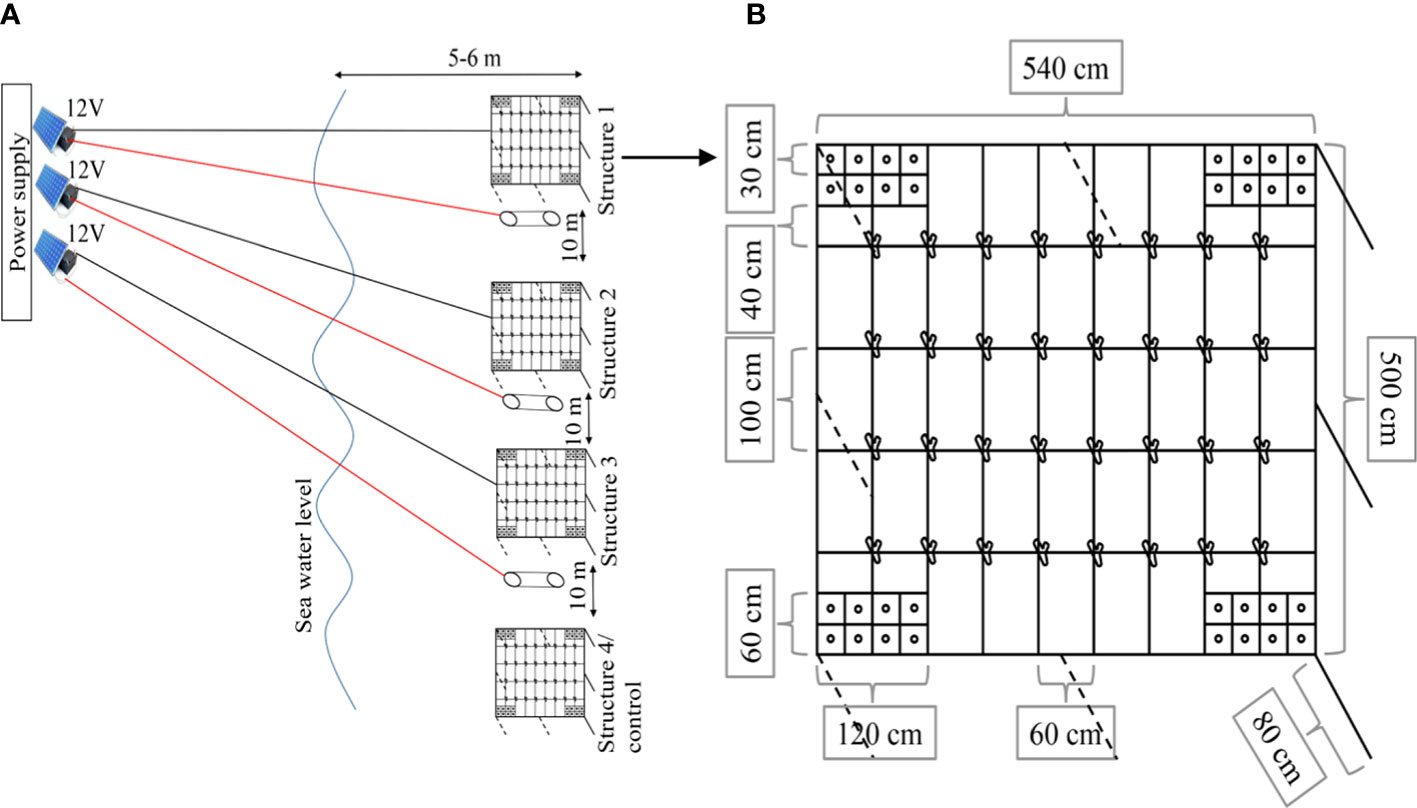
Figure 2 Design and setup of electro-stimulated structures for coral transplantation (A), the schematic of cathode structure with the positions for massive and branching transplants (B). All fragments were randomly distributed on structures with cable ties for branching (intersection between two iron bars) and epoxy for massive (metallic plate at four corners).
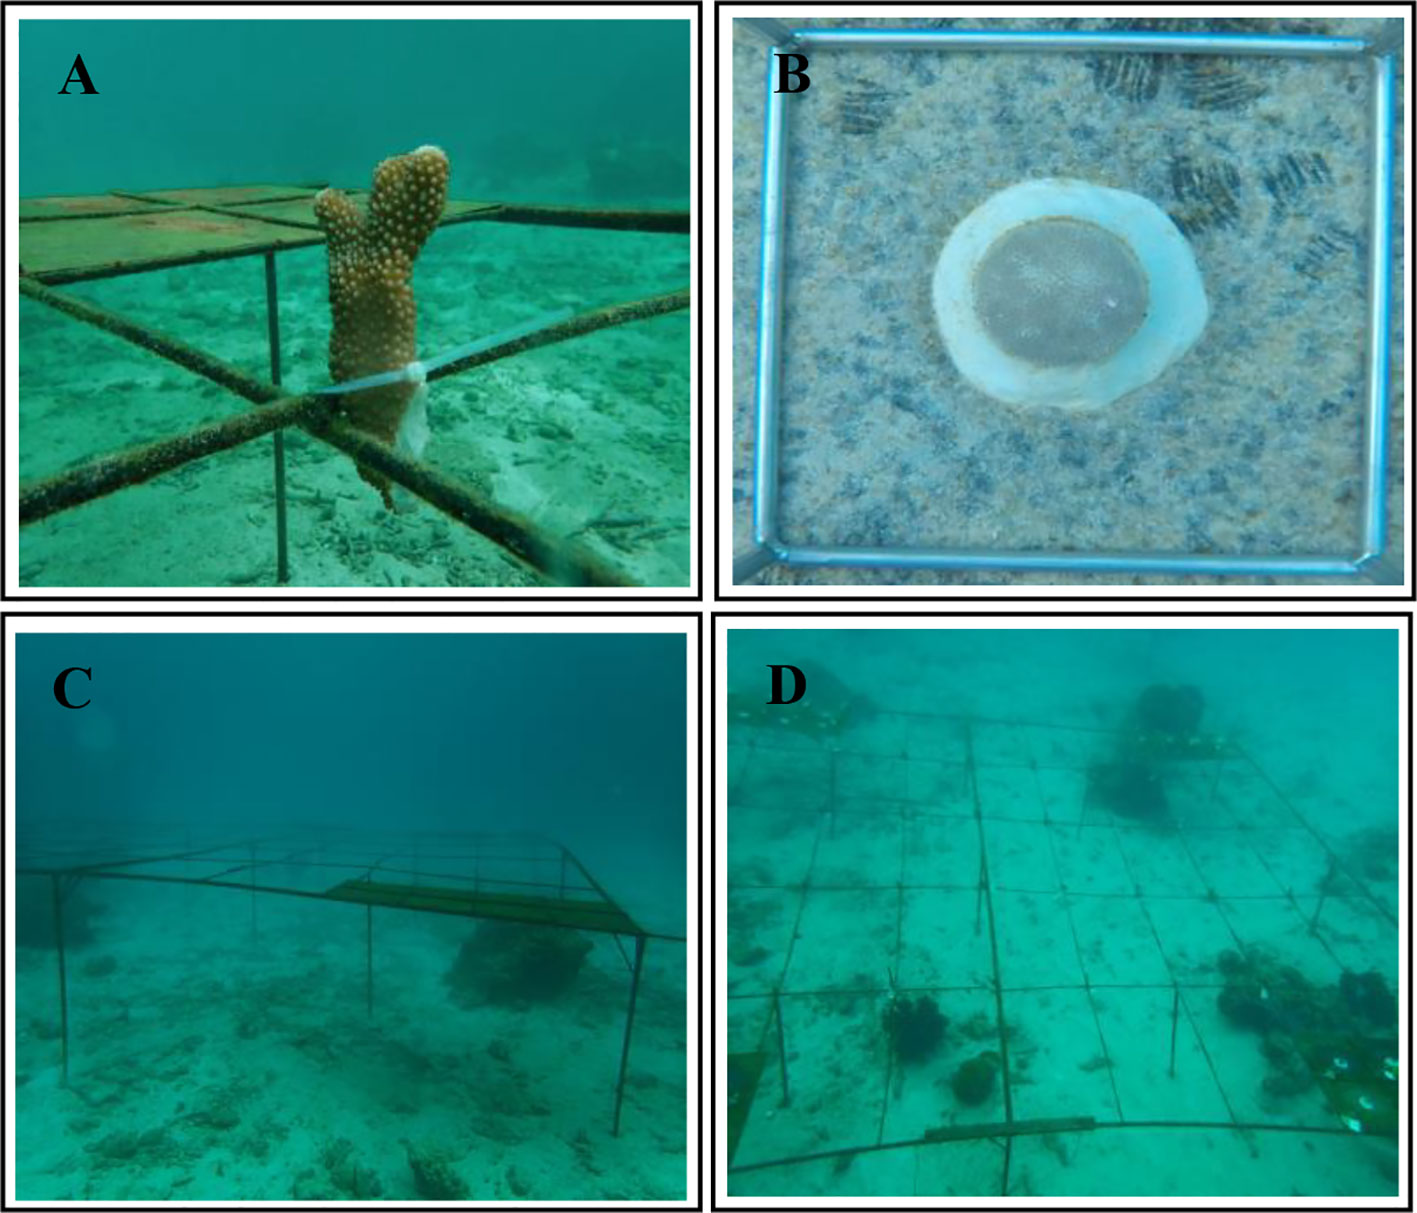
Figure 3 Branching coral fragments ranged in size 8-10 cm in length (A), massive fragments 3 cm in diameter (B), metallic structures (5.4m x 5m x 0.8m) were installed on sandy bottom at five m depth (C) and submerged metallic structure with coral transplants (D).
2.2.2 Corals transplantation
A survey was conducted to locate potential coral donor colonies. Donors were selected from a reef adjacent to the experimental site (~300 m away, Figure 1). Four species were chosen, including Acropora gemmifera (branching form), Pocillopora verrucosa (branching form), Porites murrayensis (massive form), and Porites lobata (massive form). For each species, four donor colonies were collected, and then 16 fragments were taken from each colony. Fragments derived from the same colony were randomly assigned to four structures (four fragments to each structure). A total of 64 fragments, including 32 fragments derived from two branching species and 32 fragments derived from two massive species, were transplanted and randomly dispatched onto each structure. Branching coral fragments ranged in size from 8–10 cm in length and massive fragments of 3 cm in diameter (Figures 3A, B). Branching fragments were cut from the donor colony by a bone cutter, while massive fragments were obtained using a Nemo hammer underwater drill (Nemo Power Tools Ltd., USA). Fragments from the same donor colony were placed in the same bucket filled with seawater to reduce the stress before transplantation. Furthermore, fragments were labeled for their identity and attached ton structures with cable ties for branching fragments (on the intersection of two iron bars) and epoxy for massive fragments (on the metallic plat at four corners of each structure).
2.2.3 Data collection
The GoPro 3+ Hero black edition (12 MP) with dive housing was used to take underwater photographs to monitor the coral growth on structures. All branching fragments were photographed with a fixed distance between the lenses and coral fragment (20 cm) by using an extension frame assembled with the housing, which also acts as a scale bar. Underwater photographs were taken by using a camera sitting on a PVC platform (80 cm × 80 cm × 1 cm), in which the central part was removed (15 cm in diameter) and two-sided photographs of each fragment were taken with a fixed distance from camera to fragment (20 cm) to obtain the mean planar area. For the massive coral, the GoPro3+ was mounted on a stainless frame (12 cm × 12 cm × 10 cm) to take a photograph from above.
ImageJ was used to calculate the planar area of transplants by analyzing their underwater photographs. By examining the color of the colony, we excluded the area with obvious partial mortality (covered by epifauna). We defined the bottom boundary of the fragment with the upper edge of the extension frame to select the area along the periphery of the coral fragment as its planar area. The average planar area of photographs from two sides was used to represent the planar area of each transplant for branching corals. Meanwhile, for the massive form, we calculated the planar area from the photograph taken from above, as we assumed these corals grow mainly in a horizontal direction.
We plan to conduct field monitoring from August 2019 to August 2020. The photograph collection was first conducted right after setting up the experiment in August 2019. The original plan was to monitor growth every four months throughout the year. However, soon after collecting photographs for the second monitoring event in December 2019 (first phase monitoring = T1, 4 months), the COVID-19 interrupted our ability to travel. We were unable to execute our original plan until December 2020, while the travel ban was lifted in the province of Aceh (second phase monitoring = T2, 12 months). Therefore, the third monitoring event was conducted one year after the second monitoring event.
2.3 Data analysis
2.3.1 Increment of planar area and growth rate
The increment of planar area of coral was determined by using the following formula (Ricker, 1975):
β, Coral planar area change (cm2);
Lt, Planar area measurement at periodical observation (cm2);
Lo, Planar area measurement at the beginning (cm2).
The growth rate of coral was determined by using the following formula:
P, Coral growth rate (cm2/month);
β, Coral planar area change (cm2);
t, Total observation time (month).
2.3.2 Statistical analysis
While the assumptions of normality and homoscedasticity were met, ANOVA was used to determine the effect of an electro-stimulated structure on the survival rate of coral. Then the Tukey’s HSD (Honestly Significant Differences) post-hoc test was employed to check for differences between e means. We used a t-test to check the differences between electro-stimulated and control structures on the increment and growth rate of corals. We also tested whether the increment was significantly different between species in the same growth form on electro-stimulated and control structures with a t-test. When the assumptions of normality and homoscedasticity were not met, the Kruskal–Wallis or Mann–Whitney test was performed instead. We analyzed the interspecific comparison derived from the growth rate of the last survey with split-plot ANOVA to determine whether the growth rate is significantly different between species as well as interaction between factors. The 5% significance level was applied to all tests. Statistical analyses were performed using SPSS 26.
3 Results
There were 256 coral fragments transplanted on electro-stimulated and control structures in the beginning. During the first monitoring, we found that the underwater cable was not well attached to the third structure, so we immediately fixed this issue. Additionally, at the last monitoring, one electro-stimulated structure was broken and upside down. Therefore, 64 fragments of the broken structure were excluded from most of the analyses, except the estimation of change in planar area for the first phase monitoring (T1). We also acknowledge that without having a replication of the control structure, we could not exclude the potential effect of the uncontrolled environment. However, all four structures are close to each other and it is unlikely to have a heterogeneous environment in a small area on the sandy bottom at the same depth. Therefore, in this study, we assumed the environment was stable over the experimental period.
3.1 Survival rate
3.1.1 Branching coral
Most fragments transplanted to electro-stimulated structures were alive after 16 months transplanted, except two A. gemmifera fragments that were found dead on treatment structures. The survival rate of A. gemmifera on electro-stimulated structures was 97%, while that of P. verrucosa was 100% (Figures 4A, B). There were no significant differences in the survival rates of A. gemmifera and P. verrucosa on electro-stimulated and control structures (Kruskal–Wallis, H = 2, p = 0.368 and H<0.001, p = 1).
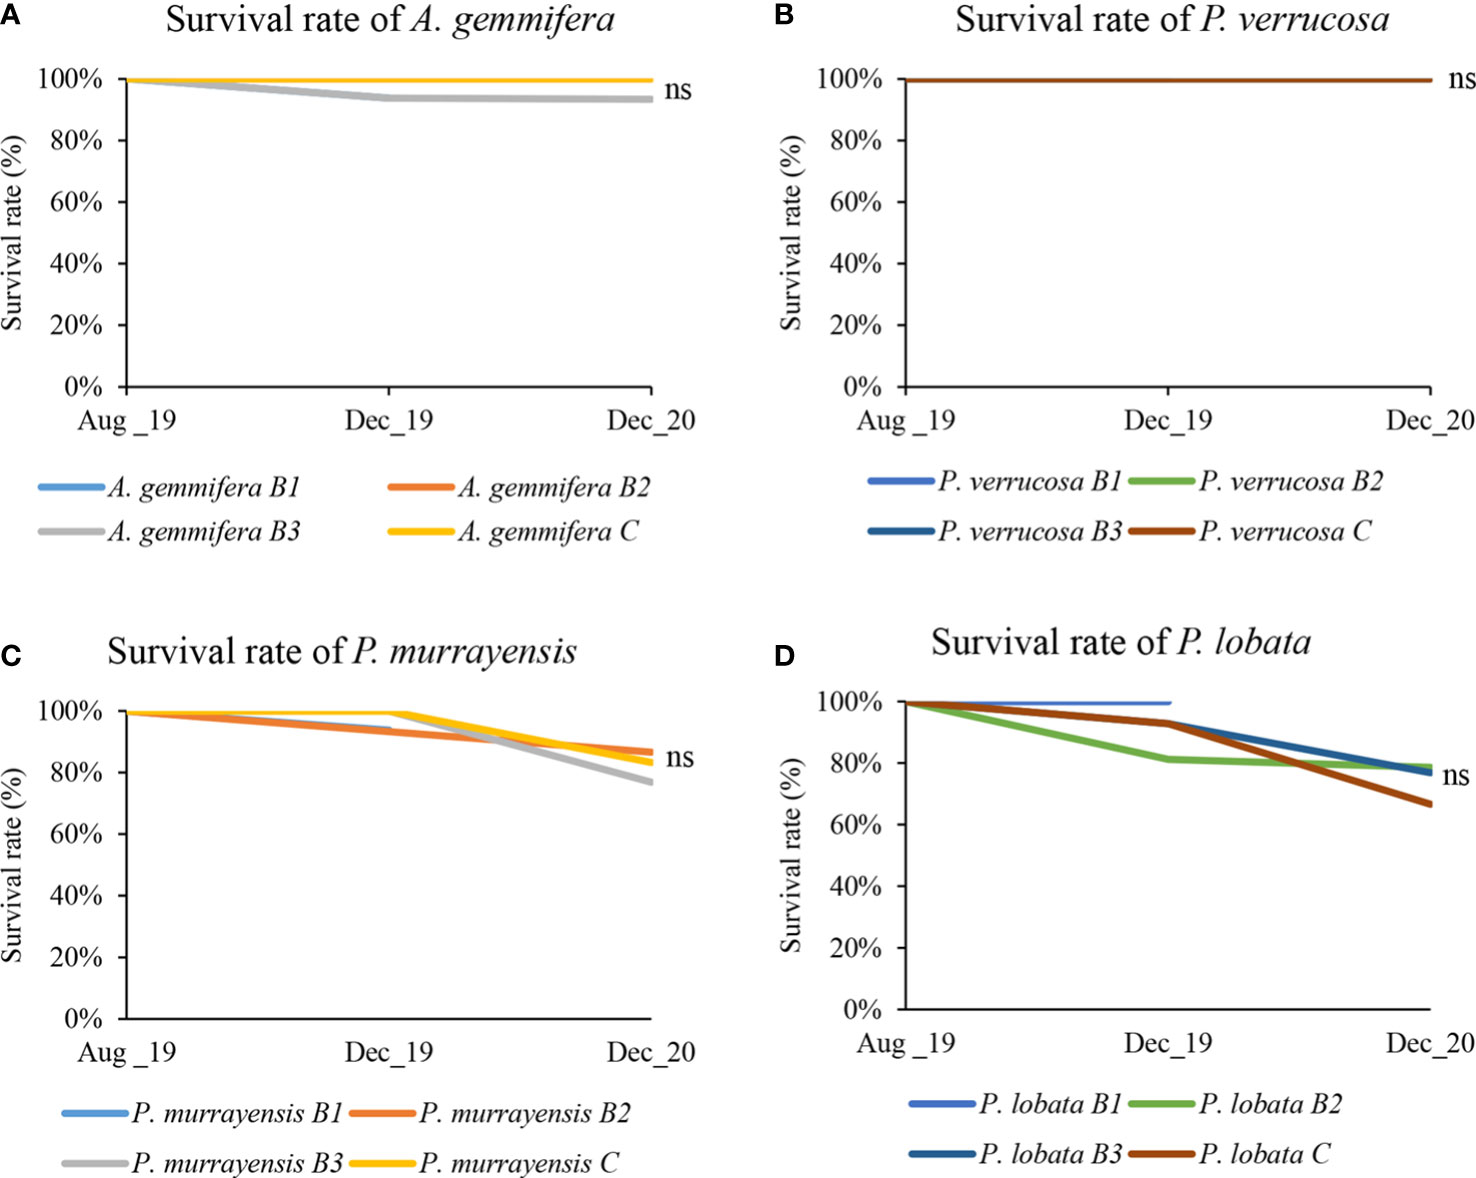
Figure 4 Survival rate of both growth forms, excluding lost fragments. (A) survival rate of A. gemmifera; light blue, orange, gray, and yellow represent the survival rates of A. gemmifera on structure B1, B2, B3, and control respectively. (B) survival rate of P. verrucosa; medium blue, light green, dark blue, and brown represent the survival rates of P. lobata on structure B1, B2, B3, and control respectively. B1–B3 as electro-stimulated structures and C as control structure, (ns, not significant). (C) survival rate of P. murrayensis; light blue, orange, gray, and yellow represent the survival rates of P. murrayensis on structures B1, B2, B3, and control respectively. (D) survival rate of P. lobata; medium blue, light green, dark blue, and brown represent the survival rates of P. lobata on structures B1, B2, B3, and control respectively ns: not significant. ns, not significant, p < 0.05.
3.1.2 Massive coral
Excluding the fragments that were lost during the 16-month period of the experiment, the survival rate of P. murrayensis on electro-stimulated structures was 82%, while that of P. lobata was 78% (Figures 4C, D). There were no significant differences (Kruskal–Wallis, H = 2.191, p = 0.334 and H = 1.496, p = 0.473) in the survival rates of P. murrayensis and P. lobata on electro-stimulated and control structures.
3.2 Change in planar area (increment)
3.2.1 Branching coral
The planar area of A. gemmifera (N = 30) transplants increased from 4.69 ± 1.80 cm2 to 13.30 ± 5.14 cm2 on electro-stimulated structures and increased from 2.80 ± 1.07 cm2 to 10.07 ± 3.12 cm2 on the control structure after 16 months of transplantation. Meanwhile, the planar area of P. verrucosa fragments (N = 32) increased from 8.07 ± 3.21 cm2 to 26.85 ± 4.85 cm2 on electro-stimulated structures and increased from 5.35 ± 2.08 cm2 to 21.41 ± 9.68 cm2 on the control structure. The results of the analyses showed that there were significant differences in the planar area increments for both species A. gemmifera and P. verrucosa among the electro-stimulated structures and control structures (A. gemmifera: T1; T-test, F = 4.653, p<0.001, effect size = 0.304; T2; Mann–Whitney, U = 150, p = 0.038, effect size = 0.483; P. verrucosa: T1; Mann–Whitney, U = 97, p<0.001, effect size = 0.293; T2; Mann–Whitney, U = 115, p = 0.004, effect size = 0.395) between T1 and T2 (Figure 5A). There was a significant difference in the planar area increment for both A. gemmifera and P. verrucosa between electro-stimulated structures and the control structure during the 16-month monitoring period (Figure 5B) (T-test, F = 2.375, p = 0.007 and Mann–Whitney, U = 110, p = 0.003). Additionally, partial mortality was examined. There was no partial mortality found in branching coral fragments.
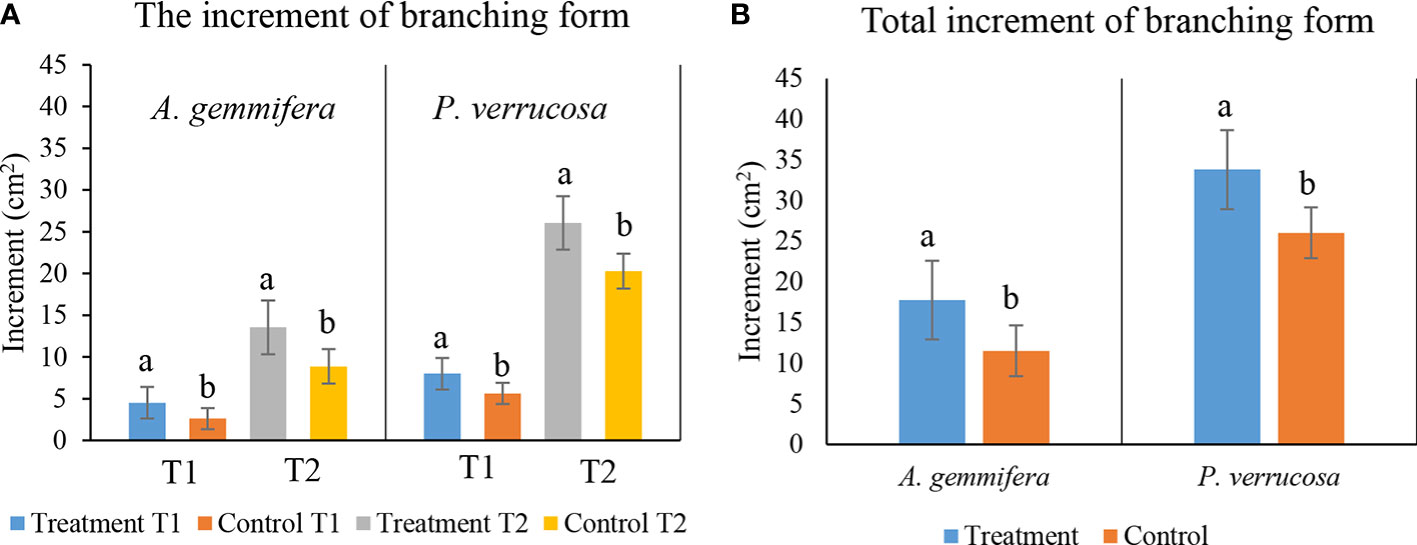
Figure 5 (A) Mean planar area (mean ± SE) of branching form coral at the T1 and T2 phase; T1, 4-month interval, T2, 12-month interval; light blue and orange represent the first phase increments of A. gemmifera and P. verrucosa on electro-stimulated structures and control; gray and yellow represent the second phase increments of A. gemmifera and P. verrucosa on treatment structures and control. (B) Overall increment (mean ± SE); light blue and orange represent the total increments of A. gemmifera and P. verrucosa on electro-stimulated structure and control. B1–B3 as electro-stimulated structures and C as control structure; (ns, not significant, a different letter is given when comparison between two groups was significant, p<0.05).
3.2.2 Massive coral
The increment of P. murrayensis (N = 21) on the electro-stimulated structures reached 7.19 ± 5.48 cm2 and the control structure increment was 6.87 ± 5.31 cm2 for the last monitoring event. The increment of P. lobata (N = 21) was 6.36 ± 3.75 cm2 on electro-stimulated structures and 5.48 ± 2.84 cm2 on the control structure. P. murrayensis and P. lobata exhibited no significant difference between electro-stimulated and control structures in the T1 and T2 periods (Figure 6A) (P. murrayensis: T1; Mann–Whitney, U = 244.500, p = 0.166, effect size = 0.296; T2; T-test, F = 0.465, p = 0.890, effect size = 0.364; P. lobata: T1; Mann–Whitney, U = 210, p = 0.728, effect size = 0.335; T2; T-test, F = 0.010, p = 0.690, effect size = 0.406). There was no significant difference in the total increment of P. murrayensis and P. lobate growth on electro-stimulated and control structures (Figure 6B) (T-test, F = 0.002, p = 0.886 and F = 0.360, p = 0.538). We found that 11.46% of the massive colonies suffered partial mortality.
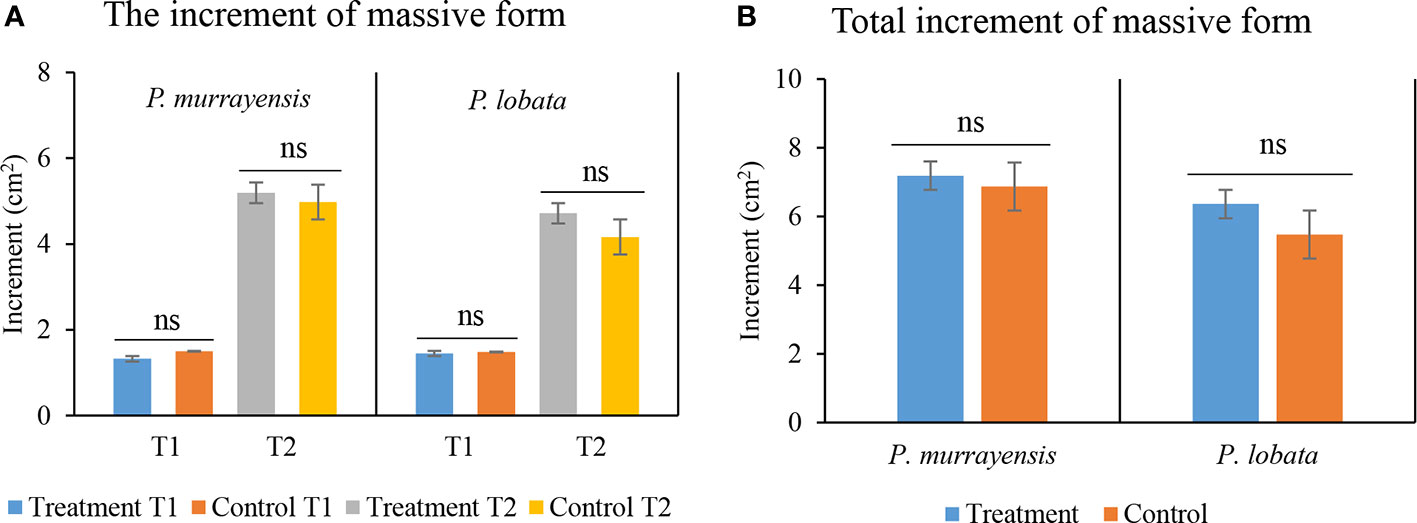
Figure 6 (A) Mean planar area (mean ± SE) of massive corals at the T1 and T2 phase; T1, 4-month interval, T2, 12-month interval; light blue and orange represent the first phase increments of P. murrayensis and P. lobata on electro-stimulated structures and control; gray and yellow represent the second phase increments of P. murrayensis and P. lobata on electro-stimulated structures and control. (B) Overall increment (mean ± SE); light blue and orange represent the total increments of P. murrayensis and P. lobata on electro-stimulated structures and control. B1–B3 as electro-stimulated structures and C as control; (ns, not significant).
3.3 The growth rate
3.3.1 Branching coral
The growth rate of A. gemmifera on electro-stimulated structures was 1.10 ± 0.23 cm2/month and 0.80 ± 0.19 cm2/month on the control structure. Furthermore, the growth rate of P. verrucosa on electro-stimulated structures was 2.16 ± 0.31 cm2/month and 1.68 ± 0.22 cm2/month on the control structure (Figure 7A). The growth rate of branching corals was significantly higher on electro-stimulated structures than on the control structure (A. gemmifera: T-test, F = 2.320, p = 0.007; P. verrucosa: Mann–Whitney, U = 109, p = 0.003).
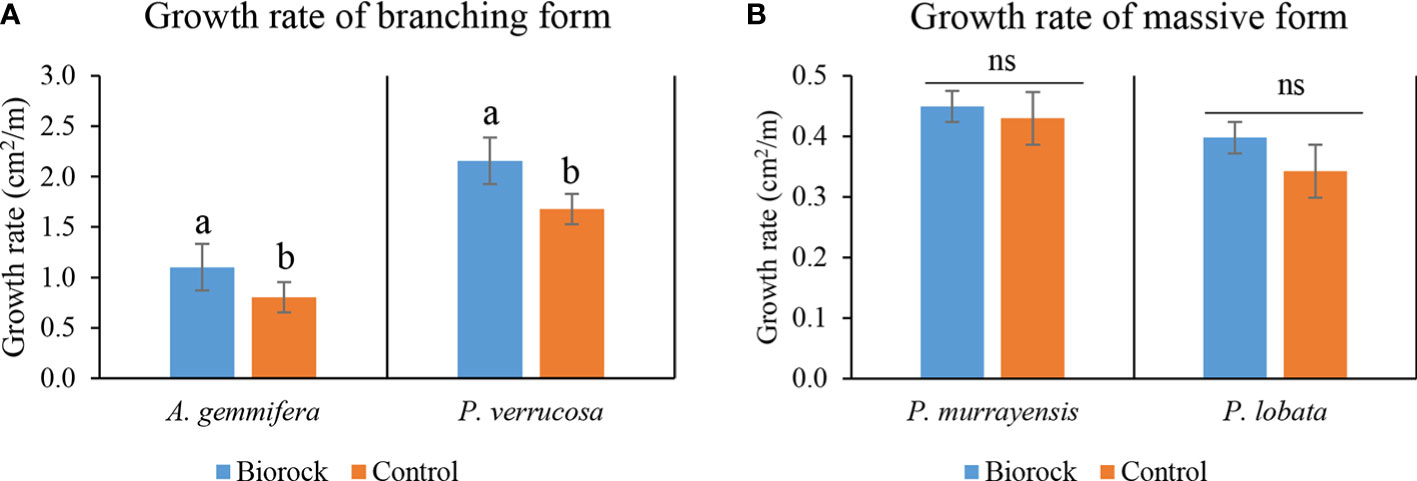
Figure 7 (A) Mean growth rate (mean ± SE) of branching corals; light blue and orange represent the growth rates of A. gemmifera and P. verrucosa on treatment structures and control. (B) Mean growth rate (mean ± SE) of massive corals; light blue and orange represent the growth rates of P. murrayensis and P. lobata on treatment structures and control; (ns, not significant, a different letter is given when comparison between two groups was significant, p<0.05).
3.3.2 Massive coral
The growth rate of P. murrayensis was 0.45 ± 0.24 cm2/month on the electro-stimulated structures and 0.43 ± 0.27 cm2/month on the control structure. The growth rate of P. lobata was 0.40 ± 0.25 cm2/month on electro-stimulated structures and 0.34 ± 0.35 cm2/month on control structures (Figure 7B). The growth rates of massive form corals on electro-stimulated structures and the control structure were not significantly different (P. murrayensis: T-test, F = 0.062, p = 0.870; P. lobata: T-test, F = 0.373, p = 0.537).
3.4 Inter-specific comparison on growth rate
3.4.1 Branching coral
The results of split-plot ANOVA showed significant differences in the growth rate between A. gemmifera and P. verrucosa (p<0.001) and between electro-stimulation and control structure (p = 0.037). Additionally, there was no difference among colonies used (p = 0.486). The results also revealed that there was no interaction between species and treatment (p = 0.650) (Table 1).
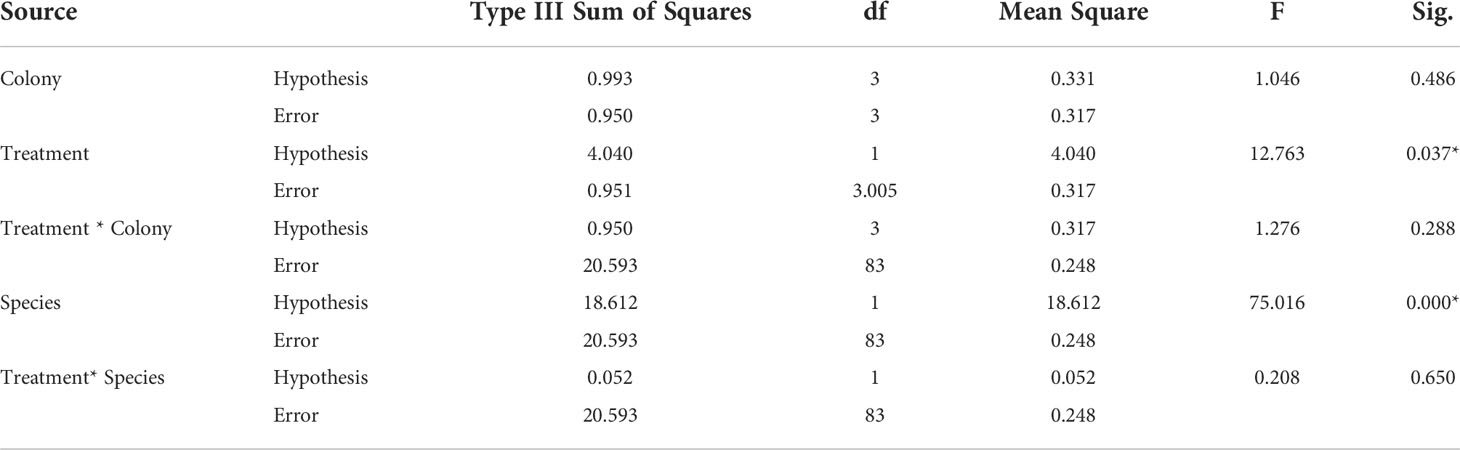
Table 1 ANOVA table for the split-plot design on growth rate of braching coral. *indicates p<0.05. .
3.4.2 Massive coral
The results of split-plot ANOVA showed that there were no significant differences in the growth rate between P. murrayensis and P. lobata (p = 0.381) and between electro-stimulation and control structure (p = 0.680). Additionally, there was no difference among colonies used (p = 0.377). The results also showed that there was no interaction between species and treatment (p = 0.802) (Table 2).
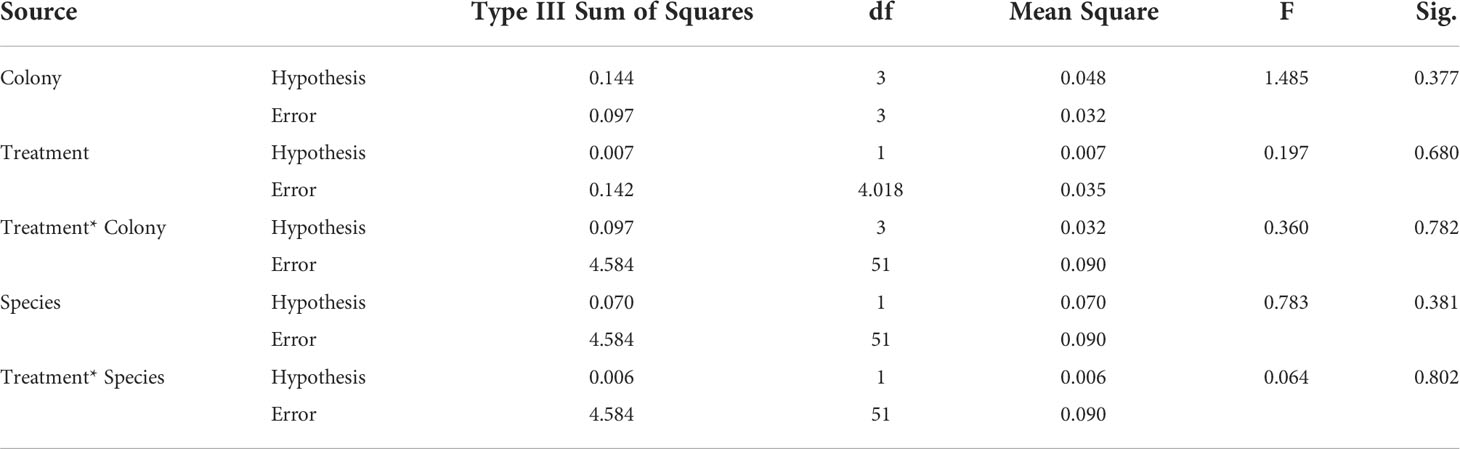
Table 2 ANOVA table for the split-plot design on growth rate of massive coral.
4 Discussion
Studies of the electro-stimulation method have generally shown a significant increase in the survival rate of coral transplants compared to control (Sabater and Yap, 2002; Sabater and Yap, 2004; Zamani et al., 2012). However, in some cases, the survival rate showed no significant difference between the treatment and control groups (Bakti et al., 2012; Huang et al., 2020). In the present study, we found there was no significant difference in the survival rates of transplants on electro-stimulated structures compared with the control structure in both growth forms tested (branching and massive). This inconsistency with some prior studies may be attributed to several possible factors, including differences in the voltage used, the size of the coral transplants, and the origin of the coral donors. In our literature review of electro-stimulation investigations, we found no consensus regarding the amount of voltage to apply for purposes of coral growth enhancement. Goreau and Hilbertz (2012) reported the use of voltages ranging between 3.8 V and 17 V in various projects to boost coral growth (Table S1). It is difficult to compare survival rate results across various studies with varying voltage settings. Lirman et al. (2010) observed high mortality on small transplants (2.5 cm) of Acropora cervicornis compared to larger fragments (3.5 cm), indicating that the length of the fragment may greatly affect the survival rate after transplantation. In the present study, 8–10 cm fragments were extracted from the A. gemmifera and P. verrucosa donor colonies and possessed a high survival rate on both electro-stimulated and control structures, suggesting the fragment size we used was suitable for the transplantation. The massive coral transplants (~80%) showed a lower survival rate than branching transplants (~99%). Page et al. (2018) showed that massive coral (Orbicella faveolata) fragment size has no great impact on the survival rate after transplantation (55.6 ± 18.4 cm2 vs. 4.6 ± 1.7 cm2), but a certain degree of tissue loss has been shown to be associated with parrotfish, butterflyfish, or snail predation. This implies that the size of massive corals used for transplantation may not have a great influence on their survival rate. In the current study, the average size of the massive coral fragments was 3 cm in diameter (7.065 cm2). We found a relatively high degree of partial mortality (11.46%) in massive corals, which may be attributed to predation by benthic organisms. Such predation could ultimately lead to complete mortality, as suggested by Rotjan and Lewis (2008). Lastly, the donor colonies were collected from adjacent reefs (approximately 300 m away from where the structures were installed) that shared similar environmental features with our experiment location. These consistent and compatible environmental conditions could prevent or minimize the effect of local adaptation found in a previous study that documented a lower survival rate of transplants (Drury et al., 2017). Therefore, we suggest the effect of electro-stimulation on the survival rate of hard coral may vary by species and other variables such as predation, which might affect more massive than branching hard coral.
For the branching corals (A. gemmifera and P. verrucosa), the results showed that the increment of planar area was significantly different between the treatment and control groups after the first four months of electro-stimulation. However, the third electro-stimulated structure did not differ significantly from the control for both A. gemmifera and P. verrucosa (Figure S1). This difference in results may be attributed to cable breakage between the battery and electro-stimulated structure 3 soon after it was installed, although this breakage was repaired during the first monitoring event. A similar situation also occurred in a previous study, and when the problem was fixed, the growth rates of Acropora tenuis and Acropora cytherea transplanted on electro-stimulated structures increased (Zamani et al., 2012). However, our results showed that even though electrical current was restored, the increment of planar area on the third electro-stimulated structure showed no significant difference from the control group, while the average increment was higher than the control group. Although our findings showed that electro-stimulation increased the increment as well as the growth of Acropora coral, the increase in rate was not as high as the rate increases of two to 10 times the control rate reported previously in the literature (Goreau, 2014). In comparison with previous literature focusing on hard coral growth with the 2D method, we found that the growth rates of A. gemmifera and P. verrucosa on the control structure were higher than the growth rates estimated from the Great Barrier Reef, Lizard Island (Table 3). Since the average SST was around 26°C at Lizard Island (Anderson et al., 2017) and the average SST was around 29°C in Sabang. Therefore, this variation in the growth rate in the natural environment could contribute to the temperature variation as mentioned in Anderson et al. (2017). Meanwhile, under the treatment, the growth rate of A. gemmifera was two to three times faster than the other branching corals (A. robusta and A. humilis) derived from previous studies conducted in the natural environment (Table 3). These pieces of evidences may indicate a substantial growth enhancement of A. gemmifera and a moderate enhancement of P. verrucosa under the treatment of electro-stimulation.
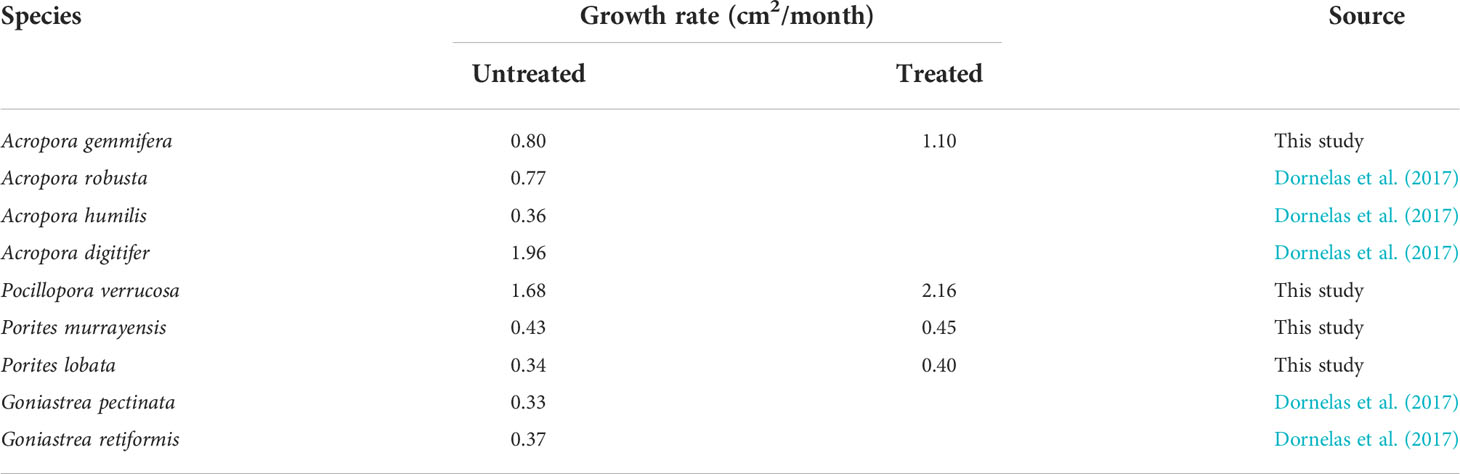
Table 3 Growth rate of hard coral derived from literatures and present study.
For the massive corals, surprisingly, one and a half years after transplantation, we found that there was no significant difference between massive corals on electro-stimulated structures and the control structure, indicating the effect of electro-stimulation may not be substantial on massive Porites corals. Although the massive corals grow along both the vertical and horizontal axes (Piller and Riegl, 2003), in the present study we considered mainly horizontal growth. If the stimulation affects vertical growth more than horizontal growth, then we may not be able to adequately detect the actual growth performance under the electro-stimulation. In addition, the high mortality and low performance found in these corals could also be attributable to their failure to counteract the corrosion caused by the mineral layer scraped off the coral fragments (Strömberg et al., 2010). Although the growth rate of massive corals on being electro-stimulated in this study was higher (0.40 cm2/month) than the growth rate derived from other massive species in the wild (0.33 cm2/month) (Table 3). But those massive transplants under electro-stimulation did not grow significantly faster than those on the control structure in the present study. Since there were several factors may cause bias while measuring the growth of massive corals in this study, such as corner effect and slow growth. Therefore, further experiments with a longer monitoring period, considering both vertical and horizontal growth, and better design of the structure to provide a more precise estimation of the growth of massive corals under electro-stimulation.
Unfortunately, the outbreak of COVID-19 in early 2020 led to the cancellation of the field trips scheduled for April and August 2020. Fortunately, we were able to carry out the last monitoring event in December 2020 while the local travel ban was lifted. During the last field trip, we found that the first structure was upside down and severely damaged. Therefore, the data we collected from the last monitoring event only included results from the remaining two electro-stimulated structures and the control structure. In this instance, the branching corals showed a significant difference (p<0.05) between the electro-stimulated and control treatments (both planar area increment and growth rate). Additionally, we acknowledge that the significant growth enhancement we found under the electro-stimulation treatment may only represent a moderate biological significance since the effect sizes of these tests were in the range between 0.296 and 0.4830 (median class) according to Cohen (1988).
5 Conclusion
Through this time series experiment, we revealed that the massive corals did not show a significant difference (p >0.05) in survival rate, increment, and growth rate between electro-stimulated and control treatments. In contrast, branching corals showed a significant difference (p<0.05) in increment and growth rate between electro-stimulated and control treatments. Additionally, the survival rate of branching (97%–100%) was higher than that of the massive forms (77%–83%). The species with the highest change in planar area in response to electro-stimulation was P. verrucosa (26.85 ± 4.85 cm2), while P. lobata (6.36 ± 3.75 cm2) exhibited the lowest performance after 16 months of transplant. However, we did not find evidence to support the hypothesis that electro-stimulation enhances the survival rate of coral transplants. Additionally, further study focusing on both horizontal and vertical growth of massive coral transplants, with a longer monitoring period and better design of the structure, is needed to more comprehensively verify the effect of electro-stimulation on the growth of massive corals.
Data availability statement
The original contributions presented in the study are included in the article/Supplementary Material. Further inquiries can be directed to the corresponding author.
Author contributions
SL and MS contributed to conception design of the study, data collecting and manuscript writing. NR, MA, PH, NN, and SB helped for field trip and data collecting. All authors listed have made a substantial, direct, and intellectual contribution to the work and approved it for publication.
Funding
The funding was provided by Ministry of Science and Technology, Taiwan (MOST), for the following projects: 108-2611-M-110-001-, and 109-2119-M-110 -003-.
Acknowledgments
We gratefully acknowledge funding from the Ministry of Science and Technology, Taiwan (MOST), for the following projects: 108-2611-M-110-001 and 109-2119-M-110-003 and the reserch award of Taiwanese Coral Reef Society to MS. Many thanks to Yulia Bungalow for providing space to installed structures and all apparatuses. Thanks to Mr. Adi, Scuba Weh, and all teams in Sabang for their assistance during the field.
Conflict of interest
The authors declare that the research was conducted in the absence of any commercial or financial relationships that could be construed as a potential conflict of interest.
Publisher’s note
All claims expressed in this article are solely those of the authors and do not necessarily represent those of their affiliated organizations, or those of the publisher, the editors and the reviewers. Any product that may be evaluated in this article, or claim that may be made by its manufacturer, is not guaranteed or endorsed by the publisher.
Supplementary material
The Supplementary Material for this article can be found online at: https://www.frontiersin.org/articles/10.3389/fmars.2022.917360/full#supplementary-material
References
Anderson K. D., Cantin N. E., Heron S. F., Pisapia C., Pratchett M. S. (2017). Variation in growth rates of branching corals along australia’s great barrier reef. Sci. Rep. 7, 2920. doi: 10.1038/s41598-017-03085-1
Bakti L. A. A., Virgota A., Damayanti L. P. A., Radiman T. H. U., Retnowulan A., Hernawati H., et al. (2012). “Biorock reef restoration in gili trawangan, north lombok,” in Innovative methods of marine ecosystem restoration. Eds. Goreau T. J., Trench R. K. (Boca Raton: CRC Press), 81–89. doi: 10.1201/b14314-8
Burns J. H. R., Delparte D., Gates R. D., Takabayashi M. (2015). Integrating structure-from-motion photogrammetry with geospatial software as a novel technique for quantifying 3D ecological characteristics of coral reefs. PeerJ 3 (7):e1077. doi: 10.7717/peerj.1077
Bythell J., Pan P., Lee J. (2001). Three-dimensional morphometric measurements of reef corals using underwater photogrammetry techniques. Coral Reefs 20 (3), 193–199. doi: 10.1007/s003380100157
Cohen J. (1988). Statistical power analysis for the behavioral sciences. 2nd ed. (Hillsdale, NJ: Lawrence Erlbaum Associates, Publishers).
Coutinho R., Yaginuma L. E., Siviero F., Christofoletti R. A., Ghilardi- N. P., Eduardo C., et al. (2016). Studies on benthic communities of rocky shores on the Brazilian coast and climate change monitoring: status of knowledge and challenges. Braz. J. Oceanogr. 64 (sp2), 27–36. doi: 10.1590/S1679-875920161015064sp2
Dornelas M., Madin J. S., Baird A. H., Connolly S. R. (2017). Allometric growth in reef-building corals. Proc. R. Soc B 284, 20170053. doi: 10.1098/rspb.2017.0053
Drury C., Manzello D., Lirman D. (2017). Genotype and local environment dynamically influence growth, disturbance response and survivorship in the threatened coral, acropora cervicornis. PloS One 12, 1–21. doi: 10.1371/journal.pone.0174000
Edwards A. J. (2010). Reef rehabilitation manual (St Lucia, Australia: Coral Reef Targeted Research & Capacity Building for Management Program), ii + 166 pp.
Edwards A. J., Clark S. (1999). Coral transplantation: a useful management tool or misguided meddling? Mar. pollut. Bull. 37, 474–487. doi: 10.1016/S0025-326X(99)00145-9
Gardner T. A., Côté I. M., Gill J. A., Grant A., Watkinson A. R. (2003). Long-term region-wide declines in Caribbean corals. Science 301 (5635), 958–960. doi: 10.1126/science.1086050
Goreau J. T. (2012). Marine electrolysis for building materials and environmental restoration. Electrolysis 13, 273–290. doi: 10.5772/48783
Goreau T. J. (2014). Electrical stimulation greatly increases settlement, growth, survival, and stress resistance of marine organisms. Nat. Resour. 05, 527–537. doi: 10.4236/nr.2014.510048
Goreau T. J., Cervino J. M., Pollina R. (2004). Increased zooxanthellae numbers and mitotic index in electrically stimulated corals. Symbiosis 37, 107–120.
Goreau T. J., Hilbertz W. H. (2005). Marine ecosystem restoration: costs and benefits for coral reefs. World Resour. Rev. 17, 375–409.
Goreau T. J., Hilbertz W. H. (2012). “Reef restoration using seawater electrolysis in Jamaica,” in Innovative methods of marine ecosystem restoration. Eds. Goreau T. J., Trench R. K. (Boca Raton: CRC Press), 81–89. doi: 10.1201/b14314-8
Herler J., Dirnwöber M. (2011). A simple technique for measuring buoyant weight increment of entire, transplanted coral colonies in the field. J. Exp. Mar. Biol. Ecol. 407 (2), 250–255. doi: 10.1016/j.jembe.2011.06.022
Hilbertz W. H., Goreau T. J. (1996). Method of enhancing the growth of aquatic organisms, and structures created thereby, united states patent number 5,543,034. US Pat. Off. 543 14 pp.
Hoegh-Guldberg O., Mumby P. J., Hooten A. J., Steneck R. S., Greenfield P., Gomez E., et al. (2007). Coral reefs under rapid climate change and ocean acidification. Science 318, 1737–1742. doi: 10.1126/science.1152509
House J. E., Brambilla V., Bidaut L. M., Christie O. P., Madin J. S., Dornelas M. (2018). Moving to 3D: relantionships between coral planar area, surface area and volume. Peer J 6, e4280. doi: 10.7717/peerj.4280
Huang Y. L., Mayfield A. B., Fan T. Y. (2020). Effects of feeding on the physiological performance of the stony coral pocillopora acuta. Sci. Rep. 10, 19988. doi: 10.1038/s41598-020-76451-1
Imanullah I., Sofyan S., Sugianto S., Haditiar Y., Rizal S. (2019). “The relationship between monsoon and sea surface temperature in the western part of aceh waters, Indonesia,” in The 2nd International Conference on Fisheries, Aquatic and Environmental Science (Banda Aceh, IOP Publishing, IOP Conf. Series: Earth and Environmental Science. 348–012066. doi: 10.1088/1755-1315/348/1/012066
Jompa J., Suharto, Anpusyahnur E. M., Dwjja P. N., Subagio J., Alimin I., et al. (2012). “Electrically stimulated corals in Indonesia reef restoration projects show greatly accelerated growth rates,” in Innovative methods of marine ecosystem restoration. Eds. Goreau T. J., Trench R. K. (Boca Raton: CRC Press), 81–89. doi: 10.1201/b14314-8
Kikuzawa Y. P., Toh T. C., Ng C. S. L., Sam S. Q., Taira D., Afiq-Rosli L., et al. (2018). Quantifying growth in maricultured corals using photogrammetry. Aquac. Res. 49 (6), 2249–2255. doi: 10.1111/are.13683
Laforsch C., Christoph E., Glaser C., Naumann M., Wild C., Niggl W. (2008). A precise and non-destructive method to calculate the surface area in living scleractinian corals using X-ray computed tomography and 3D modeling. Coral Reefs 27 (4), 811–820. doi: 10.1007/s00338-008-0405-4
Lavy A., Eyal G., Neal B., Keren R., Loya Y., Ilan M. (2015). A quick, easy and non-intrusive method for underwater volume and surface area evaluation of benthic organisms by 3D computer modelling. Methods Ecol. Evol. 6 (5), 521–531. doi: 10.1111/2041-210X.12331
Lirman D., Thyberg T., Herlan J., Hill C., Young-Lahiff C., Schopmeyer S., et al. (2010). Propagation of the threatened staghorn coral acropora cervicornis: Methods to minimize the impacts of fragment collection and maximize production. Coral Reefs 29, 729–735. doi: 10.1007/s00338-010-0621-6
Mohammed T., El-Komi M., Shoukr F., El-Arab M. E. (2017). Growth rate evaluation of the alcyonacean soft coral sinularia polydactyla (Ehrenberg , 1834) at hurghada , northern red Sea , Egypt. J. Biol. Agric. Healthc. 7 (22), 42–50. doi: 10.4236/nr.2016.76033
Natasasmita D., Wijayanti D. P., Suryona C. A. (2016). The effects of electical voltage differences and intial fragment size on growth performance and survival rate of coral acropora cerealis in biorock method. J. Aquac. Mar. Biol. 4 (4), 86. doi: 10.15406/jamb.2016.04.00086
Naumann M. S., Niggl W., Laforsch C., Glaser C., Wild C. (2009). Coral surface area quantification-evaluation of established techniques by comparison with computer tomography. Coral Reefs 28 (1), 109–117. doi: 10.1007/s00338-008-0459-3
Neal B. P., Lin T. H., Winter R. N., Treibitz T., Beijbom O., Kriegman D., et al. (2015). Methods and measurement variance for field estimations of coral colony planar area using underwater photographs and semi-automated image segmentation. Environ. Monit. Assess. 187 (8), 1–11. doi: 10.1007/s10661-015-4690-4
Orejas C., Ferrier-Pagès C., Reynaud S., Tsounis G., Allemand D., Gili J. M. (2011). Experimental comparison of skeletal growth rates in the cold-water coral Madrepora oculata linnaeus 1758 and three tropical scleractinian corals. J. Exp. Mar. Biol. Ecol. 405 (1–2), 1–5. doi: 10.1016/j.jembe.2011.05.008
Page C. A., Muller E. M., Vaughan D. E. (2018). Microfragmenting for the successful restoration of slow growing massive corals. Ecol. Eng. 123, 86–94. doi: 10.1016/j.ecoleng.2018.08.017
Piazza B. P., Piehler M. K., Gossman B. P., La Peyre M. K., La Peyre J. F. (2009). Oyster recruitment and growth on an electrified artificial reef structure in grand isle, Louisiana. Bull. Mar. Sci. 84, 59–66.
Piller W. E., Riegl B. (2003). Vertical versus horizontal growth strategies of coral framework (Tulamben, Bali, Indonesia). Int. J. Earth Sci. 92, 511–519. doi: 10.1007/s00531-003-0317-z
Ricker W. E. (1975). Computation and interpretation of biological statistics of fish populations. bull. Fish. Res. Board Can. 191, 182.
Roik A., Roder C., Röthig T., Voolstra C. R. (2016). Spatial and seasonal reef calcification in corals and calcareous crusts in the central red Sea. Coral Reefs 35 (2), 681–693. doi: 10.1007/s00338-015-1383-y
Romatzki S. B. C. (2014). Influence of electrical fields on the performance of acropora coral transplants on two different designs of structures. Mar. Biol. Res. 10, 449–459. doi: 10.1080/17451000.2013.814794
Rotjan R. D., Lewis S. M. (2008). Impact of coral predators on tropical reefs. Mar. Ecol. Prog. Ser. 367, 73–91. doi: 10.3354/meps07531
Sabater M. G., Yap H. T. (2002). Growth and survival of coral transplants with and without electrochemical deposition of CaCo3. J. Exp. Mar. Bio. Ecol. 272, 131–146. doi: 10.1016/S0022-0981(02)00051-5
Sabater M. G., Yap H. T. (2004). Long-term effects of induced mineral accretion on growth, survival and corallite properties of porites cylindrica Dana. J. Exp. Mar. Bio. Ecol. 311, 355–374. doi: 10.1016/j.jembe.2004.05.013
Strömberg S. M., Lundälv T., Goreau T. J. (2010). Suitability of mineral accretion as a rehabilitation method for cold-water coral reefs. J. Exp. Mar. Bio. Ecol. 395, 153–161. doi: 10.1016/j.jembe.2010.08.028
Terlouw G. (2012). Coral Reef Rehabilitation on Koh Tao, Thailand: Assessing the Success of a Biorock Coral Reef. Vrije Universiteit, Amsterdam, 31.
Utama R. S., Budiyanto A. (2017). Condition and diversity of stony corals in sabang waters. Oceanol. Limnol. Indonesia 2 (1), 69–82.
Utama R. S., Hadi T. A. (2018). Recent coral reef conditions in weh island, aceh province, Indonesia. Indo Pacif. J. Ocean Life 2 (2), 47–53. doi: 10.13057/oceanlife/o020202
Keywords: branching coral, electro-stimulated, growth performance, image analysis, massive coral
Citation: Samidon M, Razi NM, Agustiar M, Harahap PB, Najmi N, Bahri S and Liu SYV (2022) In-situ electro-stimulation enhanced branching but not massive scleractinian coral growth. Front. Mar. Sci. 9:917360. doi: 10.3389/fmars.2022.917360
Received: 11 April 2022; Accepted: 23 August 2022;
Published: 15 September 2022.
Edited by:
Hajime Kayanne, The University of Tokyo, JapanReviewed by:
Adán Guillermo Jordán-Garza, Universidad Veracruzana, MexicoMohammad Reza Shokri, Shahid Beheshti University, Iran
Neviaty Zamani, Bogor Agricultural University, Indonesia
Copyright © 2022 Samidon, Razi, Agustiar, Harahap, Najmi, Bahri and Liu. This is an open-access article distributed under the terms of the Creative Commons Attribution License (CC BY). The use, distribution or reproduction in other forums is permitted, provided the original author(s) and the copyright owner(s) are credited and that the original publication in this journal is cited, in accordance with accepted academic practice. No use, distribution or reproduction is permitted which does not comply with these terms.
*Correspondence: Shang Yin Vanson Liu, b2NlYW5kaXZlcjY0MjZAZ21haWwuY29t