 Amy Bartenfelder
 William Judson Kenworthy
 Brandon Puckett
 Charles Deaton3
 Jessie C. Jarvis
94% of researchers rate our articles as excellent or good
Learn more about the work of our research integrity team to safeguard the quality of each article we publish.
Find out more
ORIGINAL RESEARCH article
Front. Mar. Sci., 17 June 2022
Sec. Marine Ecosystem Ecology
Volume 9 - 2022 | https://doi.org/10.3389/fmars.2022.917237
This article is part of the Research TopicTropicalization in Seagrasses: Shifts in Ecosystem FunctionView all 8 articles
Species, including seagrasses, at their range limits are uniquely vulnerable to climate change. In the western Atlantic Ocean, the biogeographic transition zone between temperate and tropical ecosystems is recognized as one of several global hotspots where poleward-flowing western boundary currents are forecast to warm faster than the global average. In this region seagrass ecosystem services are primarily supplied by two species, Zostera marina, a temperate seagrass at its southern range limit and Halodule wrightii, a tropical seagrass at its northern limit. Water temperatures in the study location in Back Sound, North Carolina, USA have gradually increased the length of the stressful summer season for Z. marina (beginning after 3 consecutive days of daily mean water temperatures >23°C, ending after 3 consecutive days <25°C) from 84 days in 1962 to 156 days in 2019. The occurrence of extreme water temperatures also increased resulting in temperatures ≥30°C occurring more frequently in the last decade (2009-2019) than the previous 10 years. Biomass and aerial imagery collected periodically from 1981-2019 indicate that Z. marina biomass remained stable until 2008 but declined to 30-year low levels by 2019. Meadow area estimated from imagery collected during peak Z. marina biomass did not show a significant trend over time; however, lowest meadow area during the time series was recorded in 2019. Despite summer warming, H. wrightii biomass remained steady between 1979-2019 but did not replace Z. marina as the dominant species in the cooler months. We hypothesize that persistence of temperate Z. marina populations under stressful water temperatures is positively influenced by water clarity, life history, and meadow stability, due in part to the consistent presence of tropical H. wrightii maintaining meadow biomass and area. However, temperate species in edge-of-range tropicalized meadows, are still limited by physiological thresholds, and when these limits are exceeded, related declines in meadow biomass and area may not be fully replaced by tropical species immediately. Therefore, while tropicalization of seagrass meadows may result in greater resilience to abiotic stressors in the short-term, declines in biomass and area during the process of tropicalization may have significant impacts on meadow function.
Seagrasses are the foundation species for some of the most productive and ecologically important coastal systems on the planet (Orth et al., 2006), yet at the same time these habitats are one of the most threatened (Grech et al., 2012; Unsworth et al., 2019). Worldwide, in locations where seagrass ecosystems have been routinely monitored, they are experiencing unprecedented levels of anthropogenic stress and accelerated rates of decline attributed to coastal pollution, exploitation, and physical disturbance (Short and Wyllie-Echeverria, 1996; Duarte, 2002; Waycott et al., 2009; Krause-Jensen et al., 2021). Despite widespread reports of declining meadows, globally there are still large and relatively healthy seagrass ecosystems located in unimpaired coastal and open ocean waters distant from sources of land-based pollution (Green and Short, 2003; Gattuso et al., 2006; Unsworth et al., 2019). While these areas of healthy and relatively in-tact seagrass ecosystems may be insulated from many of the usual anthropogenic stressors (e.g., impaired water quality, trawling, dredging), neither these nor the already degraded systems will be immune from potential widespread climate change threats attributed to increasing sea surface temperatures (SST), sea level rise (SLR), higher frequency and intensity of storms, and ocean acidification (Short and Neckles, 1999; Paerl et al., 2019; Babcock et al., 2019; Krause-Jensen et al., 2021).
Research and modelling studies have disclosed the potential implications of these four climate change factors for temperate and tropical seagrass ecosystems (e.g., see Collier and Waycott, 2014; Marbà et al., 2015; Zimmerman et al., 2015; Collier et al., 2017; Zimmerman et al., 2017). Several compelling studies have demonstrated the relatively large-scale effects of increasing temperatures on seagrass populations, as well as changes in the structure and function of seagrass ecosystems brought about by the effects of temperature. In a temperate western Atlantic estuary (Chesapeake Bay, VA) repeated years of elevated summer temperatures impaired the growth, reproduction, and recruitment of the temperate seagrass Zostera marina resulting in a series of large catastrophic declines of the species (Orth and Moore, 1986; Moore and Jarvis, 2008; Moore et al., 2014; Arnold et al., 2017). Likewise, in southwestern Australia, an extreme marine heat wave event during 2011 reduced the areal extent of one of the world’s largest and most diverse assemblages of seagrasses in Shark Bay by 22% (Thomson et al., 2015; Arias-Ortiz et al., 2018; Babcock et al., 2019). In southern Europe, recent studies of the dominant foundation species in the Mediterranean Sea, Posidonia oceanica, showed that shoot mortality corresponded with increased maximum annual seawater temperatures (Marbà and Duarte, 2009). Subsequent modelling of projected maximum SST predicted the demise of the endemic foundation species, P. oceanica, by the middle of this current century (Jordà et al., 2012). In the absence of significant climate mitigation actions, Jordà et al. (2012) argued that the chances of a poleward migration to cooler waters by P. oceanica is physically limited by the European continent. Unless the species adapts to increasing temperatures and successfully competes with other macrophytes advantaged by warming, functional extinction of P. oceanica is a likely future scenario in Mediterranean Sea.
While the physiological basis for the effects of thermal stress on photosynthesis, respiration and growth of many seagrass species are generally known (Lee et al., 2007), the aforementioned studies, as well as other contemporary research, demonstrate that predicting the effects of climate change on seagrass ecosystems requires more than a unilateral understanding of temperature responses (Richardson et al., 2018; Krause-Jensen et al., 2021). For example, the seagrass losses partially attributed to thermal stress in Shark Bay, as well as large scale declines reported in the Great Barrier Reef, were also accompanied by unusually high rainfall events, coastal flooding, turbidity, nutrient loading, and wind damage associated with cyclonic conditions (Babcock et al., 2019). Similarly, in Chesapeake Bay, temperature stress on Z. marina was aggravated by nutrient loading and turbidity which reduced light levels needed for this species to maintain critical physiological processes, positive carbon balance, growth, and reproduction (Jarvis and Moore, 2010; Zimmerman et al., 2015; Lefcheck et al., 2017; Hammer et al., 2018). Predicting the effects of climate change on seagrass ecosystems in the polyhaline region of Chesapeake Bay is further complicated by the coexistence of two foundational species, Z. marina and R. maritima, with the former species already experiencing extreme temperatures near the southern extent of its range and the latter being more tolerant of higher temperatures and a wider range of salinities (Evans et al., 1986; Moore et al., 2014; Richardson et al., 2018). Historically, Z. marina has been the dominant species in the polyhaline region of the Chesapeake Bay, yet despite extremely high temperatures R. maritima has not replaced Z. marina. Given that R. maritima is a highly fecund species and seed germination is more dependent on lower salinity conditions than for Z. marina (Ailstock et al., 2008), Richardson et al. (2018) posited that a higher frequency of storm associated precipitation forecasted in association with climate change (Najjar et al., 2010) could eventually tip the balance in this species interaction, leading to dominance of R. maritima in the polyhaline region of Chesapeake Bay.
Just to the south of Chesapeake Bay, the co-occurrence of temperate and tropical seagrasses in North Carolina presents a unique opportunity to investigate species interaction at the very margins of their geographic ranges where the effects of climate change on growth and survival should be most evident (Figure 1A, Crawford, 2008). Extending over almost three degrees of latitude (33.8° and 36.4° N), the North Carolina (USA) coastline lies at the convergence of two major western Atlantic Ocean currents where the colder waters of the southerly flowing Labrador current meet the warm tropical waters transported north by the Gulf Stream (Figure 1B). The largest documented polyhaline seagrass ecosystem on the Atlantic seaboard of North America occurs in the shallow (< 2.0m depth) coastal waters of North Carolina. In this coastal system at least 40,000 ha of meadows occupy 315 km of coastline on submerged back barrier island shelves in four large sounds and a network of smaller lagoons and inland tidal waters (Carraway and Priddy, 1983; Thayer et al., 1984; Green and Short, 2003; NCDEQ (North Carolina Department of Environmental Quality), 2016; Field et al., 2021) (Figure 1C). The regional climate is moderated by the mixing of these two ocean currents with over two million acres of estuarine waters hydrologically connected to the Atlantic Ocean through several tidal inlets. Winters are generally mild with minimum air temperatures in January and February averaging ~ 1.6°C, while summers are hot and humid averaging ~32.2°C in July and August.
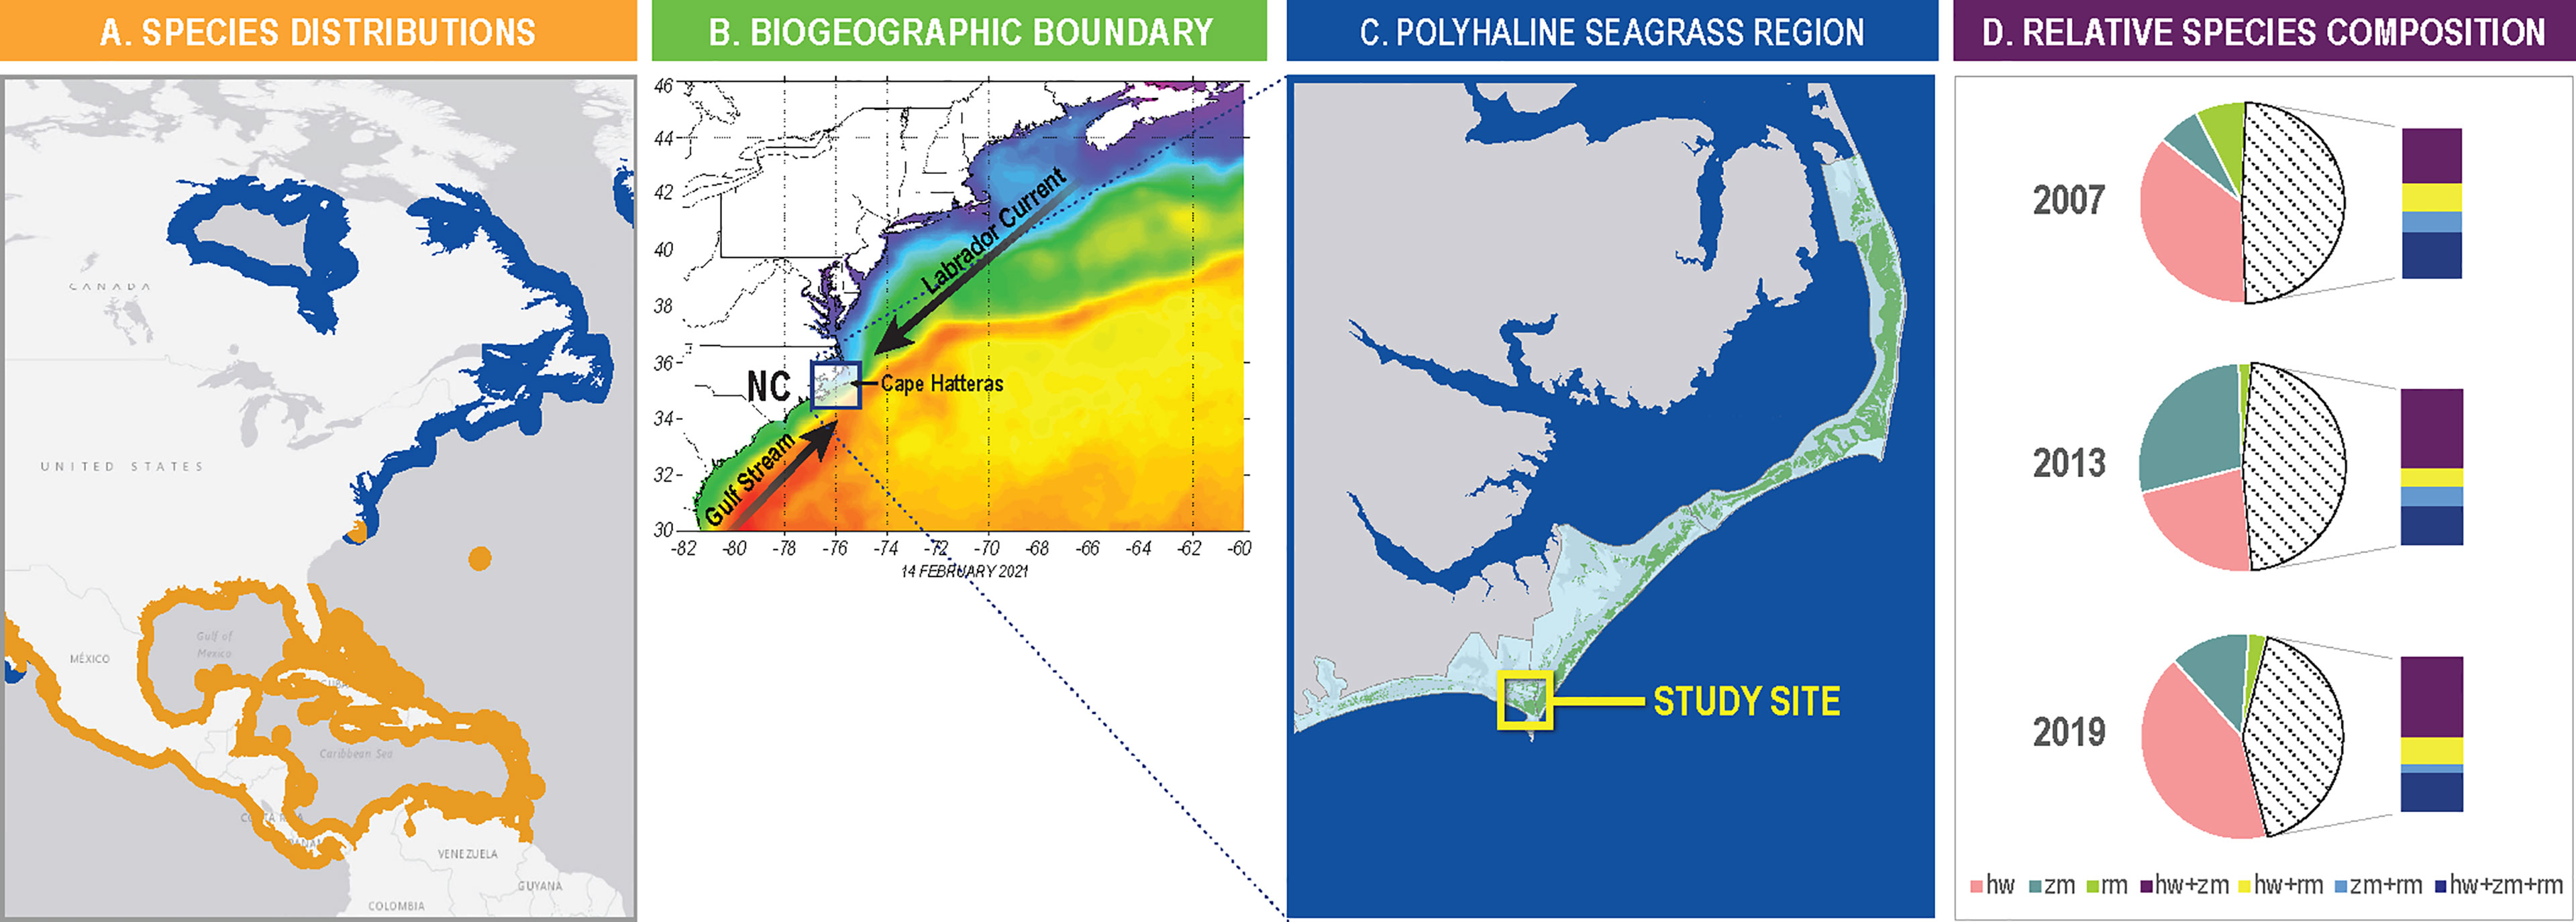
Figure 1 (A) Species distribution of Zostera marina (blue) and Halodule wrightii (orange) in the Western North Atlantic Ocean (distribution data from IUCN). The distribution of Ruppia maritima is cosmopolitan and overlaps with both Z. marina and H. wrightii. (B) Example of ocean temperature conditions highlighting the intersection of the Gulf Stream and the Labrador Current off Cape Hatteras NC that establish biogeographic boundary conditions. Data was collected in February 2021. Red and orange represent warmer water temperature and purple and blue cooler water temperatures. (C) Known historical extent of seagrass throughout the polyhaline region of the Albemarle Pamlico Estuarine System in coastal North Carolina from a composite of mapping efforts spanning 1981-2019 (data from NC Division of Marine Fisheries). (D) Relative seagrass species contribution in 2007, 2013 and 2019 throughout entire NC polyhaline seagrass region. Data are shown as percent observations as single species H. wrightii (orange), Z. marina (red), Ruppia maritima (green), or mixed meadow combinations (stippled). For multiple species combinations HW+ZM is in purple, HW+RM is in yellow, ZM + RM is light blue and all three are shown as dark blue (data from NC Division of Marine Fisheries).
Coincidentally, the coastal waters of North Carolina also lie at the boundary of two major seagrass bioregions; the temperate North Atlantic and the tropical Atlantic (Short et al., 2007). Annually, the oceanographic and climatic conditions oscillate between temperate and sub-tropical characteristics. These conditions permit the growth and reproduction of species drawn from temperate (Z. marina), tropical (Halodule wrightii) and eurytolerant (R. maritima) affinities in both mixed and monospecific meadows (Kenworthy, 1981; Thayer et al., 1984; Micheli et al., 2008) (Figure 1D). As one of the largest seagrass ecosystems in the western Atlantic (Green and Short, 2003; Field et al., 2021), it is widely recognized as critically important fish and wildlife habitat for the mid- and south Atlantic regions of the U.S. (Thayer et al., 1975; Havel, 2018), while also providing important ecological structure, functions, and economic value for local and regional coastal communities (Thayer et al., 1984; NCDEQ (North Carolina Department of Environmental Quality), 2016). Given the severe declines in neighboring seagrass ecosystems in Chesapeake Bay (Lefcheck et al., 2018) and further south along the east coast of Florida (Morris et al., 2022), the local and more extensive regional implications of climate related effects on the North Carolina seagrass ecosystem are not trivial.
Consequently, there are compelling reasons for investigating how resilient the North Carolina seagrass ecosystem will be to climate change, especially to increasing sea surface temperatures (SST) in the western Atlantic (Micheli et al., 2008; Wilson and Lotze, 2019). Given the co-occurrence of both temperate and tropical species living at the margins of their respective geographic ranges and already experiencing limits to their survival (Crawford, 2008), it is plausible to hypothesize that increasing SST could be instigating further tropicalization of this ecosystem by favoring the tropical taxa, H. wrightii, over the temperate species, Z marina (Micheli et al., 2008). Recently, this hypothesis was partially investigated with a Z. marina presence only species distribution model (SDM) that predicted the extirpation of eelgrass in North Carolina by the end of this century under three climate change scenarios; “low warming”, “strong warming” and “business as usual” options (Wilson and Lotze, 2019). While the decline or complete loss of a foundation species in any seagrass ecosystem could be expected to have substantial ecological and physical implications, in this particular case the outcome of increasing SST will depend on the unique responses and interactions of the two co-occurring temperate and tropical species, as well as the other relevant environmental factors accompanying climate change.
To further inform our understanding of the effect of climate change on this complex species interaction and the persistence of seagrasses in this western Atlantic biogeographical transition zone, we examined changes in seagrass abundance at two spatial scales over a span of forty years (1979 - 2019) by analyzing spatial and temporal variation in; 1) meadow scale (103 m2) variation in spatial extent of seagrass coverage at four sites and 2) biomass abundance within and between meadows occupied by the two dominant seagrasses, Z. marina and H. wrightii. To link these two different scales of historical and contemporary seagrass response data to factors known to be associated with climate change, we also examined how water temperatures and optical water quality have changed over a comparable period from long-term records available in our study area.
While mean daily water temperatures are commonly used to characterize the thermal conditions of a water body and have reportedly increased 1.4°C in our study area between 1985 and 2005 (Micheli et al., 2008), we also investigated changes in water temperature using two additional metrics that account for magnitude, duration and cumulative temperature stress for Z. marina; 1) length of the summer stressful temperature season (Shields et al., 2018) and, 2) amount of time spent above stressful (25°C; Evans et al., 1986; Zimmerman et al., 2017), meadow senescence (28°C; Thayer et al., 1975) and lethal thresholds (30°C; Marsh et al., 1986). As alternatives to daily means, the calculations that go into both alternative metrics can be empirically grounded in an understanding of the threshold reference or base temperatures at which Z. marina begins to experience different degrees of thermal stress associated with metabolism, growth, and reproduction. Based on a compelling relationship between summer length, water quality and declines of Z. marina in the Chesapeake Bay, VA (Shields et al., 2018), we also examined a long-term record of optical water quality data for the study area, including factors known to affect light availability (chlorophyll a (chl a), turbidity and water clarity). Light availability interacts with temperature to affect metabolism, growth and reproduction of temperate and tropical seagrasses (Lee et al., 2007; Biber et al., 2008; Moore and Jarvis, 2008; Moore et al., 2014; Lefcheck et al., 2017). Using the results of these analyses and relevant studies of seagrass biology and life history, we discuss some of the general implications of climate change on seagrass ecosystems at this and other biogeographic transition zones. More specifically, we discuss the unique persistence and resilience characteristics of this seagrass ecosystem to increasing SST, identify critical gaps in understanding of the species interactions, and discuss what additional information is needed to build more confidence in the plausibility of the forecasted effects of climate change and further tropicalization of this large seagrass ecosystem.
The primary study area was in Back Sound, Carteret County, NC, USA (34° N, 76.5° W) (Figures 1, 2). Back Sound is located in the southern geographic region of the Albemarle Pamlico Estuarine System (APES), the second largest estuary by surface area in the U.S. The Sound is bio-physically comparable to the other relatively shallow lagoon-like waterbodies that constitute the polyhaline region of APES where between 40,000 – 50,000 hectares of seagrasses have been documented to occur (Figure 1C) (Thayer et al., 1984; NCDEQ (North Carolina Department of Environmental Quality), 2016; Field et al., 2021).
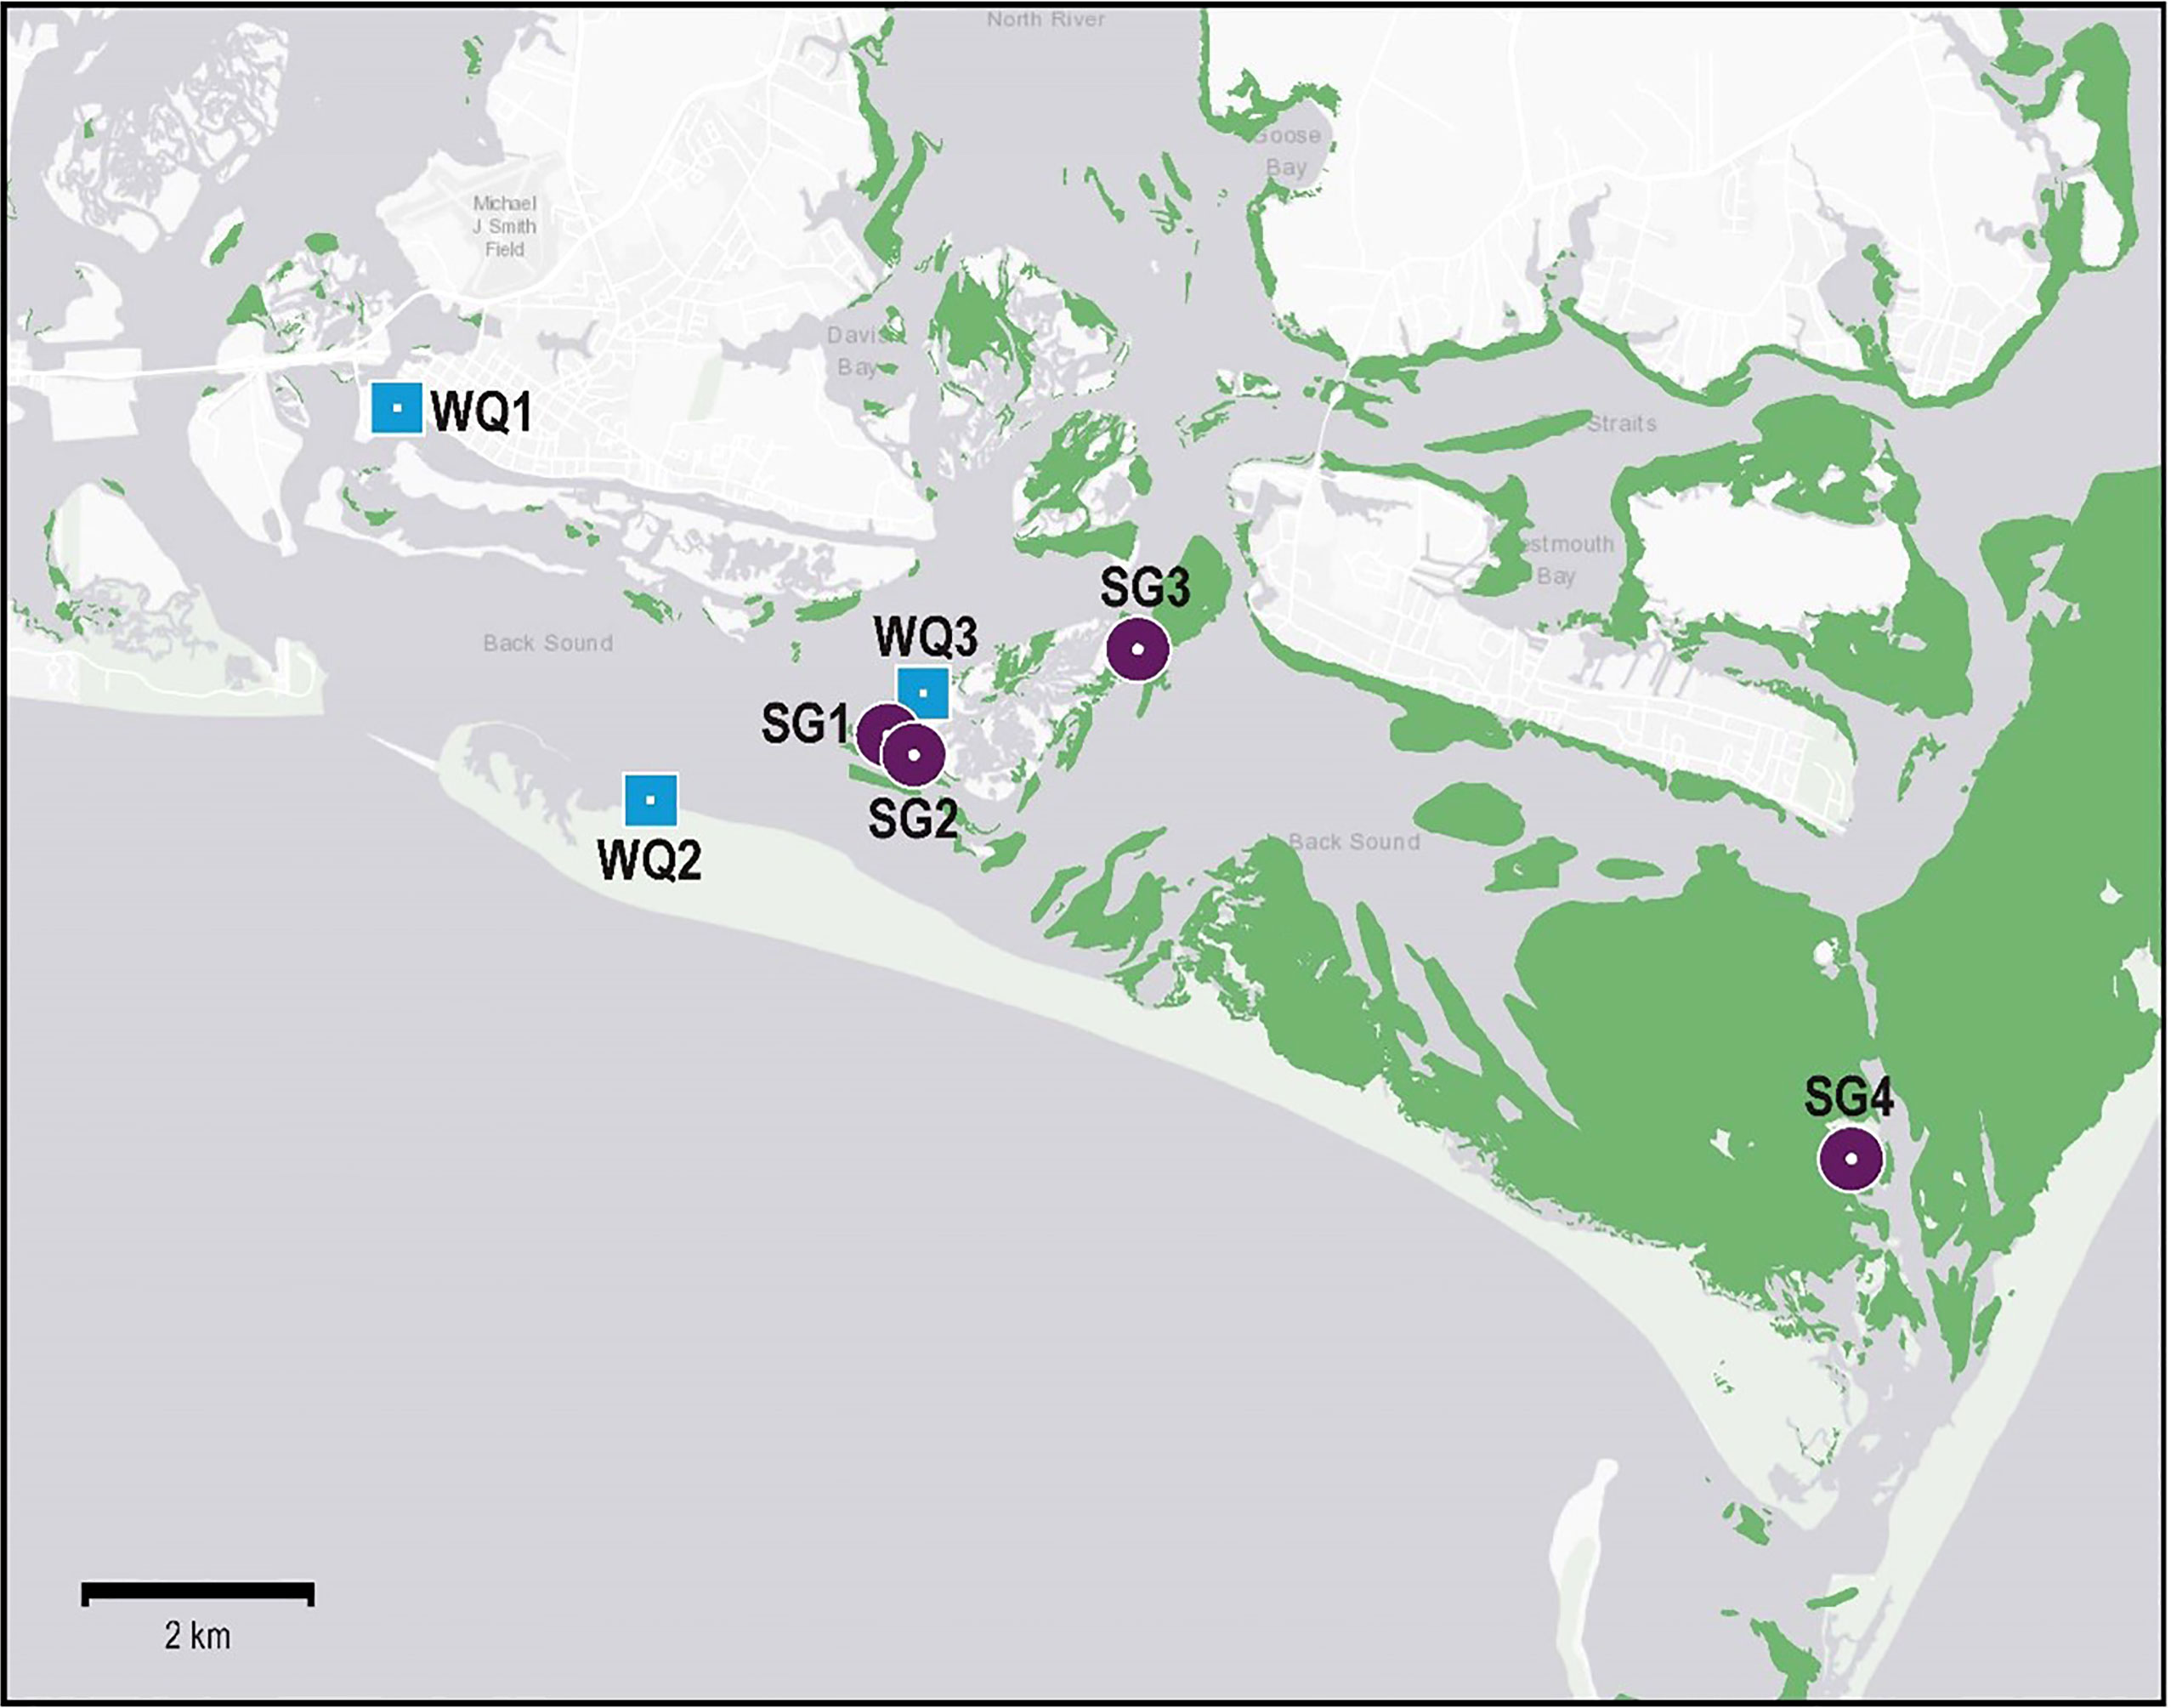
Figure 2 Map of all seagrass (SG) and water quality (WQ) sampling locations used in this study. See (Tables 1, 2) for information on sources of data, sampling frequency, and types of data collected. Green areas denote known historical extent of seagrass throughout the polyhaline region of coastal North Carolina from 1981-2019 (data from NC Division of Marine Fisheries).
In Back Sound, semi-diurnal tides (spring range approx. 1.1 m) regularly exchange water between the estuary and the Atlantic Ocean through two inlets bisecting a string of narrow barrier islands bordering the eastern margin of APES. Most of the submerged sediments in Back Sound are unconsolidated sand, silt, and mud with the exception of isolated oyster reefs and man-made structures (e.g., rock jetties, hardened shorelines). Some recreational and commercial shell fishing occurs in the area, but neither this, boat anchoring, propeller scarring, or channel dredging represent significant bio-physical disturbances that affect the seagrasses at our study sites.
High resolution (maximum 1 meter ground sample distance), color aerial orthophotography was acquired at four sites (SG1-4, Figure 2) in May, during the peak biomass season for Zostera marina. The imagery was obtained in 1981, 1992, 2006, 2008, 2013, and 2019, providing six observations spanning 39 years to estimate areal coverage of seagrasses (m2) (Table 1). Specifications for image providers, image resolutions, and flight dates are provided in Table S1. Imagery was clipped to each of the four site’s boundaries, delineated as the maximum observed seagrass areal extent at each site, providing a total of 24 observations over space and time.
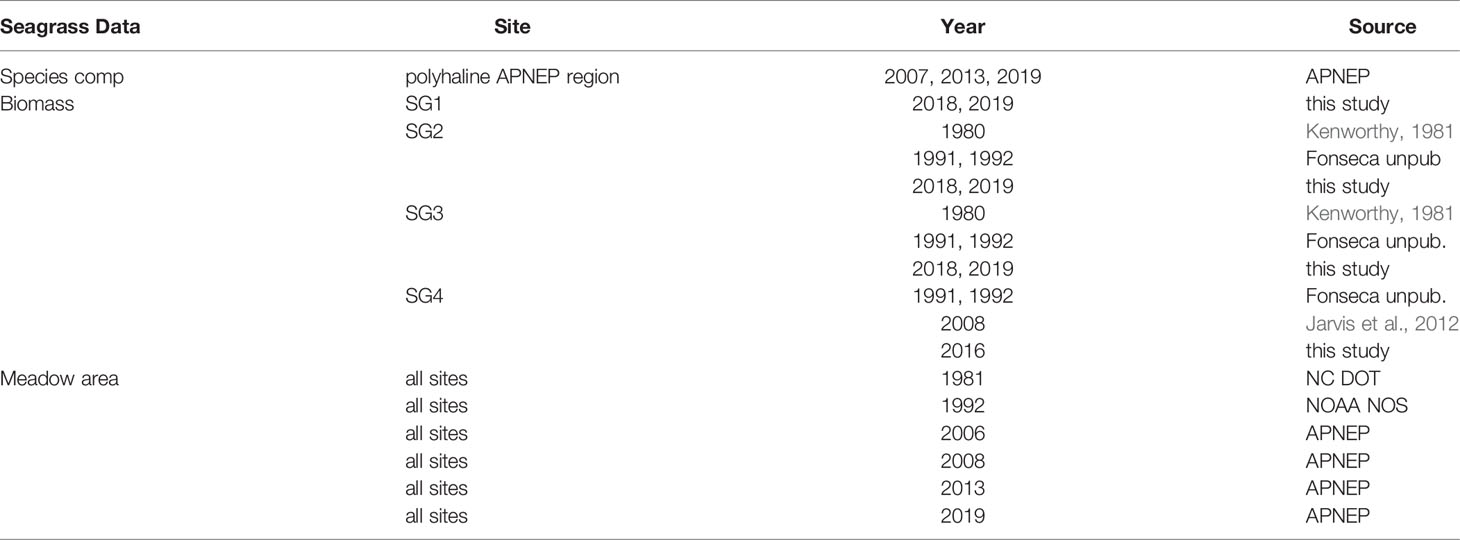
Table 1 Data sources and years of collection for all seagrass measurements at each site.
Unsupervised segmented classification, a form of object-based image analysis, was performed on the clipped imagery for each site and date in ArcGIS Desktop 10.6 (Esri Inc., Redlands, CA, USA), following ESRI (2019) recommended segmentation and classification procedures (see Figure S1 for visual workflow). In each image, RGB pixel values were stretched to highlight contrast and segmented via mean shift segmentation. The segmented images were input to an unsupervised ISO Cluster classifier, which sorted each segment based on its spectral characteristics. Each output class was then manually classified as either “seagrass” or “not seagrass.”
Classification accuracy was assessed following the recommendations of the UN Food and Agriculture Organization (Food and Agriculture Organization of the United Nations, 2016), whereby 100 points in each orthoimage were generated using stratified random sampling, and then the classified raster was compared to a technician’s interpretation of the unclassified imagery at those points. For consistency, the same technician conducted all the interpretations. Uncertainty in seagrass area estimates was calculated with the overall accuracy component of confusion matrices generated from the comparison points in ESRI ArcGIS (Barsi et al., 2018). Data were combined across all sites per sampling year and presented as median seagrass meadow area (m2) and proportion of maximum meadow extent (%).
Seagrass biomass cores were collected during the spring (April – June) and summer (July – September) seasons at SG1, SG2, SG3 and SG4 in Back Sound, NC in 1978-79 (Kenworthy, 1981), 1991-92 (Murphey and Fonseca, 1995; Fonseca and Bell, 1998), 2008 (Jarvis, 2009), 2016 (Jarvis unpublished data) and in 2018-2019 (Bartenfelder, 2019) (Table 1). For all sampling events a minimum of 3 replicate biomass cores were collected from randomly selected vegetated locations per site (1991-92 N = 3; 2018-19 N = 4; 1979-80, 2008, 2016 N = 5). Core diameter ranged from 15-25 cm and samples were collected to a depth of 10-25 cm to include root and rhizomes, as well as above ground plant material. Samples were washed free of sediment in the field and returned to the lab for further processing.
In the laboratory, all plant and root/rhizome material within each biomass sample was cleaned and separated by species. Samples were then sorted into above and below ground material at the basal meristem. Leaf epiphytes were removed either physically by scrapping the blades (2008 onward) or by soaking the blades in a weak acid (1978-79 10% HCl; 1991-1992 to 10% H3PO4) for up to 10 minutes or until effervescence ceased. All samples were then dried in an oven at between 60 – 100°C until a constant dry weight was reached (nearest 0.01 g). Due to its high thermal tolerance, a relatively low number of sample occurrences (31%) and a small proportion of the total sample biomass (Table S2), R. maritima was combined with H. wrightii for all biomass analyses. Biomass was recorded as g dry weight (DW) m-2 and reported as mean value ± standard error per sampling event.
To evaluate the historical correspondence between seagrass abundance and water temperatures, temperature data (°C) was obtained from three different long-term data sources covering three periods: 1962 – 1981, 1995 – 2008, 2009 - 2019. Using these data, we assembled a nearly continuous 57-year record from 1962 to 2019; with no water temperature data records for 1981 – 1995. For the period extending from 1962 to 1981 water temperature data was obtained from a recording station (WQ1) calibrated to a mercury thermometer located in the tidal channel adjacent to the NOAA Laboratory on Pivers Island, Beaufort, NC, USA (Hettler and Chester, 1982). The data were reported as weekly mean water temperatures presented on a fitted line utilizing least squares regression. To estimate water temperatures (°C) at 15 min time intervals, the online program, Web Plot Digitizer1, was utilized to extract water temperatures along the fitted regression line in Hettler and Chester (1982).
For the period from 1995 to 2008, water temperature data (°C) was obtained from an archive of hourly water temperatures recorded in the tidal channel adjacent to the Duke University Marine Lab (DUML) on Pivers Island, Beaufort NC (34°43’02.8N 76°40’14.3”W). This site is located approximately 500 m from NOAA laboratory where Hettler and Chester (1982) acquired their temperature data and hereafter referred to as WQ1. During this period a YSI (Yellow Springs Instruments) 44032 Thermistor collected 20 equally spaced temperature readings over a 2-minute period and averaged for each measurement recorded. The samples were collected starting one minute prior to each tenth hour or centered on the hour and publicly recorded2.
For the period extending from 2009 to 2019,we utilized data collected as part of the National Park Service Southeast Coast Network in partnership with the North Carolina National Estuarine Research Reserve (Gregory et al., 2013) with data shared publicly. Water temperature (°C) was recorded at four second intervals every 15 minutes with a Yellow Spring Instruments (YSI) 6600 VR2 (2009-2017) and EXO2 (2017-2019) data sondes deployed at a fixed depth (0.5 m) relative to the bottom at WQ3 (34°41’40.0”N 76°37’06.0”W), located approximately 5 km from WQ1 (Figure 2).
To account for potential differences between water temperatures at shallow seagrass sites (SG1-4) and the channel station at WQ1 on Pivers Island, water temperatures recorded at WQ1 were calibrated against recordings at WQ3. The available historical data from WQ1 between 2009 and 2019 was regressed against the water temperature data at WQ3 during the same time interval (2009-2019). A regression equation was created using these two data sets across each year and the collective years. The most conservative regression equation was chosen (y=1.0079x-0.2194; R2 = 0.996). Subsequently, the historical data at WQ1 between 1962 and 1981 and between 1995 and 2008 was used in the regression equation to back-calculate estimates of water temperature for the seagrass study sites (SG1-4) between 1962 and 2008 and to determine water temperature trends for the past 57-years (Table 2).
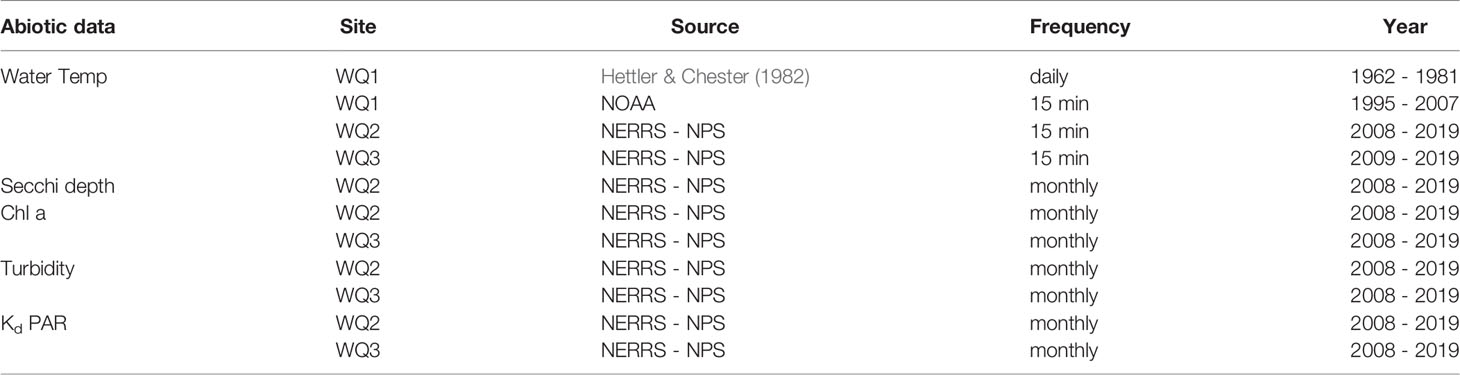
Table 2 Data sources, frequency of sampling, and years of collection for all water quality measurements at each site.
The approach of Shields et al. (2018) was adopted to characterize the summer stressful length for Z. marina in our study system and to compare to neighboring systems where observed declines occurred. The threshold temperature for summer stressful length was set at 25°C, based on the thermal stress tolerance of Z. marina (Evans et al., 1986). In situ growth experiments showed periods of low growth of Z. marina in the spring when water temperatures reached 23°C and ended after the summer season when temperatures dropped below 25°C in the fall (Batiuk et al., 1992). The beginning of the summer stressful season was determined by the first three consecutive days in each year of daily mean water temperatures recorded at the thermal growth optimum of Z. marina (≥ 23°C). The end of the summer stressful season was determined by the last three consecutive days in each year of daily mean water temperature recorded at the predetermined thermal threshold (≤ 25°C). Percent time above 25°C, 28°C and 30°C was calculated using data collected every 15 minutes for the months of June to September in 2009 -2019 from temperature data collected at WQ2 (Figure 2; Table 2).
To quantitatively characterize the long-term optical water quality properties and the submarine light environment in the region of our study sites, we examined the statistical properties and temporal trends of two optically active constituents of the water column, the concentration of chl a (ug l-l) and turbidity (NTU), as well as two metrics of water clarity, secchi depth and the attenuation of photosynthetically active radiation (Kd PAR) estimated from a calibrated bio-optical model (Gallegos, 2001; Biber et al., 2008; Hall, 2021).
We used water quality data (chl a, turbidity, salinity, secchi depth) collected as part of the National Park Service Southeast Coast Network in partnership with the North Carolina National Estuarine Research Reserve3,4 (Gregory et al., 2013). Chl a concentration (ug l-1) was obtained on 102 dates (approximately monthly) at stations WQ2 and WQ3 between 13 December 2007 and 1 October 2019. Turbidity (NTU/FTU) and salinity data were obtained using a YSI Model 6600 VR2 and EXO2 data sondes deployed at stations WQ2 and WQ3 between 8 January 2008 and 1 July 2020. Turbidity and salinity were collected every 15 minutes and used to compute monthly mean values at WQ2 (n = 130) and WQ3 (n =124) to match chl a sampling frequency. Following quality assurance and quality control protocols, chl a, salinity and turbidity data overlapped on 90 dates at WQ2 and 82 dates at WQ3. Secchi depth (m) was obtained at WQ2 (approximately monthly) on 105 dates between 13 December 2007 and 1 October 2019 using a 25 cm black and white disc lowered from a fixed overwater platform.
The attenuation of photosynthetically active radiation (Kd PAR) was estimated using a locally calibrated and validated bio-optical model (Biber et al., 2008; Hall, 2021). Formulation of the bio-optical model is based on knowledge of the light requirements of a seagrass species and the inherent optical properties of water using three optically active constituents responsible for scattering and absorption of light which are scaled to routine water quality measurements of chl a, turbidity (NTU) and colored dissolved organic matter (CDOM) (Gallegos, 1994; Gallegos and Kenworthy, 1996; Gallegos, 2001; Gallegos and Biber, 2004). We calculated Kd PAR with the model for 90 dates at WQ2 and 82 dates at WQ3 between 2008 and 2019 (approximately monthly) using corresponding data for chl a, turbidity and salinity described above (Biber et al., 2008; Hall, 2021). For the model, CDOM values were estimated based on the relationship between salinity and colored dissolved organic matter (CDOM) where CDOM (a440) = 0.25 + 12.77*freshwater fraction1.84 (Hall, 2021). The freshwater fraction (F) is calculated as F= (Ssw-S/Ssw where S is salinity and Ssw = 36 (local seawater salinity).
In addition to estimating Kd PAR, we also inverted the bio-optical model to quantitatively characterize the long-term optical water quality properties observed at stations WQ2 and WQ3 during our study period with respect to an empirically derived reference condition based on the known minimum light requirement of Z. marina (22% incident light at the surface (I0) and the observed maximum depth of growth (1.7m) in our study area (Biber et al., 2008). In the model output, the reference condition is defined as a line of constant light attenuation (Kd PAR = 0.89) calculated from explicit combinations of chl a, turbidity and CDOM yielding 22% I0 at a depth of 1.7m. This line is then used to delineate a threshold for suitable or unsuitable optical water quality conditions that support seagrass growth (Gallegos, 1994; Gallegos and Kenworthy, 1996; Gallegos, 2001; Biber et al., 2008).
All data analysis was performed in R statistical computation software (R Core Team, 2021). Data was examined for outliers, collinearity, and variance inflation factors prior to analysis (Zuur et al., 2007). Seagrass biomass data was analyzed at two levels, (1) across meadows (all species combined) and (2) by species (separated into temperate Z. marina and tropical/eurythermal H. wrightii + R. maritima). Meadow and species biomass were then compared across aboveground, belowground and total biomass (above and belowground biomass combined), seasons, and year.
Changes in meadow biomass (total, aboveground, belowground) as a function of season and year was analyzed using generalized linear mixed-effects model (GLMM) with a gamma distribution (link = “log”) holding site as the random variable (‘lme4’; Bates et al., 2015). Following data exploration, the large number of zeros in species level analysis in seagrass total biomass (20%), aboveground biomass (24%) and belowground biomass (18%) resulted in the selection of zero-inflated GLMM with a gamma distribution (link = “log”) holding site as the random variable (‘glmmTMB’; Brooks et al., 2017).
The relationship between meadow area and year was analyzed with a generalized linear model with a gamma distribution (link= “log”). The gamma distribution accounted for the positive only nature of the response variables for all biomass and meadow area analyses. Percent of maximum meadow extent across years was analyzed using a beta regression (‘betareg’; Cribari-Neto and Zeileis, 2010). The use of beta regressions was selected as the variables of interest were continuous and restricted to the interval (0, 1) (Zuur et al., 2007).
All water quality time series were analyzed for differences between sites and over time using Integrated Nested Laplace approximations (INLA) to account for temporal dependence in the dataset (‘INLA’; Rue et al., 2017; Zuur et al., 2017).
After running the global model with all possible factor combinations, all non-relevant covariates were removed, and the model was re-run until only relevant covariates remained (Zuur et al., 2007). Residuals were also inspected visually for patterns by plotting the fitted versus response variables. The best-fit model was considered to be the simplest model with the lowest Akaike information criterion (AIC) score (Zuur et al., 2007) which was calculated using the ‘bbmle’ package (Bolker, 2021; R Core Team, 2021). Overall effects of categorical variables were quantified via analysis of deviance for all model parameters using a type II ANOVA for models with no interaction terms and a type III ANOVA when interactions were present (‘car’ package; Fox and Weisberg, 2019). During post hoc analysis all pairwise comparisons were computed from the contrasts between factors with a ‘tukey’ adjustment using ‘lsmeans’ package (Lenth, 2016).
The accuracy of the 24 classified orthoimages in depicting presence-absence of seagrass ranged from 84% to 96%, with an average accuracy of 91.4%. This level of accuracy is comparable to the accuracy of remote sensing-derived habitat maps in the same area, following a very similar classification protocol (Gray et al., 2018). Overall, there was not a consistent change in seagrass areal extent over the 39-year period of aerial photographic observations (ChiSq = 14.159, DF = 5, p = 0.146; Figure 3A; Table S3). However, standardizing meadow area to percent of the maximum area ever observed at the four sites between 1981 and 2019, shows significant reductions in extent in 2019 (ChiSq = 28.4, DF = 5, p <0.00) driven by significantly lower values in 1992 and 2019 (Figure 3B; Table S4). Seagrass areal coverage nearly doubled between 1981 and 2006 and remained elevated until at least 2013. Six years later in 2019 the acreage declined back to values similar to 1981 and 1992 but were less than 50% of the maximum extent of coverage observed in 2006, 2008 and 2013. During all other periods, changes in seagrass extent was variable with gains and losses both sometimes exceeding 50% from the previous observation.
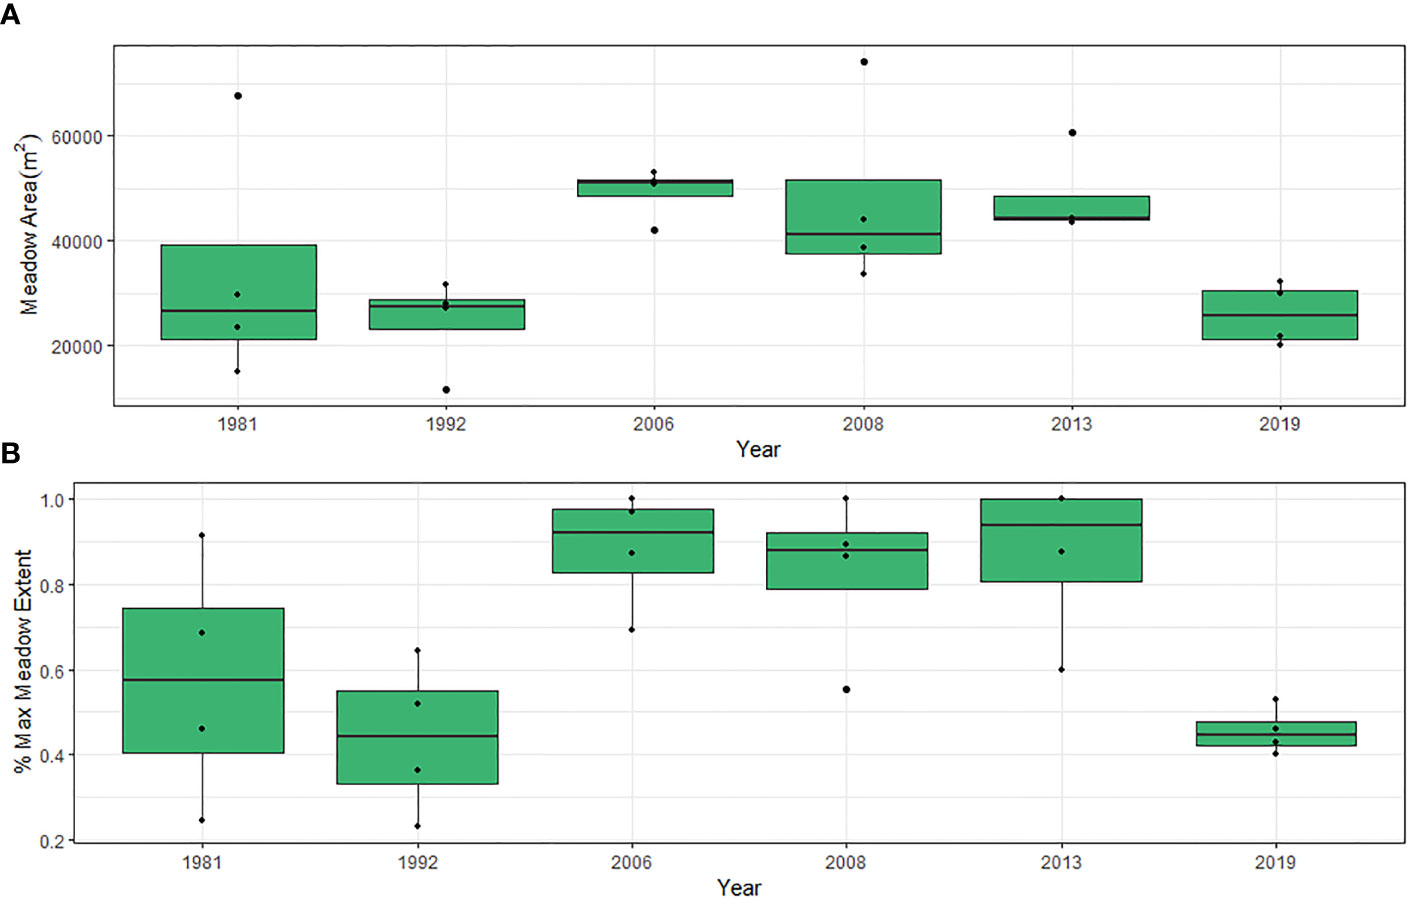
Figure 3 (A) Total seagrass meadow area (m-2) and (B) Percent of maximum meadow extent for four sites in Back Sound, NC from 1981 to 2019. Box plots indicate minimum to maximum values (whiskers), first to third quartile distribution of the data (box), median values (solid line), and include all data used in analysis (points).
Meadow total biomass (combined above and belowground) for all species was greater in the spring, when Z. marina biomass typically peaks, than in the summer (t value = -2.614, DF = 1, p = 0.009) and significantly different among years (Chi-sq = 237.967, DF = 6, p < 0.001; Tables S5A, B). Total biomass was lower in 2016, 2018 and 2019 compared to all previous sampling years (Figure 4A). When separating biomass by species, there was a significant interaction between species and season (Chi-sq = 10.156, DF = 1, p = 0.001; Tables S6A, B) as Z. marina total biomass was greater than H. wrightii + R. maritima in both spring and summer seasons prior to 2018. In 2019 combined H. wrightii + R. maritima total biomass was greater than Z. marina in the summer for the first time in 40 years (Figure 4B).
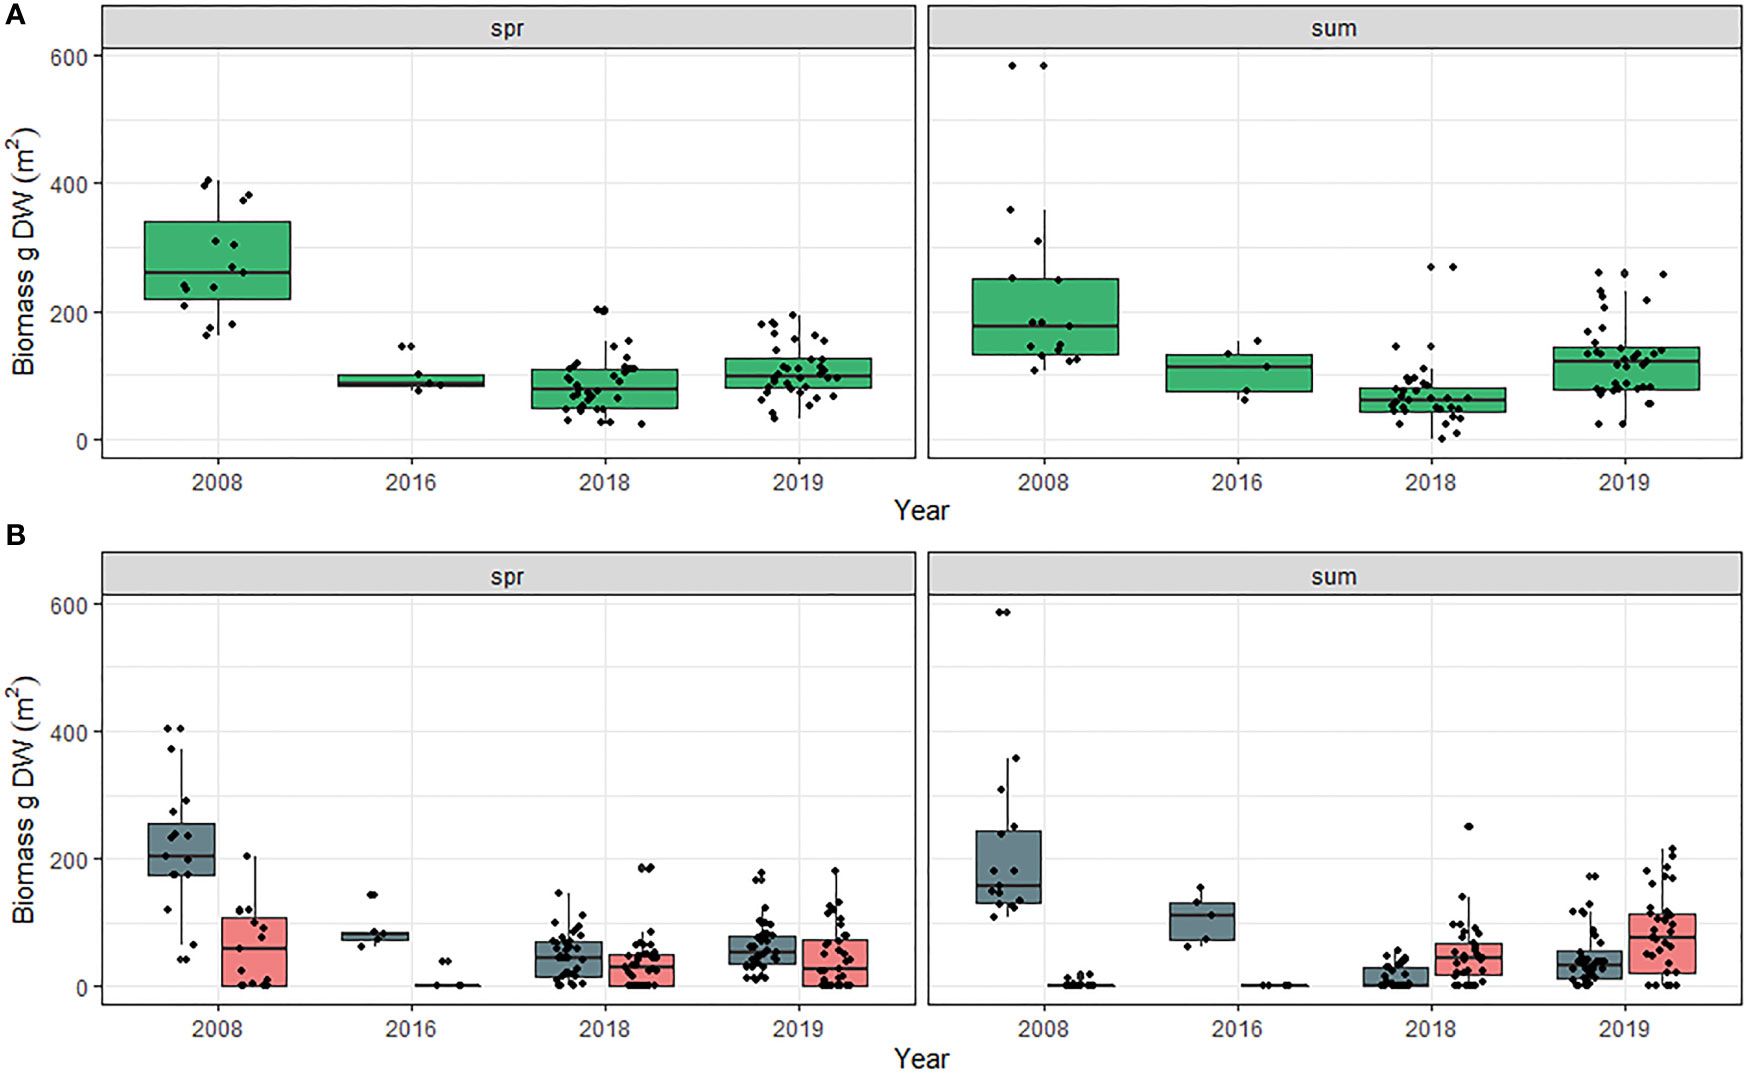
Figure 4 (A) Total meadow biomass (aboveground + belowground) for all species and (B) Meadow total biomass by species in Back Sound, NC in the spring and summer from 1979 to 2019. Spring = April –June. Summer = July-September. Blue bars Z. marina, and pink bars = H. wrightii + R. maritima. Belowground biomass was not separated by species in 1991 and 1992 therefore those years were omitted. Scales along y-axis are not equal. Box plots indicate minimum to maximum values (whiskers), first to third quartile distribution of the data (box), median values (solid line), and include all data used in analysis (points).
Meadow aboveground biomass was also greater in the spring than in the summer (t value = -4.225, DF = 1, p<0.001) and was impacted by year (Chi-sq = 224.814, DF = 6, p<0.001; Tables S7A, B). Like total biomass, meadow aboveground biomass was lower in 2016, 2018 and 2019 compared to all other years (Figure 5A). Species aboveground biomass was greater in 1979, 1992 and 2008 for Z. marina and in 1991 and 1992 for H. wrightii + R. maritima than all other years (Chi-sq = 65.045, DF = 6, p < 0.0001; Tables S8A, B). Species biomass also varied significantly across season with greater Z. marina biomass in the spring than H. wrightii + R. maritima; however, there was no difference between species in the summer (Chi-sq = 51.629, DF = 1, p < 0.001). At the species level there was also a significant season and year interaction with aboveground biomass in 1992 in the spring and summer greater than all years and seasons except for spring 1991 (Chi-sq = 29.655, DF = 6, p <0.001; Figure 5B).
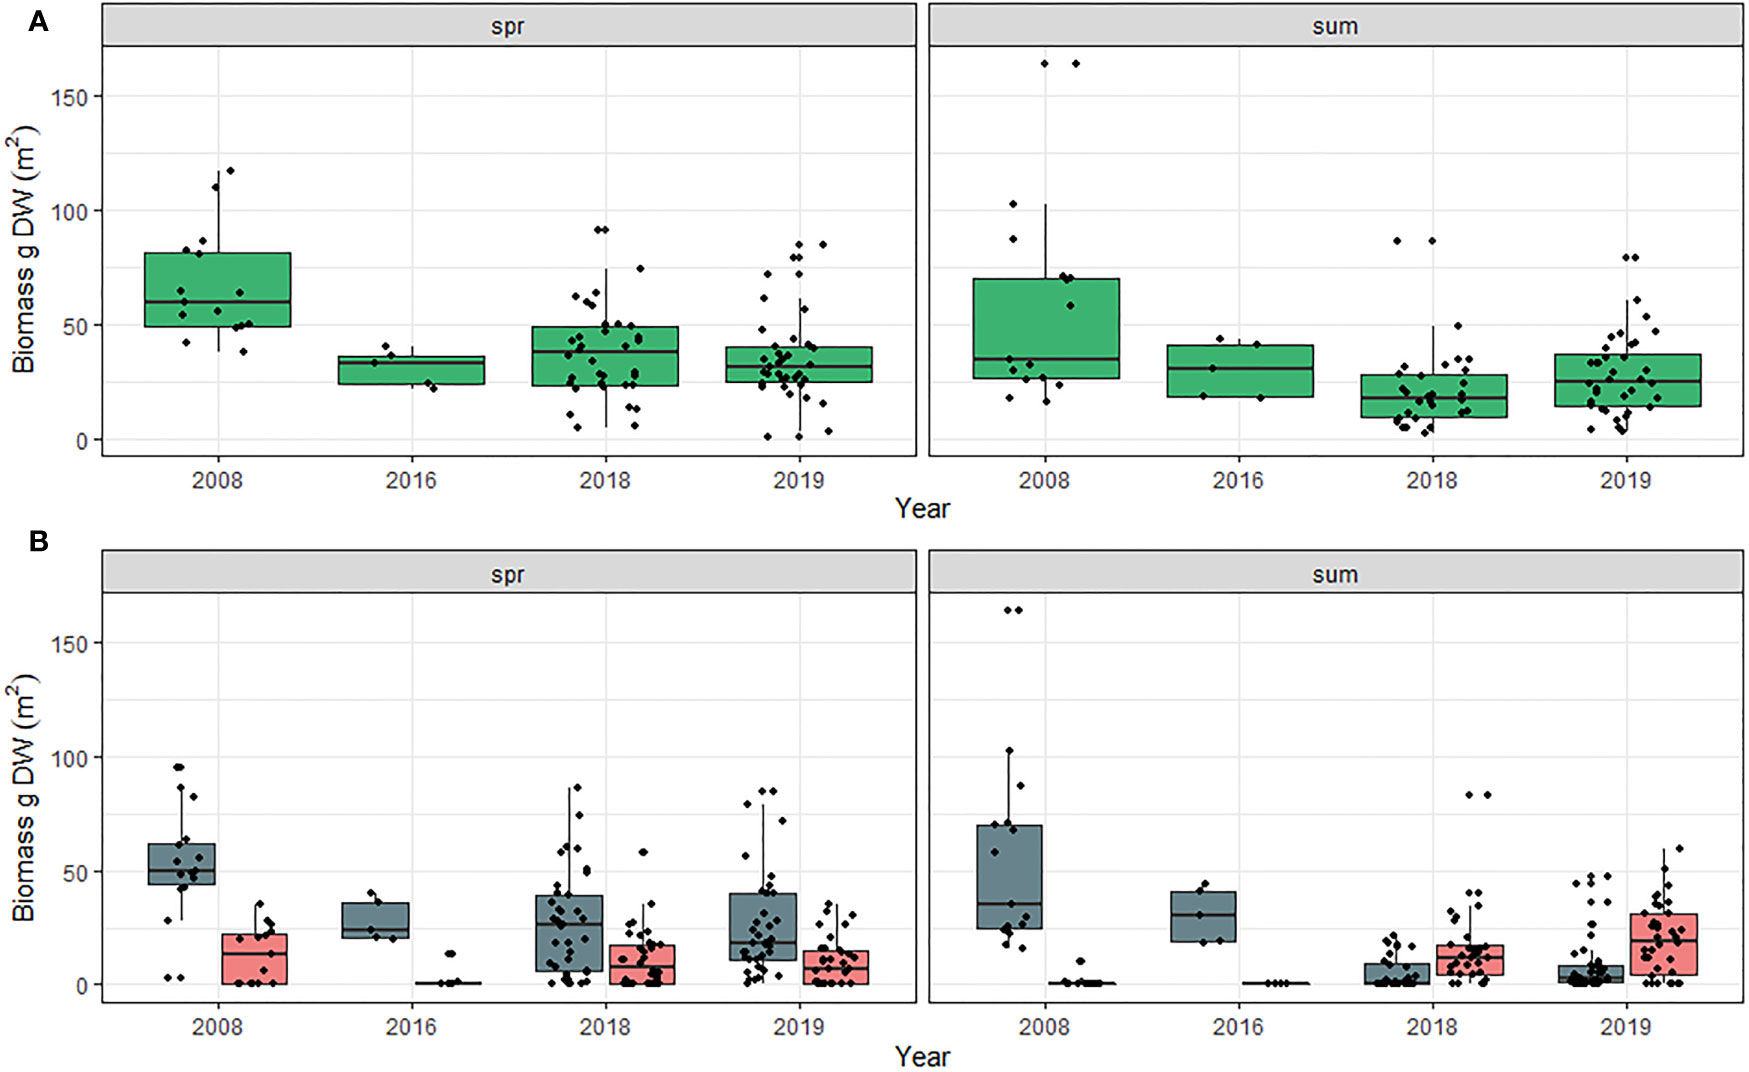
Figure 5 (A) Total meadow aboveground biomass for all species and (B) Meadow aboveground biomass by species in Back Sound, NC in the spring and summer from 1979 to 2019. Spring = April –June. Summer = July-September. Blue bars Z. marina, and pink bars = H. wrightii + R. maritima. Scales along y-axis are not equal. Box plots indicate minimum to maximum values (whiskers), first to third quartile distribution of the data (box), median values (solid line), and include all data used in analysis (points).
Total belowground biomass was significantly impacted by an interaction with year and season (Chi-sq = 21.201, DF = 6, p = 0.002; Tables S9A, B). Greater belowground biomass occurred in the spring prior to 2016 but shifted to greater belowground biomass in the summer in 2018 and 2019 (Figure 6A). At the species level, there was a significant difference between years (Chi-sq = 53.778, DF = 4, p<0.001; Tables S10A, B) due to a reduction in Z. marina belowground biomass in 2018 and 2019 compared to 1979 and 2008 (Figure 6B; Supplementary Figure S2). There was also a significant interaction between species*season (Chi-sq = 3.0093, DF = 1, p = 0.083). This reflects a shift in belowground biomass over time as pre-2018 Z. marina was greater than H. wrightii +R. maritima, and in 2019 it was the opposite (Figure 6B).
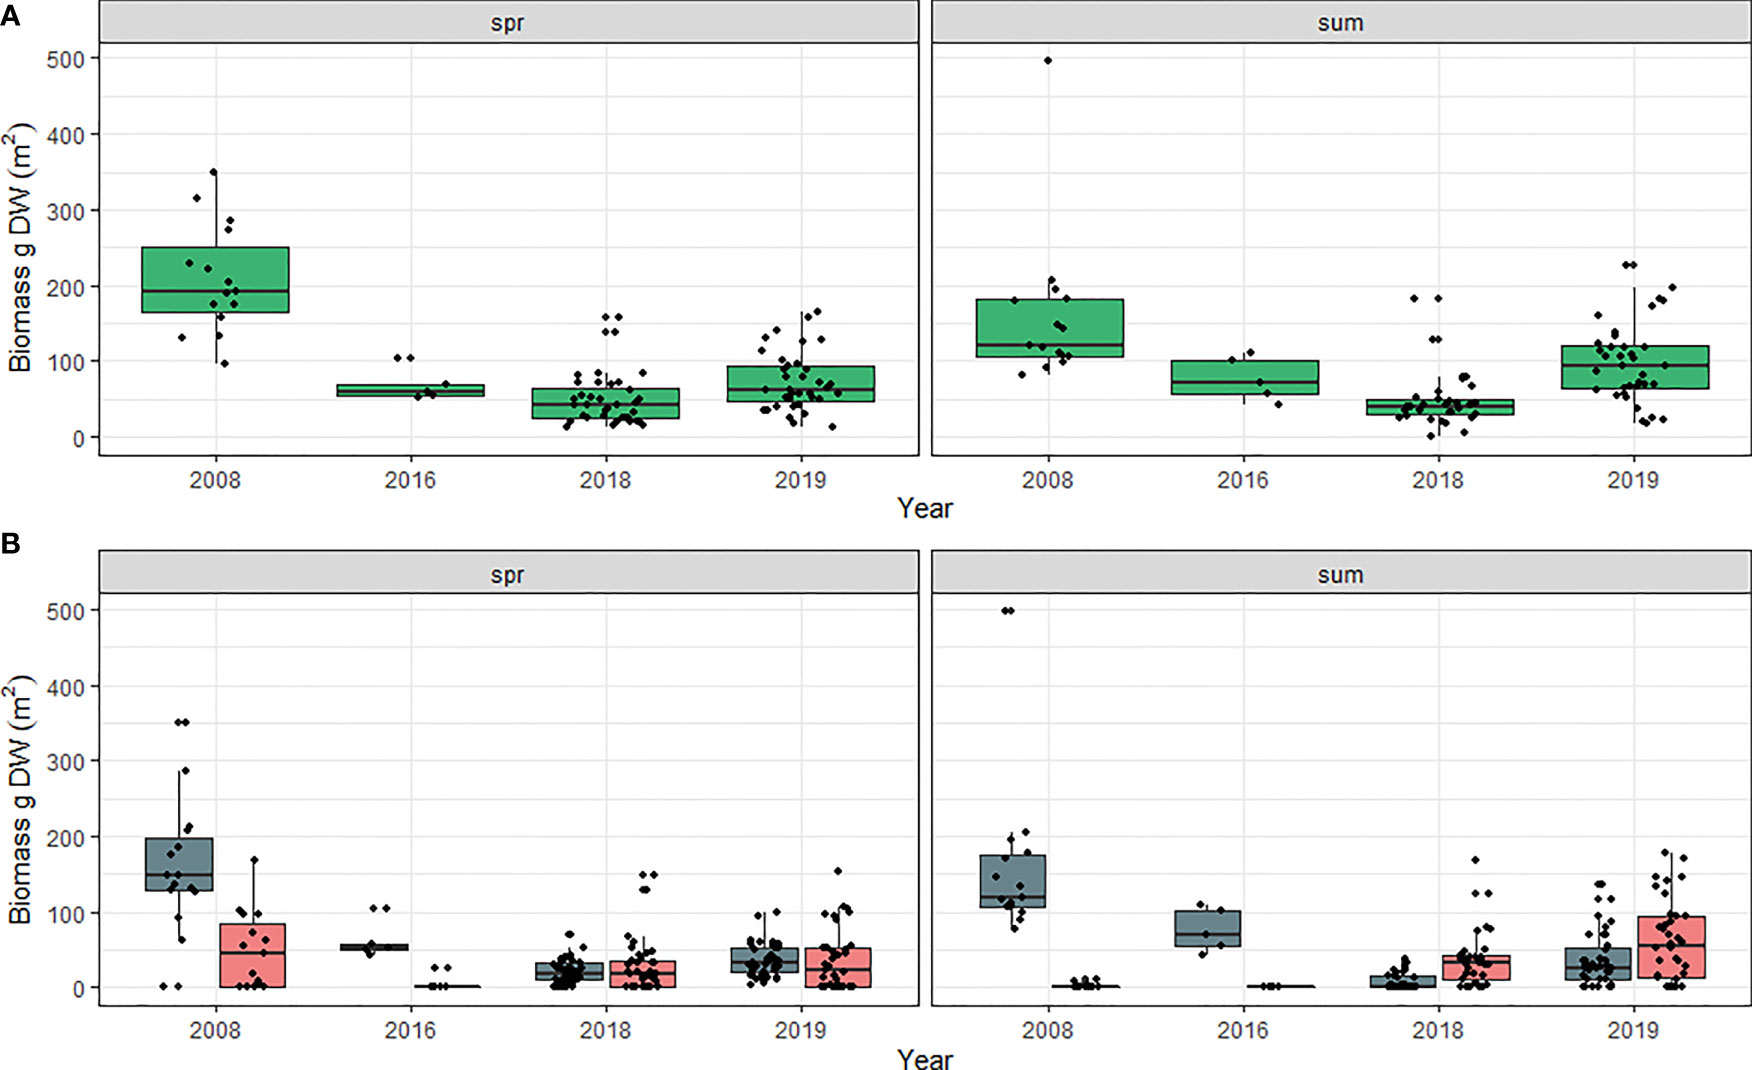
Figure 6 (A) Total meadow belowground biomass for all species and (B) Meadow belowground biomass by species in Back Sound, NC in the spring and summer from 1979 to 2019. Spring = April –June. Summer = July-September. Blue bars Z. marina, and pink bars = H. wrightii + R. maritima. Belowground biomass was not separated by species in 1991 and 1992 therefore those years were omitted. Scales along y-axis are not equal. Box plots indicate minimum to maximum values (whiskers), first to third quartile distribution of the data (box), median values (solid line), and include all data used in analysis (points).
The length of the summer stressful season in Back Sound increased from 85 days in 1962 to a maximum value of 156 days in 2019 (Figure 7). Across approximately six decades, the length of the summer stressful growth season increased by over two months (approximately 71 days), increasing the time spent when temperatures exceeded 25°C, or the thermal optimum for the seagrass species Z. marina (Marsh et al., 1986). During the last decade, a steady increase in the summer stressful growing season without fluctuations was observed. In most recent years (2018 – 2019), the steady increase in the summer stressful growing season length rose to values outside of the range observed in previous years. As a result, thermally induced stress occurred decades earlier in the trailing edge-of-range Z. marina meadows in NC than in more poleward populations (e.g., York River, Chesapeake Bay VA, Figure 7).
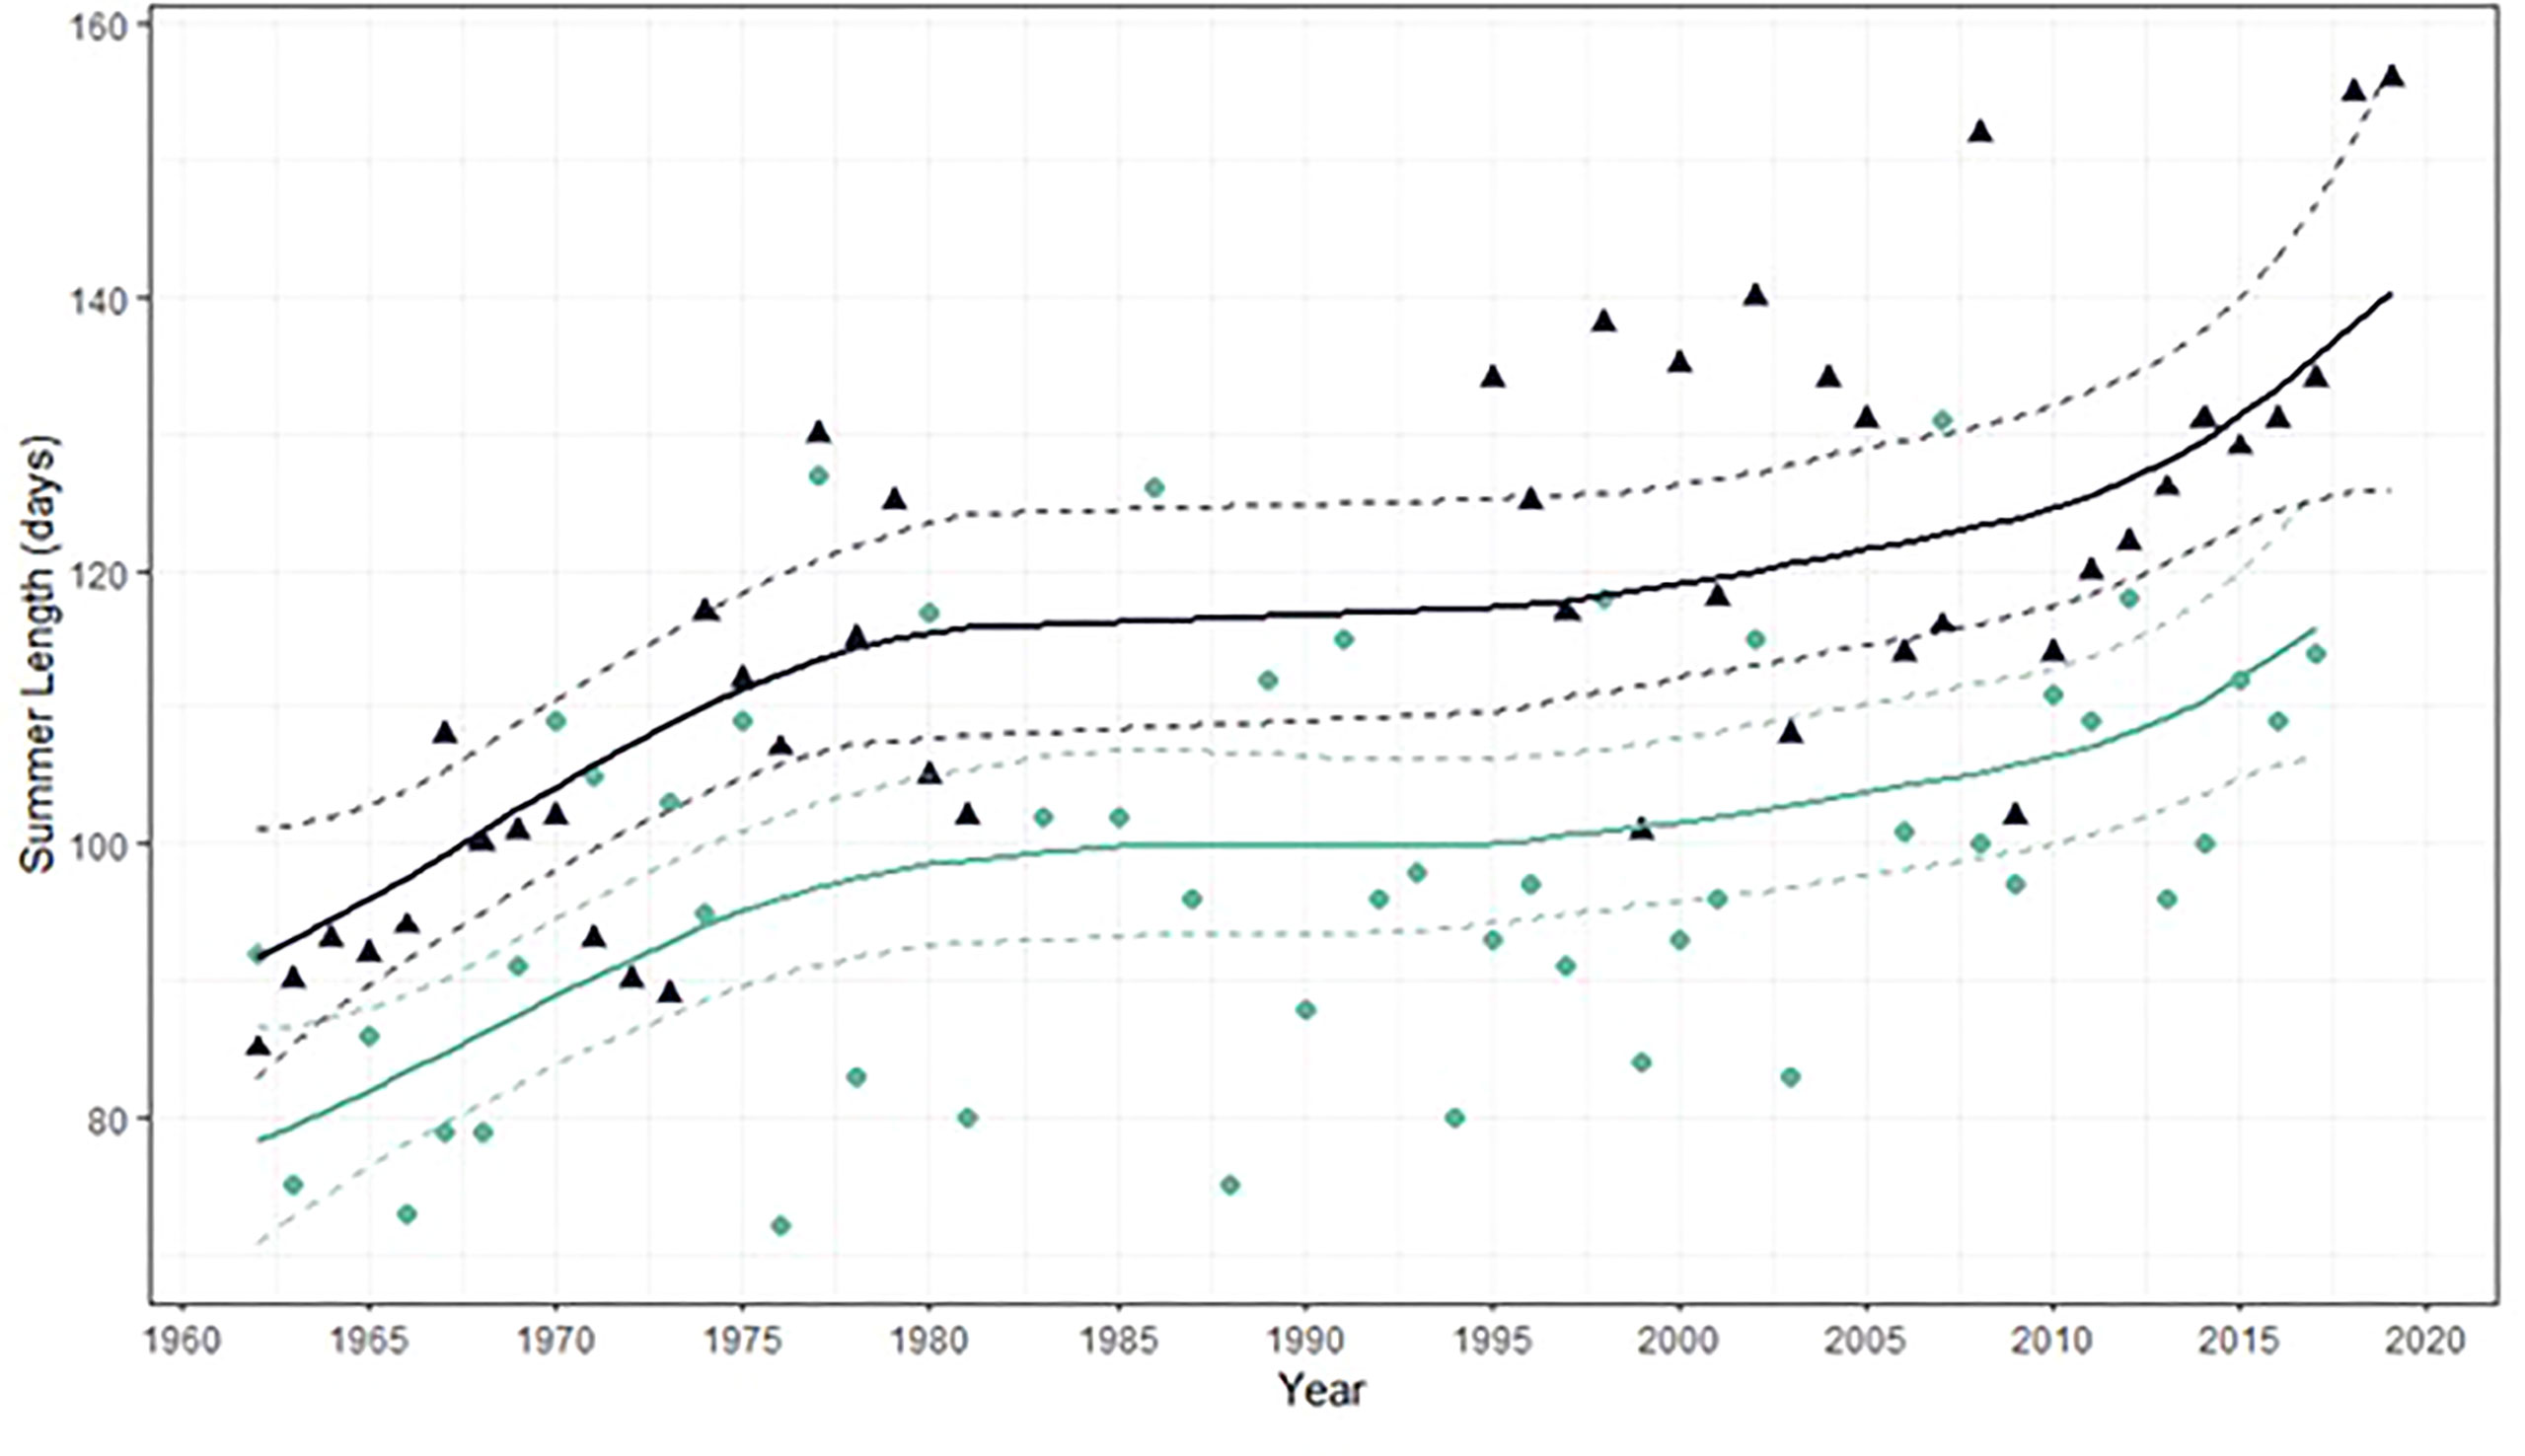
Figure 7 Stressful summer length for Z. marina in both Back Sound NC (dark blue triangles) and York River VA (teal circles). Solid lines represent mean fitted values from gamma regression with temporal correction factor and dotted lines represent 95% confidence intervals. York River data from Shields et al. (2018).
In addition to the stressful summer season lasting longer, the time that Z. marina was exposed to extreme temperatures also increased over time (Figure 8). During the last decade in Back Sound, water temperatures were >28°C for 47% of the time (dashed black line in Figure 8). As a result, local seagrasses were exposed to temperatures that induce meadow decline outside of normal seasonal loss for almost half of the stressful summer season. While the occurrence of temperatures >30°C is still rare (<5% of the time) between June and September, daily mean water temperatures routinely exceeded 30°C, the lethal threshold of Z. marina (Marsh et al., 1986), in 2016, 2018 and 2019 (solid black line in Figure 10). This was a deviation from patterns prior to 2016 when daily mean water temperatures did not exceed 30°C for 5 out of 7 years (Figure 8).

Figure 8 Daily mean water temperature from 2009-2019 in Middle Marsh, Back Sound NC. Reference lines for established threshold values for stressful (25°C dotted lines), meadow decline (28°C dashed line), and lethal temperatures (30°C solid line) are shown in black.
Over the 12-year monitoring period between 2007 and 2019 monthly chl a values ranged from 0.29 – 8.32 ug l-1) (Figure 9A). Mean chl a concentrations were slightly higher at WQ2 (2.8 ± 1.59 ugl-1) than at WQ3 (1.96 ± 1.07 ugl-1) and there was no detectable pattern with time at either site. Median values were slightly lower than means at both WQ2 (2.45 ugl-1) and WQ3 (1.84 ugl-1). Over the same period, monthly mean turbidity averaged 5.62± 2.76 NTU at WQ2 and 5.96± 2.87 NTU at WQ3, ranging between 0.23 and 18.82 NTU (Figure 9B). Median values at WQ2 (5.16 NTU) and WQ3 (5.41 NTU) were both slightly lower than the means. As was the case for chl a, there was no detectable temporal pattern in turbidity over the 12-year period.
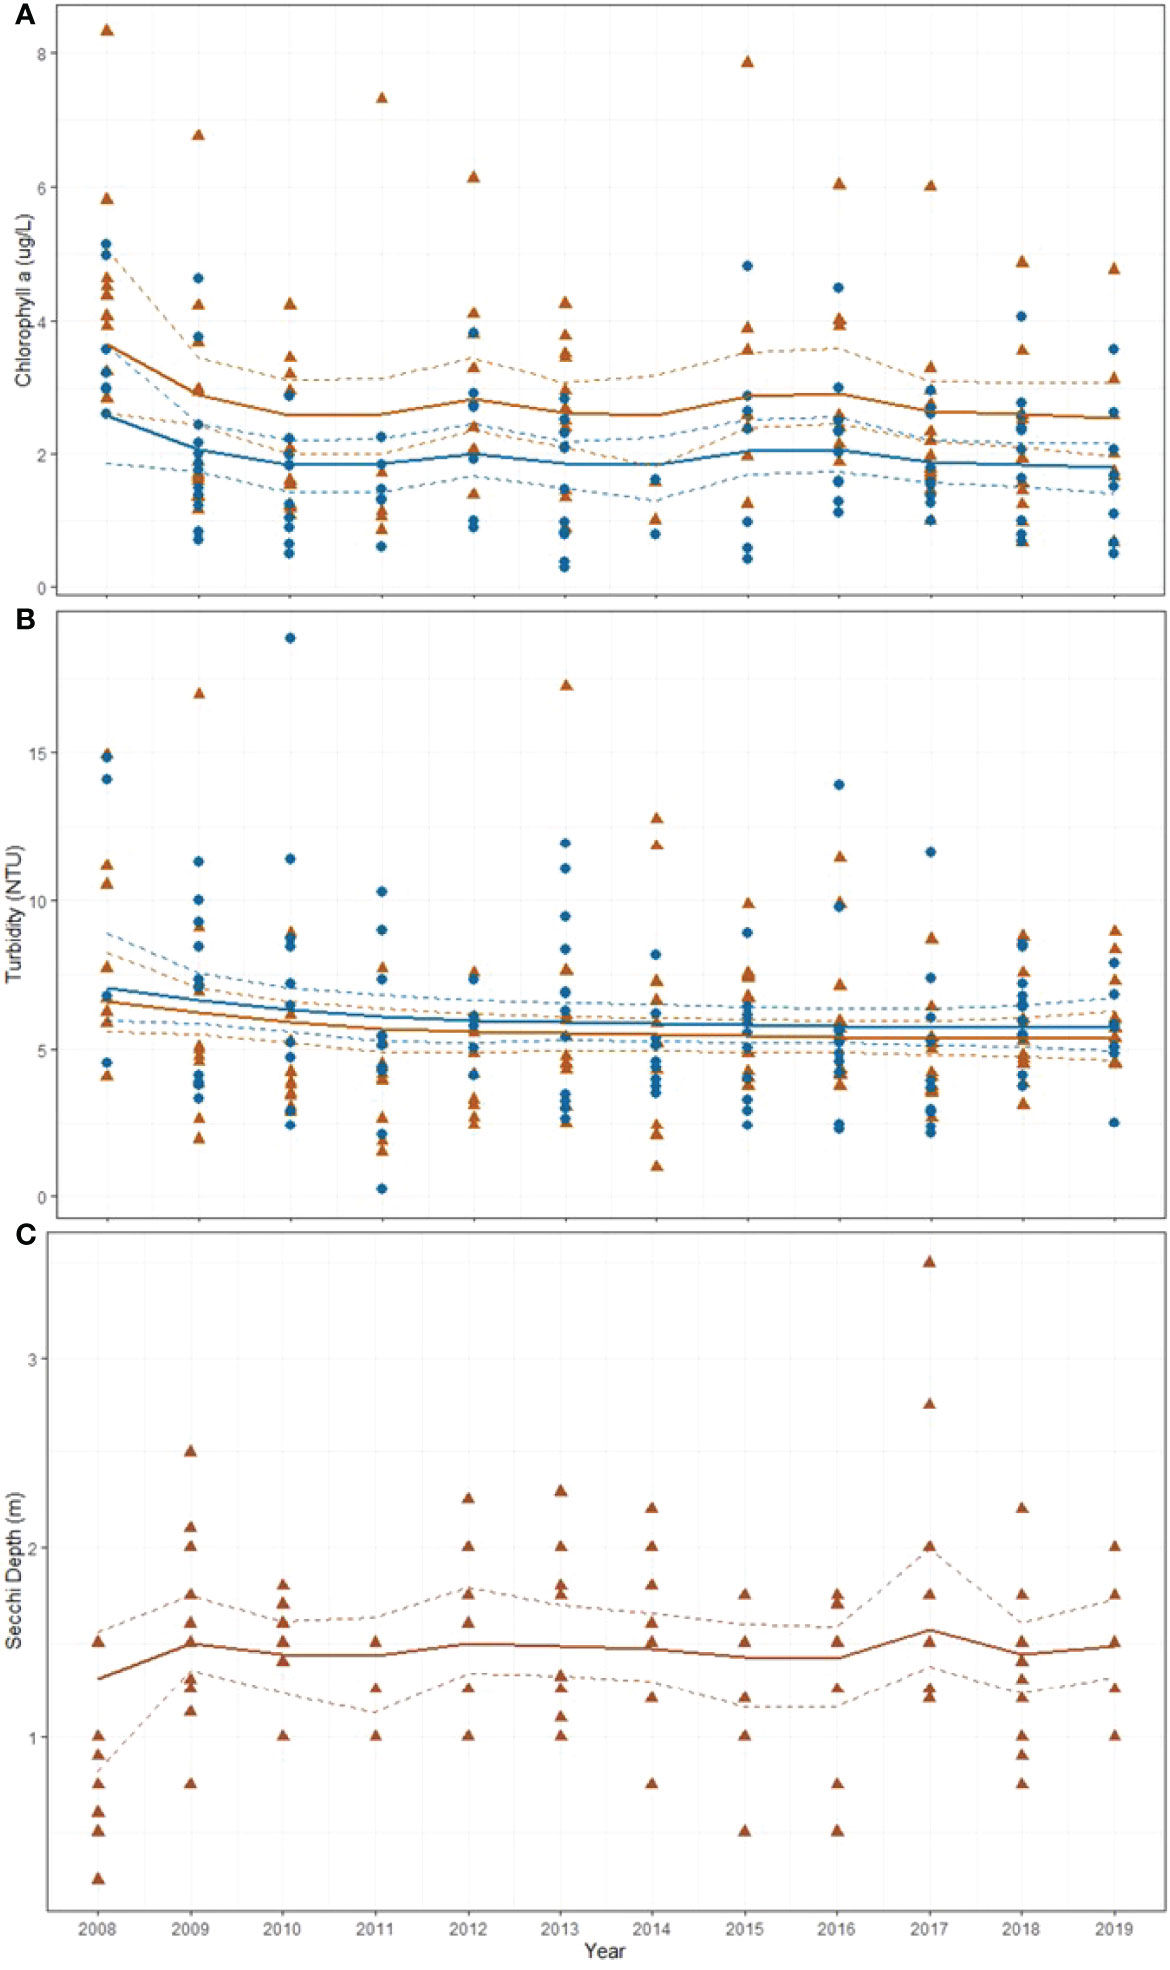
Figure 9 Monthly (A) chlorophyll a (ug/L), (B) mean turbidity (NTU), and (C) secchi depth (m) at WQ2 (brown triangles) and WQ3 (blue circles) in Back Sound NC. Solid lines represent mean fitted values from gamma regression with temporal correction factor and dotted lines represent 95% confidence intervals.
During the 12-year period secchi depth at WQ2 averaged 1.45 ± 0.51 m (median = 1.5 m) (Figure 9C). Light attenuation (Kd PAR) estimated from the bio-optical model averaged 0.70± 0.17 (median = 0.67) at WQ2 and 0.79 ± 0.21 (median = 0.66) at WQ3 (Figure 10).
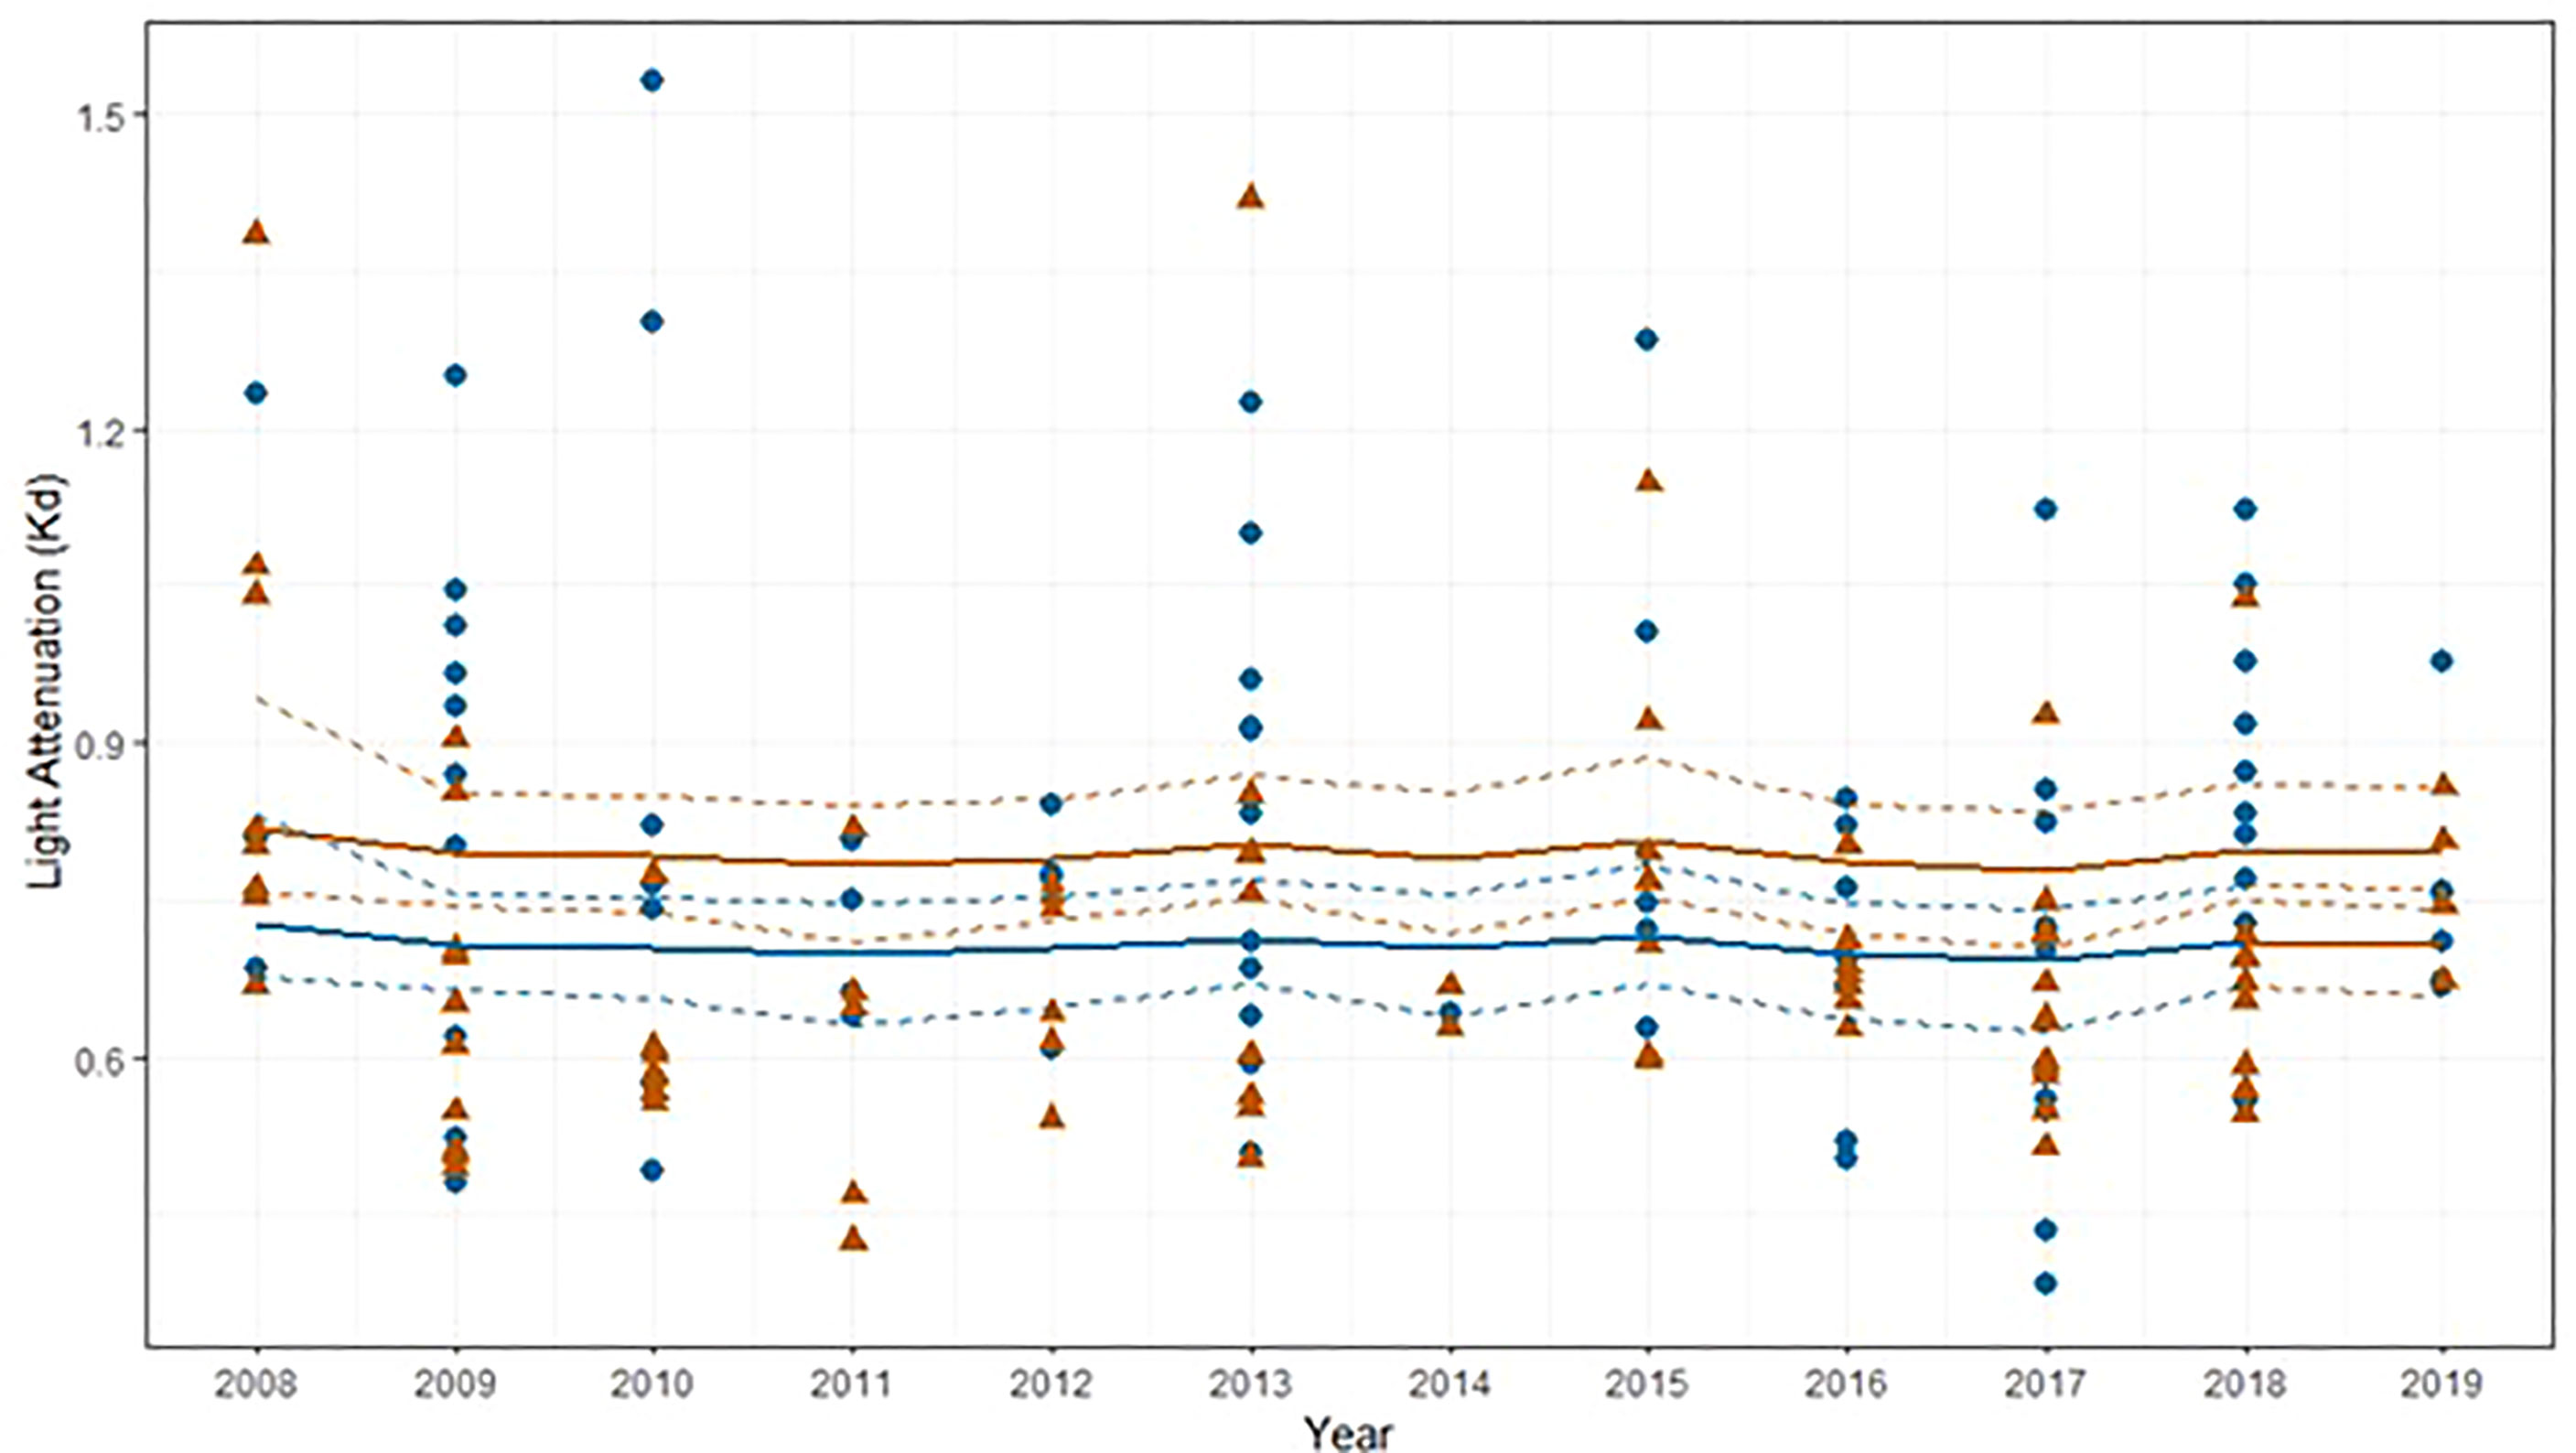
Figure 10 Calculated light attenuation coefficients (Kd) to 1 m depth at WQ2 (brown triangles) and WQ3 (blue circles) in Back Sound NC. Solid lines represent mean fitted values from gamma regression with temporal correction factor and dotted lines represent 95% confidence intervals.
The inverted bio-optical model indicated that the median values of paired chl a and turbidity data for WQ2 and WQ3 fall below the line of constant attenuation (22% Io at -1.7m) indicating that under most observed water quality conditions the light levels at these two sites should permit seagrass to grow to depths ≤ 1.7m (Figure 11). Inspection of the inverted model output shows that deviations in chl a concentration had very little effect on the optical water quality at these two sites and most of the variability in the light regime is due to substantially greater fluctuations in turbidity. Periodic, but brief, spikes in turbidity drive Kd PAR values above the line of constant attenuation and temporarily establish optical conditions unfavorable for seagrass growth.
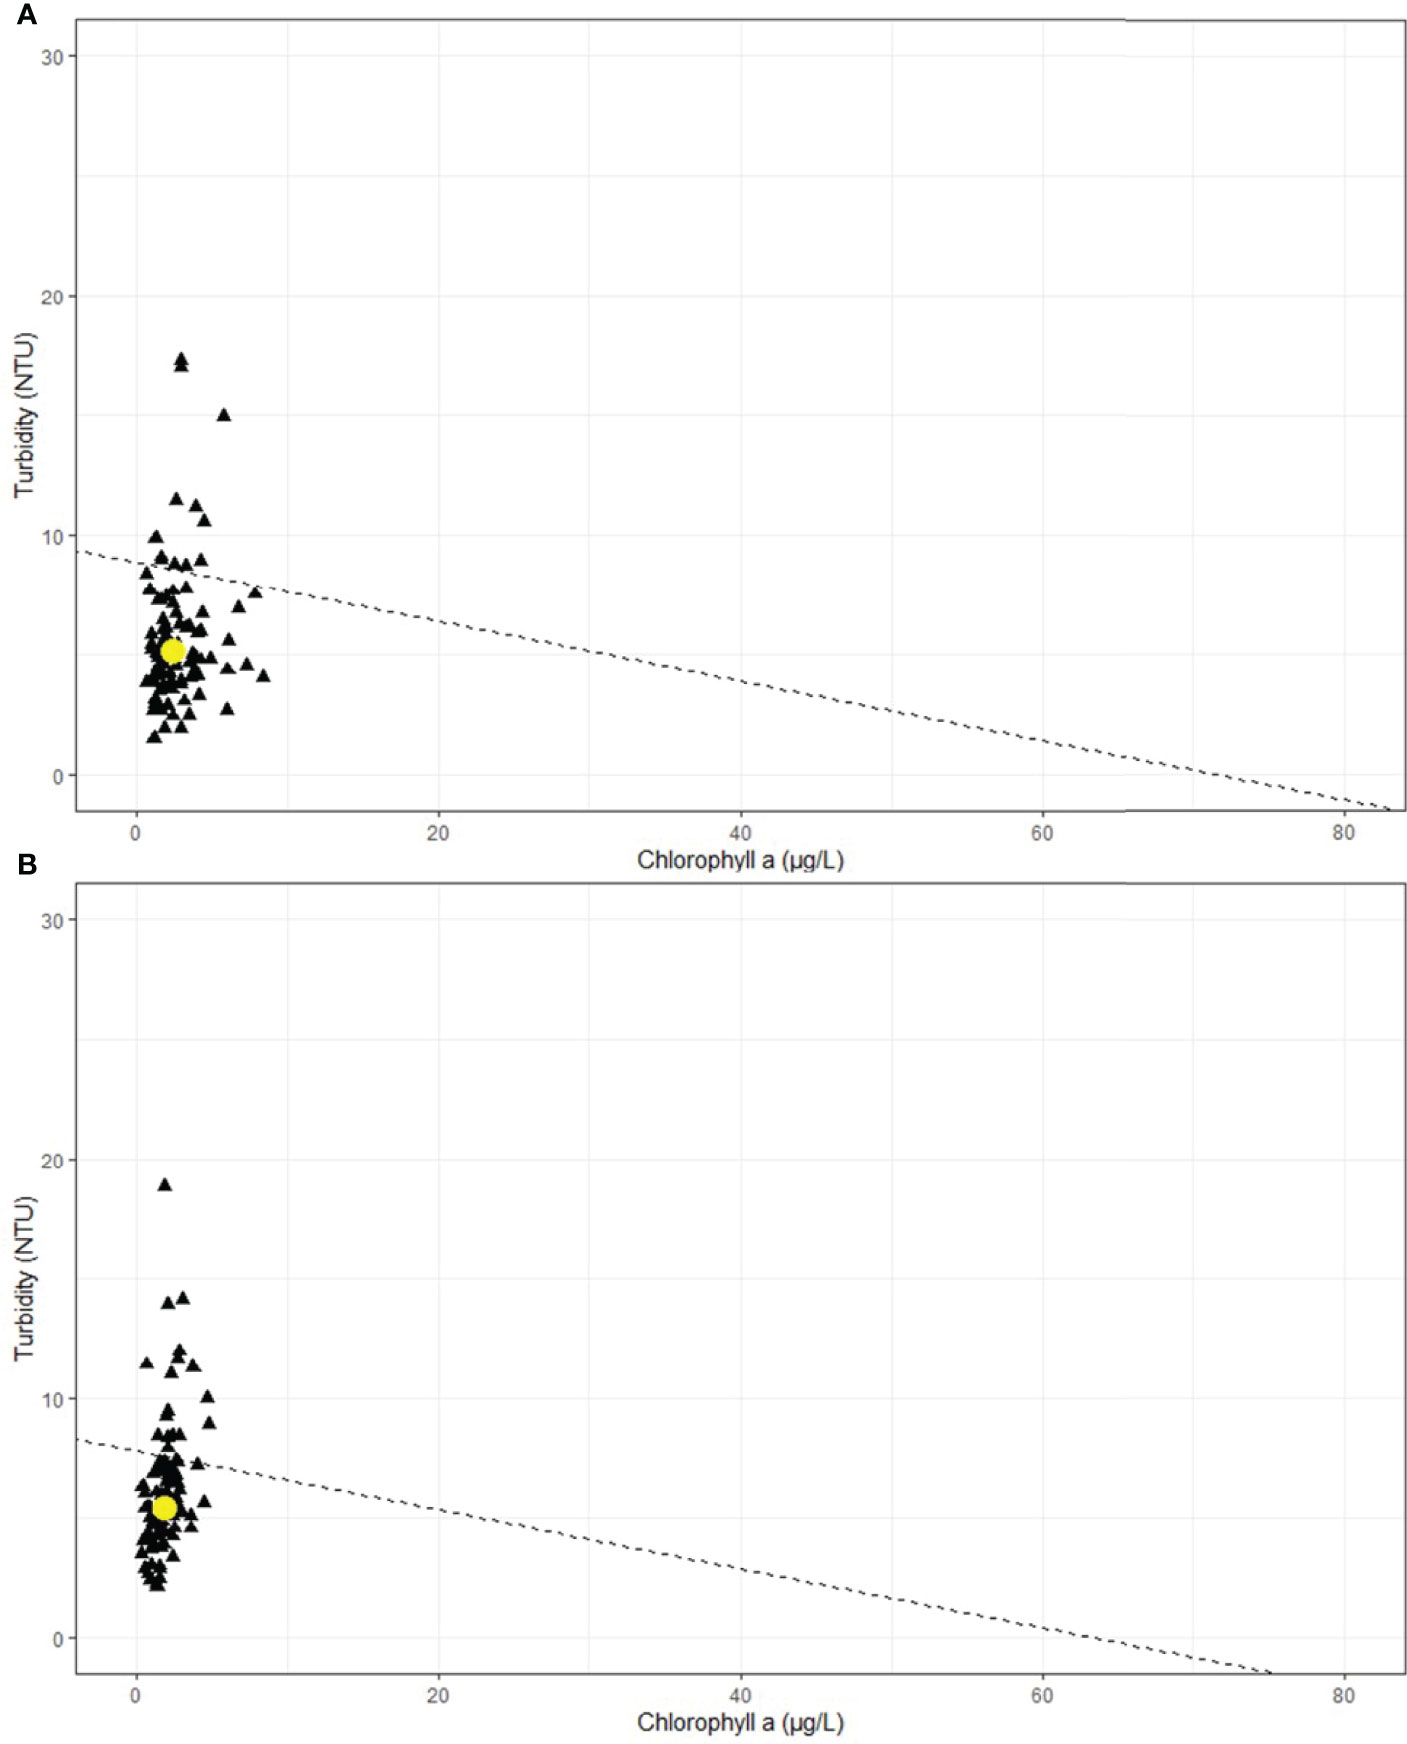
Figure 11 Inverted bio-optical model output for both (A) WQ2 and (B) WQ3 in Back Sound, NC. Yellow circle is median chl and turbidity value. Dashed line is the line of constant attenuation (22% I0 at 1.7m depth).
The present study provides a unique analysis of how novel combinations of temperate and tropical seagrass species impact the resilience and stability of edge-of-range seagrass meadows over decadal time scales. We show that the persistence of temperate Z. marina populations at its trailing edge where seasonal stressful water temperatures (>28-30°C) are recorded is facilitated by water clarity and meadow area stability due in part to the consistent presence of leading-edge populations of tropical H. wrightii maintaining meadow area, whereas large-scale declines have occurred in more poleward populations. However, our study also shows that temperate species in edge-of-range tropicalized meadows are still limited by physiological thresholds despite the possibility for localized adaptation, and when these limits are exceeded, related declines in meadow biomass and area are not fully replaced by tropical species over short (<5 year) time scales. Therefore, while tropicalization of seagrass meadows may result in greater species diversity and resilience to abiotic stressors in the short-term, declines in temperate species biomass and area during the process of tropicalization may have significant impacts on meadow function.
The 40-year record of seagrass abundance reported here displayed large fluctuations punctuated by peak values in biomass (1979, 1992, 2008) and areal coverage (2006, 2008, 2013). Our data indicate that all species persisted in the meadows; however, total meadow biomass in 2019 was substantially less than in 1979; 61% lower in spring and 39% lower in summer (Figure 4). Examining the data by species indicates that these declines in total biomass, primarily attributed to loss of the temperate species Z. marina, were partly attenuated by gains in the tropical and eurytolerant species, H. wrightii and R. maritima. It can therefore be inferred that the high-heat tolerant species are providing some modest level of meadow-scale resilience to loss of the temperate seagrass over time.
At our four study sites seagrass areal coverage nearly doubled between 1981 and 2013. Six years later in 2019 the acreage declined back to values similar to 1981 and 1982, the previous low in recorded meadow area, and less than 50% of the maximum extent of coverage observed in 2006, 2008 and 2013. It should be noted that all the aerial imagery was collected between early May and early June (Table S1), which corresponds with the local seasonal peak in aboveground biomass of Z. marina, but before the local seasonal peak for H. wrightii (Kenworthy, 1981; Thayer et al., 1984; Jarvis et al., 2012). While individual species cannot be distinguished in the imagery, we have documented the presence of Z. marina and H. wrightii and R. maritima at each site. However, changes in seagrass extent as indicated by our imagery analysis are more likely to reflect changes in Z. marina areal coverage than the other two species. Our observations suggest that these fluctuations are largely the result of the fecundity and seed dispersal capacity of Z. marina into sites that are seasonally stressed by low light levels, high temperatures and exposure (e.g., shallow intertidal areas, marsh embayments and tributaries). These habitats differ from safer sites (e.g., subtidal waters, stable sediments, moderate circulation) where Z. marina is less likely to experience extreme stressors and more likely to persist. These fluctuations could be characterized as the intrinsic properties of meadows composed of species growing at their “edge-of-range” where they are likely to experience relatively more frequent and longer periods of stressful environmental conditions (Strydom et al., 2020; Pinsky et al., 2020). However, when the area and biomass data are examined concurrently the significantly lower total seagrass biomass observed post 2008 and the decline in meadow area extent between 2013 and 2019 may indicate a reduction in the resilience of the meadows over the last ten years of our dataset. During this period, the cumulative effect of increasing summer heat stress coupled with periodic and shorter term fluctuations in optical water quality may be “thinning” seagrass biomass (Morris et al., 2022).
Changes in meadow resilience over time in Back Sound are reflected at the species level at a seasonal scale. Meadow total biomass was significantly greater in spring, reflecting the expected influence of Z. marina during its peak growing season (Kenworthy, 1981; Thayer et al., 1984; Jarvis et al., 2012). However, following the relatively higher biomass recorded in 1992, total meadow biomass declined in the later period of record (2016, 2018 and 2019) when there was a significant decrease in Z. marina biomass, especially in 2019 when biomass of H. wrightii and R. maritima exceeded Z. marina in the summer for the first time in the 40-year record. As might be expected, the meadow aboveground and belowground biomass followed similar temporal patterns as total biomass and declined during the later period (2016, 2018 and 2019) from the higher values recorded in 1992. The notable increase in belowground biomass for the tropical and eurytolerant species H. wrightii and R. maritima supports the hypothesis that these species are providing some added resilience to increasing summer temperature stress.
Species near the limits of their physiological tolerances are expected to contract their ranges as local populations decline (Parmesan, 2006), while more stress-tolerant or opportunistic species may increase in abundance or relative importance as sensitive species decline (Walther, 2010; Pinsky et al., 2020). The shallow coastal estuarine systems in North Carolina are located at the transition between temperate and sub-tropical seagrass geographical regions along the Western Atlantic Ocean (Short et al., 2007). In these systems increases in mean water temperatures of >1.4°C between 1985 and 2005 (Micheli et al., 2008) have resulted in daily mean water temperatures routinely exceeding 30°C (Z. marina’s expected lethal threshold; Marsh et al., 1986) in July and August with plants exposed to temperatures >28°C for 47% of the time during between June and Sept. (Figure 10). The length of the stressful summer season has also increased from 84 to 156 days between 1962 and 2019 (Figure 7). This has resulted in levels of thermal stress occurring 45 years earlier for the trailing edge-of-range Z. marina meadows in NC than more poleward populations (e.g., Chesapeake Bay VA, Figure 7), while reducing stress for the leading edge-of-range H. wrightii. If this trend continues, it is expected that Z. marina will continue to decline (Wilson and Lotze, 2019).
The persistence of multi-species seagrass meadows in southeastern North Carolina over the last 40 years despite an increase in the magnitude and duration of stressful water temperatures can be attributed, in part, to temporally staggered thermal stressful periods (Thayer et al., 1984; Micheli et al., 2008). During high heat stress months, most of the Z. marina biomass is lost from exfoliation of leaves which results in significant meristem mortality. In shallow subtidal meadows where tidal exchange mitigates high water temperatures some of the meristems survive and initiate regrowth in the fall when temperatures decline. Yet, H. wrightii remains throughout summer and into the fall, maintaining viable meristems and sustaining the meadow structure (Thayer et al., 1984; Micheli et al., 2008). For several months H. wrightii leaves and rhizomes keep the sediment intact thereby protecting the Z. marina seed bank and the seagrass meadows in the system from the negative effects of total seagrass loss including increased erosion and sediment resuspension and reductions in water quality (Moore, 2004). In areas where H. wrightii is not present Z. marina may be limited if there is not additional structure (e.g., saltmarsh) to protect the meadow from the effects of physical disturbances (Fonseca and Bell, 1998). Currently the level of facilitation between the tropical and temperate seagrass species in NC is unknown and requires further investigation; especially the winter cold tolerance of the leading edge species, H. wrightii (Morris et al., 2021)
Despite being geographically closer to the southern edge of Z. marina’s range and having increasingly longer summer stressful water temperature periods for nearly six decades, the changes in seagrass abundance (area and biomass) in Back Sound are not comparable in magnitude to the scale of Z. marina declines reported in more poleward populations (Shields et al., 2018). On average, the summer stressful growing seasons have been longer in Back Sound with nine recorded years where the stressful summer season was > 131 days, the length of the longest recorded season in the polyhaline region of Chesapeake Bay (Shields et al., 2018). Most of the longest summer stressful seasons in Back Sound have occurred since 1995 and correspond with the declines in total areal coverage and meadow biomass since the peak abundance years in 1992 and 2008. During this same period of increasing summer temperature stress (1992-2019), declines in total biomass in both the spring and summer in Back Sound were relatively larger for the temperate species Z. marina but the magnitude of the decline in total seagrass biomass in the meadows was partially mitigated by a stable and slightly increasing above- and belowground biomass of the tropical and eurytolerant species, H. wrightii and R. maritima.
The presence of tropical and eurytolerant species in NC may help ameliorate ecosystem function impacts due to loss of Z. marina from the system; however, R. maritima may not be able to fulfill this role by itself. In the Chesapeake Bay, die-offs of Z. marina were accompanied by increases in the abundance of R. maritima and the uncertain expectation that this more temperature tolerant, highly fecund, and opportunistic species may substitute for Z. marina or possibly stabilize meadows until eelgrass could recover (Evans et al., 1986; Kantrud, 1991; Moore and Jarvis, 2008; Lopez-Calderon et al., 2010; Moore et al., 2014; French, 2015). However, Z. marina declines continue even as R. maritima cover increased (personal communication with VIMS SAV Program). This could be due, in part, to the ephemeral nature of R. maritima growth and survival which may not support long-term meadow stability when temperate species decline (Richardson et al., 2018; Patrick et al., 2021). Loss of both Z. marina and R. maritima result in increased sediment resuspension further reducing water quality and limiting the recovery potential of Z. marina in Chesapeake Bay (Moore, 2004). As more temperate seagrass systems undergo tropicalization, meadow function and resilience to high-heat thermal stress may not only be impacted by the presence of a tropical seagrass species, but also by meadow stability.
Water clarity is another important metric that affects the stability and persistence of seagrass meadows by affecting the availability of light and interacts with temperature to influence the productivity, growth, and distribution of seagrasses (Dennison et al., 1993; Kenworthy and Fonseca, 1996; Lee et al., 2007; Biber et al., 2008). Unlike conditions in thermally stressed systems of the Chesapeake Bay USA and Shark Bay Australia, where recent temperate seagrass losses have been mainly attributed to the interaction of extreme heat stress and impaired water quality (Moore et al., 2014; Lefcheck et al., 2017; Richardson et al., 2018; Strydom et al., 2020), more favorable optical water quality in NC may be mitigating increases in the magnitude and duration of summer stressful temperatures for Z. marina. In Back Sound, water clarity metrics, including both secchi depth (cm) and estimates of light attenuation (Kd), were consistently within a range to support seagrass growth and survival at depths <1.7m and did not display any significant changes during this period (2008-2019).
Hydrology and geomorphology are two crucial factors impacting water clarity in NC coastal systems (Biber et al., 2008; Paerl et al., 2019; Hall, 2021). The relatively low concentrations of chl a in the large polyhaline region of NC are due in part to the frequent exchange of tidal waters with the Atlantic shelf resulting in short water residence times. Much of the polyhaline region is also hydrologically isolated from the major sources of land and riverine derived nutrients delivered from the adjacent coastal plain and the frequent dilution of estuarine derived nutrients by Atlantic Ocean water helps maintain favorable water clarity where most of the seagrass occurs. Therefore, the increased respiratory demands for temperate Z. marina associated with warmer temperatures did not result in a loss of temperate seagrass in Back Sound under conditions that have led to large-scale declines in other systems, as respiration was balanced by photosynthesis due to abundant light levels (Penhale, 1977; Marsh et al., 1986; Shields et al., 2018). However, water temperatures above the lethal thermal limit of Z. marina (> 30°C) occurred more frequently (5%) in the last ten years compared to the previous decade (2.5%). If this trend continues, ambient light levels will not be able to ameliorate thermal stressors and large-scale declines of Z. marina may occur in the system.
Micheli et al. (2008) hypothesized that deeper water in NC could be a future refuge for Z. marina to exploit as water temperatures increase in shallow water. But for this scenario to be feasible, optical water quality conditions would need to be sustained such that water clarity would support eelgrass at deeper depths. In Back Sound neither of the two optically active constituents (chl a, turbidity) affecting light attenuation and seagrasses in coastal ecosystems displayed significant changes during the most recent 12-y period (Gallegos and Kenworthy, 1996; Gallegos, 2001; Biber et al., 2008; Kenworthy et al., 2014). Inverting the bio-optical model developed by Biber et al. (2008) for Back Sound allowed us to simultaneously interrogate the clarity (Kd PAR) and optical water quality constituents (chl a and turbidity) in Back Sound with respect to the known light requirements (22% Io) and maximum depth distribution (1.7m) of seagrasses in the polyhaline region of NC. The median values for the time series of combinations of chlorophyll a and turbidity were beneath the line of constant light attenuation indicating that, under most conditions during the period of thermal stress for Z. marina, optical water quality was suitable for seagrass growth to depths of 1.7 m. Periodic deviations in water clarity were primarily due to variability in turbidity. This is not surprising, given that Back Sound is a relatively shallow coastal system where wind driven resuspension leads to temporarily higher concentrations of suspended material and turbidity (Biber et al., 2008). The bio-optical model suggests that, based on the most current optical water quality conditions, Z. marina is growing close to its’ threshold depth limit, and expansion to deeper depths and a migration to a cooler water refuge could not be realized without sustaining or improving optical water quality (Kenworthy and Fonseca, 1996; Duarte et al., 2007; Kenworthy et al., 2014).
Although chlorophyll a is not currently limiting light availability for seagrass in Back Sound, it should also be noted that several of the coastal plain watersheds in NC have experienced nutrient impairment over the past several decades (Paerl et al., 2019). If the climate change predictions for increased storminess and precipitation in the future lead to a delivery of more water, nutrients, and sediments from the coastal plain watersheds to the polyhaline regions of the estuary, as anticipated by Paerl et al. (2019) and NCDEQ (North Carolina Department of Environmental Quality) (2021), the protection afforded to this seagrass ecosystem by its’ geographic isolation from these water quality stressors could breakdown. As coastal development and population growth continue to proceed at a rapid pace (Mallin et al., 2000; Neumann et al., 2015) more direct and indirect delivery of nutrients to polyhaline waters could further contribute to an accelerated enrichment of chlorophyll a and the impairment of optical water quality (Paerl et al., 2018). In this future scenario we hypothesize that there would be a higher probability that stressful summer temperatures would then begin to significantly impact Z. marina comparable to what has been occurring in other thermally stressed temperate and tropical seagrass systems (Shields et al., 2018; Morris et al., 2022).
In southeastern North Carolina water quality and temperature stressors are also compounded by the impacts of tropical cyclones. During the last 10 years (2009-2019) when the stressful summer season was increasing both in magnitude and duration, Back Sound was impacted by ten named tropical cyclones, three of which were hurricanes (Paerl et al., 2018). In September 2018 the region experienced a major weather disturbance, Hurricane Florence (Paerl et al., 2019). Florence was a slow-moving Category 1 storm which passed almost directly over Back Sound affecting the area for four days with winds ≥ 64 k, significant tidal surge (3-4m) and delivered between 800 – 900 mm of precipitation. Given our understanding of how exposure to high wave energy and currents affects seagrass meadows in our area (Fonseca and Bell, 1998; Fonseca et al., 2000), this sustained period of cyclonic activity from Hurricane Florence could have contributed to the changes in areal coverage between 2013 and 2019 making it challenging to distinguish between the relative effects of storm disturbances and increasing summer temperatures. This period of time also coincided with the warmest 10-year period on record in NC (2009-2018) with 2019 the warmest year ever (NCDEQ (North Carolina Department of Environmental Quality), 2021). Based on our biomass and areal coverage data, it is reasonable to conclude that despite these multiple stressors the meadows in Back Sound persisted through a period of increasing temperatures and storminess. Recognizing climate change forecasts include an amalgamation of both rising SST and increased storminess, this past decade in NC may set a precedent of what is to come should climate change forecasts be realized (Paerl et al., 2019; NCDEQ (North Carolina Department of Environmental Quality), 2021).
Predicting the effects of climate stress in edge-of-range seagrass populations also requires an understanding of the life history strategies of the individual species, especially the relative roles of sexual and asexual reproduction in meadow persistence and resilience (Tomlinson, 1974; Kendrick et al., 2012; Jarvis et al., 2014a). Many climate change models focus on changes in biomass via clonal growth and do not consider sexual reproduction as a maintenance or recovery mechanism (Wilson and Lotze, 2019; Scalpone et al., 2020). At the southern limit for Z. marina in the Western Atlantic Ocean both perennial and mixed annual life history strategies are expressed, and populations rely heavily on successful sexual reproduction and seedling survival to sustain populations interannually (Jarvis et al., 2012). Persistent eelgrass beds in NC are not typical of the classical definition of perennial meadows which is based on the presence of biomass year around (Setchell, 1929; Thayer et al., 1984). Most eelgrass meadows persist with large fluctuations in biomass, sometimes nearly all the density and biomass are lost in summer and the meadows are annually replenished in early winter with viable seedlings recruited from the sediment seed bank (Jarvis et al., 2012; Jarvis et al., 2014b). Climate models that do not account for sexual reproduction in Z. marina will consistently underestimate the species ability to recover from disturbances (Jarvis et al., 2012), which may lead to an under-estimation of the longevity of eelgrass at its trailing edge distribution in this region.
Our current understanding of leading-edge species in marine systems that are expanding their range via tropicalization is based primarily on marine fauna (Pinsky et al., 2020); however, many mechanisms which accelerate or slow the tropicalization process may apply to seagrasses. For example, H. wrightii expansion into North Carolina coastal waters was probably aided by the favorable northerly flowing direction and proximity of the Gulf Stream (Fig 1). However, further poleward expansion of the species may be impeded by the direction of the southerly flowing Labrador Current and the life history strategy of H. wrightii in NC which is highly clonal (Digiantonio et al., 2020). Isolated reports of H. wrightii flowering in NC exist (Ferguson et al., 1993; Jarvis unpublished data); however, sexual reproduction seems to be limited throughout Back Sound as genotypic richness of populations in this area are below the median value for H. wrightii populations in more tropical locations where sexual reproduction is more common (Digiantonio et al., 2020). Clonal growth by meristem division and rhizome extension is the primary means by which most seagrasses maintain their populations and areal coverage (Tomlinson, 1974; Marbà and Duarte, 1998; Kendrick et al., 2012), but neither this or clonal fragment dispersal are as reliable, as fast, or as spatially extensive as seed dispersal (Di Carlo et al., 2005; Hall and Willis, 2006; Erftemeijer et al., 2008; Kendrick et al., 2012).
It is reasonable to infer that the dynamics in both the areal extent and biomass of edge-of-range seagrass meadows we observed over the past four decades may reflect differences in intrinsic life history characteristics, localized adaptation, and interactions of the co-occurring temperate and tropical species. Relatively speaking, four decades of observation may not seem adequate to characterize the dynamics of tropicalization with long-lived clonal species; however, these data are reported on the same temporal scale as climate models which predict large changes in the same time frame (e.g., Wilson and Lotze, 2019). Assuming H. wrightii is more resilient to temperature increases and if eelgrass is extirpated from the system by 2050 as Wilson and Lotze (2019) predict under ‘business as usual’ climate change scenarios, it is reasonable to expect, based on the data presented here, that there could be a lag time before tropical H. wrightii replaces the cover and biomass of temperate Z. marina in the system. This transition, effectively shuffling the landscape of the seagrass ecosystem, could have important implications for ecological functions and services as well as resilience (Micheli et al., 2008). For example, if there were a lag time replacing Z. marina cover with H. wrightii many of the positive feedbacks in the temporarily unvegetated habitat (e.g., sediment stabilization, nutrient cycling, and sequestration) would be lost, and in the worst case permanently impaired should H. wrightii not colonize those areas (Moore, 2004; Lefcheck et al., 2017; French and Moore, 2018). Likewise, shifts in the timing of the dominant seagrass abundance may affect faunal recruitment and utilization of these critical fishery and wildlife habitats (Micheli et al., 2008). Additionally, we should be investigating how winter water temperatures affect the tropical species, H. wrightii, and whether winter temperatures impact the overall function of tropicalized seagrass meadows (Morris et al., 2021). Long-term data sets can provide answers to these inquiries as the importance of long-term monitoring, using a tiered monitoring approach to integrate compartmentalized metrics to obtain the full perspective, increases with ongoing climate change (Neckles et al., 2012). Gaining a greater understanding of the possible abiotic and biotic feedbacks between trailing and leading-edge seagrass populations and their effects on ecosystem services is necessary to manage core range populations of temperate species more effectively as the climate continues to warm and the possibility of tropicalization increases.
As shown over a period of 40 years in North Carolina seagrass meadows, novel combinations of temperate and tropical seagrass species impact the resilience and stability of edge-of-range seagrass meadows over decadal time scales. Persistence of trailing edge temperate Z. marina populations under water temperatures that have resulted in large-scale declines in more poleward populations (>28-30°C) is positively influenced by water clarity, life history, and meadow stability, due in part to the consistent presence of leading-edge populations of tropical H. wrightii maintaining meadow biomass and area. However, our study also shows that temperate species in edge-of-range tropicalized meadows, are still limited by physiological thresholds despite the possibility for localized adaptation, and when these limits are exceeded, related declines in meadow biomass and area are not fully replaced by tropical species over short (<5 year) time scales. Therefore, while tropicalization of seagrass meadows may result in greater species diversity and resilience to abiotic stressors in the short-term, declines in biomass and area during the process of tropicalization may have significant impacts on meadow function.
The raw data supporting the conclusions of this article will be made available by the authors, without undue reservation.
JJ, WK, AB, and BP conceptualized the project and collected the long-term seagrass data. WK and AB compiled water temperature and biomass data from historical records. BP provided water quality and water temperature data (2008 -2019). BP and CD analyzed remote sensing imagery. JJ ran statistical analyses. JJ, WK, and AB prepared the first draft. All authors contributed to the manuscript preparation and revision and read and approved the submitted version.
This research was supported in part by the North Carolina Department of Environmental Quality Division of Marine Fisheries Coastal Recreational Fishing Licenses program (Number 2017-H-059). Open Access fees were provided by University of North Carolina Wilmington.
The authors declare that the research was conducted in the absence of any commercial or financial relationships that could be construed as a potential conflict of interest.
All claims expressed in this article are solely those of the authors and do not necessarily represent those of their affiliated organizations, or those of the publisher, the editors and the reviewers. Any product that may be evaluated in this article, or claim that may be made by its manufacturer, is not guaranteed or endorsed by the publisher.
The authors would like to thank Sam Burdick for georectifying historical seagrass meadow imagery, Nathan Hall for help with the optical water quality model and Mark Fonseca for sharing regional seagrass data. We also thank Trish Murphey, many NC-NERR volunteers, and the many undergraduate and graduate students in the UNCW Coastal Plant Ecology Lab for their help with sample acquisition and processing.
With respect to the land and people who preceded us, the co-authors of this article acknowledge that this research was conducted on colonized land, traditionally belonging to the Neusiok and Lumbee Peoples, all of whom have stewarded this land throughout the generations. We also acknowledge this coastal region profited from the enslavement and forced labor of African people and their descendants. We recognize that knowing, acknowledging, and honoring the history of the land and the people is only the first step and that the continuation of addressing policies and practices that perpetuate oppression is needed.
The Supplementary Material for this article can be found online at: https://www.frontiersin.org/articles/10.3389/fmars.2022.917237/full#supplementary-material
Ailstock M. S., Shafer D. J., Magoun A. D. (2008). Effects of Planting Depth, Sediment Grain Size, and Nutrients on Ruppia Maritima and Potamogeton Perfoliatus Seedling Emergence and Growth. Restor. Ecol. 18, 574–583. doi: 10.1111/j.1526-100X.2010.00697.x
Arias-Ortiz A., Serrano O., Masqué P., Lavery P. S., Mueller U., Kendrick G. A., et al. (2018). A Marine Heatwave Drives Massive Losses From the World’s Largest Seagrass Carbon Stocks. Nat. Clim. Change 8, 338–344. doi: 10.1038/s41558-018-0096-y
Arnold T. M., Zimmerman R. C., Engelhardt K. A. M., Stevenson J. C. (2017). Twenty-First Century Climate Change and Submerged Aquatic Vegetation in a Temperate Estuary: The Case of Chesapeake Bay. Ecosyst. Health Sustain. 3, 1353283. doi: 10.1080/20964129.2017.1353283
Babcock R. C., Bustamante R. H., Fulton E. A., Fulton D. J., Haywood M. D. E., Hobday A. J., et al. (2019). Severe Continental-Scale Impacts of Climate Change are Happening Now: Extreme Climate Events Impact Marine Habitat Forming Communities Along 45% of Australia’s Coast. Front. Mar. Sci. 6. doi: 10.3389/fmars.2019.00411
Barsi Á., Kugler ZS., László I., Szabó GY., Abdulmutalib H. M. (2018). Accuracy Dimensions in Remote Sensing. Int. Arch. Photogramm. Remote Sens. Spatial Inf. Sci. XLII–3, 61–67. doi: 10.5194/isprs-archives-XLII-3-61-2018
Bartenfelder A. (2019). Investigation of the Abundance and Persistence of Temperate and Tropical Seagrass Species Located at a Subtropical Transition Zone. [Master’s Thesis] ([Wilmington (NC)];: University of North Carolina Wilmington).
Bates D., Mächler M., Bolker B., Walker S. (2015). Fitting Linear Mixed-Effects Models Using Lme4. J. Stat. Software 67, 1–48. doi: 10.18637/jss.v067.i01
Batiuk R. A., Orth R. J., Moore K. A., Dennison W. C., Stevenson J. C. (1992). Chesapeake Bay Submerged Aquatic Vegetation Habitat Requirements and Restoration Targets: A Technical Synthesis (No. PB-93-196665/XAB) (VA (United States: Virginia Institute of Marine Science, Gloucester Point).
Biber P. D., Gallegos C. L., Kenworthy W. J. (2008). Calibration of a Bio-Optical Model in the North River, North Carolina (Albemarle–Pamlico Sound): A Tool to Evaluate Water Quality Impacts on Seagrasses. Estuar. Coast. 31, 177–191. doi: 10.1007/s12237-007-9023-6
Bolker B. (2021) Tools for General Maximum Likelihood Estimation [R Package Bbmle Version 1.0.24]. Available at: https://cran.r-project.org/web/packages/bbmle/index.html (Accessed January 25, 2022).
Brooks M. E., Kristensen K., van Benthem K. J., Magnusson A., Berg C. W., Nielsen A., et al. (2017). glmmTMB Balances Speed and Flexibility Among Packages for Zero-Inflated Generalized Linear Mixed Modeling. R J. 9:2, 378–400. doi: 10.32614/RJ-2017-066
Carraway R. J., Priddy L. J. (1983). Mapping of Submerged Grass Beds in Core and Bogue Sounds, Carteret County, North Carolina by Conventional Aerial Photography (CEIP Report No. 20) (Morehead City, NC (United States: Office of Coastal Zone Management, National Oceanic and Atmospheric Administration).
Collier C. J., Ow Y. X., Langlois L., Uthicke S., Johansson C. L., O’Brien K. R., et al. (2017). Optimum Temperatures for Net Primary Productivity of Three Tropical Seagrass Species. Front. Plant Sci. 8. doi: 10.3389/fpls.2017.01446
Collier C. J., Waycott M. (2014). Temperature Extremes Reduce Seagrass Growth and Induce Mortality. Mar. Pollut. Bull. 83, 483–490. doi: 10.1016/j.marpolbul.2014.03.050
Crawford R. M. M. (2008). Plants at the Margin: Ecological Limits and Climate Change (Cambridge: Cambridge University Press). doi: 10.1017/CBO9780511754906
Cribari-Neto F., Zeileis A. (2010). Beta Regression in R. J. Stat. Softw 34. doi: 10.18637/jss.v034.i02
Dennison W. C., Orth R. J., Moore K. A., Stevenson J. C., Carter V., Kollar S., et al. (1993). Assessing Water Quality With Submersed Aquatic Vegetation. Bioscience 43, 86–94. doi: 10.2307/1311969
Di Carlo G., Badalamenti F., Jensen A. C., Koch E. W., Riggio S. (2005). Colonisation Process of Vegetative Fragments of Posidonia Oceanica (L.) Delile on Rubble Mounds. Mar. Biol. 147, 1261–1270. doi: 10.1007/s00227-005-0035-0
Digiantonio G., Blum L., McGlathery K., van Dijk K., Waycott M. (2020). Genetic Mosaicism and Population Connectivity of Edge-of-Range Halodule Wrightii Populations. Aquat. Bot. 161, 103161. doi: 10.1016/j.aquabot.2019.103161
Duarte C. M. (2002). The Future of Seagrass Meadows. Environ. Conserv 29, 192–206. doi: 10.1017/S0376892902000127
Duarte C. M., Marbà N., Krause-Jensen D., Sánchez-Camacho M. (2007). Testing the Predictive Power of Seagrass Depth Limit Models. Estuar. Coast. 30, 652–656. doi: 10.1007/BF02841962
Erftemeijer P. L. A., van Beek J. K. L., Ochieng C. A., Jager Z., Los H. J. (2008). Eelgrass Seed Dispersal via Floating Generative Shoots in the Dutch Wadden Sea: A Model Approach. Mar. Ecol. Prog. Ser. 358, 115–124. doi: 10.3354/meps07304
ESRI (2019) Understanding Segmentation and Classification, ArcMap 10.6. Available at: https://desktop.arcgis.com/en/arcmap/10.6/tools/spatial-analyst-toolbox/understanding-segmentation-and-classification.htm (Accessed January 30, 2022).
Evans A. S., Webb K. L., Penhale P. A. (1986). Photosynthetic Temperature Acclimation in Two Coexisting Seagrasses, Zostera Marina L. And Ruppia Maritima L. Aquat. Bot. 24, 185–197. doi: 10.1016/0304-3770(86)90095-1
Ferguson R. L., Pawlak B. T., Wood L. L. (1993). Flowering of the Seagrass Halodule Wrightii in North Carolina, USA. Aquat. Bot. 46, 91–98. doi: 10.1016/0304-3770(93)90066-6
Field D., Kenworthy W. J., Carpenter D. (2021). Metric Report: Extent of Submerged Aquatic Vegetation, High-Salinity Estuarine Waters (REVISED) (Raleigh, NC (United States: Albemarle-Pamlico National Estuary Partnership).
Fonseca M. S., Bell S. S. (1998). Influence of Physical Setting on Seagrass Landscapes Near Beaufort, North Carolina, USA. Mar. Ecol. Prog. Ser. 171, 109–121. doi: 10.3354/meps171109
Fonseca M. S., Julius B. E., Kenworthy W. J. (2000). Integrating Biology and Economics in Seagrass Restoration: How Much is Enough and Why? Ecol. Eng. 15, 227–237. doi: 10.1016/S0925-8574(00)00078-1
Food and Agriculture Organization of the United Nations (2016). “Map Accuracy Assessment and Area Estimation,” in A Practical Guide (Rome, Italy: Food and Agriculture Organization of the United Nations).
Fox J., Weisberg S. (2019) An R Companion to Applied Regression (SAGE Publications Inc). Available at: https://us.sagepub.com/en-us/nam/an-r-companion-to-applied-regression/book246125 (Accessed January 24, 2022).
French E. (2015). The Influence of Zostera Marina and Ruppia Maritima on Habitat Structure and Function in a Changing Environment in the Chesapeake Bay. [Master’s Thesis] ([Gloucester Point (VA)]: College of William & Mary, Virginia Institute of Marine Science).
French E., Moore K. (2018). Canopy Functions of R. Maritima and Z. Marina in the Chesapeake Bay. Front. Mar. Sci. 5. doi: 10.3389/fmars.2018.00461
Gallegos C. L. (1994). Refining Habitat Requirements of Submersed Aquatic Vegetation: Role of Optical Models. Estuaries 17, 187. doi: 10.2307/1352568
Gallegos C. L. (2001). Calculating Optical Water Quality Targets to Restore and Protect Submersed Aquatic Vegetation: Overcoming Problems in Partitioning the Diffuse Attenuation Coefficient for Photosynthetically Active Radiation. Estuaries 24, 381. doi: 10.2307/1353240
Gallegos C. L., Biber P. D. (2004). Diagnostic Tool Sets Water Quality Targets for Restoring Submerged Aquatic Vegetation in Chesapeake Bay. Ecol. Restor. 22, 296–297.
Gallegos C. L., Kenworthy W. J. (1996). Seagrass Depth Limits in the Indian River Lagoon (Florida, U.S.A.): Application of an Optical Water Quality Model. Estuar. Coast. Shelf Sci. 42, 267–288. doi: 10.1006/ecss.1996.0020
Gattuso J. P., Gentili B., Duarte C. M., Kleypas J. A., Middelburg J. J., Antoine D. (2006). Light Availability in the Coastal Ocean: Impact on the Distribution of Benthic Photosynthetic Organisms and Their Contribution to Primary Production. Biogeosciences 3, 489–513. doi: 10.5194/bg-3-489-2006
Gray P., Ridge J., Poulin S., Seymour A., Schwantes A., Swenson J., et al. (2018). Integrating Drone Imagery Into High Resolution Satellite Remote Sensing Assessments of Estuarine Environments. Remote Sens (Basel) 10, 1257. doi: 10.3390/rs10081257
Grech A., Chartrand-Miller K., Erftemeijer P., Fonseca M., McKenzie L., Rasheed M., et al. (2012). A Comparison of Threats, Vulnerabilities and Management Approaches in Global Seagrass Bioregions. Environ. Res. Lett. 7, 24006. doi: 10.1088/1748-9326/7/2/024006
Green E. P., Short F. T. (2003). World Atlas of Seagrasses. Illustrated Ed (Berkeley: University of California Press).
Gregory M. B., DeVivo J. C., DiDonato E. M., Wright C. J., Thompson E. (2013). Protocol for Monitoring Estuarine Water and Sediment Quality in Selected Southeast Coast Network Parks (Fort Collins Colorado: National Park Service).
Hall N. (2021). Evaluation of Water Clarity Metrics for Protection of Submerged Aquatic Vegetation in the Albemarle-Pamlico Estuarine System (Raleigh, NC: Albemarle-Pamlico National Estuary Partnership).
Hall M. C., Willis J. H. (2006). Divergent Selection on Flowering Time Contributes to Local Adaptation in Mimulus Guttatus Populations. Evolution 60, 2466–2477. doi: 10.1111/j.0014-3820.2006.tb01882.x
Hammer K. J., Borum J., Hasler-Sheetal H., Shields E. C., Sand-Jensen K., Moore K. A. (2018). High Temperatures Cause Reduced Growth, Plant Death and Metabolic Changes in Eelgrass Zostera Marina. Mar. Ecol. Prog. Ser. 604, 121–132. doi: 10.3354/meps12740
Havel L. N. (2018). Submerged Aquatic Vegetation Policy: A Review of Past Accomplishments and Emerging Research and Management Issues (Arlington, VA: ASMFC Habitat Committee).
Hettler W. F., Chester A. J. (1982). The Relationship of Winter Temperature and Spring Landings of Pink Shrimp, Penaeus Duorarum Vol. 80 (North Carolina: Fish B-NOAA), 160–168.
Jarvis J. C., Brush M. J., Moore K. A. (2014a). Modeling Loss and Recovery of Zostera Marina Beds in the Chesapeake Bay: The Role of Seedlings and Seed-Bank Viability. Aquat. Bot. 113, 32–45. doi: 10.1016/j.aquabot.2013.10.010
Jarvis J. C., Moore K. A. (2010). The Role of Seedlings and Seed Bank Viability in the Recovery of Chesapeake Bay, USA, Zostera Marina Populations Following a Large-Scale Decline. . Hydrobiol 649, 55–68. doi: 10.1007/s10750-010-0258-z
Jarvis J. C., Moore K. A., d Kenworthy W. J. (2012). Characterization and Ecological Implication of Eelgrass Life History Strategies Near the Species’ Southern Limit in the Western North Atlantic. Mar. Ecol. Prog. Ser. 444, 43–56. doi: 10.3354/meps09428
Jarvis J. C., Moore K. A., Judson Kenworthy W. (2014b). Persistence of Zostera Marina L. (Eelgrass) Seeds in the Sediment Seed Bank. J. Exp. Mar. Biol. Ecol. 459, 126–136. doi: 10.1016/j.jembe.2014.05.024
Jordà G., Marbà N., Duarte C. M. (2012). Mediterranean Seagrass Vulnerable to Regional Climate Warming. . Nat. Clim. Change 2, 821–824. doi: 10.1038/nclimate1533
Kantrud H. A. (1991). “Wigeon Grass (Ruppia Maritima L.),” in A Literature Review (Washington D.C. (United States: United States Department of the Interior).
Kendrick G. A., Waycott M., Carruthers T. J. B., Cambridge M. L., Hovey R., Krauss S. L., et al. (2012). The Central Role of Dispersal in the Maintenance and Persistence of Seagrass Populations. Bioscience 62, 56–65. doi: 10.1525/bio.2012.62.1.10
Kenworthy W. J. (1981). The Interrelationship Between Seagrasses, Zostera Marina and Halodule Wrightii, and the Physical and Chemical Properties of Sediments in a Mid-Atlantic Coastal Plain Estuary Near Beaufort, North Carolina (U.S.A). [Master’s Thesis] (Charlotte (VA: University of Virginia).
Kenworthy W. J., Fonseca M. S. (1996). Light Requirements of Seagrasses Halodule Wrightii and Syringodium Filiforme Derived From the Relationship Between Diffuse Light Attenuation and Maximum Depth Distribution. Estuaries 19, 740. doi: 10.2307/1352533
Kenworthy W. J., Gallegos C. L., Costello C., Field D., di Carlo G. (2014). Dependence of Eelgrass (Zostera Marina) Light Requirements on Sediment Organic Matter in Massachusetts Coastal Bays: Implications for Remediation and Restoration. Mar. Pollut. Bull. 83, 446–457. doi: 10.1016/j.marpolbul.2013.11.006
Krause-Jensen D., Duarte C. M., Sand-Jensen K., Carstensen J. (2021). Century-Long Records Reveal Shifting Challenges to Seagrass Recovery. Glob. Change Biol. 27, 563–575. doi: 10.1111/gcb.15440
Lee K.-S., Park S. R., Kim Y. K. (2007). Effects of Irradiance, Temperature, and Nutrients on Growth Dynamics of Seagrasses: A Review. J. Exp. Mar. Biol. Ecol. 350, 144–175. doi: 10.1016/j.jembe.2007.06.016
Lefcheck J. S., Orth R. J., Dennison W. C., Wilcox D. J., Murphy R. R., Keisman J., et al (2018). Long-Term Nutrient Reductions Lead to the Unprecedented Recovery of a Temperate Coastal Region. Proc. Natl. Acad. Sci. U.S.A. 115, 3658–3662. doi: 10.1073/pnas.1715798115
Lefcheck J. S., Wilcox D. J., Murphy R. R., Marion S. R., Orth R. J. (2017). Multiple Stressors Threaten the Imperiled Coastal Foundation Species Eelgrass (Zostera Marina) in Chesapeake Bay, USA. Glob. Change Biol. 23, 3474–3483. doi: 10.1111/gcb.13623
Lenth R. V. (2016). Least-Squares Means: The R Package Lsmeans. J. Stat. Software 69, 1–33. doi: 10.18637/jss.v069.i01
Lopez-Calderon J., Riosmena-Rodríguez R., Rodríguez-Baron J. M., Carrión-Cortez J., Torre J., Meling-López A., et al. (2010). Outstanding Appearance of Ruppia Maritima Along Baja California Sur, México and its Influence in Trophic Networks. Mar. Biodiv. 40, 293–300. doi: 10.1007/s12526-010-0050-3
Mallin M. A., Burkholder J. M., Cahoon L. B., Posey M. H. (2000). North and South Carolina Coasts. Mar. Pollut. Bull. 41, 56–75. doi: 10.1016/S0025-326X(00)00102-8
Marbà N., Duarte C. M. (1998). Rhizome Elongation and Seagrass Clonal Growth. Mar. Ecol. Prog. Ser. 174, 269–280. doi: 10.3354/meps174269
Marbà N., Duarte C. M. (2009). Mediterranean Warming Triggers Seagrass (Posidonia Oceanica) Shoot Mortality. Glob. Change Biol. 16, 2366–2375. doi: 10.1111/j.1365-2486.2009.02130.x
Marbà N., Jordà G., Agustí S., Girard C., Duarte C. M. (2015). Footprints of Climate Change on Mediterranean Sea Biota. Front. Mar. Sci. 2. doi: 10.3389/fmars.2015.00056
Marsh J. A., Dennison W. C., Alberte R. S. (1986). Effects of Temperature on Photosynthesis and Respiration in Eelgrass (Zostera Marina L.). J. Exp. Mar. Biol. Ecol. 101, 257–267. doi: 10.1016/0022-0981(86)90267-4
Micheli F., Bishop M. J., Peterson C. H., Rivera J. (2008). Alteration of Seagrass Species Composition and Function Over Two Decades. Ecol. Monogr. 78, 225–244. doi: 10.1890/06-1605.1
Moore K. A. (2004). Influence of Seagrasses on Water Quality in Shallow Regions of the Lower Chesapeake Bay. J. Coastal Res. 10045, 162–178. doi: 10.2112/SI45-162.1
Moore K. A., Jarvis J. C. (2008). Environmental Factors Affecting Recent Summertime Eelgrass Diebacks in the Lower Chesapeake Bay: Implications for Long-Term Persistence. J. Coastal Res. 10055, 135–147. doi: 10.2112/SI55-014
Moore K. A., Shields E. C., Parrish D. B. (2014). Impacts of Varying Estuarine Temperature and Light Conditions on Zostera Marina (Eelgrass) and its Interactions With Ruppia Maritima (Widgeongrass). Estuaries Coast. 37, 20–30. doi: 10.1007/s12237-013-9667-3
Morris L. J., Hall L. M., Jacoby C. A., Chamberlain R. H., Hanisak M. D., Miller J. D., et al. (2022). Seagrass in a Changing Estuary, the Indian River Lagoon, Florida, United States. Front. Mar. Sci. 8. doi: 10.3389/fmars.2021.789818
Morris L. J., Hall L. M., Miller J. D., Lasi M. A., Chamberlain R. H., Virnstein R. W., et al. (2021). Diversity and Distribution of Seagrasses as Related to Salinity, Temperature, and Availability of Light in the Indian River Lagoon, Florida. Fla. Sci. 84, 119–137.
Murphey P. L., Fonseca M. S. (1995). Role of High and Low Energy Seagrass Beds as Nursery Areas for Penaeus Duorarum in North Carolina. Mar. Ecol. Prog. Ser. 121, 91–98. doi: 10.3354/meps121091
Najjar R. G., Pyke C. R., Adams M. B., Breitburg D., Hershner C., Kemp M., et al. (2010). Potential Climate-Change Impacts on the Chesapeake Bay. Estuar. Coast. Shelf Sci. 86, 1–20. doi: 10.1016/j.ecss.2009.09.026
NCDEQ (North Carolina Department of Environmental Quality) (2016). North Carolina Coastal Habitat Protection Plan. Nc (Morehead City, NC (United States: Division of Marine Fisheries).
Neckles H. A., Kopp B. S., Peterson B. J., Pooler P. S. (2012). Integrating Scales of Seagrass Monitoring to Meet Conservation Needs. Estuaries Coast. 35, 23–46. doi: 10.1007/s12237-011-9410-x
Neumann B., Vafeidis A. T., Zimmermann J., Nicholls R. J. (2015). Future Coastal Population Growth and Exposure to Sea-Level Rise and Coastal Flooding–a Global Assessment. PloS One 10, e0118571. doi: 10.1371/journal.pone.0118571
Orth R. J., Carruthers T. J. B., Dennison W. C., Duarte C. M., Fourqurean J. W., Heck K. L., et al. (2006). A Global Crisis for Seagrass Ecosystems. Bioscience 56, 987. doi: 10.1641/0006-3568(2006)56[987:AGCFSE]2.0.CO;2
Orth R. J., Moore K. A. (1986). Seasonal and Year-to-Year Variations in the Growth of Zostera Marina L. (Eelgrass) in the Lower Chesapeake Bay. Aquat. Bot. 24, 335–341. doi: 10.1016/0304-3770(86)90100-2
Paerl H. W., Crosswell J. R., Van Dam B., Hall N. S., Rossignol K. L., Osburn C. L., et al. (2018). Two Decades of Tropical Cyclone Impacts on North Carolina’s Estuarine Carbon, Nutrient and Phytoplankton Dynamics: Implications for Biogeochemical Cycling and Water Quality in a Stormier World. . Biogeochem 141, 1–26. doi: 10.1007/s10533-018-0438-x
Paerl H. W., Hall N. S., Hounshell A. G., Luettich R. A., Rossignol K. L., Osburn C. L., et al. (2019). Recent Increase in Catastrophic Tropical Cyclone Flooding in Coastal North Carolina, USA: Long-Term Observations Suggest a Regime Shift. Sci. Rep. 9, 10620. doi: 10.1038/s41598-019-46928-9
Parmesan C. (2006). Ecological and Evolutionary Responses to Recent Climate Change. Annu. Rev. Ecol. Evol. Syst. 37, 637–669. doi: 10.1146/annurev.ecolsys.37.091305.110100
Patrick C. J., McCluney K. E., Ruhi A., Gregory A., Sabo J., Thorp J. H. (2021). Multi-Scale Biodiversity Drives Temporal Variability in Macrosystems. Front. Ecol. Environ. 19, 47–56. doi: 10.1002/fee.2297
Penhale P. A. (1977). Macrophyte-Epiphyte Biomass and Productivity in an Eelgrass (Zostera Marina L.) Community. J. Exp. Mar. Biol. Ecol. 26, 211–224. doi: 10.1016/0022-0981(77)90109-5
Pinsky M. L., Selden R. L., Kitchel Z. J. (2020). Climate-Driven Shifts in Marine Species Ranges: Scaling From Organisms to Communities. Ann. Rev. Mar. Sci. 12, 153–179. doi: 10.1146/annurev-marine-010419-010916
R Core Team (2021) R: The R Project for Statistical Computing. Available at: https://www.r-project.org/ (Accessed January 26, 2022).
Richardson J. P., Lefcheck J. S., Orth R. J. (2018). Warming Temperatures Alter the Relative Abundance and Distribution of Two Co-Occurring Foundational Seagrasses in Chesapeake Bay, USA. Mar. Ecol. Prog. Ser. 599, 65–74. doi: 10.3354/meps12620
Rue H., Riebler A., Sørbye S. H., Illian J. B., Simpson D. P., Lindgren F. K. (2017). Bayesian Computing With INLA: A Review. Annu. Rev. Stat. Appl. 4, 395–421. doi: 10.1146/annurev-statistics-060116-054045
Scalpone C. R., Jarvis J. C., Vasslides J. M., Testa J. M., Ganju N. K. (2020). Simulated Estuary-Wide Response of Seagrass (Zostera Marina) to Future Scenarios of Temperature and Sea Level. Front. Mar. Sci. 7. doi: 10.3389/fmars.2020.539946
Setchell W. A. (1929). Morphological and Phenological Notes on Zostera marina. L. Univ. Calif. Pub. Bot. 14, 389–452.
Shields E., Moore K., Parrish D. (2018). Adaptations by Zostera Marina Dominated Seagrass Meadows in Response to Water Quality and Climate Forcing. Diversity 10, 125. doi: 10.3390/d10040125
Short F., Carruthers T., Dennison W., Waycott M. (2007). Global Seagrass Distribution and Diversity: A Bioregional Model. J. Exp. Mar. Biol. Ecol. 350, 3–20. doi: 10.1016/j.jembe.2007.06.012
Short F. T., Neckles H. A. (1999). The Effects of Global Climate Change on Seagrasses. Aquat. Bot. 63, 169–196. doi: 10.1016/S0304-3770(98)00117-X
Short F. T., Wyllie-Echeverria S. (1996). Natural and Human-Induced Disturbance of Seagrasses. Environ. Conserv. 23, 17. doi: 10.1017/S0376892900038212
Strydom S., Murray K., Wilson S., Huntley B., Rule M., Heithaus M., et al. (2020). Too Hot to Handle: Unprecedented Seagrass Death Driven by Marine Heatwave in a World Heritage Area. Glob. Change Biol. 26, 3525–3538. doi: 10.1111/gcb.15065
Thayer G. W., Adams S. M., LaCroix M. W. (1975). Structural and Functional Aspects of a Recently Established Zostera Marina Community. Estuar Res. 1, 518–540.
Thayer G. W., Kenworthy W. J., Fonseca M. S. (1984). “The Ecology of Eelgrass Meadows of the Atlantic Coast: A Community Profile, U.S. Fish and Wildlife Service (FWS/OBS-84-02), 147pp.
Thomson J. A., Burkholder D. A., Heithaus M. R., Fourqurean J. W., Fraser M. W., Statton J., et al. (2015). Extreme Temperatures, Foundation Species, and Abrupt Ecosystem Change: An Example From an Iconic Seagrass Ecosystem. Glob. Change Biol. 21, 1463–1474. doi: 10.1111/gcb.12694
Tomlinson P. B. (1974). Vegetative Morphology and Meristem Dependence — The Foundation of Productivity in Seagrasses. Aquaculture 4, 107–130. doi: 10.1016/0044-8486(74)90027-1
Unsworth R. K. F., McKenzie L. J., Collier C. J., Cullen-Unsworth L. C., Duarte C. M., Eklöf J. S., et al. (2019). Global Challenges for Seagrass Conservation. Ambio 48, 801–815. doi: 10.1007/s13280-018-1115-y
Walther G.-R. (2010). Community and Ecosystem Responses to Recent Climate Change. Philos. Trans. R. Soc Lond. B Biol. Sci. 365, 2019–2024. doi: 10.1098/rstb.2010.0021
Waycott M., Duarte C. M., Carruthers T. J. B., Orth R. J., Dennison W. C., Olyarnik S., et al. (2009). Accelerating Loss of Seagrasses Across the Globe Threatens Coastal Ecosystems. Proc. Natl. Acad. Sci. U.S.A. 106, 12377–12381. doi: 10.1073/pnas.0905620106
Wilson K. L., Lotze H. K. (2019). Climate Change Projections Reveal Range Shifts of Eelgrass Zostera Marina in the Northwest Atlantic. Mar. Ecol. Prog. Ser. 620, 47–62. doi: 10.3354/meps12973
Zimmerman R. C., Hill V. J., Gallegos C. L. (2015). Predicting Effects of Ocean Warming, Acidification, and Water Quality on Chesapeake Region Eelgrass. Limnol. Oceanogr. 60, 1781–1804. doi: 10.1002/lno.10139
Zimmerman R. C., Hill V. J., Jinuntuya M., Celebi B., Ruble D., Smith M., et al (2017). Experimental Impacts of Climate Warming and Ocean Carbonation on Eelgrass Zostera Marina. Mar. Ecol. Prog. Ser. 566, 1–15. doi: 10.3354/meps12051
Zuur A. F., Ieno E. N., Saveliev A. A. (2017). Beginner’s Guide to Spatial, Temporal, and Spatial-Temporal Ecological Data Analysis With R-INLA (United Kingdom: Highland Statistics Ltd).
Keywords: Zostera marina, Halodule wrightii, biomass, areal coverage, temperature, climate change, water quality
Citation: Bartenfelder A, Kenworthy WJ, Puckett B, Deaton C and Jarvis JC (2022) The Abundance and Persistence of Temperate and Tropical Seagrasses at Their Edge-of-Range in the Western Atlantic Ocean. Front. Mar. Sci. 9:917237. doi: 10.3389/fmars.2022.917237
Received: 10 April 2022; Accepted: 04 May 2022;
Published: 17 June 2022.
Edited by:
Angel Borja, Technological Center Expert in Marine and Food Innovation (AZTI), SpainReviewed by:
James E. Kaldy, United States Environmental Protection Agency, United StatesCopyright © 2022 Bartenfelder, Kenworthy, Puckett, Deaton and Jarvis. This is an open-access article distributed under the terms of the Creative Commons Attribution License (CC BY). The use, distribution or reproduction in other forums is permitted, provided the original author(s) and the copyright owner(s) are credited and that the original publication in this journal is cited, in accordance with accepted academic practice. No use, distribution or reproduction is permitted which does not comply with these terms.
*Correspondence: Jessie C. Jarvis, amFydmlzakB1bmN3LmVkdQ==
Disclaimer: All claims expressed in this article are solely those of the authors and do not necessarily represent those of their affiliated organizations, or those of the publisher, the editors and the reviewers. Any product that may be evaluated in this article or claim that may be made by its manufacturer is not guaranteed or endorsed by the publisher.
Research integrity at Frontiers
Learn more about the work of our research integrity team to safeguard the quality of each article we publish.