 Bérangère Péquin
 Richard LaBrie
 Nicolas Fortin St-Gelais§
 Roxane Maranger
- Département des sciences biologiques, Groupe de Recherche Interuniversitaire en Limnologie, Université de Montréal, Montréal, QC, Canada
Surface ocean eukaryotic phytoplankton biogeography can be determined as chlorophyll-a using remote sensing techniques yet evaluating its community composition remains limited. Given our ability to track site-specific chlorophyll-a concentration, we tested which factors influenced protistan functional trait distribution, and whether the distributions can be inferred from bloom succession. Here we surveyed the Labrador Sea during spring over three consecutive years, sequenced 18S data over 15 stations and collected satellite-derived chlorophyll-a concentration from March to July for each year. We evaluated changes in distribution of taxonomic composition as well as the functional traits of protistan size, trophic strategy (defined as phototrophy, phagotrophy, and mixotrophy as capable of both), motility and dimethylsulfoxide or dimethylsulfoniopropionate production by building a functional trait database after an extensive literature review. More variability in the biogeography of protistan functional traits was explained across water masses, and among years than taxonomic composition and patterns in trait variability were more apparent when site-specific timing of peak chlorophyll-a was considered. We found that reconstructing bloom phenology using days before peak (DBP) chlorophyll explained a significant amount of variability in functional trait community structure that was previously attributed to water masses or years, suggesting that spatial and interannual variations can be explained by the sampling moment during succession. Approximately 30 days prior to peak, mixotrophy as a trophic strategy was replaced by phototrophic protists of typically larger size classes. Our work suggests DBP influences protistan community trait succession that could inform biogeochemical models, and likely acts a proxy for the onset of stratification.
Introduction
Protistan communities in the surface ocean are taxonomically and functionally highly diverse, with a biomass distribution that is patchy in both space and time, which challenges our ability to assess the biogeography of protistan communities at different scales (Kostadinov et al., 2017). Remote sensing techniques have improved our understanding of near-surface spatial and temporal changes in chlorophyll-a concentrations, a proxy for biomass of all organisms capable of phototrophy, and this technology enables us to determine the interannual variability in peak chlorophyll at any location in the ocean (Brody et al., 2013; Marchese et al., 2019). Although elucidating protistan taxonomic and functional community structure using remote techniques seems promising (Uitz et al., 2015), this remains a challenge (Kudela et al., 2017). Functional traits are defined as the shared physiological, morphological, molecular, and behavioral characteristics of individual taxa that allows for the integrations of multiple taxa into broader trait categories (Violle et al., 2007; Barton et al., 2013; Hébert et al., 2017). In fact, given the incredible taxonomic diversity of protists (Adl et al., 2019), linking protistan community composition to major biogeochemical cycles may be best achieved by converting taxonomic composition into functional traits (e.g., Litchman et al., 2007; Finkel et al., 2010; Barton et al., 2013; Ward and Follows, 2016). As such, assessing how protistan traits are distributed spatially and temporally enables a better quantification of their role in different ecosystem functions.
One of the most common functional traits used to understand biogeochemical fluxes like the vertical carbon export and energetic trophic transfer is protistan cell size (Finkel et al., 2010; Key et al., 2010; Ward and Follows, 2016). Measuring other protistan functional traits directly, however, can be a challenge (Selosse et al., 2017; Stoecker et al., 2017), which often limits their broader use in ecosystem models (Petchey and Gaston, 2006; Irwin and Finkel, 2017). Fortunately, several functional traits can be inferred, such as trophic strategy, motility, dimethylsulfoxide or dimethylsulfoniopropionate (DMS) production, cell stoichiometry, and toxin production among others (Yoch, 2002; Stoecker et al., 2009; Flynn et al., 2018). Mixoplankton, defined here as taxa having the capacity to perform both phototrophy and phagotrophy (Flynn et al., 2019), are now recognized as a major component in food webs (Ward and Follows, 2016; Leles et al., 2017). These mixoplankton have the distinctive functional trophic strategy trait of mixotrophy, as opposed to being purely phototrophic (as with phytoplankton) or heterotrophic (protozooplankton). Although the functional trait of mixotrophy is highly plastic and occurs along a continuum (Maranger et al., 1998; Flynn et al., 2013), the potential of mixotrophy as a trophic strategy is known to occur in specific taxa (Stoecker et al., 2017; Wilken et al., 2020), and as such, can be identified as a potential discrete trait. Identifying what factors influence the relative distribution of multiple protistan functional traits and how these may co-vary over time with other factors would improve our assessments of major biogeochemical fluxes.
The biogeography of individual plankton traits has been broadly characterized at the global scale based on species distribution as a function of general ocean circulation models (Barton et al., 2013). In this aforementioned study, protistan size, mixotrophy (defined in their study as the combination of auto- and heterotrophic nutrition), and the N-fixation capacity of bacterioplankton were considered broadly in space, but other traits of interest could include motility, DMS production, cell stoichiometry, and toxin production among others (Yoch, 2002; Stoecker et al., 2009; Flynn et al., 2018). Traits may vary significantly over time and are driven not only primarily by nutrient and light availability but the onset of stratification, which arguably controls the availability of both (Sverdrup, 1953; Marra et al., 2015). Unfortunately, identifying the moment of stratification at large regional spatial scales is not possible; however, remote sensing techniques do permit the identification of the moment of peak chlorophyll-a in surface waters, which we argue that this may act as a proxy for the timing of stratification. This may be particularly the case in north temperate regions where deep winter convection occurs. Indeed, it has been hypothesized that a systematic succession in protistan functional traits leads up to a bloom (Lewandowska et al., 2015), but the latter has never been tested. Therefore, understanding when a sample was collected relative to peak chlorophyll-a concentration could provide insight into the functional trait community structure of protists.
In order to test this hypothesis and characterize the factors that influence the biogeographical distribution of protistan traits, we sampled a transect in the Labrador Sea at the same time over three consecutive years. The Labrador Sea is a site of deep and variable convective mixing during winter (Yashayaev and Loder, 2016), replenishing nutrients to the surface. As such, the onset of stratification is critical for establishing the spring bloom, whose timing and extent are highly variable in this region (Marchese et al., 2019). Furthermore, the region is composed of physically and chemically distinctive water masses creating different ecological niches, therefore favoring different phytoplankton species (Vallina et al., 2017) resulting in a regional taxonomic biogeography (Fragoso et al., 2016). The main goals of this study were to explore which factors could explain the variation in this biogeography using protistan community functional traits, assess if there was co-variation among traits, and evaluate whether the timing of peak chlorophyll-a (or bloom timing), a proxy for the onset of stratification, influenced this pattern.
Materials and methods
Sampling site
Sampling was carried onboard the R/V CCGS Hudson, in collaboration with the Bedford Institute of Oceanography (BIO, Department of Fisheries and Ocean Canada) as part of the VITALS (Ventilation, Interactions, and Transport Across the Labrador Sea) research program. Sampling was conducted on the AR7W (Atlantic Repeat Hydrography Line 7 West, Figure S1) during the two first weeks of May in 2014 (day of year 125–136), 2015 (day of year 129–138) and 2016 (day of year 126–136) in the Labrador Sea. Water was collected using a CTD-rosette (conductivity, temperature, and depth) mounted with 24 Niskin bottles of 10 L (2014 and 2015) or 12 L (2016) at 2- and 30-meters depth and transported to the shipboard laboratory in acid-washed polyethylene carboys. Seven stations were sampled in 2014, 8 in 2015 and 6 in 2016 (Table S1 for details), for a total of 21 stations.
Chemical analysis, chlorophyll a, and bacterial production
Dissolved organic carbon (DOC), nutrients, chlorophyll a and bacterial production (BP) are described in full details in LaBrie et al. (2020). Briefly, samples for DOC were filtered with 0.7 µm pre-combusted glass fiber filters (Whatman, UK), acidified to pH 2 with ACS grade HCl, stored at 4°C until analysis using the high temperature catalytic oxidation (HTCO) method on a TOC-Vcpn analyzer (Shimadzu, Japan). Samples for nitrate () and phosphate () were determined using routine colorimetric methods with a Bran and Luebbe Autoanalyzer II (SEAL Analytical, WI, USA). Chlorophyll a was extracted in 90% acetone and analyzed fluorometrically following Holm-Hansen et al. (1965). BP was measured following a modified version of Smith and Azam (1992). 1.5 ml of samples were incubated in the dark at 4°C with [3, 4, 5-3H]-L-leucine (~10 nM final concentration, Perkin Elmer) for 3 hours in triplicate with a trichloroacetic (TCA) acid killed control (5% final concentration). Incubations were stopped by adding TCA (5% final concentration), briefly vortexed and flash frozen until further processing. Samples were thawed at room temperature, centrifuged at 13 000 RPM using an accuSpin micro17 centrifuge (Thermo Fisher, MA, USA) and gently siphoned to the last drop. Samples were acidified with TCA, vortexed, centrifuged and siphoned a second time. Vials were filled with 1.5 ml of scintillation cocktail (ScintiVerse, Thermo Fisher) and stored for 1 hour before counting on a Tri-carb 2800TR (Perkin Elmer). We assumed a 1550 g C mol leucine-1 to calculate BP.
Taxonomic identification
Water for microscopic taxonomic identification of nano 2–20 µm and microplankton 20–200 µm was collected at 6 stations in 2014 and 8 stations in 2015 (Table S1), at 2 m and 30 m, and was fixed and preserved in an acidic Lugol solution until analysis. Aliquots of 10 or 25 mL were sedimented and a minimum of 400 cells were enumerated using an inverted microscope (Zeiss Axiovert 10) at 400X magnification. Three transects of 20 mm were counted for each sample and converted into cells/L (Lund et al., 1958; Edler and Elbrächter, 2010).
For DNA extraction, between 1 L and 5.3 L of seawater was sequentially filtered on board with a peristaltic pump using silicone tubing within 6 hours of collection, which were acid washed between each sample run. Samples were first filtered through a 53 µm nylon mesh at the rosette, then through a 3 µm polycarbonate filter (hereafter referred to as “large”), followed by a 0.2 µm polyethersulfone filters (hereafter referred to as “small”). Filters were conserved in a lysis buffer (EDTA 40 mM, Tris 50 mM and sucrose 750 mM), flash-frozen, and stored at -80°C until further processing. DNA was extracted using an extraction kit (Qiagen, DNeasy Power Water extraction kit) and quantified with a Qubit 2.0 fluorometer (Invitrogen by Life) high sensitivity kit, following the manufacturers’ instructions. We sequenced 60 samples equally divided between the “large” and “small” fractions to cover all water masses, representing 5, 4 and 6 stations respectively for 2014, 2015, 2016 at the surface (2 m) and close to the deep chlorophyll maximum (30 m) depth. We merged both size fractions to represent the whole protistan community. The DNA amplification, library preparation and Illumina sequencing of 18S rRNA gene (V4 region) were done at Integrated Microbiome Resources in Dalhousie University according to in-house protocols (cgeb-imr.ca/protocols.html). Briefly, a dual-indexing, one-step PCR was done using kit Nextera XT v2 (Illumina). The adapters and indexes are those provided by the kit. Region V4, 18S rRNA gene for eukaryotes was targeted with primers E572F (CYGCGGTAATTCCAGCTC) and E1009R (AYGGTATCTRATCRTCTTYG). PCR amplification was run for 30 cycles. The amplicons’ quality was visualized using a 96-well E-gel (Invitrogen), then purified and normalized by the high-throughput SequalPrep 96-well plate kit (Invitrogen). Samples were pooled to make one library and quantify using Qubit double-stranded DNA high-sensitivity kit (Invitrogen) (Comeau et al., 2017). Raw reads were deposited on NCBI Sequence Read Archive (PRJNA559877) and were analyzed with the DADA2 pipeline (Callahan et al., 2016) version 1.4 using the R software v3.4.3 (R Core Team, 2017). After the processing, 1292 amplicon sequence variants (ASVs) were obtained and taxonomically classified based on the Silva database v128. Samples where the order, class or genus were not assigned using silva were completed using BLASTn on NCBI (blast.ncbi.nlm.nih.gov/Blast.cgi).
Functional trait database
The microscopic and 18S taxonomic identifications were used to create a table with protistan functional traits. ASVs assigned with the same genus were grouped together, reducing the number of ASVs from 1292 to 130 taxa (referred to as “valid name” in SCOR database and our database). The first step to create our database was to leverage the information from the Scientific Committee on Oceanic Research (SCOR) database created a few years ago to synthesize functional traits of phytoplankton in the Baltic Sea (Klais et al., 2017). When we found matching taxa between our database and SCOR (19%, version May 2017), we noted the functional traits that were associated. Functional traits from the remaining 81% of taxa were manually filled after an extensive literature search. The functional traits database used in this study is available as a Supplementary Table and the full database is freely available at https://github.com/LaboMaranger/Protists and includes the 130 taxa, their functional traits and the references for each trait.
Although a large number of traits were identified, there were only four functional traits, size, trophic strategy, motility and the ability to produce dimethylsulfoxide or dimethylsulfoniopropionate (DMS) that could be assigned to all of the genera identified. Other traits remain incomplete for a large number of taxa. For size, the only continuous trait retained in our analyses, we first grouped organisms in three size classes based on classical oceanographic planktonic categories: pico 0.2–2 µm, nano 2–20 µm and micro 20–200 µm (Robinson et al., 2018) but then further divided organisms into five size classes (0.2–2 µm, 2–5 µm, 5–10 µm, 10–20 µm, 20–200 µm). The latter divisions were more typical in earlier assessments (Legendre and Le Fevre, 1991; Chisholm, 1992). It also provided additional information particularly when considering how functional traits, such as size and trophic strategy co-vary given the wide range of possible size classes that are mixoplanktonic. For all traits, we aggregated the abundance of organisms within the community possessing a specific trait for a given station in a given year. It should be noted that different species of the same genera do not necessarily share the same feeding strategy, but we are limited to this taxonomic rank by using 18S rRNA data. However, this limitation should not cause major changes in the interpretation of our results as the most abundant organisms are not influenced by this limitation (e.g., Phaeocystis pouchetii and diatoms).
We also wish to clarify the use of terms throughout this paper to avoid confusion between protistan groups and their functional trait trophic strategies. Phytoplankton use phototrophy as their trophic strategy; protozooplankton are incapable of phototrophy and use heterotrophy as their trophic strategy, whereas mixoplankton use mixotrophy as their trophic strategy, which we define here as protists with the capacity to perform both phototrophy and phagotrophy. Osmotrophy, the capacity to consume dissolved organic matter is excluded as a mixotrophic strategy as this ability is pervasive among many protistan taxa who also photosynthesize and is different from the ability to phagocytose bacteria and control their populations (Mitra et al., 2016).
Identifying peak chlorophyll-a and bloom extent
For each station and each year, we estimated the beginning and maximum extent of the bloom using L3 chlorophyll-a concentration (mg m-3) derived from satellite observations from the GlobColour project (http://www.globcolour.info/), which has been developed, validated, and distributed by ACRI-ST, France. Satellite data was aggregated in pixels of 625 km² and binned over an eight-day period from March to July. As the frequent cloud cover over the Labrador Sea caused by DMS production (Renfrew and Moore, 1999; Renfrew et al., 2002) often prevents satellites from receiving information for many pixels, we concatenated four pixels together to reduce the number of stations-date without a chlorophyll-a concentration value. We associated the chlorophyll-a values to each station based on their coordinates and calculated how many days separated the sampling date from the onset of the bloom (≥ 1 mg m-3) (Moore and Abbott, 2000) and the maximum intensity of bloom (days from before peak, DBP). Changes in the mixed layer depth was not considered here as our sampling was done in a short period of time (about ten days each year). We did not try to parse out cyanobacteria from the total chlorophyll-a concentration signal as it represented a minor component of the biomass (Fragoso et al., 2017) and our aim was simply to identify the moment when concentrations were highest.
Statistical analyses
Using a redundancy analysis (RDA) (Legendre and Legendre, 2012), followed by a variation partitioning (Borcard et al., 1992) using the varpart function from the vegan library (Oksanen et al., 2010), we first compared the variation in the taxonomic and functional composition of protists that could be explained by space (water mass) and time (sampling year) in the Labrador Sea. We then assessed the variation explained by yearly succession in the protistan community using DBP as an explanatory variable in both the RDA and the variation partitioning. The RDA was performed on Hellinger transformed data (Legendre and Gallagher, 2001) and the RDA global significance was tested using the anova.cca function (9999 permutations) from the vegan package.
To measure the association of specific taxa and functional traits among water masses and for specific years, we used the Pearson’s phi coefficient of association (Chytrý et al., 2002) using the indicspecies R package (De Caceres and Legendre, 2009). The significance of each association was tested using a permutation test and only significant associations were reported. The association coefficient (Φ) was also corrected to take into account that some taxa were present in more sites than others (Tichy and Chytry, 2006).
Results
After correcting for sample volumes, we found no statistically significant differences between community composition at 2 and 30 m (constrained correspondence analysis, p-value > 0.05), presumably because of surface water homogeneity (Fragoso et al., 2016). We thus pooled sequences from both depths to represent the whole station for subsequent analysis. All protistan phyla are represented on Figure S2, but only the four dominant phyla will be used for graphical representations as they represented on average 76% of the community diversity. The main orders of these phyla were: Micromonas and Pyramimonas for Chlorophyta; Biechelaria, Gyrodinium, Gymnodinium, Heterocapsa, Woloszynskia for Dinoflagellata; Phaeocystis, Chrysochromulina, Haptolina, Prymnesium and Coccolithus for Prymnesiophytes. Ochrophyta were predominantly diatoms with the genera Thalassiosira, Chaetoceros, Skeletonema, Pseudo-nitzschia, Fragilariopsis, but also included the orders Pelagophyceae and Chrysophyceae. Given that there is a historical time series related to this transect using microscopy, we wanted to compare our 18S with available taxonomic counts for 2014 and 2015. We found reasonable complementarity between the methods (Figure S3) and the 18S taxonomic assessments (Figure S2) presumably because Phaeocystis pouchetii dominated in the region. Although only 47% of taxa identified using microscopy were captured by sequencing 18S, after a few minor corrections related to different names for the same species (Estep and MacIntyre, 1989; Altenburger et al., 2020, Table S2), the remaining unsequenced taxa represented only 3.1% ± 1.7% (mean ± standard deviation) of total cell abundance. Hence, the 18S reflected the historical records of the phototrophs and mixotrophs. However, we found that there was much more diversity (Shannon index, paired T-test, p-value< 0.001) and higher representation in the heterotrophic protistan categories using 18S. This is likely due to the focus of primarily identifying the phytoplankton using microscopy.
Of the 130 unique taxonomic genera identified in the Labrador Sea using 18S DNA, we created a database with over 1062 assigned traits in 16 different trait categories. Size, trophic strategy, motility, and dimethylsulfoxide and dimethylsulfoniopropionate (DMS) production were the only traits that could be assigned to the full taxonomic spectrum. As such, these were the traits assessed in this analysis. Differences in the distribution of taxonomic groups and size classes were observed between sampling stations and among years (Figures 1A, B). Community composition closer to the shelves were structured differently as compared to those located in the central basin, and there seemed to be differences in dominance patterns between years, but there was no obvious biogeographical pattern. In order to conclusively test if there were differences in the taxonomic and functional trait composition of the protistan communities as a function of water mass and between years, we used a variation partitioning approach. We found that a significant proportion of the taxonomic and trait composition could be explained by both factors (Figure 1C) in the Labrador Sea. However, a greater proportion of the variation in protistan biogeography was explained using functional trait composition as compared to taxonomy (Figure 1C). This was the case for trophic strategy, size, and motility, where almost twice as much variation was explained by water mass and sampling year as compared to taxonomic composition (Figure 1C). For DMS, only differences among sampling years were observed and slightly less variance was explained for this trait as compared to others.
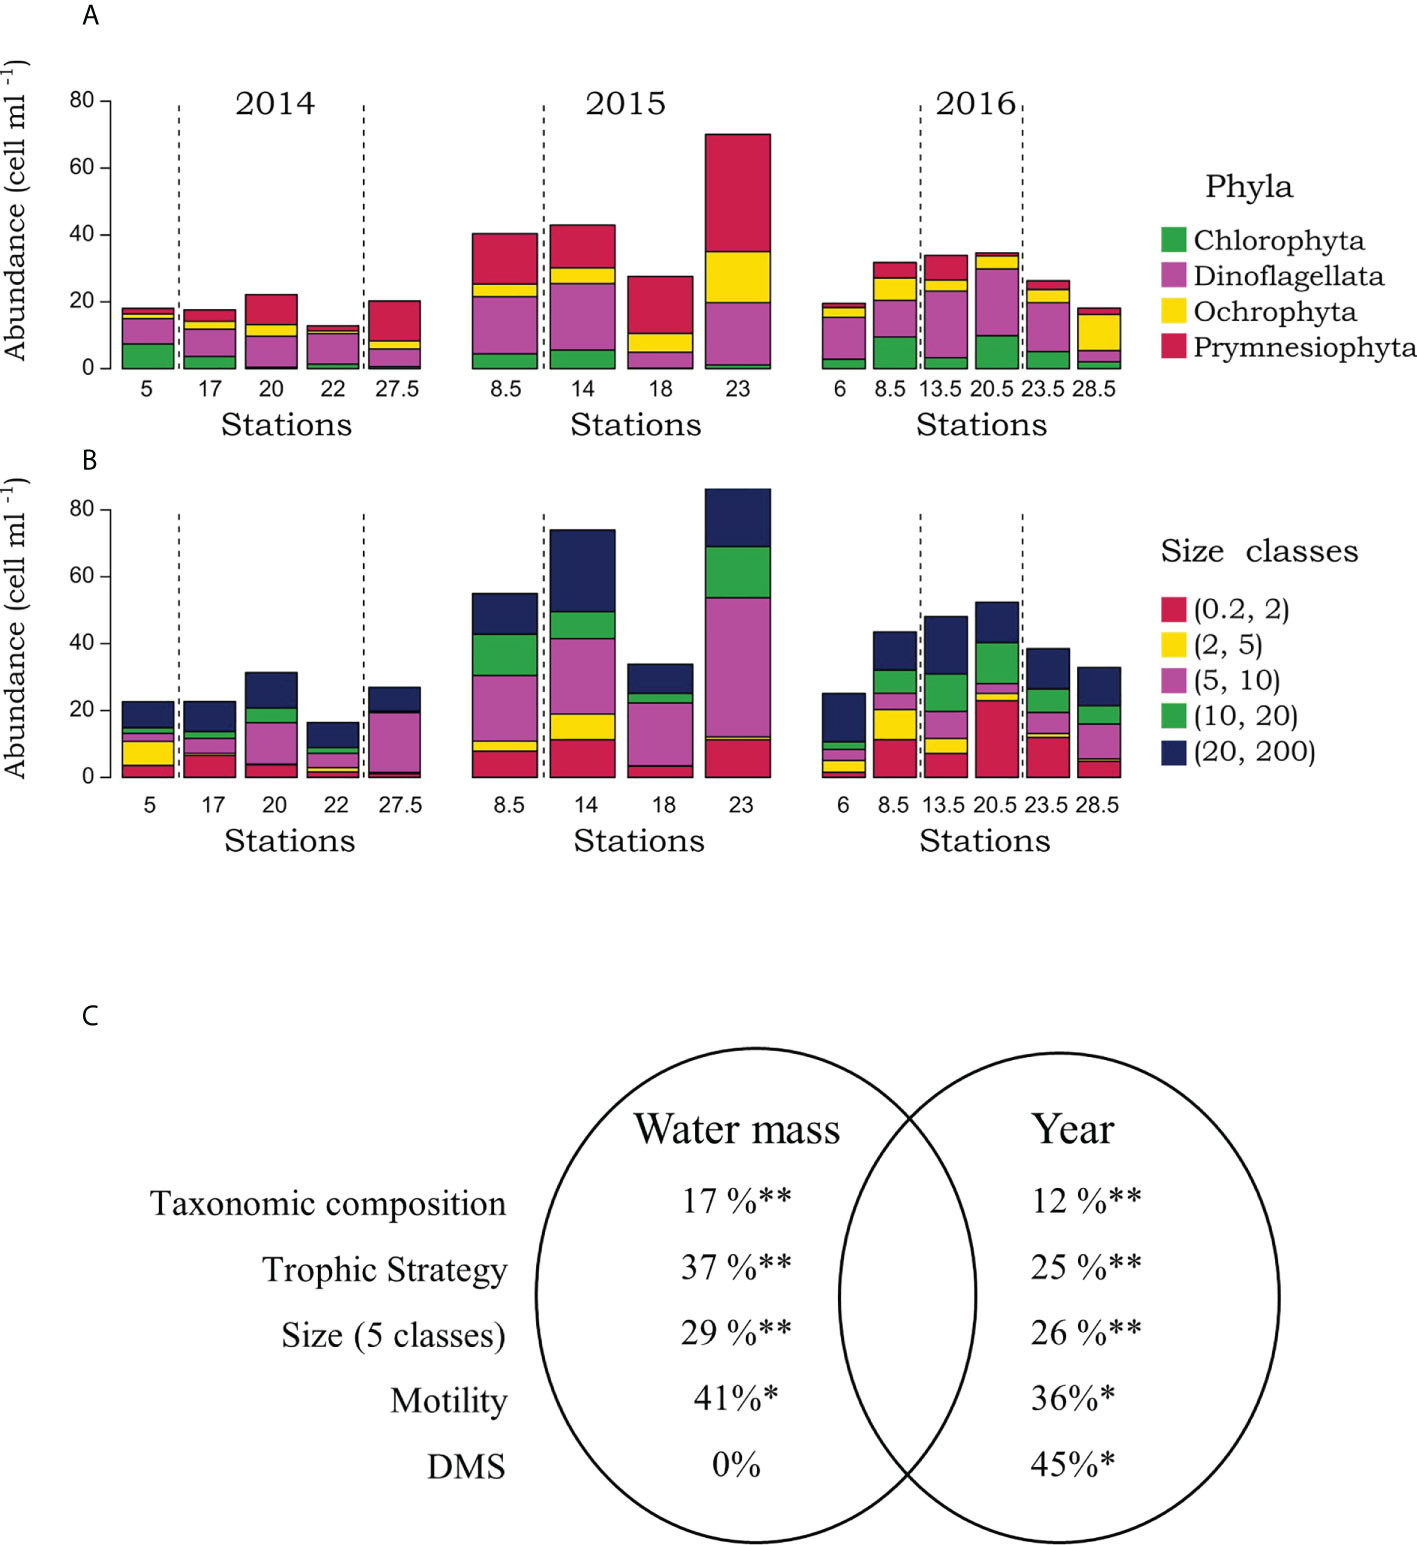
Figure 1 The abundance of the most abundant taxa based on 18S sequencing (A), and size classes (B) in the Labrador Sea water masses and over years. Dashed lines represent the separation between waters masses: Labrador shelf (left), central basin (middle), Greenland shelf (right, absent in 2015). A Venn diagram (C) representing the variation partitioning (in %) of taxonomic composition and the four functional traits of this study across water masses and years. Note that nothing was shared between space and time. * and ** represent partial RDA p-values of ≤ 0.05 and ≤ 0.01, respectively.
To understand which taxa and traits were affiliated with the different water masses and years, we used a Pearson’s phi coefficient of association. We found that the two shelves differed considerably in terms of the associated taxa and functional traits (Table 1). Dinoflagellates, chlorophytes, and genera who were predominantly mixotrophic, motile, and of the 2–5 µm size class were positively associated with the Labrador Shelf, whereas most of these groupings were negatively associated with the Greenland Shelf. In terms of annual differences, prymnesiophytes were strongly associated with 2015 as were protists of the 5–10 µm size class; indeed, there was a major bloom of the colonial Phaeocystis pouchetii (8 µm) that year which resulted in considerably higher average chlorophyll-a and DOC concentrations across the region (Figure S4). In contrast, the associations between the other two years with protistan taxa and their traits varied considerably (Table 1). Given these differences and the high variability in chlorophyll-a concentration across sites and among years, we wanted to determine if the bloom timing was related to the taxonomic and functional composition patterns we observed.
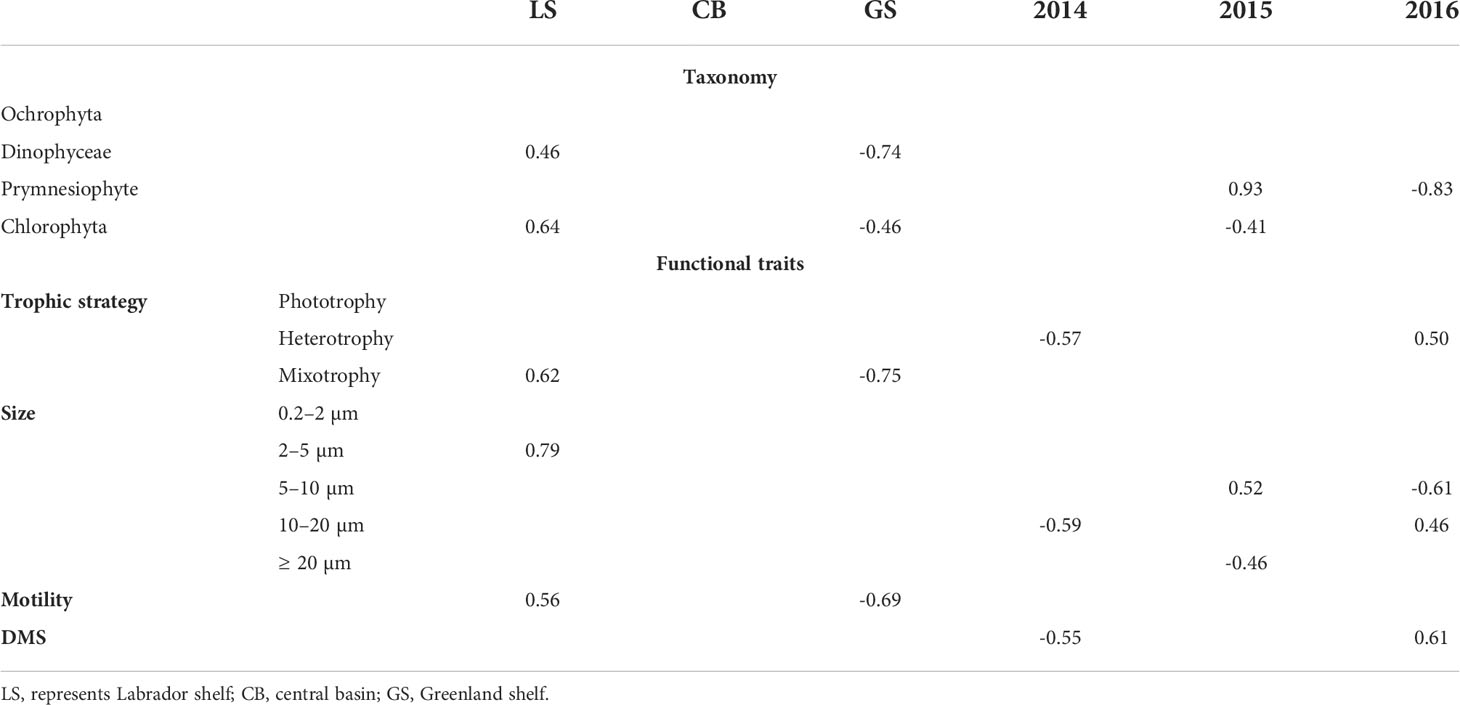
Table 1 Strength of the association between taxonomic groups and functional traits with water mass and year based on Pearson’s phi coefficient. Only significant associations are reported.
Using satellite-derived chlorophyll-a concentrations, we characterized the inter-annual variability in bloom timing as the moment of peak chlorophyll-a concentration at each station across years (Figure 2). The spring peak occurred between May and June at the majority of stations, but the onset of the bloom differed among years (Table S1). The moment of peak chlorophyll-a was also variable across stations and among years, but sampling occurred annually between days of year 127–136 (gray area, Figure 2). Therefore, we summarized this information in a metric we call “days before peak” (DBP), which represents the number of days preceding the date of highest chlorophyll concentration (i.e., DBP = 0) at any one sampling event (site and moment). Information ranged from 0 to 50 DBP (Table S1) which allowed for the reconstruction of a successional pattern leading to the moment of peak chlorophyll, profiting from the interannual variation in observed chlorophyll-a concentration and community dynamics for the same day of the year. For most stations in 2014, the bloom started in early May and peaked 21 days later (mean ± standard error) at around day 150 ± 3 of year. In 2015, the onset of the bloom was earlier, towards the end of April and peaked 25 days later at around day 142 ± 3 of year. In 2016, the bloom started later, towards mid-May and peaked at day 169 ± 6 of year. As a result, most stations were sampled shortly before the peak of the bloom in 2014 and 2015 (Figures 2A, B), while sampling generally occurred well before the peak in 2016 (Figure 2B). The maximum intensity (mean ± standard error) of the bloom varied significantly among years with 7.74 ± 1.36 mg m-3 chlorophyll-a in 2014, 6.55 ± 1.00 in 2015 with the lowest observed in 2016 at 3.23 ± 0.55 mg m-3.
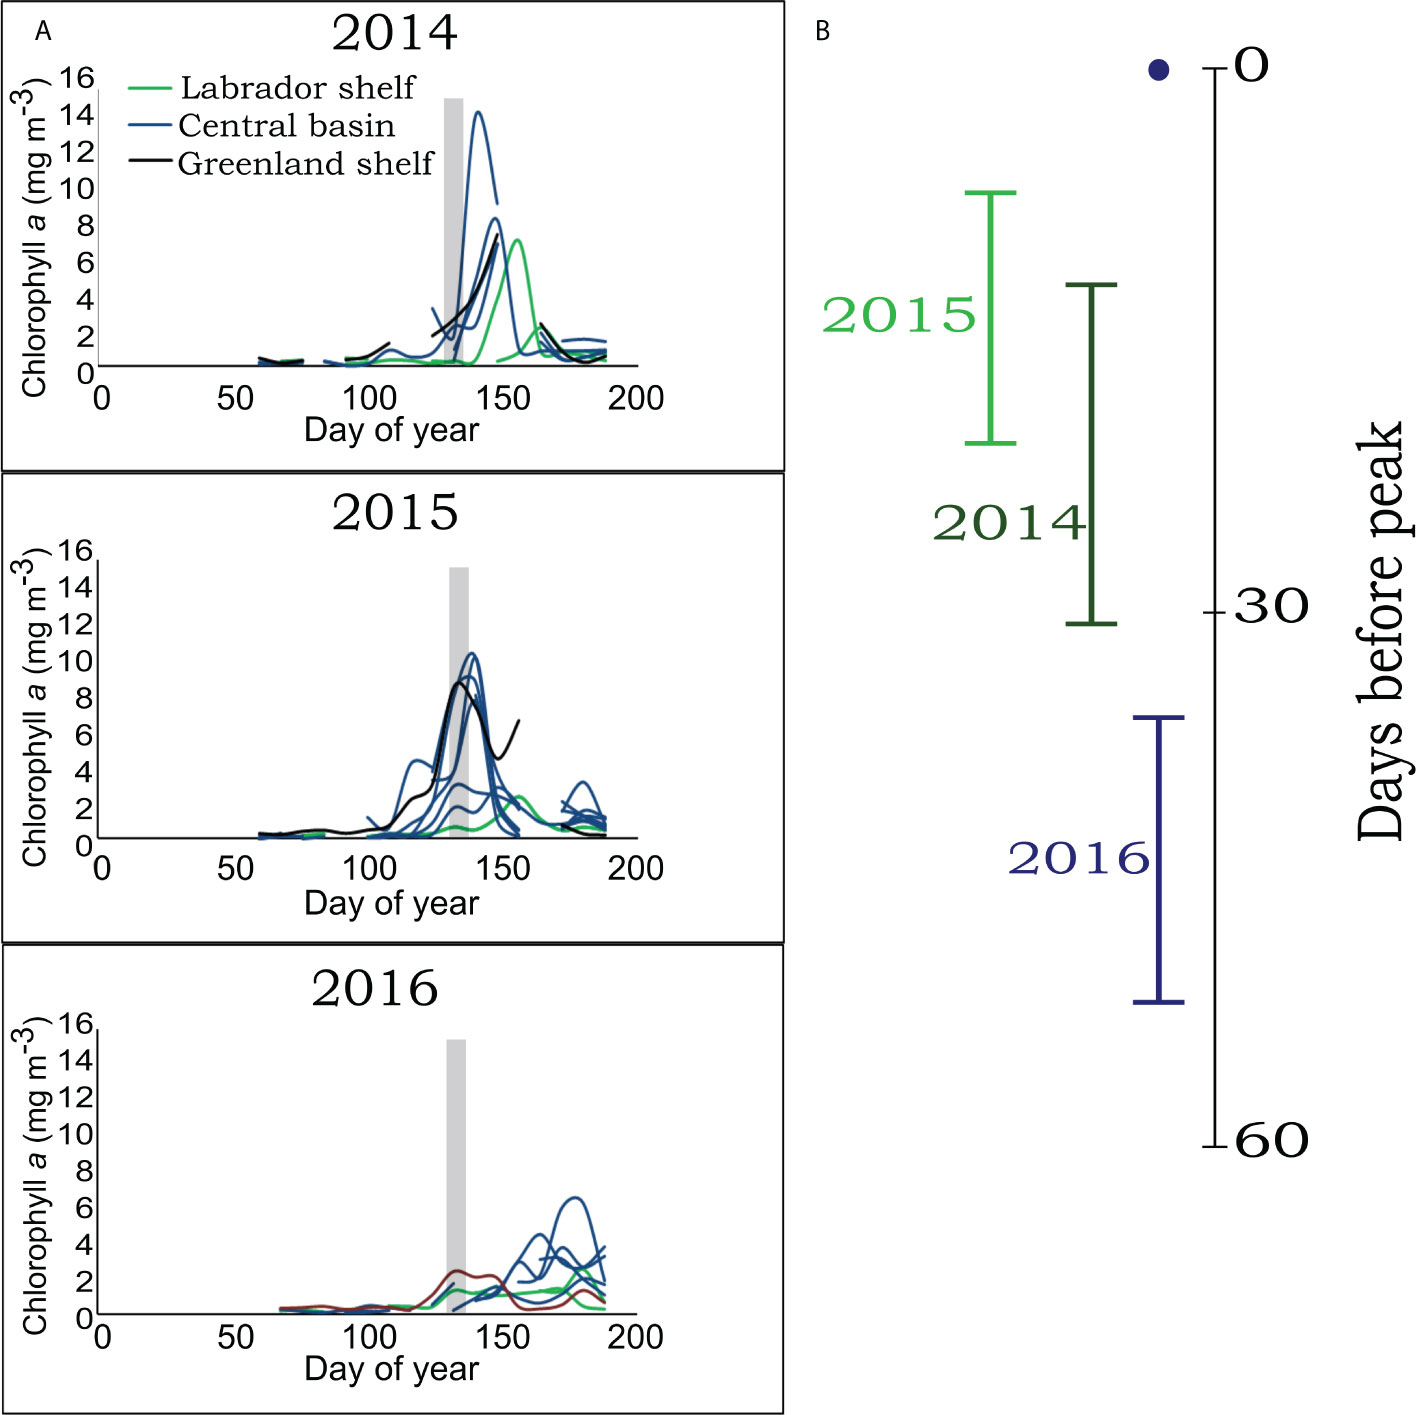
Figure 2 Chlorophyll-a concentrations (mg m-3) from satellite observations between days of year 60 and 188 for 2014, 2015, 2016 (A). Each line represents a sampling station with colors corresponding to water masses. The grey area represents the sampling period. Number of days before peak chlorophyll-a for all stations grouped by year (B).
Given the range of observations in DBP among years and across stations within years, we used this information to test whether the moment of sampling influenced protistan functional trait community structure. Using variation partitioning, we observed that for all traits except DMS, more than half of the explained variation could be attributed to DBP (Figures 3A, B; Table S3). Indeed, a significant proportion of the variation in size and trophic strategy attributed to year (Figures 3, 17% in A and 11% in B) and water mass (Figures 3, 13% in A and 27% in B) could be explained by the successional stage of protistan community traits. Focusing on size and trophic strategy, we then recreated a bloom phenology by combining all years together, in a sort of space for time substitution to elucidate the succession of functional traits from 52 days before chlorophyll-a peak. For size classes, the most dramatic shift was in the 5–10 µm size class, where the relative abundance started to increase dramatically between 30 and 15 DBP, more than doubling closer to the peak (Figure 3C). The relative abundance of the microplankton (≥ 20 µm) remained high and stable throughout the near two months’ time frame while all the other three size classes remained low but declined slightly closer to the peak. For trophic strategies, mixotrophy and motility started to decline around 35 DBP (Figure 3D; Figure S5). Mixotrophy was dominant prior to 20 DBP chlorophyll whereas phototrophy started to increase from about 30 DBP and became dominant after 20 DBP (Figure 3D). As we got closer to the peak, a relative increase in heterotrophy was observed, and mixotrophy was lowest. Not surprisingly, these patterns also coincided with a decrease in nutrients as well as an increase bacterial production around 20 DBP (Figures S6, S7).
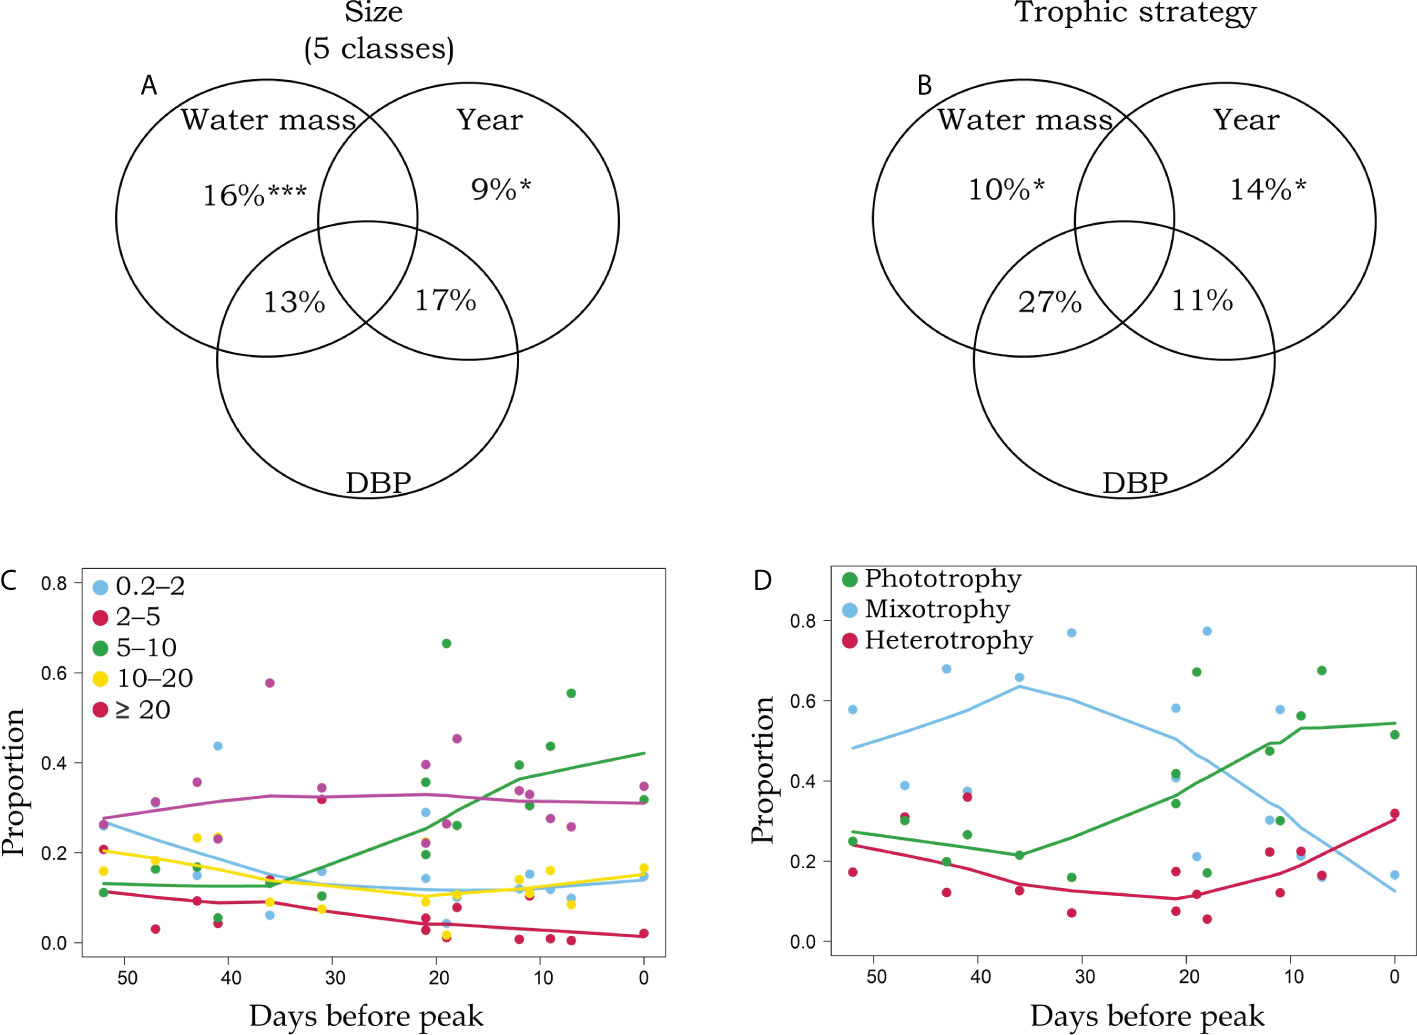
Figure 3 Venn diagrams representing the variation partitioning of size classes (A) and trophic strategy (B) across water masses, years, and the number of days before peak (DBP) chlorophyll. The smoothed (LOWESS function, stats core R package, 60% span) relationship between the proportion of size classes (C) and trophic strategies (D) and the number of DBP. *and *** represent partial RDA p-values of ≤ 0.05 and ≤ 0.001, respectively.
When we combined size structure and trophic strategy with regards to bloom phenology (Figure 4), the smallest size class contained all three trophic strategies, with heterotrophy being slightly more prominent at different occasions. The 2–5 µm and 10–20 µm size classes were dominated by mixotrophic groups, that declined through the period, whereas the 5–10 µm was dominated by phototrophs, increasing from 30 DBP. In the biggest size class, ≥ 20 µm, mixotrophy was dominant up to 20 DBP when phototrophy started to increase. The continuous decline of mixotrophy in the 10–20 µm size class was mainly replaced by phototrophy in the 5–10 µm size class, which represented overall more than 30% of total abundance close to the peak. By comparison, protozooplankton were mostly constrained in the smallest size class of 0.2–2 µm. However, those of the 5–10 µm size class drove the increase closer to the peak, representing about 20% of the protistan abundance capable of heterotrophy only. All these results were also observed using total read counts (not shown).
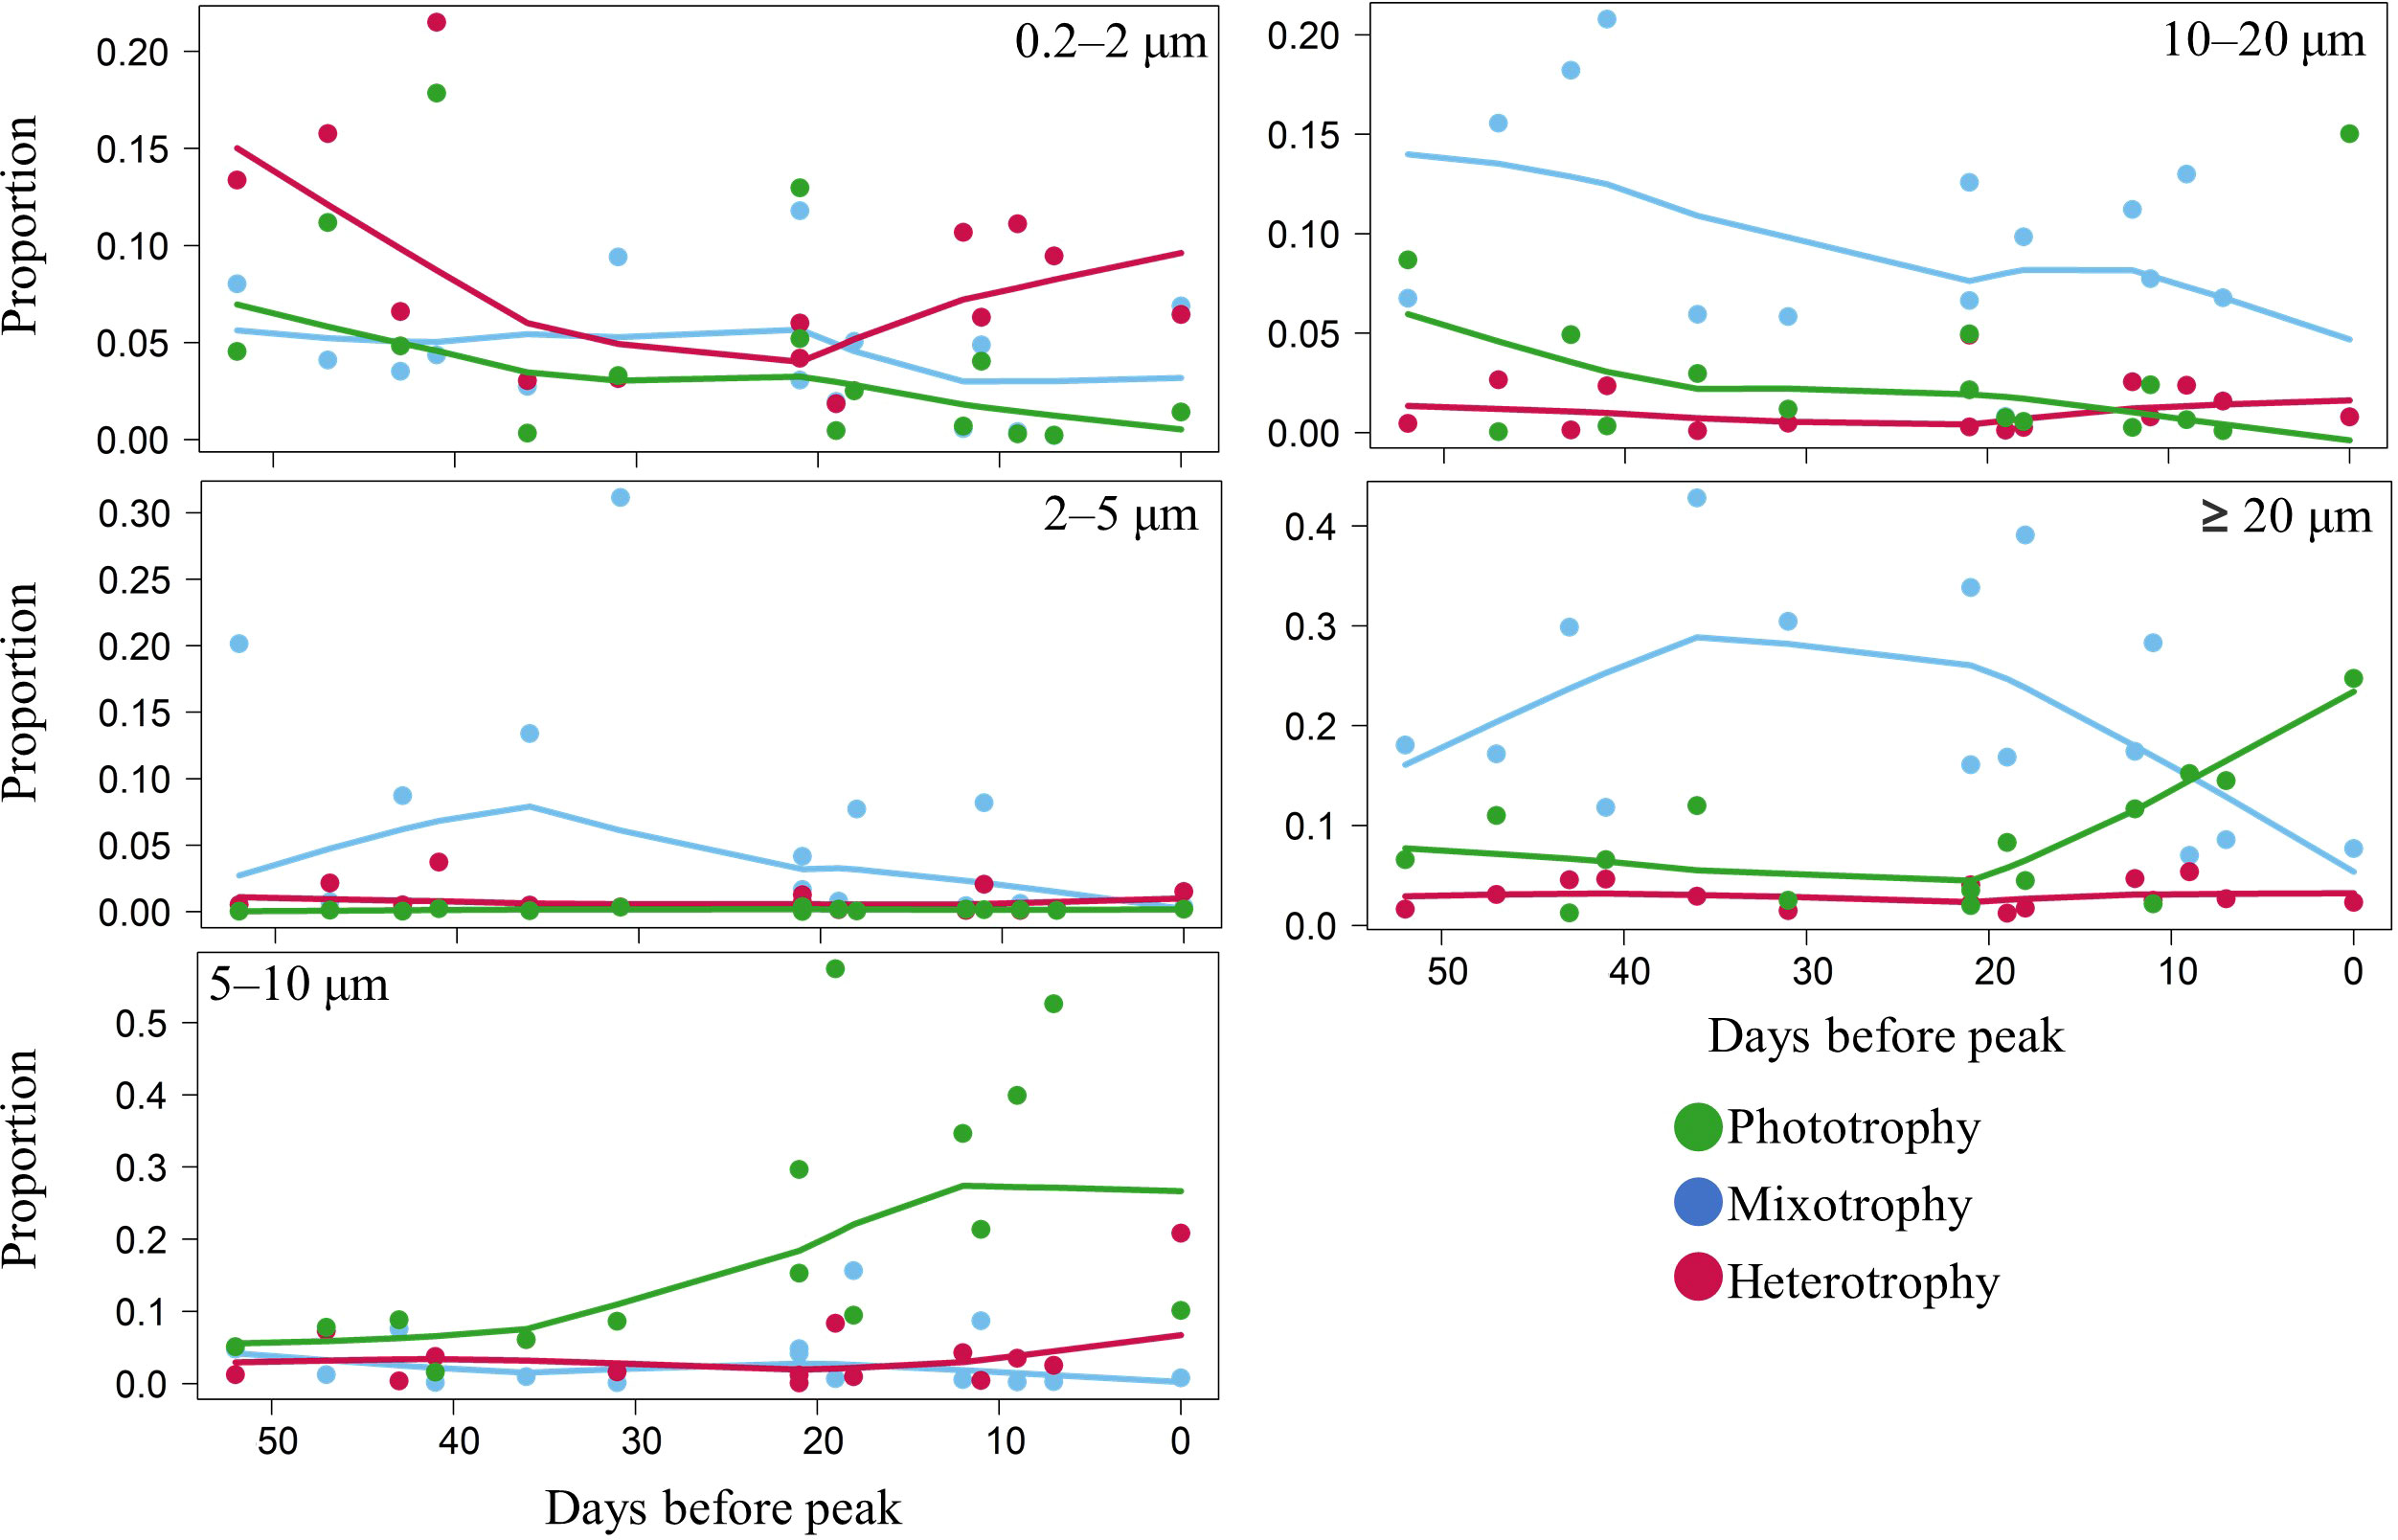
Figure 4 The smoothed (LOWESS function, stats core R package, 60% span) relationship between the proportion of each trophic strategy by size class.
Discussion
In this study we characterized a functional biogeography of several functional traits of the protistan community in the Labrador Sea and found that this biogeography was influenced by successional patterns related to bloom timing, expressed as days before peak chlorophyll-a (DBP). Although a taxonomic biogeography of the region has been described (Fragoso et al., 2016; Fragoso et al., 2017), we showed that more spatial and temporal variability could be explained using a functional trait approach to characterize community structure and that bloom phenology is pivotal in determining the biogeographical patterns of this structure. Moreover, DBP assessed changes in preferred trophic strategy, cell size, and their combined responses, enabling the evaluation of how two key functional traits used in oceanic models (Le Quéré et al., 2005; Flynn and Mitra, 2009) co-vary over time. Understanding how changes in phenology influences the expression of protistan traits, particularly in light limited subpolar regions of the ocean and those whose stratification dynamics are more affected by climate change (Kahru et al., 2011) will have consequences on both our understanding of carbon sequestration and trophic transfer spatially and at different time scales. As ecosystem productivity is influenced by which phytoplankton are adapted to dominate at any given moment (Vallina et al., 2017), this can now be captured through the functional trait succession of our novel DBP metric.
Determining the moment of the onset of a bloom, which is largely controlled by how stratification dynamics influence the availability of both light and nutrients, is somewhat of a challenge (Yang et al., 2020), but remote sensing techniques enable the tracking of chlorophyll-a concentration and allows for the determination of the moment of peak chlorophyll-a, with relative ease. Broadscale patterns have shown that the extent and timing of blooms in the Labrador Sea are highly variable (Brody et al., 2013; Marchese et al., 2019). We also found that the moment of peak chlorophyll-a on the AR7W transect was highly variable across years, which enabled us to determine where a bloom was in time in a site-specific context. Using DBP we were able to reconstruct the successional pattern of functional traits up to two months before maximum chlorophyll-a concentrations to track changes in functional trait dominance over bloom development and clearly show that this timing acts as a driver of functional trait community structure. During that time frame, the relative abundance of picophototrophs steadily decreased and were replaced by nano- and micro- phototrophs, increasing the potential of carbon sequestration through the biological carbon pump (Finkel et al., 2010) due to increased cell size combined with photosynthesis. Late winter to early spring patterns of succession have been reported in the areas of the North Atlantic Ocean from a broad taxonomic point of view where changes in size traits were observed (Daniels et al., 2015), and are similar to what we report here.
A shift in size-classes is of interest as this may also be attributed to additional functional trait trade-offs (Irwin and Finkel, 2017) including differential uptake kinetics related to cell size and physiology (Litchman et al., 2007; Flynn et al., 2018). Indeed, size is a master-trait in that it influences so many other functions related to inorganic resource acquisition (Litchman et al., 2015); this is why pairing size with trophic strategy provides additional information on biogeochemical flows because of how phagotrophy provides an alternative pathway to both nutrient and carbon acquisition (Maranger et al., 1998; Stoecker et al., 2017). In terms of trophic strategy, it is not completely surprising that at the end of winter and early spring, mixotrophy was dominant as they tend to thrive out of blooms, particularly when light or nutrient availability are low, or as a function of predator-prey interactions (Mitra et al., 2014). Our findings support a modelling approach that considered both protistan cell size and trophic strategy along a latitudinal gradient which found that phototrophy dominated during spring blooms in high latitudes, and that the contribution of mixotrophy was quite variable (Chakraborty et al., 2020). There is also a growing capacity to assess phytoplankton size structure using remote sensing techniques (Uitz et al., 2015), with the intention of broadening it into different functional types (Mouw et al., 2017), and this will only improve as more hyperspectral satellites come online. Our work certainly suggests that the mixotrophic loop (Zubkov and Tarran, 2008; Mitra et al., 2014) be considered in the functional assessment of the North Atlantic Ocean (Lindemann and St. John, 2014).
According to our reconstruction, mixoplankton dominated in late winter early spring, and began losing their competitive advantage at around 20–30 DBP; this resulted in their decline in both the 10–20 µm and ≥ 20 µm size classes while being outcompeted by phytoplankton in the 5–10 µm and ≥ 20 µm size classes. As this result was observed in both absolute and relative abundances, this suggests that phytoplankton had much higher growth rates than mixoplankton, and/or that the grazing pressure by mesozooplankton, Calanus spp. in this region (Head et al., 2000), was more intense on mixoplankton as they can have better nutritional quality (Traboni et al., 2021). Indeed, we saw that this timing also corresponded with a number of different shifts, including a loss in relative protistan motility, which is often a trait associated with the flagellates that perform mixotrophy, as well as a decline in nutrients and an increase in bacterial production (Figures S6, S7). As such, 20 to 30 DBP chlorophyll represents a critical moment catalyzing a series of changes. We propose that this timing corresponds to the onset of stratification, where sufficient light and nutrients become available to allow for the accrual of phototrophic biomass, although this hypothesis needs to be confirmed.
From a functional ecological point of view, addressing the successional behavior of multiple traits in combination remains underexplored. We acknowledge that our work was only able to address a limited number of traits because we focused only on those that were fully represented across our taxa, whereas our database includes 12 more traits to be further developed. For the few other traits where information was available, these shifts clearly supported change in size and trophic strategy, albeit DBP had a more variable influence. We saw a strong shift from more motile species towards less motile ones starting at 30 DBP, again coinciding with a change from largely flagellate mixoplankton to non-motile phytoplankton. Motility for mixoplankton enables them to chase their prey to acquire their energy and nutrients or move toward the light (Flynn et al., 2019) and, for phytoplankton, can serve as a mechanism to avoid resource scarcity and evade predators (Wentzky et al., 2020). However, the dominant species during Labrador Sea spring bloom is the colonial Phaeocystis pouchetii, a non-motile species and well known DMS producer (Schoemann et al., 2005). The capacity to produce DMS share a similar ecological property with motility as it is a defense mechanism against bacterio- and zooplankton (Keller et al., 1989). Most of the variation in DMS production as a trait was temporal, likely due to the interannual variability in the moment of peak biomass (Marchese et al., 2019), with some influence of DBP.
At 10 to 20 DBP, there was an increase in the smallest heterotrophic size class coinciding with an increase in bacterial production. These heterotrophs were associated to Syndiniales and Picomonas, and given their small size, were not major grazers of phototrophs. Syndiniales are parasitoids of marine dinoflagellates and have been found to co-occur in conditions of variable dinoflagellate biomass (Chambouvet et al., 2008; Sehein et al., 2022). They have a free-living form called dinospores that can survive in water a few days after infection (Guillou et al., 2008), which may explain their capture in the sequencing data. Although their role in biogeochemical cycling is not well understood, Syndiniales likely contribute to elemental recycling (Guillou et al., 2008). Picomonas are cosmopolite pico-heterotrophs that are not well ecologically characterized, but are thought to have contributed to the loss of endosymbiosis during protist evolution (Schön et al., 2021). Our reconstructed time series did not cover post bloom, where we would anticipate the potential takeover of larger phagotrophic protists.
As size and trophic strategy combined influence energetic trophic transfer (Ward and Follows, 2016), the interannual variability in event timing may result in phenological mismatches with herbivores. Indeed, the timing of peak chlorophyll was highly variable and differed by a maximum of 48 days across the three sampling years. Understanding trait changes in bloom phenology is critical, especially if we consider not only the carbon quantity as a function of cell size and overall biomass, but also the differential carbon quality be it primarily from protists that perform mixotrophy, phototrophy or heterotrophy. Mismatches can occur when changes in phytoplankton bloom dynamics influence the success of zooplankton (Edwards and Richardson, 2004; Koeller et al., 2009) and fish recruitment (Platt et al., 2003; Asch et al., 2019). Changes in bloom timing could have significant implications on the relative fate of carbon particularly in the Labrador Sea where the dominant blooming species during spring is Phaeocystis pouchetii. Phaeocystis is a major source of energy for copepods (Head and Harris, 1996), but sinks to the deep ocean only once it dies (Schoemann et al., 2005). Thus, the biomass produced by Phaeocystis can either be transferred to higher trophic levels if biomass production is in synchrony with copepods or otherwise it would become a major carbon sink.
Given their increasingly recognized influence on carbon dynamics (Mitra et al., 2014; Ward and Follows, 2016; Leles et al., 2018; Leles et al., 2021) and their ubiquitous distribution (Zubkov and Tarran, 2008; Leles et al., 2017; Stoecker et al., 2017; Faure et al., 2019; Leles et al., 2019), understanding the factors driving the expression of mixotrophy as a trait at the community level is becoming increasingly more relevant. However, identifying mixoplankton conclusively represent several conceptual challenges and it should be noted that our evaluation of mixotrophy was largely theoretical, based on a literature survey of those genera capable of both phototrophy and phagotrophy. As a trait, mixotrophy is known to be highly plastic and a challenge to measure in situ (Flynn et al., 2013; Chakraborty et al., 2017; Selosse et al., 2017). In general, mixoplankton as defined here would be favored when nutrients are low and light is high or vice-versa where phagotrophy supplies nutrients or carbon, respectively (Hansen and Hjorth, 2002; Selosse et al., 2017; Edwards, 2019). The succession we observed in our reconstruction was similar to what has been proposed theoretically (Berge et al., 2017). From an ecological point of view, as light availability increased it is not surprising that phytoplankton replaced and outcompeted mixoplankton, when nutrients were still available (Li et al., 2020). However, whether mixoplankton are relying on phagotrophy, and precisely how they allocate their acquired resources can be quite complex. For example, under high light and low particulate iron availability, mixoplankton rely more on heterotrophy to acquire carbon from their preys rather than acquiring carbon through phototrophy (Maranger et al., 1998). The imbalance between light and non-carbon elements may provide some general guidelines for the conditions that favor mixotrophy and potential carbon acquisition pathways (Selosse et al., 2017), but there are exceptions to the rule and these may extend to vast areas of the iron limited ocean. Nevertheless, knowing when mixoplankton dominate in conditions where mixotrophy is the most plausible feeding strategy among protistan communities will improve current carbon models and we propose that using the days before peak chlorophyll-a as a proxy of where a sampling location may be in terms of its functional succession could be useful to elucidate this.
Conclusion
This study is the first to our knowledge to provide evidence of the structuring effect of the timing of peak chlorophyll-a on the succession of protistan functional traits, which will influence how we assess their biogeography given that most oceanographic in situ sampling is a snap-shot. Although some of the interpretations of our work needs to be confirmed, we suggest the use of days before peak chlorophyll-a concentrations, derived from remote sensing techniques, could be used as a proxy of plankton phenology to better understand the dynamics of one’s sampling moment with regards to protistan functional trait distribution. Functional properties of the moment of sampling relative to peak chlorophyll-a should be explored further. For example, the shift we observed between 30 and 20 DBP may be related to a proportion of peak chlorophyll-a biomass that represents a change in community growth rate, similar to the dilution–recoupling hypothesis (Behrenfeld, 2010). That proportion may also vary as a function of biomass. This could further be evaluated using the relative signal of different hyperspectral bands to identify successional changes among different phytoplankton types. The structuring effect of the timing of peak chlorophyll-a could also be assessed in lakes as there are generalized biogeographical patterns based on climate (Jamil et al., 2014; Sodré et al., 2020), and time-series, including the onset of stratification, are easier to conduct than in marine ecosystems. This structuring effect could also be tested post-bloom to determine if similar patterns emerge in the senescing phase of the bloom as predicted in different models (Berge et al., 2017; Chakraborty et al., 2020); our work showed an increasing proportion of protozooplankton closer to peak chlorophyll but interestingly the increases we observed were not related to the onset of phytoplankton grazers, but Picomonas and Syndiniales, smaller picoheterotrophs of the 0.2–2 µm size class. Regardless, the influence of DBP could be tested on zooplankton species and functional traits to assess its pervasiveness as a structuring effect of plankton communities at higher trophic levels. As more information on the influence of the timing of peak chlorophyll-a in structuring the success of functional traits arises, its inclusion in marine biogeochemical models offer a simple parameter to reconstruct more dynamic carbon pathways of plankton communities in space and over time.
Data availability statement
Raw reads were deposited on NCBI Sequence Read Archive (accession number PRJNA559877). All other data and scripts are available at www.github.com/laboMaranger/Protists and attributed to a DOI using Zenodo (DOI:10.5281/zenodo.6985297).
Author contributions
BP did the DNA extraction and analyses, and the functional trait literature survey. RL did the field work and remote sensing analyses. NFS-G did the statistical analysis. RM conceptualized the work, and supervised the process. All contributed to idea development, wrote and edited the manuscript, with major contributions by RL and RM. All authors contributed to the article and approved the submitted version.
Funding
This work was funded by an FQRNT student scholarship and Postdoctoral Fellowship to RL and NFS-G respectively, and a NSERC Discovery and a NSERC-CCAR to RM. This work is a contribution to the Groupe de recherche interuniversitaire en limnologie (GRIL) and Ventilation, Interactions and Transports Across the Labrador Sea (VITALS - RGPCC 433898, NSERC-CCAR group grant - led by P. Myers, U. Alberta).
Acknowledgments
We would like to thank all crew members and officers of the R/V CCGS Hudson including Chief scientist Igor Yashayaev (DFO) for logistics, and Sylvie Lessard (DFO) for taxonomic identification and phytoplankton counts using microscopy. We also thank J. Shapiro for providing the space for DNA extractions. We are grateful for the constructive criticisms of anonymous referees. No financial benefits were received from this publication, and all authors declare no conflict of interest.
Conflict of interest
The authors declare that the research was conducted in the absence of any commercial or financial relationships that could be construed as a potential conflict of interest.
Publisher’s note
All claims expressed in this article are solely those of the authors and do not necessarily represent those of their affiliated organizations, or those of the publisher, the editors and the reviewers. Any product that may be evaluated in this article, or claim that may be made by its manufacturer, is not guaranteed or endorsed by the publisher.
Supplementary material
The Supplementary Material for this article can be found online at: https://www.frontiersin.org/articles/10.3389/fmars.2022.916093/full#supplementary-material
References
Adl S. M., Bass D., Lane C. E., Lukeš J., Schoch C. L., Smirnov A., et al. (2019). Revisions to the classification, nomenclature, and diversity of eukaryotes. J. Eukaryot. Microbiol. 66 (1), 4–119. doi: 10.1111/jeu.12691
Altenburger A., Blossom H. E., Garcia-Cuetos L., Jakobsen H. H., Carstensen J., Lundholm N., et al. (2020). Dimorphism in cryptophytes–the case of teleaulax amphioxeia/Plagioselmis prolonga and its ecological implications. Sci. Adv. 6 (37), eabb1611. doi: 10.1126/sciadv.abb1611
Asch R. G., Stock C. A., Sarmiento J. L. (2019). Climate change impacts on mismatches between phytoplankton blooms and fish spawning phenology. Global Change Biol. 25 (8), 2544–2559. doi: 10.1111/gcb.14650
Barton A. D., Pershing A. J., Litchman E., Record N. R., Edwards K. F., Finkel Z. V., et al. (2013). The biogeography of marine plankton traits. Ecol. Lett. 16 (4), 522–534. doi: 10.1111/ele.12063
Behrenfeld M. J. (2010). Abandoning sverdrup's critical depth hypothesis on phytoplankton blooms. Ecology 91 (4), 977–989. doi: 10.1890/09-1207.1
Berge T., Chakraborty S., Hansen P. J., Andersen K. H. (2017). Modeling succession of key resource-harvesting traits of mixotrophic plankton. ISME J. 11 (1), 212–223. doi: 10.1038/ismej.2016.92
Borcard D., Legendre P., Drapeau P. (1992). Partialling out the spatial component of ecological variation. Ecology 73 (3), 1045–1055. doi: 10.2307/1940179
Brody S. R., Lozier M. S., Dunne J. P. (2013). A comparison of methods to determine phytoplankton bloom initiation: Methods to determine bloom initiation. J. Geophys. Res.: Oceans 118 (5), 2345–2357. doi: 10.1002/jgrc.20167
Callahan B. J., McMurdie P. J., Rosen M. J., Han A. W., Johnson A. J. A., Holmes S. P. (2016). DADA2: high-resolution sample inference from illumina amplicon data. Nat. Methods 13 (7), 581. doi: 10.1038/nmeth.3869
Chakraborty S., Cadier M., Visser A. W., Bruggeman J., Andersen K. H. (2020). Latitudinal variation in plankton traits and ecosystem function. Global Biogeochem. Cycles 34 (8), e2020GB006564. doi: 10.1029/2020GB006564
Chakraborty S., Nielsen L. T., Andersen K. H. (2017). Trophic strategies of unicellular plankton. Am. Nat. 189 (4), E77–E90. doi: 10.1086/690764
Chambouvet A., Morin P., Marie D., Guillou L. (2008). Control of toxic marine dinoflagellate blooms by serial parasitic killers. Science 322 (5905), 1254–1257. doi: 10.1126/science.1164387
Chisholm S. W. (1992). “Phytoplankton size,” in Primary productivity and biogeochemical cycles in the Sea. Eds. Falkowski P. G., Woodhead A. D., Vivirito K. (Boston, MA: Springer US), 213–237.
Chytrý M., Tichý L., Holt J., Botta-Dukát Z. (2002). Determination of diagnostic species with statistical fidelity measures. J. Veg. Sci. 13 (1), 79–90. doi: 10.1111/j.1654-1103.2002.tb02025.x
Comeau A. M., Douglas G. M., Langille M. G. I. (2017). Microbiome helper: a custom and streamlined workflow for microbiome research. MSystems 2 (1), e00127–e00116. doi: 10.1128/mSystems.00127-16
Daniels C. J., Poulton A. J., Esposito M., Paulsen M. L., Bellerby R., St John M., et al. (2015). Phytoplankton dynamics in contrasting early stage north Atlantic spring blooms: composition, succession, and potential drivers. Biogeosciences 12 (8), 2395–2409. doi: 10.5194/bg-12-2395-2015
De Caceres M., Legendre P. (2009). Associations between species and groups of sites: indices and statistical inference. Ecology 90 (12), 3566–3574. doi: 10.1890/08-1823.1
Edler L., Elbrächter M. J. M. (2010). The utermöhl method for quantitative phytoplankton analysis. Microsc. Mol. Methods Quant. Phytoplankton Anal. 110, 13–20.
Edwards K. F. (2019). Mixotrophy in nanoflagellates across environmental gradients in the ocean. Proc. Natl. Acad. Sci. 116 (13), 6211–6220. doi: 10.1073/pnas.1814860116
Edwards M., Richardson A. J. (2004). Impact of climate change on marine pelagic phenology and trophic mismatch. Nature 430 (7002), 881–884. doi: 10.1038/nature02808
Estep K. W., MacIntyre F. (1989). Taxonomy, life cycle, distribution and dasmotrophy of chrysochromulina: a theory accounting for scales, haptonema, muciferous bodies and toxicity. Mar. Ecol. Prog. Ser. 57 (1), 11–21. doi: 10.3354/meps057011
Faure E., Not F., Benoiston A.-S., Labadie K., Bittner L., Ayata S.-D. (2019). Mixotrophic protists display contrasted biogeographies in the global ocean. ISME J. 13 (4), 1072–1083. doi: 10.1038/s41396-018-0340-5
Finkel Z. V., Beardall J., Flynn K. J., Quigg A., Rees T. A. V., Raven J. A. (2010). Phytoplankton in a changing world: cell size and elemental stoichiometry. J. Plankton Res. 32 (1), 119–137. doi: 10.1093/plankt/fbp098
Flynn K. J., Mitra A. (2009). Building the “perfect beast”: modelling mixotrophic plankton. J. Plankton Res. 31 (9), 965–992. doi: 10.1093/plankt/fbp044
Flynn K. J., Mitra A., Anestis K., Anschütz A. A., Calbet A., Ferreira G. D., et al. (2019). Mixotrophic protists and a new paradigm for marine ecology: where does plankton research go now? J. Plankton Res. 41 (4), 375–391. doi: 10.1093/plankt/fbz026
Flynn K. J., Skibinski D. O. F., Lindemann C. (2018). Effects of growth rate, cell size, motion, and elemental stoichiometry on nutrient transport kinetics. PloS Comput. Biol. 14 (4), e1006118. doi: 10.1371/journal.pcbi.1006118
Flynn K. J., Stoecker D. K., Mitra A., Raven J. A., Glibert P. M., Hansen P. J., et al. (2013). Misuse of the phytoplankton–zooplankton dichotomy: the need to assign organisms as mixotrophs within plankton functional types. J. Plankton Res. 35 (1), 3–11. doi: 10.1093/plankt/fbs062
Fragoso G. M., Poulton A. J., Yashayaev I. M., Head E. J. H., Purdie D. A. (2017). Spring phytoplankton communities of the Labrador Sea, (2005–2014): pigment signatures, photophysiology and elemental ratios. Biogeosciences 14 (5), 1235–1259. doi: 10.5194/bg-14-1235-2017
Fragoso G. M., Poulton A. J., Yashayaev I. M., Head E. J., Stinchcombe M., Purdie D. A. (2016). Biogeographical patterns and environmental controls of phytoplankton communities from contrasting hydrographical zones of the Labrador Sea. Prog. Oceanogr. 141, 212–226. doi: 10.1016/j.pocean.2015.12.007
Guillou L., Viprey M., Chambouvet A., Welsh R. M., Kirkham A. R., Massana R., et al. (2008). Widespread occurrence and genetic diversity of marine parasitoids belonging to syndiniales (Alveolata). Environ. Microbiol. 10 (12), 3349–3365. doi: 10.1111/j.1462-2920.2008.01731.x
Hansen P. J., Hjorth M. (2002). Growth and grazing responses of chrysochromulina ericina (Prymnesiophyceae): the role of irradiance, prey concentration and pH. Mar. Biol. 141 (5), 975–983. doi: 10.1007/s00227-002-0879-5
Head E., Harris L. (1996). Chlorophyll destruction by calanus spp. grazing on phytoplankton:kinetics, effects of ingestion rate and feeding history, and a mechanistic interpretation. Mar. Ecol. Prog. Ser. 135, 223–235. doi: 10.3354/meps135223
Head E., Harris L., Campbell R. (2000). Investigations on the ecology of calanus spp. in the Labrador sea. i. relationship between the phytoplankton bloom and reproduction and development of calanus finmarchicus in spring. Mar. Ecol. Prog. Ser. 193, 53–73. doi: 10.3354/meps193053
Hébert M.-P., Beisner B. E., Maranger R. (2017). Linking zooplankton communities to ecosystem functioning: toward an effect-trait framework. J. Plankton Res. 39 (1), 3–12. doi: 10.1093/plankt/fbw068
Holm-Hansen O., Lorenzen C. J., Holmes R. W., Strickland J. D. H. (1965). Fluorometric determination of chlorophyll. ICES J. Mar. Sci. 30 (1), 3–15. doi: 10.1093/icesjms/30.1.3
Irwin A. J., Finkel Z. V. (2017). Phytoplankton functional types: a trait perspective. BioRxiv: Ecol. doi: 10.1101/148312
Jamil T., Kruk C., ter Braak C. J. F. (2014). A unimodal species response model relating traits to environment with application to phytoplankton communities. PloS One 9 (5), e97583. doi: 10.1371/journal.pone.0097583
Kahru M., Brotas V., Manzano-Sarabia M., Mitchell B. G. (2011). Are phytoplankton blooms occurring earlier in the Arctic. Global Change Biol. 17 (4), 1733–1739. doi: 10.1111/j.1365-2486.2010.02312.x
Keller M. D., Bellows W. K., Guillard R. R. L. (1989). “Dimethyl sulfide production in marine phytoplankton,” in Biogenic sulfur in the environment (American Chemical Society), 167–182. doi: 10.1021/bk-1989-0393.ch011
Key T., McCarthy A., Campbell D. A., Six C., Roy S., Finkel Z. V. (2010). Cell size trade-offs govern light exploitation strategies in marine phytoplankton. Environ. Microbiol. 12 (1), 95–104. doi: 10.1111/j.1462-2920.2009.02046.x
Klais R., Norros V., Lehtinen S., Tamminen T., Olli K. (2017). Community assembly and drivers of phytoplankton functional structure. Funct. Ecol. 31 (3), 760–767. doi: 10.1111/1365-2435.12784
Koeller P., Fuentes-Yaco C., Platt T., Sathyendranath S., Richards A., Ouellet P., et al. (2009). Basin-scale coherence in phenology of shrimps and phytoplankton in the north Atlantic ocean. Science 324 (5928), 791–793. doi: 10.1126/science.1170987
Kostadinov T. S., Cabré A., Vedantham H., Marinov I., Bracher A., Brewin R. J. W., et al. (2017). Inter-comparison of phytoplankton functional type phenology metrics derived from ocean color algorithms and earth system models. Remote Sens. Environ. 190, 162–177. doi: 10.1016/j.rse.2016.11.014
Kudela R. M., Stumpf R. P., Petrov P. (2017). Acquisition and analysis of remote sensing imagery of harmful algal blooms. In:Anderson D. M., Boerlage S. F.E., Dixon M.B Harmful Algal Blooms (HABs) and Desalination: A Guide to Impacts, Monitoring and Management Paris, FranceIntergovernmental Oceanographic Commission of UNESCO, pp. 119–132. (IOC Manuals and Guides No. 78). doi: 10.25607/OBP-207
LaBrie R., Bélanger S., Benner R., Maranger R. (2020). Spatial abundance distribution of prokaryotes is associated with dissolved organic matter composition and ecosystem function. Limnol. Oceanogr. 66 (3), 575–587. doi: 10.1002/lno.11624
Legendre P., Gallagher E. D. (2001). Ecologically meaningful transformations for ordination of species data. Oecologia 129 (2), 271–280. doi: 10.1007/s004420100716
Legendre L., Le Fevre J. (1991). “From individual plankton cells to pelagic marine ecosystems and to global biogeochemical cycles,” in Particle analysis in oceanography (Springer), 261–300. doi: 10.1007/978-3-642-75121-9_11
Leles S. G., Bruggeman J., Polimene L., Blackford J., Flynn K. J., Mitra A. (2021). Differences in physiology explain succession of mixoplankton functional types and affect carbon fluxes in temperate seas. Prog. Oceanogr. 190, 102481. doi: 10.1016/j.pocean.2020.102481
Leles S. G., Mitra A., Flynn K. J., Stoecker D. K., Hansen P. J., Calbet A., et al. (2017). Oceanic protists with different forms of acquired phototrophy display contrasting biogeographies and abundance. Proc. R. Soc. B: Biol. Sci. 284 (1860), 20170664. doi: 10.1098/rspb.2017.0664
Leles S. G., Mitra A., Flynn K. J., Tillmann U., Stoecker D., Jeong H. J., et al. (2019). Sampling bias misrepresents the biogeographical significance of constitutive mixotrophs across global oceans. Global Ecol. Biogeogr. 28 (4), 418–428. doi: 10.1111/geb.12853
Leles S. G., Polimene L., Bruggeman J., Blackford J., Ciavatta S., Mitra A., et al. (2018). Modelling mixotrophic functional diversity and implications for ecosystem function. J. Plankton Res. 40 (6), 627–642. doi: 10.1093/plankt/fby044
Le Quéré C., Harrison S. P., Colin Prentice I., Buitenhuis E. T., Aumont O., Bopp L., et al. (2005). Ecosystem dynamics based on plankton functional types for global ocean biogeochemistry models. Global Change Biol. 11 (11), 2016–2040. doi: 10.1111/j.1365-2486.2005.01004.x
Lewandowska A. M., Striebel M., Feudel U., Hillebrand H., Sommer U. (2015). The importance of phytoplankton trait variability in spring bloom formation. ICES J. Mar. Sci. 72 (6), 1908–1915. doi: 10.1093/icesjms/fsv059
Lindemann C., St. John M. A. (2014). A seasonal diary of phytoplankton in the north Atlantic. Front. Mar. Sci. 1. doi: 10.3389/fmars.2014.00037
Litchman E., Klausmeier C. A., Schofield O. M., Falkowski P. G. (2007). The role of functional traits and trade-offs in structuring phytoplankton communities: scaling from cellular to ecosystem level. Ecol. Lett. 10 (12), 1170–1181. doi: 10.1111/j.1461-0248.2007.01117.x
Litchman E., Pinto P., Edwards K. F., Klausmeier C. A., Kremer C. T., Thomas M. K. (2015). Global biogeochemical impacts of phytoplankton: a trait-based perspective. J. Ecol. 103 (6), 1384–1396. doi: 10.1111/1365-2745.12438
Li T., Yang F., Xu J., Wu H., Mo J., Dai L., et al. (2020). Evaluating differences in growth, photosynthetic efficiency, and transcriptome of asterarcys sp. SCS-1881 under autotrophic, mixotrophic, and heterotrophic culturing conditions. Algal Res. 45, 101753. doi: 10.1016/j.algal.2019.101753
Lund J. W. G., Kipling C., Le Cren E. D. (1958). The inverted microscope method of estimating algal numbers and the statistical basis of estimations by counting. Hydrobiologia 11 (2), 143–170. doi: 10.1007/BF00007865
Maranger R., Bird D. F., Price N. M. (1998). Iron acquisition by photosynthetic marine phytoplankton from ingested bacteria. Nature 396 (6708), 248–251. doi: 10.1038/24352
Marchese C., de la Guardia L. C., Myers P. G., Bélanger S. (2019). Regional differences and inter-annual variability in the timing of surface phytoplankton blooms in the Labrador Sea. Ecol. Indic. 96, 81–90. doi: 10.1016/j.ecolind.2018.08.053
Marra J. F., Dickey T. D., Plueddemann A. J., Weller R. A., Kinkade C. S., Stramska M. (2015). Phytoplankton bloom phenomena in the north Atlantic ocean and Arabian Sea. ICES J. Mar. Sci. 72 (6), 2021–2028. doi: 10.1093/icesjms/fsu241
Mitra A., Flynn K. J., Burkholder J. M., Berge T., Calbet A., Raven J. A., et al. (2014). The role of mixotrophic protists in the biological carbon pump. Biogeosciences 11 (4), 995–1005. doi: 10.5194/bg-11-995-2014
Mitra A., Flynn K. J., Tillmann U., Raven J. A., Caron D., Stoecker D. K., et al. (2016). Defining planktonic protist functional groups on mechanisms for energy and nutrient acquisition: Incorporation of diverse mixotrophic strategies. Protist 167 (2), 106–120. doi: 10.1016/j.protis.2016.01.003
Moore J. K., Abbott M. R. (2000). Phytoplankton chlorophyll distributions and primary production in the southern ocean. J. Geophys. Res.: Oceans 105 (C12), 28709–28722. doi: 10.1029/1999JC000043
Mouw C. B., Hardman-Mountford N. J., Alvain S., Bracher A., Brewin R. J. W., Bricaud A., et al. (2017). A consumer's guide to satellite remote sensing of multiple phytoplankton groups in the global ocean. Front. Mar. Sci. 4. doi: 10.3389/fmars.2017.00041
Oksanen J., Blanchet F. G., Kindt R., Legendre P., O’hara R. B., Simpson G. L., et al. (2010) Vegan: community ecology package. r package version 1.17-4. Available at: http://CRAN.R-project.org/package=vegan.
Petchey O. L., Gaston K. J. (2006). Functional diversity: back to basics and looking forward. Ecol. Lett. 9 (6), 741–758. doi: 10.1111/j.1461-0248.2006.00924.x
Platt T., Fuentes-Yaco C., Frank K. T. (2003). Spring algal bloom and larval fish survival. Nature 423 (6938), 398–399. doi: 10.1038/423398b
R Core Team (2017). "R: A language and environment for statistical computing." (Vienna, Austria: R Foundation for Statistical Computing). Available at: https://www.R-project.org/.
Renfrew I. A., Moore G. W. K. (1999). An extreme cold-air outbreak over the Labrador Sea: Roll vortices and air–Sea interaction. Monthly Weather Rev. 127, 16. doi: 10.1175/1520-0493(1999)127<2379:AECAOO>2.0.CO;2
Renfrew I. A., Moore G. W. K., Guest P. S., Bumke K. (2002). A comparison of surface layer and surface turbulent flux observations over the Labrador Sea with ECMWF analyses and NCEP reanalyses. J. Phys. Oceanogr. 32 (2), 383–400. doi: 10.1175/1520-0485(2002)032<0383:ACOSLA>2.0.CO;2
Robinson A., Bouman H. A., Tilstone G. H., Sathyendranath S. (2018). Size class dependent relationships between temperature and phytoplankton photosynthesis-irradiance parameters in the Atlantic ocean. Front. Mar. Sci. 4. doi: 10.3389/fmars.2017.00435
Schoemann V., Becquevort S., Stefels J., Rousseau V., Lancelot C. (2005). Phaeocystis blooms in the global ocean and their controlling mechanisms: a review. J. Sea Res. 53 (1-2), 43–66. doi: 10.1016/j.seares.2004.01.008
Schön M. E., Zlatogursky V. V., Singh R. P., Poirier C., Wilken S., Mathur V., et al. (2021). Single cell genomics reveals plastid-lacking picozoa are close relatives of red algae. Nat. Commun. 12 (1), 6651. doi: 10.1038/s41467-021-26918-0
Sehein T. R., Gast R. J., Pachiadaki M., Guillou L., Edgcomb V. P. (2022). Parasitic infections by group II syndiniales target selected dinoflagellate host populations within diverse protist assemblages in a model coastal pond. Environ. Microbiol. 24 (4), 1818–1834. doi: 10.1111/1462-2920.15977
Selosse M.-A., Charpin M., Not F. (2017). Mixotrophy everywhere on land and in water: the grand écart hypothesis. Ecol. Lett. 20 (2), 246–263. doi: 10.1111/ele.12714
Smith D. C., Azam F. (1992). A simple, economical method for measuring bacterial protein synthesis rates in seawater using 3H-leucine. Mar. Microb. Food Webs 6 (2), 107–114.
Sodré E. D. O., Langlais-Bourassa A., Pollard A. I., Beisner B. E. (2020). Functional and taxonomic biogeography of phytoplankton and zooplankton communities in relation to environmental variation across the contiguous USA. J. Plankton Res. 42 (2), 141–157. doi: 10.1093/plankt/fbaa002
Stoecker D. K., Hansen P. J., Caron D. A., Mitra A. (2017). Mixotrophy in the marine plankton. Annu. Rev. Mar. Sci. 9 (1), 311–335. doi: 10.1146/annurev-marine-010816-060617
Stoecker D. K., Johnson M. D., de Vargas C., Not F. (2009). Acquired phototrophy in aquatic protists. Aquat. Microb. Ecol. 57 (3), 279–310. doi: 10.3354/ame01340
Sverdrup H. U. (1953). On conditions for the vernal blooming of phytoplankton. J. Cons. Int. Explor. Mer. 18 (3), 287–295. doi: 10.1093/icesjms/18.3.287
Tichy L., Chytry M. (2006). Statistical determination of diagnostic species for site groups of unequal size. J. Veg. Sci. 17 (6), 809–818. doi: 10.1111/j.1654-1103.2006.tb02504.x
Traboni C., Calbet A., Saiz E. (2021). Mixotrophy upgrades food quality for marine calanoid copepods. Limnol. Oceanogr. 66 (12), 4125–4139. doi: 10.1002/lno.11948
Uitz J., Stramski D., Reynolds R. A., Dubranna J. (2015). Assessing phytoplankton community composition from hyperspectral measurements of phytoplankton absorption coefficient and remote-sensing reflectance in open-ocean environments. Remote Sens. Environ. 171, 58–74. doi: 10.1016/j.rse.2015.09.027
Vallina S. M., Cermeno P., Dutkiewicz S., Loreau M., Montoya J. M. (2017). Phytoplankton functional diversity increases ecosystem productivity and stability. Ecol. Model. 361, 184–196. doi: 10.1016/j.ecolmodel.2017.06.020
Violle C., Navas M.-L., Vile D., Kazakou E., Fortunel C., Hummel I., et al. (2007). Let the concept of trait be functional! Oikos 116 (5), 882–892. doi: 10.1111/j.2007.0030-1299.15559.x
Ward B. A., Follows M. J. (2016). Marine mixotrophy increases trophic transfer efficiency, mean organism size, and vertical carbon flux. Proc. Natl. Acad. Sci. 113 (11), 2958–2963. doi: 10.1073/pnas.1517118113
Wentzky V. C., Tittel J., Jäger C. G., Bruggeman J., Rinke K. (2020). Seasonal succession of functional traits in phytoplankton communities and their interaction with trophic state. J. Ecol. 108 (4), 1649–1663. doi: 10.1111/1365-2745.13395
Wilken S., Choi C. J., Worden A. Z. (2020). Contrasting mixotrophic lifestyles reveal different ecological niches in two closely related marine protists. J. Phycol. 56 (1), 52–67. doi: 10.1111/jpy.12920
Yang B., Boss E. S., Haëntjens N., Long M. C., Behrenfeld M. J., Eveleth R., et al. (2020). Phytoplankton phenology in the north Atlantic: Insights from profiling float measurements. Front. Mar. Sci. 7. doi: 10.3389/fmars.2020.00139
Yashayaev I., Loder J. W. (2016). Recurrent replenishment of Labrador Sea water and associated decadal-scale variability. J. Geophys. Res.: Oceans 121 (11), 8095–8114. doi: 10.1002/2016JC012046
Yoch D. C. (2002). Dimethylsulfoniopropionate: its sources, role in the marine food web, and biological degradation to dimethylsulfide. Appl. Environ. Microbiol. 68 (12), 5804–5815. doi: 10.1128/AEM.68.12.5804-5815.2002
Keywords: protists, biogeography, phenology, functional diversity, days before peak chlorophyll, Labrador Sea
Citation: Péquin B, LaBrie R, St-Gelais NF and Maranger R (2022) Succession of protistan functional traits is influenced by bloom timing. Front. Mar. Sci. 9:916093. doi: 10.3389/fmars.2022.916093
Received: 08 April 2022; Accepted: 29 July 2022;
Published: 29 August 2022.
Edited by:
Sergio M. Vallina, Spanish Institute of Oceanography, SpainReviewed by:
Mitsuhide Sato, Nagasaki University, JapanChang Jae Choi, Monterey Bay Aquarium Research Institute (MBARI), United States
Copyright © 2022 Péquin, LaBrie, St-Gelais and Maranger. This is an open-access article distributed under the terms of the Creative Commons Attribution License (CC BY). The use, distribution or reproduction in other forums is permitted, provided the original author(s) and the copyright owner(s) are credited and that the original publication in this journal is cited, in accordance with accepted academic practice. No use, distribution or reproduction is permitted which does not comply with these terms.
*Correspondence: Richard LaBrie, cmljaGFyZC5sYWJyaWU5MEBnbWFpbC5jb20=
†Present address: Bérangère Péquin, Department of Natural Resource Sciences, McGill University, Montreal, QC, Canada
Richard LaBrie, Interdisciplinary Environmental Research Centre, University of Freiberg, Freiberg, Germany
‡These authors have contributed equally to this work and share first authorship
§ORCID: Bérangère Péquin, orcid.org/0000-0002-4992-1420
Richard LaBrie, orcid.org/0000-0003-1681-4888
Nicolas Fortin St-Gelais, orcid.org/0000-0002-6721-5191
Roxane Maranger, orcid.org/0000-0002-2509-4678