 Jingtai Li
 Dandan Yan
 Xiuying Yao
 Yao Liu
 Siying Xie
 Yufeng Sheng
 Zhaoqing Luan
- College of Biology and the Environment, Co-Innovation Center for Sustainable Forestry in Southern China, Nanjing Forestry University, Nanjing, China
Saltmarsh carbon storage contributes significantly to combating global climate change and achieving regional carbon neutrality. Yet saltmarsh carbon stocks have shown a trend of decline in recent years. Therefore, long-term monitoring and analyzing of saltmarshes for their carbon storage is imperative to better protect and manage this pool of carbon. This study investigated the spatiotemporal dynamics in saltmarsh carbon storage during 1987–2020, by using the Google Earth Engine (GEE) platform and applying the Integrated Valuation of Ecosystem Services and Tradeoffs (InVEST) model, and analyzed the driving factors of carbon storage in saltmarshes. The key results are as follows. Firstly, carbon density values in saltmarshes ranged more than 14-fold, from 7.24 to 104.99 Mg·hm-2, and the total carbon storage showed a decreasing trend. Secondly, reduced carbon storage was concentrated in inshore saltmarshes adjacent to reclamation sites, especially in Shandong, whereas augmented carbon storage characterized the offshore saltmarshes dominated by Spartina alterniflora, especially in Shanghai and Jiangsu. Overall, the carbon stocks of saltmarshes have fallen by 10.44 Tg; the decrease in carbon storage caused by Suaeda salsa, Phragmites australis, and mudflats exceeded the increase in carbon storage caused by Spartina alterniflora and Scirpus mariqueter. Further, we found that reclamation was the most dominant driver of carbon storage reductions, except for sea level rise and hurricane disturbances that can also negatively impact carbon storage, while greater carbon storage was closely related to the invasion of Spartina alterniflora. This study’s findings facilitate the development of a carbon storage management strategy for saltmarsh ecosystems to address global climate change and contribute to attaining carbon neutrality.
1 Introduction
As globally significant carbon sinks, coastal ecosystems play a pivotal role in tackling global climate change (Tang et al., 2018; Cai et al., 2021). Carbon sequestered in saltmarshes, seagrass beds, and mangrove forests of coastal ecosystem is known as “blue carbon” (Davidson et al., 2018). The carbon sequestration capacity of “blue carbon” ecosystems is about 10 times greater than that of terrestrial ecosystems (Mcleod et al., 2011). Although these ecosystems constitute only 0.2% of the marine area, the carbon stored in their sediment accounts for ca. 50% of the total carbon storage in ocean sediments (Duarte et al., 2013). As an important coastal wetland type, saltmarshes are of great intrinsic conservation value because of their high productivity and large carbon storage. There is now mounting recognition of the value and potential of saltmarsh carbon storage in addressing global climate change (Cai et al., 2021). Therefore, exploring, protecting, and promoting carbon storage and sequestration in saltmarsh ecosystems will be helpful to mitigate global warming and realizing regional carbon neutrality.
The saltmarsh ecosystems provide numerous ecosystem services, including biodiversity conservation and carbon sequestration (Zhao et al., 2018; Chen et al., 2020; Cai et al., 2021), where the vast area of mudflats and flora serve as massive blue carbon sink and promote the ecosystem-based coastal defense (Yim et al., 2018; Ma et al., 2019). The saltmarsh vegetations are reported to be one of the major contributors to blue carbon in the coastal wetlands because of their high productivity and carbon sequestration capacity per unit area (Bai et al., 2016; Zhang et al., 2017; Tang et al., 2018). Shen et al. (2021) recently determined that the aboveground carbon storage in a coastal marsh region to be ca. 1.1 Tg, based on field surveys and wetland distribution data in China. In the coastal United States, the total carbon storage of salt marsh and mangrove soils is estimated to be 0.87 Pg C (Nahlik and Fennessy, 2016). Similarly, mudflats without vegetation could function as critical carbon sink because of their high burial rate and vast area (Chen et al., 2020). In China, the lower limit of the carbon burial rate of coastal tidal flats is roughly 0.42 Tg C·a−1, which is significantly greater than that of mangroves and second only to salt marshes (Wang et al., 2021). Moreover, Chen et al. (2020) found that carbon storage values of 20.53 and 78.07 Tg for vegetated wetland and non-vegetated tidal flats along coastal China, respectively. To date, studies have focused on carbon storage of a single type (vegetation or mudflat) in a specific year, ignoring the long-term change of the overall carbon storage in the salt marsh ecosystem (Chen et al., 2020; Shen et al., 2021; Wang et al., 2021). In addition, the dynamics of carbon storage in different salt marsh types have not been well-characterized.
In the context of global climate change, studying carbon storage and sequestration in saltmarshes has become a crucial topic in global carbon cycle research (Mcleod et al., 2011; Tang et al., 2018; Zhang et al., 2018). As a tool for ecosystem assessment, the InVEST model is well suited for quantitatively analyzing carbon stocks, habitat quality, soil conservation, food production, and other similar ecosystem service functions, whose corresponding results can be depicted in thematic maps (He et al., 2016; Li et al., 2018a). Previous studies have proven that the InVEST model can estimate the carbon storage in a simple and reliable way (He et al., 2016; Zhao et al., 2019; Islam et al., 2022). However, research on carbon storage in China along its coast based on InVEST model has mostly focused on several hotspot areas (Ma et al., 2019; Cai et al., 2021), leaving the large-scale spatial and temporal changes of saltmarshes’ carbon storage across the China’s entire eastern coastal zone still unclear. Furthermore, it is imperative for InVEST model to obtain accurate temporal and spatial patterns of saltmarshes to quantitatively analyze dynamics of carbon storage (Adelisardou et al., 2021; Xu et al., 2021b). Supervised, unsupervised and object-based classification have been widely used to produce the land use and land cover (LULC) products (Wang et al., 2020b). These methods typically produce accurate LULC raster maps for small areas at a specific time, but are usually expensive, time-consuming, and difficult to scale up to larger areas (Wang et al., 2020b; Yan et al., 2021). In the last few years, the GEE, a free web-based cloud computation platform with powerful computational power and big data-processing algorithms, has begun to provide time-series remote sensing imagery and other relevant data on a global scale (Zhang et al., 2019). Many scholars have already used GEE to carry out large-scale wetland mapping in coastal China with good results so far (Zhang et al., 2019; Gu et al., 2021; Hu et al., 2021). Thus, Random Forest (RF) algorithm via GEE was used in this study to provide an accurate land cover raster for input into the InVEST model.
In order to address the abovementioned issues and concerns, here we integrate GEE and InVEST model to quantify the spatiotemporal dynamics of carbon storage in different saltmarshes types for 1987–2020 across China’s entire eastern coastal zone. The specific objectives of our study are (1) to investigate the long-term variability of different saltmarshes types on a large spatiotemporal scale through GEE coding; (2) to simulate and analyze the spatial and temporal dynamics of carbon storage in saltmarshes, using the InVEST model; and (3) to explore the factors driving carbon stock changes. Moreover, the findings of this study will provide a timely reference for enhancing conservation and management strategies of coastal ecosystems’ carbon storage and contribute to achieving carbon neutrality targets.
2 Materials and Methods
2.1 Study Area
China’s coastline runs at least 32,000 km, including 14,000 km of island coastline, starting from the mouth of the Yalu River (39.83°N, 121.16°E) and extending to that of the Beilun River (21.53°N, 108.05°E) (Gu et al., 2021; Hu et al., 2021). These coastal wetlands are geographically divided by Hangzhou Bay into two types: rocky shores in the south and muddy flats in the north. The study area covers the entire saltmarshes north of Hangzhou Bay from 29.42°N to 39.83°N, this lying within subtropical and temperate monsoon climate zones. Saltmarshes are usually divided into low, middle, and high marshes (Gu et al., 2021). Extensive mudflats are distributed around the low marshes. The inner side of middle and high saltmarshes is adjacent to reclamation areas (such as aquaculture pond, farmland, etc.). In high marshes, Phragmites australis (P. australis) is the dominant species; however, Suaeda salsa (S. salsa) dominates the middle marshes and Scirpus mariqueter (S. mariqueter) is dominant in low marshes; Spartina alterniflora (S. alterniflora) is invading high marshes from mudflat (Figure 1).
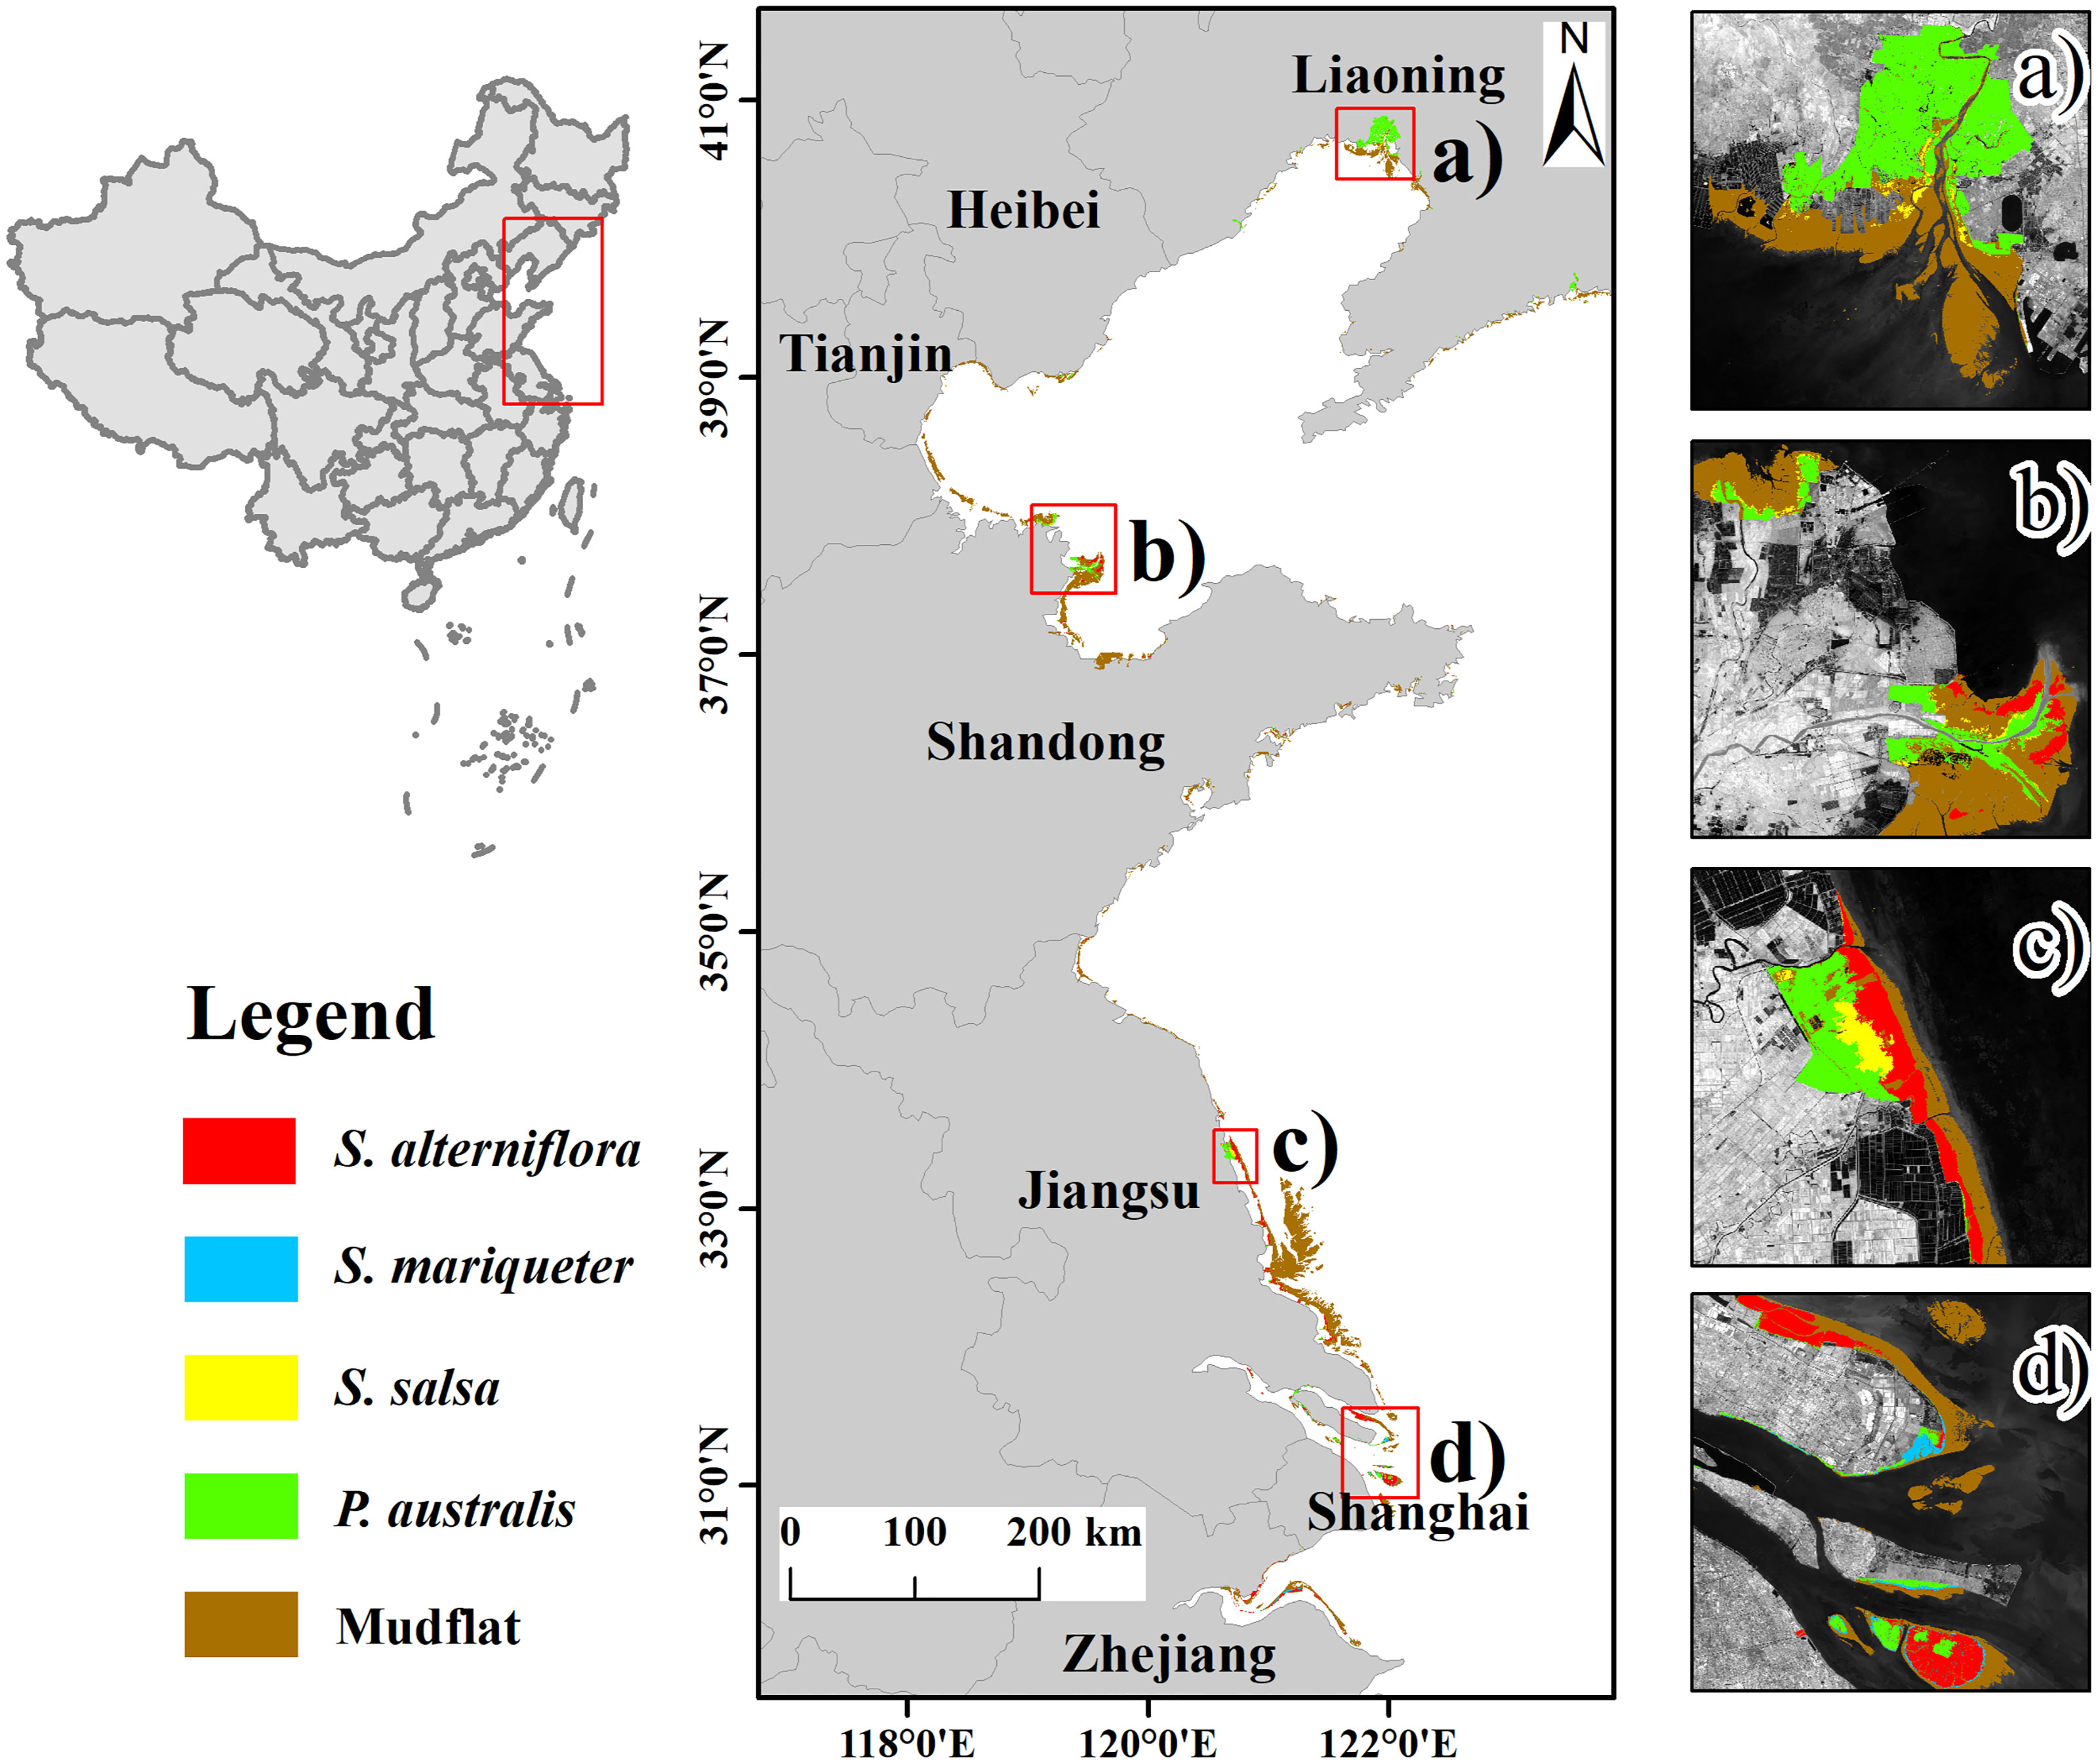
Figure 1 Geographic position and types of saltmarshes in 2020. (a–d) represent the Liao River Estuary, Yellow River Delta, Yancheng National Nature Reserve, and Yangtze River Estuary, respectively.
2.2 Data Acquisition and Preprocessing
Over the past few decades, NASA (National Aeronautics and Space Administration) has provided a continuous series of Landsat images. These images are contained in the public data archive of GEE (https://code.earthengine.google.com/) and can be used to detect long-term land cover change in saltmarshes (Zhang et al., 2019; Wang et al., 2020a). Here, we selected Landsat 5, 7, and 8 image collections from the Landsat surface reflectance Tier 1 products, spanning 1987 to 2020. Despite selecting only those images with low cloud cover (< 20%) to obtain high quality data, even the best available data in certain areas still had a small amount of cloud present, which affected the surface reflectance of different saltmarshes types (Gu et al., 2021). Therefore, to avoid errors, pixel quality attributes (pixel_qa) generated from the CFMASK algorithm were used to exclude pixels identified as clouds or cloud shadows from the image stack. Finally, we calculated the Normalized Difference Vegetation Index (NDVI), Modified Normalized Differences Water Index (mNDWI), and Land Surface Water Index (LSWI) for each image and added both to each image collection. These three indices are defined in Eqs. (1), (2), and (3):
where ρnir, ρred, ρgreen, and ρswir are respectively the near-infrared, red, green, and shortwave infrared bands of Landsat imagery.
Accurate and adequate sample data are important for conducting a supervised large-scale LULC classification (Yang and Huang, 2021). Zhang et al. (2019) found that the mudflat area is easily distinguished from vegetation in high-resolution imagery from Google Earth. Accordingly, we selected mudflat and vegetation samples from Google Earth’s repository of high-resolution images. Published research indicates that a visual interpretation method can yield accurate and high-quality samples (Hu et al., 2021; Yang and Huang, 2021). Hence, we used a visual interpretation method to classify vegetation sample sites into four types (S. salsa, P. australis, S. alterniflora, S. mariqueter) based on published in situ studies of saltmarshes. Overall, ca. 11,000 sampled points representing five saltmarsh categories were selected (Supplementary Figure 1); of these samples, 70% were used for model training and the remaining 30% for assessing accuracy.
For each saltmarsh type, its carbon pools data (Table 1) was expressed as carbon storage per unit area and obtained from previous studies (based data availability). All carbon storage per unit area data used in our paper are field measurements of saltmarshes in China’s eastern coastal zone from those previous studies. References for this data can be found in provided Supplementary Table 1.
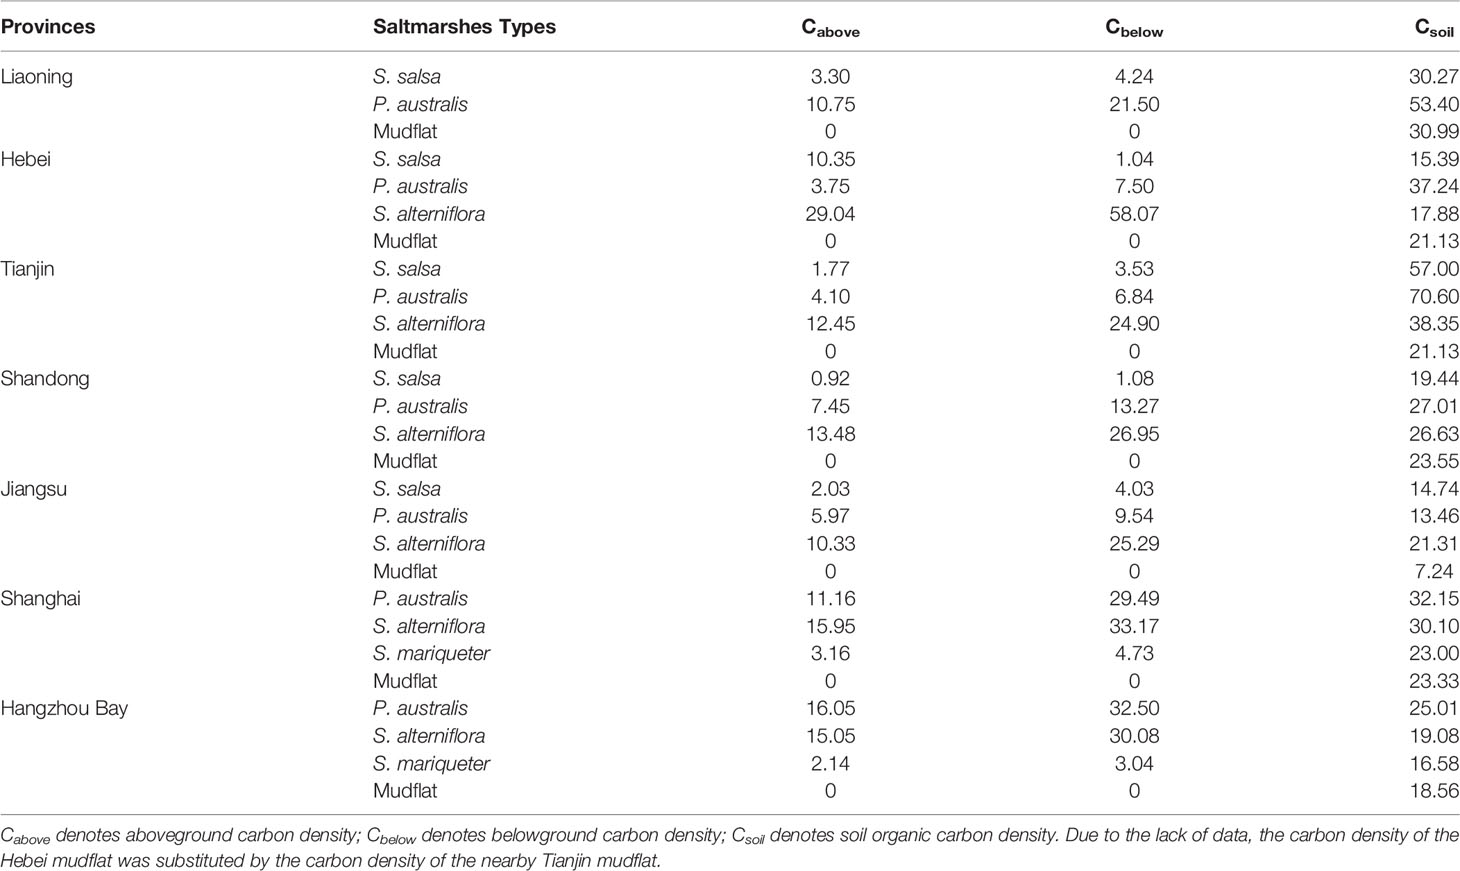
Table 1 Carbon pools of the saltmarshes used in the InVEST model (Mg·hm-2).
2.3 Saltmarsh Classification
2.3.1 Compositing the Images of Maximal Saltmarsh Extent
Tidal inundation has a significant impact on a coastal wetlands’ classification. To not miss any fully exposed saltmarshes, we used the maximum spectral index (MSIC) to composite the image. According to the pixel with the maximum value of the selected spectral index in the time-series collection of Landsat images, MSIC sets each pixel of the composite image. Thus, each pixel represents an extreme tidal condition at its own location (Jia et al., 2021). In this way, MSIC composite images are not only representative of the saltmarshes in general for a given year but they also bypass the effects of tidal inundation on saltmarshes. Next, to obtain each the maximal extent of the saltmarshes, i.e., the lowest tide condition, NDVI-based MSIC images were produced. Compared with other composite images (e.g., median composite image), the NDVI-MSIC can effectively separate saltmarshes from marine water bodies to uncover fully-exposed saltmarshes (Jia et al., 2021). To visualize the advantages of using NDVI-MSIC images over a median composite image, we examined Jiaozhou Bay as a case study area (Figure 2).
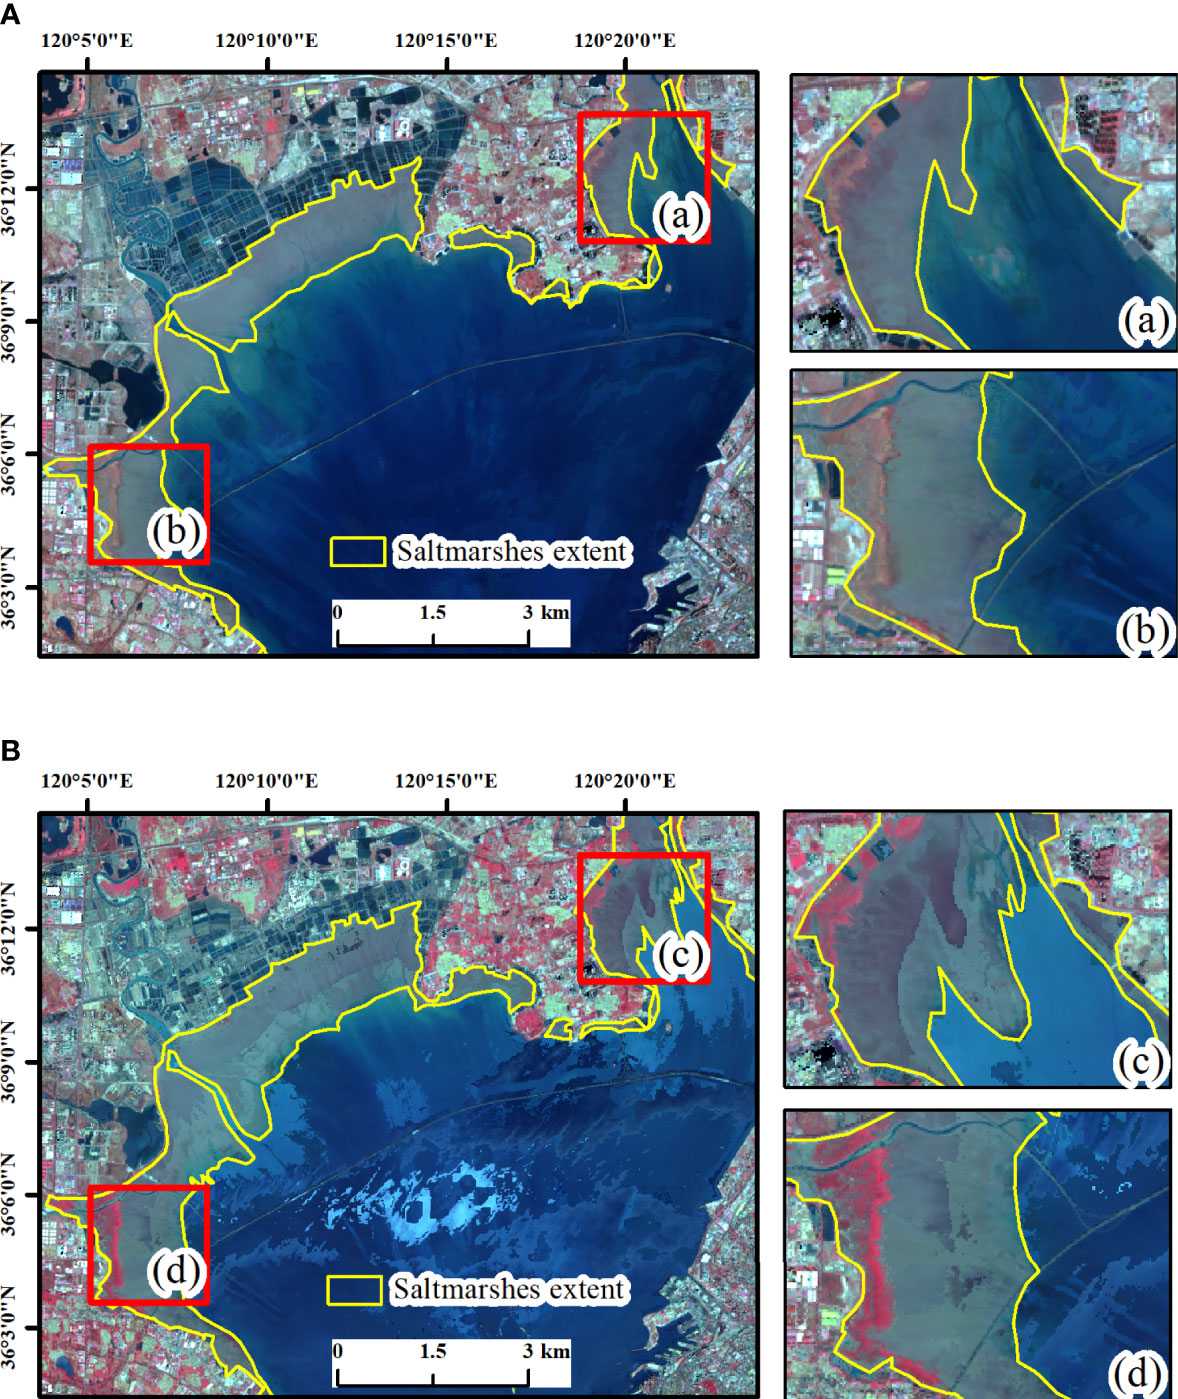
Figure 2 Landsat composite images acquired in 2020: (A) Median composite image; (B) NDVI-MSIC image. (a, b) zoomed-in areas showing the local details of the median composite image; (c, d) zoomed-in areas showing the local details of the NDVI-MSIC image.
2.3.2 RF Machine Learning Algorithm via GEE
The RF algorithm outperforms other algorithms when using long time-series of remotely sensed data for LULC mapping (Xu et al., 2021a; Yan et al., 2021). To reduce the possibility of overfitting, sub-samples are randomly selected by the RF algorithm from input variables and, in addition, the optimal features are randomly selected through a voting process to create splits in the nodes of the generated tree (Zhang and Zhang, 2020). Using the RF algorithm leads to greater accuracy and efficiency, even under adverse conditions of noise interference. For these reasons, we applied the RF algorithm to NDVI-MSIC images to distinguish between different salt marsh types. Approximately 70% of samples were randomly selected on the GEE platform for use as a dataset to train the RF algorithm (Section 2.2). The input data for the RF algorithm consisted of the original spectral bands and three calculated normalized indices.
2.3.3 Post-Classification Processing and Accuracy Assessment
Morphological processing and filtering are effective methods of post-classification processing that contribute to a highly accurate classification (Hu et al., 2021). In our study, the majority filter and elimination tools in ArcGIS 10.3 were used to post-process the RF classification results. Any obvious misclassified results were corrected by their manual modification.
Accuracy assessment is crucial for ensuring the robust classification of remote sensing images. To that end, we used a validation dataset, consisting of the 30% remaining sample points recorded in Section 2.2, to construct confusion matrices. We then derive including overall accuracy and kappa coefficient parameters to evaluate the accuracy of the mapped saltmarshes. These results revealed an overall accuracy > 90% and a mean kappa coefficient of 0.89 (Table 2). The confusion matrices indicated that the map of saltmarshes was highly consistent with validation data.
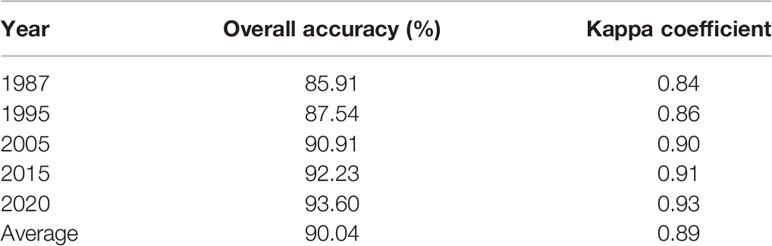
Table 2 Accuracy assessment of the saltmarsh classification results.
2.4 Carbon Storage and Sequestration
The Carbon Storage and Sequestration module of the InVEST model uses LULC-type maps, along with four basic carbon pools (aboveground, belowground, soil, dead litter), to estimate the carbon storage in a landscape unit (i.e., amount of carbon currently stored), as well as the carbon sequestration (i.e., amount of carbon it has sequestered over time) (Zhao et al., 2019; Adelisardou et al., 2021; Cai et al., 2021). Because of unavailable data, the total carbon storage calculated in this study omitted carbon storage by dead organic matter. We used these equations to estimate the carbon storage and sequestration:
where Ck is the carbon storage of a saltmarsh of type k (Mg), Ck_above is aboveground carbon density of a saltmarsh of type k (Mg·hm-2), Ck_below is belowground carbon density of a saltmarsh of type k (Mg·hm-2), Ck_soil is soil carbon density of a saltmarsh of type k (Mg·hm-2), and Ak is the area of a saltmarsh of type k (ha); C is the total carbon storage of the saltmarsh ecosystem (Mg); S is the carbon sequestration (Mg), Ct2 and Ct1 represent the carbon storage in years t2 and t1, respectively (t2 > t1).
3 Results
3.1 Changes to Saltmarshes Between 1987 and 2020
In total, 6605.04–12104.77 km2 of saltmarshes occurred along China’s eastern coastal zone in 1987 to 2020, which included the S. salsa, P. australis, S. alterniflora, S. mariqueter types and mudflats (Supplementary Figure 2 and Table 3). For S. salsa and P. australis saltmarshes, their coverage decreased continuously from 1987 through 2020, losing 189.31 and 1186.39 km2, respectively. Conversely, the S. alterniflora saltmarsh has continued to expand, increasing from 17.62 km2 to 523.95 km2. Deviating from those trends, S. mariqueter saltmarsh initially decreased in area but then increased over time. The area of mudflats generally featured a downward trend, with a reduction in area of 4265.01 km2. The proportion corresponding to mudflats ranged from 78.85% to 82.84%, comprising the largest saltmarsh type in the study area. The second largest saltmarsh type was P. australis, covering 11.82%–16.62% of the total area. This was followed by S. alterniflora, S. salsa and S. mariqueter, representing 0.15%–7.50%, 1.06%–2.18%, and 0.33%–0.77% of the total area, respectively.
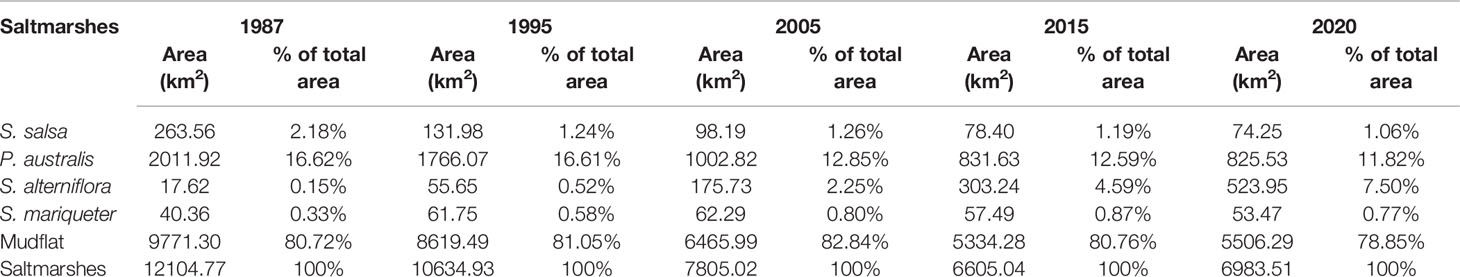
Table 3 Statistics of the saltmarshes from 1987 to 2020.
3.2 Total Carbon Storage and Sequestration Between 1987 and 2020
The total carbon density maps were created by quantifying carbon storage per unit area of saltmarshes, as shown in Figure 3. Evidently, the total carbon density in China’s eastern coastal zone changed significantly during the period of 1987–2020. The value of carbon density in saltmarshes ranged from 7.24 to 104.99 Mg·hm-2. High carbon density areas were mainly located in the vegetation-covered areas, and low density areas mainly occurred in mudflats. After 1995, however, the area of high carbon density continuously expanded. Large areas characterized by high carbon density were found in offshore saltmarshes that had been mudflats before 1995. This was especially the case for the saltmarsh wetlands of Jiangsu. By 2020, these areas covered nearly the entire eastern coastal zone area.
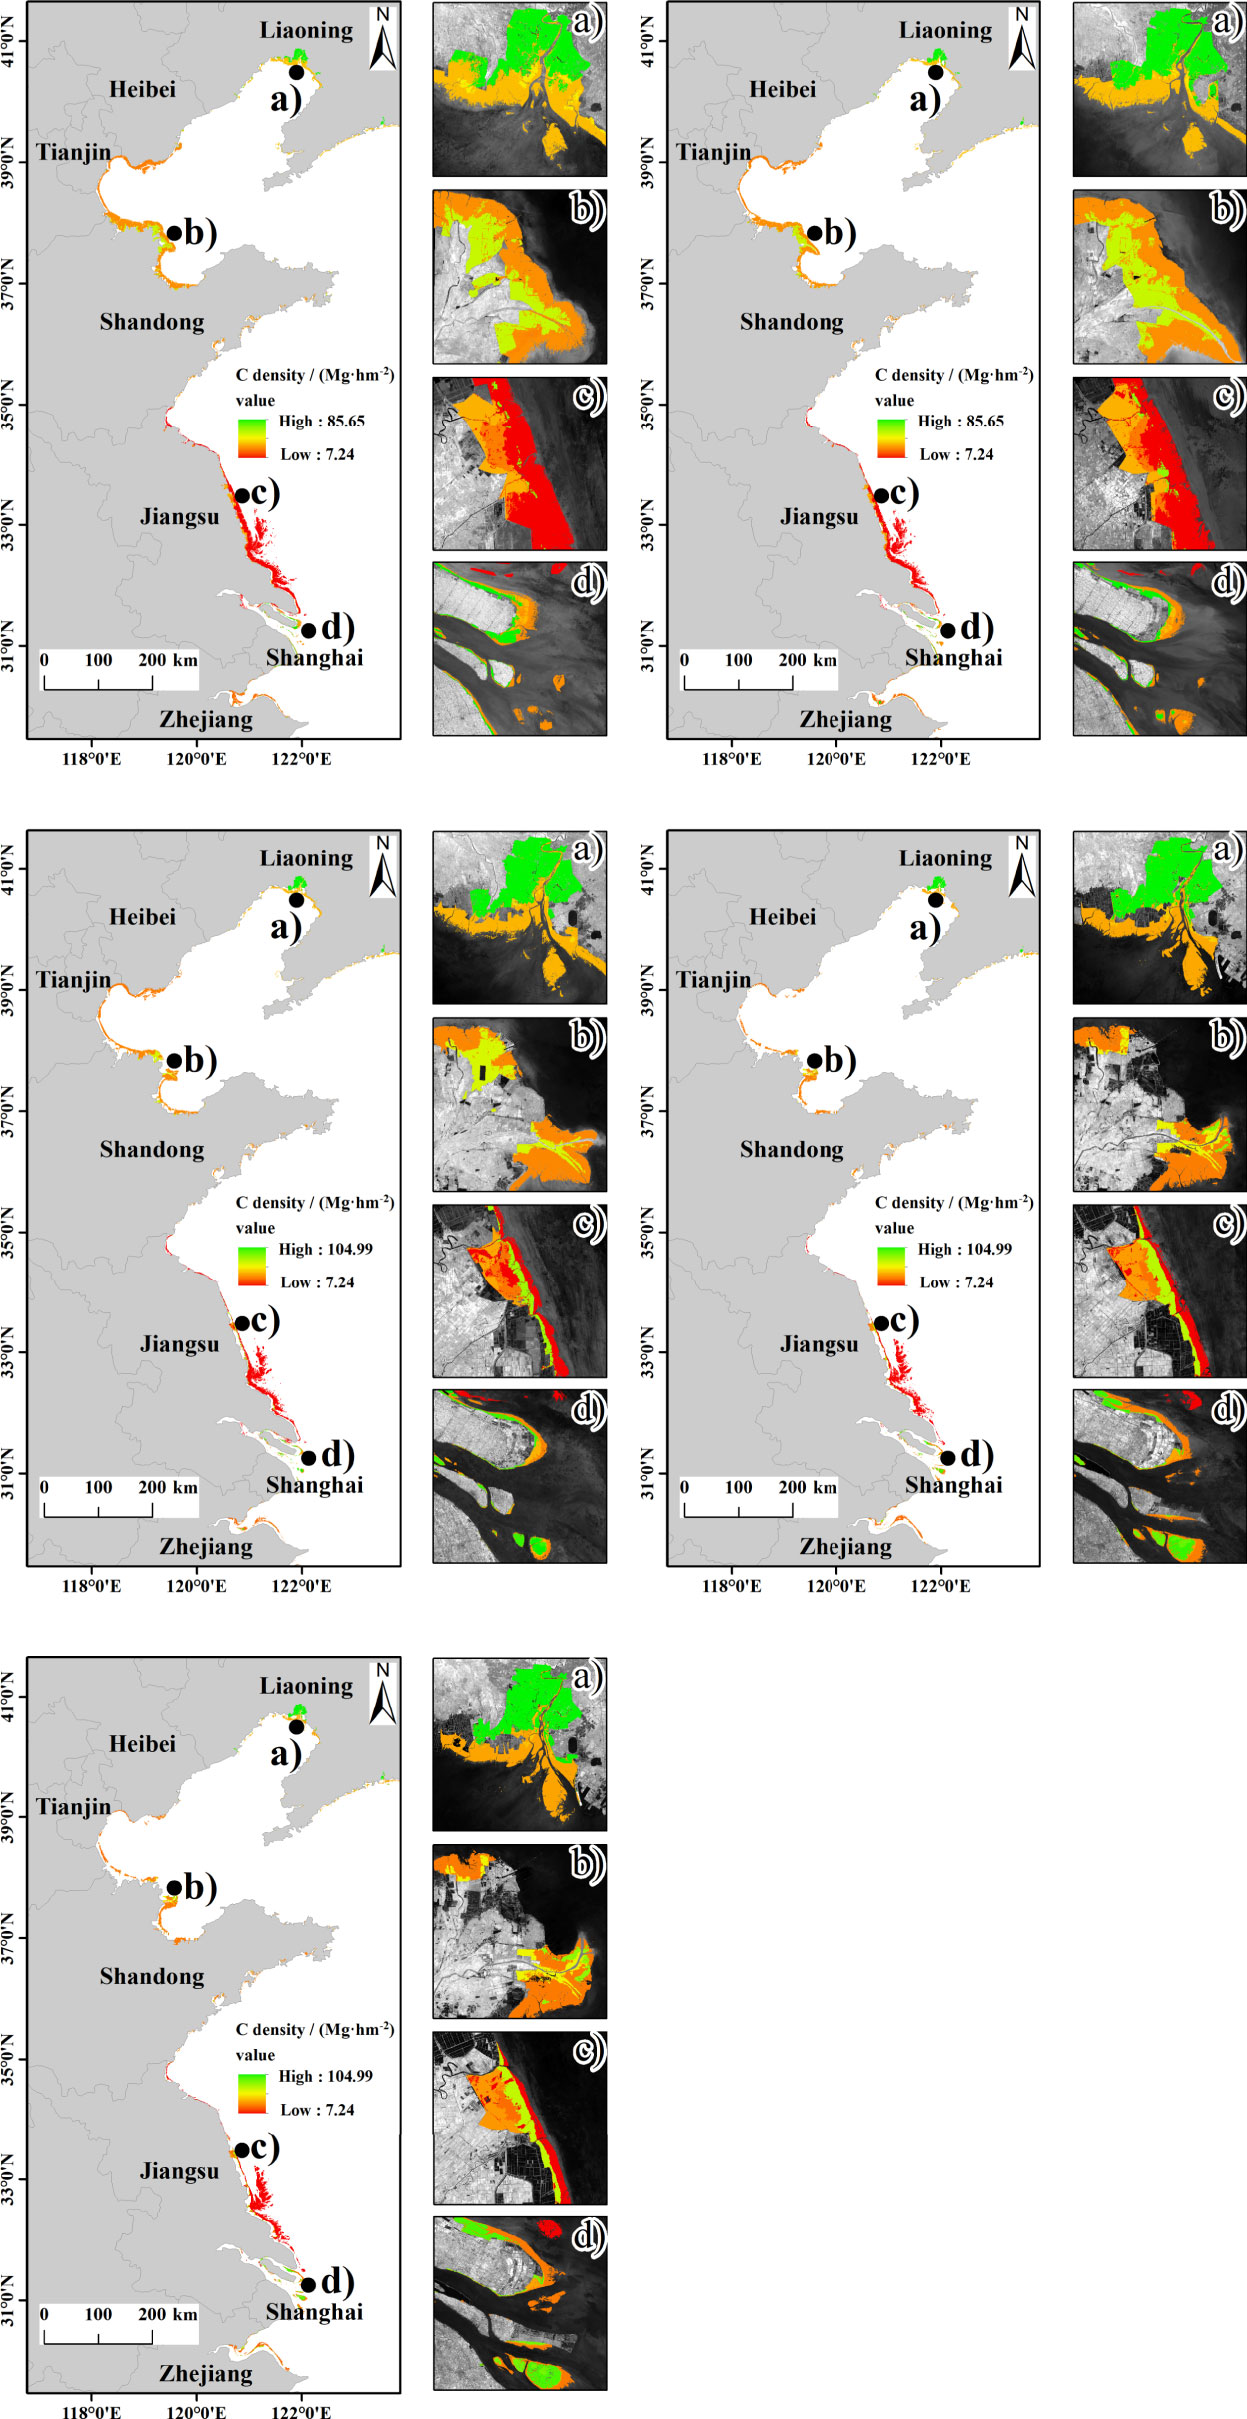
Figure 3 Maps of saltmarshes total carbon density in (A) 1987, (B) 1995, (C) 2005, (D) 2015, and (E) 2020; (a-d) represent the Liao River Estuary, Yellow River Delta, Yancheng National Nature Reserve, and Yangtze River Estuary, respectively.
The total amount of carbon storage in the whole study area decreased from 29.30 Tg to 18.85 Tg during 1987–2020 (Figure 4), though the total carbon storage showed an increasing trend from 2015 to 2020. The carbon storage changes in various coastal provinces are not consistent, as depicted in Figure 4. In the provinces to the north of Jiangsu, carbon storage showed a downward trend. Only in Shanghai and Zhejiang, the carbon storage maintained an increasing trend in the past 30 years.
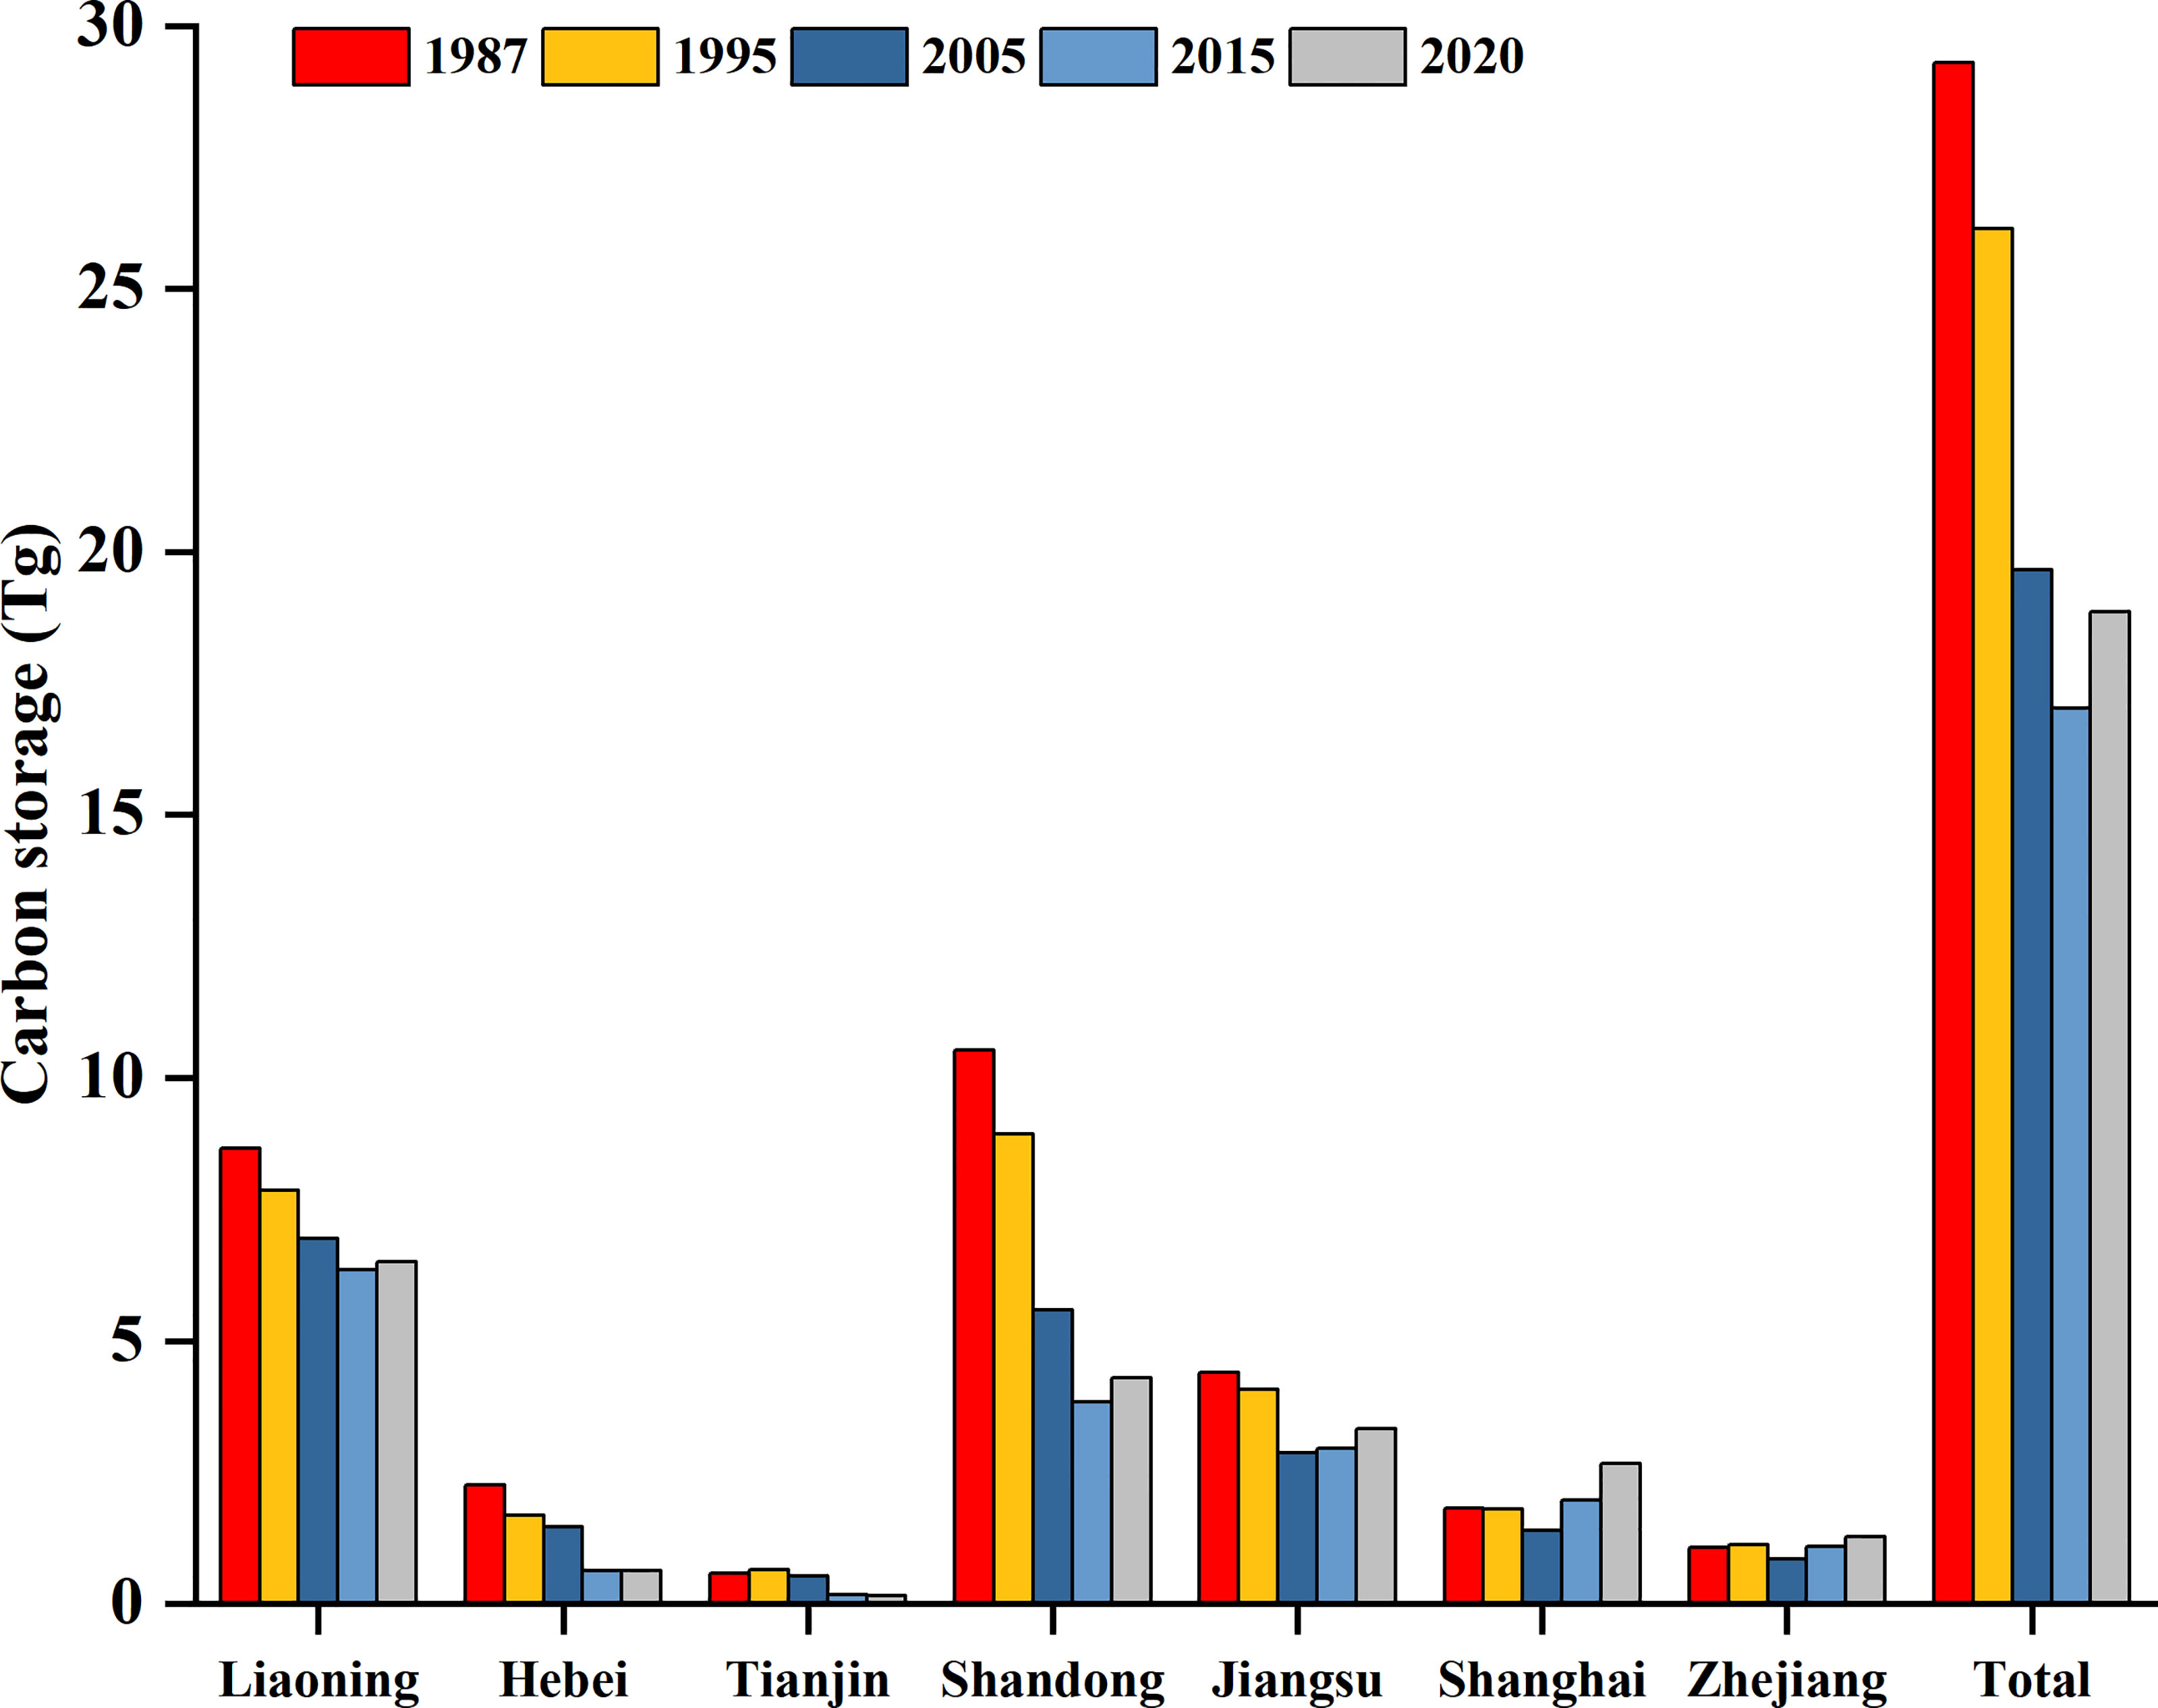
Figure 4 Total carbon storage of saltmarshes in each province and the whole study area from 1987 to 2020.
In addition to carbon storage, we calculated carbon sequestration in the saltmarshes (Figures 5, 6). Raster maps (Figure 5) showed differential carbon density patterns between 1987 and 2020. In these maps the negative values indicate lost carbon and positive values denote carbon gain (in Mg per hectare). The results showed that carbon density was constantly altered within saltmarshes where carbon density underwent decreases in most areas. The inshore saltmarshes adjacent to reclamation sites were the main area of carbon density loss, reaching a maximum of −85.65 Mg·hm-2. It is well known that the S. alterniflora invasion not only expands the extent of saltmarsh wetlands but also enhances their carbon sequestration capacity (Davidson et al., 2018). Hence, the maximum carbon density of S. alterniflora saltmarsh rose from 64.21 to 104.99 Mg·hm-2; these carbon density gain areas were located chiefly in the offshore saltmarshes where dominance by S. alterniflora is less affected by human activities (Supplementary Figure 3 and Figure 5).
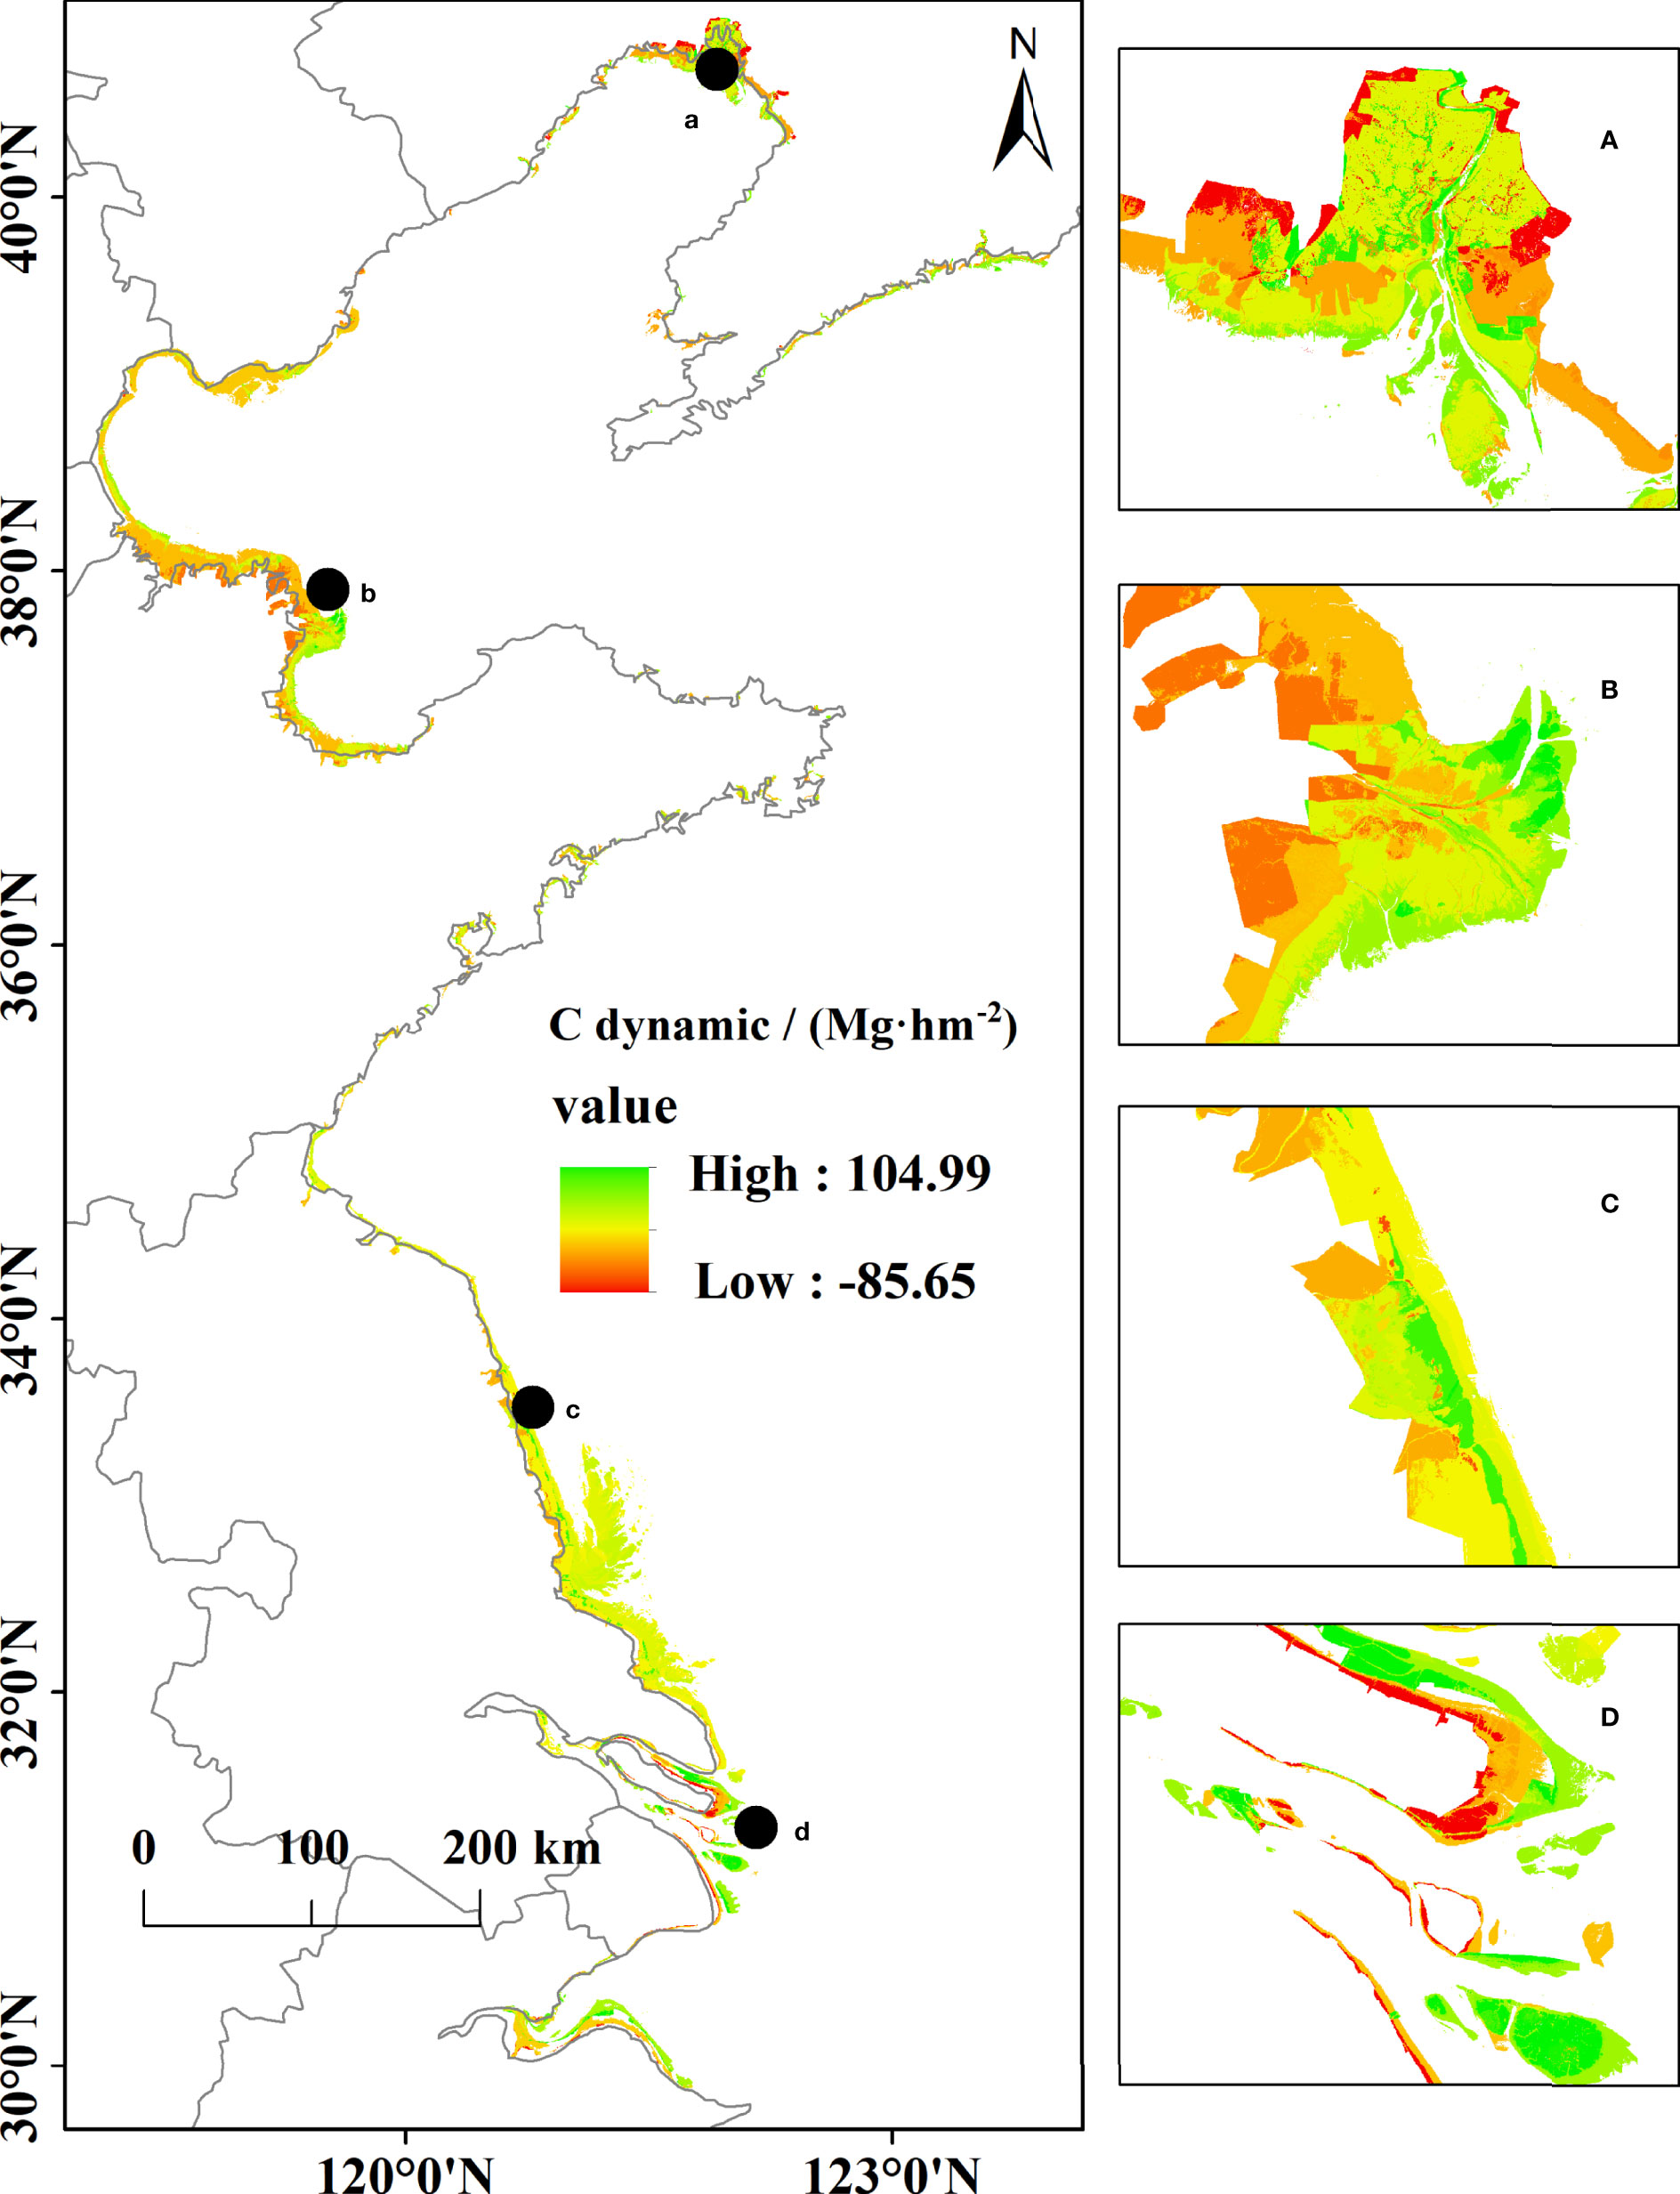
Figure 5 Map of total carbon density dynamics during 1987 to 2020 in the saltmarshes; (a–d) represent the Liao River Estuary, Yellow River Delta, Yancheng National Nature Reserve, and Yangtze River Estuary, respectively.
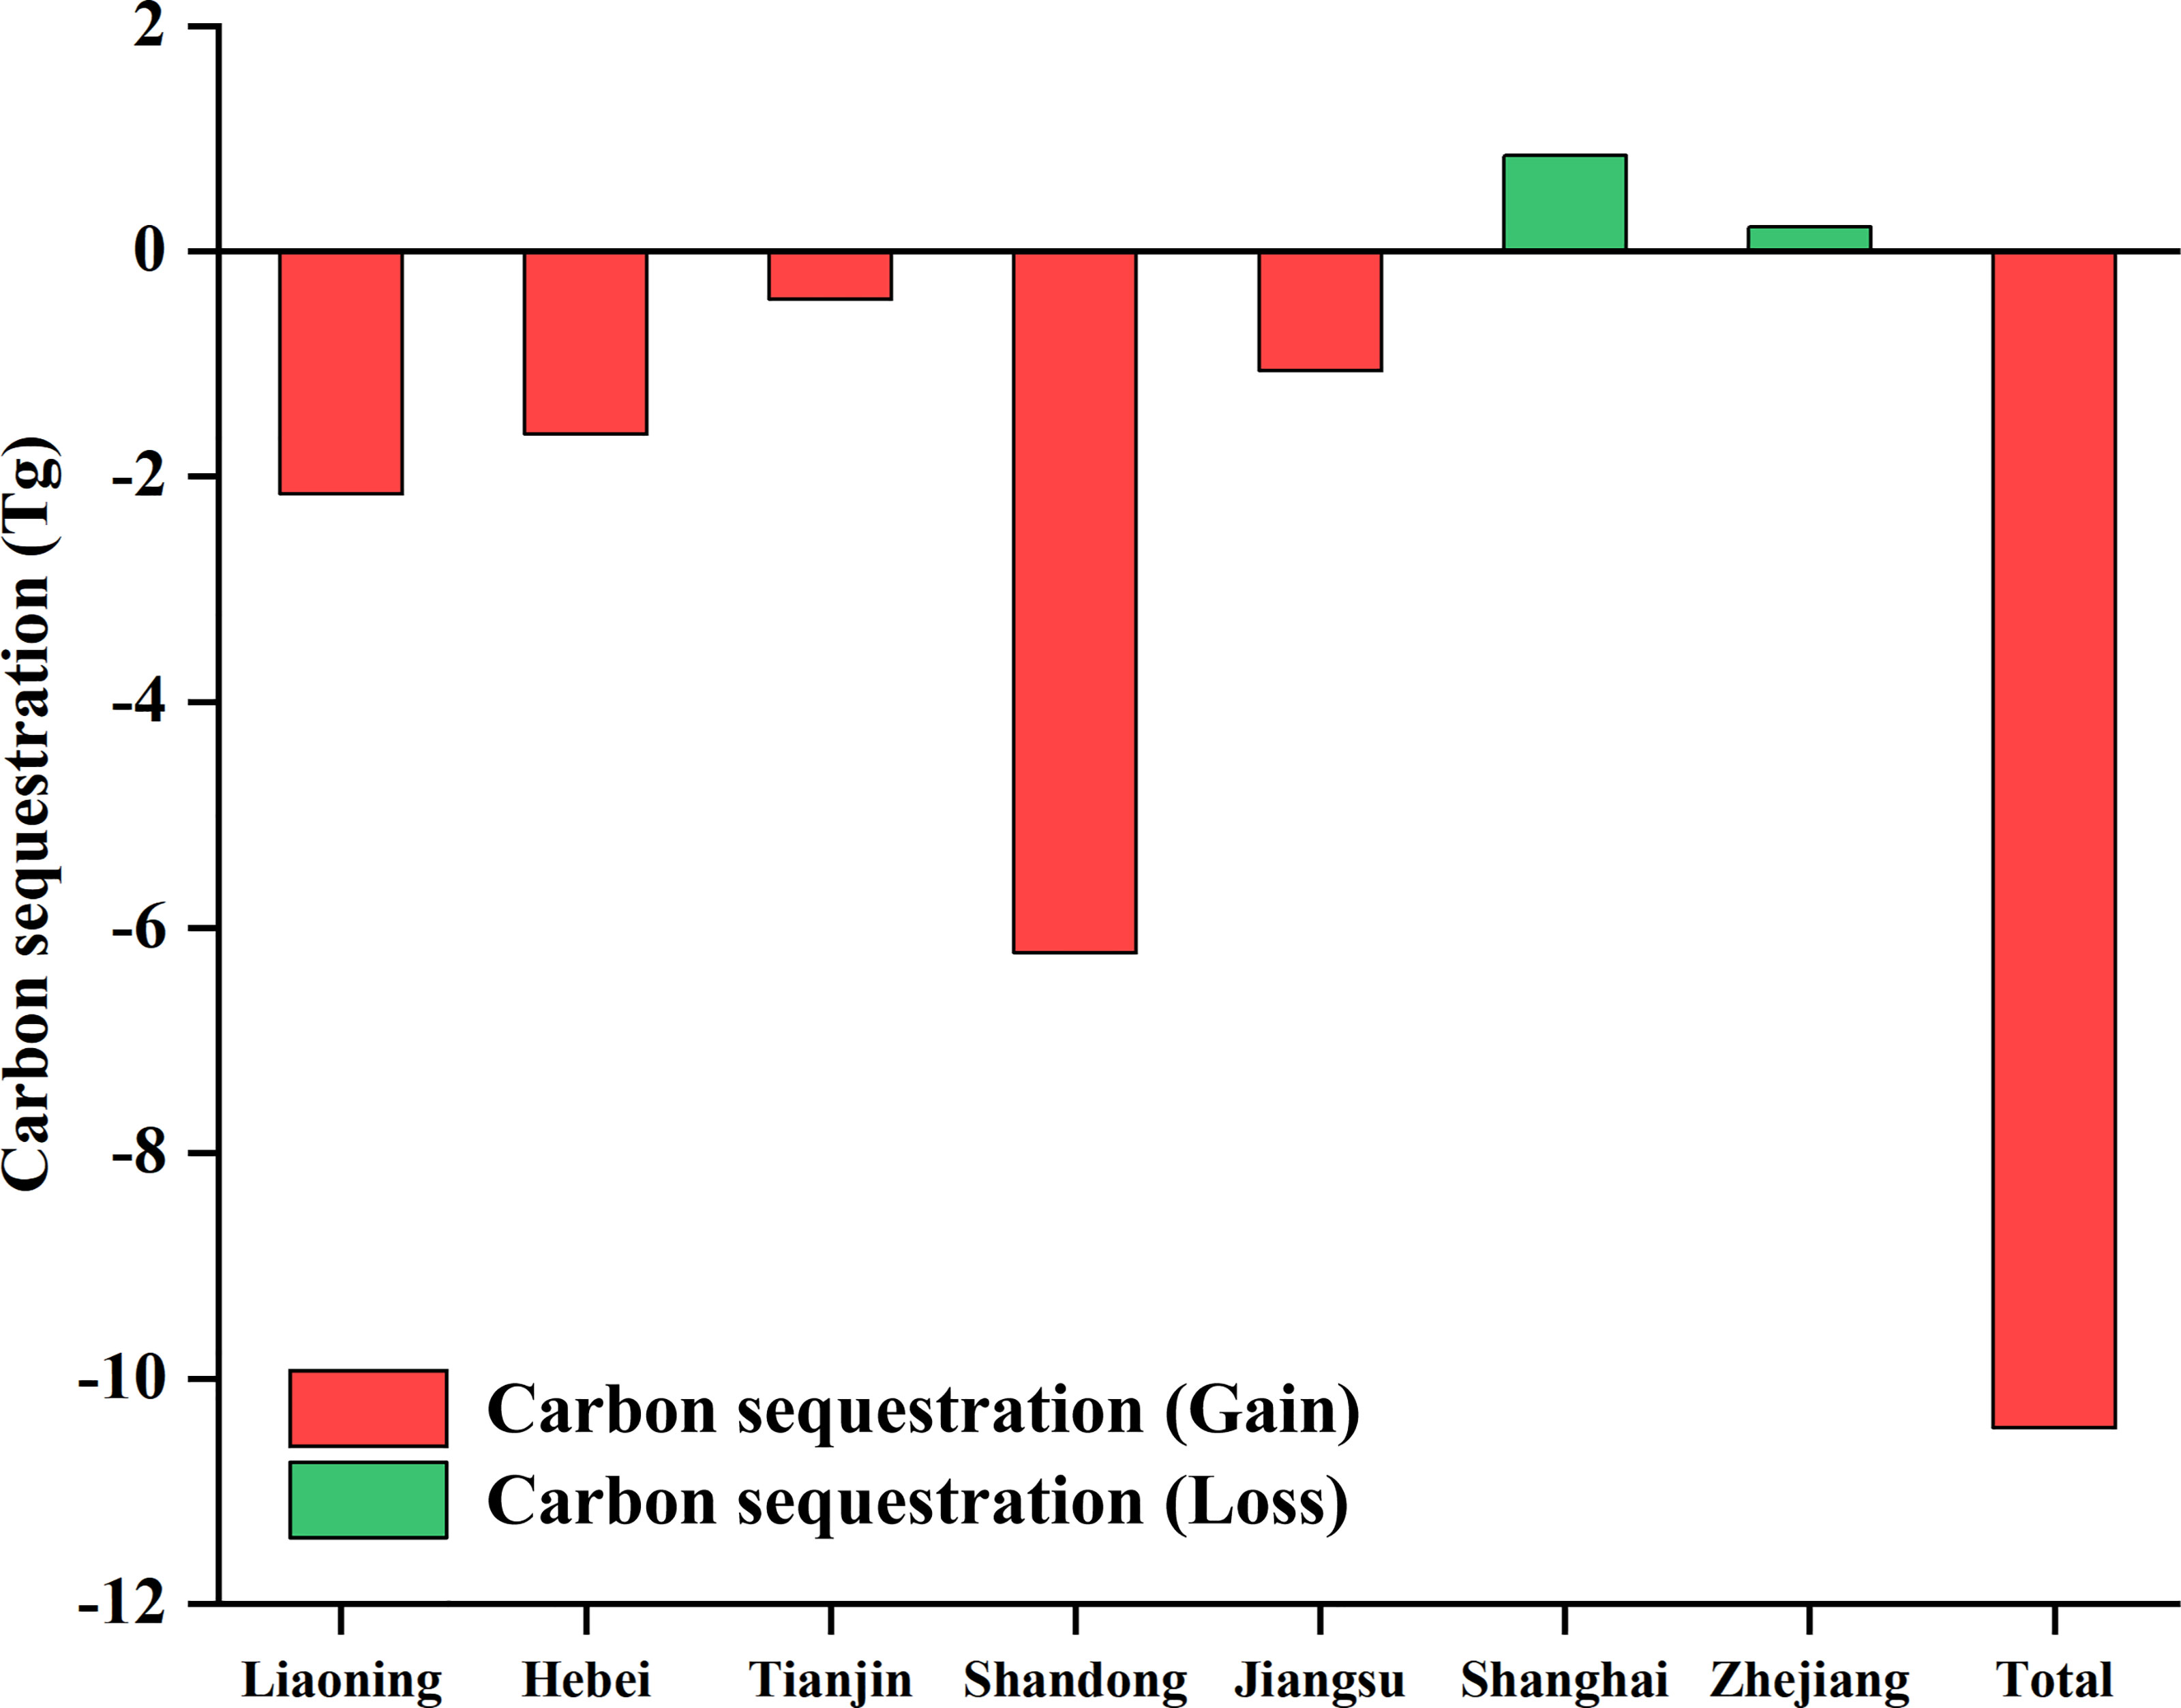
Figure 6 Total carbon sequestration of each province and the whole study area from 1987 to 2020.
The Figure 6 showed amount of carbon it has sequestered between 1987 and 2020. The red indicates carbon loss and green denotes carbon gain. Over the period 1987–2020 period, total carbon storage in the whole study area decreased by 10.44 Tg, with a mean reduction of 0.32 Tg per year. The most significant loss of carbon storage was Shandong, this was followed by Liaoning, Hebei, Jiangsu, and Tianjin, the loss of carbon storage was 6.22, 2.15, 1.62, 1.06, and 0.43 Tg respectively. And the gain of carbon storage in Shanghai and Zhejiang was 0.84 and 0.21 Tg respectively.
3.3 Carbon Storage and Sequestration in Various Saltmarshes Between 1987 and 2020
The spatial distribution maps of carbon density for each saltmarsh type (Supplementary Figure 3) revealed the carbon density of mudflats and P. australis were higher in the southern and northern parts than the central zone. Carbon density of S. salsa and S. mariqueter were higher in the northern than the southern areas. Besides that, S. alterniflora’s carbon density exhibited pronounced spatial variation.
In order to further analyze the spatiotemporal dynamics of carbon storage, we compared and analyzed the storage and sequestration of five saltmarsh in each province and the whole study area (Figures 7, 8). The results show that the carbon storage of S. salsa, P. australis and mudflat declined continuously in the whole study area, with carbon storage loss of 0.48, 5.54 and 7.82 Tg respectively. Meanwhile, the carbon storage by S. alterniflora and S. mariqueter continually increased in the whole study area, with carbon storage gain of 3.37 and 0.02 Tg respectively. The increase in saltmarshes carbon storage is substantially less than the loss. Specifically, the carbon stocks of P. australis and mudflat decreased in almost all provinces, with Shandong Province showing the most significant loss of 2.98 and 3.52Tg respectively. In addition, the carbon stocks of S. alterniflora increased in practically all provinces, with the largest increases in Jiangsu and Shanghai provinces, at 1.11 and 1.22 Tg respectively. In general, the carbon storage loss of S. salsa and P. australis saltmarshes and the mudflats was together greater than the rise in carbon storage facilitated by S. alterniflora.
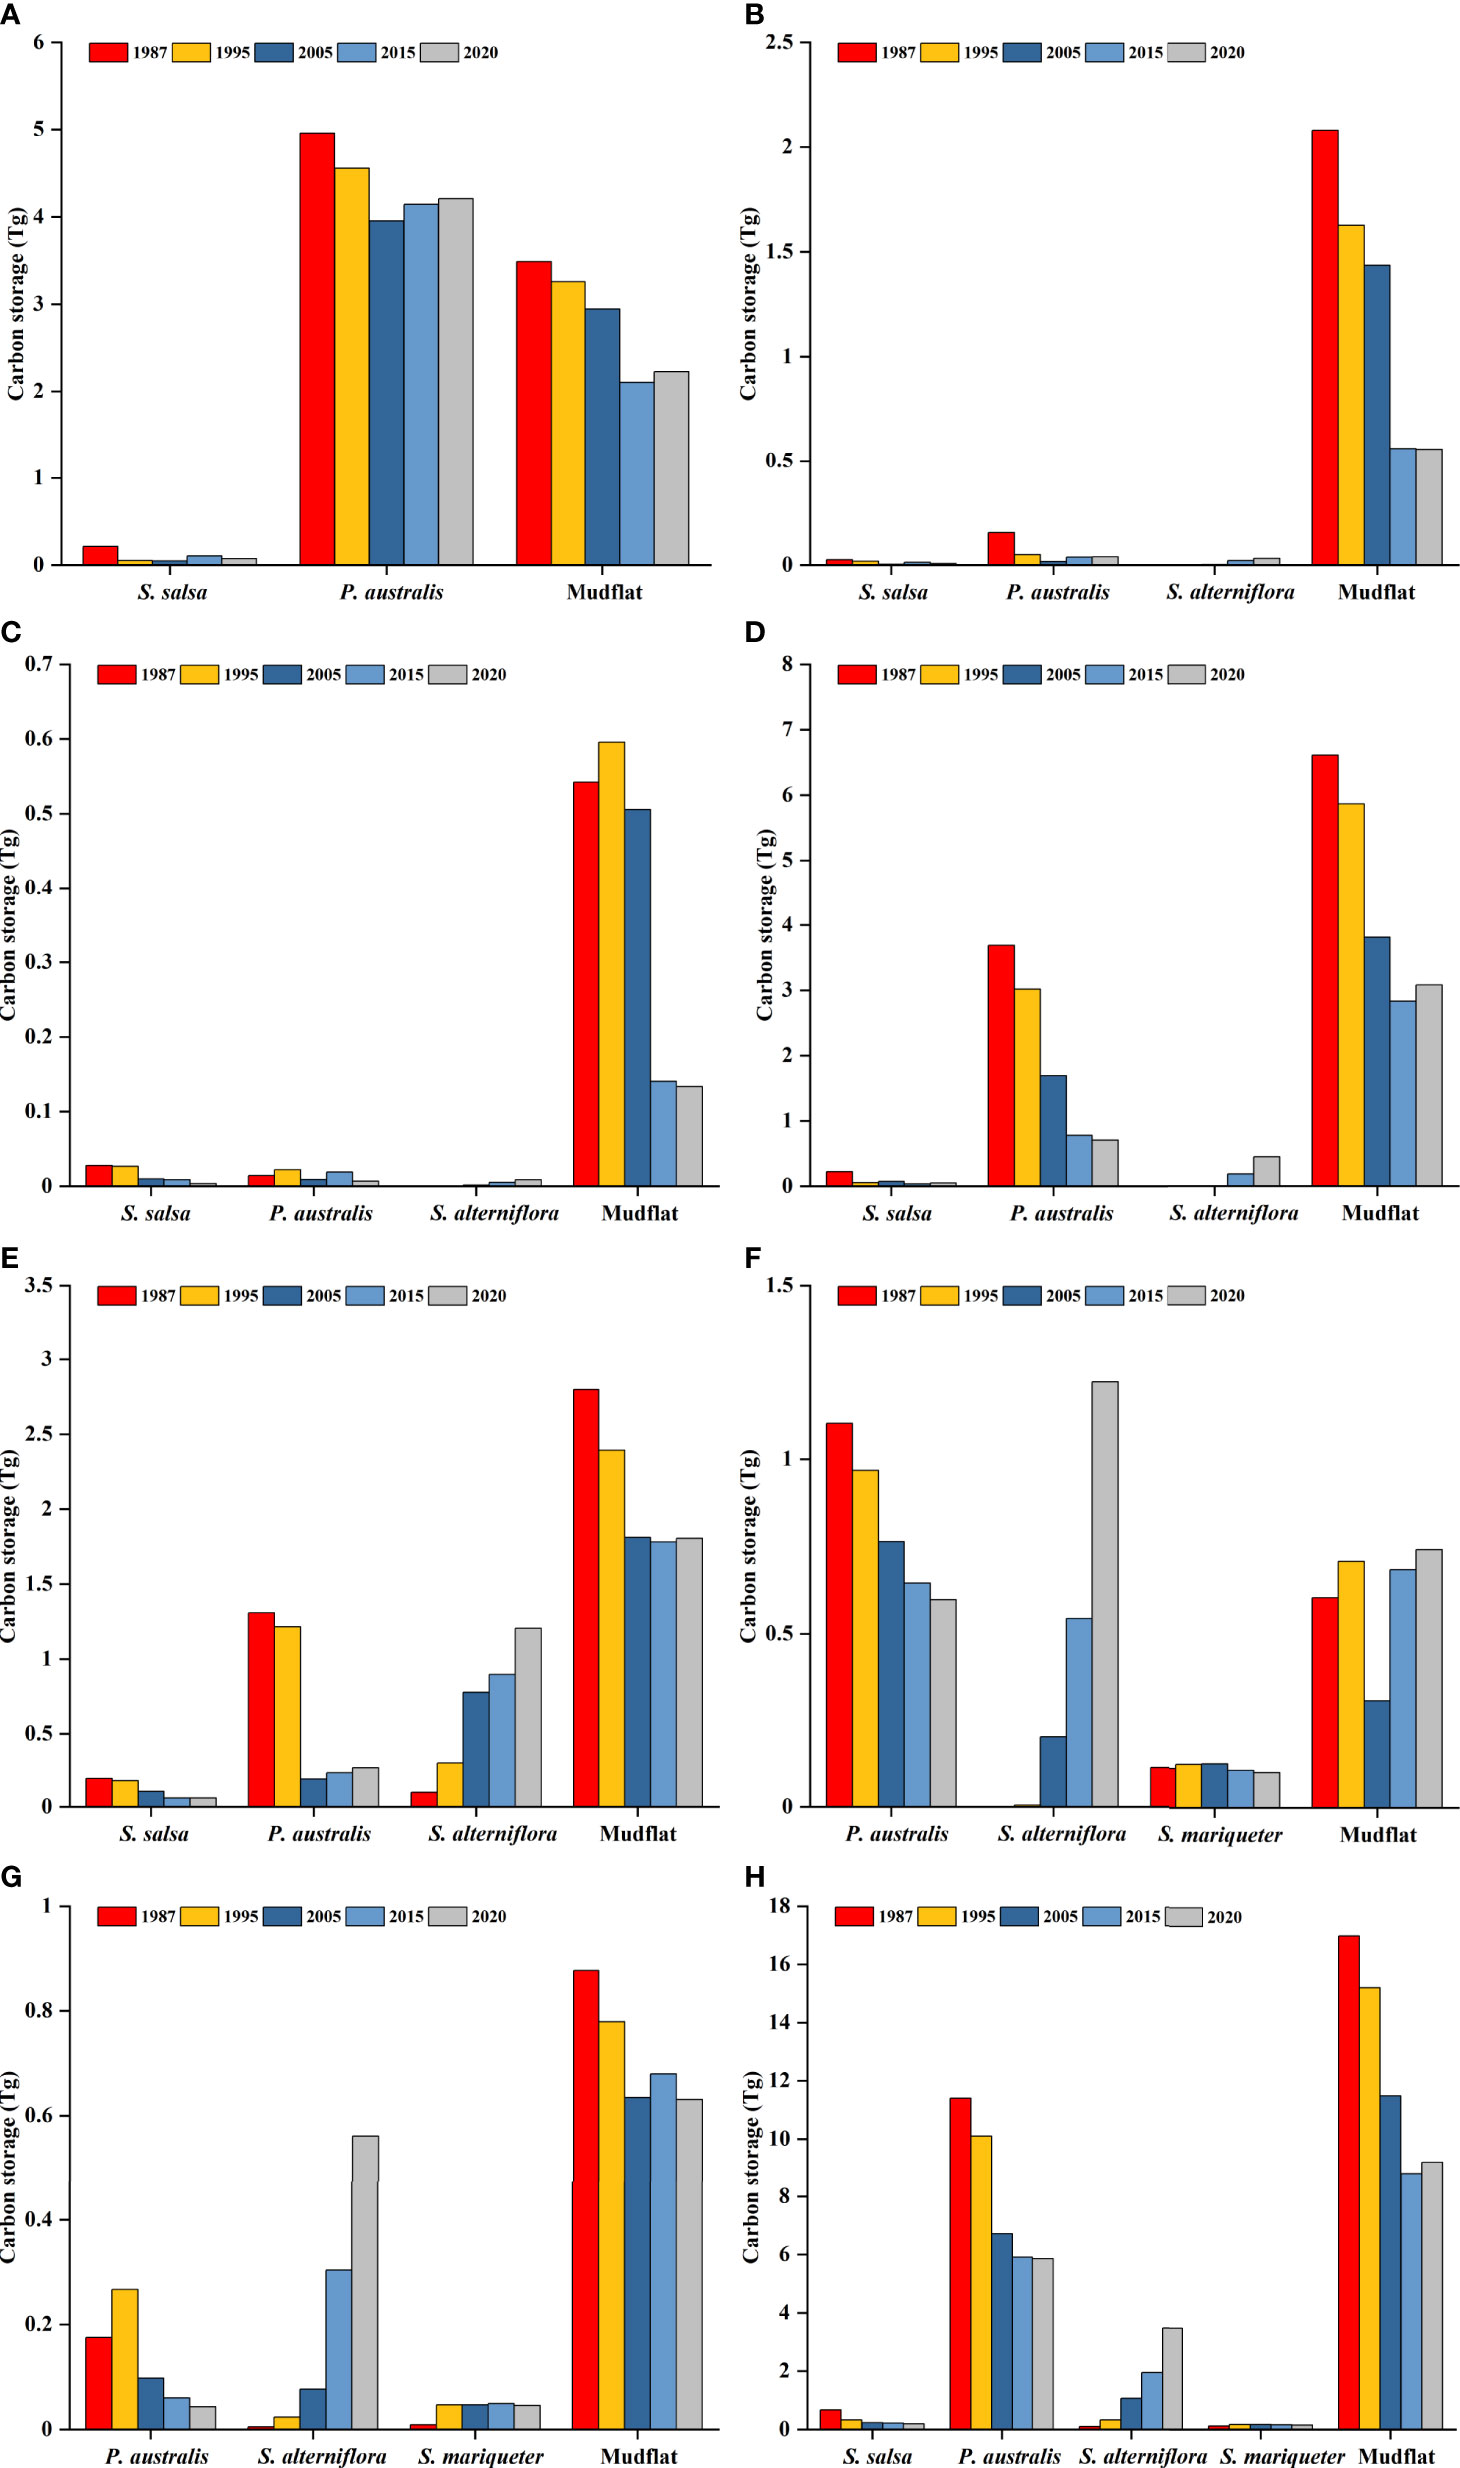
Figure 7 Carbon storage of various saltmarshes in (A) Liaoning, (B) Hebei, (C) Tianjin, (D) Shandong, (E) Jiangsu, (F) Shanghai, (G) Zhejiang, and (H) the whole study area from 1987 to 2020.
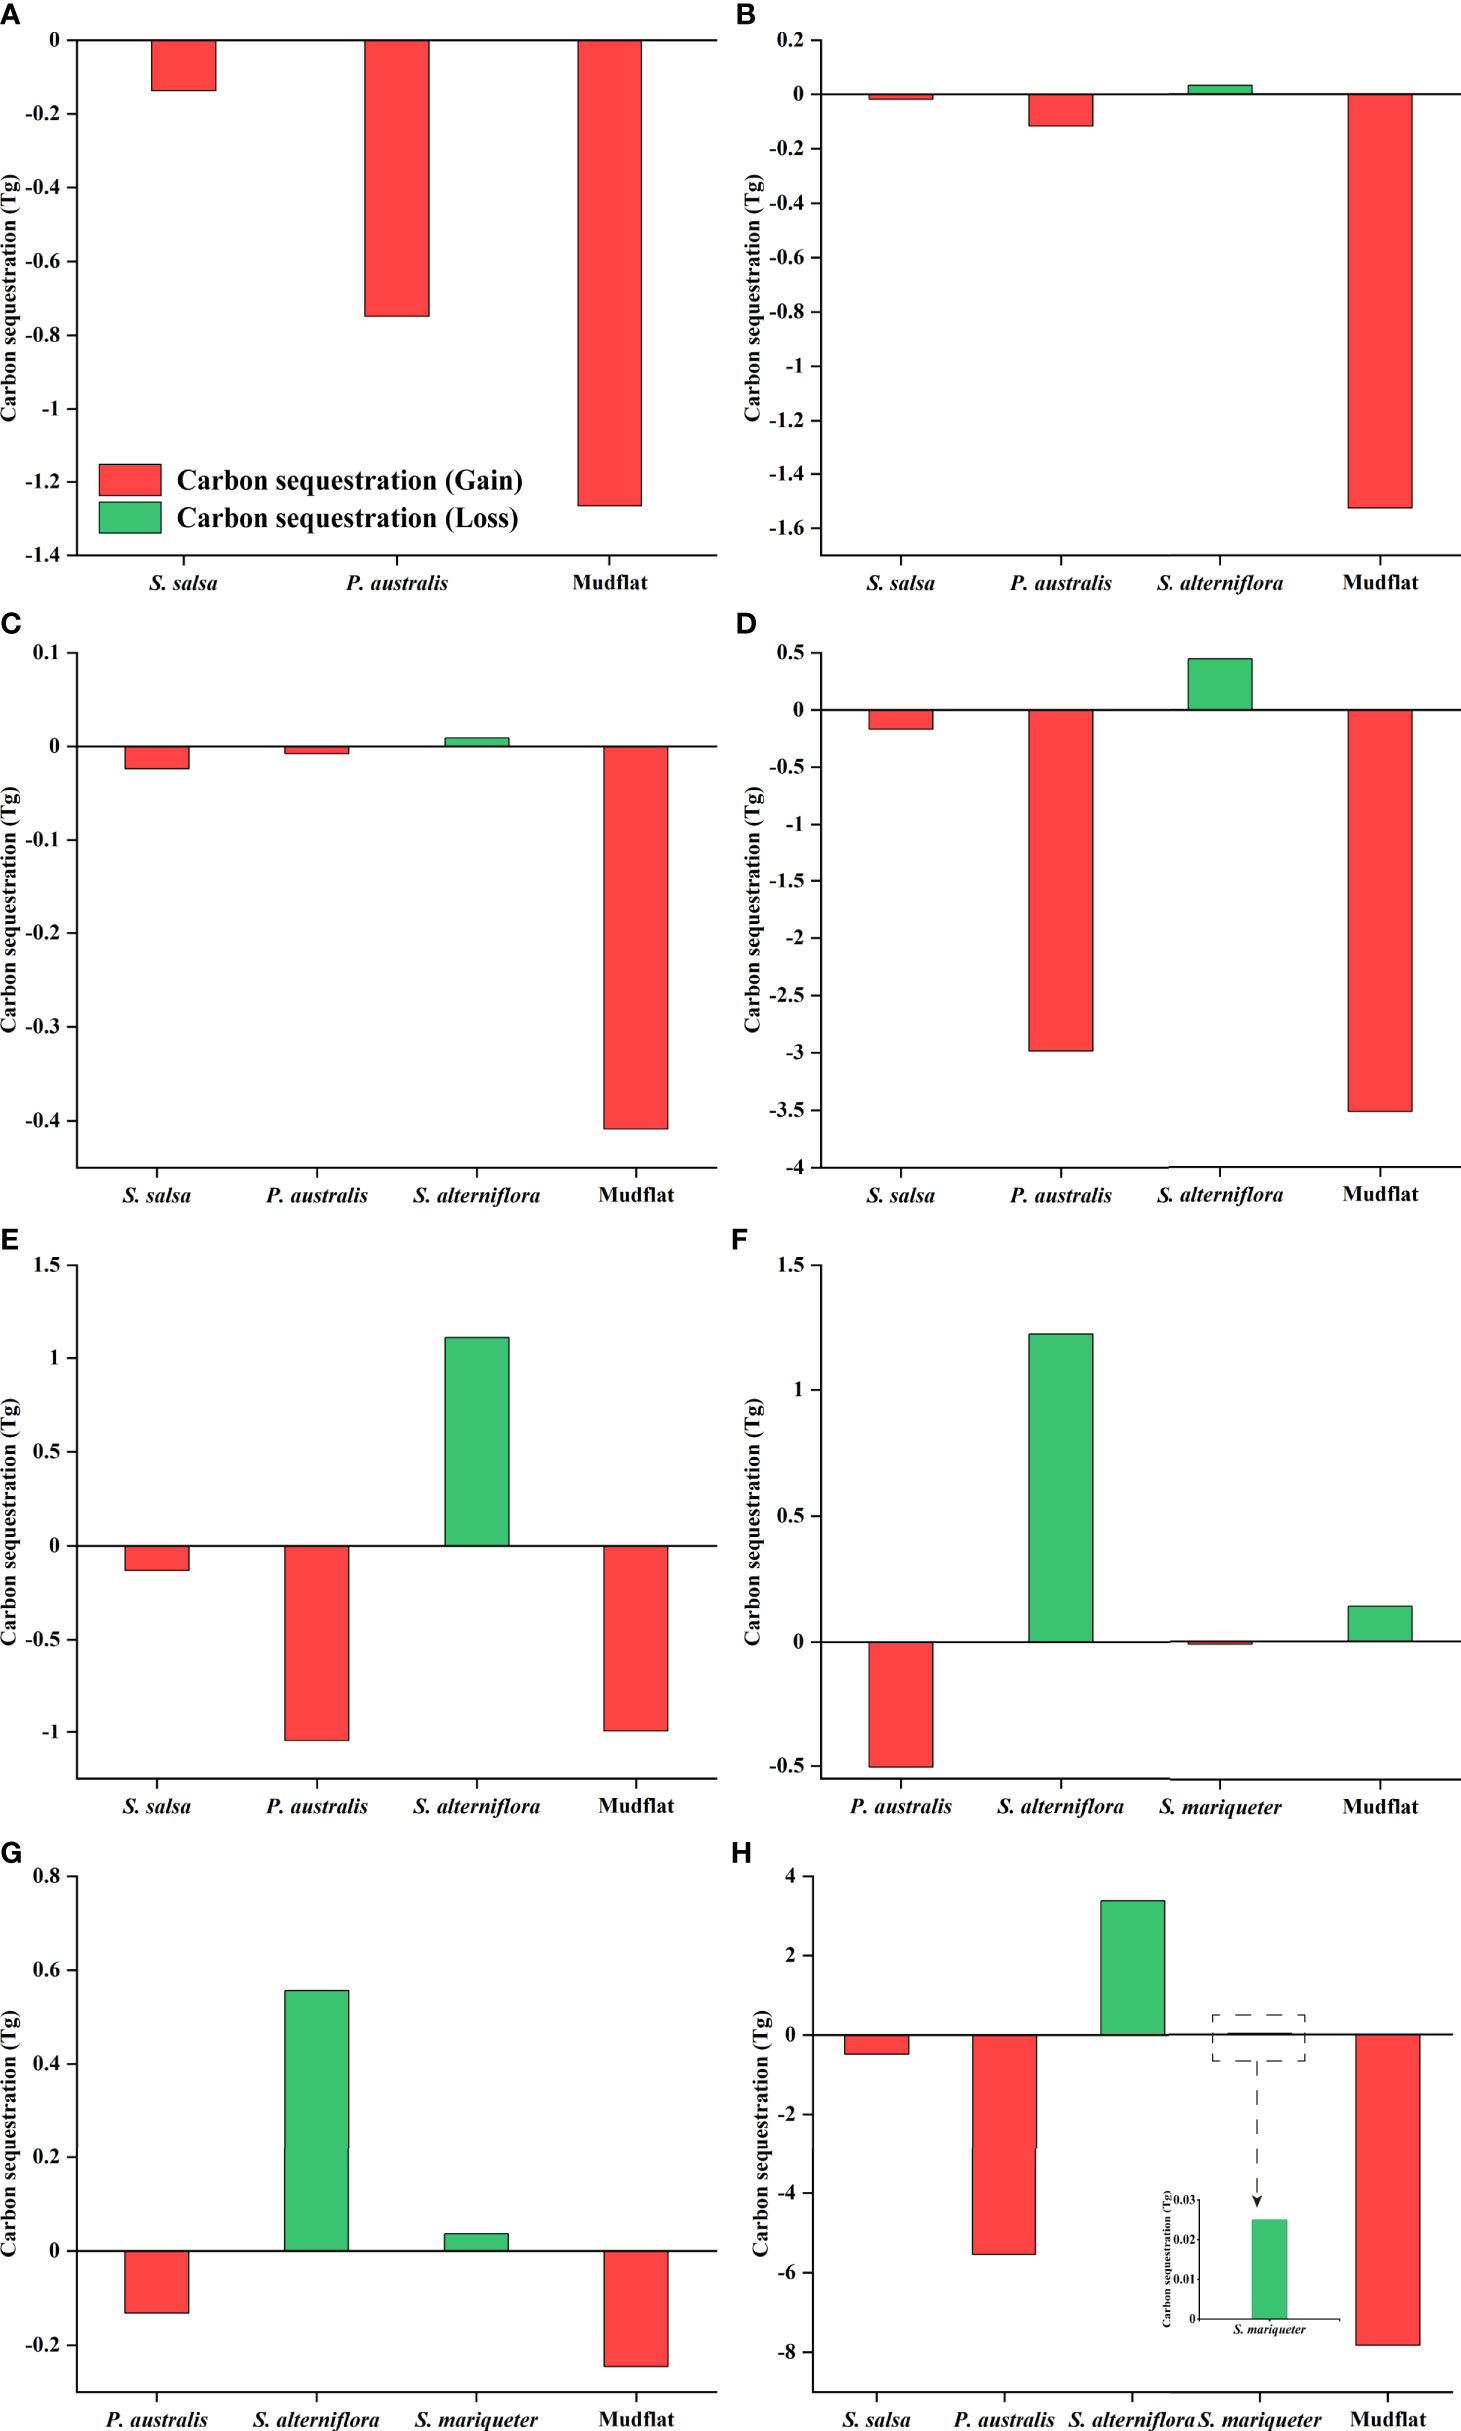
Figure 8 Carbon sequestration of various saltmarshes in (A) Liaoning, (B) Hebei, (C) Tianjin, (D) Shandong, (E) Jiangsu, (F) Shanghai, (G) Zhejiang, and (H) the whole study area from 1987 to 2020. The inset in (H) is enlarged data for carbon sequestration of S. mariqueter in the whole study area.
4 Discussion
4.1 Changes in Saltmarsh Coverage and Carbon Storage
We found that the area of saltmarshes area shrank from 1987 to 2020 (Table 3 and Supplementary Figure 2). In particular, major trends included the reduction in the P. australis saltmarsh and mudflats, and the expansion of the S. alterniflora saltmarsh. Our results for changed areas of saltmarsh types are similar to those reported in other research (Gu et al., 2018; Mao et al., 2019; Gu et al., 2021). Reclamation projects carried out in China coastal wetlands are considered to be the most dominant cause for coastal ecosystem degradation and loss. Newly constructed buildings, farmland, and aquaculture ponds now occupy large areas that were once wetlands along the country’s coastal zone (Li et al., 2018b; Li et al., 2020). In our study, while the carbon stocks of S. alterniflora increased, those of the salt-marsh wetlands showed an overall decline, because the greater S. alterniflora carbon storage is much less than reduced carbon storage in other saltmarsh types (Figures 6, 8). Recently, several studies that estimated saltmarshes’ carbon storage came to conclusions similar to ours. For example, reclamation in China has caused a great loss of coastal carbon storage over the past three decades (Li et al., 2018b). In addition, Ma et al. (2019) analyzed the dynamics of coastal blue carbon storage in the Yellow River Delta, China, from 1970 to 2010, finding that it collectively decreased more than increased over time. Therefore, it is necessary to strengthen the protection and management of China’s saltmarshes.
4.2 Driving Factors of Carbon Storage Variation
In our study, the corresponding maximum carbon density of S. alterniflora increasing to 104.99 from 85.65 Mg·hm-2 (Figure 3). Previous research has showed that plant invasions can alter C and N cycles in wetland ecosystems (Windham and Ehrenfeld, 2003; Zhang et al., 2021). It is known that S. alterniflora relies on the C4 photosynthetic pathway to sustain higher rates of net primary productivity than S. salsa or other native C3 plants can attain, leading to its carbon stock gain in biomass, in addition, S. alterniflora have the high potential for additional carbon accumulation from litter and roots (Zhang et al., 2010; Davidson et al., 2018; Zhang et al., 2018). During the past three decades, carbon stocks in some areas, such as Jiangsu and Shanghai, were indeed enhanced after an S. alterniflora invasion (Figures 6, 7), and the total carbon storage increased by 3.37 Tg (Figure 8). Davidson et al. (2018) found significantly greater carbon stocks in encroached saltmarsh, amounting to 40% ( ± 16%) more carbon than in non-invaded saltmarsh habitat, but effects depended on the species of invader. Large areas with high carbon density that emerged in offshore saltmarshes (mudflats) after undergoing S. alterniflora invasion (Supplementary Figure 3). Importantly, these offshore saltmarshes invaded by S. alterniflora were most responsible for the significantly increased carbon storage over time (Figures 5, 8). Other scholars reported that S. alterniflora mostly invades mudflats (Mao et al., 2019). An S. alterniflora invasion intensifies biomass per unit area, extends the margins of saltmarsh wetlands—for example, the expansion of S. alterniflora at Dafeng Milu National Nature Reserve (Figure 9)—and converts mudflats into vegetated habitats rich in carbon (Davidson et al., 2018; Mao et al., 2019). S. alterniflora colonization on mudflats also absorbs a substantial quantity of nutrients like nitrogen and phosphorus, reducing the input of terrestrial nutrients to the offshore eutrophic sea area and improving the primary productivity of offshore areas (Wang et al., 2021). Apart from the invasion of S. alterniflora, mudflat deposition increases carbon stocks in salt marshes (Figure 5). Mudflats, a form of coastal environment with a vast surface area and high carbon storage capacity, are an essential part of the ecosystem (Lin et al., 2020; Xia et al., 2021). However, because the added mudflats were far fewer than the reduction, mudflat carbon storage decreased in all but Shanghai (Figure 8).

Figure 9 Maps of S. alterniflora expansion at the Dafeng Milu National Nature Reserve from (A) 1987 to (B) 2020.
Our research showed that the carbon reserve in saltmarshes changed from 29.30 to 18.85 Tg during 1987 and 2020, with a loss of 13.84 Tg and a gain of 3.40 Tg (Figures 4, 8). Carbon storage loss in mudflats and the P. australis saltmarsh together accounted for more than 96% of reduced carbon storage (Figure 8). This trend can be attributed to an increased reclamation area which damaged large-sized inshore saltmarshes (e.g., the expansion of reclamation area at Liao River Estuary, Yellow River Delta and Chongming Dongtan, Figure 10), resulting in a significant loss of carbon storage (Li et al., 2018b). Additionally, tidal flat reclamation exposes wetland soils in anaerobic environment to the atmosphere, hastening the decomposition of soil organic carbon and the release of CO2 into the atmosphere (Zhou et al., 2016). Shandong suffered the largest loss of carbon storage, followed by Liaoning, Hebei and Jiangsu (Figure 6), which might be related to the continuous increase of reclamation area in these provinces (Li et al., 2020; Duan et al., 2021), which leads to the reduction of carbon sink potential of coastal wetlands (Zhang et al., 2009; Zhou et al., 2016). Based on aquaculture pond extent data from Duan et al. (2021), we calculated the correlation between pond area and saltmarsh carbon storage. The results showed a significant negative correlation between carbon storage and aquaculture ponds area (P < 0.05). The rapid development of the aquaculture industry has caused the large-scale transformation of much coastal wetlands, leading to harmful impacts on natural ecosystems (Virdis, 2014; Meng et al., 2017). The results showed that the carbon storage of offshore mudflat decreased (Figures 5, 8), especially in the middle coast of Jiangsu. The sea level rise which caused losses of soil in saltmarshes may be the main reason for the carbon storage loss of offshore mudflat (DeLaune and White, 2012; Yin et al., 2012). Additionally, DeLaune and White (2012) suggested that reductions in carbon stocks of coastal zones could be related to hurricanes. Hurricanes trigger an instantaneous losses of much sequestered soil carbon through the damage cause to wide swaths of saltmarshes.
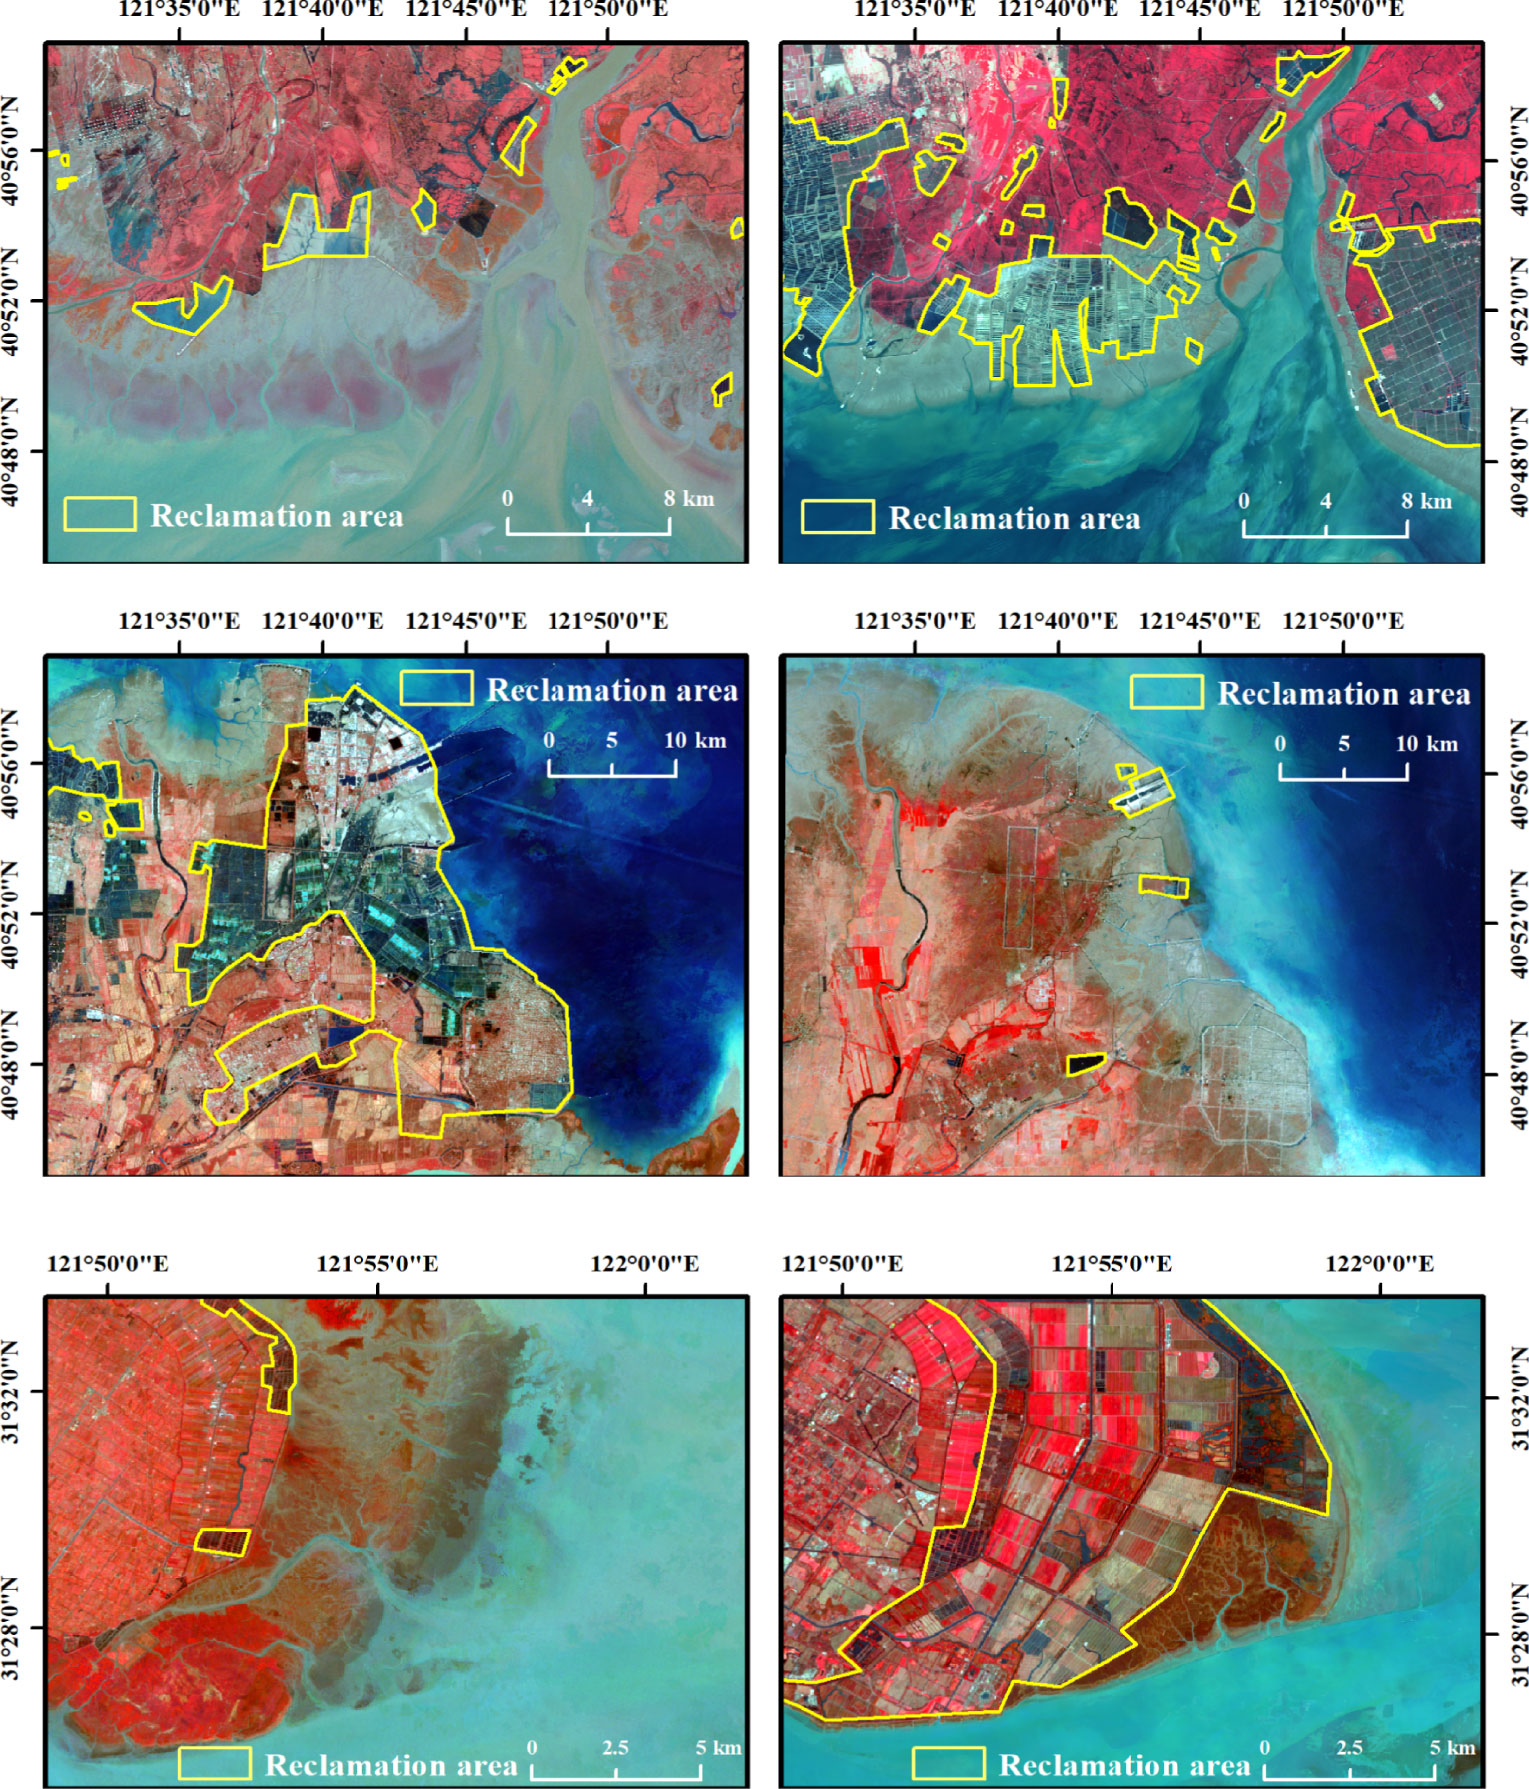
Figure 10 Landsat image examples of the reclamation area’s expansion at the Liao River Estuary from (A) 1987 to (B) 2020, at Yellow River Delta from (C) 1987 to (D) 2020, and at Chongming Dongtan from (E) 1987 to (F) 2020.
4.3 Limitations
In this study, we must acknowledge several limitations. First, Landsat satellites can only partially capture information about the full tidal range (Zhang et al., 2019). Thus, even though MSIC based on GEE was used to discern the fully-exposed salt marsh wetlands, it is basically impossible to obtain images of all the lowest and highest tides along China’s eastern coastline. Even so, it is still certain that MSIC based on GEE is more accurate in delineating the extent of salt marsh wetlands primarily affected by semi-diurnal tides than other currently available algorithms (Jia et al., 2021). Besides, in considering aboveground, belowground, and soil organic carbon storage compartments in the studied saltmarsh types, we used the InVEST model to estimate the carbon storage of China’s eastern coastal zone. We have made use of existing carbon pool data that fit with the study area and objectives as far as possible. Yet the carbon storage by dead organic matter in saltmarshes was assumed to be zero, because of the paucity of empirical data. We believe this compartment would only have an insignificant effect on the total carbon storage of the saltmarshes, given that we know the dead organic matter carbon pool accounts for a tiny percentage (less than 2%) of total carbon pool of coastal marsh ecosystems (Ma et al., 2019; Cai et al., 2021). Looking ahead, in situ surveys are needed to refine the carbon pool data, and obtain more accurate parameters, which would be helpful for estimating the carbon stocks more reliably for predictive purposes. Finally, the InVEST model assumes that none of the saltmarsh types gained or lost carbon over the past three decades. In fact, due to the influence of many factors, carbon storage has some degree of spatiotemporal variability (Li et al., 2018a). For example, the storage and distribution of soil organic carbon can be affected by land use dynamics (Wang et al., 2002). Nevertheless, this space-for-time substitution model, InVEST, is currently deemed effective and useful for carbon storage estimation because more appropriate models are lacking (Adelisardou et al., 2021; Xu et al., 2021b).
5 Conclusions
By integrating GEE and InVEST, our study was able to explore the spatiotemporal changes to saltmarsh carbon stocks in the China’s eastern coastal zone from 1987 to 2020, and to analyze the effects of natural and human-driven processes on these stocks in various types of saltmarshes. The findings demonstrated that, overall, loss in saltmarsh carbon storage exceeded its gain, such that net carbon storage decreased by 10.44 Tg. Reduced carbon storage occurred most starkly in mudflats and the P. australis wetlands close to reclamation areas in Shandong, amounting to a loss of 13.84 Tg. Gained carbon storage was concentrated in S. alterniflora wetlands at the seaward edge within saltmarshes in Jiangsu and Shanghai, increasing by 3.37 Tg. The carbon sequestration was influenced by mainly the negative effects of coastal reclamation and the positive effects of S. alterniflora invasion. The results of this article could serve as a blueprint for carbon stock estimations of various saltmarsh types, to facilitate the conservation and restoration of carbon stocks in global wetlands.
Data Availability Statement
The original contributions presented in the study are included in the article/Supplementary Material. Further inquiries can be directed to the corresponding author.
Author Contributions
JL, DY, and ZL conceived the study. JL, XY, DY, YL, SX, and YS performed data processing and statistical analyses. JL wrote the manuscript draft. DY and ZL reviewed and edited the manuscript. All authors contributed to revisions of the final version and approved the submitted version.
Funding
This research was supported by the National Natural Science Foundation of China (project nos. 41871097, 41471078), the 333 High-level Talents Fostering Project of Jiangsu Province (project no. BRA2020339), and the Priority Academic Program Development of Jiangsu Higher Education Institution (PAPD).
Conflict of Interest
The authors declare that the research was conducted in the absence of any commercial or financial relationships that could be construed as a potential conflict of interest.
Publisher’s Note
All claims expressed in this article are solely those of the authors and do not necessarily represent those of their affiliated organizations, or those of the publisher, the editors and the reviewers. Any product that may be evaluated in this article, or claim that may be made by its manufacturer, is not guaranteed or endorsed by the publisher.
Acknowledgments
The authors gratefully acknowledge the editors and reviewers for raising suggestions and comments on this paper.
Supplementary Material
The Supplementary Material for this article can be found online at: https://www.frontiersin.org/articles/10.3389/fmars.2022.915727/full#supplementary-material
References
Adelisardou F., Zhao W., Chow R., Mederly P., Minkina T., Schou J. S. (2021). Spatiotemporal Change Detection of Carbon Storage and Sequestration in an Arid Ecosystem by Integrating Google Earth Engine and InVEST (The Jiroft Plain, Iran). Int. J. Environ. Sci. Technol. doi: 10.1007/s13762-021-03676-6
Bai J., Zhang G., Zhao Q., Lu Q., Jia J., Cui B., et al. (2016). Depth-Distribution Patterns and Control of Soil Organic Carbon in Coastal Salt Marshes With Different Plant Covers. Sci. Rep. 6, 34835. doi: 10.1038/srep34835
Cai W., Zhu Q., Chen M., Cai Y. (2021). Spatiotemporal Change and the Natural–Human Driving Processes of a Megacity’s Coastal Blue Carbon Storage. Int. J. Environ. Res. Public Health 18, 8879. doi: 10.3390/ijerph18168879
Chen J., Wang D., Li Y., Yu Z., Chen S., Hou X., et al. (2020). The Carbon Stock and Sequestration Rate in Tidal Flats From Coastal China. Global Biogeochem. Cycle. 34, e2020GB006772. doi: 10.1029/2020GB006772
Davidson I. C., Cott G. M., Devaney J. L., Simkanin C. (2018). Differential Effects of Biological Invasions on Coastal Blue Carbon: A Global Review and Meta-Analysis. Glob. Chang. Biol. 24, 5218–5230. doi: 10.1111/gcb.14426
DeLaune R. D., White J. R. (2012). Will Coastal Wetlands Continue to Sequester Carbon in Response to an Increase in Global Sea Level?: A Case Study of the Rapidly Subsiding Mississippi River Deltaic Plain. Clim. Change 110, 297–314. doi: 10.1007/s10584-011-0089-6
Duan Y., Tian B., Li X., Liu D., Sengupta D., Wang Y., et al. (2021). Tracking Changes in Aquaculture Ponds on the China Coast Using 30 Years of Landsat Images. Int. J. Appl. Earth Obs. Geoinformat. 102, 102383. doi: 10.1016/j.jag.2021.102383
Duarte C. M., Losada I. J., Hendriks I. E., Mazarrasa I., Marbà N. (2013). The Role of Coastal Plant Communities for Climate Change Mitigation and Adaptation. Nat. Clim. Change 3, 961–968. doi: 10.1038/nclimate1970
Gu J., Jin R., Chen G., Ye Z., Li Q., Wang H., et al. (2021). Areal Extent, Species Composition, and Spatial Distribution of Coastal Saltmarshes in China. IEEE J. Sel. Top. Appl. Earth Obs. Remote Sens. 14, 7085–7094. doi: 10.1109/JSTARS.2021.3093673
Gu J., Luo M., Zhang X., Christakos G., Agusti S., Duarte C. M., et al. (2018). Losses of Salt Marsh in China: Trends, Threats and Management. Estuar. Coast. Shelf. Sci. 214, 98–109. doi: 10.1016/j.ecss.2018.09.015
He C., Zhang D., Huang Q., Zhao Y. (2016). Assessing the Potential Impacts of Urban Expansion on Regional Carbon Storage by Linking the LUSD-Urban and InVEST Models. Environ. Model. Software. 75, 44–58. doi: 10.1016/j.envsoft.2015.09.015
Hu Y., Tian B., Yuan L., Li X., Huang Y., Shi R., et al. (2021). Mapping Coastal Salt Marshes in China Using Time Series of Sentinel-1 SAR. ISPRS. J. Photogramm. Remote Sens. 173, 122–134. doi: 10.1016/j.isprsjprs.2021.01.003
Islam I., Cui S., Hoque M. Z., Abdullah H. M., Tonny K. F., Ahmed M., et al. (2022). Dynamics of Tree Outside Forest Land Cover Development and Ecosystem Carbon Storage Change in Eastern Coastal Zone, Bangladesh. Land 11, 76. doi: 10.3390/land11010076
Jia M., Wang Z., Mao D., Ren C., Wang C., Wang Y. (2021). Rapid, Robust, and Automated Mapping of Tidal Flats in China Using Time Series Sentinel-2 Images and Google Earth Engine. Remote Sens. Environ. 255, 112285. doi: 10.1016/j.rse.2021.112285
Li C., Zhao J., Thinh N., Xi Y. (2018a). Assessment of the Effects of Urban Expansion on Terrestrial Carbon Storage: A Case Study in Xuzhou City, China. Sustainability 10, 647. doi: 10.3390/su10030647
Li F., Ding D., Chen Z., Chen H., Shen T., Wu Q., et al. (2020). Change of Sea Reclamation and the Sea-Use Management Policy System in China. Mar. Policy 115, 103861. doi: 10.1016/j.marpol.2020.103861
Li Y., Qiu J., Li Z., Li Y. (2018b). Assessment of Blue Carbon Storage Loss in Coastal Wetlands Under Rapid Reclamation. Sustainability 10, 2818. doi: 10.3390/su10082818
Lin W., Wu J., Lin H. (2020). Contribution of Unvegetated Tidal Flats to Coastal Carbon Flux. Glob. Chang. Biol. 26, 3443–3454. doi: 10.1111/gcb.15107
Ma T., Li X., Bai J., Ding S., Zhou F., Cui B. (2019). Four Decades' Dynamics of Coastal Blue Carbon Storage Driven by Land Use/Land Cover Transformation Under Natural and Anthropogenic Processes in the Yellow River Delta, China. Sci. Tot. Environ. 655, 741–750. doi: 10.1016/j.scitotenv.2018.11.287
Mao D., Liu M., Wang Z., Li L., Man W., Jia M., et al. (2019). Rapid Invasion of Spartina Alterniflora in the Coastal Zone of Mainland China: Spatiotemporal Patterns and Human Prevention. Sens. 19, 2308. doi: 10.3390/s19102308
Mcleod E., Chmura G. L., Bouillon S., Salm R., Björk M., Duarte C. M., et al. (2011). A Blueprint for Blue Carbon: Toward an Improved Understanding of the Role of Vegetated Coastal Habitats in Sequestering CO2. Front. Ecol. Environ. 9, 552–560. doi: 10.1890/110004
Meng W., Hu B., He M., Liu B., Mo X., Li H., et al. (2017). Temporal-Spatial Variations and Driving Factors Analysis of Coastal Reclamation in China. Estuar. Coast. Shelf. Sci. 191, 39–49. doi: 10.1016/j.ecss.2017.04.008
Nahlik A. M., Fennessy M. S. (2016). Carbon Storage in US Wetlands. Nat. Commun. 7, 13835. doi: 10.1038/ncomms13835
Shen X., Jiang M., Lu X., Liu X., Liu B., Zhang J., et al. (2021). Aboveground Biomass and its Spatial Distribution Pattern of Herbaceous Marsh Vegetation in China. Sci. China.: Earth Sci. 64, 1115–1125. doi: 10.1007/s11430-020-9778-7
Tang J., Ye S., Chen X., Yang H., Sun X., Wang F., et al. (2018). Coastal Blue Carbon: Concept, Study Method, and the Application to Ecological Restoration. Sci. China.: Earth Sci. 61, 637–646. doi: 10.1007/s11430-017-9181-x
Virdis S. G. P. (2014). An Object-Based Image Analysis Approach for Aquaculture Ponds Precise Mapping and Monitoring: A Case Study of Tam Giang-Cau Hai Lagoon, Vietnam. Environ. Monit. Assess. 186, 117–133. doi: 10.1007/s10661-013-3360-7
Wang F., Tang J., Ye S., Liu J. (2021). Blue Carbon Sink Function of Chinese Coastal Wetlands and Carbon Neutrality Strategy. Bull. Chin. Acad. Sci. 36, 241–251. doi: 10.16418/j.issn.1000-3045.20210215101
Wang X., Xiao X., Zou Z., Chen B., Ma J., Dong J., et al. (2020a). Tracking Annual Changes of Coastal Tidal Flats in China During 1986–2016 Through Analyses of Landsat Images With Google Earth Engine. Remote Sens. Environ. 238, 110987. doi: 10.1016/j.rse.2018.11.030
Wang X., Xiao X., Zou Z., Hou L., Qin Y., Dong J., et al. (2020b). Mapping Coastal Wetlands of China Using Time Series Landsat Images in 2018 and Google Earth Engine. ISPRS. J. Photogramm. Remote Sens. 163, 312–326. doi: 10.1016/j.isprsjprs.2020.03.014
Wang S., Xu J., Zhou C., He C. (2002). Using Remote Sensing to Estimate the Change of Carbon Storage; A Case Study in the Estuary of Yellow River Delta. Int. J. Remote Sens. 23, 1565–1580. doi: 10.1080/014311602753590887
Windham L., Ehrenfeld J. G. (2003). Net Impact of a Plant Invasion on Nitrogen-Cycling Processes Within a Brackish Tidal Marsh. Ecol. Appl. 13, 883–896. doi: 10.1890/02-5005
Xia S., Wang W., Song Z., Kuzyakov Y., Guo L., Van Zwieten L., et al. (2021). Spartina Alterniflora Invasion Controls Organic Carbon Stocks in Coastal Marsh and Mangrove Soils Across Tropics and Subtropics. Glob. Chang. Biol. 27, 1627–1644. doi: 10.1111/gcb.15516
Xu Y., Hu Z., Zhang Y., Wang J., Yin Y., Wu G. (2021a). Mapping Aquaculture Areas With Multi-Source Spectral and Texture Features: A Case Study in the Pearl River Basin (Guangdong), China. Remote Sens. 13, 4320. doi: 10.3390/rs13214320
Xu J., Renaud F. G., Barrett B. (2021b). Modelling Land System Evolution and Dynamics of Terrestrial Carbon Stocks in the Luanhe River Basin, China: A Scenario Analysis of Trade-Offs and Synergies Between Sustainable Development Goals. Sustain. Sci. doi: 10.1007/s11625-021-01004-y
Yang J., Huang X. (2021). The 30 M Annual Land Cover Dataset and its Dynamics in China From 1990 to 2019. Earth Syst. Sci. Data 13, 3907–3925. doi: 10.5194/essd-13-3907-2021
Yan D., Li J., Yao X., Luan Z. (2021). Quantifying the Long-Term Expansion and Dieback of Spartina Alterniflora Using Google Earth Engine and Object-Based Hierarchical Random Forest Classification. IEEE J. Sel. Top. Appl. Earth Obs. Remote Sens. 14, 9781–9793. doi: 10.1109/JSTARS.2021.3114116
Yim J., Kwon B., Nam J., Hwang J., Choi K. (2018). Analysis of Forty Years Long Changes in Coastal Land Use and Land Cover of the Yellow Sea: The Gains or Losses in Ecosystem Services. Environ. Pollut. 241, 74–84. doi: 10.1016/j.envpol.2018.05.058
Yin J., Yin Z., Wang J., Xu S. (2012). National Assessment of Coastal Vulnerability to Sea-Level Rise for the Chinese Coast. J. Coast. Conserv. 16, 123–133. doi: 10.1007/s11852-012-0180-9
Zhang G., Bai J., Jia J., Wang X., Wang W., Zhao Q., et al. (2018). Soil Organic Carbon Contents and Stocks in Coastal Salt Marshes With Spartina Alterniflora Following an Invasion Chronosequence in the Yellow River Delta, China. Chin. Geogr. Sci. 28, 374–385. doi: 10.1007/s11769-018-0955-5
Zhang G., Bai J., Zhao Q., Jia J., Wang X., Wang W., et al. (2021). Soil Carbon Storage and Carbon Sources Under Different Spartina Alterniflora Invasion Periods in a Salt Marsh Ecosystem. Catena 196, 104831. doi: 10.1016/j.catena.2020.104831
Zhang Y., Ding W., Luo J., Donnison A. (2010). Changes in Soil Organic Carbon Dynamics in an Eastern Chinese Coastal Wetland Following Invasion by a C4 Plant Spartina Alterniflora. Soil Biol. Biochem. 42, 1712–1720. doi: 10.1016/j.soilbio.2010.06.006
Zhang K., Dong X., Liu Z., Gao W., Hu Z., Wu G. (2019). Mapping Tidal Flats With Landsat 8 Images and Google Earth Engine: A Case Study of the China's Eastern Coastal Zone Circa 2015. Remote Sens. 11, 924. doi: 10.3390/rs11080924
Zhang D., Zhang L. (2020). Land Cover Change in the Central Region of the Lower Yangtze River Based on Landsat Imagery and the Google Earth Engine: A Case Study in Nanjing, China. Sens. 20, 2091. doi: 10.3390/s20072091
Zhang X., Zhang Z., Xu Z., Gu D., Zheng W. (2009). Landscape Pattern Change and its Cumulative Environmental Effects of Coastal Wetlands in Southern Laizhou Bay. Chin. J. Ecol. 28, 2437–2443. doi: 10.13292/j.1000-4890.2009.0403
Zhang Y., Zhao M., Cui Q., Fan W., Qi J., Chen Y., et al. (2017). Processes of Coastal Ecosystem Carbon Sequestration and Approaches for Increasing Carbon Sink. Sci. China.: Earth Sci. 60, 809–820. doi: 10.1007/s11430-016-9010-9
Zhao Q., Bai J., Zhang G., Jia J., Wang W., Wang X. (2018). Effects of Water and Salinity Regulation Measures on Soil Carbon Sequestration in Coastal Wetlands of the Yellow River Delta. Geoderma 319, 219–229. doi: 10.1016/j.geoderma.2017.10.058
Zhao M., He Z., Du J., Chen L., Lin P., Fang S. (2019). Assessing the Effects of Ecological Engineering on Carbon Storage by Linking the CA-Markov and InVEST Models. Ecol. Indic. 98, 29–38. doi: 10.1016/j.ecolind.2018.10.052
Keywords: carbon storage, driving factors, GEE, InVEST, saltmarshes, spatiotemporal dynamics
Citation: Li J, Yan D, Yao X, Liu Y, Xie S, Sheng Y and Luan Z (2022) Dynamics of Carbon Storage in Saltmarshes Across China’s Eastern Coastal Wetlands From 1987 to 2020. Front. Mar. Sci. 9:915727. doi: 10.3389/fmars.2022.915727
Received: 08 April 2022; Accepted: 09 May 2022;
Published: 02 June 2022.
Edited by:
Junhong Bai, Beijing Normal University, ChinaReviewed by:
Zhigaosun Sun, Fujian Normal University, ChinaFeng Li, Institute of Subtropical Agriculture (CAS), China
Copyright © 2022 Li, Yan, Yao, Liu, Xie, Sheng and Luan. This is an open-access article distributed under the terms of the Creative Commons Attribution License (CC BY). The use, distribution or reproduction in other forums is permitted, provided the original author(s) and the copyright owner(s) are credited and that the original publication in this journal is cited, in accordance with accepted academic practice. No use, distribution or reproduction is permitted which does not comply with these terms.
*Correspondence: Zhaoqing Luan, bHVhbnpoYW9xaW5nQG5qZnUuZWR1LmNu