- 1Shirshov Institute of Oceanology, Russian Academy of Sciences, Moscow, Russia
- 2Moscow Institute of Physics and Technology, Dolgoprudny, Russia
- 3Marine Hydrophysical Institute of RAS, Sevastopol, Russia
- 4Russian State Hydrometeorological University, Saint-Petersburg, Russia
- 5Ilyichev Pacific Oceanological Institute, Far Eastern Branch of the Russian Academy of Sciences, Vladivostok, Russia
The inflow of warm and saline Atlantic water from the North Atlantic to the Western Arctic is provided by two branches, namely, the Fram Strait branch water and the Barents Sea branch water. The pathways of these branches merge at the St. Anna Trough, and then both branches propagate eastward along the continental slope, albeit at different depths. As a result, the local interaction between these branches in the trough affects the properties of the large-scale Atlantic water flow to the Eastern Arctic and the deep Arctic basins. In this study, we report extensively in situ measurements with high spatial coverage (56 hydrological stations organized into 7 transects) in the St. Anna Trough, obtained in August and October 2021. Based on these data, we reconstructed the thermohaline structure and circulation in this area and obtained new insights, which are crucial for the assessment of the interaction and heat balance of water masses in the trough. First, we state that the majority of the Fram Strait branch water is recirculated in the trough within the stable cyclonic gyre, while a smaller fraction returns to the continental slope. The formation of this gyre increases the residence time of the Fram Strait branch water in the trough and decreases the intensity of water and heat exchange between the trough and the continental slope. Second, we describe the dynamic interaction between the northward flow of the Barents Sea branch water and the surface layer. It causes intense transport of warm surface water from the Kara and Barents seas adjacent to the Novaya Zemlya toward the continental slope and its mixing with the Barents Sea branch water along the eastern part of the trough. These processes result in increased surface temperature at the eastern part of the trough, which enhances ice melting at the study area and increases the duration of the ice-free period.
Introduction
The large-scale transport of Atlantic water from the North Atlantic to the Arctic Ocean is among the most important drivers of the Arctic thermohaline structure and circulation (Aagaard, 1981; Rudels et al., 1996; Rudels et al., 1999; Rudels and Friedrich, 2000; Dmitrenko et al., 2008; Dmitrenko et al., 2010; Rudels et al., 2015). The Atlantic water enters the Arctic Ocean along two pathways, namely, through the Fram Strait (~3–4 Sv) and the Barents Sea (~1–3 Sv) (Rudels et al., 2000; Fahrbach et al., 2001; Schauer et al., 2002; Schauer et al., 2002b; Beszczynska-Möller et al., 2011) (Figure 1A). The southern branch of the Atlantic water experienced significant transformation in the Barents Sea (Schauer et al., 2002; Rudels et al., 2004; Årthun et al., 2011). The resulting cold (<0°C) and dense Barents Sea branch water (BSBW) flows northward to the continental slope adjacent to the Nansen basin mainly through the St. Anna Trough (Schauer et al., 1997; Rudels and Friedrich, 2000; Årthun et al., 2011). The northern branch of the Atlantic waterway propagates eastward from the Fram Strait along the continental slope (Rudels et al., 1994; Ivanov et al., 2012; Onarheim et al., 2014). A comprehensive review of the spread and transformation of Atlantic water in the Barents Sea and along the continental slope is given in (Dmitrenko et al., 2015).
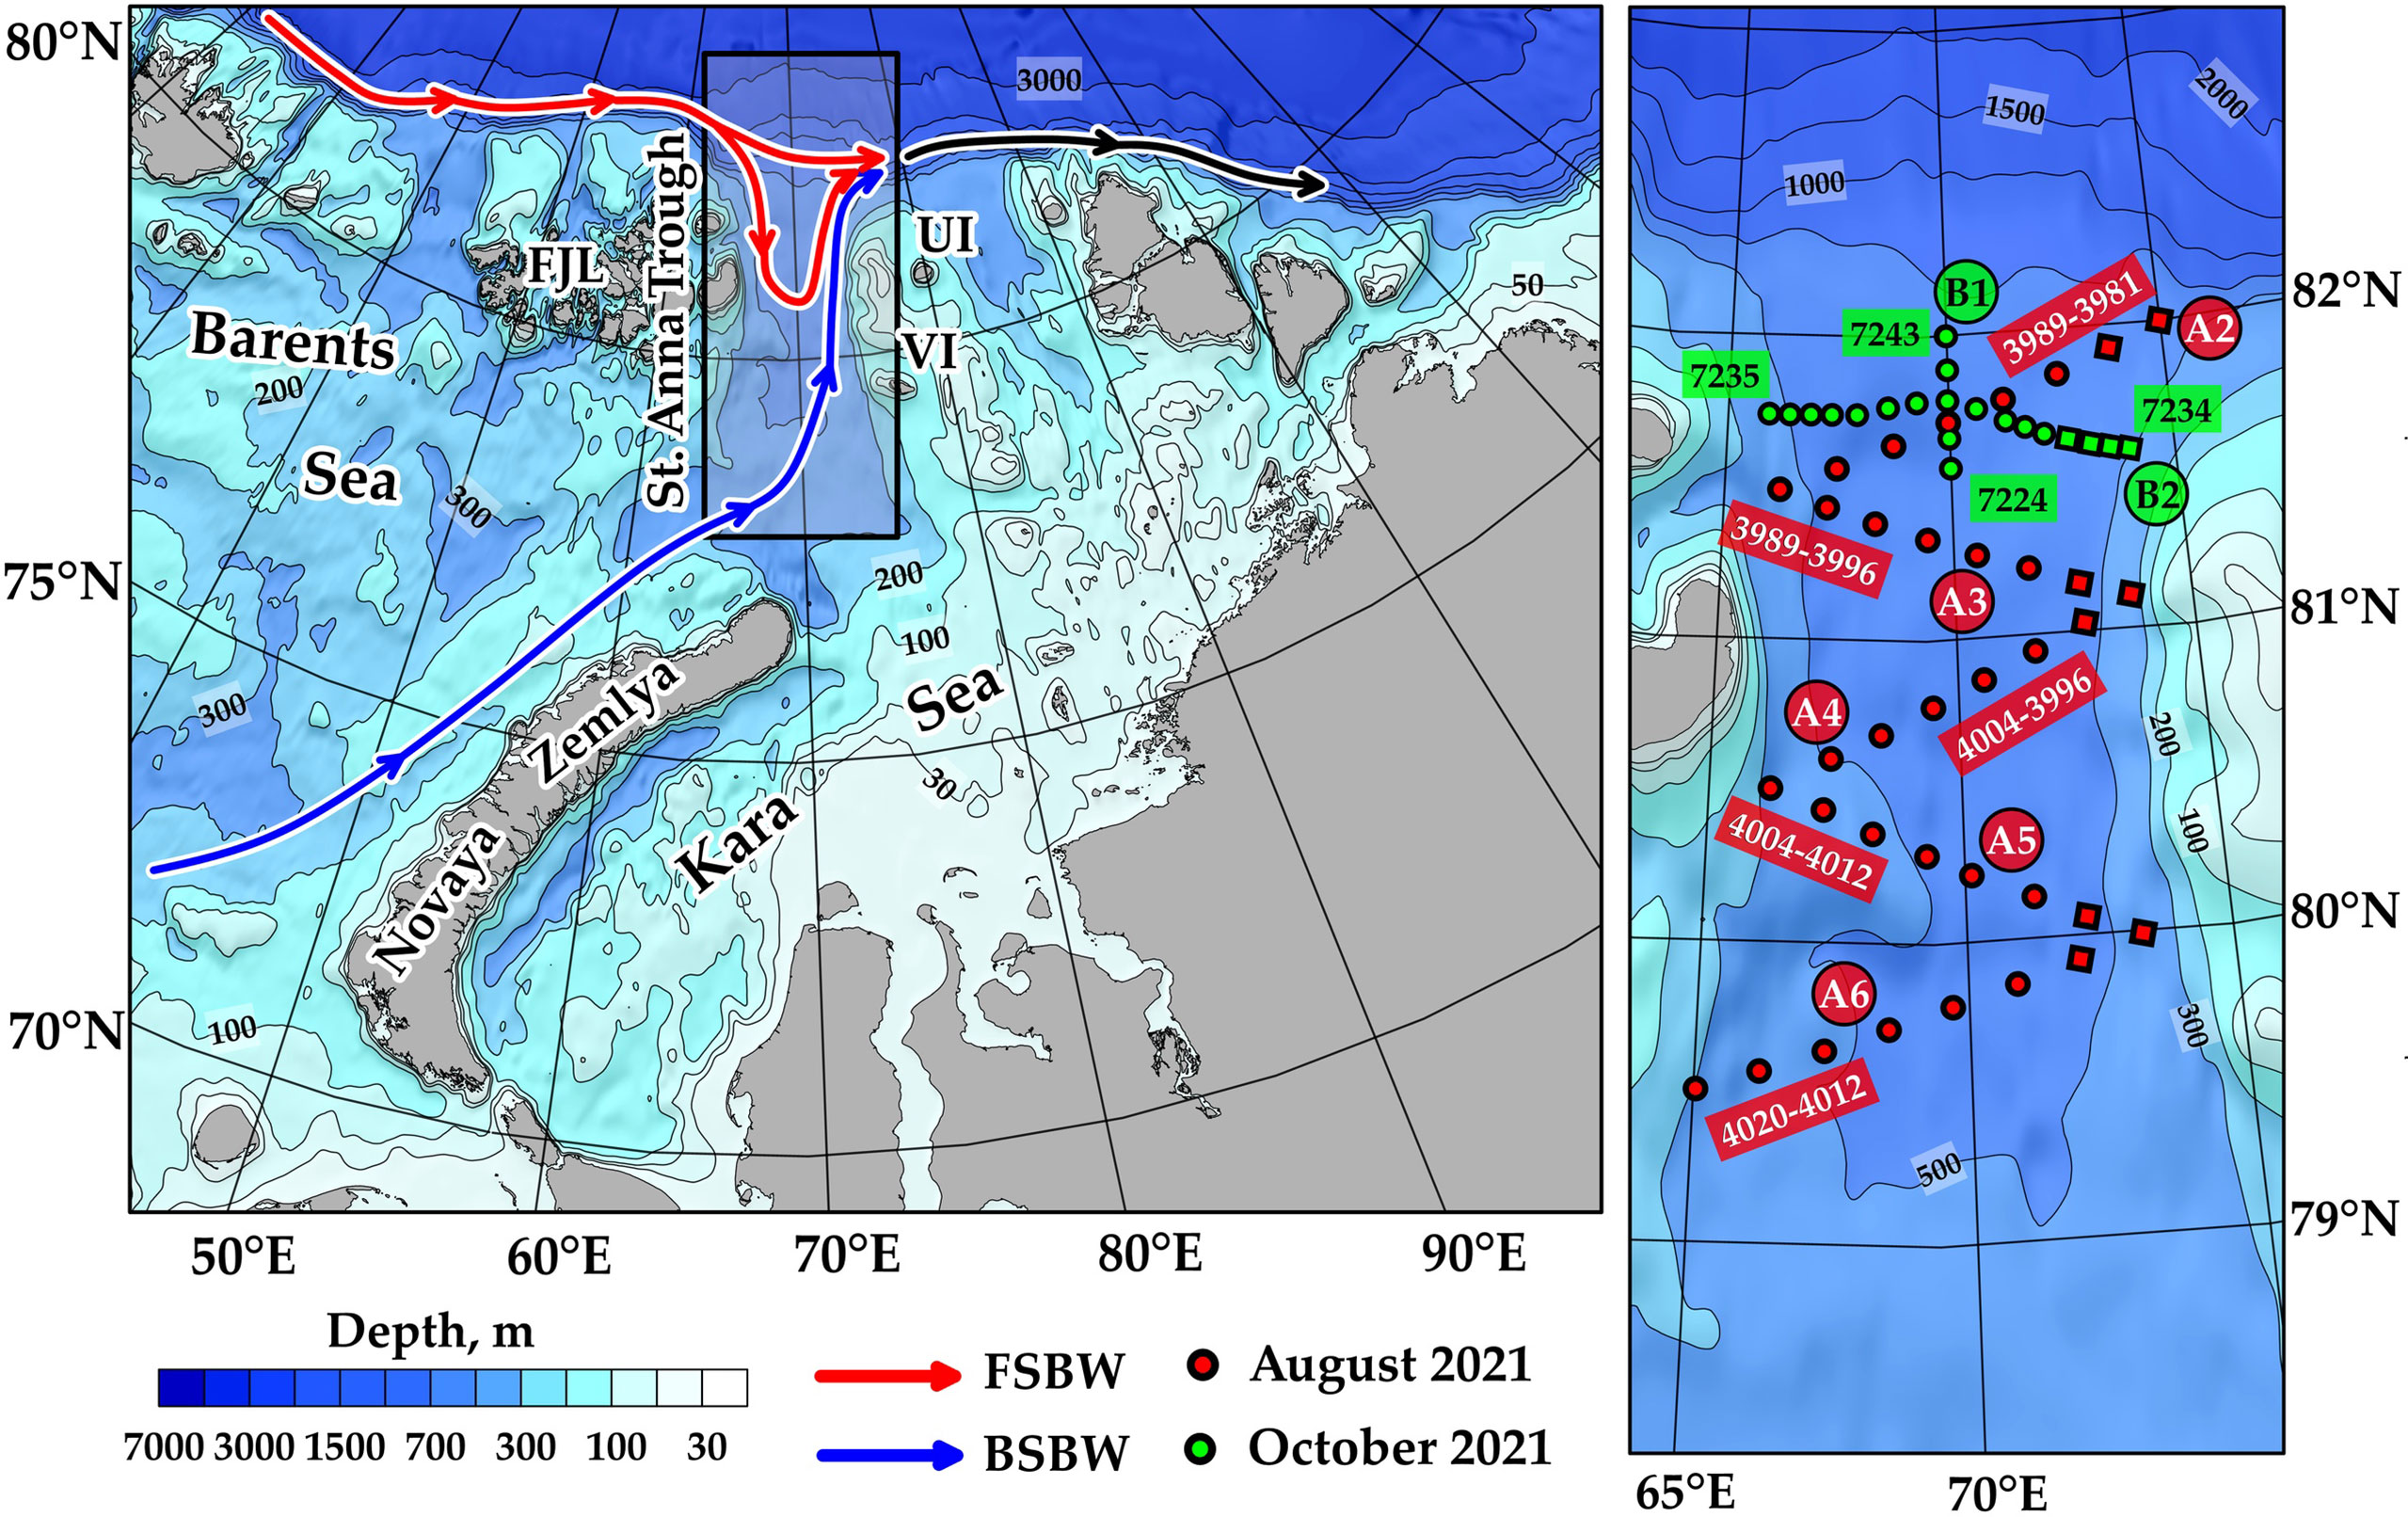
Figure 1 (A) A map of the St. Anna Trough and the adjacent areas of the Barents and Kara seas illustrating general circulation scheme of the Atlantic Water including flows of FSBW (red arrows), BSBW (blue arrows) and their joint flow along the continental slope eastward from the trough (black arrow).FJL, UI, and VI represent Franz Josef Land, Vize Island, and Ushakov Island respectively. (B) Location of hydrologic stations in the St. Anna Trough on 22–26 August 2021 (red circles and squares) and on 18–21 October 2021 (green circles and squares). Red and green circles mark stations in the central and western parts of the trough; red and green squares mark stations in the eastern part of the trough.
Once the northern flow of the Atlantic water reaches the St. Anna Trough, a part of it enters the trough along its western flank, reverses in the trough, and then exits along the eastern flank (Hanzlick and Aagaard, 1980; Schauer et al., 2002; Kirillov et al., 2012; Lien and Trofimov, 2013; Rudels et al., 2013; Dmitrenko et al., 2015) (Figure 1A). This flow, hereafter, referred to as the Fram Strait branch water (FSBW), is significantly warmer (>2°C in the core) and less dense than BSBW. FSBW circulates in the western and central parts of the trough, while BSBW forms an intense northward flow along the eastern flank of the trough. BSBW flow is in geostrophic balance and its velocity depends on baroclinic and barotropic pressure gradients across the eastern flank of the trough (Schauer et al., 2002; Kirillov et al., 2012; Lien et al., 2013; Smedsrud et al., 2013; Dmitrenko et al., 2015). Further northward at the continental slope, BSWB significantly deepens and becomes vertically aligned with the warm Atlantic water originating from the Fram Strait (Rudels et al., 1994; Schauer et al., 1997; Schauer et al., 2002b; Pnyushkov et al., 2015; Zhurbas and Kuzmina, 2020).
The Atlantic water that exits from the trough to the continental slope plays an important role in the formation of the halocline and deep layers over a wide area in the Arctic Ocean (Aksenov et al., 2011; Rudels et al., 2015). The local interaction between FSBW and BSBW within the trough, i.e., the momentum and heat exchange, can strongly affect the properties of the Atlantic water, which flows further eastward along the continental slope. In particular, Dmitrenko et al. (2014; 2015) reported the enhanced heat loss from the Atlantic water along the eastern flank of the St. Anna Trough. Therefore, understanding of the interaction and transformation of FSBW and BSBW in the trough is crucial for Arctic studies, especially in relation to the ongoing atlantification of the Western Arctic (Polyakov et al., 2017; Polyakov et al., 2020; Pnyushkov et al., 2022).
Previous studies provided baseline information about the structure and circulation of water masses in the St. Anna Trough (Schauer et al., 2002; Lien and Trofimov, 2013; Dmitrenko et al., 2014; Dmitrenko et al., 2015). However, the in situ measurements analyzed in these studies were limited to 1–3 zonal transects across the trough during certain years (in (Dmitrenko et al., 2015) also a mooring station at the eastern part of the trough). In this study, we analyze the new set of thermohaline measurements obtained at 56 stations in the St. Anna Trough in August and October 2021. These measurements covered the central and northern parts of the trough with high spatial resolution and provided new insights into (1) the circulation of FSBW in the northern part of the trough and (2) interaction between BSBW and the mixed surface layer along the eastern part of the trough. The obtained results are important for the assessment of the interaction and heat balance of FSBW, BSBW, halocline, and mixed surface layer in the study area.
This paper is organized as follows: in Section 2, we provide general information about the study region as well as the in situ and satellite data analyzed in this work. The detailed analysis of in situ measurements and the description of the structure and circulation of water masses in the St. Anna Trough are provided in Section 3. Section 4 addresses the transformation of temperature, salinity, and heat content of the Atlantic water in the trough, which is followed by the conclusions in Section 5.
Data and Methods
The St. Anna Trough is located in the northwestern part of the Kara Sea between the Franz Josef Land to the west, the Novaya Zemlya to the south, and Vize Island and the Ushakov Island to the east (Figure 1A). The trough is oriented from south to north (~500 km long) with a relatively stable width (~150 km). It has relatively plain relief, 500–600 m deep in the southern part and 500–700 m in the northern part, bounded by steep eastern and western slopes (Figure 1B). Sea depths westward and eastward from the trough are <200 m. In the south, the trough is connected with the shallow central part of the Kara Sea (mainly <50 m) and the northeastern part of the Barents Sea (150–350 m). In the north, the trough crosses the continental slope and connects with the deep Nansen basin (3,000–4,000 m).
In this work, we analyzed the in situ measurements obtained in the St. Anna Trough during the 58th cruise of the R/V “Akademik Ioffe” on 22–26 August 2021 and the 86th cruise of the R/V “Akademik Mstislav Keldysh” on 18–21 October 2021 (Figure 1B). In the first field survey in August, the measurements were obtained at 36 hydrological stations (red circles and squares in Figure 1B), organized into five transects across the northern and central parts of the trough (hereafter, referred to as transects A2–A6). In the second survey in October, the measurements were obtained at 20 hydrological stations (green circles and squares in Figure 1B), organized into two transects across (transect B1) and along (transect B2) in the northern part of the trough.
During both cruises, the vertical thermohaline structure was investigated using a conductivity-temperature–depth (CTD) instrument (Sea Bird Electronics (SBE) 911plus) at a 24 Hz sampling rate. This CTD profiler was equipped with two parallel temperature and conductivity sensors; the mean temperature differences between them did not exceed 0.01°C, while that of salinity was not greater than 0.005 PSU. The CTD data were processed based on a standard programming package (SBE Data Processing, version 7.26.7) using recommended settings. The heat content in different water masses in the study area was calculated using the formula , where is θ the potential temperature, θfr is the freezing temperature, ρ0≈ 1,027 kg·m−3 is the seawater density, cp≈ 3,991.9 J·kg−1·K−1 is the specific heat capacity of seawater (Polyakov et al., 2017).
Satellite maps of sea surface distributions of corrected reflectance and brightness temperature in the study area were retrieved from MODIS satellite data. These data were used to address certain aspects of the surface circulation in the St. Anna Trough. Additionally, satellite altimetry data from the Data Unification and Altimeter Combination System (DUACS) near real-time altimeter gridded product of 0.25° (Pujol et al., 2016) available from Copernicus Marine Environment Monitoring Service (CMEMS, http://marine.copernicus.eu/) was used for the analysis of the geostrophic circulation in the St. Anna Trough in 1994–2021. The product includes the data from all available altimeters on a Mercator regular grid, which has good effective spatial resolution (<100 km) in the study area because of the convergence of satellite ground tracks at high latitudes (Ballarotta et al., 2019). In this study, we analyze satellite altimetry maps with a time step of 10 days, which is also consistent with the effective temporal resolution of the DUACS product in high latitudes (Ballarotta et al., 2019). The wind forcing conditions in the study area were examined using the ERA5 atmospheric reanalysis with a 0.25° spatial and hourly temporal resolution (Hersbach et al., 2020).
Results
FSBW in the St. Anna Trough
The vertical temperature and salinity structures observed along the transect in the St. Anna Trough in August 2021 is shown in Figures 2, 3. It demonstrates the presence of the main local water masses, namely, mixed surface layer, halocline, FSBW, and BSBW (Figure 4A). A mixed surface layer (MSL) (S <34.1) and a more saline and dense halocline (34.1< S <34.7) occupy the depths from surface till 50–70 m. Another water mass is referred to as MSL mixed with BSBW, which is significantly warmer than halocline (T 0–2.5°C in August and T −0.5–1°C in October), but more saline than MSL and less saline than the lower part of halocline (S 34–34.5). MSL mixed with BSBW occupies the surface layer along the eastern part of the trough and is described and discussed in BSBW in the St. Anna Trough.
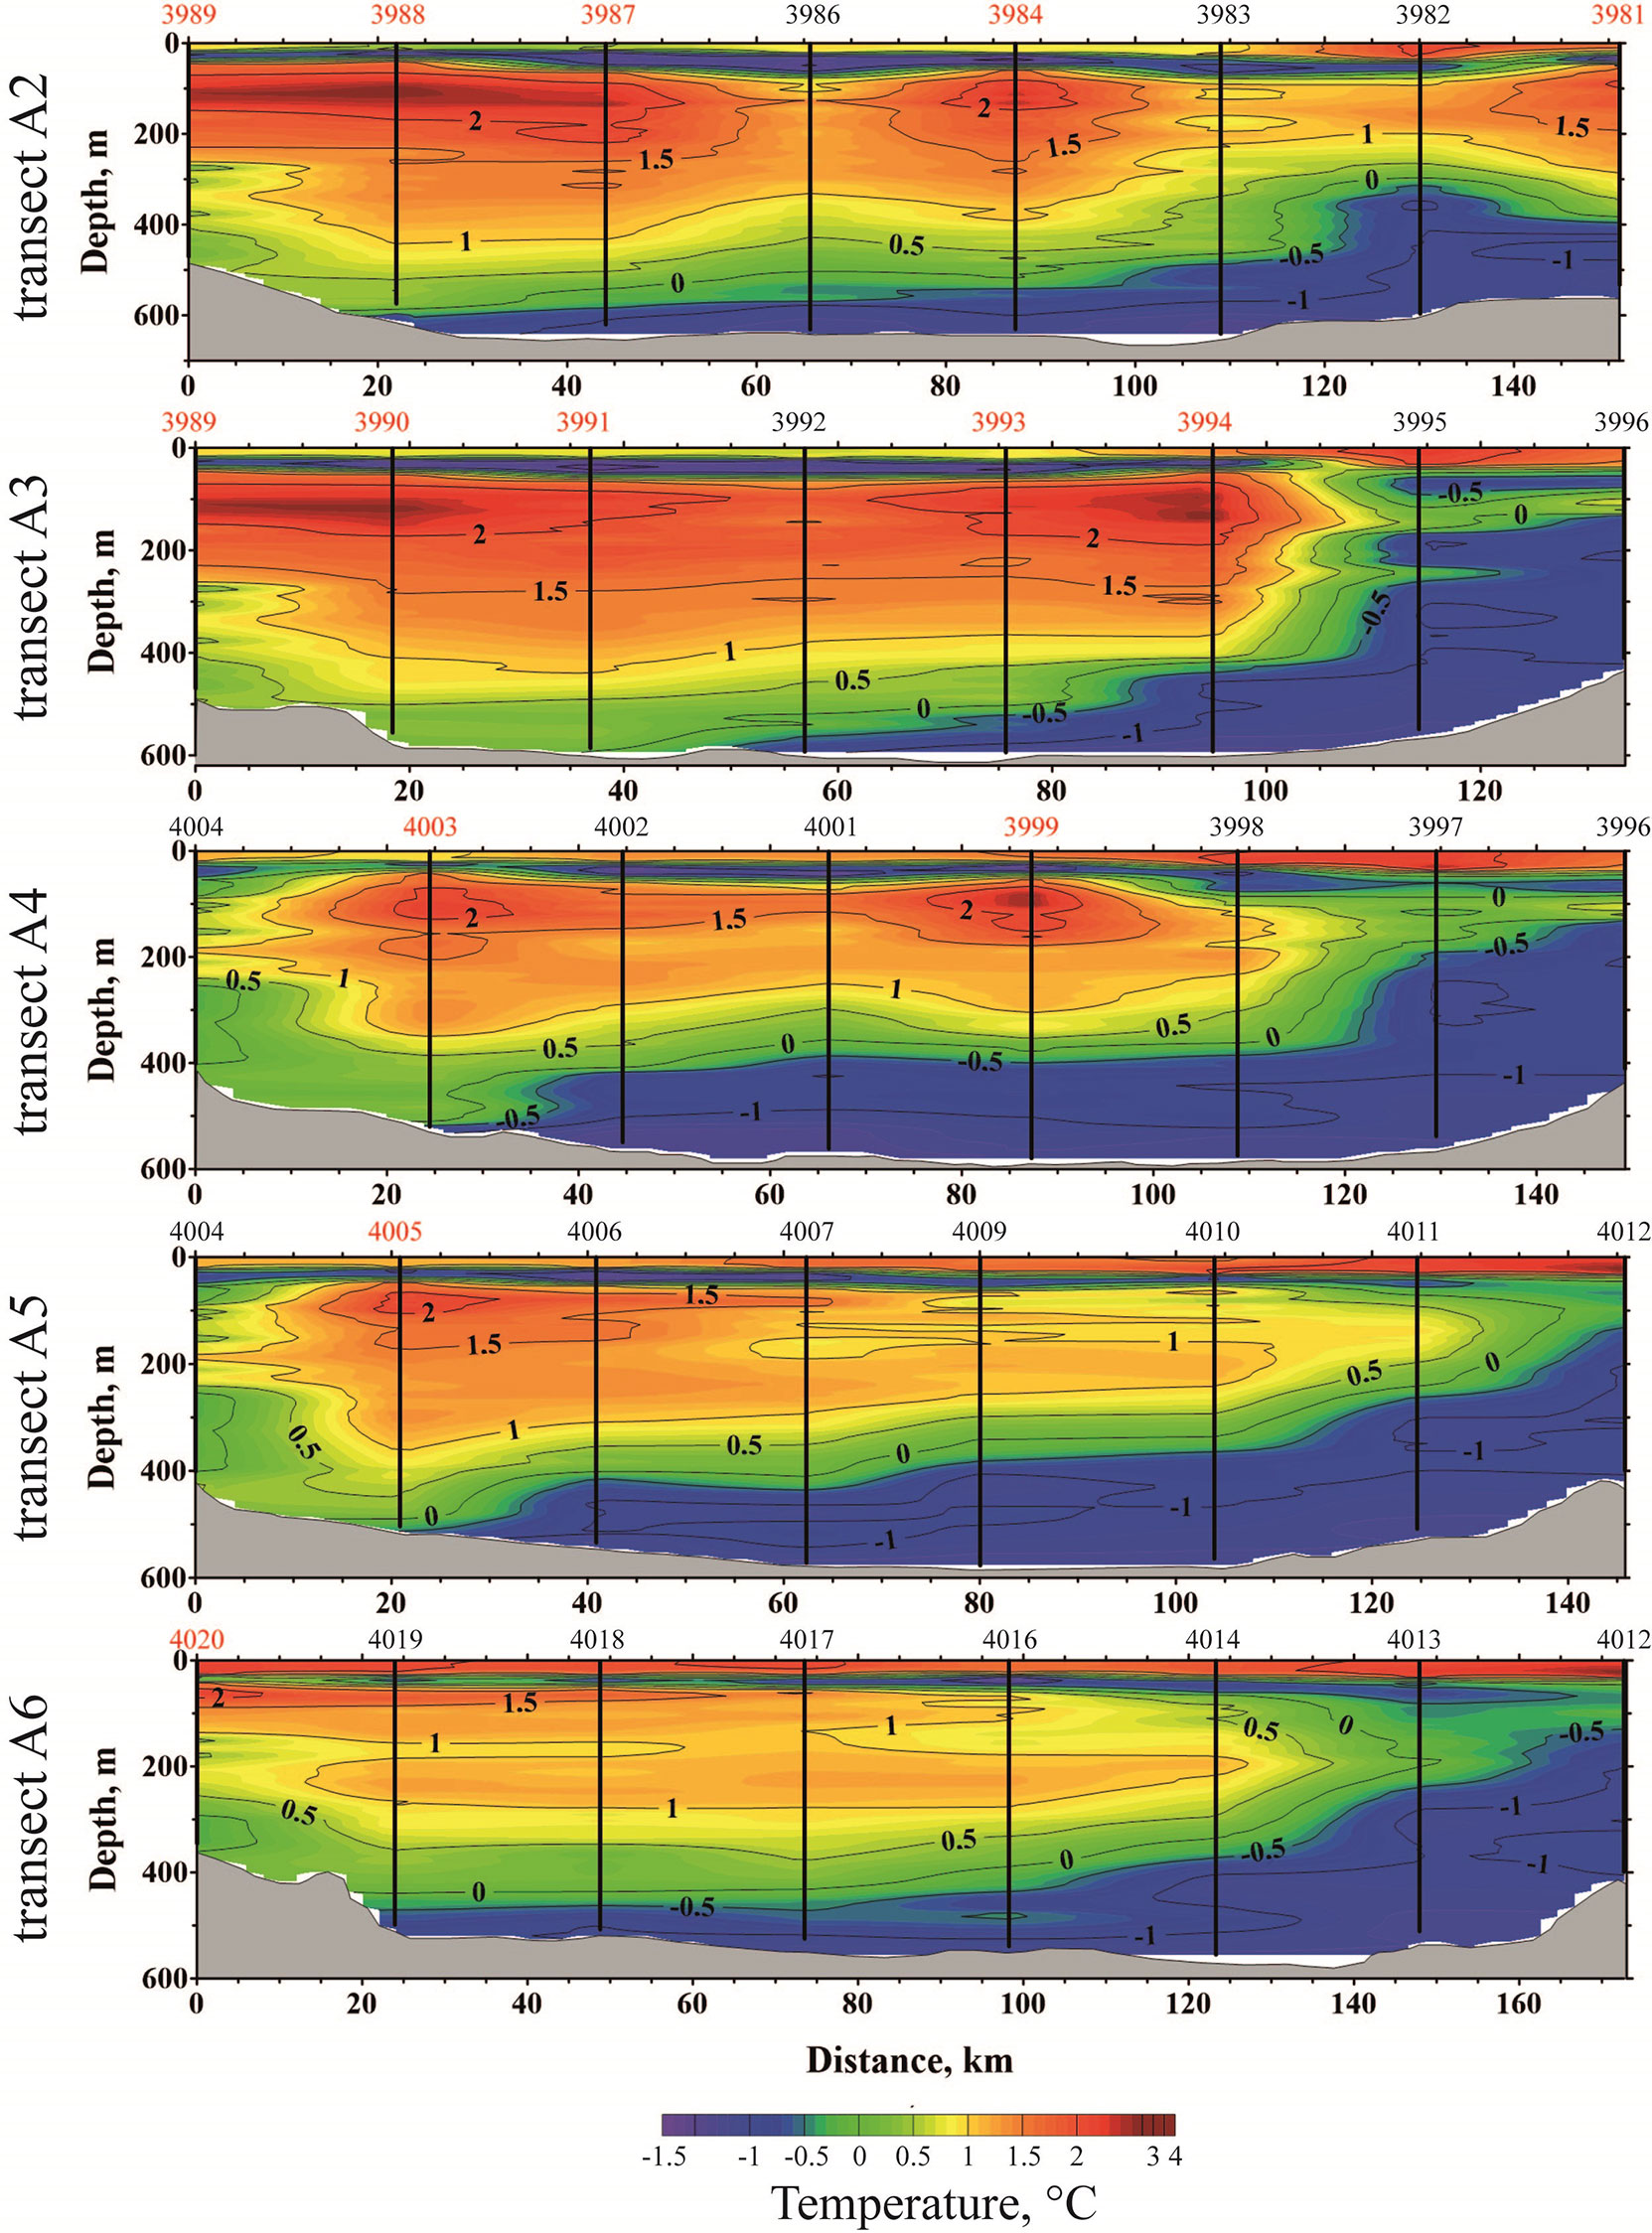
Figure 2 The vertical temperature structure along transects A2–A6 in the St. Anna Trough on 22–26 August 2021. The red station numbers indicate locations of the FSBW cores.
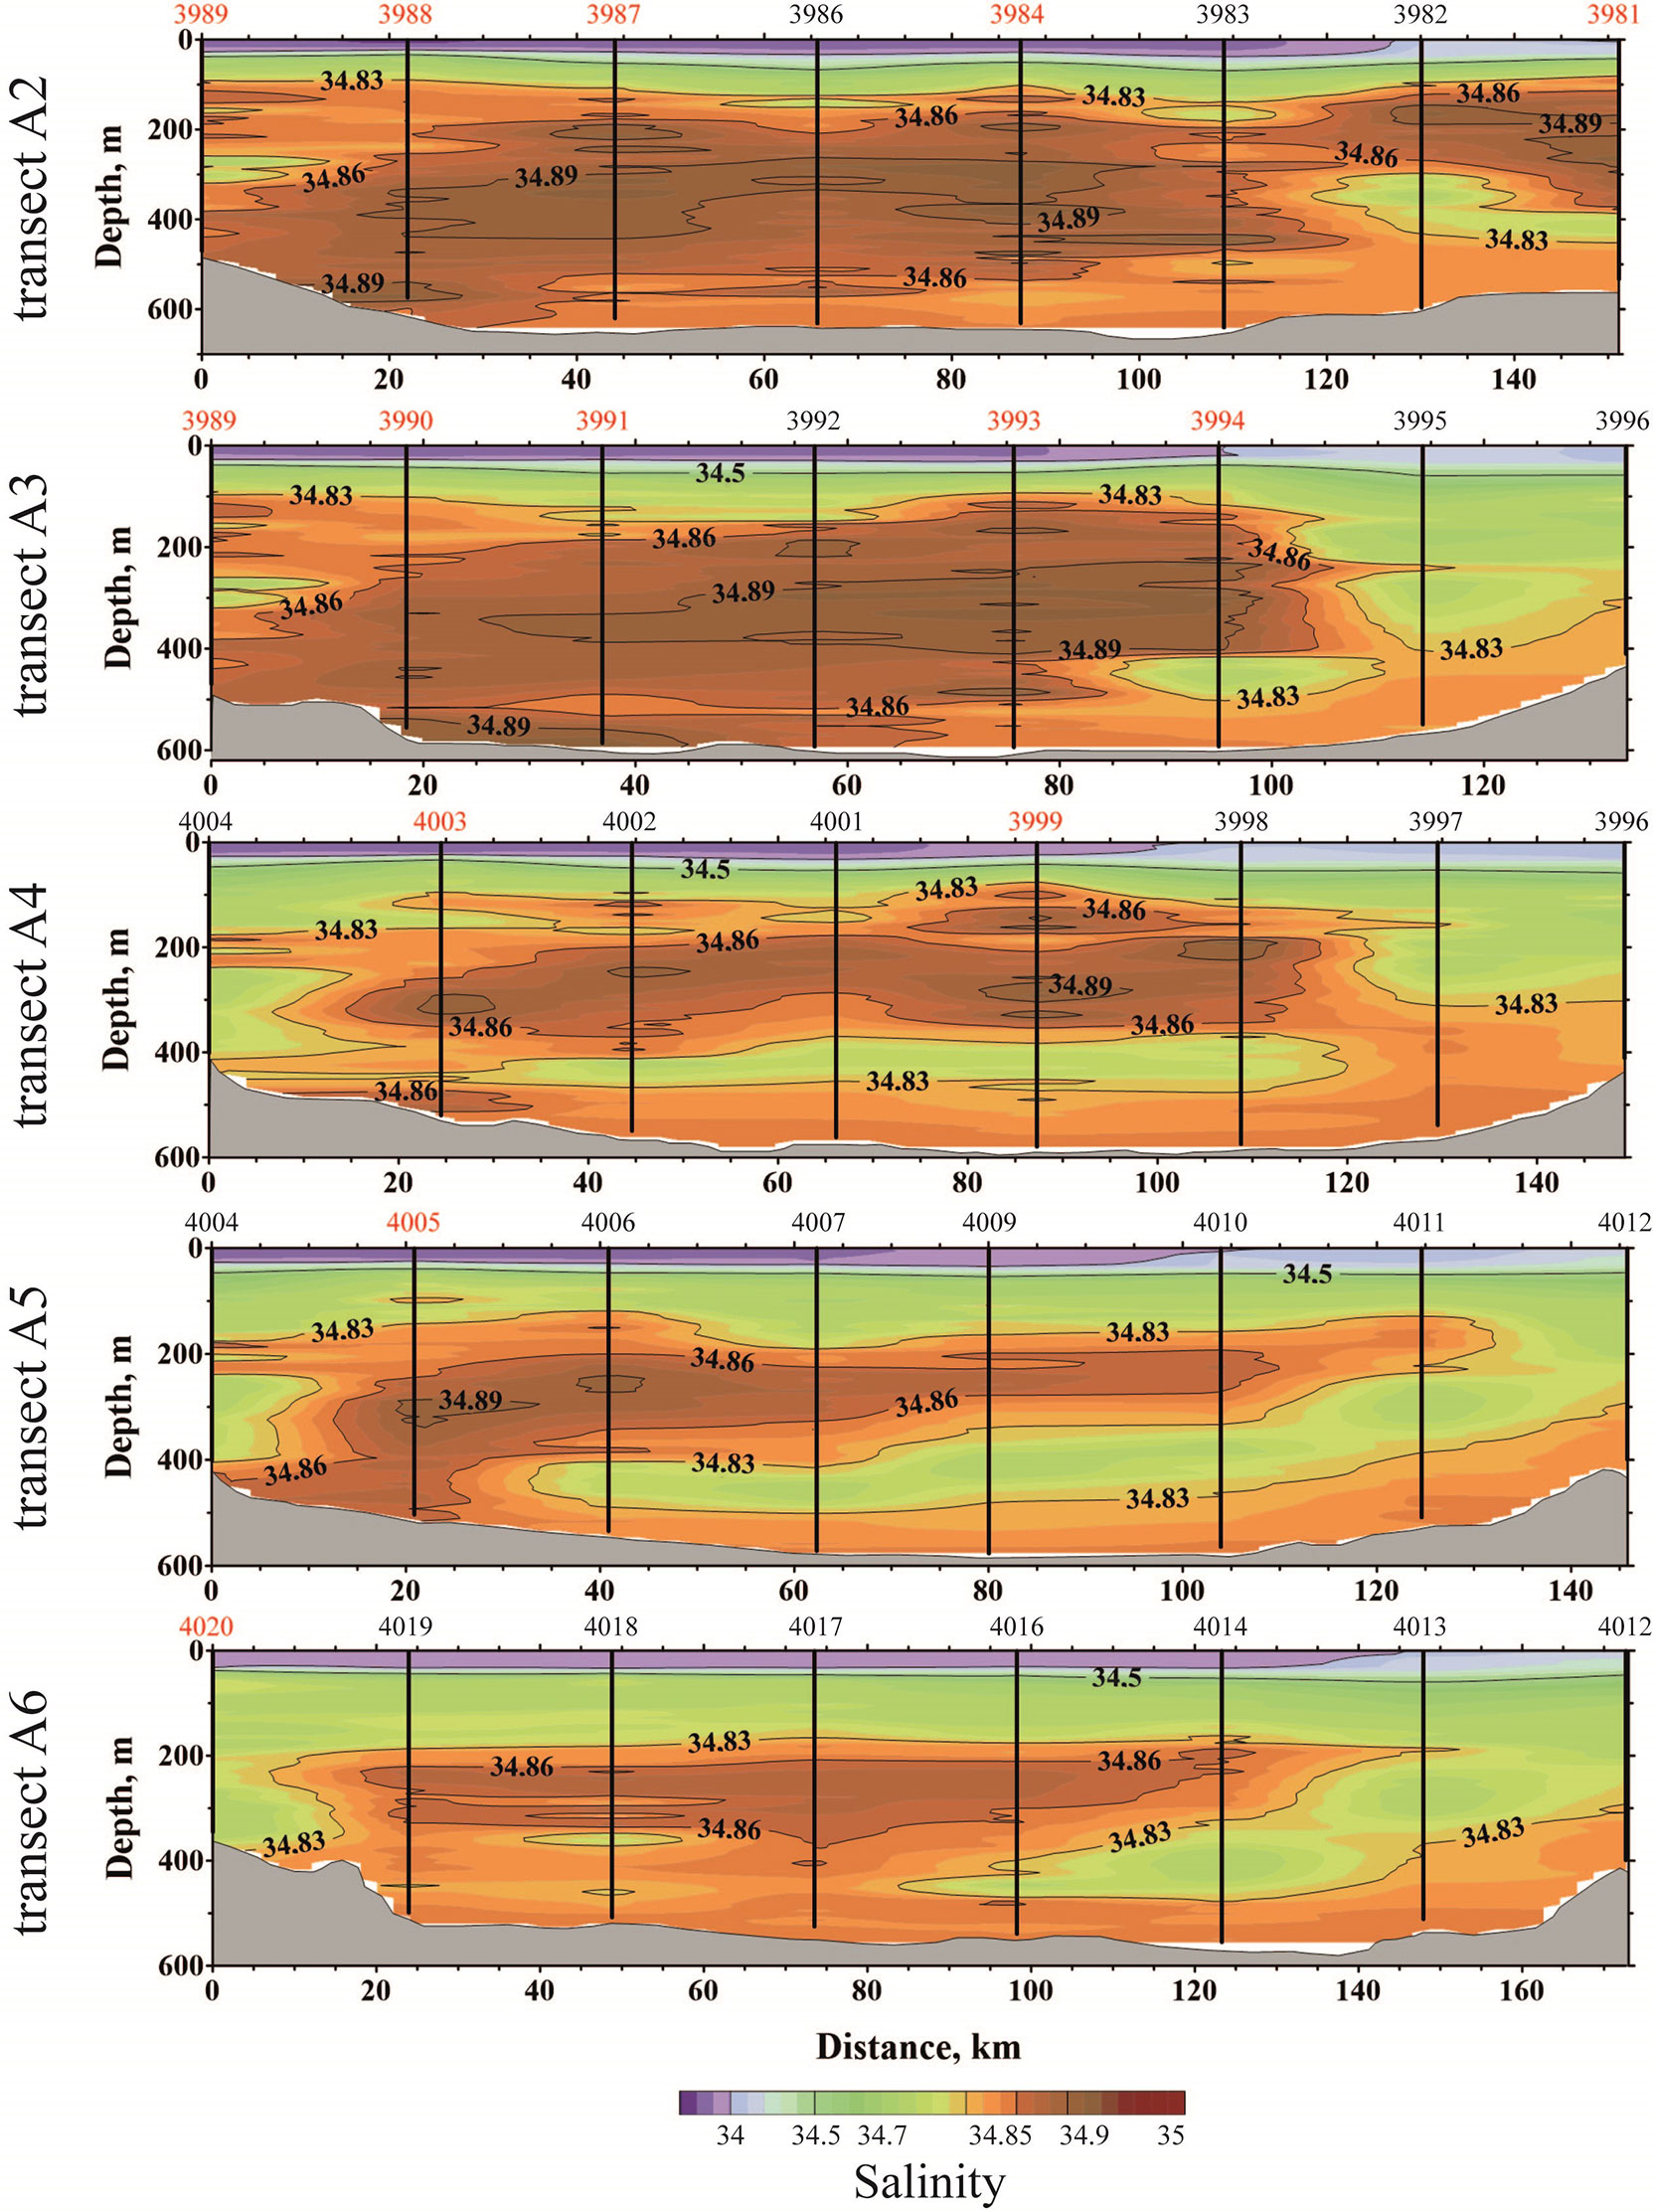
Figure 3 The vertical salinity structure along transects A2–A6 in the St. Anna Trough on 22–26 August 2021. The red station numbers indicate locations of the FSBW cores.
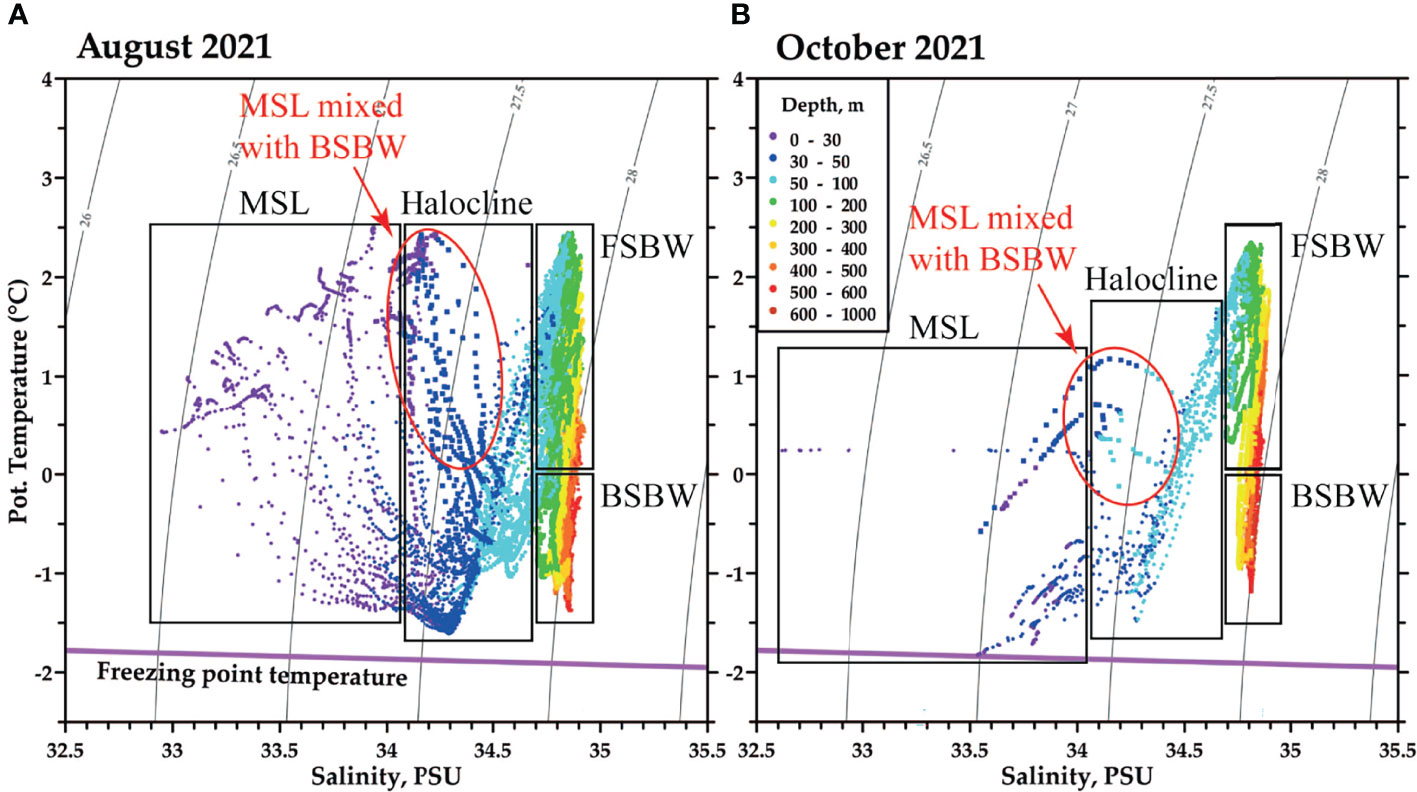
Figure 4 Temperature–salinity diagrams including the freezing point temperature (magenta line) and sigma-contours (gray lines) at the hydrographic stations in the St. Anna Trough at (A) transects A2–A6 on 22–26 August 2021 and (B) transects B1 and B2 on 18–21 October 2021. Circles mark measurements at stations in the central and western parts of the trough; squares mark measurements at stations in the eastern part of the trough.
The most saline (S >34.7) and dense Atlantic water is located below the halocline with a distinct difference between warm FSBW (>2°C in the core) and cold BSBW (<−1°C in the core). In this paper, we distinguish these water masses by the isotherm of 0°C, i.e., BSBW is colder than 0°C and centered at σ0 ~28 kg/m3, while FSBW is warmer than 0°C and centered at σ0 ~27.85 kg/m3, following a previous comprehensive study by Dmitrenko et al. (2015). This exact partition is somewhat arbitrary; however, it does not affect the analysis presented in this study.
Thermohaline structure in the St. Anna Trough observed in August 2021 is consistent with previously reported in situ measurements in this area (Schauer et al., 2002; Lien and Trofimov, 2013; Dmitrenko et al., 2014; Dmitrenko et al., 2015). FSBW is manifested by 1–3 cores of warm water located at the intermediate depths. In August 2021, we detected three warm cores at the northernmost transect A2 (at 81.5–82°N), two warm cores at transects A3 and A4 (at 80.5–81.5°N) and one warm core at transects A5 and A6 (at 79.5–80.5°N). The configuration of cores indicates the inflow of FSBW from the continental slope along the western flank of the trough, its reversal between transects A4 and A5, i.e., at the latitude of ~80.5°N, and the outflow of FSBW along the central part of the trough. A portion of the FSBW water did not reverse in the southern part of the trough and propagated further southward to the northeastern part of the Barents Sea (Skagseth et al., 2008; Lien and Trofimov, 2013).
However, the only questionable issue in this scheme is the origin of the three cores at transect A2. Three cores at the northern part of the trough were previously observed in September 2009 (Figure 3A in Dmitrenko et al., 2015). Dmitrenko et al. (2015) proposed that the third core is the meander of the alongslope boundary current, which does not propagate far southward to the trough (yellow arrows in Figure 1B in Dmitrenko et al., 2015). However, the measurements analyzed in that paper were limited to two zonal transects across the trough at the latitudes of 81 and 82°N, so this hypothesis was not supported by tracing all three cores northward to the slope or southward to the central part of the trough. Note that all field surveys in the central part of the trough (in 1994, 1996, 2008, 2009, 2010, 2013, and 2015, most of them in the framework of the NABOS program) revealed two cores in the central part of the trough, i.e., the absence of the third core (Ivanov et al., 1999; Schauer et al., 2002; Schauer et al., 2002b; Lien and Trofimov, 2013; Dmitrenko et al., 2015).
Good spatial coverage of in situ measurements in the study area in August 2021 provided an opportunity to trace the inflow and outflow streams of FSBW and to examine the hypothesis about the meandering of the boundary current. If the central warm core at transect A2 is the meander (which does not propagate further southward to the trough), then it should be isolated, i.e., not connected with any core at transect A3. At the same time, the eastern warm cores at transects A2 and A3 should be connected, manifesting the outflow of FSBW from the trough.
However, in situ measurements show a completely different configuration of the warm cores at transects A2 and A3. The core of the FSBW outflow at transect A3 (station 3994) is located exactly southward of the central warm core at transect A2 (station 3984). The eastern warm core at transect A2 (station 3981) is located ~50 km eastward from the core of the FSBW outflow. In addition, both the inflow and outflow streams of FSBW are well developed at transects A3 and A4, and the vertical size of their cores (>2°C) is 50–100 m. The same is observed for the western and central cores at transect A2, while the eastern core is significantly smaller, with a vertical size of ~10 m. Based on this data, we presume that the northward outflow stream of FSBW splits into two flows at the area between transects A3 and A2. The majority of FSBW water flows northward at the central part of the trough, while smaller fraction flows northeastward along the isobaths of 400–500 m. Note that a similar configuration with large western and central warm cores and small eastern warm cores was also observed in September 2009 (Figure 3A in Dmitrenko et al., 2015).
The observed configuration of warm cores at transects A2 and A3 contradicts the circulation scheme with meandering of the alongslope boundary current described by Dmitrenko et al. (2015) but proposes two new possible circulation schemes at the northern part of the trough. The first scheme is that the central warm core at transect A2 is the outflow of FSBW from the trough that flows further northward to the continental slope, while the eastern core is the meander of the alongslope current. The second scheme is that the eastern warm core is the outflow of FSBW from the trough to the continental slope, while the central warm core is the meander of FSBW from the south, which further merges with the inflow of FSBW. Note that the second scheme proposes that FSBW forms a recirculating cyclonic gyre within the trough; i.e., most of the northward flow of FSBW along the eastern flank of the trough reverses at the northern part of the trough and returns to the trough along its western flank. As a result, only a small fraction of FSBW water is transported off the trough to the continental slope, while the majority remains in the cyclonic gyre within the trough.
The location of the cores of the inflow and outflow streams of FSBW at transects A2–A5 supports the second proposed circulation scheme, which is illustrated by the horizontal temperature distribution in the trough at the depths of 100 and 150 m (Figures 5C, D). The distance from the outflow core of FSBW to the eastern slope of the trough decreases from 60 km (transect A4) to 40 km (transect A3) and then abruptly changes to 60/10 km (central/eastern warm core at transect A2), which indicates the presence of the gyre circulation.
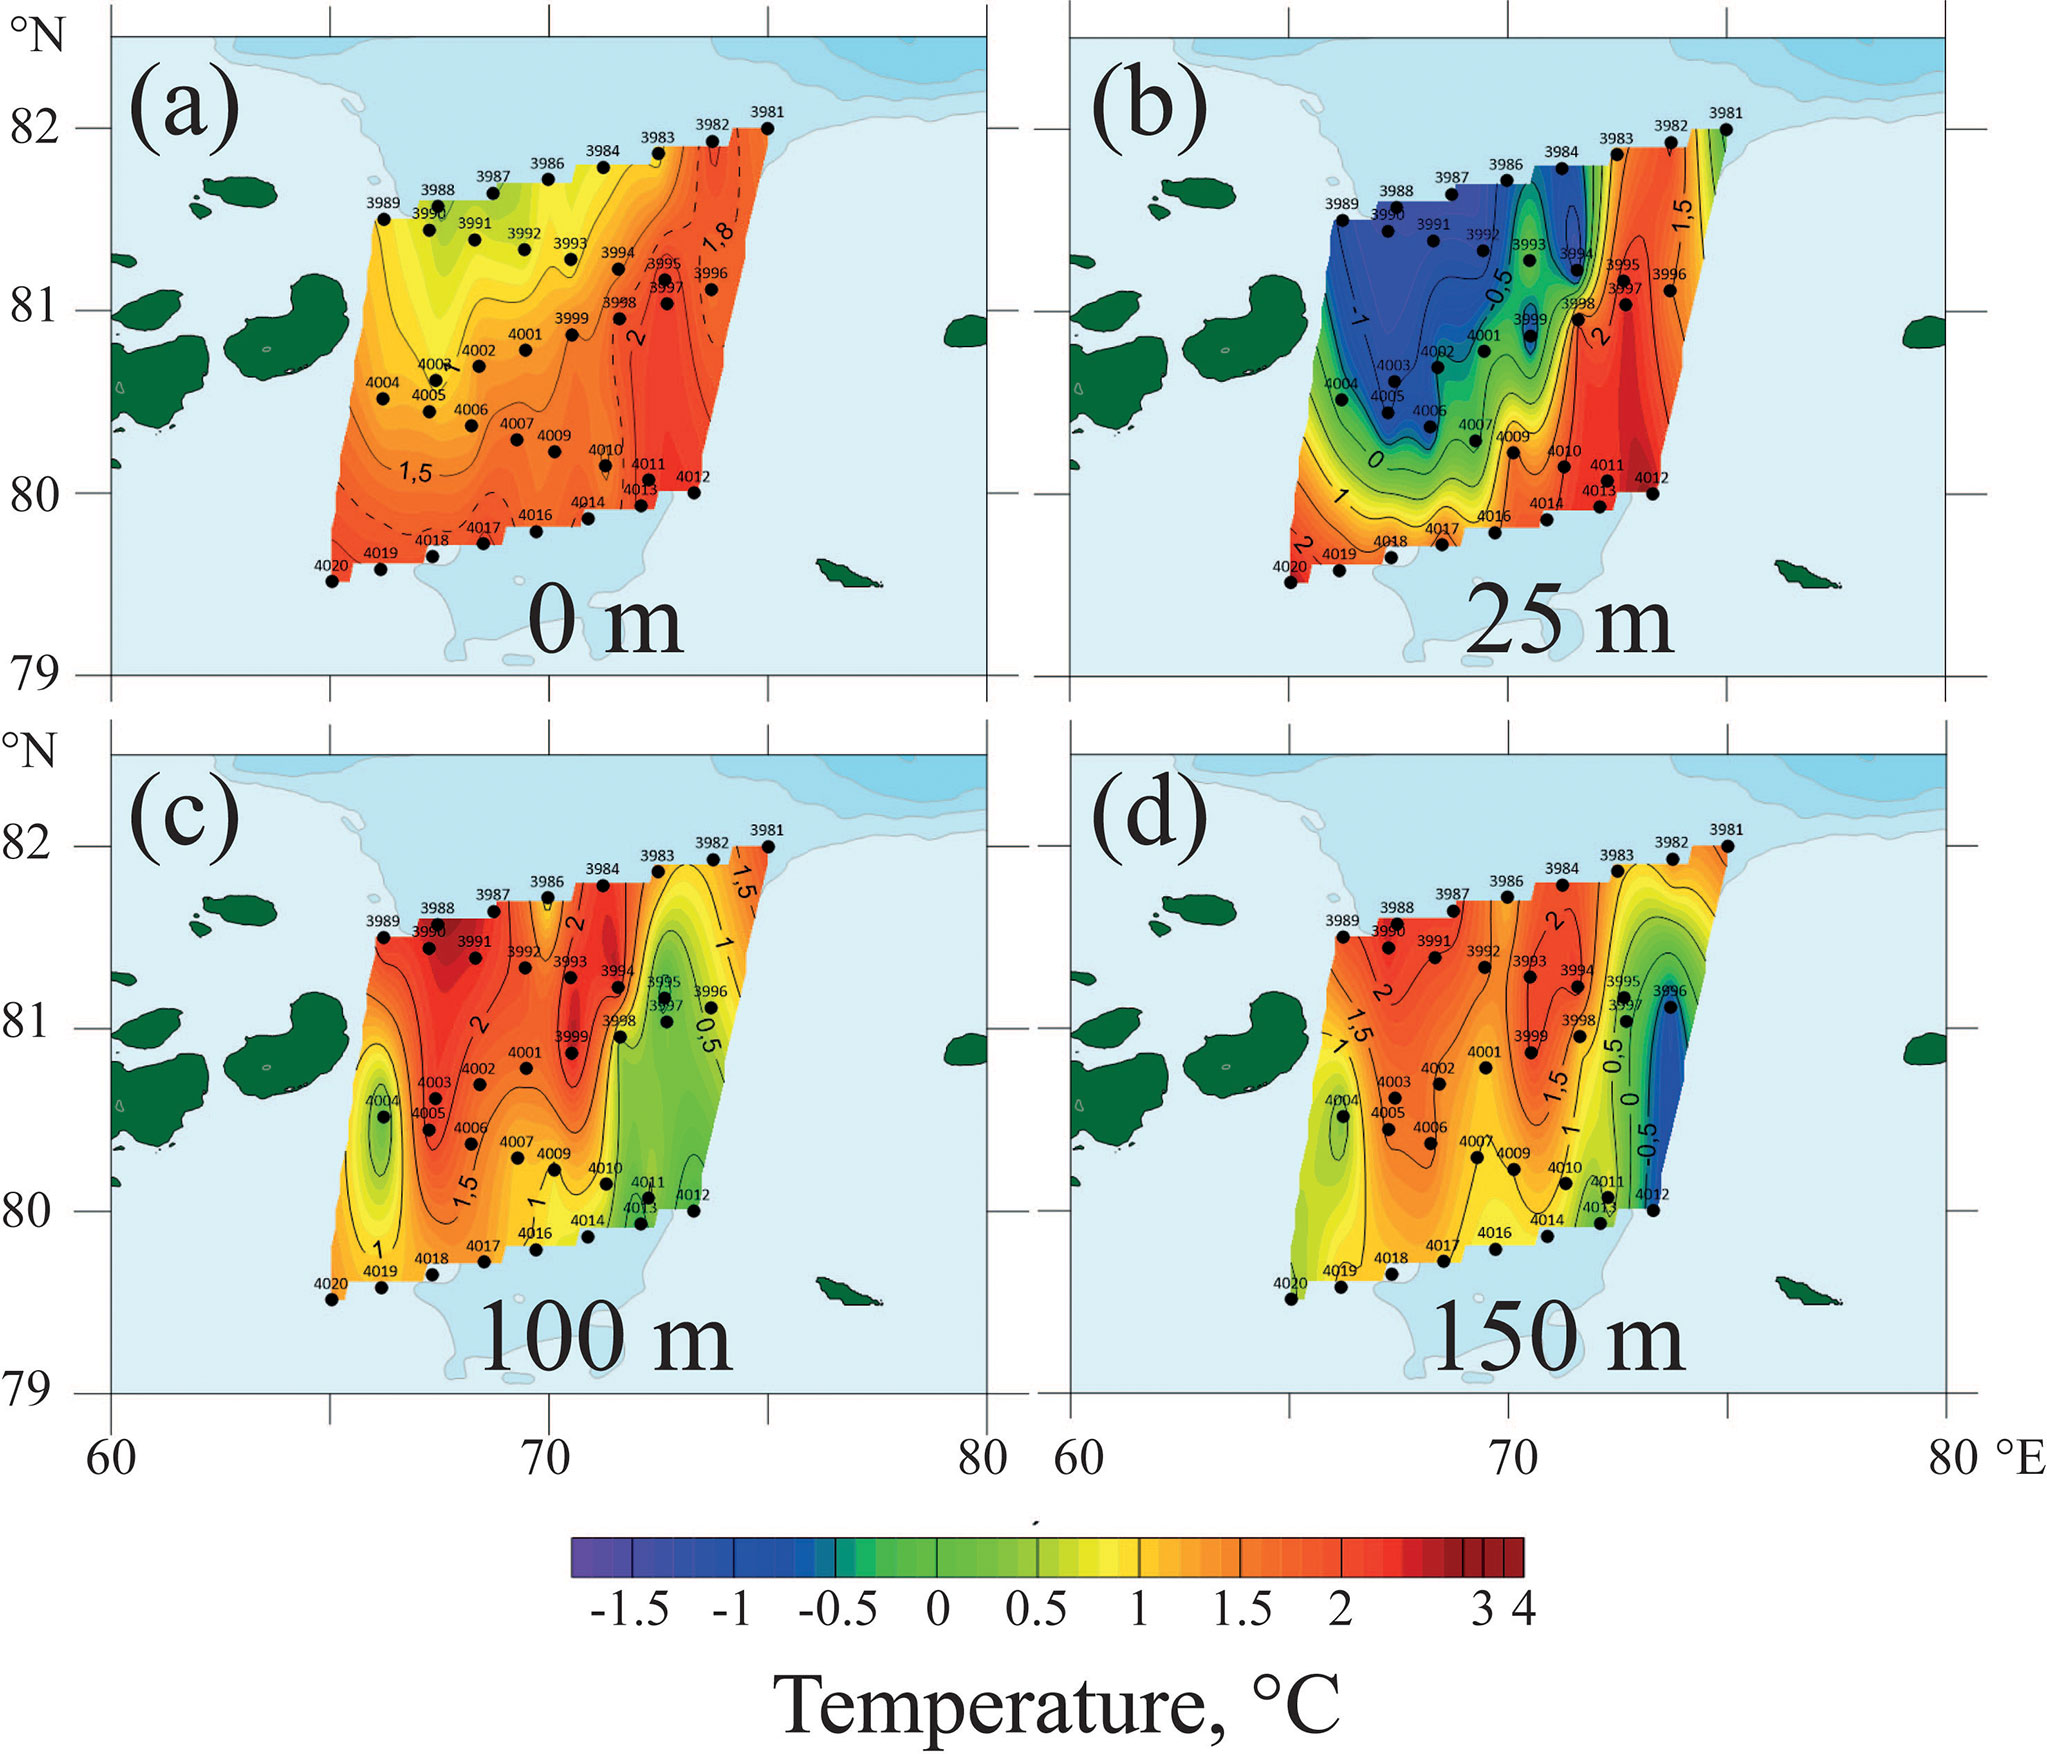
Figure 5 Horizontal temperature structure in the St. Anna Trough on 22–26 August 2021 at the depths of (A) 0 m, (B) 50 m, (C) 100 m, and (D) 150 m.
The second circulation scheme consists of, first, the western inflow and the eastern outflow FSBW streams that connect the St. Anna Trough with the continental slope and, second, the cyclonic FSBW gyre within the trough. Therefore, the zonal transect at the northern part of the trough can cross these FSBW streams four times from west to east: (1) the FSBW inflow, (2) from outside to inside the FSBW gyre, (3) from inside to outside the FSBW gyre, and (4) the FSBW outflow. To check this assumption, we performed a second field survey in the northern part of the trough in October 2021, i.e., two months after the first field survey. Vertical thermohaline measurements were organized at the northern part of the proposed FSBW gyre and crossed it by zonal (transect B1) and meridional (transect B2) transects (Figure 1B).
The vertical temperature and salinity structure along the transects B1 and B2 supported the second circulation scheme (Figures 6, 7). The zonal transect indeed crossed the FSBW streams four times, which is indicated by the four warm cores in Figure 6A. The western and eastern warm cores, which correspond to the inflow and outflow FSBW streams, were significantly smaller than both central warm cores at the FSBW gyre. The meridional transect B2 crossed the northern part of the FSBW gyre, indicated by the warm core (Figure 6). Note that both the southern and northern ends of transect B2 (stations 7224 and 7243) were outside the warm core, which indicates that this flow is not the outflow of FSBW but is a part of the FSBW gyre.
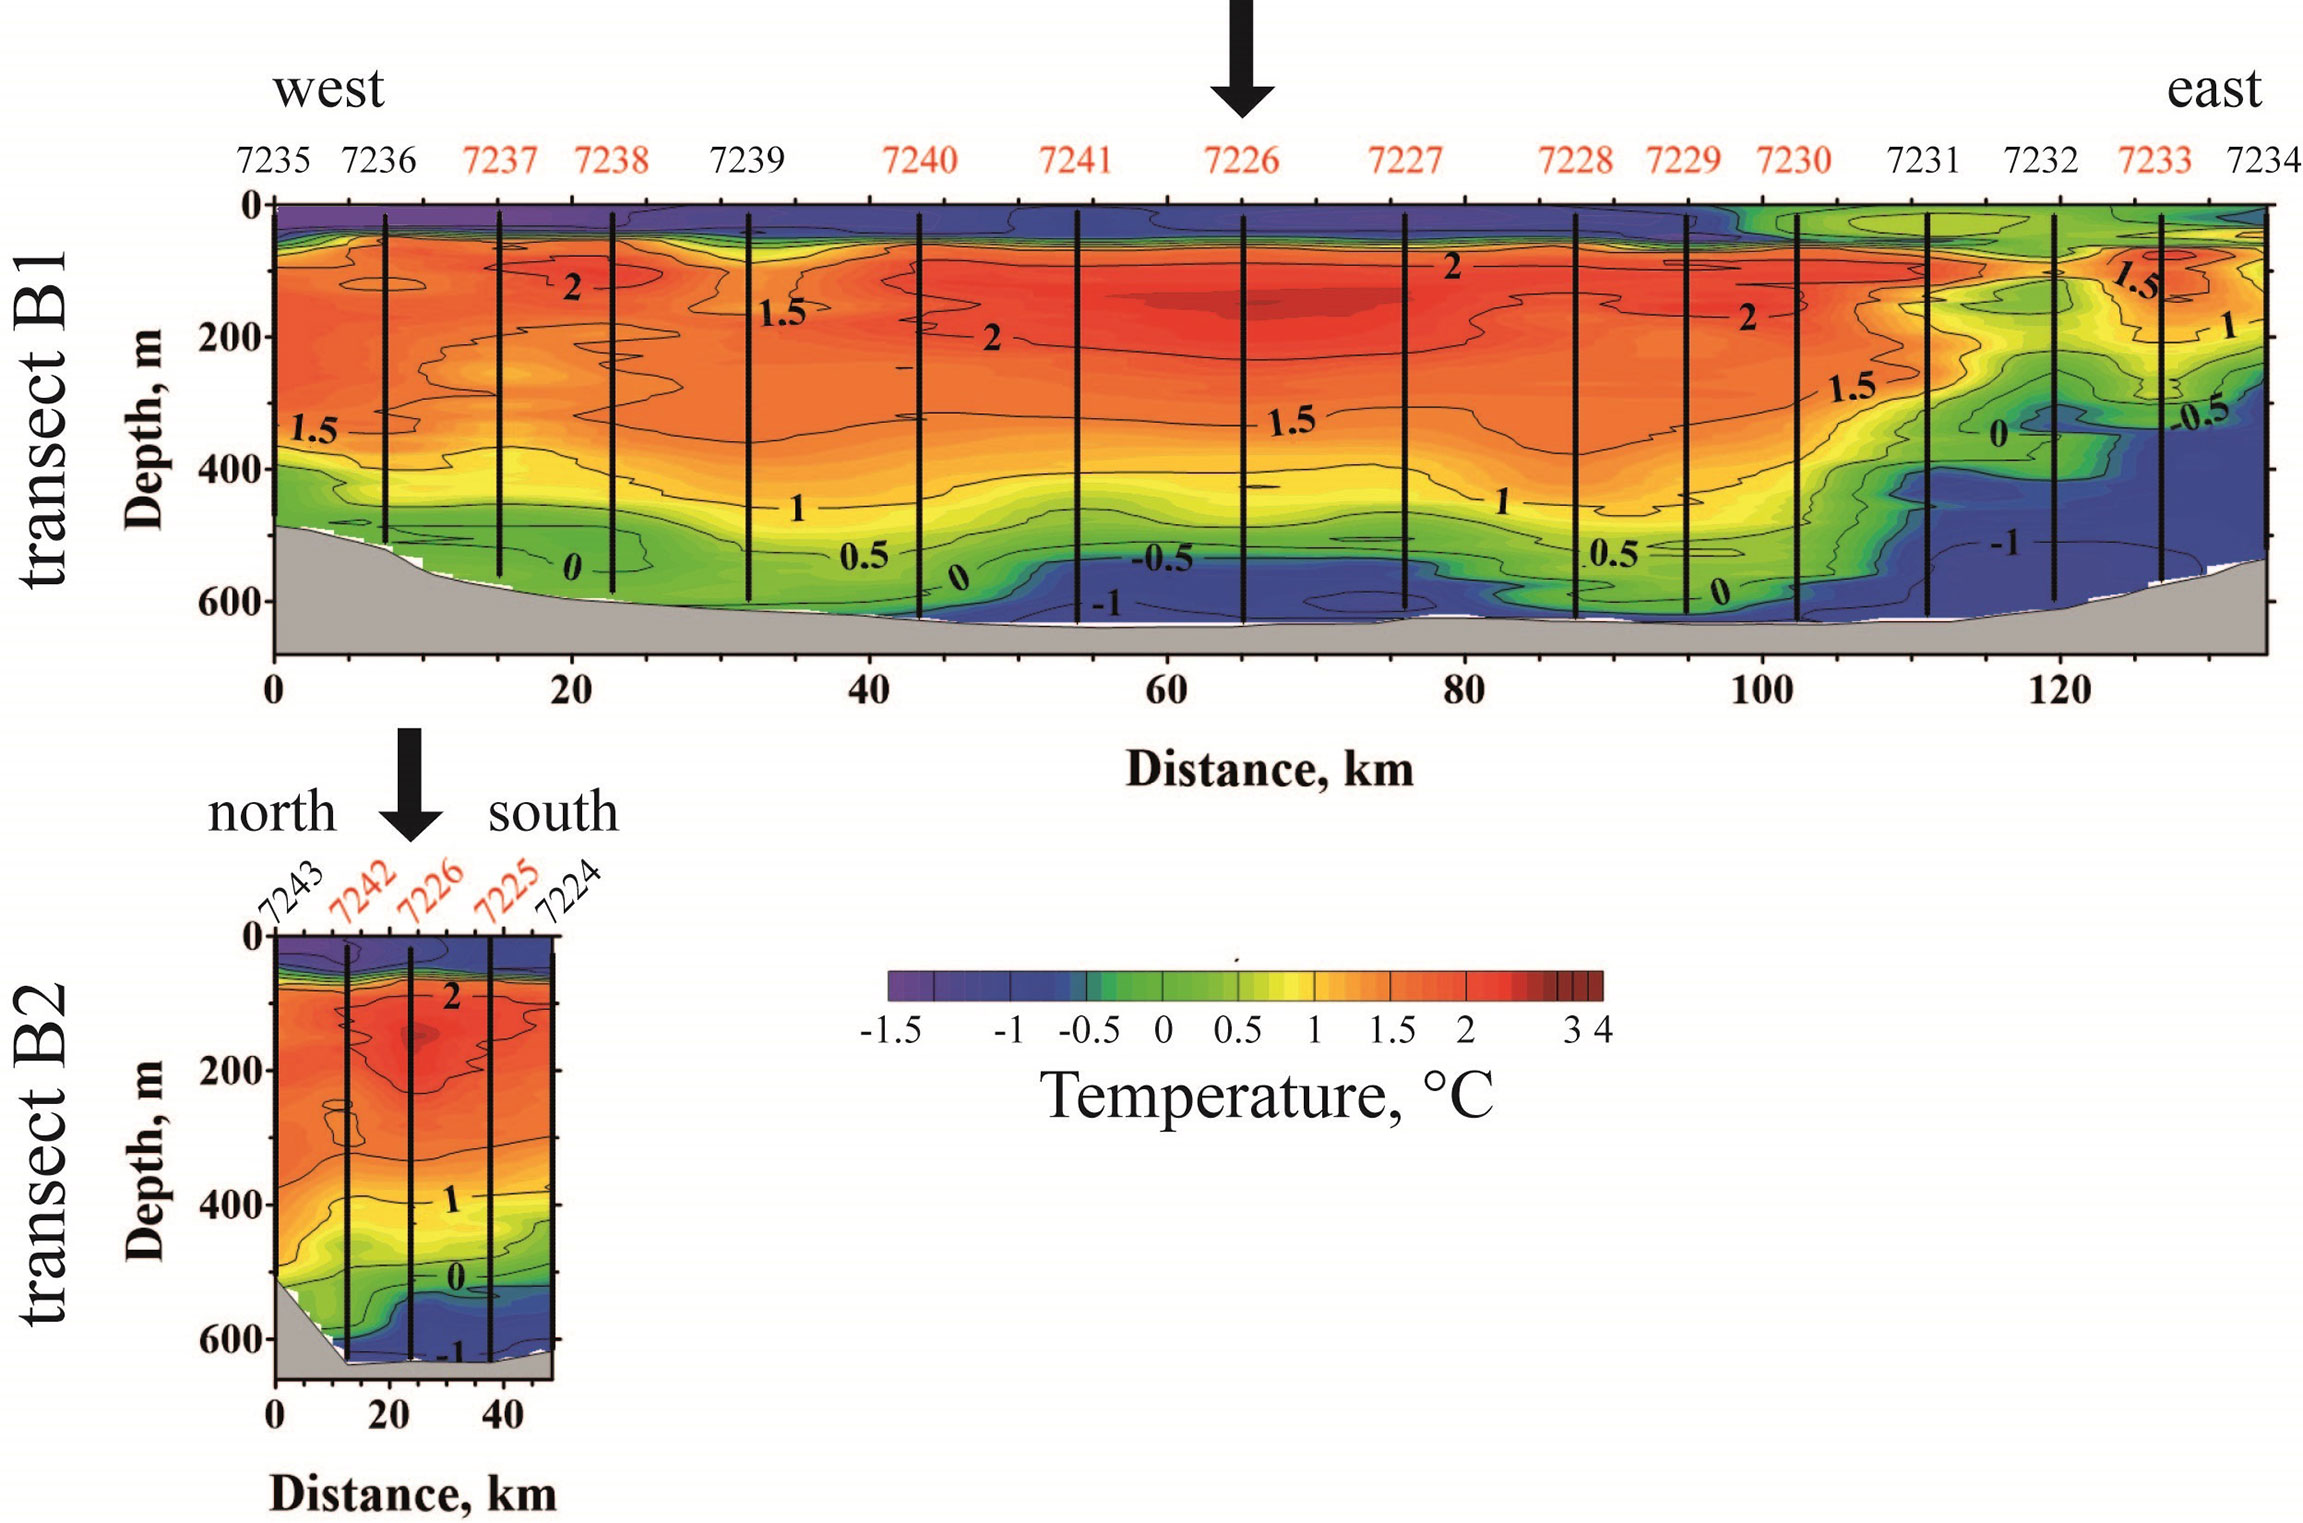
Figure 6 The vertical temperature structure along transects B1and B2 in the St. Anna Trough on 18–21 October 2021. The black arrows indicate the intersection of transects B1 and B2. The red station numbers indicate locations of the FSBW cores.
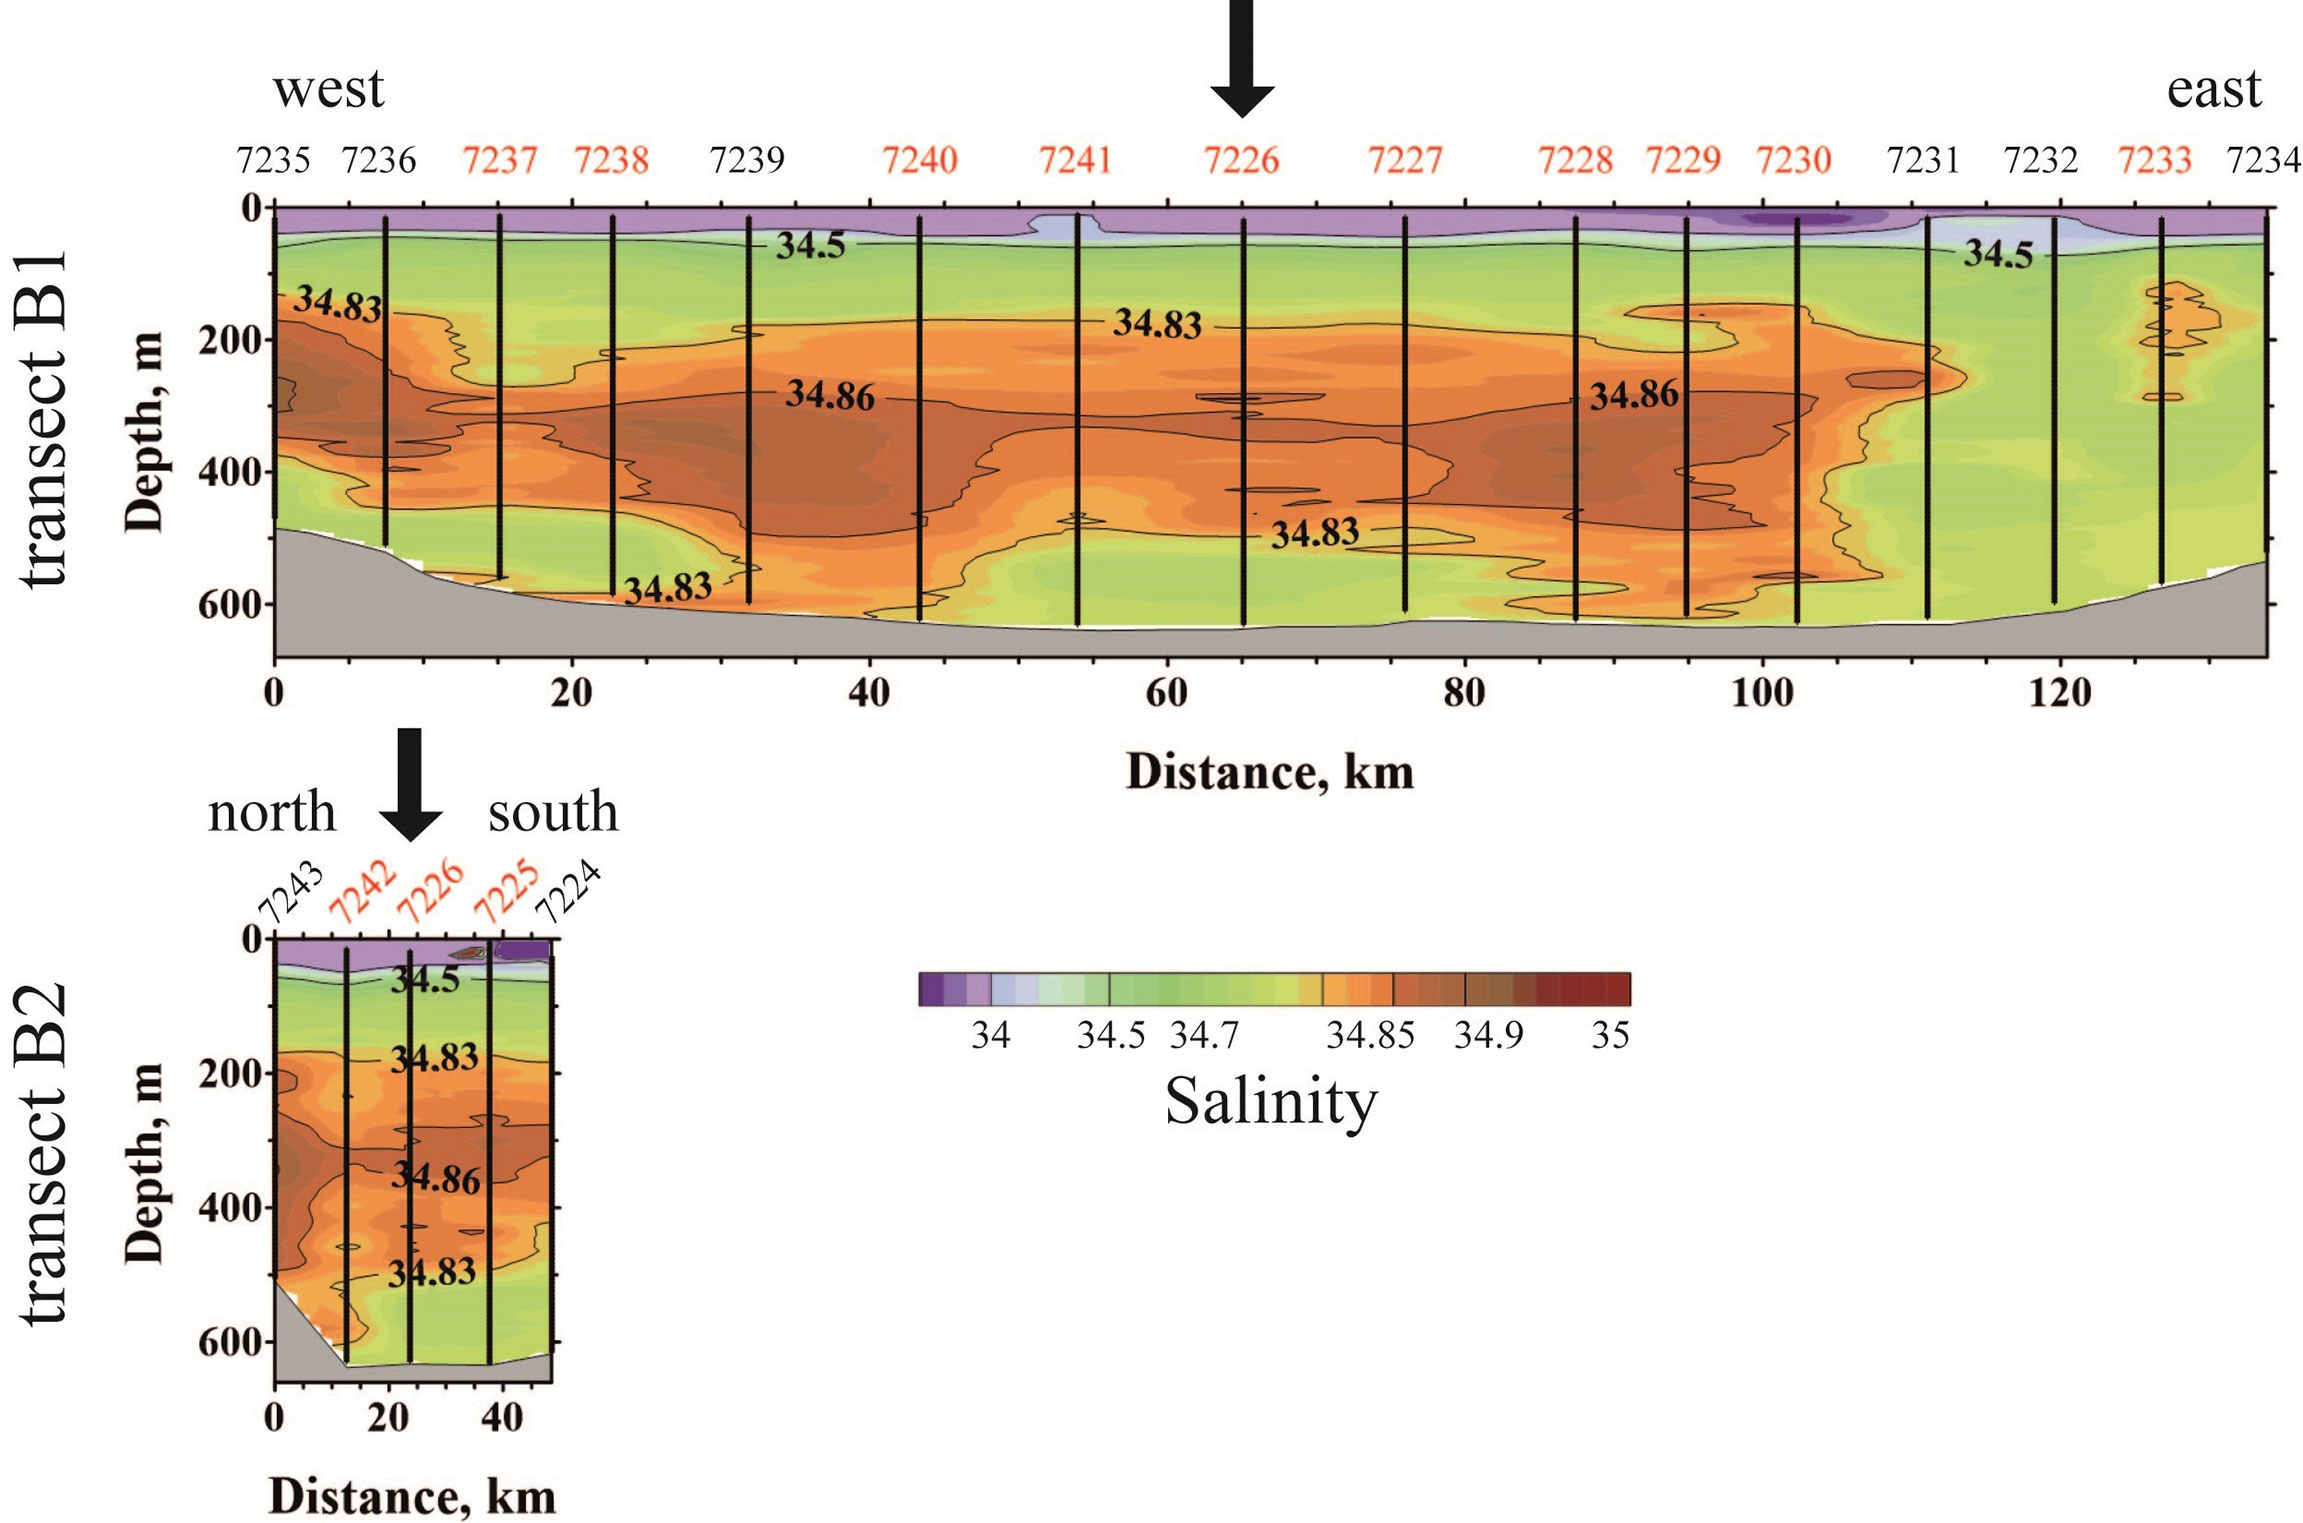
Figure 7 The vertical salinity structure along transects B1 and B2 in the St. Anna Trough on 18–21 October 2021. The black arrows indicate the intersection of transects B1 and B2. The red station numbers indicate locations of the FSBW cores.
To verify the presence of the FSBW gyre and to visualize the general circulation scheme in the St. Anna Trough, we calculated the geostrophic currents in the trough based on the thermohaline measurement data (for the baroclinic component) and the synchronous satellite-derived absolute dynamic topography (ADT) (for the barotropic component) (Figures 8, 9). The zero velocity level for the baroclinic component was prescribed at a depth of 30 m, i.e., below the mixed surface layer and above the Atlantic water flow (Ivanov et al., 1999). The geostrophic currents were calculated only for the transects of the field survey on 22–26 August 2021 because in October 2021 the marginal ice zone occupied the study area during the field work, which resulted in the inappropriate quality of the satellite ADT maps. The baroclinic currents (and, therefore, the total geostrophic currents) were calculated, first, perpendicular to the transect lines (Figure 9A) and, second, interpolated to the whole study area (Figure 9B).
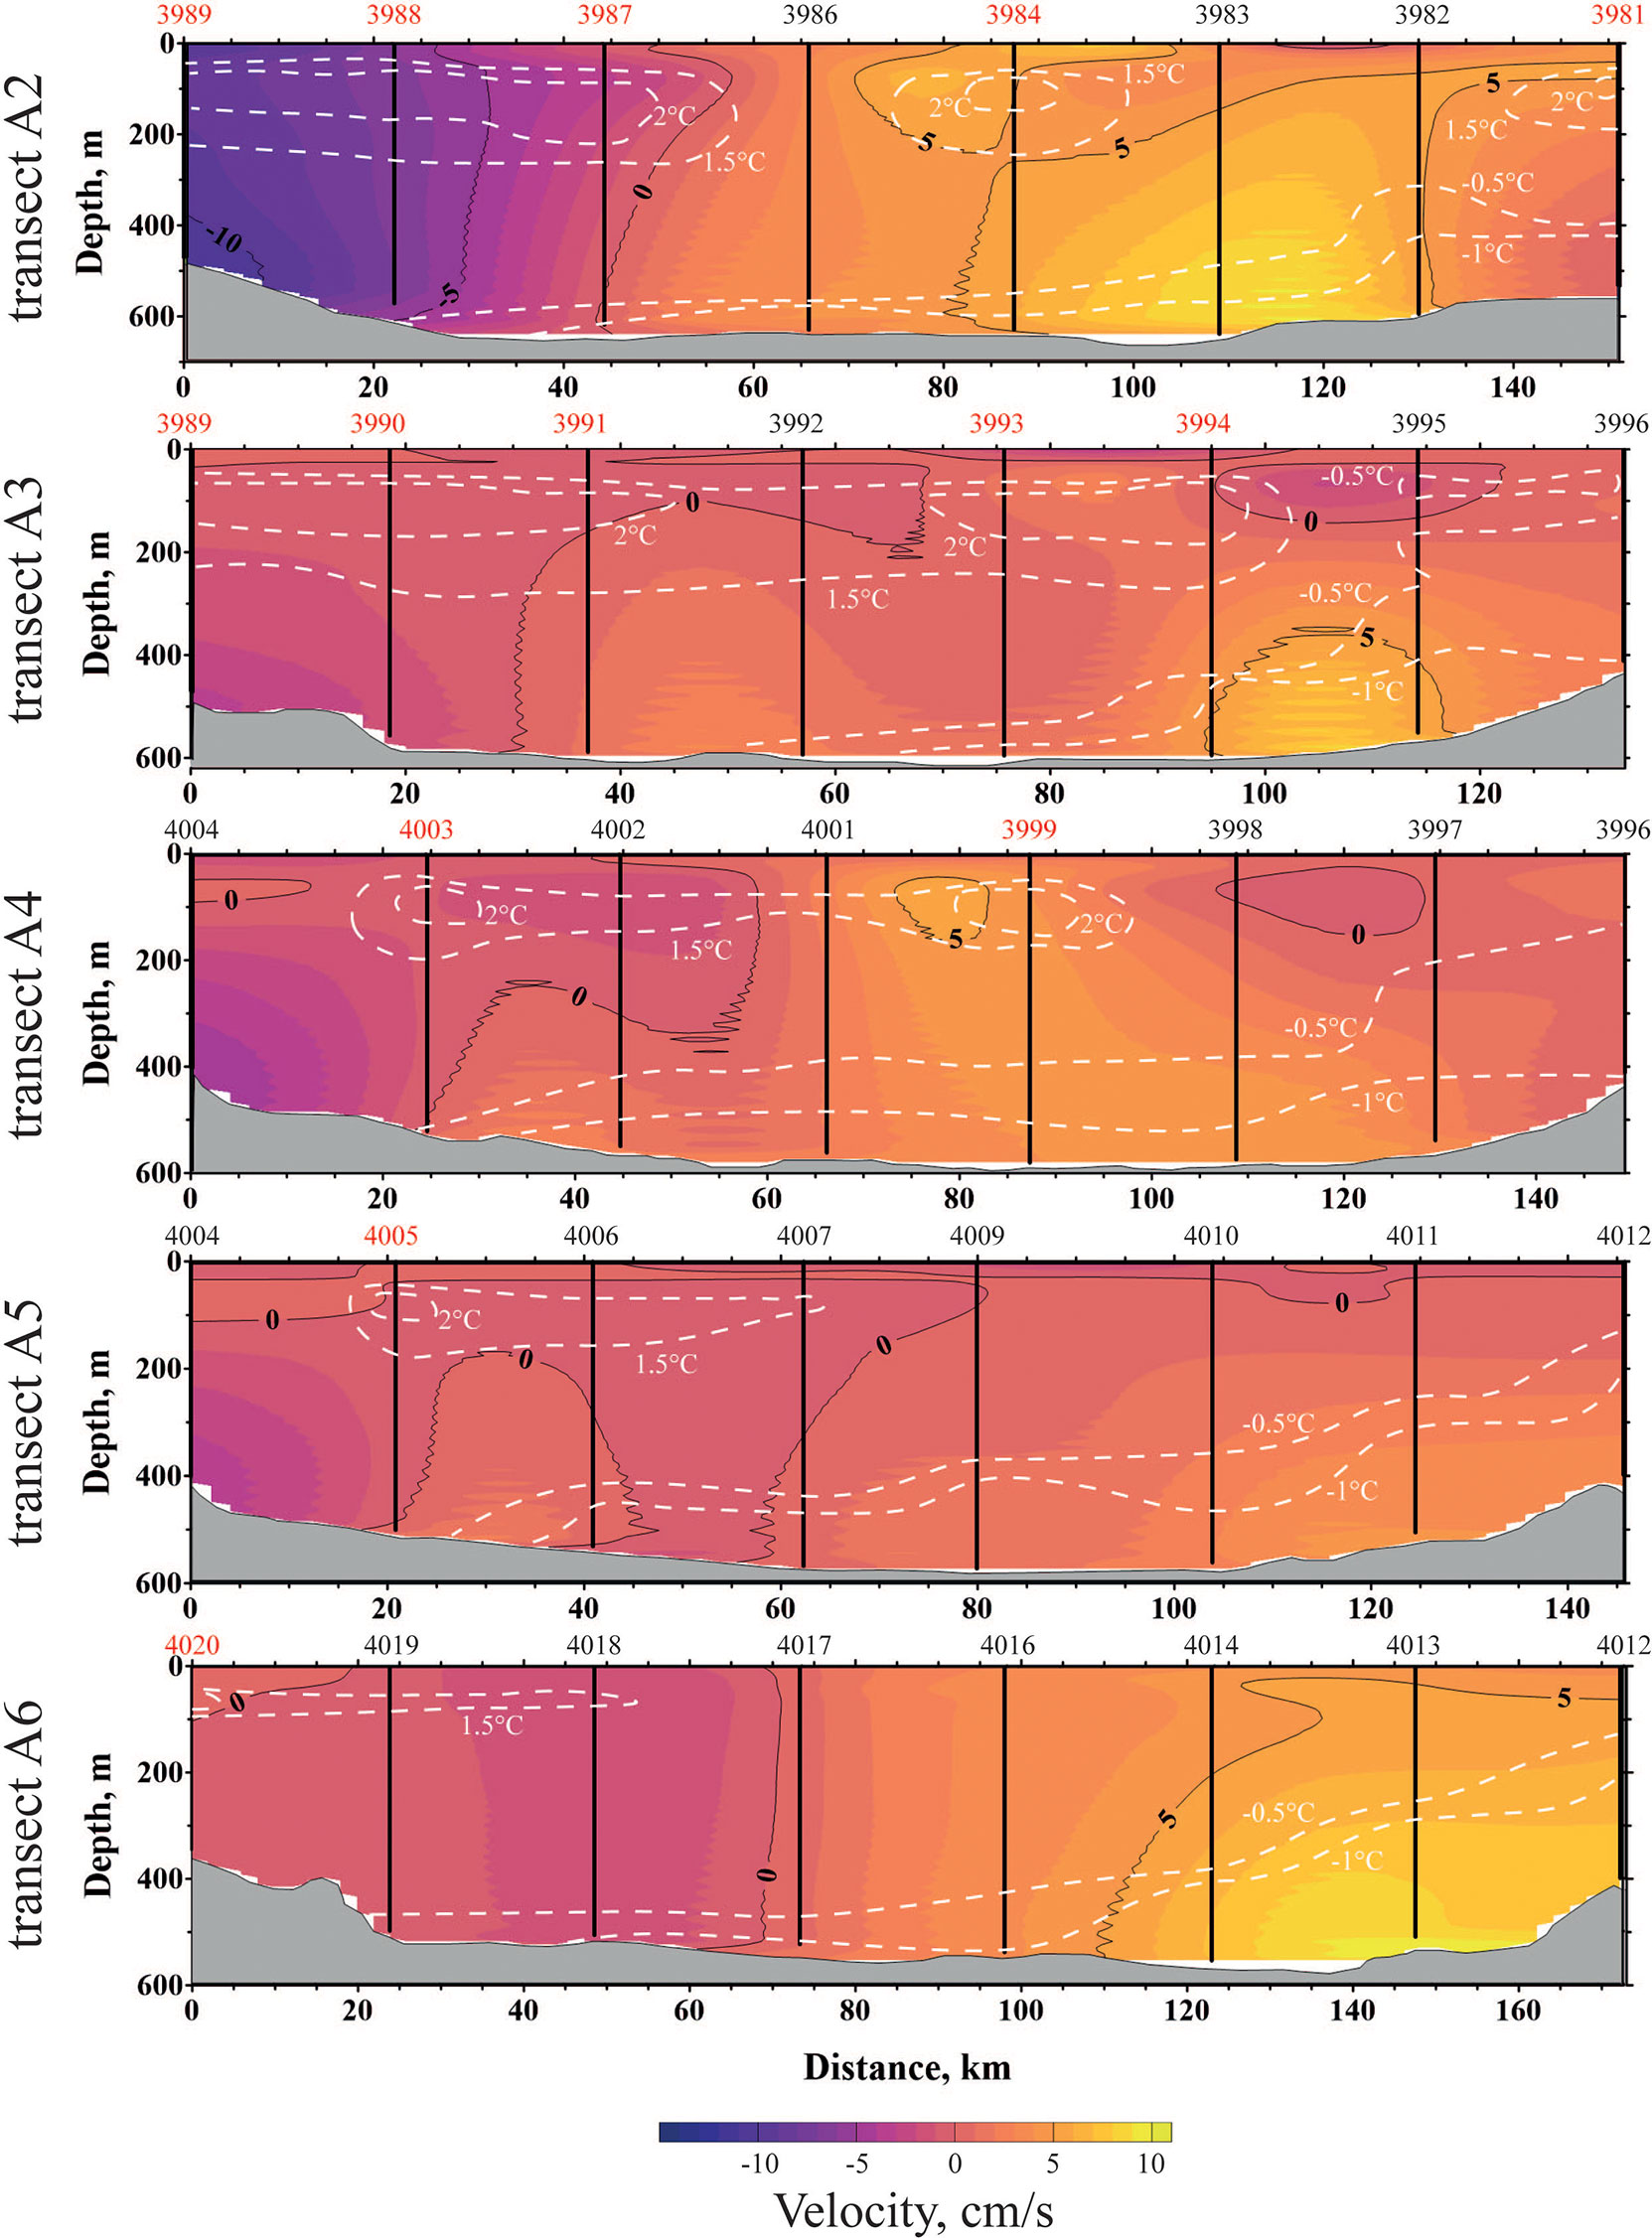
Figure 8 The sum of baroclinic and barotropic components of geostrophic current along transects A2–A6 in the St. Anna Trough on 22–26 August 2021. Note that the current velocity is shown perpendicular to the transect lines. The white dashed lines indicate isotherms of −1, −0.5, 1.5, and 2°C to show the locations of FSBW and BSBW cores. The red station numbers indicate locations of the FSBW cores.
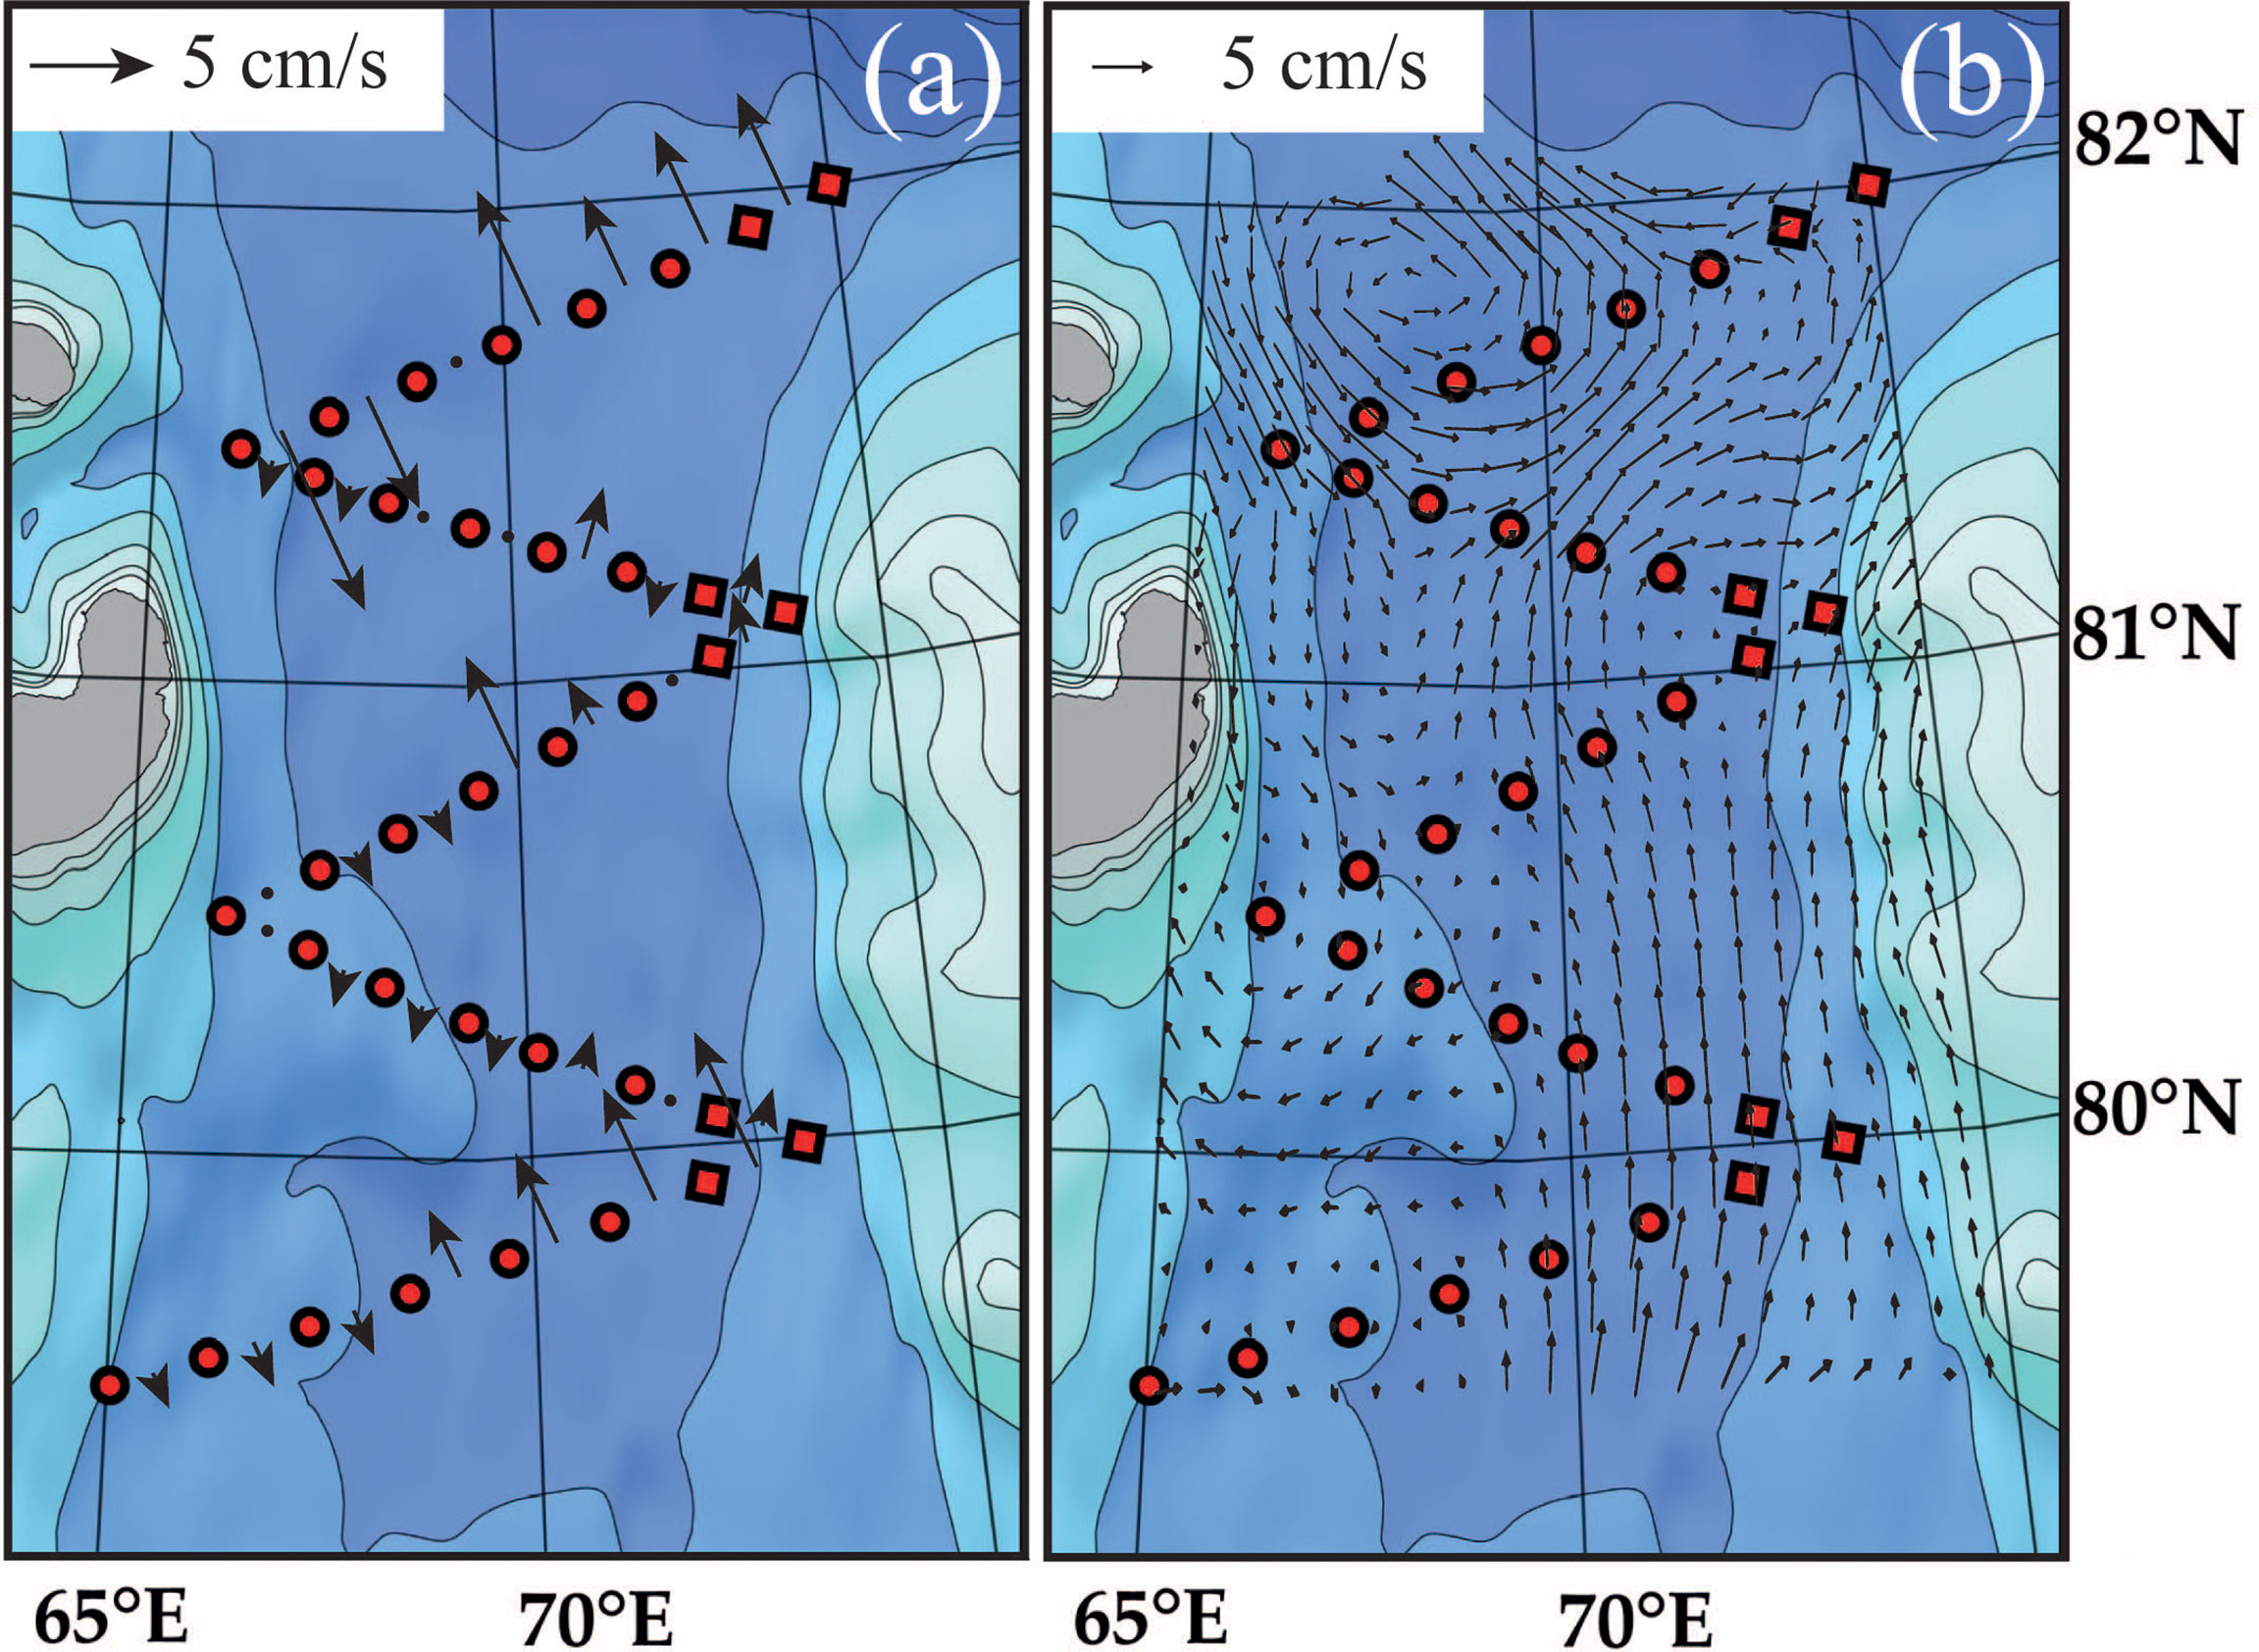
Figure 9 Geostrophic currents at the depth of 100 m: (A) cross-transect components and (B) interpolated to the whole study area illustrating FSBW flow in the St. Anna Trough on 22–26 August 2021.
Figure 8 demonstrates the resulting geostrophic currents across the transect on 22–26 August 2021, with an indication of the locations of the FSBW and BSBW cores. The general flow direction is southward in the western part of the trough and northward in the central and eastern parts. The maximal velocities are observed in the bottom layer in the eastern part and are associated with the BSBW flow. Velocities of FSBW are lower, albeit they show the distinct southward flow of the western warm core at transects A2–A4 and further residual southward outflow of FSBW from the trough toward the northeastern part of the Barents Sea at transects A5–A6. Figure 8 also demonstrates the northward flow of the eastern warm core at transects A3–A4 and, what is more important, the distinct northward flow of both the central and eastern warm cores at transect A2. Figure 9 illustrates the resulting FSBW flow at a depth of 100 m in the trough on 22–26 August 2021. The obtained results confirm the origin of the three warm cores at transect A2 and verify the proposed recirculation of FSBW in the St. Anna Trough. The geostrophic currents also show that the flow in the central warm core at transect A2, i.e., the FSBW gyre, is somewhat more intense than the flow in the eastern warm, i.e., FSBW outflow from the trough.
Finally, we applied the satellite ADT date with spatial resolution of 0.25° to detect the presence of the cyclonic FSBW gyre in the St. Anna Trough. The flow of Atlantic Water is not a surface current, however, it could have surface manifestations which are visible in satellite altimetry data. The ADT distribution averaged during the period of field work on 22–26 August 2021 is presented in Figure 10A. It clearly demonstrates the cyclonic FSBW gyre in the northern and central parts of the trough (65–70° E, 81–82° N) manifested by the decreased sea level.
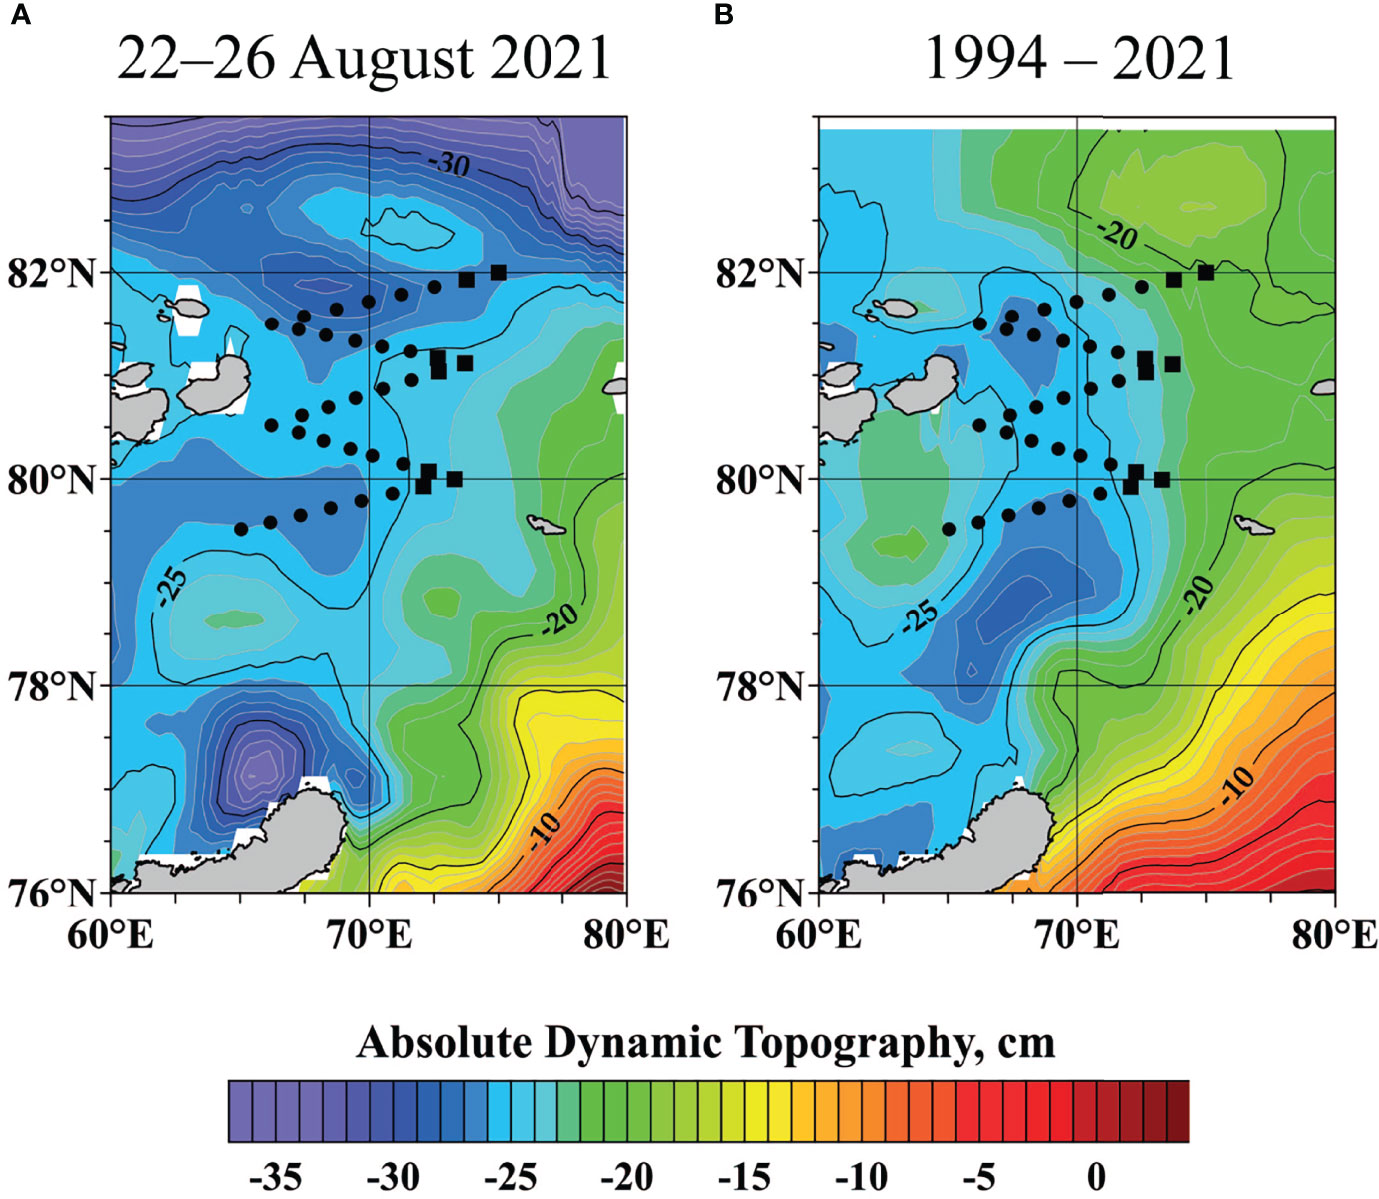
Figure 10 Absolute dynamic topography maps in the northern part of the Kara Sea from near real-time gridded altimetry data (A) averaged during the period of field survey 22–26 August 2021 and (B) averaged during ice-free and low wind forcing (wind speed <6 m/s) in 1994–2021.
To check whether this cyclonic eddy is a stationary and persistent feature in the northern part of the trough, we analyzed the ADT data during the ice-free periods in 1994–2021. We revealed that the decreased sea level associated with the FSBW gyre is regularly observed on ADT maps, albeit this manifestation is unstable and is often blurred or not present. We presume that this instability in the manifestation of the gyre in ADT maps is caused by the relatively low velocity of the FSBW gyre and the resulting small difference in sea level between the center and periphery of the eddy (3–5 cm). As a result, this small sea-level gradient in the trough could be distorted by the wind forcing, which causes a shift of the sea-level minimum from the eddy center (Frey and Osadchiev, 2021). The relatively narrow St. Anna Trough is sandwiched by land and/or shallow areas including the Franz Josef Land in the west and the Central Kara Plateau (<100 m deep) with Vize Island and the Ushakov Island (Figure 1B). As a result, even moderate zonal wind (which dominates meridional wind in the study area) modifies the sea surface height distribution and masks the manifestations of the gyre in the trough. The average wind speed during the field survey on 22–26 August 2021 was equal to 5.5 m/s, therefore the manifestation of the gyre was visible on the ADT map (Figure 10A).
Locations of stations are shown by black dots.Indeed, the average ADT distribution averaged during all ice-free and low wind forcing (<6 m/s) periods in 1994–2021 clearly demonstrates the cyclonic FSBW gyre in the trough (Figure 10B). Stable sea-level gradients are also observed along the eastern slope of the St. Anna Trough and further southward to the Novaya Zemlya, indicating the BSBW flow. This result confirms that the cyclonic gyre is a stationary and persistent feature in the northern part of the trough.
BSBW in the St. Anna Trough
Cold and dense BSBW occupied the intermediate and bottom layers along the eastern flank of the St. Anna Trough (Figures 2, 6). The lowest temperature of BSBW was equal to −1.1 to −1.2°C and was registered at the narrow bottom layer. The largest salinity of BSWB was equal to 39.83–39.85 and was also registered at the bottom layer (Figure 3). The intense northward flow of BSBW in the eastern part of the trough is in a geostrophic balance (Kirillov et al., 2012). Based on the thermohaline measurements in August 2021, we assessed the geostrophic velocity of BSBW as 5–10 cm/s (Figure 8). This result is in agreement with previous measurements of the velocity of the BSBW flow in the trough equal to 10–30 сm/s (Dmitrenko et al., 2014).
The thermohaline structure and circulation of BSBW in the St. Anna Trough observed in August and October 2021 agree with previous related studies (Schauer et al., 2002; Schauer et al., 2002b; Lien and Trofimov, 2013; Dmitrenko et al., 2014; Dmitrenko et al., 2015). The main new finding of this study related to BSBW addresses the mixed surface layer above BSBW in the eastern part of the trough. In situ measurements in August and October 2021 showed that the surface layer along the northeastern part of the trough (indicated by squares in Figure 4) was significantly warmer (1.6–2.4°C in August and 0.3–0.5°C in October) and more saline (34.0–34.2) than that at the central and western parts of the trough (33.0–33.6; 0.4–1.6°C in August and −1.8 to −1.0°C in October) (Figures 2, 3, 6, 7). Moreover, the cold (<0°C) halocline layer was thin (10–15 m) (stations 3981 and 3982 at transect A2) or absent (stations 3995 and 3996 at transect A3, station 3997 at transect A4, and station 4012 at transect A5) in August 2021 below this warm and saline surface layer (Figure 2). The isotherm of −0.5°C raised from the depths of 450–550 m in the middle of the trough to 120–150 m at the eastern flank of the trough.
The observed feature, i.e., the increased surface temperature at the eastern part of the trough, was reported in previous studies. Schauer et al. (2002b) demonstrated that this warm and high-saline anomaly is local, i.e., it is not observed in the surface layer further westward or eastward. Dmitrenko et al. (2014) also reported that the surface temperature at the eastern part of the trough is anomalously high, much higher than it should be at this latitude. Dmitrenko et al. (2014) presumed that its formation is caused by an upward heat flux from the FSBW outflow, which interacts and mixes with BSBW along the eastern flank of the trough. However, our measurements in August contradict this assumption for the following reasons: first, maximal temperatures in the core of the warm surface layer in the eastern part of the trough (2.2–2.4°C) were the same as those in the core of the FSBW outflow (2.2–2.4°C). The temperature of the surface layer warmed as a result of vertical heat flux should be distinctly lower than the temperature of FSBW due to heat losses between these water masses. Second, the warm and saline surface layer was located exactly above BSBW and ~20–30 km eastward from the FSBW outflow.
We propose an alternative explanation for the formation of the warm and saline surface layer along the eastern flank of the St. Anna Trough. The surface temperature and salinity structure at the study area in August 2021 (Figures 5A, B) show that the source of this water is located in the southeastern part of the trough above BSBW. In the eastern part of the trough, i.e., above BSBW, the temperature at a depth of 25 m decreases from 2–3°C in the south to 1.5–1.8°C in the north (Figure 5B). In the central and western parts of the trough, i.e., above FSBW, the temperature at a depth of 25 m decreases from 0 to −0.5°C in the south to −1 to −1.2°C in the north. Thus, the temperatures of the surface layer above both FSBW and BSBW significantly decrease from south to north, while the temperature difference across the trough, i.e., between eastern and central/western parts at the same latitude, remains relatively stable (2–3.5°C in the south, 2.5–3°C in the north).
We presume that the intense northward flow of BSBW along the eastern flank of the trough interacts with the surface layer. This interaction induces, first, the northward transport of the warm surface layer above BSBW and, second, mixing of the warm surface layer with BSBW. As a result, the salinity of the surface layer along the eastern flank of the trough increases and becomes higher than that at the same longitude westward in the trough. The temperature of this surface layer decreases due to mixing but remains higher than at the same longitude westward in the trough due to the decrease in air temperatures with the increase in latitude. Indeed, in August 2021, the difference in salinity and temperature of the surface layer between the central and eastern parts of the trough increased significantly from the southern transect A6 (0.4; 0.4°C) to the northern transect A2 (1.0; 1.3°C).
The proposed scheme of the northward flow and mixing of BSBW and the surface layer along the eastern part of the trough is supported by thermal satellite imagery of the study area. This region has almost constant cloud coverage during the short ice-free season. Moreover, during certain years, this area is completely covered by ice in summer and autumn. Therefore, analysis of daily MODIS Terra and Aqua images taken from July to October 2000–2021 revealed only five different days (4 September 2008; 30 July, 31 July, and 1 August 2015; and 12 September 2016) with cloud-free and ice-free conditions in the St. Anna Trough and the adjacent areas of the Kara and Barents seas. The pairs of corrected reflectance and brightness temperature satellite images during these days are presented in Figure 11. All five thermal satellite images in Figure 11 demonstrate the distinct northward flow of the warm surface water from the northern part of Novaya Zemlya along the eastern flank of the St. Anna Trough. The most illustrative are the cases of three consecutive days from 30 July to 1 August 2015 with almost cloud-free conditions, albeit the northeastern and northern parts of the trough are partly covered by ice. The available SST images do not show the exact source region of warm water, which could be advected to the trough from either the Kara Sea, the Barents Sea, or both sources. Note that the corrected reflectance satellite images are shown only to demonstrate the state of cloud and ice coverage. It is crucial to distinguish the areas where the brightness temperature is referred to as ice and clouds and does not correspond to the real sea surface temperature.
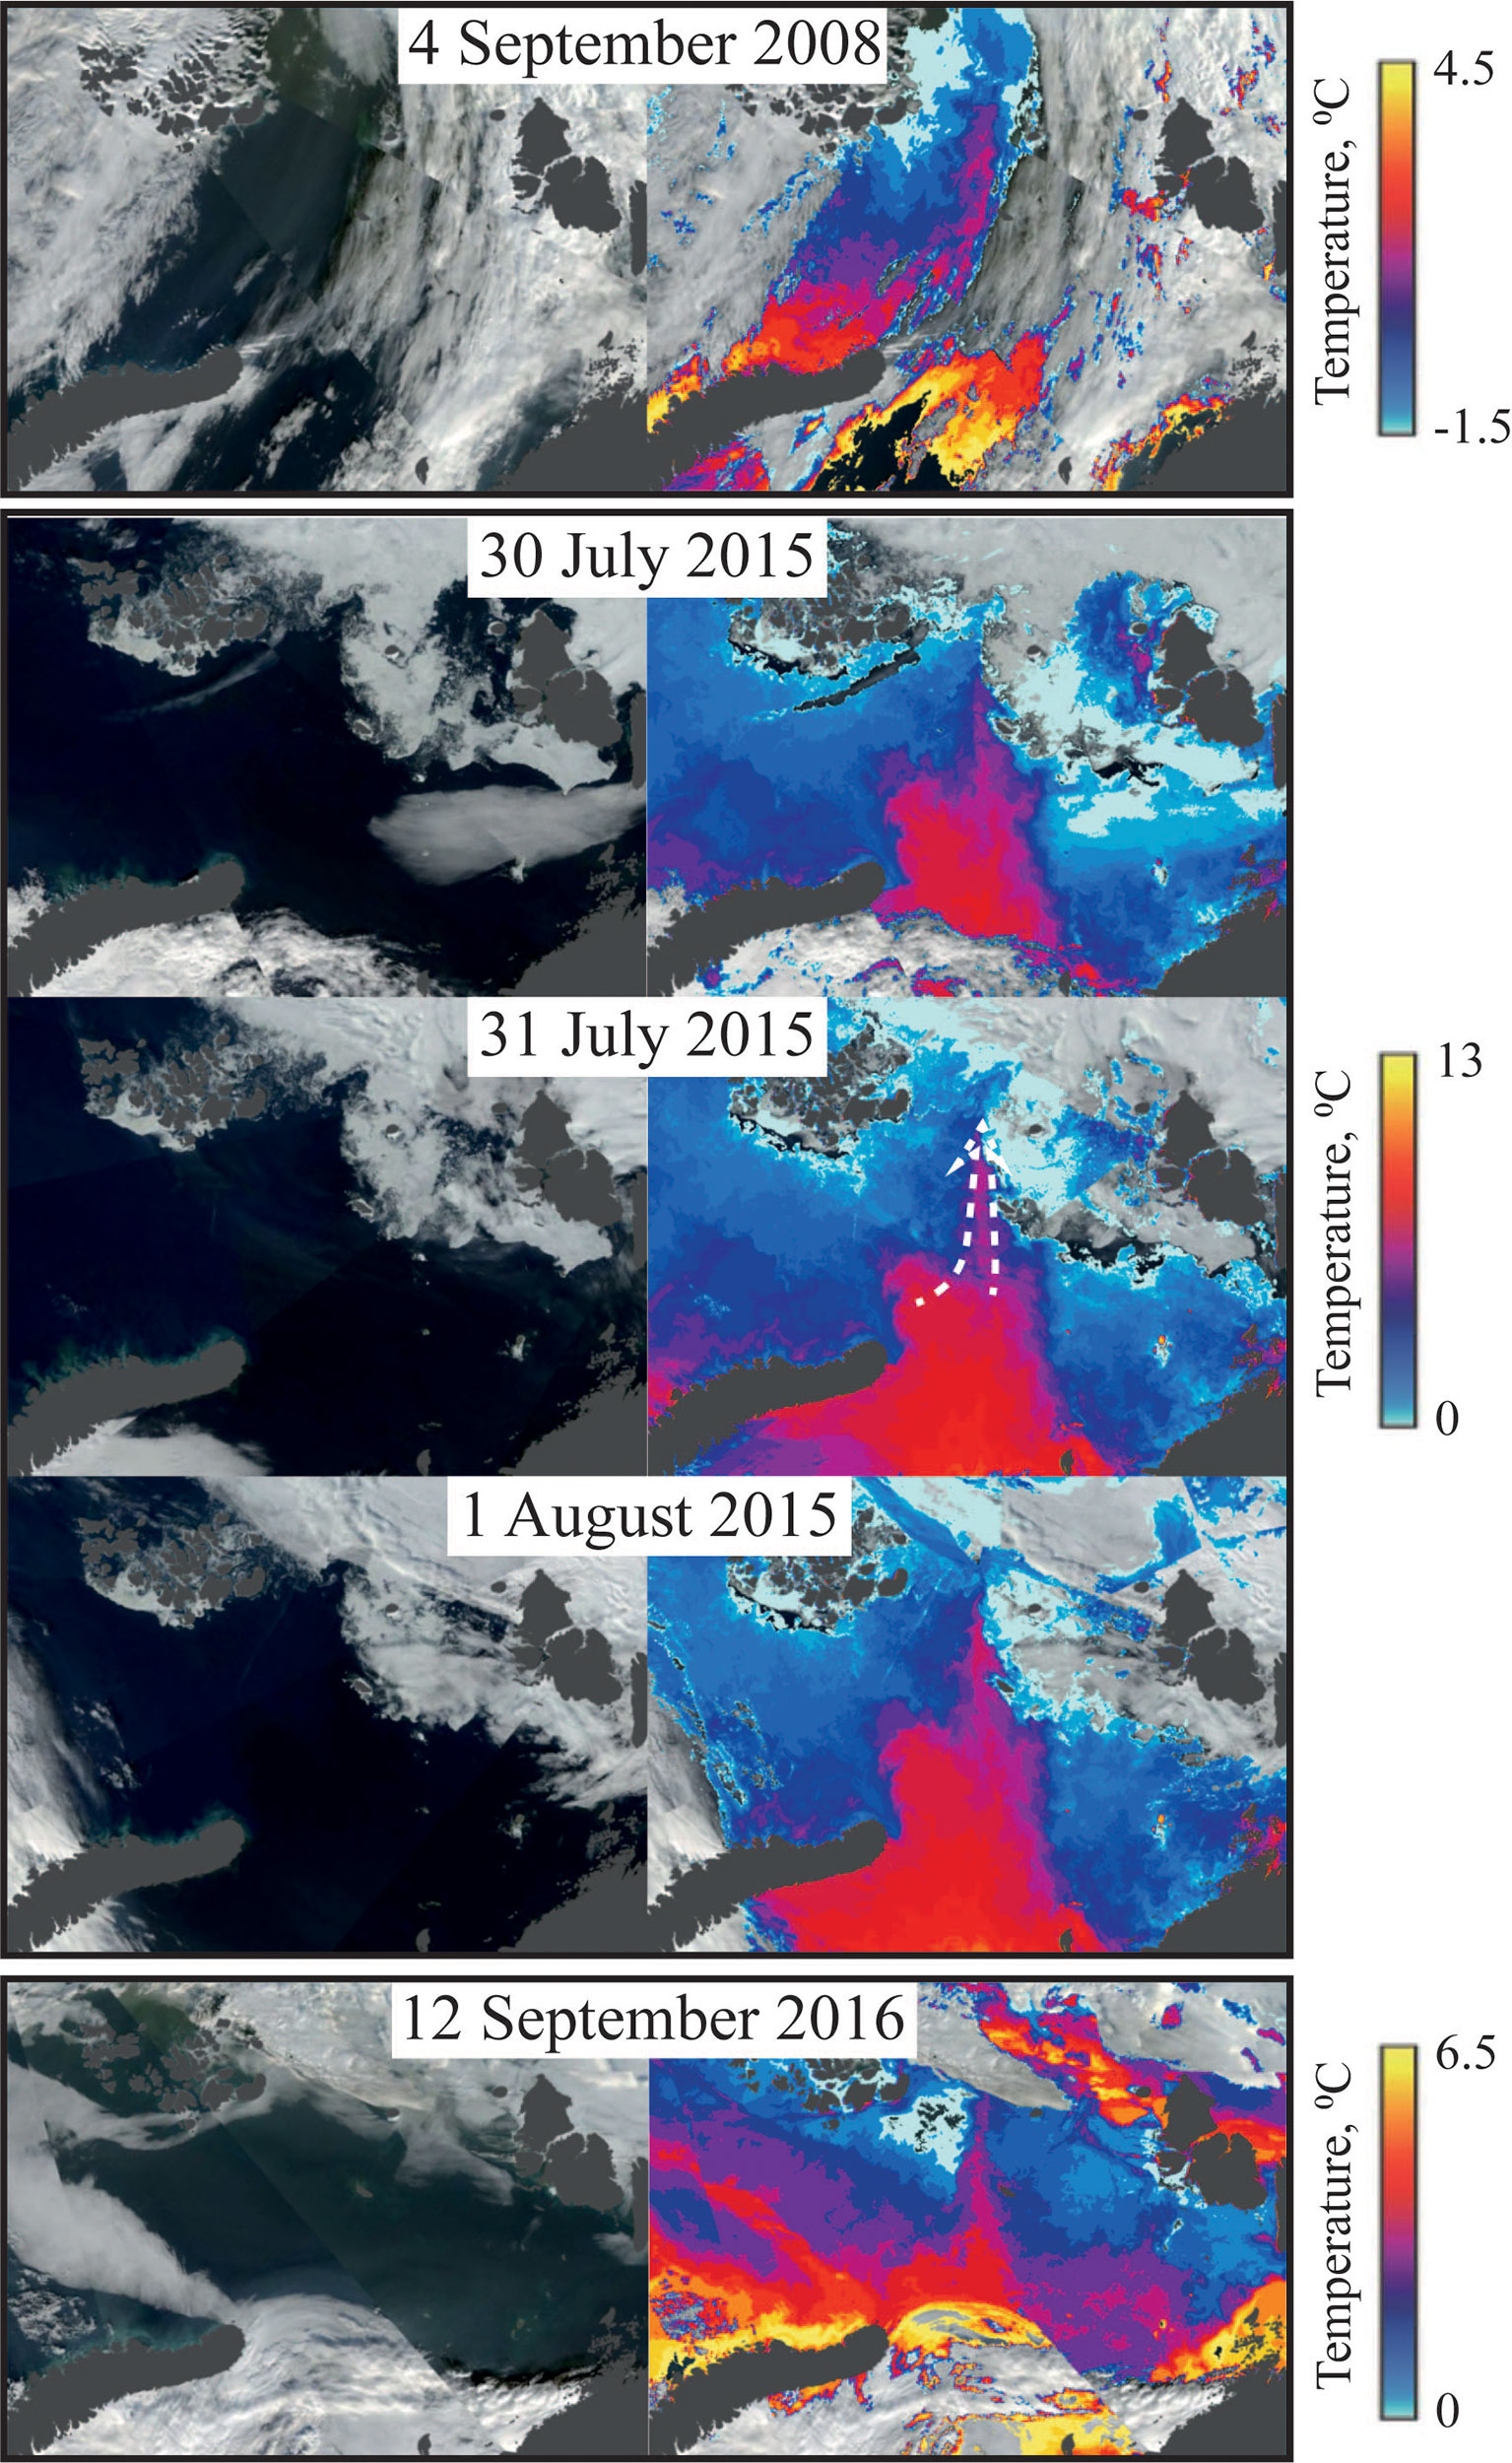
Figure 11 Corrected reflectance (left) and brightness temperature (right) from MODIS Terra/Aqua satellite images of the St. Anna Trough and the adjacent areas of the Kara and Barents seas acquired on 4 September 2008; 30 July, 31 July, and 1 August 2015; and 12 September 2016. The dashed white arrow in the thermal image on 31 July 2015 illustrates the northward flow of the warm surface layer along the eastern flank of the St. Anna Trough.
Both in situ measurements and cloud-free and ice-free satellite observations in the St. Anna Trough are scarce. These data cannot be used to understand if the advection of warm surface water to the trough is an episodic or persistent circulation scheme. However, based on satellite ice data, Dmitrenko et al. (2014) reported that reduced sea ice thickness and concentration is a common feature along the eastern flank of the St. Anna Trough (see Figures 11 and 14 in Dmitrenko et al. (2014)). Sea ice conditions in this area regularly show a delayed freeze-up onset during the fall and a reduction in the sea ice thickness during the winter. This result is a convincing argument that the northward flow of surface water from the Novaya Zemlya along the eastern flank of the trough toward the continental slope is a stationary circulation feature.
Discussion
The in situ measurements obtained in the St. Anna Trough in August and October 2021 provided new insights into the circulation of the local water masses: (1) the recirculation of most of FSBW within the cyclonic gyre and (2) the intense northward transport of the warm surface layer along the eastern flank of the trough and its mixing with BSBW (Figure 12). Considering this scheme, the obtained in situ measurements provide an opportunity to assess the transformation of the Atlantic water during its flow in the trough, including changes in temperature, salinity, and heat content. The latter was calculated using the vertical integration range for FSBW selected between the isotherms of 2°C and while for BSBW between the seafloor and the isotherm of −0.5°C. This analysis is based on the measurements at hydrological stations; therefore, it has some bias due to potential underestimation of the maximal/minimal temperature and salinity values as well as the heat content in the FSBW and BSBW cores. Another important limitation is the temporal coverage of the measurements, because we consider only one “snapshot” of the thermohaline structure in the trough in August 2021 and one “snapshot” in the northern part of the trough in October 2021. Nevertheless, we believe that the obtained results are representative of the circulation and transformation of the Atlantic water in the trough, so it can be used as a first-order approximation of these processes.
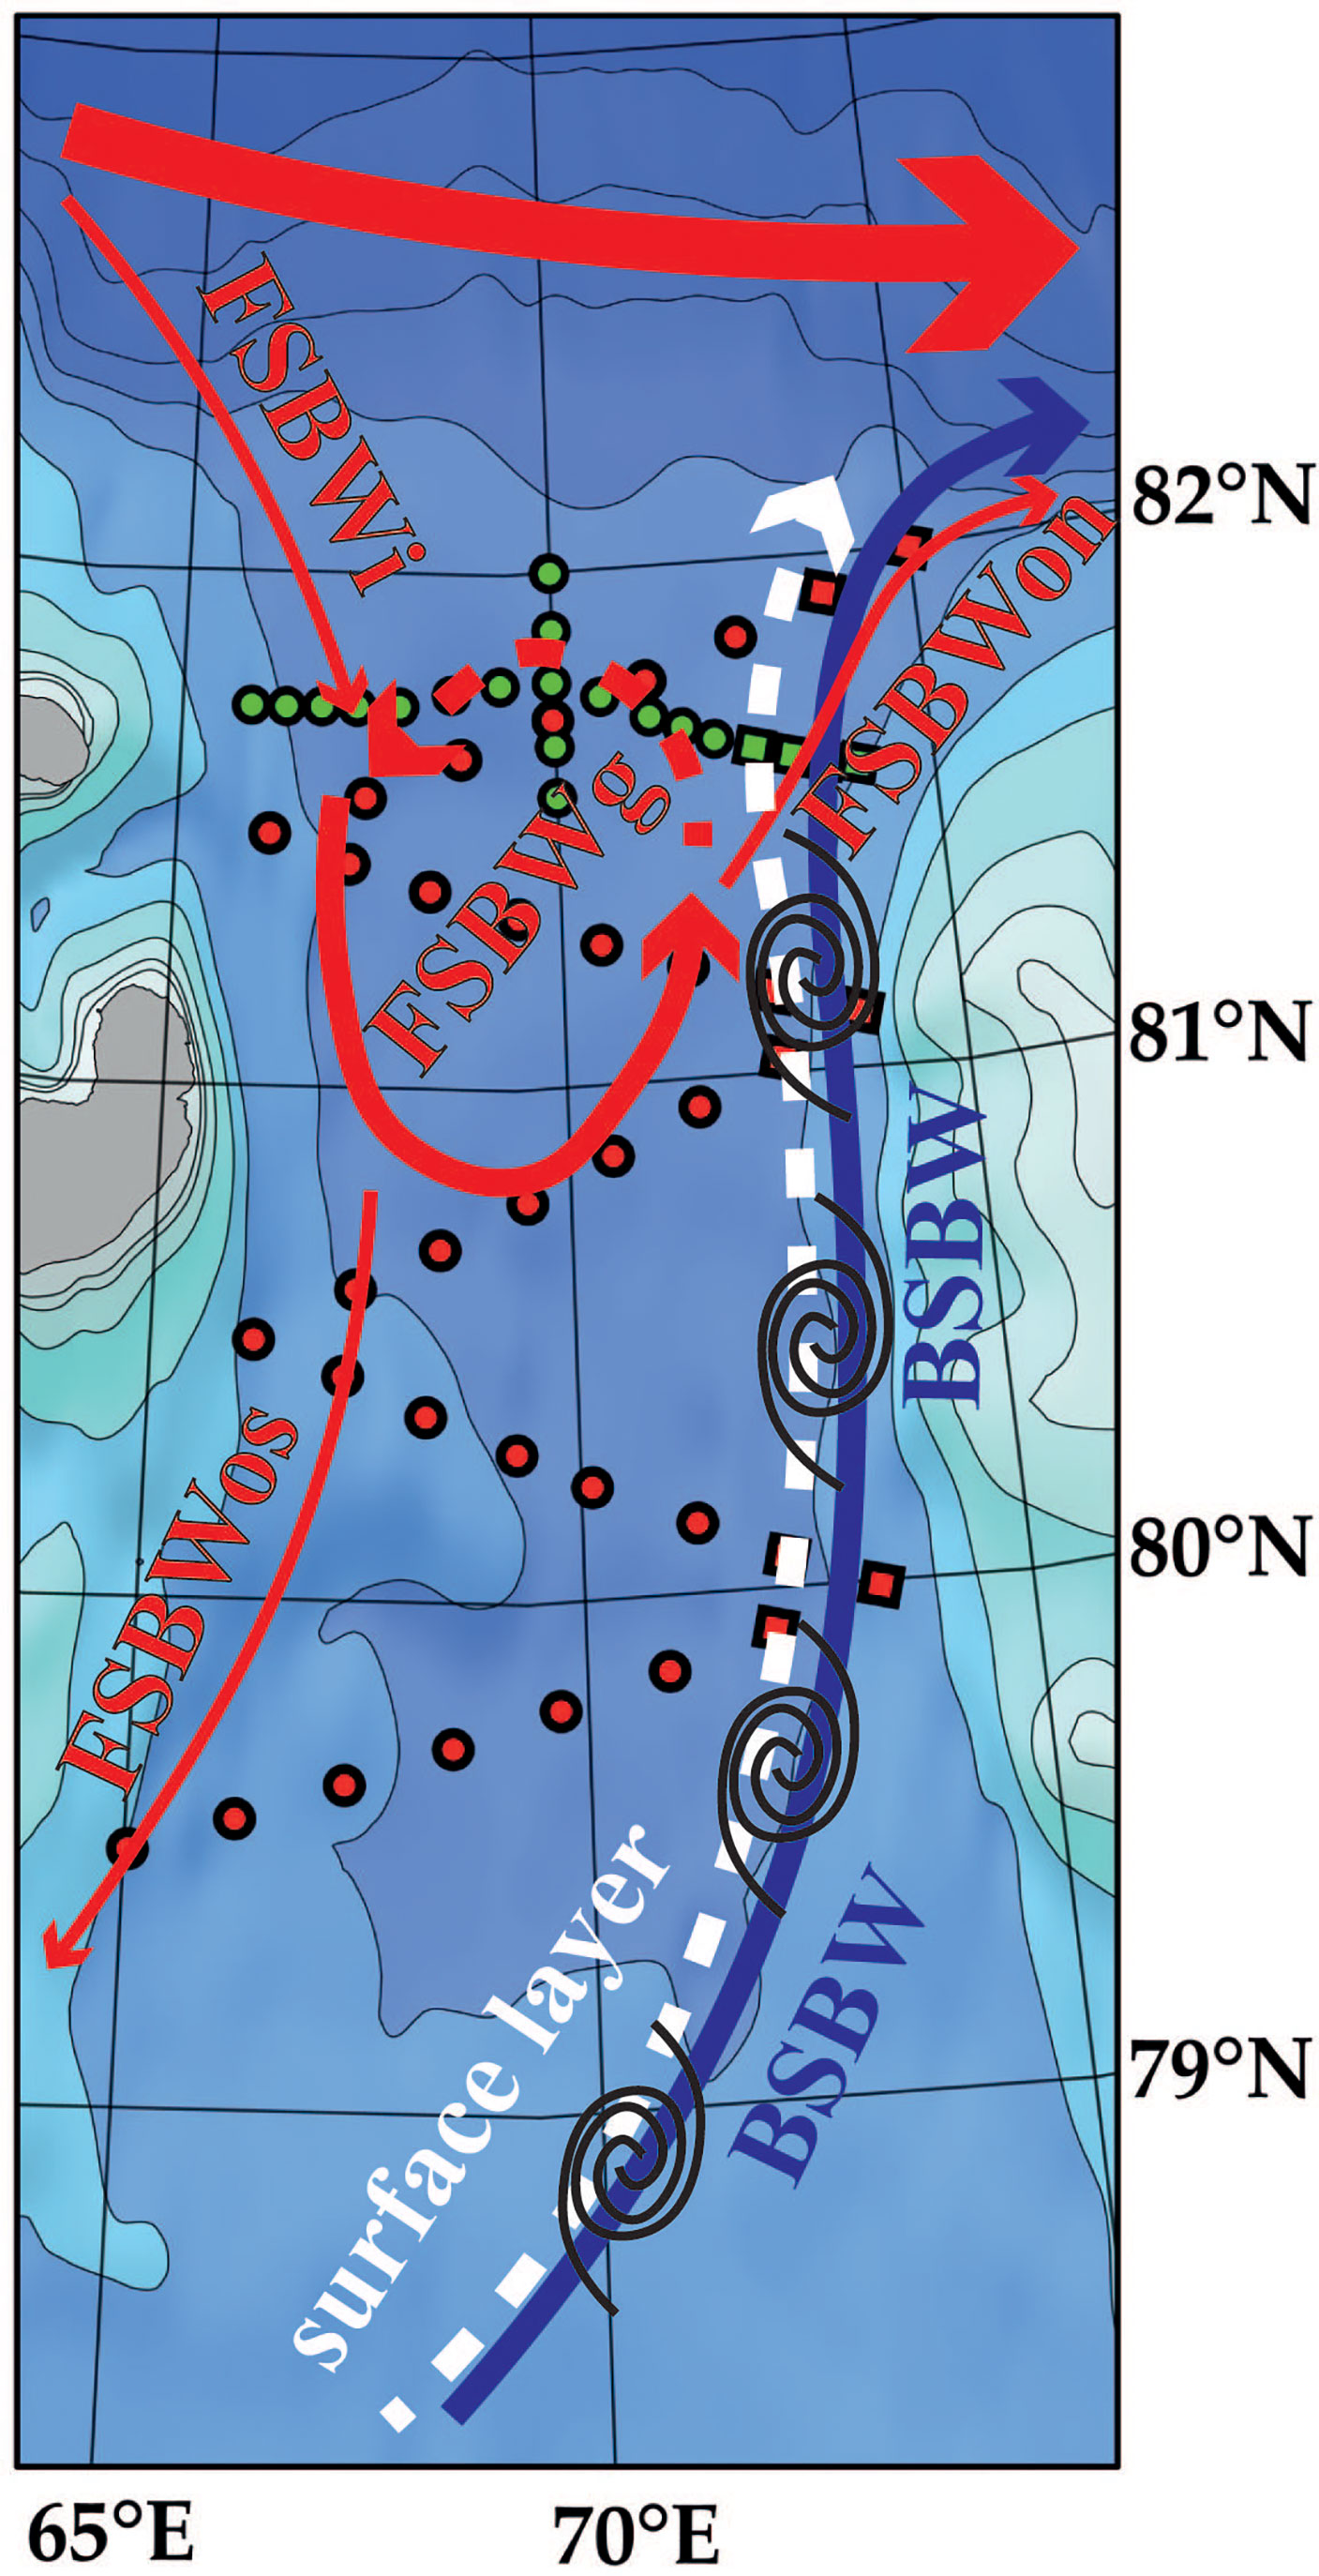
Figure 12 The general circulation scheme in the St. Anna Trough. Red and blue arrows show the FSBW and BSBW pathways, white arrow shows the surface layer pathway, black swirls indicates mixing between the surface layer and BSBW. Dashed arrows indicate flows of water masses revealed and described in this study.
The temperatures and salinities of the warm cores at the intermediate depths, which correspond to FSBW, showed good agreement with the main circulation features, including the FSBW gyre (hereafter FSBWg), the FSBW inflow from the continental slope to the trough (FSBWi), the FSBW southward outflow from the trough toward the Barents Sea (FSBWos), and the FSBW northward outflow toward the continental slope (FSBWon). FSBWg recirculated in the trough with stable maximal temperature of 2.44–2.45°C except the northern part of the gyre, where the maximal registered temperature was lower (2.38°C in August, 2.34°C in October). The depths of the temperature maximums increase significantly increase from 105 to 115 m at the western and southern parts of FSBWg to 135–140 m at its eastern and northern parts. The vertical location of the FSBWg core (defined by temperature >2°C) is relatively stable. Its upper and lower boundaries vary between 65–80 m and 150–190 m, respectively, at different parts of the gyre. Salinity in the FSBWg core is equal to 34.77–34.89 and is relatively stable along the gyre. Note that the maximal salinity in the trough (>34.9) is registered below the cores of FSBWg. The heat content of FSBWg was also stable and was equal to 1.6·109 J·m−2 at the western part of the trough (average value at stations 3987, 3988, 3989, 3990, and 3991) and 1.5·109 J·m−2 at the eastern part of the trough (average value at stations 3984, 3993, 3994, and 3999).
Maximal temperatures in the inflowing FSBWi registered in October (2.26°C) were significantly lower, than those in FSBWg including measurements in its coldest northern part in October (2.34°C). The depth of the temperature maximum (105 m) of FSBWi is similar to the related depths in the western part of FSBWg (105–115 m). However, the depths of the merging shallow FSBWi core (75–120 m) and the deep northern part of FSBWg (80–160 m) are also consistent with those in the western part of FSBWg (75–170 m). Salinity in the merging FSBWi core (34.76–34.82) and the northern part of FSBWg (34.81–34.88) includes those observed in the western part of FSBWg (34.77–34.87).
The fact that the FSBWi flow has lower temperatures than the FSBWi flow is questionable because FSBWi is the source of heat at intermediate depths in the St. Anna Trough. We propose the following reasons why we observed this feature: The inflow of the Atlantic water to the trough is non-stationary in terms of temperature and intensity (at least due to its strong seasonal variability), which can result in the observed temperature difference between FSBWi and FSBWg at the only transect B1 across them in October 2021. Moreover, the only measurements in FSBWi (stations 7237 and 7238 in October 2021) were obtained very close to FSBWg (<20 km) and possibly did not show the core characteristics of FSBWi.
The southward outflow FSBWos is also colder than FSBWg. The maximal temperatures in FSBWos are only 2.2–2.28°C. The depths of the FSBWos core significantly decreased during its southward propagation from 70–130 m to 55–70 m. The heat content of FSBWos was also significantly smaller than that of FSBWg and decreased from 0.9·109 J·m−2 (average value at stations 4003 and 4005) to 0.7·109 J·m−2 (station 4020). The northward outflow of FSBWon is also colder than FSBWg, with maximal temperatures of 2.06–2.2°C. This outflow is also shallower, with depths of 85–100 m compared to the eastern part of FSBWg (65–190 m). The heat content of FSBWon was the smallest and equal to 0.2·109 J·m−2 (station 3981). Salinity in the FSBWos core (34.81–34.85) and especially in the FSBWon core (34.85–34.86) corresponds to the highest salinity in the FSBWg core. As a result, both outflows are relatively cold, shallow, and saline compared to FSBWg.
The transformation of BSWB in the St. Anna Trough was considered using the in situ measurements at the eastern and central parts of the trough, where this water mass is present. The minimal temperatures and maximal salinities of BSWB were registered in the bottom layer. In August 2021, the minimal temperatures did not show any stable trend from south to north; they slightly increased from −1.25 to −1.27°C at transect A2 to −1.19 to −1.24°C at transects A3–A4 and then abruptly decreased to −1.33°C at transects A5–A6. Analogously, the heat content of BSBW in August 2021 changed from 3.5·109 J·m−2 at the southeastern part of the trough (average value at stations 4010, 4011, 4012, 4013, and 4014) to 3.9·109 J·m−2 (average value at stations 3994, 3995, 3996, 3997, and 3998) and then to 3.0·109 J·m−2 at the northeastern part of the trough (average value at stations 3981, 3982, and 3983). In October 2021, the minimal temperatures at the northeastern part of the trough were much higher and varied from −1.00 to −1.17°C. Additionally, anomalously warm bottom water (−0.24°C) was registered in October 2021 at station 7229 (617 m deep), indicating the deep penetration of FSBW and absence of the BSBW core at this station. The maximal salinity, on the other hand, was stable and equal to 34.85 at all transects in August 2021 and to 34.82–34.83 in October 2021.
Salinity at the isotherm of −0.5°C (which can be regarded as the boundary of the BSBW core) was also stable and equal to 34.8–34.81 at almost all stations in the eastern part of the trough in August and October 2021. Lower salinities were registered only at stations 3996 (34.69), 3997 (34.78), and 4012 (34.77) in August and at stations 7231 (34.78), 7232 (34.76), 7233 (34.79), and 72343 (34.77) in October, which is caused by mixing with a less saline surface layer. In the central part of the trough, salinity at the isotherm of −0.5 was >34.8 at all stations, which is caused by mixing with more saline FSBW. These salinities were the highest below the southward flow of FSBW (34.85–34.87 at stations 3986, 3987, and 3992) and only slightly higher below the northward flow of FSBW (34.81–34.83 at stations 3983, 3984, 3993, 3999, 4001, 4006, 4007, 4009, 7228, and 7230).
The thermohaline measurements described in this study, continue the sequence of field surveys performed in the St. Anna Trough since the 1960s (Hanzlick and Aagaard, 1980; Ivanov et al., 1999; Schauer et al., 2002a; Lien and Trofimov, 2013; Dmitrenko et al., 2015). Therefore, we compared the results of in situ measurements in 2021 with the previously reported studies to make a contribution to understanding the long-term variability of the thermohaline structure in the trough, which is important in the context of the ongoing climate change in the Arctic Ocean.
In August 2021, the temperature and salinity of the BSBW core in the bottom layer in were −1.1 to −1.2°C and 34.8–34.9, respectively (Figures 2–4), which is similar to those registered in 1965 (Hanzlick and Aagaard, 1980) and 1996 (Schauer et al., 2002). However, bottom temperature and salinity in BSBW in 1994 (Ivanov et al., 1999) and in 2008–2010 (Lien and Trofimov, 2013; Dmitrenko et al., 2015) were significantly greater (−0.5–0°C and 34.93–34.97), which was associated with the formation of the saltier and warmer brine water (referred to as “true BSBW” in Dmitrenko et al. (2015)). The observed differences in the presence and absence of the bottom brine water could be caused by the widely studied inter-annual variability of cooling and density modification of the Atlantic water in the Barents Sea (Skagseth et al., 2021; Shu et al., 2021).
The temperature and salinity of FSBW in the St. Anna Trough also significantly changed on the inter-annual time scale. The maximal temperatures of FSBW in the eastern part of the trough steadily increased from 1.5°C in 1965 (Hanzlick and Aagaard, 1980) to 1.75°C in 1994 (Ivanov et al., 1999) and 1996 (Schauer et al., 2002) and to 2–2.5°C in 2008–2010 (Lien and Trofimov, 2013; Dmitrenko et al., 2015). In 2021, the maximal temperatures were similar to those registered in 2008–2010, which indicates the secession of the FSBW warming. The maximal salinities of FSBW were equal to 34.93 in 1965 (Hanzlick and Aagaard, 1980) and in 1994 (Ivanov et al., 1999), 34.95 in 1996 (Schauer et al., 2002), and 34.94 in 2009 (Dmitrenko et al., 2015). In 2021 we registered a significant reduction in salinity with a maximal value of 34.89. This result is also associated with the inter-annual variability of the Atlantic water along the continental slope in the Barents Sea (Polyakov et al., 2017; Polyakov et al., 2020; Pnyushkov et al., 2022).
Conclusions
This study describes the extensive in situ measurements obtained in the St. Anna Trough in August and October 2021, with special emphasis on the northern part of the trough. Good spatial resolution of vertical thermohaline profiling provided novel information about the circulation of the Atlantic water in the trough. First, we revealed that the majority of the FSBW flow recirculates within the trough as a cyclonic gyre. The FSBW outflows southward to the Barents Sea and northward to the continental slope are less pronounced than the northern part of the FSBW gyre. Second, we revealed the intense northward flow of the mixed surface layer at the eastern part of the trough caused by its dynamic interaction with the BSBW flow. It causes mixing of the surface layer and halocline with BSBW and results in the transport of a warm and saline surface layer to the northeastern part of the trough.
Based on the obtained in situ data, we assessed the transformation of FSBW and BSBW in the trough. The cyclonic FSBW gyre has a stable temperature, salinity, and vertical location of the core. All local inflows and outflows are colder, thinner, and shallower in the core than the FSBW gyre. The inflow of FSBW from the continental slope is less saline than the FSBW gyre, while both outflows of FSBW to the Barents Sea and the continental slope are more saline than the FSBW gyre. We presume that stability of temperature and salinity in the eastern and western parts of the FSBW gyre is provided by its recirculation and the resulting heat and saline balance with the BSBW flow. The BSBW core adjacent to the sea bottom layer has stable salinity but variable temperature within the trough. While propagating northward, temperature at the upper BSBW layer steadily increases and salinity steadily decreases as a result of mixing of BSBW and warm and low-saline surface layer, however this mixing does not affect the bottom layer.
The results obtained in this study are an important modification of the circulation scheme in the St. Anna Trough described in previous studies (Schauer et al., 2002; Lien and Trofimov, 2013; Dmitrenko et al., 2014; Dmitrenko et al., 2015). They are important for understanding the interaction of the local water masses, which determines their density and heat content. In particular, the presence of the FSBW gyre significantly increases the residence time of FSBW water in the trough. This results in decreased heat inflow from the continental slope and modifies the heat balance between FSBW and BSBW in the trough. In particular, we did not register any evidence of the intense mixing and heat exchange between FSBW and BSBW within the trough. On the other hand, BSBW experiences intense heat exchange with the halocline and surface layer during its flow through the St. Anna Trough. The transport of warm water from the south to the eastern part of the trough affects ice formation and ice melting. This process significantly increases the duration of the ice-free season, which was reported by Dmitrenko et al. (2014).
The intense northward transport of the surface layer from the northern part of Novaya Zemlya toward the continental slope could be important in the context of the freshwater balance of the Kara Sea. The Ob-Yenisei plume, which occupies a wide area between Novaya Zemlya and the continent in the central part of the Kara Sea, is among the largest freshwater reservoirs in the Arctic Ocean (Osadchiev et al., 2019; Osadchiev et al., 2020a; Osadchiev et al., 2020b; Osadchiev et al., 2021a; Osadchiev et al., 2021b). This plume (with salinities of <25) is formed during the ice-free period in summer and autumn and disappears during the ice period, i.e., in early spring, salinities in the central part of the sea are >30 (Fedulov et al., 2018; Mosharov et al., 2018). The fate of the Ob-Yenisei plume under ice during the cold season remains unknown. In the case of northward advection of the Ob-Yenisei plume to the southern part of the St. Anna Trough, the interaction of the plume with the BSBW flow could result in its transport northward to the continental slope and provide the advection of the plume from the central part of the Kara Sea. However, determining whether or not this process occurs requires additional under-ice in situ measurements at the study area.
Despite certain progress in our understanding of processes in the St. Anna Trough, many important issues remain unknown. Among the others, we want to highlight the question of the formation of the FSBW gyre. In this study, we detected the exact area of reversal of FSBW in the St. Anna Trough. It occurs at the middle of the trough (81.5° N), near the topographic elevation of the seafloor on the western slope. However, this elevation is relatively small and local; it is manifested by a 30-km eastward shift of the 500-m isobath (Figure 12). Moreover, this elevation does not hinder the formation of the southward flow of FSBW into the Barents Sea. As a result, the physical mechanism that causes a reversal of FSBW in the trough and controls the meridional extent of the FSBW gyre remains unknown. Among the possible explanations are the dynamic interactions of FSBW with the northward flow of BSBW (which was not detected in this study) and conservation of the vorticity of the FSBW flow. However, these issues require specific in situ measurements and validated numerical modeling, which is also the case for many other related questions, including the temporal variability of the FSBW gyre, the residence time of FSBW in the gyre, the volumes of the FSBW inflow and outflow, and the influence of the FSBW gyre on mixing and heat balance in the trough.
Data Availability Statement
The original contributions presented in the study are included in the article/Supplementary Material. Further inquiries can be directed to the corresponding author.
Author Contributions
AO designed the study. AO, IS, and NS organized the field surveys. AO, KV, DF, DD, AD, AN, AG, VK, ES, IS, and NS performed the field work. KV, DF, DD, AD, AN, AG, VK, and ES processed the in situ data and organized the database. AO, KV, DF, and DD performed the analysis of the in situ and satellite data. All authors contributed to the article and approved the submitted version.
Funding
This research was funded by the Ministry of Science and Higher Education of the Russian Federation, theme FMWE-2021-0001 (collecting and processing of satellite data) and the Russian Science Foundation, research project 21-17-00278 (collecting and processing of in situ data).
Conflict of Interest
The authors declare that the research was conducted in the absence of any commercial or financial relationships that could be construed as a potential conflict of interest.
Publisher’s Note
All claims expressed in this article are solely those of the authors and do not necessarily represent those of their affiliated organizations, or those of the publisher, the editors and the reviewers. Any product that may be evaluated in this article, or claim that may be made by its manufacturer, is not guaranteed or endorsed by the publisher.
Acknowledgments
The authors wish to thank the crews of R/V “Akademik Ioffe” and R/V “Akademik Mstislav Keldysh” for their invaluable support in our Arctic surveys nearby the ice fields and beyond the navigation maps, especially captain Andrey Zybin and chief mate Sergey Ponomarenko (Akademik Ioffe), captain Yuriy Gorbach and chief mate Alexander Fedin (Akademik Mstislav Keldysh). The authors wish to thank the "Floating University" scientific and educational program for support in organisation of field measurements.
Supplementary Material
The Supplementary Material for this article can be found online at: https://www.frontiersin.org/articles/10.3389/fmars.2022.915674/full#supplementary-material
References
Aagaard K. (1981). On the Deep Circulation of the Arctic Ocean. Deep-Sea Res. 28, 251–268. doi: 10.1016/0198-0149(81)90066-2
Aksenov Y., Ivanov V. V., Nurser A. J. G., Bacon S., Polyakov I. V., Coward A. C., et al. (2011). The Arctic Circumpolar Boundary Current. J. Geophys. Res. 116, C09017, 1–28. doi: 10.1029/2010JC006637
Årthun M., Ingvaldsen R. B., Smedsrud L. H., Schrum C. (2011). Dense Water Formation and Circulation in the Barents Sea. Deep Sea Res. Part I 58, 801–817. doi: 10.1016/j.dsr.2011.06.001
Ballarotta M., Ubelmann C., Pujol M.-I., Taburet G., Fournier F., Legeais J.-F., et al. (2019). On the Resolutions of Ocean Altimetry Maps. Ocean Sci. 15, 1091–1109. doi: 10.5194/os-15-1091-2019
Beszczynska-Möller A., Woodgate R. A., Lee C., Melling H., Karcher M. (2011). A Synthesis of Exchanges Through the Main Oceanic Gateways to the Arctic Ocean. Oceanography 24, 82–99. doi: 10.5670/oceanog.2011.59
Dmitrenko I. A., Kirillov S. A., Serra N., Koldunov N. V., Ivanov V. V., Schauer U., et al. (2014). Heat Loss From the Atlantic Water Layer in the Northern Kara Sea: Causes and Consequences. Ocean Sci. 10 (4), 719–730. doi: 10.5194/os-10-719-2014
Dmitrenko I. A., Kirillov S. A., Tremblay L. B., Bauch D., Hölemann J. A., Krumpen T., et al. (2010). Impact of the Arctic Ocean Atlantic Water Layer on Siberian Shelf Hydrography. J. Geophysical Res. 115, C08010. doi: 10.1029/2009JC006020
Dmitrenko I. A., Polyakov I. V., Kirillov S. A., Timokhov L. A., Frolov I. E., Sokolov V. T., et al. (2008). Toward a Warmer Arctic Ocean: Spreading of the Early 21st Century Atlantic Water Warm Anomaly Along the Eurasian Basin Margins. J. Geophysical Res. 113, C05023. doi: 10.1029/2007JC004158
Dmitrenko I. A., Rudels B., Kirillov S. A., Aksenov Y. O., Lien V. S., Ivanov V. V., et al. (2015). Atlantic Water Flow Into the Arctic Ocean Through the St. Anna Trough in the Northern Kara Sea. J. Geophys. Res. Oceans 120, 5158–5178. doi: 10.1002/2015JC010804
Fahrbach E., Meincke J., Osterhus S., Rohardt G., Schauer U., Tverberg V., et al. (2001). Direct Measurements of Volume Transports Through Fram Strait. Polar Res. 20, 217–224. doi: 10.3402/polar.v20i2.6520
Fedulov V. Y., Belyaev N. A., Kolokolova A. V., Sazhin A. F. (2018). Base Geochemical Parameters of the Surface Water of Southwestern Kara Sea in the Winter Season. J. Oceanological Res. 46, 115–122. doi: 10.29006/1564-2291.JOR-2018.46(1).9
Frey D., Osadchiev A. (2021). Large River Plumes Detection by Satellite Altimetry: Case Study of the Ob–Yenisei Plume. Remote Sens. 13, 5014. doi: 10.3390/rs13245014
Hanzlick D., Aagaard K. (1980). Freshwater and AtlanticWater in the Kara Sea. J. Geophysical Research: Oceans Atmospheres 85, 4937–4942. doi: 10.1029/JC085iC09p04937
Hersbach H., Bell B., Berrisford P., Hirahara S., Horanyi A., Munoz-Sabater J., et al(2020). The ERA5 Global Reanalysis. Q. J. R. Meteorol. Soc 146, 1999–2049. doi: 10.1002/qj.3803
Ivanov V. V., Alexeev V. A., Repina I., Koldunov N. V., Smirnov A. (2012). Tracing Atlantic Water Signature in the Arctic Sea Ice Cover East of Svalbard. Adv. Meteorol 2012, 201818 .doi: 10.1155/2012/201818
Ivanov G. I., Nechsheretov A. V., Ivanov V. V. (1999). “Oceanographic Observations in the St. Anna Trough, Kara Sea,” in Modern and Late Quaternary Depositional Environment of the St. Anna Trough Area, Northern Kara Sea. Eds. Stein R., Fahl K., Ivanov G. I., Leviten M. A., Tarasov G., (Germany: Berichte zur Polarforschung), 27–45.
Kirillov S. A., Dmitrenko I. A., Ivanov V. V., Aksenov E. O., Makhotin M. S., De Quevas B. A. (2012). The Influence of Atmospheric Circulation on the Dynamics of the Intermediate Water Layer in the Eastern Part of the St. Anna Trough. Doklady Earth Sci. 444, 630–633. doi: 10.1134/S1028334X12050121
Lien V. S., Trofimov A. G. (2013). Formation of Barents Sea Branch Water in the Northeastern Barents Sea. Polar Res. 32, 18905. doi: 10.3402/polar.v32i0.18905
Lien V. S., Vikebø F., Skagseth Ø. (2013). One Mechanism Contributing to Co-Variability of the Atlantic Inflow Branches to the Arctic. Nat. Commun. 4, 1488. doi: 10.1038/ncomms2505
Mosharov S. A., Sazhin A. F., Druzhkova E. I., Khlebopashev P. V. (2018). Structure and Productivity of the Phytocenosis in the Southwestern Kara Sea in Early Spring. Oceanology 58, 396–404. doi: 10.1134/S0001437018030141
Onarheim I. H., Smedsrud L. H., Ingvaldsen R. B., Nilsen F. (2014). Loss of Sea Ice During Winter North of Svalbard. Tellus Ser. A 66, 23933. doi: 10.3402/tellusa.v66.23933
Osadchiev A. A., Asadulin E., Miroshnikov A., Zavialov I. B., Dubinina E. O., Belyakova P. A. (2019). Bottom Sediments Reveal Inter-Annual Variability of Interaction Between the Ob and Yenisei Plumes in the Kara Sea. Sci. Rep. 9, 18642. doi: 10.1038/s41598-019-55242-3
Osadchiev A. A., Frey D. I., Shchuka S. A., Tilinina N. D., Morozov E. G., Zavialov P. O. (2021a). Structure of Freshened Surface Layer in the Kara Sea During Ice-Free Periods. J. Geophys. Res. Oceans 126, e2020JC016486. doi: 10.1029/2020JC016486
Osadchiev A. A., Konovalova O. P., Gordey A. S. (2021b). Water Exchange Between the Gulf of Ob and the Kara Sea During Ice-Free Seasons: The Roles of River Discharge and Wind Forcing, Front. Mar. Sci. 8. doi: 10.3389/fmars.2021.741143
Osadchiev A. A., Medvedev I. P., Shchuka S. A., Kulikov M. E., Spivak E. A., Pisareva M. N., et al. (2020a). Influence of Estuarine Tidal Mixing on Structure and Spatial Scales of Large River Plumes. Ocean Sci. 16, 1–18. doi: 10.5194/os-16-1-2020
Osadchiev A. A., Pisareva M. N., Spivak E. A., Shchuka S. A., Semiletov I. P. (2020b). Freshwater Transport Between the Kara, Laptev, and East-Siberian Seas. Sci. Rep. 10, 13041. doi: 10.1038/s41598-020-70096-w
Pnyushkov A. V., Alekseev G. V., Smirnov A. V. (2022). On the Interplay Between Freshwater Content and Hydrographic Conditions in the Arctic Ocean in the 1990s–2010s. J. Mar. Sci. Eng. 10, 401. doi: 10.3390/jmse10030401
Pnyushkov A. V., Polyakov I. V., Ivanov V. V., Aksenov Y., Coward A. C., Janout M., et al. (2015). Structure and Variability of the Boundary Current in the Eurasian Basin of the Arctic Ocean. Deep-Sea Res. I 101, 80–97. doi: 10.1016/j.dsr.2015.03.001
Polyakov I. V., Alkire M. B., Bluhm B. A., Brown K. A., Carmack E. C., Chierici M., et al. (2020). Borealization of the Arctic Ocean in Response to Anomalous Advection From Sub-Arctic Seas. Front. Mar. Sci. 7. doi: 10.3389/fmars.2020.00491
Polyakov I. V., Pnyushkov A. V., Alkire M. B., Ashik I. M., Baumann T. M., Carmack E. C., et al. (2017). Greater Role for Atlantic Inflows on Sea-Ice Loss in the Eurasian Basin of the Arctic Ocean. Science 356 (6335), 285–291. doi: 10.1126/science.aai8204
Pujol M.-I., Faugère Y., Taburet G., Dupuy S., Pelloquin C., Ablain M., et al. (2016). DUACS DT2014: The New Multi-Mission Altimeter Data Set Reprocessed Over 20 Years. Ocean Sci. 12, 1067–1090. doi: 10.5194/os-12-1067-2016
Rudels B., Anderson L. G., Jones E. P. (1996). Formation and Evolution of the Surface Mixed Layer and Halocline of the Arctic Ocean. J. Geophys. Res. 101 (C4), 8807–8821. doi: 10.1029/96JC00143
Rudels B., Friedrich H. (2000). “The Transformations of Atlantic Water in the Arctic Ocean and Their Significance for the Freshwater Budget,” in The Freshwater Budget of the Arctic Ocean. Eds. Lewis L. L., Jones E. P., Lemke P., Prowse T. D., Wadhams P. (The Netherlands: Kluwer Academic Publishers), 503–532. doi: 10.1007/978-94-011-4132-1_21
Rudels B., Friedrich H. J., Quadfasel D. (1999). The Arctic Circumpolar Boundary Current. Deep-Sea Res. Part II 46 (6-7), 1023–1062. doi: 10.1016/S0967-0645(99)00015-6
Rudels B., Jones E. P., Anderson L. G., Kattner G. (1994). “On the Intermediate Depth Waters of the Arctic Ocean,” in The Polar Oceans and Their Role in Shaping the Global Environment, vol. 85 . Eds. Johannessen O. M., Muench R. D., Overland J. E. (USA: AGU), 33–46. Geophysical Monograph. doi: 10.1029/GM085p0033
Rudels B., Jones P. E., Schauer U., Eriksson P. (2004). Atlantic Sources of the Arctic Ocean Surface and Halocline Waters. Polar Res. 23 (2), 181–208. doi: 10.1111/j.1751-8369.2004.tb00007.x
Rudels B., Korhonen M., Schauer U., Pisarev S., Rabe B., Wisotzki A. (2015). Circulation and Transformation of Atlantic Water in the Eurasian Basin and the Contribution of the Fram Strait Inflow Branch to the Arctic Ocean Heat Budget, Prog. Oceanogr. 132, 128–152. doi: 10.1016/j.pocean.2014.04.003
Rudels B., Meyer R., Fahrbach E., Ivanov V. V., Osterhus S., Quadfasel D., et al. (2000). Water Mass Distribution in Fram Strait and Over the Yermak Plateau in Summer 1997. Ann. Geophys. 18, 687–705. doi: 10.1007/s00585-000-0687-5
Rudels B., Schauer U., Bj€ork G., Korhonen M., Pisarev S., Rabe B., et al. (2013). Observations of Water Masses and Circulation With Focus on the Eurasian Basin of the Arctic Ocean From the 1990s to the Late 2000s. Ocean Sci. 9, 147–169. doi: 10.5194/os-9-147-2013
Schauer U., Loeng H., Rudels B., Ozhigin V. K., Dieck W. (2002). Atlantic Water Flow Through the Barents and Kara Seas. Deep-Sea Res. Part I 49, 2281–2298. doi: 10.1016/S0967-0637(02)00125-5
Schauer U., Muench R. D., Rudels B., Timokhov L. (1997). Impact of Eastern Arctic Shelf Waters on the Nansen Basin Intermediate Layers. J. Geophys. Res. 102, 3371–3382. doi: 10.1029/96JC03366
Schauer U., Rudels B., Jones E. P., Anderson L. G., Muench R. D., Björk G., et al. (2002b). Confluence and Redistribution of Atlantic Water in the Nansen, Amundsen and Makarov Basins. Ann. Geophys. 20, 257–273. doi: 10.5194/angeo-20-257-2002
Shu Q., Wang Q., Song Z., Qiao F. (2021). The Poleward Enhanced Arctic Ocean Cooling Machine in a Warming Climate. Nat. Commun. 12, 2966. doi: 10.1038/s41467-021-23321-7
Skagseth O., Eldevik T., Årthun M., Asbjørnsen H., Lien V. S., Smedsrud L. H. (2021). Reduced Efficiency of the Barents Sea Cooling Machine. Nat. Climate Change 10, 661–666. doi: 10.1038/s41558-020-0772-6
Skagseth O., Furevik T., Ingvaldsen R., Loeng H., Mork K. A., Orvik K. A., et al. (2008). “Volume and Heat Transports to the Arctic via the Norwegian and Barents Seas,” in Arctic-Subarctic Ocean Fluxes: Defining the Role of the Northern Seas in Climate. Eds. Dickson R. R., Meincke J., Rhines P. (The Netherlands: Dordrecht, Springer), 45–64. doi: 10.1007/978-1-4020-6774-7
Smedsrud L. H., et al. (2013). The Role of the Barents Sea in the Arctic Climate System. Rev. Geophys. 51, 415–449. doi: 10.1002/rog.20017
Keywords: water masses, circulation, Fram Strait branch water, Barents Sea branch water, Atlantic water, St. Anna Trough, Kara Sea, Arctic Ocean
Citation: Osadchiev A, Viting K, Frey D, Demeshko D, Dzhamalova A, Nurlibaeva A, Gordey A, Krechik V, Spivak E, Semiletov I and Stepanova N (2022) Structure and Circulation of Atlantic Water Masses in the St. Anna Trough in the Kara Sea. Front. Mar. Sci. 9:915674. doi: 10.3389/fmars.2022.915674
Received: 08 April 2022; Accepted: 17 June 2022;
Published: 18 July 2022.
Edited by:
Igor Dmitrenko, University of Manitoba, CanadaReviewed by:
Denis L. Volkov, Atlantic Oceanographic and Meteorological Laboratory (NOAA), United StatesAndrey V. Pnyushkov, University of Alaska Fairbanks, United States
Vidar Lien, Norwegian Institute of Marine Research (IMR), Norway
Copyright © 2022 Osadchiev, Viting, Frey, Demeshko, Dzhamalova, Nurlibaeva, Gordey, Krechik, Spivak, Semiletov and Stepanova. This is an open-access article distributed under the terms of the Creative Commons Attribution License (CC BY). The use, distribution or reproduction in other forums is permitted, provided the original author(s) and the copyright owner(s) are credited and that the original publication in this journal is cited, in accordance with accepted academic practice. No use, distribution or reproduction is permitted which does not comply with these terms.
*Correspondence: Alexander Osadchiev, b3NhZGNoaWV2QG9jZWFuLnJ1
 Alexander Osadchiev
 Kirill Viting2
 Dmitry Frey
 Alexandra Gordey
 Igor Semiletov
 Natalia Stepanova