 Xiaoxin Dai1†
 Haidong Li
 Zhangjie Chu
94% of researchers rate our articles as excellent or good
Learn more about the work of our research integrity team to safeguard the quality of each article we publish.
Find out more
ORIGINAL RESEARCH article
Front. Mar. Sci. , 30 May 2022
Sec. Marine Pollution
Volume 9 - 2022 | https://doi.org/10.3389/fmars.2022.915415
The plasticizer bisphenol A, a typical endocrine disrupting chemical, is widely present in the environment. Previous studies demonstrated that exposure to bisphenol A can cause reproductive toxicity, abnormal fertilization, and infertility. However, the mechanisms of low-concentration bisphenol A on the reproductive system and treatment measures have not been fully determined. In this study, we explored the transcriptomic profiles of female zebrafish ovaries. The transcriptomic data revealed that mitochondrial NADH dehydrogenase (mt-Nd) genes were significantly decreased in the bisphenol A-exposed group, while the co-administration of tea polyphenols remarkably elevated the expression of mt-Nd genes. To further explore the expression pattern of the mt-Nd, we analyzed the expression of six mt-Nd genes on different days by qRT-PCR in control, bisphenol A-exposed, and bisphenol A-tea polyphenols ovaries. Here, we found that 0.1 mg/L bisphenol A exposure adversely affects the mitochondrial respiratory chain in ovaries and may lead to reproductive disorders. Finally, our study demonstrated that tea polyphenols play a protective role in ovarian mitochondrial dysfunction in low-concentration bisphenol A-exposed female zebrafish.
The environmental endocrine disrupting chemicals (EDCs) widely exist in the environment which interfere with the endocrine system of organisms (Guillette and Gunderson, 2001). It can lead to the abnormal morphology and function of related organs and seriously endanger the health of organisms (Colborn et al., 1993; McLachlan, 2001). Studies have shown that the reproductive organs have been considered to be the main organs of EDCs (Gore et al., 2011), resulting in abnormal gonadal development and reproductive behavior, hindering fertilization success (Hill and Janz, 2003; Larsen et al., 2009; Baker and Hardiman, 2014). In recent years, there is a continuing trend of deterioration and EDC pollution has become more serious (Colborn et al., 1993; Hill and Janz, 2003).
Bisphenol A (BPA) is an important monomer in the manufacture of epoxy resins and polycarbonates (Castillo-Sanchez et al., 2020). As one of the typical EDCs, it is widely used in the production of automobiles, plastic products, household appliances, kitchen utensils, covering all levels of human life (Fenichel et al., 2013; Laing et al., 2016). Also, BPA is released into the soil, water, and atmospheric environments during the production and degradation of BPA-containing products. It has been detected in drinking water, household dust (Rudel et al., 2003; Von Goetz et al., 2010), human urine, and maternal and baby samples through diet and skin (Calafat et al., 2005; Zhang et al., 2011; Sayici et al., 2019).
Fish populations are an important part of aquatic ecosystems (Wu et al., 2017). They can accumulate EDCs including BPA, 17α-ethynylestradiol (EE2), and nonylphenol (NP) (Brown et al., 2007), which could make them a source of higher trophic pollutants, thereby posing a threat to the whole ecosystem and even human health (Lee et al., 2015; Salvaggio et al., 2019). Previous reports have proved that in water with BPA levels of 10-30 ng/L, BPA levels varied from 1–11 ng/g in fish muscle and 2–75 ng/g in fish liver (Belfroid et al., 2002; Laing et al., 2016). And especially, it has been more often detected in infertile women (Pivonello et al., 2020), which suggests a possible relevance between BPA exposure and female fertility. The normal function of the ovaries depends on the good balance between the body’s scavenging ability and the free radicals. Particularly, it has been documented that BPA mediated oxidative stress and apoptosis in several tissues, including the ovary (Cho et al., 2018; Mukherjee et al., 2020). The adverse effects of BPA on mammalian oocytes have presented meiotic abnormalities such as spindle aberrations, unaligned chromosomes (Lenie et al., 2008). Furthermore, BPA has been reported to inhibit estradiol biosynthesis and follicle growth in mouse ovaries (Peretz et al., 2011).
Tea polyphenols (TP) are complexes of polyhydroxylated compounds extracted from tea, which can scavenge free radicals and have significant antioxidant activity (Pandey et al., 2015). As a well-known natural phenolic antioxidant, TP can prevent oxidative stress related diseases and suppress ROS production and reduce the oxidative stress (Higdon and Frei, 2003; Chen et al., 2009). Studies have shown that TP could protect Tri-ortho-cresyl phosphate-induced ovarian damage by inhibiting oxidative stress. They found that autophagy and oxidative stress were significantly induced by Tri-ortho-cresyl phosphate in the mouse ovarian tissue, while TP could rescue the autophagy and oxidative stress (Yang et al., 2020). Additionally, TP could inhibit the transition from primordial to developing follicles, prolong the follicular growth period, reduce the number of dominant follicles per cycle to increase germ cell reserve, inhibit oocyte apoptosis and follicular atresia, and then delay menopause in rats (Luo et al., 2008).
Moreover, mitochondria play an important role in apoptosis, reactive oxygen species regulation, and calcium signaling (Bravo-Sagua et al., 2017). The mitochondrial respiratory chain is the major source of ROS and free radicals under normal circumstances and there is also a balance between the production and removal of ROS in cells (Cui et al., 2012). As the main source of ROS, considerable evidence has revealed that mitochondrial DNA will be attacked by oxidative stress (Lin and Beal, 2006). Nicotine-amide adenine dinucleotide (NADH) dehydrogenase, is the largest protein complex in the mitochondrial respiratory chain and seven of mitochondrially encoded NADH dehydrogenase (mt-Nd) genes are encoded by mtDNA. In general, dysfunction of the mt-ND genes might lead to disturbance of the mitochondrial respiratory chain (Srirattana and St John, 2019), trigger apoptosis, and induce mitochondrial damage (Lee and Wei, 2007).
The present study employing zebrafish as a model investigated the mechanism of low concentration BPA on the ovary of zebrafish and the protective effect of TP. We explored the transcriptome data of zebrafish ovaries from low concentration BPA-exposed and BPA-TP groups, through the Illumina platform by generating de novo assembly. We also presented the expression pattern of the mitochondrial genes associated with oxidative stress, thereby improving the understanding of transcription and regulation exposed by low concentration BPA and TP. In addition, the gene expression level of mt-ND1, mt-ND2, mt-ND3, mt-ND4, mt-ND5, mt-ND6 related to oxidative stress pathways were measured. Finally, our study demonstrated that TP played a protective role in ovarian mitochondrial dysfunction in low-concentration BPA-exposed female zebrafish.
Adult zebrafish (Danio rerio) were maintained at 26 ± 1°C with a 14 h/10 h light-dark cycle in dechlorinated tap water. Fish were fed twice a day with the Japanese Nitsin B2 feedstuffs (size 0.36-0.65 mm, protein 50%, fat 10%, fiber 3.0%, slow sink type). The experiment studied the ovaries and the number of feeding times were twice daily. The zebrafish could eat within 5 minutes, as is the standard for each feeding, so to avoid excessive feeding that causes sedimentation and convex abdomen of the fish. It was difficult to judge the maturity of the gonads.
Bisphenol A and Tea polyphenols were supplied by Sigma-Aldrich (St. Louis, MO, USA). All of the other chemicals and reagents including dimethyl sulfoxide were of analytical grade. The stock solution of BPA (1 g/L) was prepared using dimethyl sulfoxide (DMSO) and deionized water (v/v = 1:1). Exposure solutions of BPA were at 100 ug/L and diluted using dechlorinated tap water. The stock solution of TP (1 mg/L) was prepared and diluted using dechlorinated tap water. Exposure solutions of TP were at 10 ng/L. Four-month-old female zebrafish (body length 2.5 ± 0.5 cm) were randomly assigned to three groups: a control group (n=90), a BPA-exposed group (n=90), and a BPA-TP group (n=90). Each group consisted of at least three repetitions. On average, the water was changed 1/3 every day for 30 days preceding ovary analysis and the control group did not have any treatment. The BPA-exposed group added BPA and the BPA-TP group added BPA-TP to keep the BPA and TP in the water at 100 ug/L and 10 ng/L.
From the three groups, RNA was extracted from 30 mg of the ovaries after all samples were collected, using the RNA Extraction Kit (TaKaRa, Code: NO.9767) according to the manufacturer’s instructions. The Agilent 2100 Bioanalyzer (Agilent Technologies, Santa Clara, CA, USA) was used to validate the integrity of the RNA. Subsequently, library constructions were performed by the Truseq TM RNA sample prep kit (Illumina, San Diego, CA, USA). The RNA-Seq libraries were also sequenced by the Illumina sequencing platform to filter the raw data.
The differentially expressed genes (DEGs) were calculated based on the negative binomial distribution test in the DESeq software (http://bioconductor.org/packages/release/bioc/html/DESeq.html). Subsequent analysis of DEGs included the Eukaryotic Orthologous Groups (KOG) function annotation, the Gene Ontology (GO) classification, and the Kyoto Encyclopedia of Genes and Genomes (KEGG) metabolic pathway analysis. Among them, GO classification analyzed the function of DEGs and the KEGG pathway analyzed differential gene pathways and calculated the significance of the enrichment of differential genes in each pathway entry by a hypergeometric distribution test.
To validate the transcriptome data, quantitative real-time RT-PCR (qRT-PCR) was performed to analyze the expression patterns during the developmental progress of six mt-Nd genes. These genes were selected in the transcriptome expression data and might play key roles in zebrafish mitochondrial function. The primer sequences for β-actin and mt-Nd genes are shown in Table 1. According to the manufacturer’s instructions, the SYBR Premix Ex Taq TMII kit (TaKaRa, Code: DRR820A) was used to qRT-PCR reaction system. The qRT-PCR reaction cycles were as follows: 95°C for 5 min, followed by 40 cycles of 95°C for 5 s, and 60°C for 30 s. The gene β-actin was used as the internal reference gene for qRT-PCR. Concurrently, to confirm the specificity of the samples, we analyzed the dissociation curve.
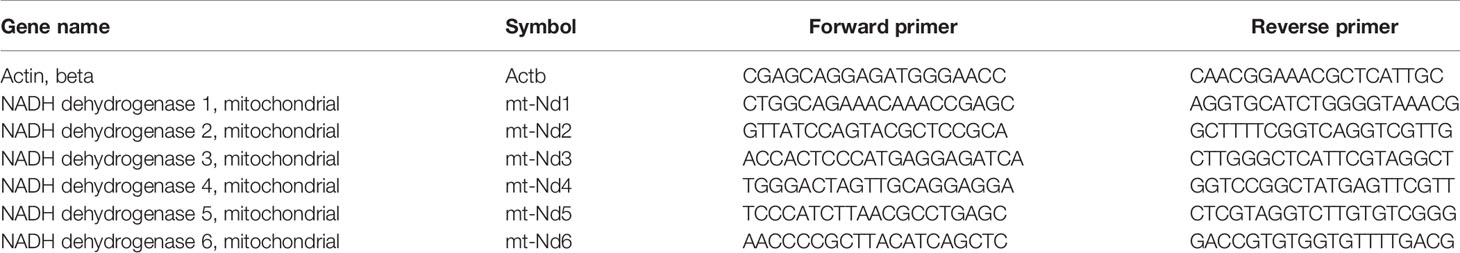
Table 1 Sequences of primer sets used for gene expression analysis.
The different expression level of genes was analyzed in different days among three groups, and the 2-ΔΔCT method was used to compare the relative expression levels of target genes and β-actin gene. All statistical analyses were expressed as mean ± SEM and assessed by two-way ANOVA. The level of statistical significance was accepted as p < 0.05 and symbolized as “*”.
The quality of the original sequence of the transcriptome sample library and sequence is shown in Table 2. The raw data is filtered to remove the linker sequence and low-quality reads in order to obtain high-quality clean data. A total of 63.66 Gb of clean data was obtained from nine samples in the control, experimental, and rescue groups, of which the clean data of each sample reached 6.14 Gb or above. The analysis showed that Q20 (the percentage of bases with base recognition accuracy of more than 99%) in the control, experimental, and rescue groups were all higher than 96.89%, and Q30 (the percentage of bases with base recognition accuracy of more than 99.9%) was higher than 91.64%. It can be seen that the transcriptome sequencing results are better, which ensures the accuracy of subsequent analysis.
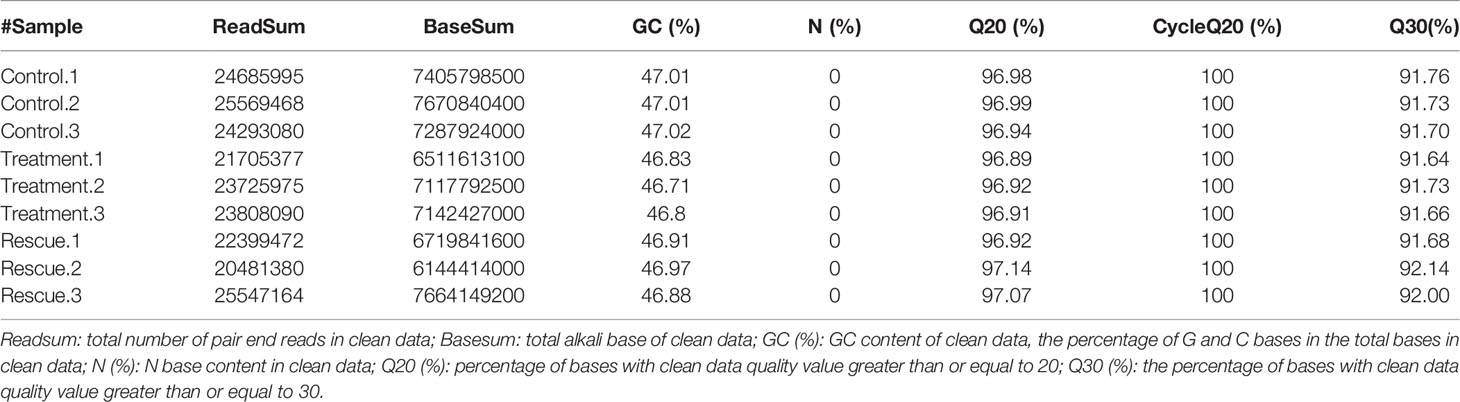
Table 2 Quality analysis of sequence after filtration.
HISAT2 (v2.1.0) is used to compare zebrafish genome as a reference sequence for alignment and reconstruct transcripts. The alignment results include alignment efficiency, coverage area, shear recognition statistics, etc. Among them, the alignment efficiency is the most direct embodiment of the utilization rate of transcriptome data (Table 3). The comparison efficiency of clean readings was above 92.04% for all nine samples in the control, experiment and rescue groups. The coverage area statistics are shown in Table 4, which shows the source ratio of Reads and confirms that the database creation type is correct. At the same time, the libraries are also quality controlled based on the result of the comparison and insert size inspection is performed. The results indicate that the fragment size recovered during the library construction was consistent with that sequenced (Figure 1). After the transcript was reconstructed, it would be compared with the interpretation of the previous reference sequence to establish the correspondence between the two versions, optimize the original gene structure annotation, and discover new transcripts and new genes. It is shown in Tables 5, 6 that the result of reconstruction and comparison. String Tie (v2.1.3) realizes more complete and accurate gene reconstruction and better predicts the expression level.
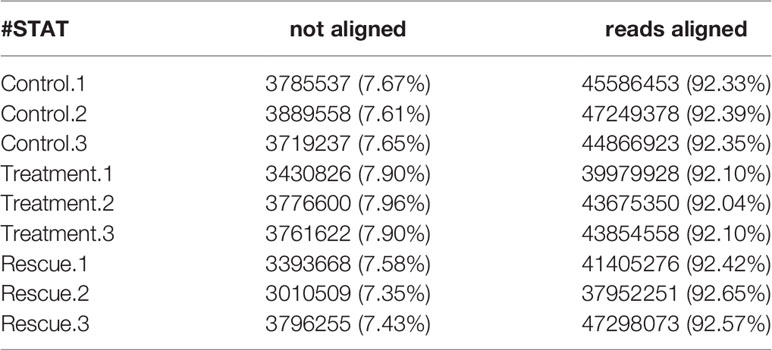
Table 3 Comparison efficiency statistics of Control, Treatment and Rescue.
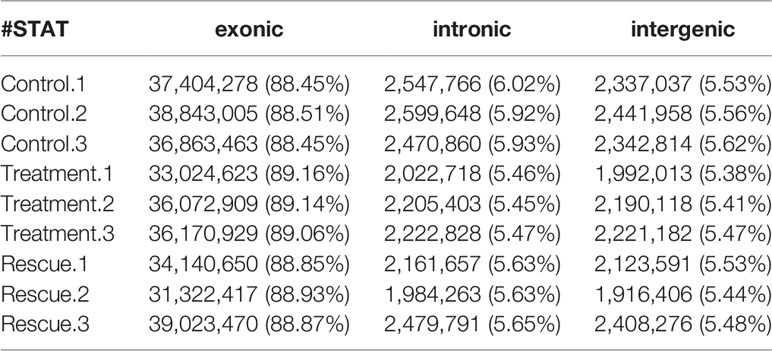
Table 4 Statistical table of Control, Treatment and Rescue.
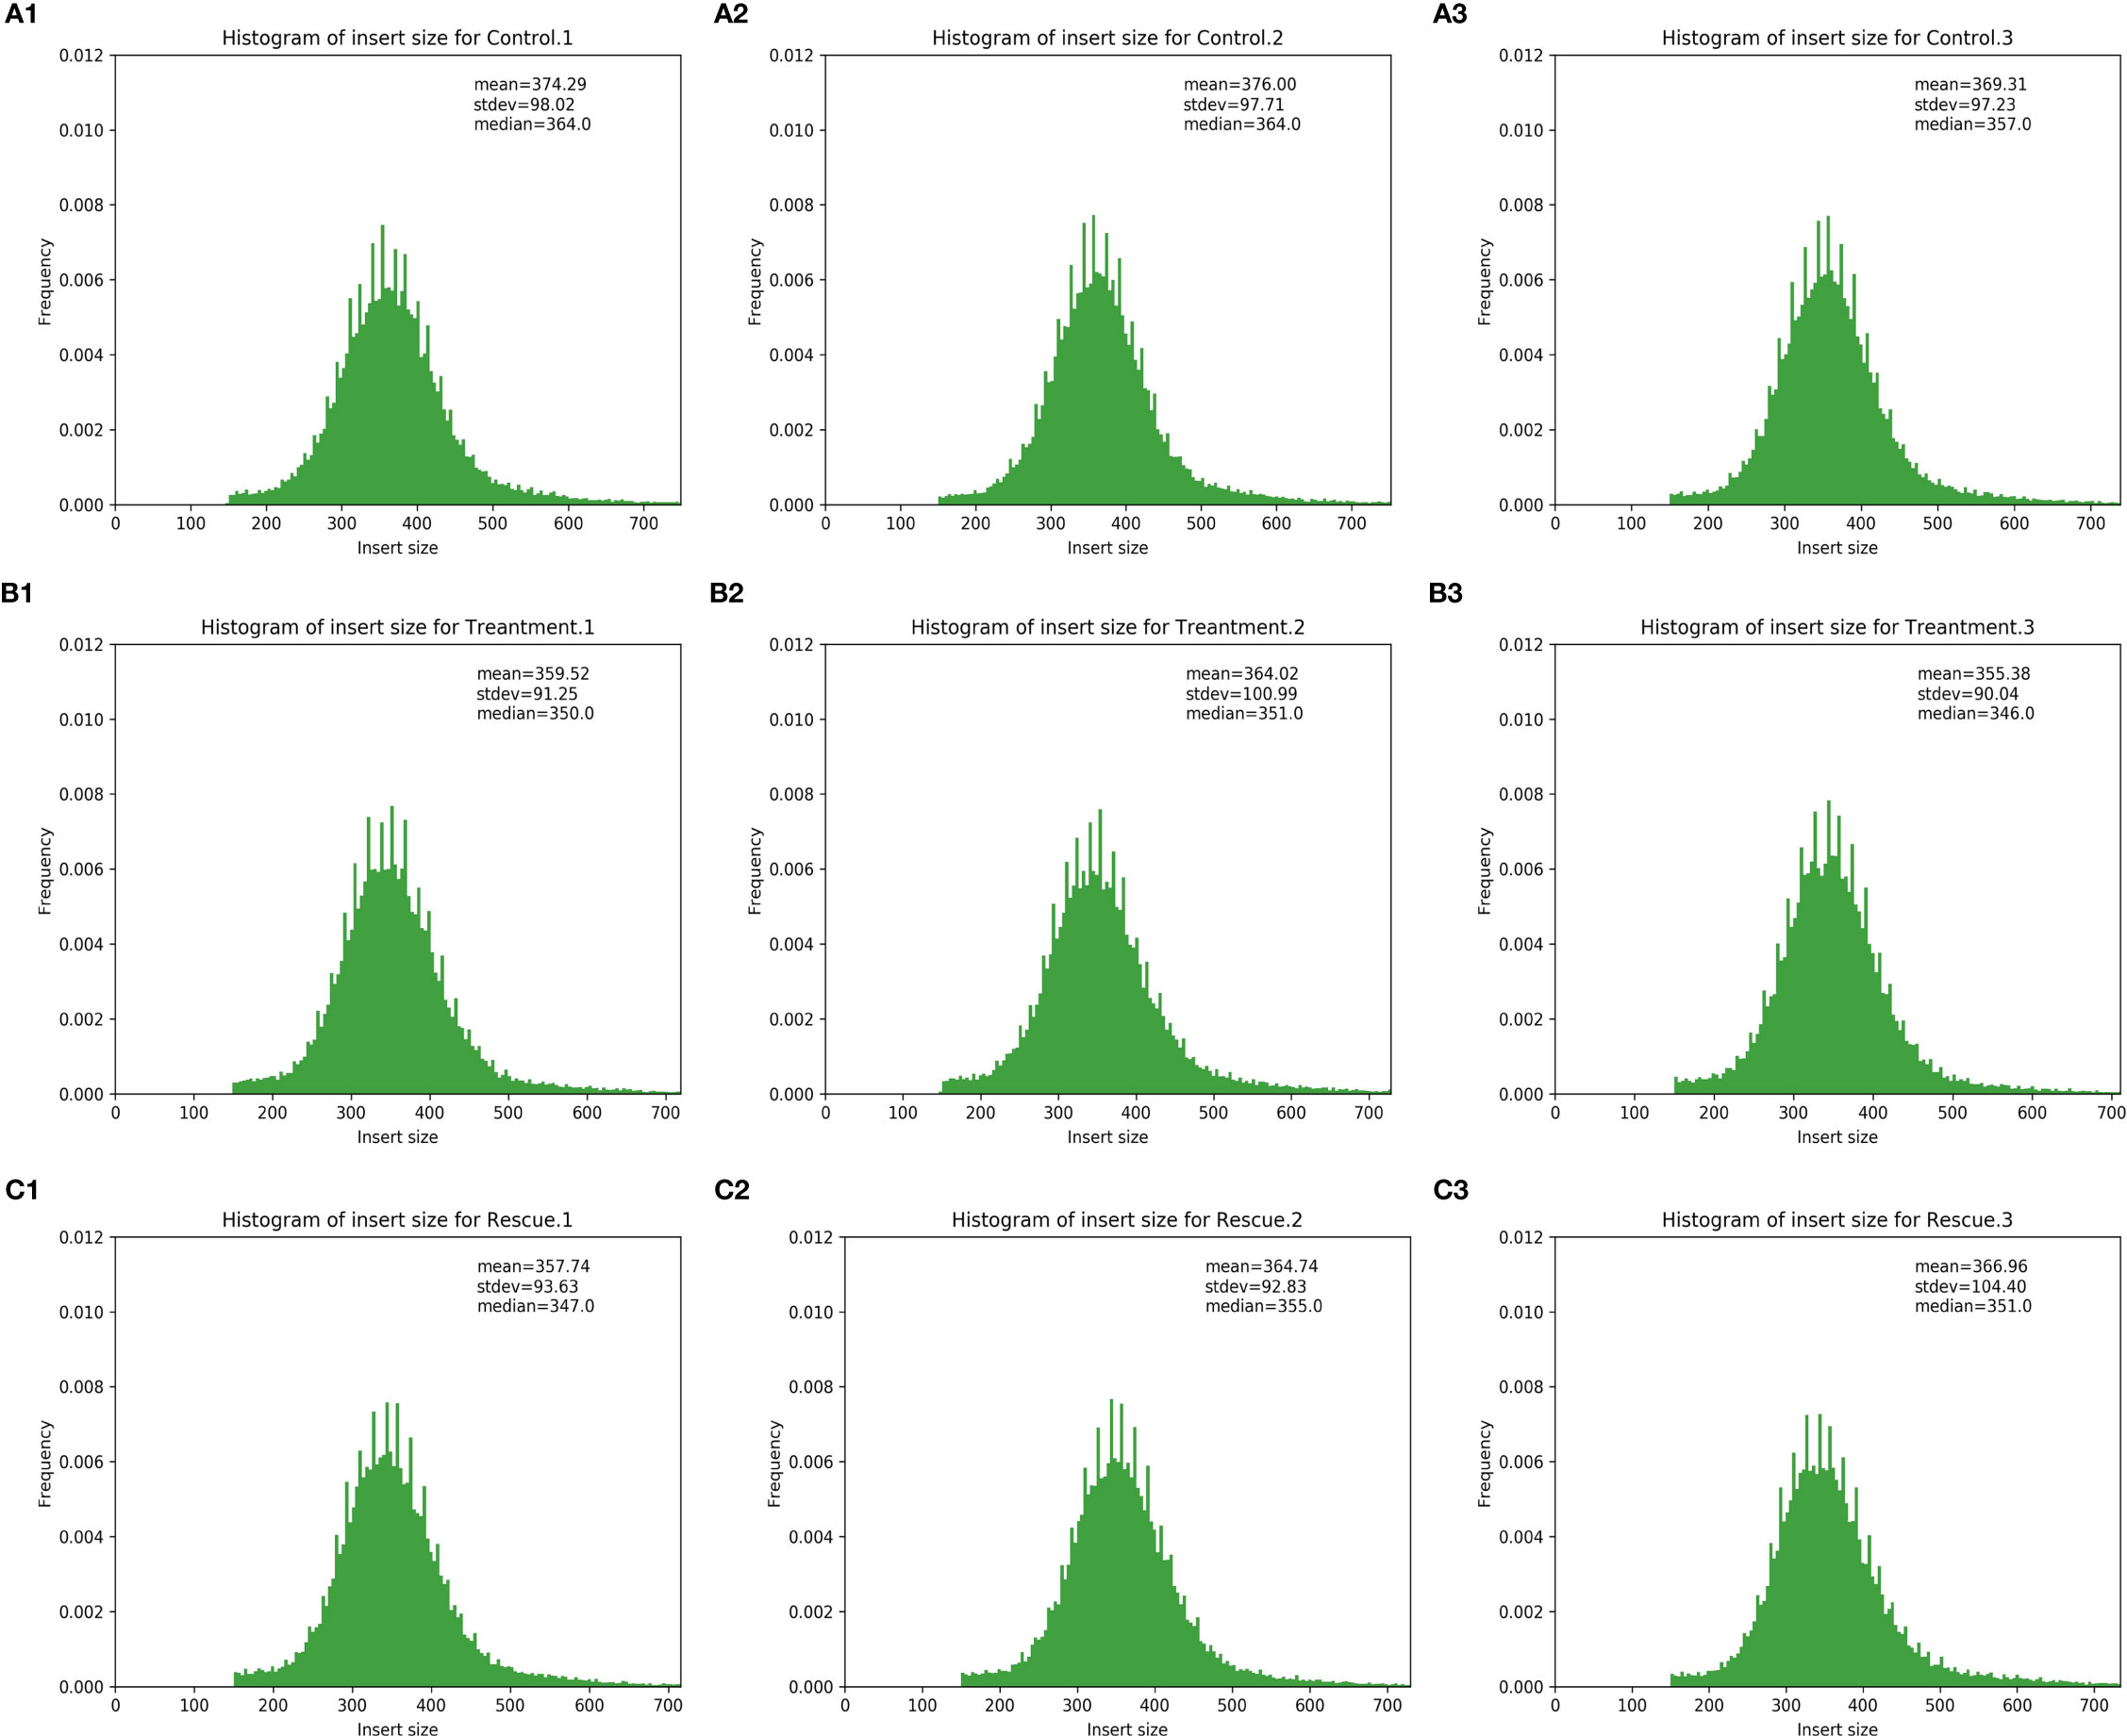
Figure 1 Inspection of insert size from Control, Treatment and Rescue samples. The x-axis represents insert size, and the y-axis indicated the ratio of the number of inserts to the total. (A-1) Control.1; (A-2) Control.2; (A-3) Control.3; (B-1) Treatment.1; (B-2) Treatment.2; (B-3) Treatment.3; (C-1) Rescue.1; (C-2) Rescue.2; (C-3) Rescue.3.
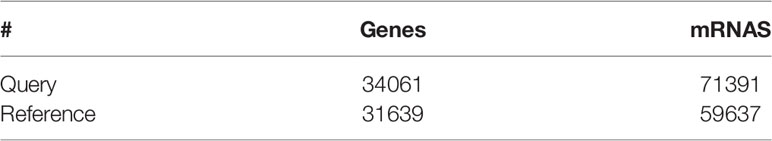
Table 5 Statistical table of transcript reconstruction results.

Table 6 Comparison statistical table of transcript reconstruction results.
When detecting differently expressed genes (DEGs) between the control and BPA-exposed groups, the results show that 3,683 genes were differentially expressed, of which 2,807 and 876 genes were considered to be up-and down-regulated BPA-exposed groups. And 3,579 genes were shown to be differentially expressed between BPA-exposed and BPA-TP groups, of which 2,338 and 1,241 genes were considered to be up-and down-regulated (Table 7). In addition, to determine the DEGs potentially involved in the three groups, statistical analysis of unigene data with DESeq was conducted; and the threshold value was set to Fold Change ≥ 2, with an FDR < 0.05 to standardize the expression differences between the different samples. All DEGs in the three groups were visualized in a scatter plot. The distribution trends in the volcano plot (Figure 2) display significantly DEGs (red and green dots), and non-differentially expressed genes (black dots). Moreover, by performing hierarchical cluster analysis on the selected differentially expressed genes and cluster genes with the same or similar expression behavior, we acquired the clustering results of DEGs (Figure 3).
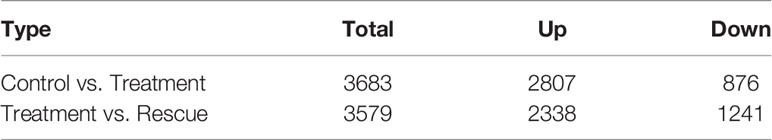
Table 7 Statistical table of the number of DEGs.
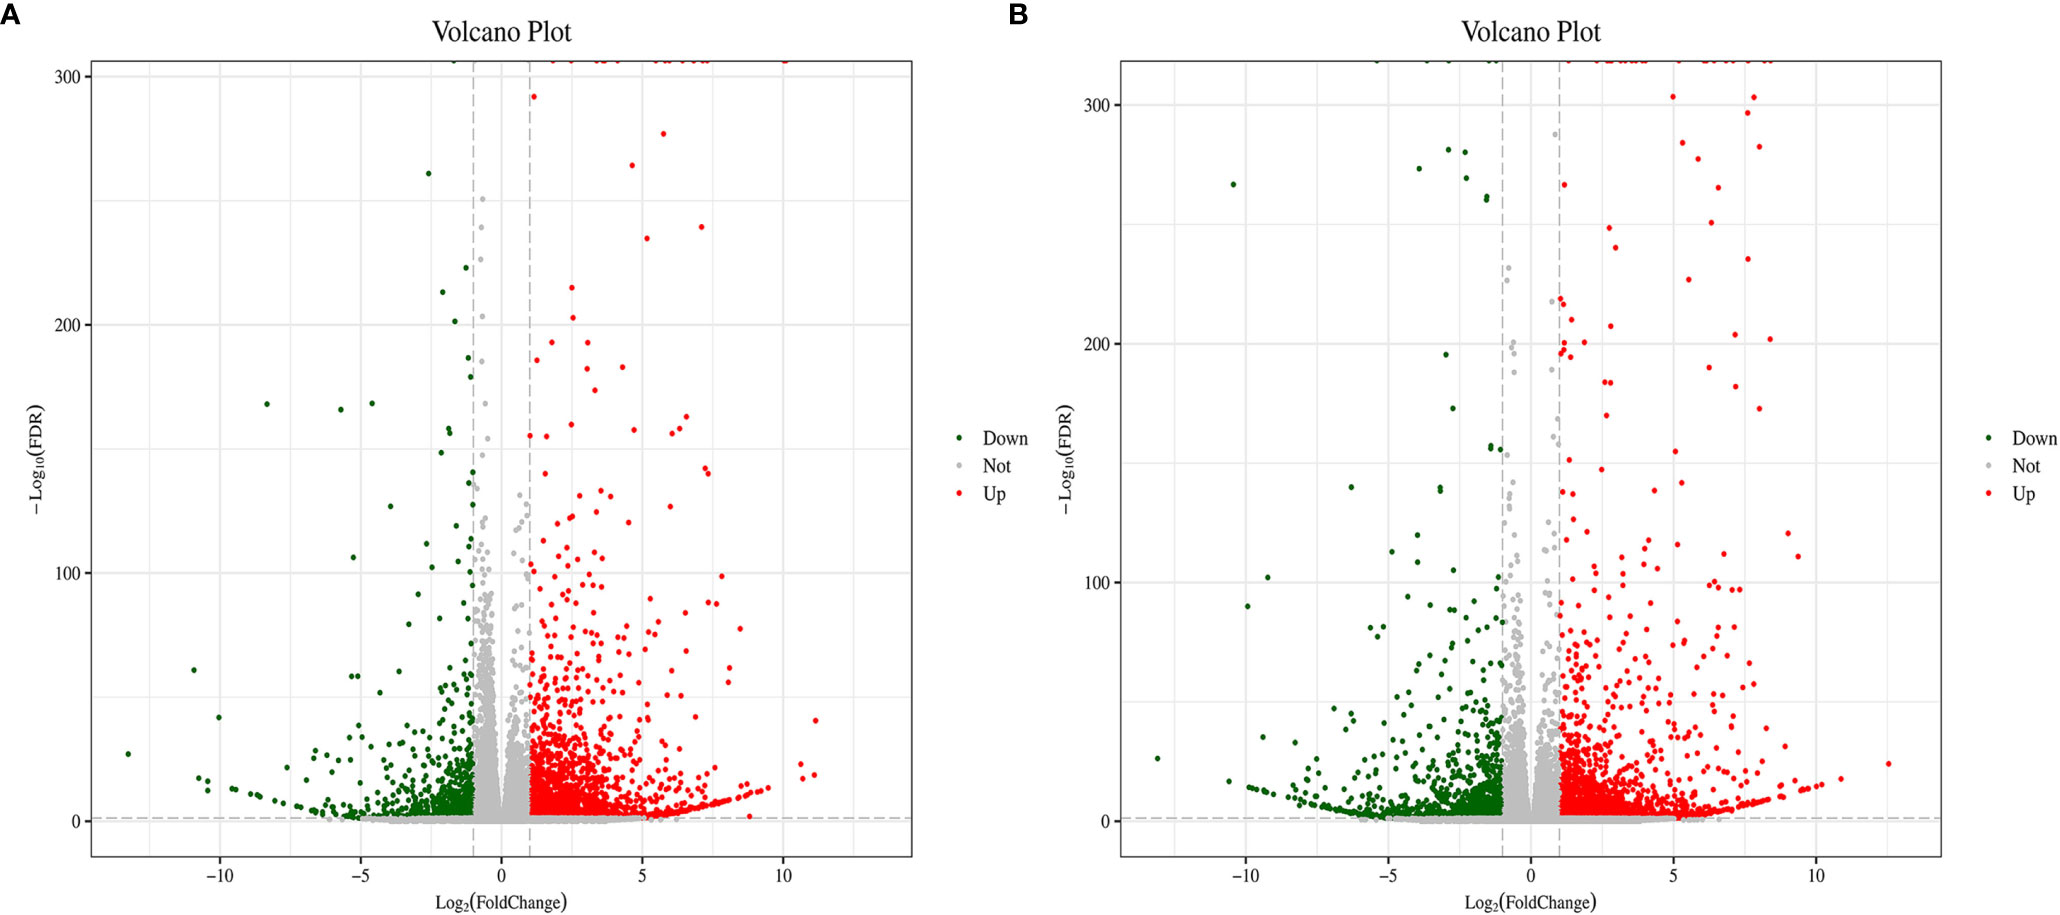
Figure 2 Overview of differently expressed genes between Control, Treatment and Rescue groups. Volcano plot can view the difference in gene expression levels between the two groups and the statistical significance of the difference. Each point in the volcano plot represents a gene, the x-axis represents the logarithm of the differential multiple of the expression of a gene in the two samples; the y-axis represents the negative logarithm of the FDR. The green dots in the figure represent down-regulated differentially expressed genes, the red dots represent up-regulated differentially expressed genes, and the black dots represent non-differentially expressed genes. (A) Control vs. Treatment; (B) Treatment vs. Rescue.
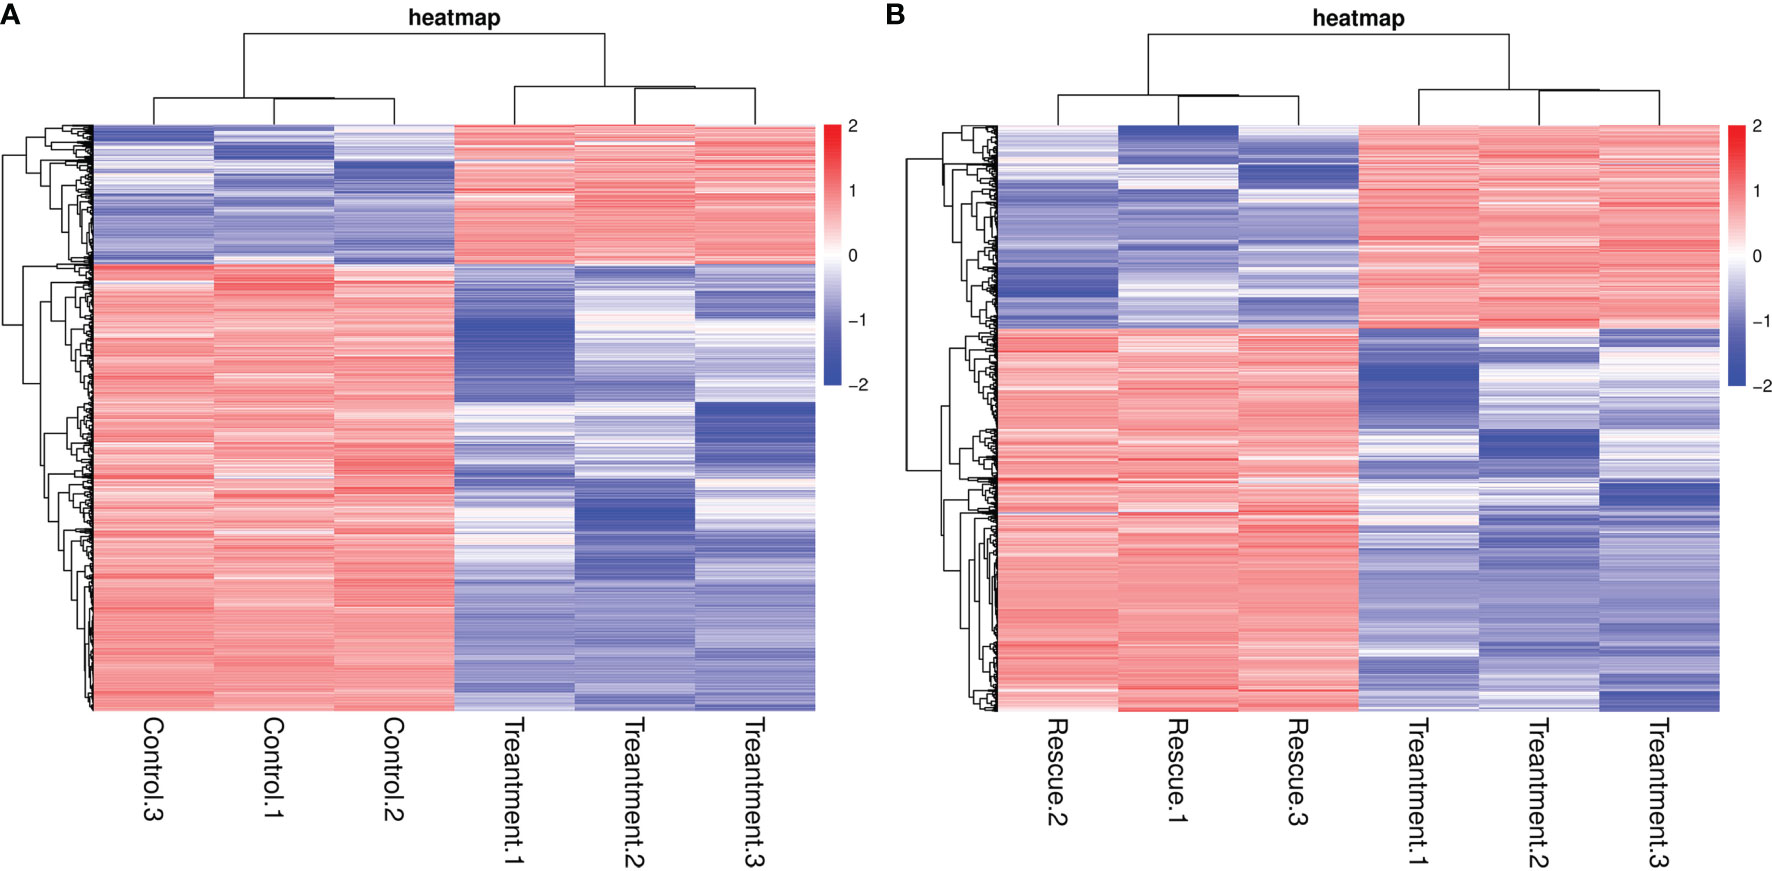
Figure 3 Cluster diagram of differentially expressed genes. The x-axis represents the sample name and the clustering result of the sample, and the y-axis represents the differential gene and the clustering result of the gene. Different columns represent different samples, and different rows represent different genes. The color represents the expression level of the gene in the sample log10 (gene+0.00001). (A) Control vs. Treatment; (B) Treatment vs. Rescue.
All DEGs from the three groups were used as queries for BLASTX searches against several protein databases, including the Nr database and the Swiss-Prot database. Among them, through the Nr and Swiss-Prot database, the control and BPA-exposed groups were compared to obtain 3,045 and 2,402 DEGs, which accounted for 99.25% and 78.29%, respectively. The BPA-exposed and BPA-TP groups were compared to obtain 2,845 and 2,169 DEGs, which annotated accounted for 98.78% and 75.31%, respectively (Table 8).
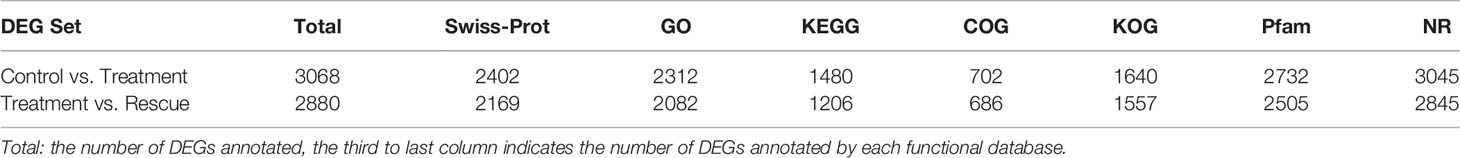
Table 8 Functional annotation of DEGs and Statistical table of the number of annotated DEGs.
The COG classification of the DEGs is essential for functional annotation and evolutionary studies. As shown in Figure 4, a total of 1,302 DEGs were finally mapped onto 25 different COG categories between control and BPA-exposed groups. The largest COG groups were “general function prediction only” (348 DEGs), followed by “signal transduction mechanisms” (143 DEGs) and “replication, recombination and repair” (135 DEGs). The shortest COG group was “nuclear structure” and “extracellular structures” (0 DEGs). A total of 1,379 DEGs were finally mapped onto 25 different COG categories between BPA-exposed and BPA-TP groups. The largest COG groups were “general function prediction only” (425 DEGs), followed by “signal transduction mechanisms” (162DEGs) and “replication, recombination and repair” (137 DEGs). The shortest COG group was “nuclear structure”, “extracellular structures” and “RNA processing and modification” (0 DEGs). Further, these regulated DEGs were mapped to 54 gene ontology (GO) terms, consisting of three major categories: biological processes (23 terms), cellular components (17 terms), and molecular functions (14 terms) (Figure 5).
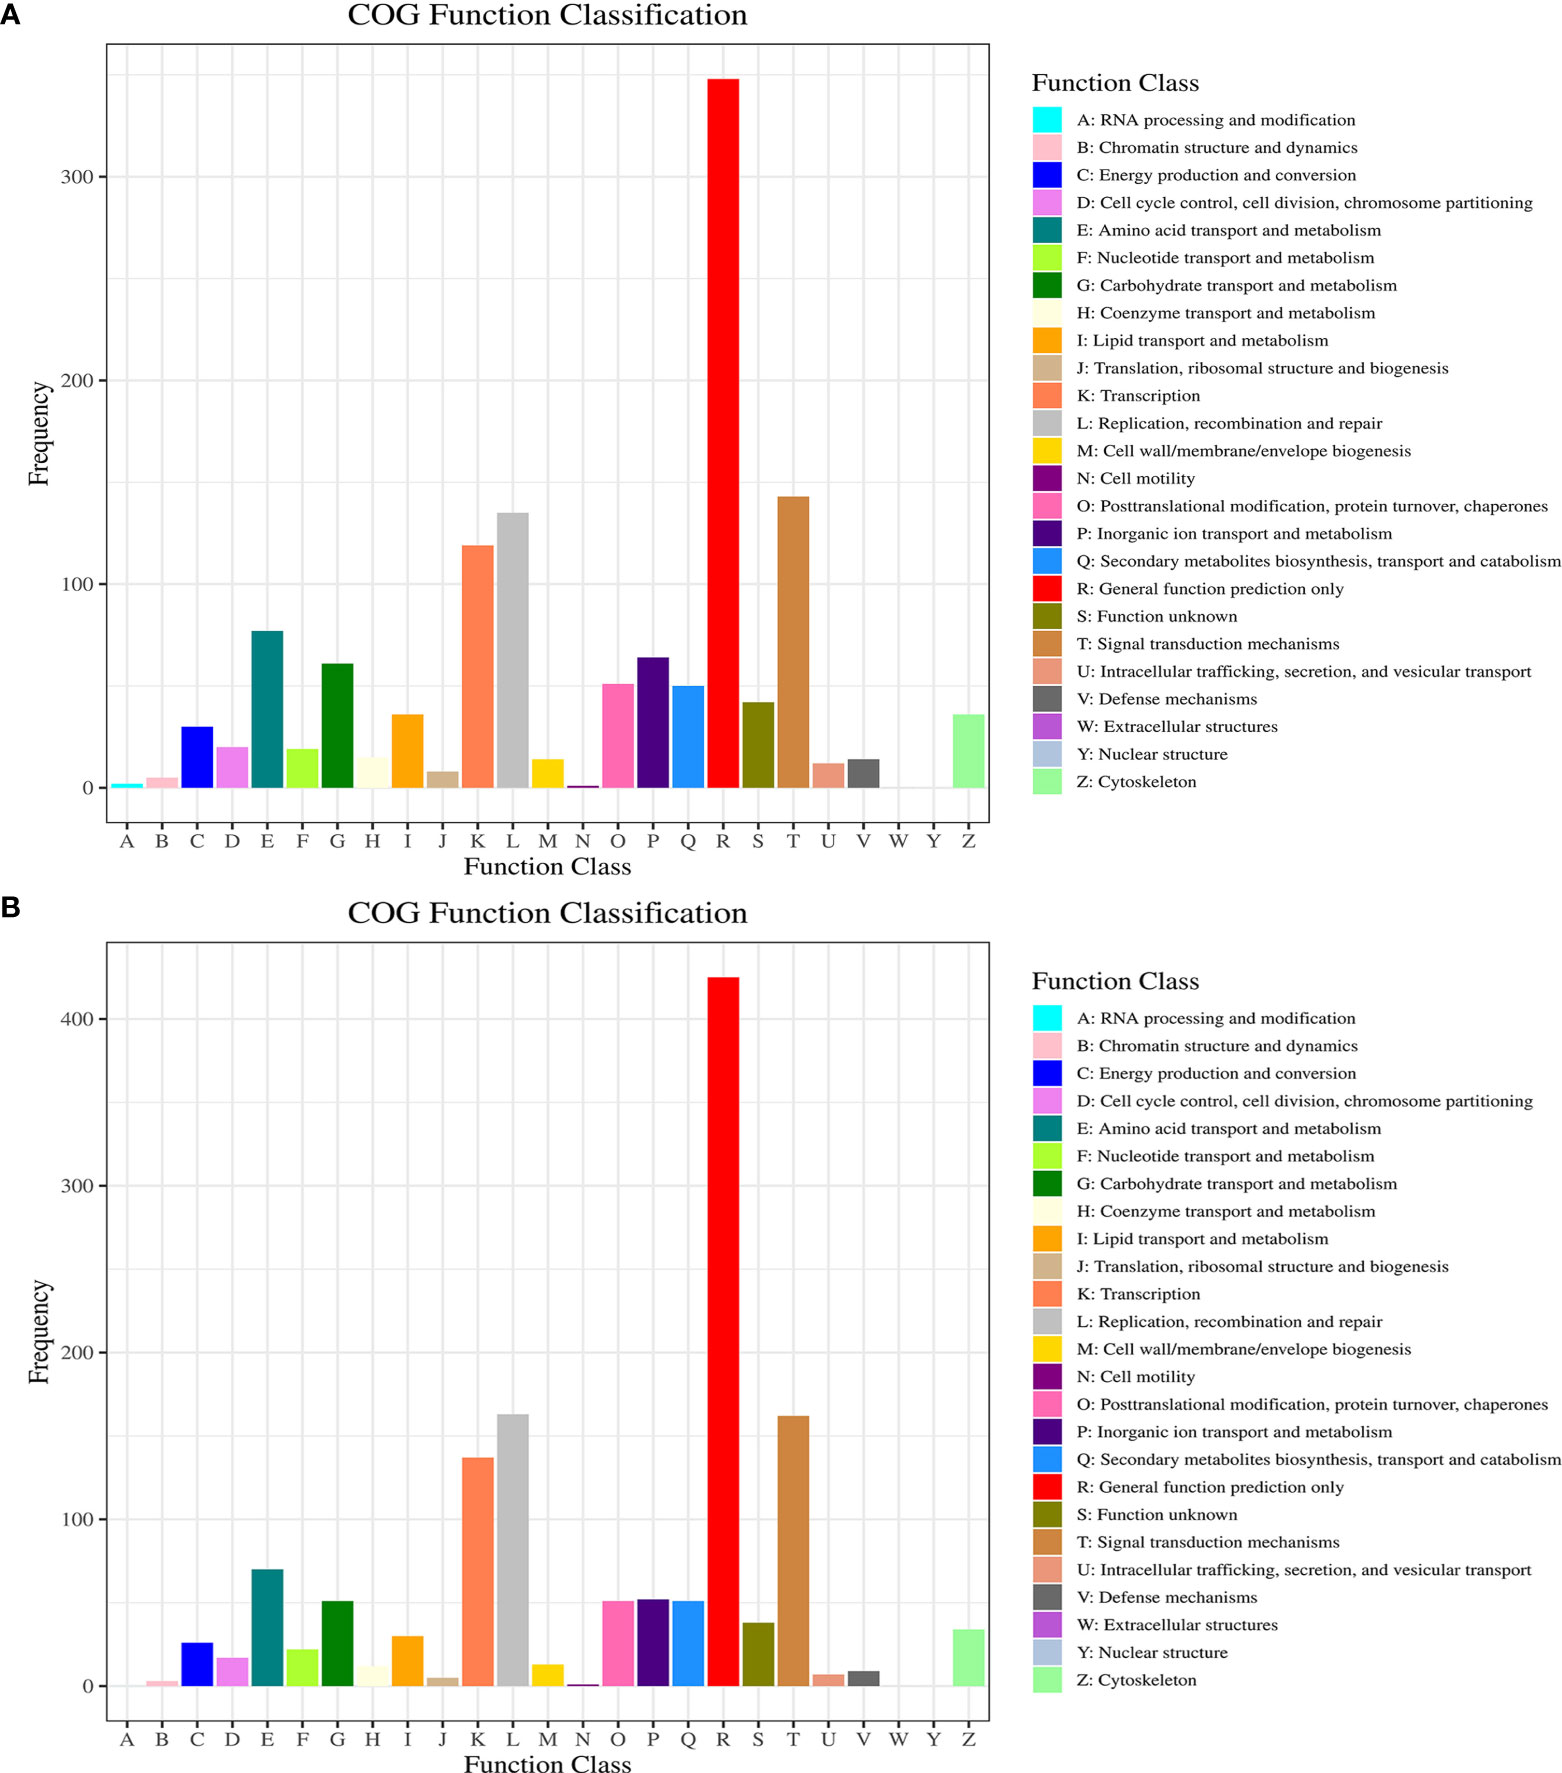
Figure 4 COG classification of DEGs from Control, Treatment and Rescue groups. The x-axis indicates the COG categories, and the y-axis indicates the number of DEGs. (A) Control vs. Treatment; (B) Treatment vs. Rescue.
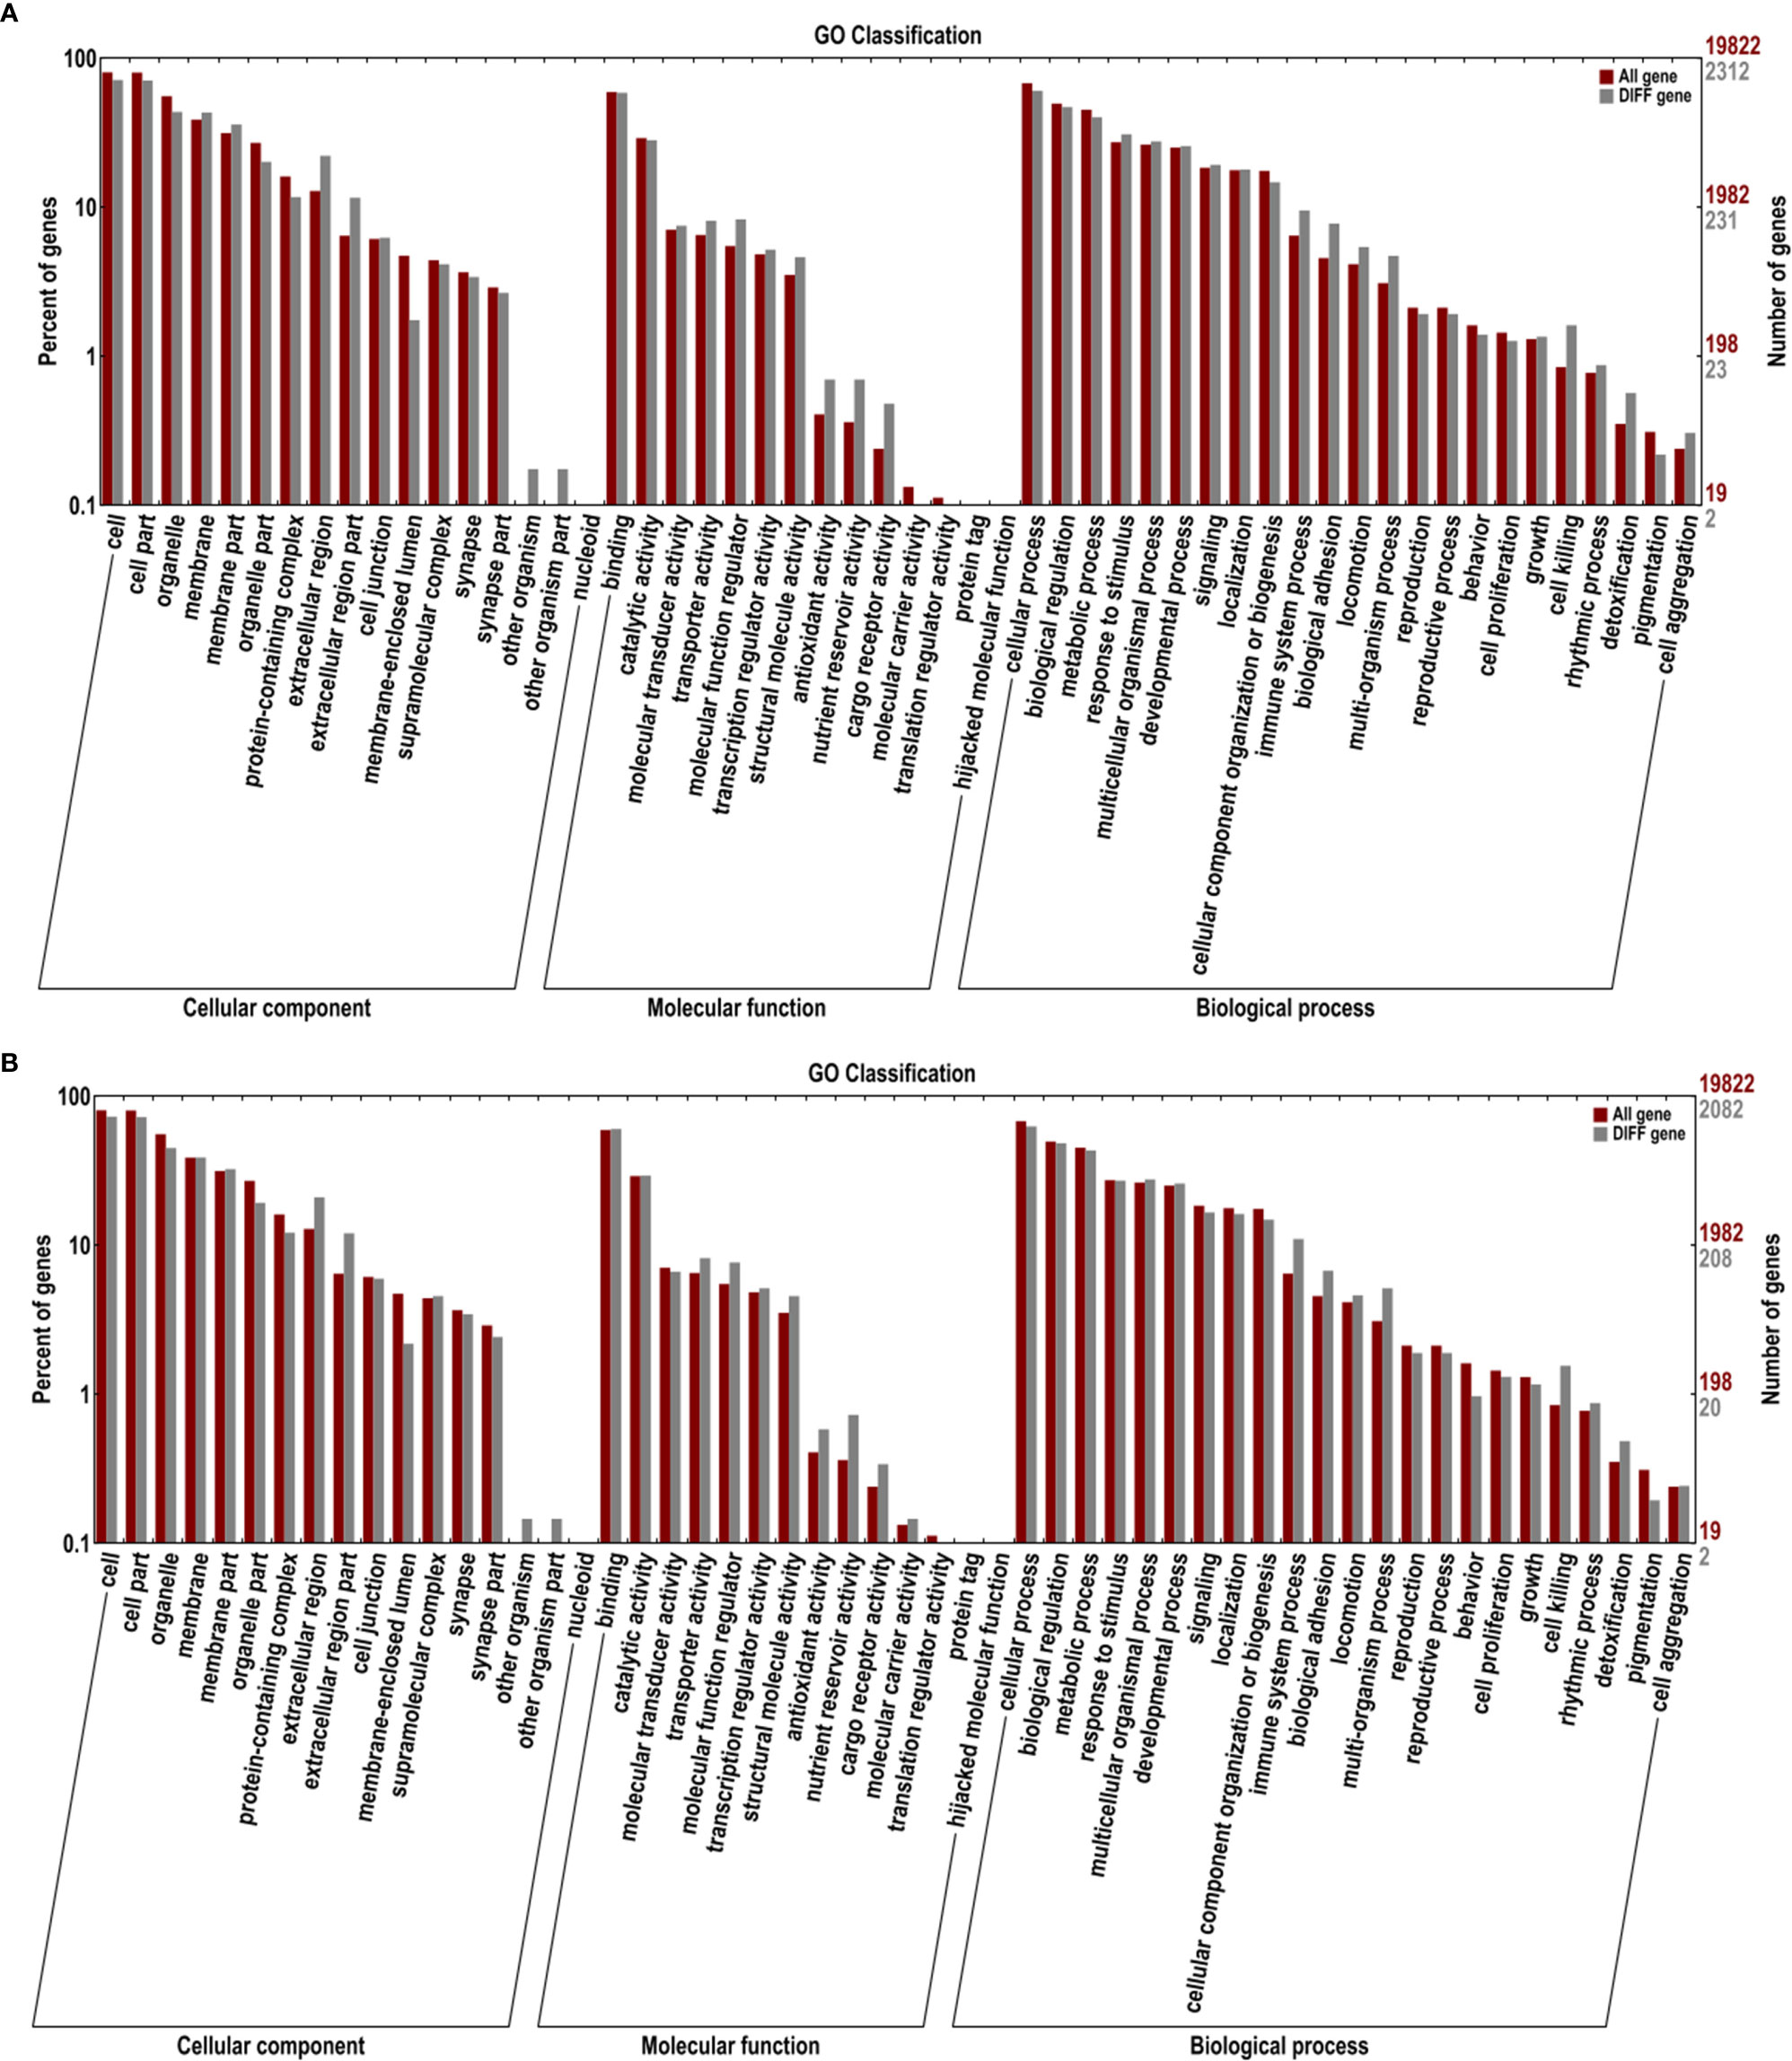
Figure 5 Gene ontology assignments for DEGs from Control, Treatments and Rescue groups. The DEGs matched various ontology (GO) categories, including biological process, cellular component and molecular function. The x-axis represents the gene functional classification of GO, and the y-axis indicates the enrichment score. (A) Treatment vs. Control; (B) Treatment vs. Rescue.
Finally, the top 20 KEGG enrichment pathways influenced by the control, BPA-exposed and BPA-TP groups are shown in Figure 6. Between control and BPA-exposed groups, the top three pathways were thiamine metabolism (3.9), steroid hormone biosynthesis (3.25) and nrachidonic acid metabolism (3.25). Between BPA-exposed and BPA-TP groups, the top three pathways were neomycin, kanamycin, and gentamicin biosynthesis (5.89), steroid hormone biosynthesis (3.72) and arachidonic acid metabolism (3.50).
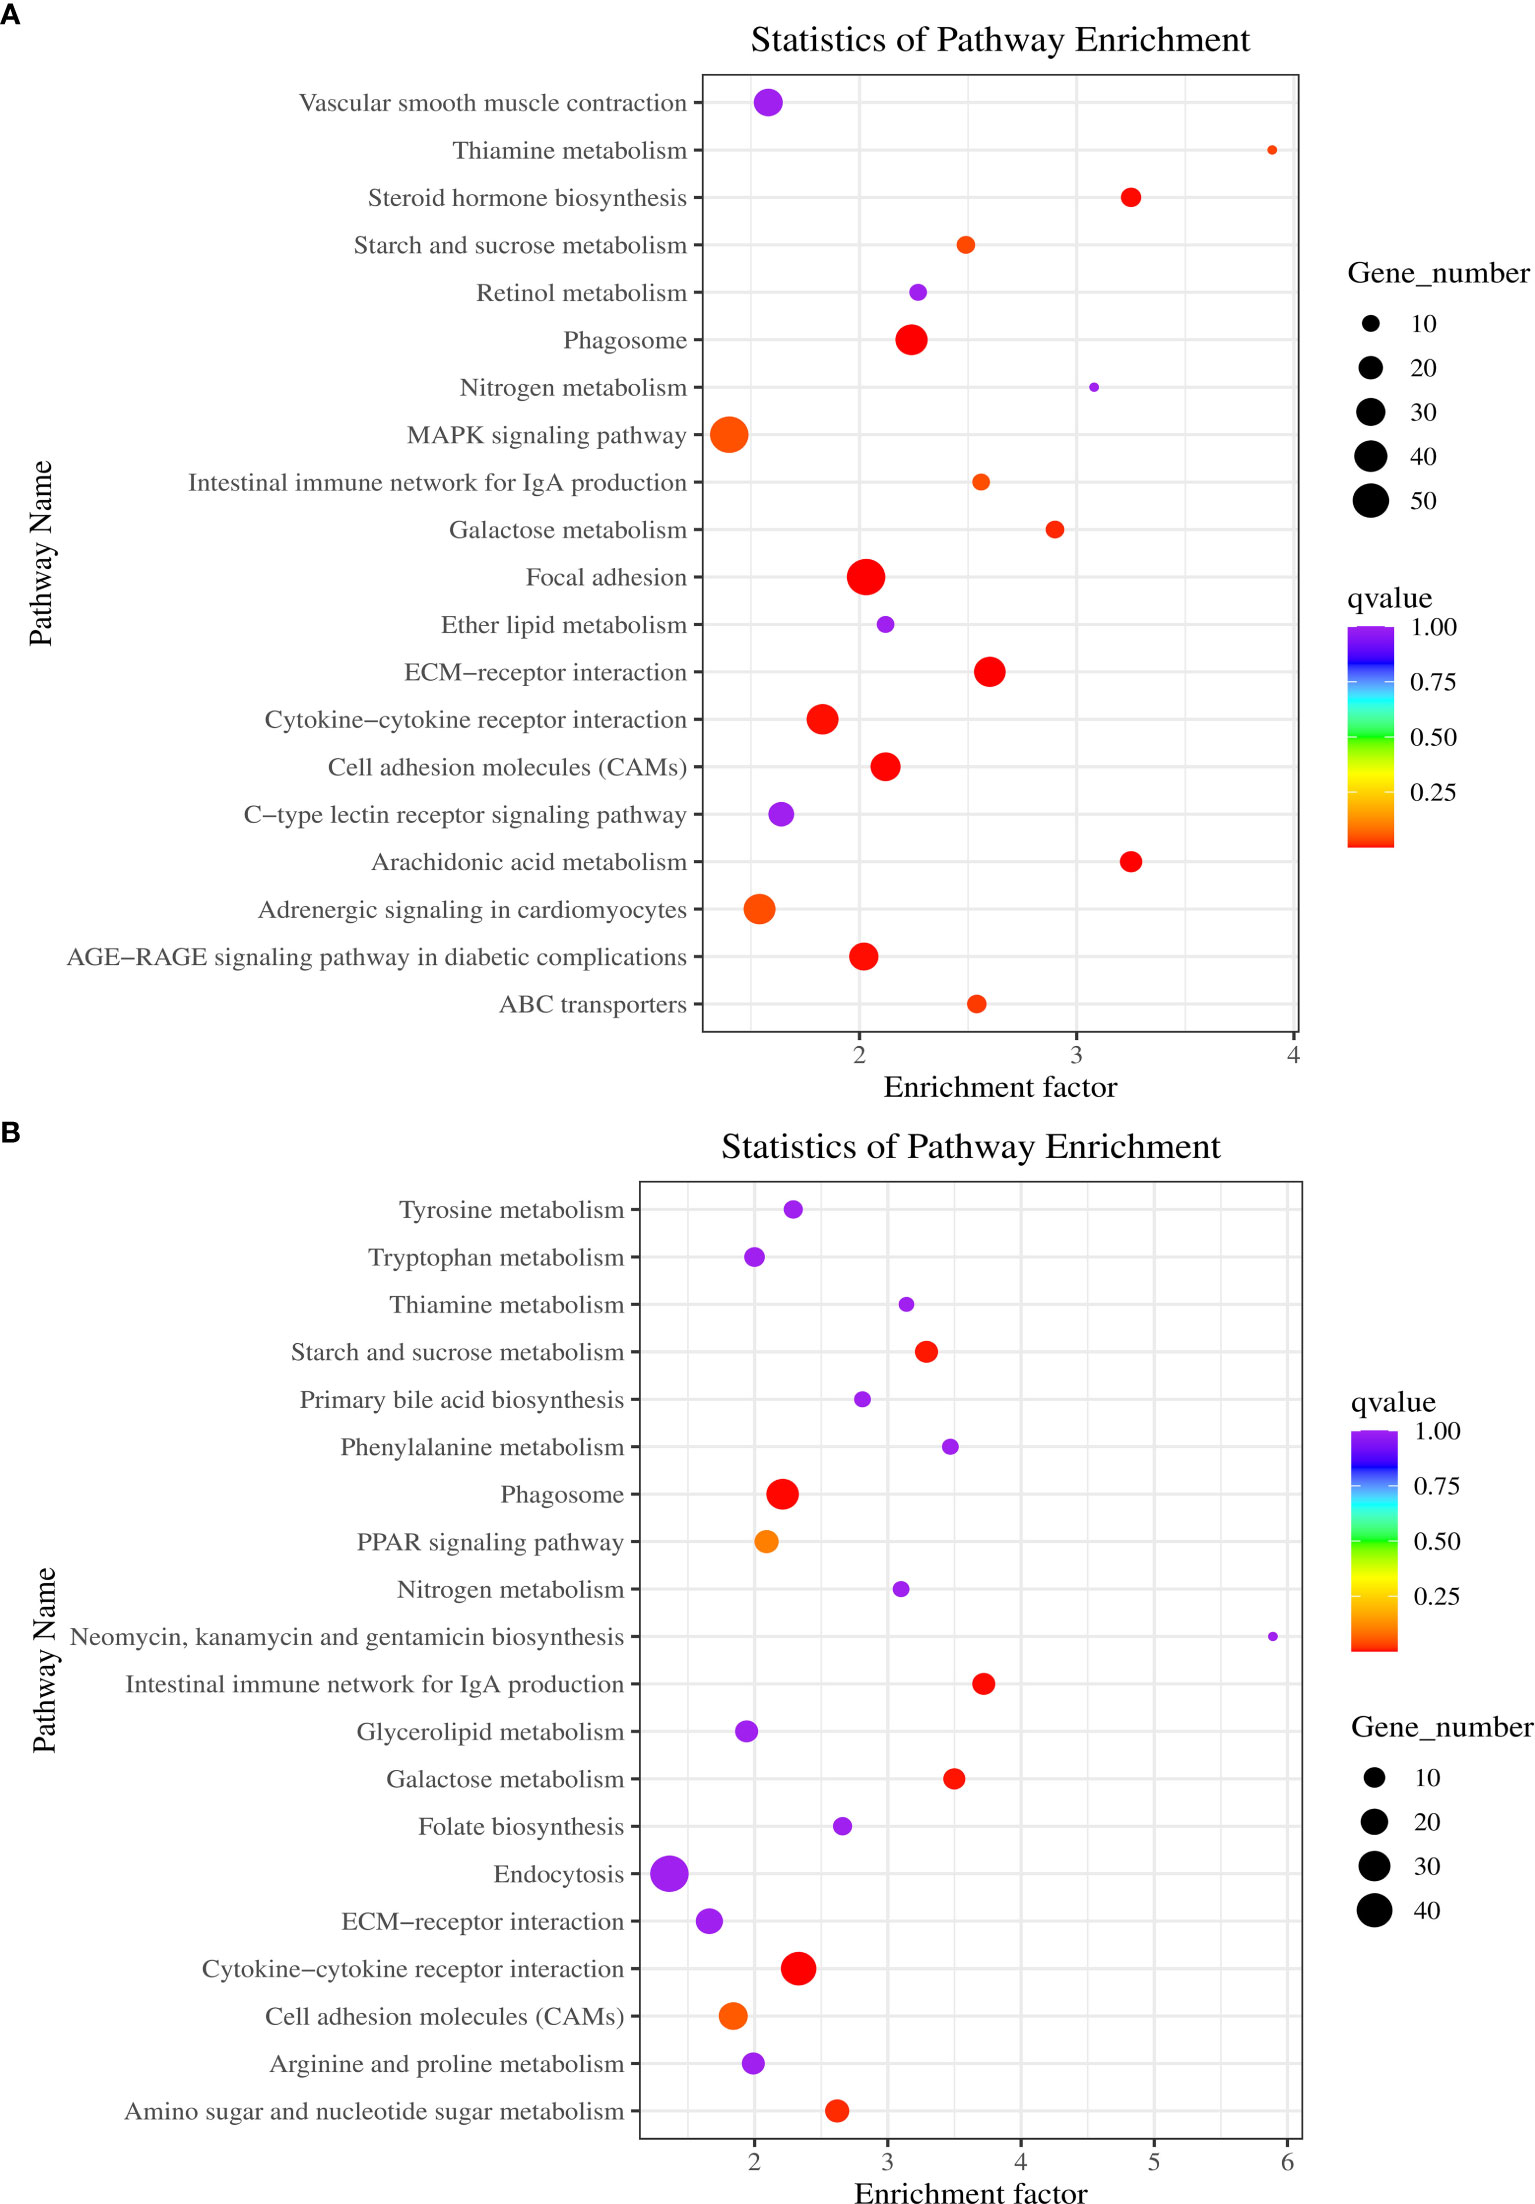
Figure 6 KEGG enrichment analysis during Control, Treatment and Rescue groups and the top 20 pathways. Each row represents a KEGG pathway. The x-axis is the enrichment factor, which represents the ratio of the proportion of genes annotated to the pathway among the DEGs to the proportion of genes annotated to the pathway among all genes. (A) Control vs. Treatment; (B) Treatment vs. Rescue.
According to the transcriptome data, six significantly down-regulated genes were selected 1/5/10/15/20/30 days after BPA treatment and TP rescue and the expression of mitochondrial DNA genes in the three groups were compared and analyzed. The results of qRT-PCR indicate that almost all six genes were significantly expressed (Figure 7).
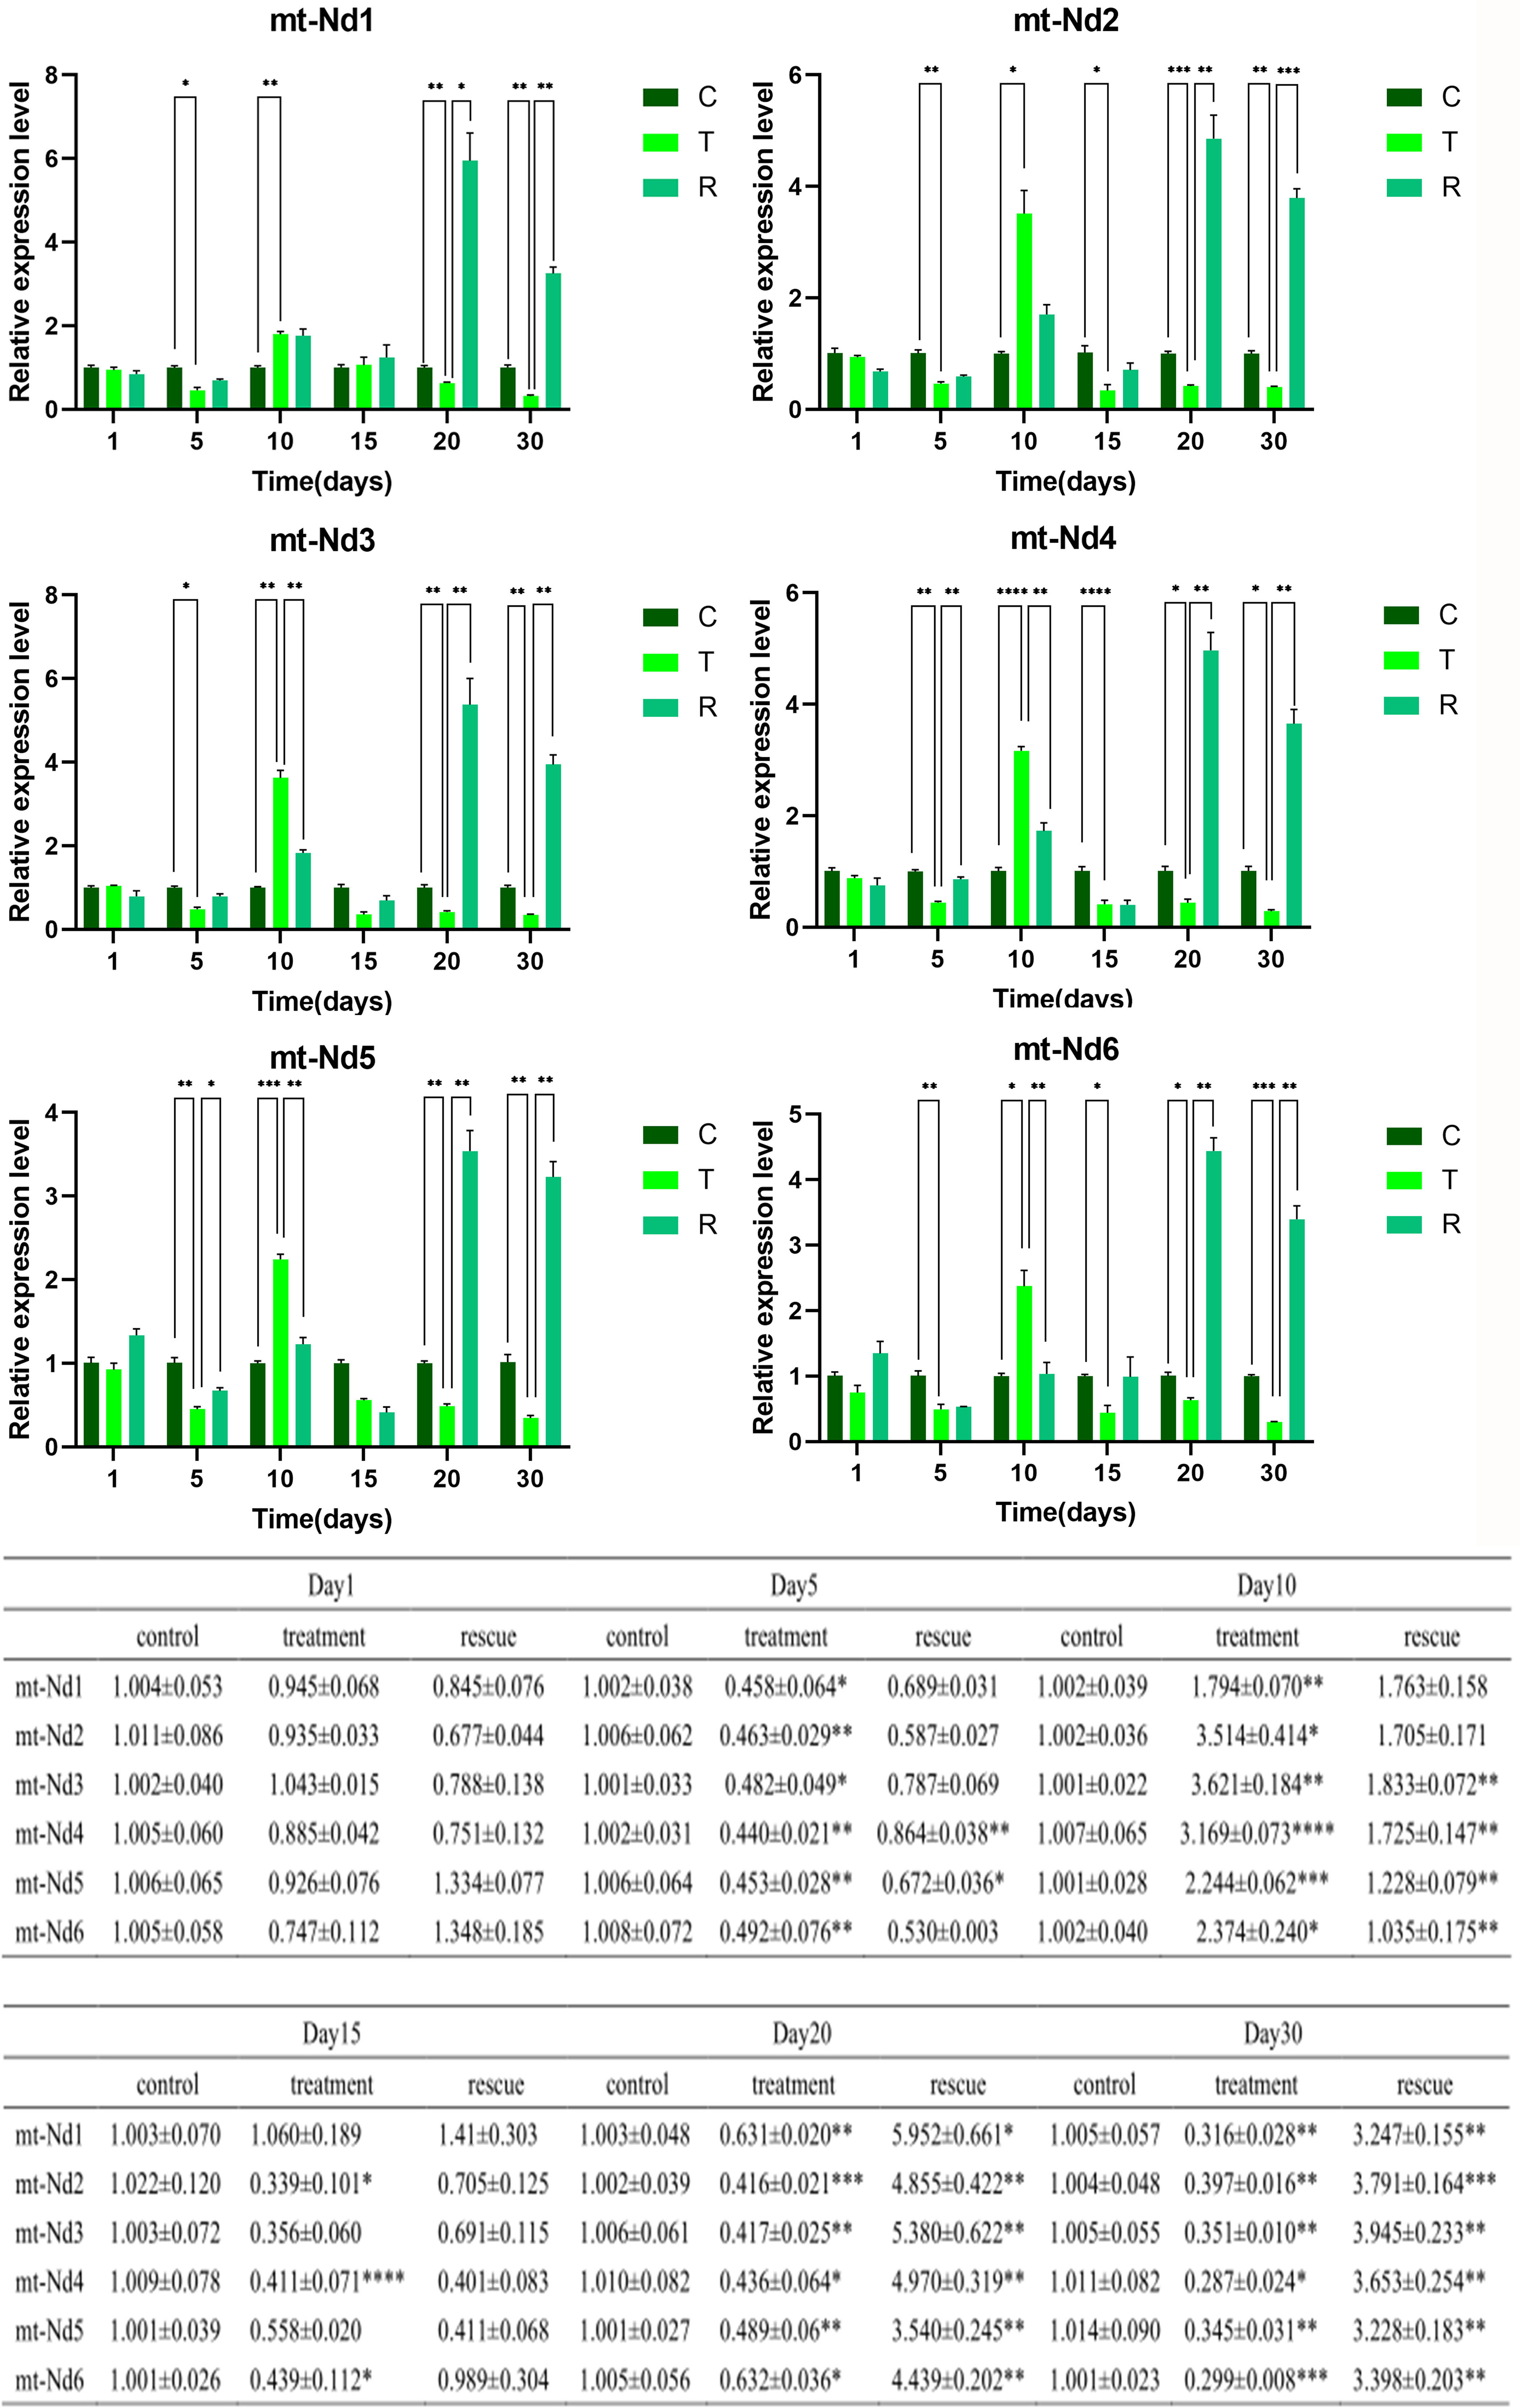
Figure 7 Expression patterns of six mt-Nd genes in female zebrafish ovaries in Control, Treatment and Rescue at different time points, data represent the mean ± SEM from at least three separate experiments, (*P < 0.05, **P < 0.01, ***P < 0.001, ****P < 0.0001), the vertical bar represents the standard error of mean (SEM).
One day after 0.1 mg/L BPA exposure, there was no significant difference in the expression levels of the six genes between the three groups. And, 5 days after BPA exposure, the mt-Nd genes were significantly decreased compared to the control group.
Then, in 15 days, the expression level of mtNd1, mt-Nd3, and mt-Nd5 did not show a significant difference between the three groups. Mt-Nd2, mt-Nd4, and mt-Nd6 which in the BPA group were significantly decreased compared to the control group.
In 20 days, the expression levels of the mt-Nd genes were significantly decreased in the BPA group, compared to the control group, and the mt-Nd genes which in the BPA-TP group were significant increased compared to the BPA group.
Finally, in 30 days, the expression levels of the mt-Nd genes in the BPA group were significantly decreased compared to the control group, and the mt-Nd genes in the BPA-TP group were significantly increased compared to the BPA group.
As one of the typical endocrine disrupting chemicals, the plasticizer BPA is ubiquitous and integrated into the environments such as soil, atmosphere, and water. Studies have demonstrated that BPA is enriched in phytoplankton through the food chain. Fish feed on phytoplankton and are again enriched in aquatic animals and finally in humans. Studies have shown that 1 mg/L BPA can significantly reduce the fertilization rate of zebrafish and low doses of 0.1 mg/L do not affect fertilization. However, whether low-dose BPA affects the fish reproductive system and how BPA impacts reproductive system has not fully defined. In addition, TP, as a robust antioxidant, can effectively scavenge free radicals and protect against oxidative stress. Furthermore, it has been reported that TP improves the follicular development in rats and promotes oocyte maturation as well as embryo development in bovines (Wang et al., 2007b; Wang et al., 2007a; Luo et al., 2008; Wang et al., 2013; Zhou et al., 2019). Therefore, we propose that TP could ameliorate BPA-induced reproductive system abnormalities.
To test it, we first investigated the gene expression of zebrafish ovaries. Transcriptome sequencing is an effective technique to better understand the pathways and gene expression. Our results show that BPA and TP affect certain zebrafish ovarian-specific genes. Through the analysis of differentially expressed genes in transcriptome data, six key mitochondrial-related genes (mt-Nd1, mt-Nd2, mt-Nd3, mt-Nd4, mt-Nd5, mt-Nd6) were found in the down-regulation of the BPA-exposed group.
Mitochondrion is a primary organelle that provides the source of ATP, determines the reproductive process, and mediates a variety of cellular processes, including cell apoptosis and the regulation of reactive oxygen species. Nicotine-amide adenine dinucleotide (NADH) dehydrogenase is the largest protein complex in mitochondrial respiratory chain. NADH consists of more than 40 subunits, seven of which are encoded by mtDNA, named as mitochondrially encoded NADH dehydrogenase (mt-Nd), including mt-Nd1, mt-Nd2, mtNd3, mt-Nd4, mt-Nd4L, mt-Nd5 and mt-Nd6.
To further explore the mt-Nd genes expression pattern, we examined the expression of six genes in different day by qRT-PCR and the expression level was quite certain with the transcriptomic data. Subsequently, we analyzed the expression patterns of six genes differently expressed after exposure to BPA, BPA-TP.
One day after 0.1 mg/L BPA exposure, there were no significant differences in the expression levels of the six genes. And, 5 days after BPA exposure, mt-Nd genes significantly decreased compared to the control group. However, the significantly increased expression levels of mt-Nd genes after 10 days of BPA exposure, which may be potential feedback mechanisms, were activated to protect the reduction of ovarian genes from BPA. Combining transcriptome data, the expression levels of mt-Nd genes significantly decreased after 15, 20, and 30 days of BPA exposure, indicating that from long-term exposure to BPA, the ovaries cannot rely on feedback mechanisms to rescue gene expression levels. Expectedly, co-administration of TP could, or even exceed, recovery of the expression levels of mt-Nd genes to the control groups.
Under normal physiologic, the mitochondrial respiratory chain is the main intracellular source of reactive oxygen species (ROS) and free radicals and there is a balance between ROS production and ROS scavenging systems in the cell (Lee and Wei, 2007). Being the major source of ROS, mitochondrial DNA will face more attack from oxidative stress (Hudson et al., 2005; Cha et al., 2015; Zhang et al., 2019). In the present study, we found that this process changes the expression of mt-Nd genes in the BPA-treated ovaries. In general, the dysfunction of mt-Nd genes might cause the disorder of the mitochondrial respiratory chain and oxidative phosphorylation (Zhang et al., 2019). Oxidative stress plays an important role in endocrine disruptor-mediated dysfunction in reproduction and it is thought that ROS may serve as an early marker for toxicity evaluation (Lam et al., 2008; Dai et al., 2015). Our analysis illustrates that BPA would adversely affect the mitochondrial respiratory chain in ovaries, leading to oxidative stress and reproductive disorders. TP, as a robust antioxidant, was able to recover the BPA-exposure-induced reproductive disorders by eliminating the excessive ROS, thereby inhibiting the accumulation of DNA damage.
Collectively, our study provides evidence that TP plays a protective role in ovarian mitochondrial dysfunction in low-concentration BPA-treated female zebrafish. However, the detailed mechanism of how BPA disrupts the mtDNA expression and needs further investigation.
The datasets presented in this study can be found in online repositories. The names of the repository/repositories and accession number(s) can be found below: NCBI [accession: PRJNA825753].
The animal study was reviewed and approved by Zhejiang Ocean University, Zhoushan.
XD and LQ: Investigation, Conceptualization, Writing-original draft. HZ: Preparation of experimental fishes. CX: Data curation, Methodology, Software. BZ: Supervision, Project administration, Funding acquisition. YG and HL: Conceptualization, Validation, Formal analysis. YM and ZC: Writing-review & editing, Supervision. All authors contributed to the article and approved the submitted version.
The study was supported by the National Natural Science Foundation of China, Grant/Award Number: 31801246.
The authors declare that the research was conducted in the absence of any commercial or financial relationships that could be construed as a potential conflict of interest.
All claims expressed in this article are solely those of the authors and do not necessarily represent those of their affiliated organizations, or those of the publisher, the editors and the reviewers. Any product that may be evaluated in this article, or claim that may be made by its manufacturer, is not guaranteed or endorsed by the publisher.
The Supplementary Material for this article can be found online at: https://www.frontiersin.org/articles/fmars.2022.915415/full#supplementary-material
Baker M. E., Hardiman G. (2014). Transcriptional Analysis of Endocrine Disruption Using Zebrafish and Massively Parallel Sequencing. J. Mol. Endocrinol. 52 (3), R241–R256. doi: 10.1530/JME-13-0219
Belfroid A., Van Velzen M., van der Horst B., Vethaak D. (2002). Occurrence of Bisphenol A in Surface Water and Uptake in Fish: Evaluation of Field Measurements. Chemosphere 49 (1), 97–103. doi: 10.1016/s0045-6535(02)00157-1
Bravo-Sagua R., Parra V., Lopez-Crisosto C., Diaz P., Quest A. F., Lavandero S. (2017). Calcium Transport and Signaling in Mitochondria. Compr. Physiol. 7 (2), 623–634. doi: 10.1002/cphy.c160013
Brown K. H., Schultz I. R., Nagler J. J. (2007). Reduced Embryonic Survival in Rainbow Trout Resulting From Paternal Exposure to the Environmental Estrogen 17alpha-Ethynylestradiol During Late Sexual Maturation. Reproduction 134 (5), 659–666. doi: 10.1530/REP-07-0169
Calafat A. M., Kuklenyik Z., Reidy J. A., Caudill S. P., Ekong J., Needham L. L. (2005). Urinary Concentrations of Bisphenol A and 4-Nonylphenol in a Human Reference Population. Environ. Health Perspect. 113 (4), 391–395. doi: 10.1289/ehp.7534
Castillo-Sanchez R., Ramirez-Ricardo J., Martinez-Baeza E., Cortes-Reynosa P., Candanedo-Gonzales F., Gomez R., et al. (2020). Bisphenol A Induces Focal Adhesions Assembly and Activation of FAK, Src and ERK2 via GPER in MDA-MB-231 Breast Cancer Cells. Toxicol. In Vitro. 66, 104871. doi: 10.1016/j.tiv.2020.104871
Cha M. Y., Kim D. K., Mook-Jung I. (2015). The Role of Mitochondrial DNA Mutation on Neurodegenerative Diseases. Exp. Mol. Med. 47, e150. doi: 10.1038/emm.2014.122
Chen X., Sun C. K., Han G. Z., Peng J. Y., Li Y., Liu Y. X., et al. (2009). Protective Effect of Tea Polyphenols Against Paracetamol-Induced Hepatotoxicity in Mice is Significantly Correlated With Cytochrome P450 Suppression. World J. Gastroenterol. 15 (15), 1829–1835. doi: 10.3748/wjg.15.1829
Cho Y. J., Park S. B., Park J. W., Oh S. R., Han M. (2018). Bisphenol A Modulates Inflammation and Proliferation Pathway in Human Endometrial Stromal Cells by Inducing Oxidative Stress. Reprod. Toxicol. 81, 41–49. doi: 10.1016/j.reprotox.2018.06.016
Colborn T., Vom Saal F. S., Soto A. M. (1993). Developmental Effects of Endocrine-Disrupting Chemicals in Wildlife and Humans. Environ. Health Perspect. 101 (5), 378–384. doi: 10.1289/ehp.93101378
Cui H., Kong Y., Zhang H. (2012). Oxidative Stress, Mitochondrial Dysfunction, and Aging. J. Signal Transduction 2012, 646354. doi: 10.1155/2012/646354
Dai X. X., Duan X., Cui X. S., Kim N. H., Xiong B., Sun S. C. (2015). Melamine Induces Oxidative Stress in Mouse Ovary. PloS One 10 (11), e0142564. doi: 10.1371/journal.pone.0142564
Fenichel P., Chevalier N., Brucker-Davis F. (2013). Bisphenol A: An Endocrine and Metabolic Disruptor. Ann. Endocrinol. (Paris) 74 (3), 211–220. doi: 10.1016/j.ando.2013.04.002
Gore A. C., Walker D. M., Zama A. M., Armenti A. E., Uzumcu M. (2011). Early Life Exposure to Endocrine-Disrupting Chemicals Causes Lifelong Molecular Reprogramming of the Hypothalamus and Premature Reproductive Aging. Mol. Endocrinol. 25 (12), 2157–2168. doi: 10.1210/me.2011-1210
Guillette L. J. Jr., Gunderson M. P. (2001). Alterations in Development of Reproductive and Endocrine Systems of Wildlife Populations Exposed to Endocrine-Disrupting Contaminants. Reproduction 122 (6), 857–864. doi: 10.1530/rep.0.1220857
Higdon J. V., Frei B. (2003). Tea Catechins and Polyphenols: Health Effects, Metabolism, and Antioxidant Functions. Crit. Rev. Food Sci. Nutr. 43 (1), 89–143. doi: 10.1080/10408690390826464
Hill R. L. Jr., Janz D. M. (2003). Developmental Estrogenic Exposure in Zebrafish (Danio Rerio): I. Effects on Sex Ratio and Breeding Success. Aquat. Toxicol. 63 (4), 417–429. doi: 10.1016/s0166-445x(02)00207-2
Hudson G., Keers S., Yu-Wai-Man P., Griffiths P., Huoponen K., Savontaus M. L., et al. (2005). Identification of an X-Chromosomal Locus and Haplotype Modulating the Phenotype of a Mitochondrial DNA Disorder. Am. J. Hum. Genet. 77 (6), 1086–1091. doi: 10.1086/498176
Laing L. V., Viana J., Dempster E. L., Trznadel M., Trunkfield L. A., Uren Webster T. M., et al. (2016). Bisphenol A Causes Reproductive Toxicity, Decreases Dnmt1 Transcription, and Reduces Global DNA Methylation in Breeding Zebrafish (Danio Rerio). Epigenetics 11 (7), 526–538. doi: 10.1080/15592294.2016.1182272
Lam H. S., Ng P. C., Chu W. C., Wong W., Chan D. F., Ho S. S., et al. (2008). Renal Screening in Children After Exposure to Low Dose Melamine in Hong Kong: Cross Sectional Study. BMJ 337, a2991. doi: 10.1136/bmj.a2991
Larsen M. G., Bilberg K., Baatrup E. (2009). Reversibility of Estrogenic Sex Changes in Zebrafish (Danio Rerio). Environ. Toxicol. Chem. 28 (8), 1783–1785. doi: 10.1897/08-563.1
Lee C. C., Jiang L. Y., Kuo Y. L., Chen C. Y., Hsieh C. Y., Hung C. F., et al. (2015). Characteristics of Nonylphenol and Bisphenol A Accumulation by Fish and Implications for Ecological and Human Health. Sci. Total Environ. 502, 417–425. doi: 10.1016/j.scitotenv.2014.09.042
Lee H. C., Wei Y. H. (2007). Oxidative Stress, Mitochondrial DNA Mutation, and Apoptosis in Aging. Exp. Biol. Med. (Maywood) 232 (5), 592–606. doi: 10.3181/00379727-232-2320592
Lenie S., Cortvrindt R., Eichenlaub-Ritter U., Smitz J. (2008). Continuous Exposure to Bisphenol A During In Vitro Follicular Development Induces Meiotic Abnormalities. Mutat. Res. 651 (1-2), 71–81. doi: 10.1016/j.mrgentox.2007.10.017
Lin M. T., Beal M. F. (2006). Mitochondrial Dysfunction and Oxidative Stress in Neurodegenerative Diseases. Nature 443 (7113), 787–795. doi: 10.1038/nature05292
Luo L. L., Huang J., Fu Y. C., Xu J. J., Qian Y. S. (2008). Effects of Tea Polyphenols on Ovarian Development in Rats. J. Endocrinol. Invest. 31 (12), 1110–1118. doi: 10.1007/BF03345661
McLachlan J. A. (2001). Environmental Signaling: What Embryos and Evolution Teach Us About Endocrine Disrupting Chemicals. Endocr. Rev. 22 (3), 319–341. doi: 10.1210/edrv.22.3.0432
Mukherjee U., Samanta A., Biswas S., Das S., Ghosh S., Mandal D. K., et al. (2020). Bisphenol A-Induced Oxidative Stress, Hepatotoxicity and Altered Estrogen Receptor Expression in Labeo Bata: Impact on Metabolic Homeostasis and Inflammatory Response. Ecotoxicol. Environ. Saf. 202, 110944. doi: 10.1016/j.ecoenv.2020.110944
Pandey R., Ter Beek A., Vischer N. O., Smelt J. P., Kemperman R., Manders E. M., et al. (2015). Quantitative Analysis of the Effect of Specific Tea Compounds on Germination and Outgrowth of Bacillus Subtilis Spores at Single Cell Resolution. Food Microbiol. 45 (Pt A), 63–70. doi: 10.1016/j.fm.2014.03.006
Peretz J., Gupta R. K., Singh J., Hernandez-Ochoa I., Flaws J. A. (2011). Bisphenol A Impairs Follicle Growth, Inhibits Steroidogenesis, and Downregulates Rate-Limiting Enzymes in the Estradiol Biosynthesis Pathway. Toxicol. Sci. 119 (1), 209–217. doi: 10.1093/toxsci/kfq319
Pivonello C., Muscogiuri G., Nardone A., Garifalos F., Provvisiero D. P., Verde N., et al. (2020). Bisphenol A: An Emerging Threat to Female Fertility. Reprod. Biol. Endocrinol. 18 (1), 22. doi: 10.1186/s12958-019-0558-8
Rudel R. A., Camann D. E., Spengler J. D., Korn L. R., Brody J. G. (2003). Phthalates, Alkylphenols, Pesticides, Polybrominated Diphenyl Ethers, and Other Endocrine-Disrupting Compounds in Indoor Air and Dust. Environ. Sci. Technol. 37 (20), 4543–4553. doi: 10.1021/es0264596
Salvaggio A., Tiralongo F., Krasakopoulou E., Marmara D., Giovos I., Crupi R., et al. (2019). Biomarkers of Exposure to Chemical Contamination in the Commercial Fish Species Lepidopus Caudatus (Euphrasen 1788): A Particular Focus on Plastic Additives. Front. Physiol. 10. doi: 10.3389/fphys.2019.00905
Sayici I. U., Simsek Orhon F., Topcu S., Ulukol B., Baskan S. (2019). Preliminary Study on Bisphenol A Levels and Possible Exposure History of Mother and Exclusively Breastfed Infant Pairs. Eur. J. Pediatr. 178 (4), 541–550. doi: 10.1007/s00431-019-03329-4
Srirattana K., St John J. C. (2019). Transmission of Dysfunctional Mitochondrial DNA and Its Implications for Mammalian Reproduction. Adv. Anat. Embryol. Cell Biol. 231, 75–103. doi: 10.1007/102_2018_3
Von Goetz N., Wormuth M., Scheringer M., Hungerbuhler K. (2010). Bisphenol a: How the Most Relevant Exposure Sources Contribute to Total Consumer Exposure. Risk Anal. 30 (3), 473–487. doi: 10.1111/j.1539-6924.2009.01345.x
Wang Z., Fu C., Yu S. (2013). Green Tea Polyphenols Added to IVM and IVC Media Affect Transcript Abundance, Apoptosis, and Pregnancy Rates in Bovine Embryos. Theriogenology 79 (1), 186–192. doi: 10.1016/j.theriogenology.2012.10.002
Wang Z. G., Yu S. D., Xu Z. R. (2007a). Effect of Supplementation of Green Tea Polyphenols on the Developmental Competence of Bovine Oocytes In Vitro. Braz. J. Med. Biol. Res. 40 (8), 1079–1085. doi: 10.1590/s0100-879x2007000800008
Wang Z. G., Yu S. D., Xu Z. R. (2007b). Improvement in Bovine Embryo Production In Vitro by Treatment With Green Tea Polyphenols During In Vitro Maturation of Oocytes. Anim. Reprod. Sci. 100 (1-2), 22–31. doi: 10.1016/j.anireprosci.2006.06.014
Wu M., Pan C., Chen Z., Jiang L., Lei P., Yang M. (2017). Bioconcentration Pattern and Induced Apoptosis of Bisphenol A in Zebrafish Embryos at Environmentally Relevant Concentrations. Environ. Sci. Pollut. Res. Int. 24 (7), 6611–6621. doi: 10.1007/s11356-016-8351-0
Yang S., Shao S., Huang B., Yang D., Zeng L., Gan Y., et al. (2020). Tea Polyphenols Alleviate Tri-Ortho-Cresyl Phosphate-Induced Autophagy of Mouse Ovarian Granulosa Cells. Environ. Toxicol. 35 (4), 478–486. doi: 10.1002/tox.22883
Zhang Z., Alomirah H., Cho H. S., Li Y. F., Liao C., Minh T. B., et al. (2011). Urinary Bisphenol A Concentrations and Their Implications for Human Exposure in Several Asian Countries. Environ. Sci. Technol. 45 (16), 7044–7050. doi: 10.1021/es200976k
Zhang T., Xi Q., Wang D., Li J., Wang M., Li D., et al. (2019). Mitochondrial Dysfunction and Endoplasmic Reticulum Stress Involved in Oocyte Aging: An Analysis Using Single-Cell RNA-Sequencing of Mouse Oocytes. J. Ovarian Res. 12 (1), 53. doi: 10.1186/s13048-019-0529-x
Keywords: zebrafish, bisphenol A, tea polyphenols, transcriptome, mitochondrial NADH dehydrogenase
Citation: Dai X, Qiu L, Zhang H, Xu C, Zhao B, Gao Y, Li H, Mu Y and Chu Z (2022) Tea Polyphenols Improve Down-Regulation of Mitochondrial Functional Gene Expression Induced by Bisphenol A in Zebrafish Ovaries. Front. Mar. Sci. 9:915415. doi: 10.3389/fmars.2022.915415
Received: 08 April 2022; Accepted: 29 April 2022;
Published: 30 May 2022.
Edited by:
Wan-Xi Yang, Zhejiang University, ChinaReviewed by:
Marika Scafuro, Second University of Naples, ItalyCopyright © 2022 Dai, Qiu, Zhang, Xu, Zhao, Gao, Li, Mu and Chu. This is an open-access article distributed under the terms of the Creative Commons Attribution License (CC BY). The use, distribution or reproduction in other forums is permitted, provided the original author(s) and the copyright owner(s) are credited and that the original publication in this journal is cited, in accordance with accepted academic practice. No use, distribution or reproduction is permitted which does not comply with these terms.
*Correspondence: Yi Mu, Ymx1ZWdsb2JlZmlzaEBhbGl5dW4uY29t; Zhangjie Chu, Y3pqMDUwMUB6am91LmVkdS5jbg==
†These authors have contributed equally to this work and share first authorship
Disclaimer: All claims expressed in this article are solely those of the authors and do not necessarily represent those of their affiliated organizations, or those of the publisher, the editors and the reviewers. Any product that may be evaluated in this article or claim that may be made by its manufacturer is not guaranteed or endorsed by the publisher.
Research integrity at Frontiers
Learn more about the work of our research integrity team to safeguard the quality of each article we publish.