
94% of researchers rate our articles as excellent or good
Learn more about the work of our research integrity team to safeguard the quality of each article we publish.
Find out more
ORIGINAL RESEARCH article
Front. Mar. Sci., 06 October 2022
Sec. Marine Ecosystem Ecology
Volume 9 - 2022 | https://doi.org/10.3389/fmars.2022.914475
 Elsa Breton1*
 Eric Goberville2
 Benoit Sautour3
 Anis Ouadi3
 Dimitra-Ioli Skouroliakou1Laurent Seuront1,4,5Gregory Beaugrand1Loïck Kléparski1,6
 Muriel Crouvoisier1David Pecqueur7Christophe Salmeron7Arnaud Cauvin1Adrien Poquet1,8Nicole Garcia9
 Francis Gohin10
 Urania Christaki1
The effect of environmental change in structuring the phytoplankton communities of the coastal waters of the Eastern English Channel was investigated by applying a trait-based approach on two decades (1996-2019) of monitoring on diatoms and Phaeocystis. We show that phytoplankton species richness in an unbalanced nutrient supply context was influenced by wind-driven processes, ecological specialization for dissolved inorganic phosphorous, temporal niche differentiation, and a competition-defense and/or a growth-defense trade-off, a coexistence mechanism where weak competitors (i.e., slower growing) are better protected against predation. Under the influence of both environmental perturbations (e.g., wind-driven processes, freshwater influence, unbalanced nutrient levels) and biotic interactions (e.g., competition, predation, facilitation), phytoplankton species exhibited specific survival strategies such as investment on growth, adaptation and tolerance of species to environmental stresses, silicification and resource specialization. These strategies have led to more speciose communities, higher productivity, functional redundancy and stability in the last decade. Our results revealed that the unbalanced nutrient reduction facilitated Phaeocystis blooms and that anthropogenic climate warming and nitrate reduction may threaten the diatom communities of the eastern English Channel in a near future. Our results provide strong support for biogeographical historical and niche-based processes in structuring the phytoplankton community in this temperate region. The variety of species responses that we characterized in this region may help to better understand future changes in pelagic ecosystems, and can serve as a basis to consider functional approaches for future ecosystem management.
Species functional traits reflect what species do, how they interact with and how they influence their environment (Violle et al., 2007). Trait-based approaches may therefore prove beneficial to significantly improve our knowledge of the interaction between community assembly and structure, species diversity and ecosystem functioning (McGill et al., 2006; Mayfield and Levine, 2010; Cadotte et al., 2011; Cardinale et al., 2012; Borja, 2014; 2015; De Laender et al., 2016).
Community ecologists typically infer the ecological processes of community assembly by considering that any local community is a subset of a regional species pool shaped by biogeographical and historical effects (Weiher et al., 1998; Grime, 2006): species thriving local community have successfully passed a hierarchy of ecological filters, including dispersal limitation, abiotic and biotic constraints (Zobel, 1997; Weiher et al., 1998; Grime, 2006). While the functional identity of a community often reflects optimal ecological strategies (e.g., predation avoidance, Ackerly, 2003; Muscarella and Uriarte, 2016), functional diversity - in combination with null modelling - informs on the degree of niche overlap (functional convergence/similarity of a community as a proxy) and therefore on the mechanisms of community assembly (Mason et al., 2013). While over-dispersion of functional traits related to resources use is related to competition driven by niche differences (Mc Arthur and Levins, 1967; Cornwell and Ackerly, 2009), an under-dispersion reflects asymmetric competition for one limiting resource and/or abiotic filtering (Cornwell and Ackerly, 2009; Mayfield and Levine, 2010). However, facilitation, another biotic process known to occur in all environmental conditions (McIntire and Fajardo, 2014), may lead to a similar functional diversity outcome (Münkemüller et al., 2020 and references therein). Accordingly, over-dispersion is expected in the case of asymmetric facilitation (i.e., one species favors another) whereas under-dispersion is expected in the case of symmetric facilitation (i.e., species favor each other) (Gallien et al., 2018).
According to the modern coexistence theory (Chesson, 2000), coexistence under limiting resource conditions is maintained only if species either exhibit sufficient niche differentiation with respect to resource use, or are functionally similar (i.e., fitness equalities). As the result of competition among species (Winder, 2009) or an increase in spatio-temporal environmental variability (e.g., Adler et al., 2006; Stein et al., 2014), niche differentiation can be achieved by a multitude of processes, including resource niche partitioning (e.g., Cardinale, 2011) and temporal niche differentiation (Shimadzu et al., 2013), the latter implying specialization of species to specific temporal niches (e.g., Carscadden et al., 2020; Gao et al., 2020). Although trait trade-offs (e.g., the defense-growth trade-off, Ehrlich et al., 2020) promote coexistence (e.g., Kneitel and Chase, 2004; Litchman et al., 2007) by reducing the effect of differences among competitive ability of species, niche differentiation is required for stabilization of coexistence (Chesson, 2008).
The ‘niche complementarity effect’ hypothesizes that more diverse communities are more likely to favor species which use different resources, while the ‘selection effect’ promotes highly productive species (Tilman et al., 1997; Loreau, 2000). Both mechanisms facilitate ecosystem functioning (Worm et al., 2006; Ptacnik et al., 2008; Cardinale et al., 2012). Ecosystem functions may also be driven by mechanisms such as the particular traits of the dominant species within a community (the so-called ‘mass ratio hypothesis’; Grime, 2006) or be induced by changes in population densities or species composition (Spaak et al., 2017). Given specialists (i.e., species with narrow niche breadth resulting from their preference to particular environments/habitat; see Levins, 1962 and Carscadden et al., 2020) are considered to be more efficient at capturing and consuming resources than generalists (i.e., species with broad environmental tolerance), a loss of specialists is expected to greatly affect material and energy transfer in ecosystems (Olden et al., 2004; Alexander et al., 2016), with putative consequences on ecosystem functioning. More diverse communities may also stabilize ecosystem processes and functions by steadying the overall biomass of communities (the so-called ‘portfolio effect’; Figge, 2004; Duffy, 2009) as a result of asynchrony in species fluctuations (i.e, compensation dynamics), evenness, overyielding, and how temporal variability in biomass scales with its mean (Cottingham et al., 2001). Increase in temporal stability may also be the result of a decrease in temporal variability of the dominant species (Steiner et al., 2005).
The Eastern English Channel (EEC) is a well-mixed mesoeutrophic sea under the influence of multiple environmental stressors such as temperature rise (McLean et al., 2019) and the effects of nutrient abatement measures implemented to reverse cultural eutrophication in the northwest European shelf seas (OSPAR, 1988; European Union, 1991a; European Union, 1991b). Over the last decades, these management measures led to a trend reversal in anthropogenic nutrients (Talarmin et al., 2016; Lheureux et al., 2021), with an increase in phosphate limitation in different marine coastal ecosystems (Loebl et al., 2009; Burson et al., 2016; Talarmin et al., 2016). Despite that reduction in nutrients loads to coastal waters, Phaeocystis (Phylum Haptophyta, Class Coccolithophyceae) - which forms the bulk of phytoplankton biomass with diatoms and is considered as a symptom of eutrophication (Tett et al., 2007; Burson et al., 2016; Breton et al., 2021) - still forms impressive spring blooms in the EEC (2006; 2017; 2021; Breton et al., 2000) and similar unexpected consequences have been observed elsewhere for diatoms abundance and chlorophyll a (McQuatters-Gollop et al., 2007; Duarte et al., 2009; Alvarez-Fernandez et al., 2012; Wiltshire et al., 2015; Xu et al., 2020). While an improvement in light conditions has been suggested as a potential triggering mechanism for phytoplankton increase (e.g., McQuatters-Gollop et al., 2007; Xu et al., 2020), and as important for the maintenance of high Phaeocystis biomass given the higher light requirements of this microalga in comparison to diatoms (Jahnke, 1989; Peperzak et al., 1998; Breton et al., 2017); there is still a critical lack of full understanding of the underlying processes behind these unexpected observations. Phytoplankton increase could have been also induced by changes in seawater temperature, nutrient concentrations, and/or nutrient ratios observed in the study area.
Here, we applied a trait-based approach, null modelling and probabilistic hypervolumes to time-series (1996-2019) of diatoms and Phaeocystis collected in the EEC in order to (i) understand long-term changes in the assembly, structure and dynamic of species assemblages in relation to changing environmental conditions, especially unbalanced nutrient conditions, (ii) investigate the impact of environmental changes on different aggregate ecosystem functions and properties, and (iii) explore the role played by biodiversity on ecosystem functioning.
Nutrient data (dissolved inorganic phosphorous [DIP], dissolved inorganic silica [DSi], and dissolved inorganic nitrogen as the sum of nitrates, nitrites and ammonium [DIN]), chlorophyll a (Chla, µg L-1), Particulate Organic Nitrogen (PON, µg L-1) and phytoplankton were collected at high tide by means of a Niskin Water Sampler (8 L) from subsurface (2m depth) samples originating from the coastal station “C” in the Eastern English Channel (50°40’75 N; 1°31’17E, 20-25 m maximum depth) that belongs to the French coastal monitoring network SOMLIT (https://www.somlit.fr/). Nutrient concentrations were analyzed according to Aminot and Kérouel (2004) using autoanalyzer systems (Technicon, Alliance, and Seal Instruments), except for ammonium (NH4). Ammonium concentrations were assessed by spectrometry up to 2008 according to Koroleff (1970) and Solorzano (1969) and by fluorimetry from 2009 according to Holmes et al. (1999) and Taylor et al. (2007). Chlorophyll a was estimated by fluorometry (Lorenzen, 1967) from a 100-250 ml sample of seawater filtrated through glass fiber filters (Whatman, GF/F, 25 mm) and free of pigment (extraction in acetone 90% in the dark at 4°C for 12h). PON was assessed on a NA2100 Frisons CHN analyzer according to Aminot and Kérouel (2004).
Subsurface temperature (SST, °C) and salinity (S), and the mean diffuse attenuation coefficient for downwelling irradiance (Kd, m−1) were assessed from instantaneous vertical CTD profiles with a Conductivity Temperature Depth (CTD) Seabird profiler equipped with a Photosynthetically Active Radiation (PAR, E m−2 d−1) sensor (QSP 2300; Biospherical Instruments). Seawater density (D, kg m-3) was calculated from the CTD data using SST, S and pressure (db), and the 1980 UNESCO International Equation of State (IES80, Millero et al., 1980; Millero and Poisson, 1981). The vertical stratification index (VSI) was calculated over the water column using separately temperature and density data according to the general formula:
where X is the observed temperature or density value at a given depth z (m).
The average daily PAR experienced by phytoplankton in the water column, for a 6-day period before sampling, was obtained from Kd and global solar radiation (GSR, Wh m-2) from the Copernicus Atmosphere Monitoring Service (CAMS) radiation service (http://www.soda-pro.com/web-services/radiation/cams-radiation-service) using the formula of Riley (1957). GSR was converted into PAR by assuming PAR to be 50% of GSR and by considering 1 W m−2 = 0.36 E m−2 d−1 (Morel and Smith, 1974).
Local and regional meteorological data are described in Table S1 and details on large-scale hydro-climatological indices (the Northern Hemisphere Temperature (NHT), the East Atlantic (EA), the North Atlantic Oscillation (NAO), and the Arctic Oscillation (AO) are given in Lheureux et al. (2021). Information on the East Atlantic Western Russian (EAWR) pattern, one of most prominent teleconnection patterns that affects Eurasia throughout year, can be found at https://www.cpc.ncep.noaa.gov/data/teledoc/eawruss.shtml/.
Biological samples of diatoms and Phaeocystis were fixed with Lugol-glutaraldehyde solution (1% v/v; a fixative that does not disrupt Phaeocystis colonies; Breton et al., 2006) and examined using an inverted microscope (Nikon Eclipse TE2000-S) with 100-400x magnification after sedimentation in 5–25 mL Hydrobios chambers. Biovolume measurements were made over the entire period using standard geometric forms according to Hillebrand et al. (1999). Abundance and biovolume of Phaeocystis colonial cells were counted according to Rousseau et al. (1990). Carbon biomass of diatoms and Phaeocystis (μg C l−1) were calculated using the carbon conversion factors of Menden-Deuer and Lessard (2000) and the value of 89.5 pg C cell–1 (van Rijssel et al., 1997), respectively. The list of diatom species is provided in Supplementary Table S2, with information about occurrence frequency (%), and species average abundance (N L-1) and biomass (µg C L-1). Note that a subset of the phytoplankton count datasets used in this study has been previously published (Breton et al., 2021).
Given that at least some 80% of the total biomass are required to be representative of the functional identity of the communities (Pakeman and Quested, 2007; see ‘Functional diversity metrics’ sub-section), available flow cytometry data of cryptophytes, picoeukaryotes and Synechococcus over the period 2009-2019 were used to ensure the dominant contribution of diatoms and Phaeocystis to total phytoplankton biomass. For flow cytometry, 5mL samples were fixed with glutaraldehyde (1.33% v/v) and kept at -80°C until analysis (FACSCan, BD Biosciences; Marie et al., 1999; abundance data are available at https://www.somlit.fr/). Dinoflagellates (auto- and mixotrophic) were counted by microscopy to complete the phytoplankton datasets. Identifications were made at the species level when possible, according to Schiller (1931–1937); Gómez and Souissi (2007); Hoppenrath et al. (2009) and Maar et al. (2002). Carbon biomass of auto- and mixo- dinoflagellates and cryptophytes were obtained from biovolume measurements according to Hillebrand et al. (1999) and the carbon conversion factors of Menden-Deuer and Lessard (2000). Carbon biomass of Synechococcus spp. and picoeukaryotes were determined using the carbon conversion factors of 154 fgC cell−1 and 1319 fgC cell−1 (Buitenhuis et al., 2012), respectively.
For each of the 74 diatom species and Phaeocystis, biovolume (V, µm3), Maximum Linear Dimension (MLD, µm), and the surface to biovolume cell ratio (S/V ratio) were calculated from the median values of microscopic measurements realized over the entire period (Breton unpublished data). The apparent degree of silicification (i.e., 1: slight; 2: medium; 3: heavy) was based on Hasle and Syvertsen (1996) and Hoppenrath et al. (2009). The potential degree of coloniality for diatoms (i.e., 0: None; 1:<5 cells; 2: 5-20 cells; 3: >20 cells; 4>50 cells) was assessed through the cultivation of each diatom species under F/20 medium and with a light:dark cycle of 12:12h at an irradiance of 400 µmol photons m-2 s-1 (Daylight HQIT-WD 250 W F, OSRAM Gmbh, Műnchen, Germany).
Biovolume is a key trait that relates to various ecophysiological attributes for resource acquisition, reproduction and predator avoidance (Litchman and Klausmeier, 2008; Karp-Boss and Boss, 2016). Species with high S/V cell ratio and long cellular chain length - that favor cell suspension in the water column and increase nutrient flux - have a great competitive ability under nutrient limitation (Grover, 1989; Karp-Boss et al., 1996; Tabakabayashi et al., 2006; Musielak et al., 2009; Lovecchio et al., 2019). Higher S/V cell ratio and weaker silicified species have also been related to lower silica requirement under laboratory (Leynaert et al., 2004) and DSi limitation conditions (Martin-Jézéquel et al., 2000; Martin-Jézéquel and Lopez, 2003). Cell elongation enhances both cell buoyancy (Grover, 1989; Naselli-Flores et al., 2021) and protection against photo-inhibition, especially for larger cells because of a lower cross-section for photoinactivation of PSII, and lower maximum metabolic rates than for smaller cells (Key et al., 2010; Schwaderer et al., 2011). Prey biovolume (Litchman and Klausmeier, 2008), the degree of coloniality (Bjærke et al., 2015), and the apparent degree of silicification (Pančić et al., 2019), reflect resource use and/or requirement and mirror ecological processes/functions linked to predation. A composite defense trait was then built based on the methodology described in Breton et al. (2021), i.e., by summing the scores of each of following traits: (i) the capacity to produce mucous or toxins (Yes: 1; No: 0), (ii) the presence of setae and/or spicules – which favor buoyancy; Van den Hoek et al., 1995 – (Yes: 1; No: 0), (iii) the degree of silicification (1: slight; 2: medium; 3: heavy), and (iv) coloniality (0: None; 1:<5 cells; 2: 5-20 cells; 3: >20 cells; 4>50 cells). More detail can be found in the supplementary material of Breton et al. (2021). All the trait values used in this study are given in supplementary data. Note that a subset of this dataset has been previously published (Breton et al., 2021).
The chlorophyll a-to-carbon ratio for phytoplankton (Chl a/C ratio, in µgChl a µgC -1) was calculated using microscopic counts. The cell carbon was computed from the equations of Menden-Deuer and Lessard (2000). Although the Chl a/C ratio is not a trait sensu strictissimo (Litchman and Klausmeier, 2008), it stems from processes linking the traits of species and the alleviation (or accentuation) of external limiting factors such as light/nutrients availability, in particular nitrogen (Thackeray et al., 2008; Jakobsen and Markager, 2016). This ratio is known to be a relevant proxy of phytoplankton growth rate (Cloern et al., 1995; Le Bouteiller et al., 2003).
In addition to species richness and Pielou’s indices (Pielou, 1966, Step 1, Figure 1), we characterized the functional structure and functional diversity of phytoplankton communities by means of the (i) Community-Weighted Mean (CWM; the mean trait value among each community weighted by the relative biomass of each species; Garnier et al., 2004), (ii) functional richness (FRic), (iii) functional evenness (FEve), and (iv) Rao Quadratic entropy (RaoQ). CWM is a proxy of functional identity, i.e., the optimal trait strategy (Ackerly, 2003; Muscarella and Uriarte, 2016). Functional richness corresponds to the volume of functional niche space filled by a species within a community (Villéger et al., 2008). Functional evenness is the regularity with which species biomass in a community is distributed along the minimum spanning tree that links all species in the multidimensional trait space (Mason et al., 2005). RaoQ is the sum of pairwise distances between species, weighted by the relative biomass within the multidimensional trait space (Botta-Dukát, 2005). This index is a relevant proxy of functional divergence and was selected over other similar metrics for its ability to detect assembly rules significantly better (Botta-Dukát and Czúcz, 2016).
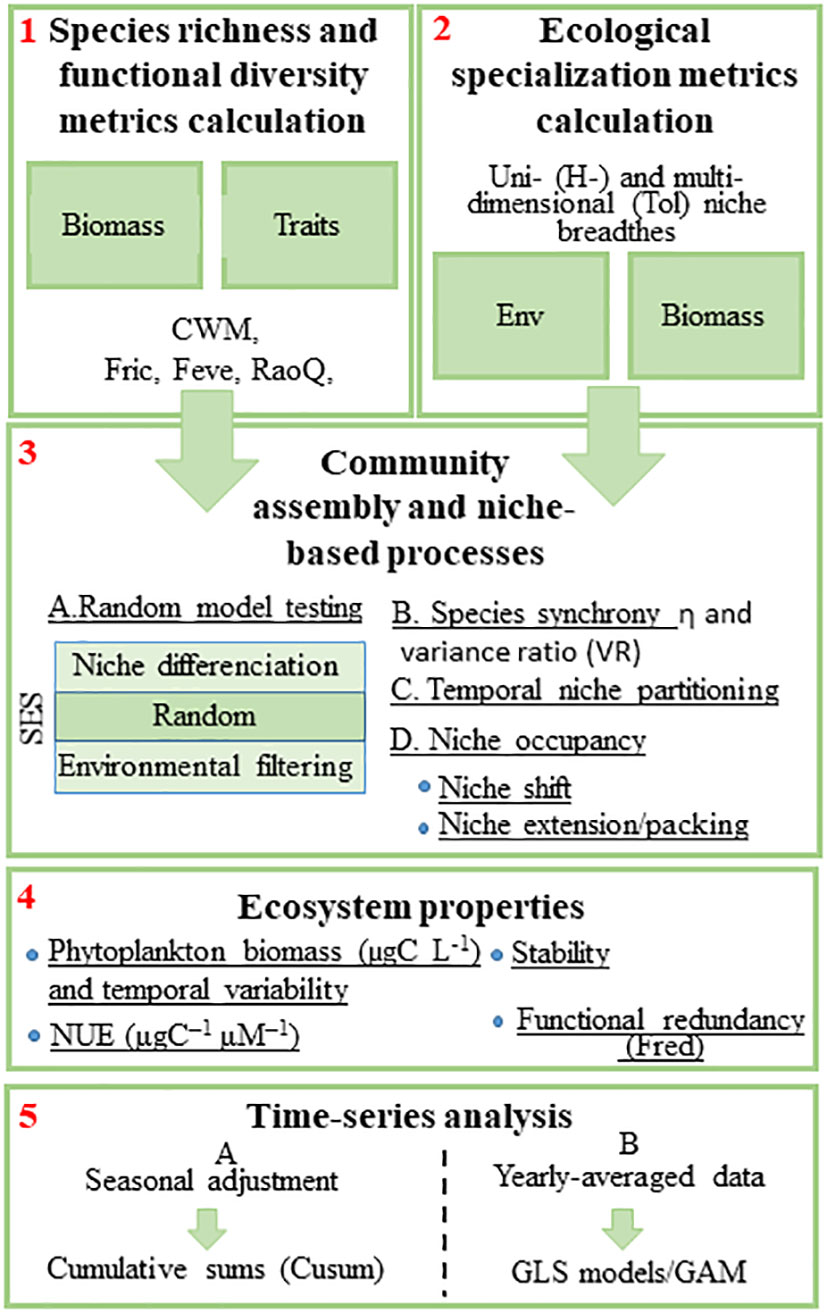
Figure 1 The 5 main steps in our statistical methodology to explore the link between the environment, phytoplankton biodiversity, and ecosystem functioning, and the underlying mechanisms and processes. Step 1: characterization of the plankton community trait distributions and biodiversity; Step 2: characterization of the ecological specialization of the phytoplankton community; Step 3: exploration of the mechanisms/niche-based processes of phytoplankton coexistence (SES, Standardized Effect Size); Step 4: Calculation of different ecosystem properties (phytoplankton biomass [µgC L-1], Nitrogen Use Efficiency [NUE, μg C–1 μM–1], Stability, and functional redundancy); Step 5: Time-series analysis. H, unidimensional niche; Tol, environmental tolerance; Env, environmental variables; CWM, community-weighted mean; RaoQ, functional divergence; FEve, functional evenness; Fric, functional richness; FRed, functional redundancy; GLS, Generalized Least Squares; GAM, Generalized Additive Models.
The precision of functional diversity indices, especially FRic and FEve, is sensitive to the incompleteness in species and/or traits data (Pakeman, 2014). Here, we considered 74 diatom species and Phaeocystis, which represented the majority of the phytoplankton species richness in coastal waters of the EEC (2021; Breton et al., 2017). Auto-/mixo dinoflagellates included 10 species (see Breton et al., 2021, Table S3). For smaller phytoplankton, which cannot be accurately identified by microscopy, several molecular surveys in the area (e.g., 2016; Genitsaris et al., 2015) have previously found that pico eukaryotes were dominated by prasinophyceans (Micromonas spp., Bathycoccus spp.), Teleaulax spp. and Plagioselmis spp. for cryptophytes, and Emiliania huxleyi for coccolithophorids.
The functional indices for the diatoms and Phaeocystis communities were calculated from the biovolume, the apparent degree of silicification, coloniality, the S/V cell ratio, and MLD. For each observation (i.e., sampling unit), the functional metrics were computed on log-transformed species biomass to reduce a potential influence of the most abundant species using the R package ‘FD’ (Functional Diversity; Laliberté and Legendre, 2010). For FRic, FEve, and RaoQ, a preliminary principal coordinate analysis (PCoA; ‘vegan’ package; Oksanen et al., 2011) was performed to calculate the multidimensional trait space for each sampling day. Functional diversity was computed from a dissimilarity matrix calculated using both the PCoA axes - as new functional traits - and the Gower distance (Gower, 1971). The Gower distance allows traits of different types, including ordinal (Podani, 1999; Table I), to be included. A square-root transformation (‘sqrt’) - or a Lingoes correction for negative values (Lingoes, 1971) - was applied when the distance matrix “species × species” was not Euclidean.
Ecological specialization (Step 2, Figure 1) was estimated by means of the multi-dimensional Outlying Mean Index (OMI, hereafter called ‘environmental tolerance’; Dolédec et al., 2000) and uni-dimensional niche breadth analysis using the ‘ade4’ (Chessel et al., 2004; Dray et al., 2007) and ‘hypervolume’ R packages (Blonder et al., 2014). Environmental tolerance was based on species biomass, considering SST, salinity, wind stress, nutrients, and PAR. Unidimensional niche breadth (DIN, DIP, DSi, PAR, SST, and salinity) was determined from kernel density using (i) the environmental conditions encountered by each species, (ii) a Silverman bandwidth estimator and (iii) a 0% quantile threshold (Blonder et al., 2014). Niche breadth and environmental tolerance reflect the range of an abiotic factor determining the distribution and species biomass of a species, respectively. Advantages and disadvantages of each method are detailed in Breton et al. (2021). Considering one ecological dimension, we then calculated the Community-Weighted Mean (CWM; see ‘Functional diversity metrics’) of the niche breadth to estimate the degree of ecological specialization at the community scale. A decrease in any CWM of the niche breadth for one dimension mirrors an increase in the degree of ecological specialization of the phytoplankton community.
The inference of environmental filtering and biotic interactions (Step 3, Figure 1) were estimated from the deviation (Standardized Effect Size [SES]; Gotelli and McCabe, 2002) between functional diversity metrics (FRic, FEve, and RaoQ) calculated on a given (i.e., observed) phytoplankton community and functional values obtained from a random community: for each sampling date, trait data were randomized arbitrarily (times=1000; ‘permatfull’ in the ‘vegan’ R package), while maintaining species richness and abundance constant. SES was calculated as follows:
where xobs is the observed values of functional metric at a given date; is the mean; and σran is the standard deviation of the functional diversity of randomly assembled communities. Assuming a normal distribution of the random communities, the traits derived from the sampling dates falling into the 95th (or higher) percentile of the random distribution were considered ‘over-dispersed’ (i.e., niche differentiation being the major process driving community assembly); trait falling into the 5th (or lower) percentile were considered ‘under-dispersed’ (i.e., environmental filtering as the major process).
The degree of temporal synchrony (η) between diatom and Phaeocystis species and the variance ratio (VR) were calculated for each year on monthly-averaged species biomass according to Gross et al. (2014) and Schluter (1984), respectively, using the ‘codyn’ R package (Hallett et al., 2020):
and
where n is the number of species, and Yi and Yj, the biomass of the species i and that of all other species than species i, respectively.
The approach of Gross et al. (2014) for synchrony calculation was preferred to the equation of Loreau and de Mazincourt (2008) because it equally weights species. This index varies between -1 (perfect asynchrony) and 1 (perfect synchrony). The variance ratio, VR = 1 indicates that species do not covary, whereas VR > 1 or<1 indicates predominately positive (i.e., synchronous dynamics) and negative (i.e., compensatory dynamics) covariance among species, respectively (Schluter, 1984). To test if the observed VR value was significantly different from 1, a thousand null communities were created by randomly selecting different starting points for each species’ time series, allowing species biomass to vary independently while maintaining. within-species autocorrelation (Hallett et al., 2020). VR is considered to be significantly different from 1 when the observed VR value falls outside of the 2.5th and the 97.5th percentiles of the null distribution.
Potential temporal niche partitioning and its causes (niche shift vs niche packing/expansion processes) were assessed between successive pairs of phytoplankton communities by considering the DIP dimension (i.e., the hypothesized main limiting resource for growth, see Loebl et al., 2009; Burson et al., 2016; Talarmin et al., 2016) and using the function kernel.beta (Carvalho and Cardoso, 2020; Mammola and Cardoso, 2020) from the ‘BAT’ R package (Cardoso et al., 2014) and by choosing the Jaccard similarity index. Niche shift corresponds to change in niche position of a given species from one community to another (i.e., occupation of a different niche space between two successive communities); niche packing/expansion corresponds to the differences in niche breadth between two successive communities.
Here, we focused on five ecological properties that are important for ecosystem functioning and for which data for their calculation were available: (i) phytoplankton biomass and (ii) its variability, (iii) the temporal stability of community-level biomass (reviewed in Cottingham et al., 2001; Loreau et al., 2002), (iv) the Nitrogen Use Efficiency (NUE; Ptacnik et al., 2008), and (v) functional redundancy (FRed). Temporal stability of community-level biomass - the inverse coefficient of variation of biomass - was calculated on monthly log-transformed time-series of diatom and Phaeocystis carbon biomass using the ‘codyn’ R package (Hallett et al., 2020). Given that communities mainly composed of functionally redundant species may improve ecosystem resilience and stability (e.g., Biggs et al., 2020), FRed - the difference between Simpson’s diversity and RaoQ (de Bello et al., 2007) computed using the R package ‘SYNCSA’ (Debastiani and Pillar, 2012) - reflects ecosystem sustainability and the buffer capacity of communities to counteract environmental disturbances. NUE (biomass per unit of nitrogen available μg C–1 μM–1) was calculated as:
where DIN and PON are in μM. We did not consider the possibility of organic nitrogen uptake by phytoplankton due to lack of available measuring equipment. Phytoplankton of the English Channel and the southern North Sea has been found to primarily use dissolved inorganic nitrogen (L’Helguen et al., 1993; Moneta et al., 2014).
For each variable, we successively (i) calculated monthly average, (ii) applied the Kalman smoothing filter (Kalman, 1960) for data completion if needed, and (iii) decomposed the completed time-series for seasonal adjustment (i.e., without the seasonal component) using the Loess method (Cleveland and Cleveland, 1990). Data completion and seasonal adjustment were performed using the R packages ‘stlplus’ (Hafen, 2016) and ‘imputeTS’ (Moritz and Bartz-Beielstein, 2017; Moritz, 2018), respectively. Before, Phaeocystis and diatom biomasses were log(x+1)-transformed. Note that an arbitrary time window of 5 years was chosen for time-series decomposition. To build an index of the wind conditions at a regional scale, we performed a PCA (‘ade4’ R package) on monthly wind values and their variations (CV), considering four regional weather stations monitored by Meteo-France (Dunkirk, Calais, Boulogne/mer, and Abbeville). A second PCA was calculated to summarize the abiotic conditions encountered by phytoplankton over the study period. Given that environmental heterogeneity may favor niche differentiation by increasing niche availability (e.g., Stein et al., 2014), and because nutrient ratios may play an important role in the outcomes of competitive interactions, the CV of SST, salinity, seawater density, PAR, each nutrient between each pair of consecutive months, and the DIP/DIN, DSi/DIP and DSi/DIN molar ratios were considered in the PCA in addition to mean values. To explore the link between niche breadths along the different niche dimensions that we investigated (DSi, DIN, DIP, SST, salinity, and PAR) and to define the ecological specialization index of the phytoplankton community, we performed a third PCA on the CWMs of niche breadth of the different niche dimensions and environmental tolerance. Prior the three PCAs, skewness of the data was removed to reach normality and all variables were z-transformed to have a mean of zero and a standard deviation of one (‘caret’ package; Kuhn et al., 2016).
To explore the driver-response relationships of the phytoplankton community patterns/ecosystem properties to the environment, we successively calculated (step 5, Figure 1) cumulative sums (Cusum, Ibañez et al., 1993; Kirby et al., 2009; Regier et al., 2019) and performed Generalized Least Squares for linear regression modelling (GLS, Aitken, 1936) or Generalized Additive Models (GAM, Hastie and Tibshirani, 1990) for non-linear modelling. The Cusum method is particularly well-adapted to the study of environmental time-series because of its robustness for handling incomplete, non-normal, noisy data (Regier et al., 2019), and its potential to reduce the risk of misinterpretation which may result from the use of standard relationship analysis between variables (Regier et al., 2019). However, while previous studies correlated Cusum-transformed variables to explore the relationships between biotic patterns and the environment (e.g., Ibañez et al., 1993; Breton et al., 2006; Glibert, 2010), such an approach violates the assumption of variable independence and is strongly discouraged (Cloern et al., 2012; Regier et al., 2019; but see Lancelot et al., 2012); instead, relationships are assessed by visually evaluating parallelism between Cusum-transformed variables using Cusum charts (Regier et al., 2019 and references therein). By contrast, GLS models and GAM allow accounting for the autocorrelation in time series data, and, therefore, a more quantitative assessment of the driver-response relationships and valid hypothesis testing. Cusum for each time series were obtained by subtracting the mean from all values of the given monthly time-series, and progressively adding the residuals. The Cusum function, called v in the formula, is calculated iteratively as follows (Ibañez et al., 1993; Kirby et al., 2009; Regier et al., 2019):
where xt is the monthly averaged variable at time t (ranging from 1 to n), and is the variable averaged over the whole period of investigation. As a result, the distribution of the Cusum-transformed variables has a mean of 0 and a standard deviation of 1. The sign and the slope of the Cusum plots reveals trend and sub-cycle patterns, thresholds and changes in mean values along a time series of two or more variables (Regier et al., 2019). Positive vt values indicate a deviation of xt above the mean, while negative values indicate a deviation below the mean; increasing and decreasing slopes reveal values (on average) above and below and the mean of the time series, respectively. A transition from negative (positive) to positive (negative) slopes shows a shift in the time series from lower (higher) to higher (lower) than the mean (Regier et al., 2019). For regression modelling, we first computed Pearson correlations (package ‘corrplot’; Wei and Simko, 2021) between the different variables using annual and standardized data. Each model was then built (i) by sequentially selecting (i.e., forward selection) the significantly correlated variables, (ii) by accounting for a serial correlation AR(1) model for the errors and potential interaction between predictors when applicable, and (iii) using the Maximum-Likelihood method. The variance inflation factor (VIF) per variable was also calculated using the package ‘car’ (Fox and Weisberg, 2019) to ensure that multi-collinearity between predictors of the model was negligible (VIF<3). Based on the Akaike information criterion (AIC), we retained the most parsimonious model. All models were checked for accuracy by ensuring that the structure of the Autocorrelation and Partial-autocorrelation functions (ACF/PACF) of the model residuals meet the properties of an AR(1) model. GLS and GAM were performed using the R packages ‘nlme’ (Pinheiro et al., 2022) and ‘mgcv’ (Wood, 2017), respectively; and the function corAR1(form=~year) for the correlation structure of the residuals.In our study, only the clear driver-response relationships (i.e., parallelism or anti-parallelism for Cusums and significant (p<0.05) GLS or GAM models) are shown (Tables 3–5 and S3; and Figures 5A–F, 6A–E, 7, 9A–F, and 10A–C).
The range, mean ( ± SD) and median values of the environmental conditions recorded at the monitoring coastal station “C” over the period 1996-2019 are given in Table 1. The values of nutrients and Kd were in the common range of coastal stations of the English Channel (e.g., Lefebvre et al., 2011; Napoléon et al., 2012; Houliez et al., 2013; Saulquin et al., 2013; Bonato et al., 2016). Based on the Redfield and Brzezinski ratios (Redfield et al., 1963; Brzezinski, 1985), the nutrient molar ratio values recorded at station “C” showed that DIN was regularly in excess over DIP over the last two decades (Table 2). The trend towards DIP-limitation occurred from 2005 to 2015 and resulted from an increase in DIN : DIP and DSI : DIP peak events well above the Redfield (1963) and Brzezinski (1985) ratios (i.e., >>16, Figures 2A, B). The DIN : DIP and DSI : DIP ratios decreased abruptly from 2015 to reach values similar to those recorded in the early 2000s, indicating an excess in DIP at both periods (DIN : DIP and DSI: DIP ratio value<<16). The analysis of the phytoplankton composition available for the last decade indicated that phytoplankton was mainly composed of diatoms and Phaeocystis biomass (86 ± 16%, Figures 3A, B), but for several dates from mid-2015 to end-2019 when picoeukaryotes and cryptophytes contributed altogether to more than 50% of the total phytoplankton biomass (20% of the observations). On a seasonal scale (Figure 3C), diatoms and Phaeocystis biomass contributed in average to 91% to phytoplankton biomass; the lowest and highest contributions occurring in November-December (78 and 80%, respectively) and in April during the maximum of the Phaeocystis bloom, respectively. The list of the ten most dominant diatom species in term of carbon biomass identified over the period 1996-2019 is given in Table 2 (see Table S2 for all the diatom species).
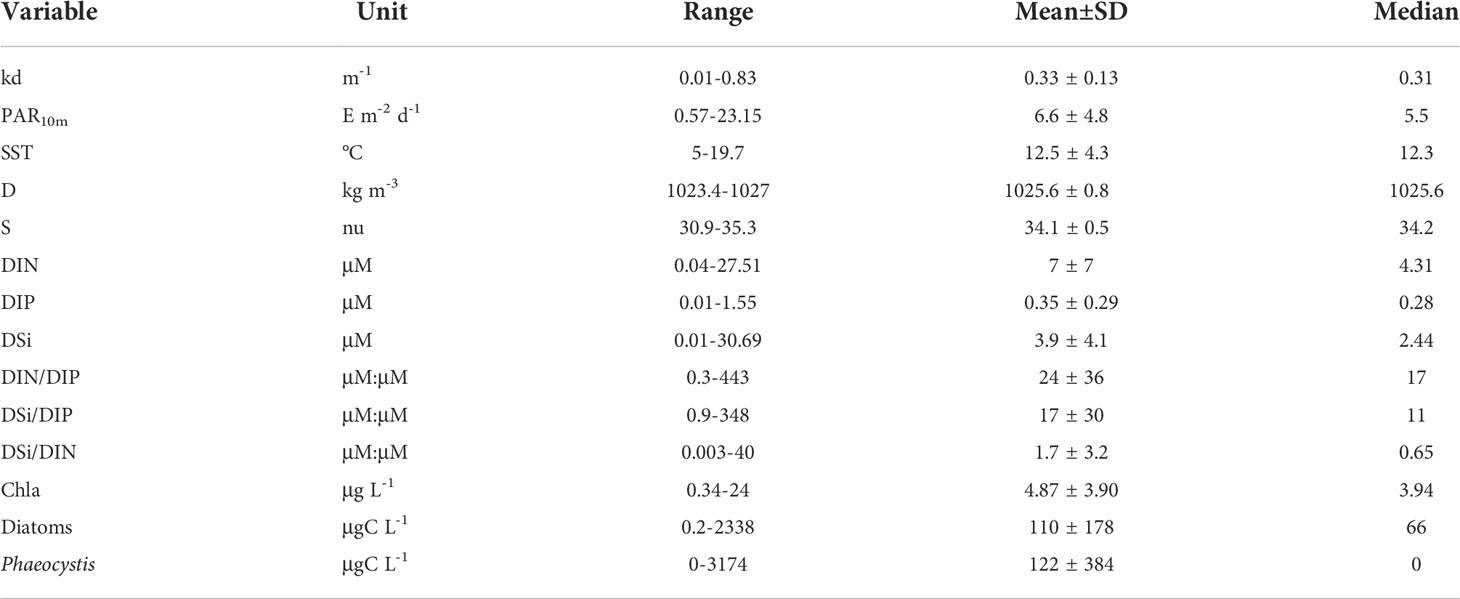
Table 1 Range, mean ( ± SD) and median values of the mean diffuse attenuation coefficient for downwelling irradiance (kd(PAR, m−1), Photosynthetic Active Radiation at mid-depth (PAR10m, E m−2 d−1), sea surface temperature (SST, °C), density (D, kg m-3), salinity (S), nutrients (dissolved inorganic nitrogen as the sum of nitrates, nitrites and ammonium [DIN, µM], dissolved inorganic phosphorous [DIP, µM], Dissolved inorganic silica [DSi, µM], and their molar ratios [DIN/DIP, DSi/DIP, and DSI/DIN, µM:µM], Chlorophyll a (Chla, µg L-1), and diatom and Phaeocystis biomass (µgC L-1) in coastal waters of the eastern English Channel over the period 1996-2019.
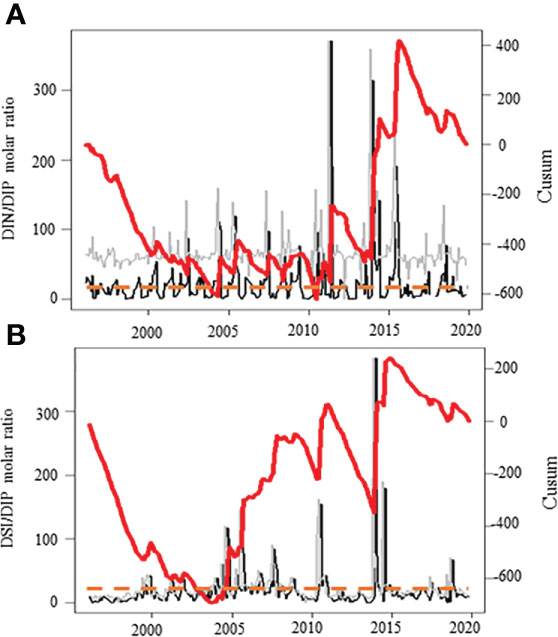
Figure 2 Temporal variations of the nutrient molar ratios (A: DIN/DIP, B: DSi/DIP, [µM:µM], with DIN and DIP as dissolved inorganic nitrogen [i.e., the sum of nitrates, nitrites and ammonium]) and phosphorus in coastal waters of the eastern English Channel over the period 1996-2019. Black line: monthly raw time-series. Grey line: seasonally adjusted, and red thick line: Cusum. Right axes are for seasonally adjusted and Cusum. Orange dashed line: the Redfield and Brzezinski nutrient molar ratios (Redfield 1963; Brzezinski 1985).
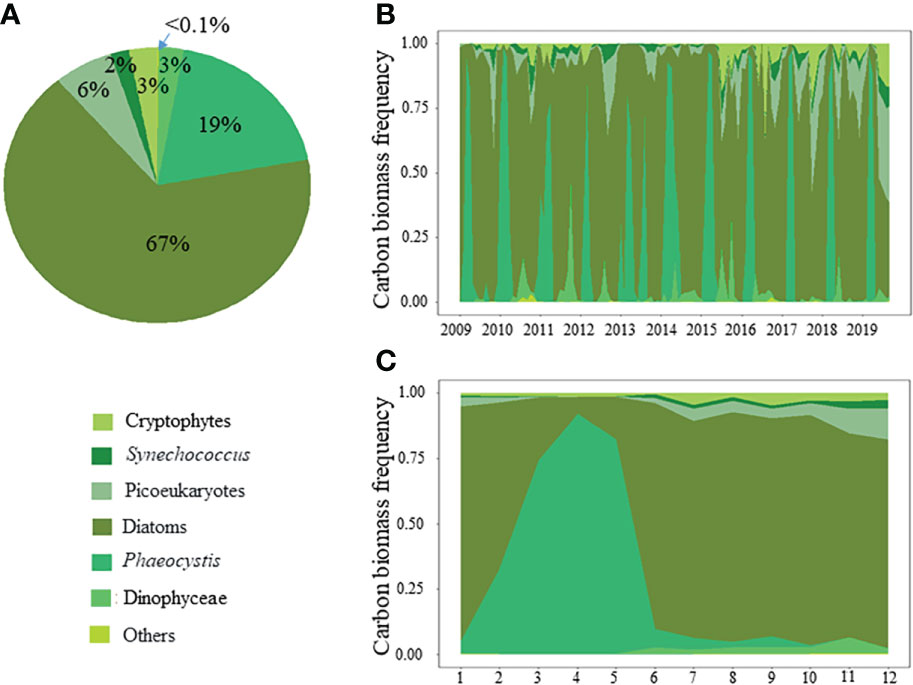
Figure 3 (A) Whole phytoplankton composition (carbon biomass frequency), and its (B) temporal and (C) average seasonal variations, respectively, in coastal waters of the eastern English Channel over the period 2009-2019.
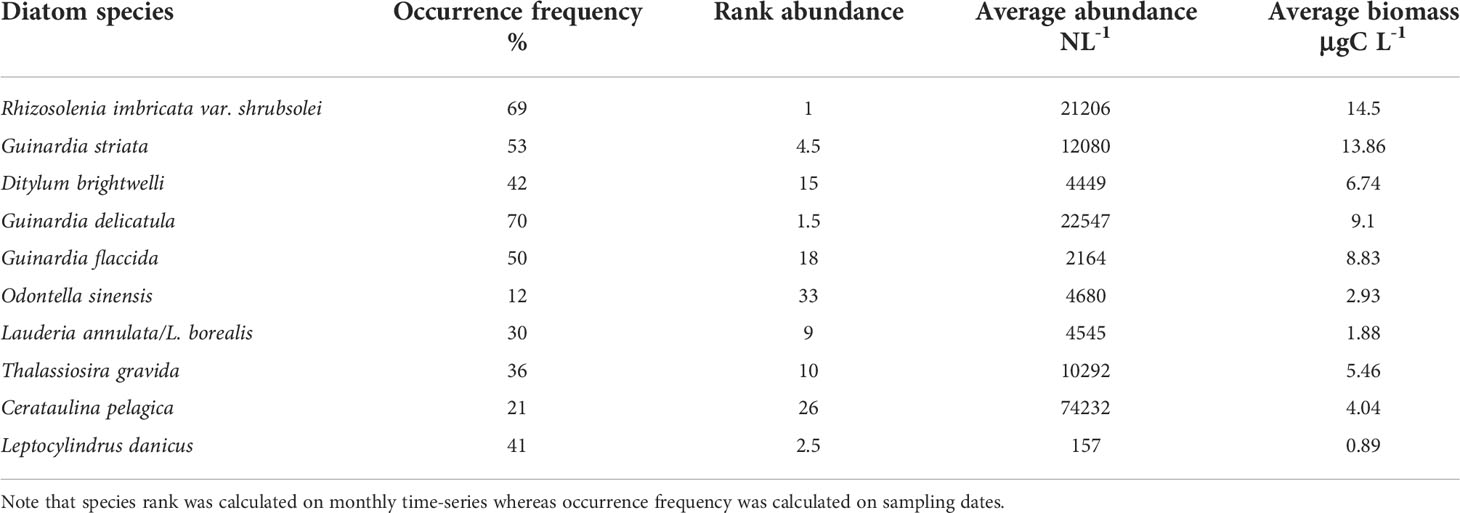
Table 2 Rank biomass and abundance and occurrence frequency (%) of the ten most dominant diatom species in term of carbon biomass identified in coastal waters of the eastern English Channel over the period 1996-2019 (see Table S2 for all the diatom species).
The cumulative sums calculated on the first three independent PCs (PC1-3, Figures 4A–C) of the PCA performed on the seasonally-adjusted mean abiotic environmental conditions and their variability (see Figures S1A–C for details) were synchronous with changes in twelve of the phytoplankton community patterns that we measured (Figures 5A–F, 6A–E, and 7). The Cusum of the inverse PC1 axis (INV-PC1, 20.3% of the total variability, Figures 4A and S1A-C) was synchronous with the Cusums of (i) the degree of silicification of the phytoplankton community (Figure 5A), (ii) the Chl a/C ratio (Figure 5B), (iii) the degree of generalism for nutrients and environmental tolerance (Figure 5C; Figure S2A, B), (iv) the temporal niche overlap for DIP which ranged from 66 to 92% (79 ± 4% niche overlap in average; Figure 5D), and (v) the temporal variability in phytoplankton biomass (0-104%, 64 ± 41%; Figure 5E). All Cusum values increased between 1996 and 2002 to reach a maximum in early 2002, followed by a second peak at end-2009, and a decrease until end-2019. The Cusum of the INV-PC1 (Figure 4A) was synchronous with the Cusums of the local wind speed (Figure S3A) and precipitation (3-206 mm, 73 ± 35 mm, Figure S3B). No synchrony between Cusums of precipitation and the INV-PC1 was found from 2012. Nutrients (positively), salinity (negatively), density (negatively), and the variability in both salinity, DIN, and DSi (positively) mainly contributed to the INV-PC1 (Figures S1A, C), and an increase in the Cusum of the INV-PC1 corresponded to an increase of both freshwater influence and wind-driven abiotic forcing (temporal environmental fluctuations). Note that the temporal niche differentiation, which started in early 2009, was mainly caused by a progressive niche shift of the communities (Figure S4). GLS modelling confirmed these driver-response relationships except for the temporal niche overlap for DIP (Table 3). Nevertheless, temporal niche overlap for DIP was indirectly related to the INV-PC1 through its relationships with DIN and PAR variability, themselves related to the INV-PC1 (Table S4). Note that refining driver-response relationships showed that the CWM of the degree of silicification and the variability in phytoplankton biomass were significantly related to DSI, whereas the Chla/C ratio and the degree of generalism were significantly related to the regional wind conditions (positively) and density (negatively) and the temporal niche overlap for DIP (positively), respectively (Table 3). The Cusum of the second principal component (PC2, 11.3% of the total variability, Figure 4B) was synchronous with the Cusums of (i) the contribution of Phaeocystis to total phytoplankton biomass (max 99%, Figure 6A), (ii) the duration of Phaeocystis seasonal occurrence (Figure 6B), (iii) the phytoplankton biomass (0.2-3221, 233 ± 420 µgCL-1, Figure 6C), (iv) the total diatom abundance (0.16-64.4 105 cellsL-1, 3.6 105 ± 6.3 105, Figure 6D), (v) the functional redundancy (Figure 6E), and the inverse of the Pielou’s evenness (Figure 6F). The Cusums of the contribution of Phaeocystis to total phytoplankton biomass and the Phaeocystis biomass were also synchronous (Figure S5). After a constant decrease from 1996 to mid-2004, all Cusum values increased until end-2014 - except for PC2, which showed a sharp decrease in 2013 - and slightly decreased until end-2019. Given that DIP level (negatively) and the DSI/DIP and DIN/DIP ratios (positively) contributed significantly to PC2 (Figure S1A and C), we revealed a noticeable DIP limitation. GLS modelling confirmed that the contribution of Phaeocystis to total phytoplankton biomass, the diatom and the total phytoplankton abundance, and the Pielou’s evenness were significantly related to the PC2 (Table 4). Note that refining the driver-response relationships showed that the contribution of Phaeocystis to total phytoplankton biomass was significantly related to the DIN/DIP ratio and the inverse of the variability in PAR and variance ratio. In the same way, diatom and phytoplankton abundance were related to the DSI/DIP ratio. and the diatom abundance and the contribution of Phaeocystis to total phytoplankton biomass, respectively. By contrast, the duration of Phaeocystis seasonal occurrence was inversely related to the regional wind conditions and the variance ratio. Moreover, the functional redundancy and phytoplankton biomass were related to DIP (negatively) and Phaeocystis biomass (positively), respectively. Phaeocystis biomass, was inversely related to the variability in PAR and the variance ratio (Table S3). The Cusum of the third component (PC3, 8.3% of the total variability, Figures 4C, Figures S1B, C) was similar to the Cusum of the diatom biomass (Figure 7). While not being related over the first years of monitoring, both Cusums increased from end-2002 until a maximum in mid-2005 and then decreased sharply from early 2015 to the end-2019. SST (negatively) and the variability in DIN and DSi (positively) were the variables that mainly contributed to PC3 (Figure S1B, C), indicating that diatom biomass was promoted under cold conditions and, to a lesser extent, favored by DIN and DSi pulses (i.e., increase in their temporal variability). Note that no correspondence was found between the Cusum of PC3 and any meteorological parameter. GLS modelling showed that diatom biomass was only significantly related to the CWM of the S/V ratio (negatively, Table 4), itself being inversely related to DIN (Table S3). Note that, the variables used to compute the PC3 - yearly-averaged data - were different from the variables used to calculate the PC3 based on seasonally-adjusted data (Figure S1 and Table S4).
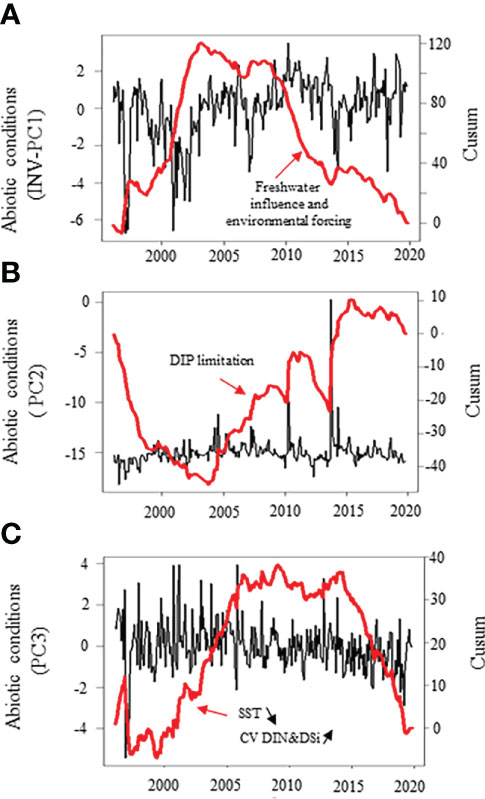
Figure 4 Temporal variations of the abiotic conditions (mean and variability) in coastal waters of the eastern English Channel over the period 1996-2019. (A) Principal component 1 [INV-PC1]; (B) Principal component 2 (PC2); and (C) Principal component 3 (PC3, see Figure S1 for PCA details). Black line: monthly seasonally adjusted ones. Red thick line: Cusum. Right axes are for Cusum. Note that PCs values in (A) have been inverted for ease of reading with next results (Figure 5).
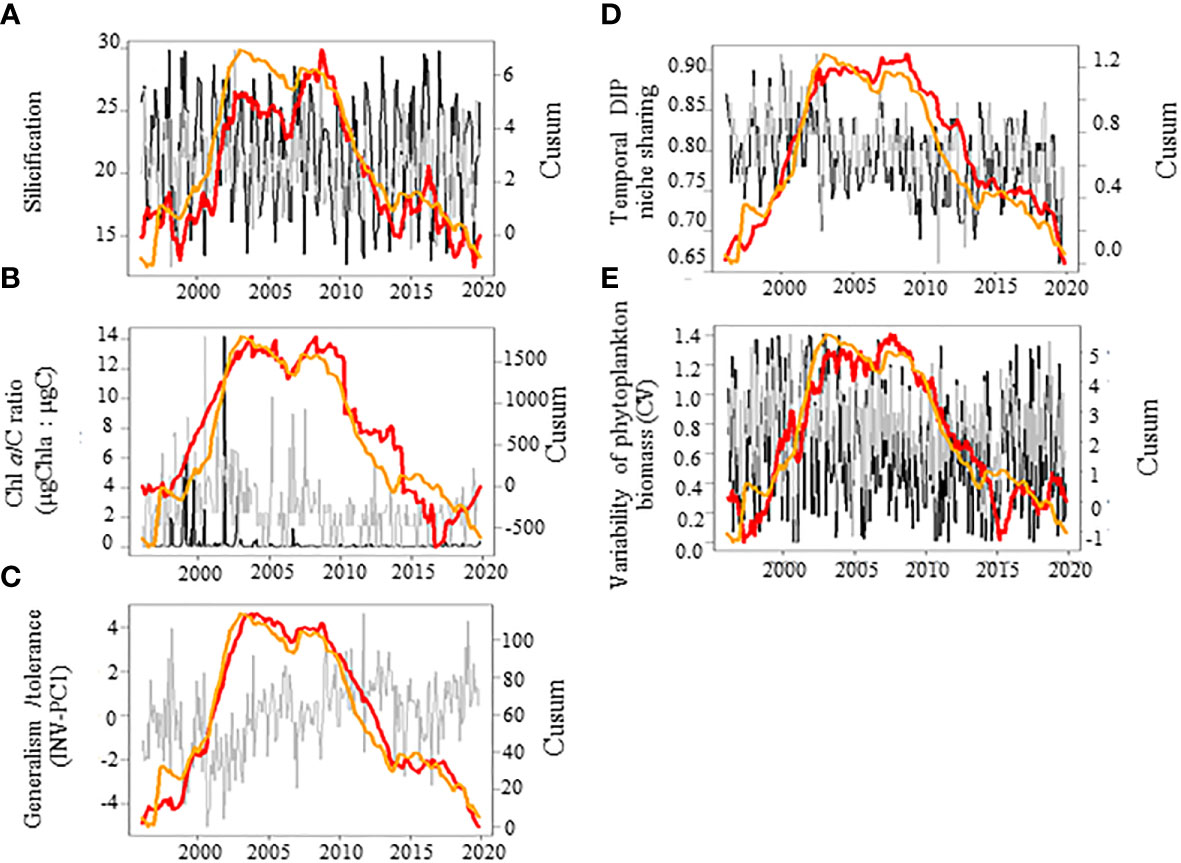
Figure 5 Temporal variations of the phytoplankton community patterns (red lines) in relation with the abiotic conditions (orange line, PC1, see Figure S1 for PCA details) in coastal waters of the eastern English Channel over the period 1996-2019. (A) The apparent degree of silicification, (B) the Chlorophyll a to phytoplankton carbon biomass (Chl a/C, μg Chla:μg C), (C) the degree of generalism for nutrients and environmental tolerance (INV-PC1, see Figure S2 for the PCA details); (D) temporal niche sharing for DIP; and (E) variability of phytoplankton biomass (CV). Black and grey line: monthly raw and seasonally adjusted time-series, respectively. Note that PCs in (C) represent yet seasonally adjusted time-series. Orange and red lines: Cusum. Right axes are for seasonally adjusted and Cusum. Note that PCs values in (C) have been inverted for ease of reading.
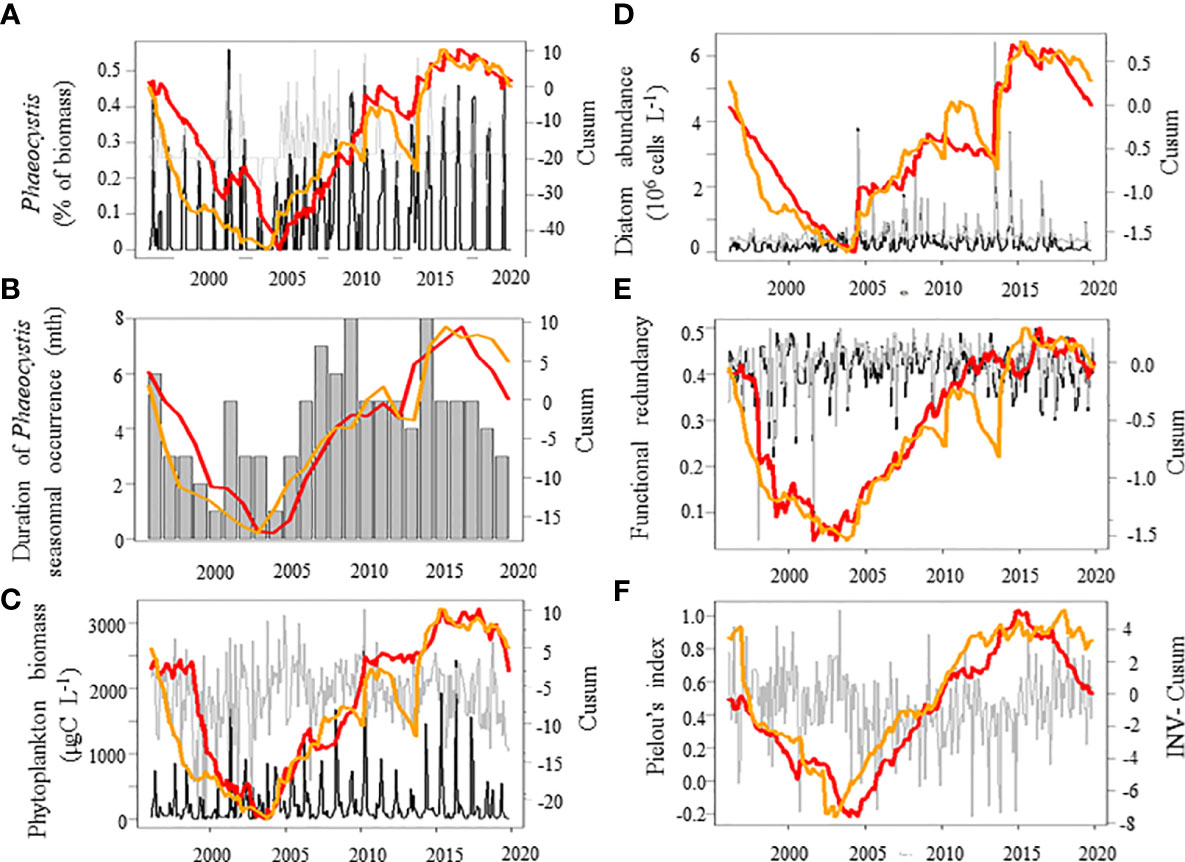
Figure 6 Temporal variations of phytoplankton patterns (red lines) in relation with the abiotic conditions (Principal component 2 [PC2], see Figure S1 for PCA details, orange line) over the period 1996-2019 in coastal waters of the eastern English Channel. (A) the % of Phaeocystis biomass, (B) the duration of Phaeocystis seasonal occurrence (months), (C) phytoplankton biomass (µgC L-1), (D) diatom abundance (106 cells L-1), (E) functional redundancy, and (F) Pielou’s index (abundance-based) of the phytoplankton community. Black and grey lines: monthly raw and seasonally-adjusted time-series, respectively. Thick line: Cusum. Stick: seasonal value. Right axes are for seasonally adjusted and Cusum. Note that the Cusum of Pielou’s evenness is inverted (INV-Cusum) for ease of reading.
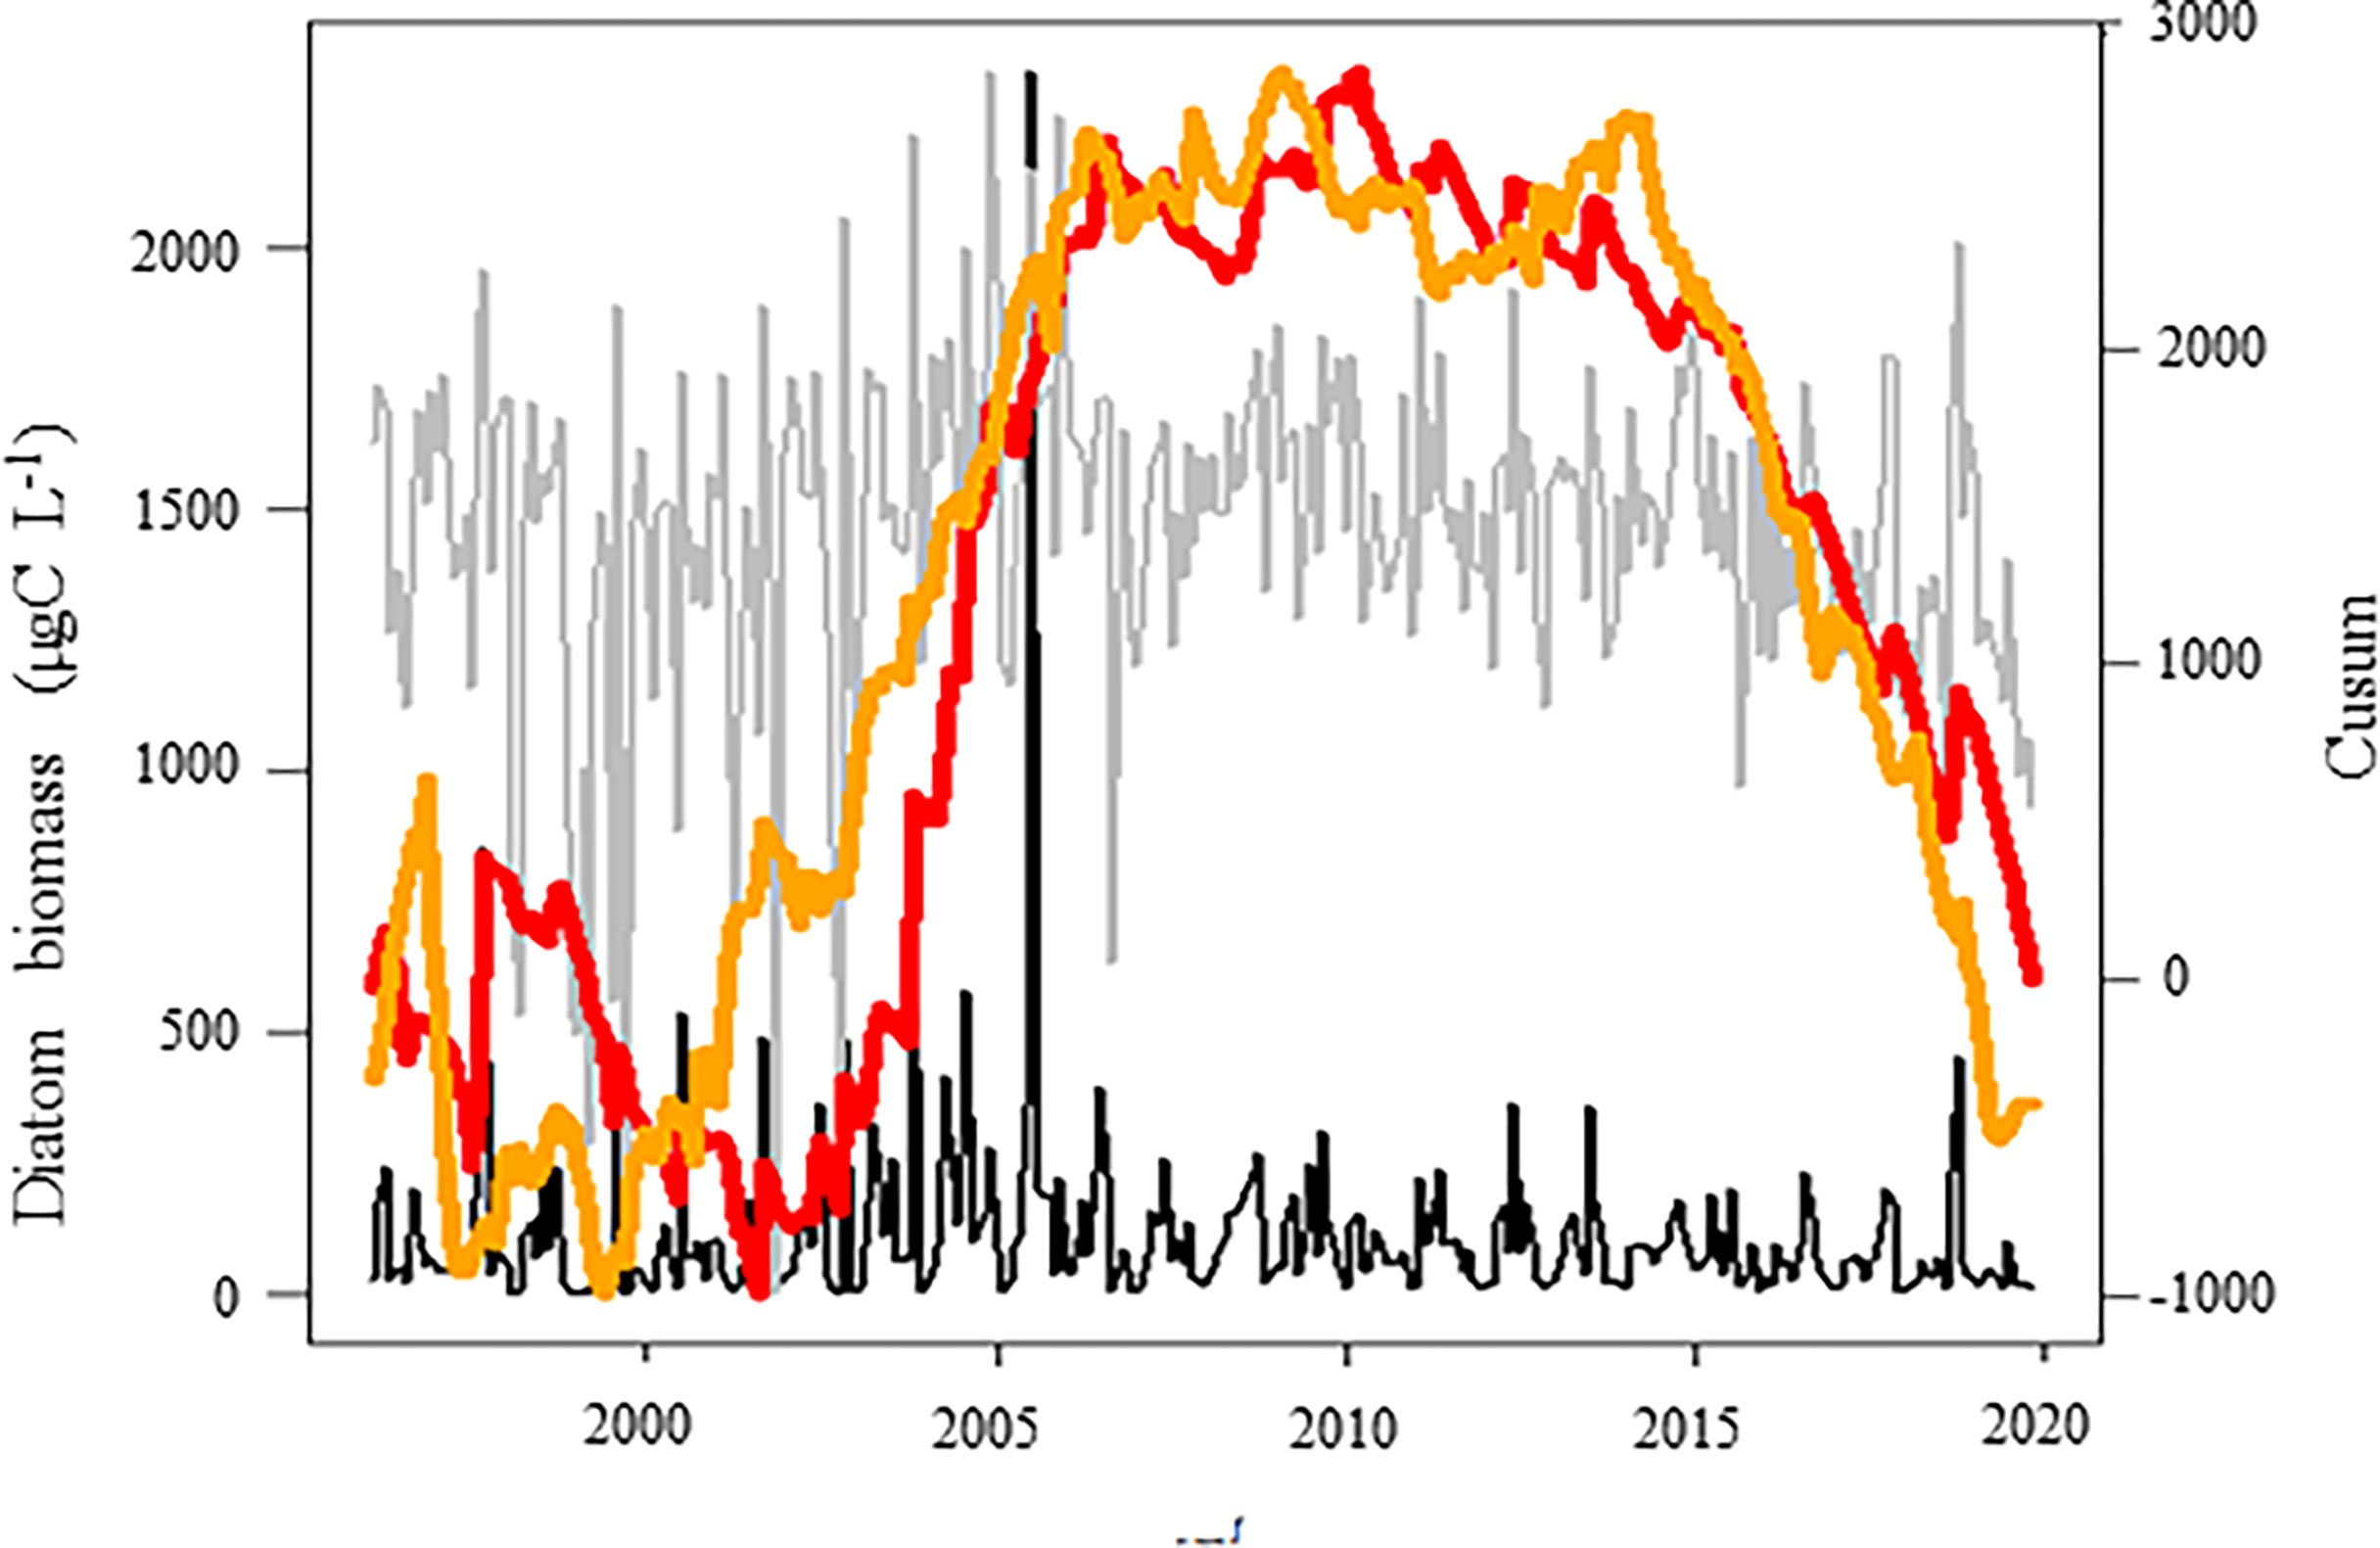
Figure 7 Temporal variations of the diatom biomass (μgC L-1, red line) in coastal waters of the eastern English Channel over the period 1996-2019 in relation with the abiotic conditions (PC3, orange line, see Figure S1 for PCA details). Black and grey lines: monthly raw and seasonally adjusted time-series, respectively. Red and orange lines: Cusum. Right axes are for seasonally adjusted and Cusum.
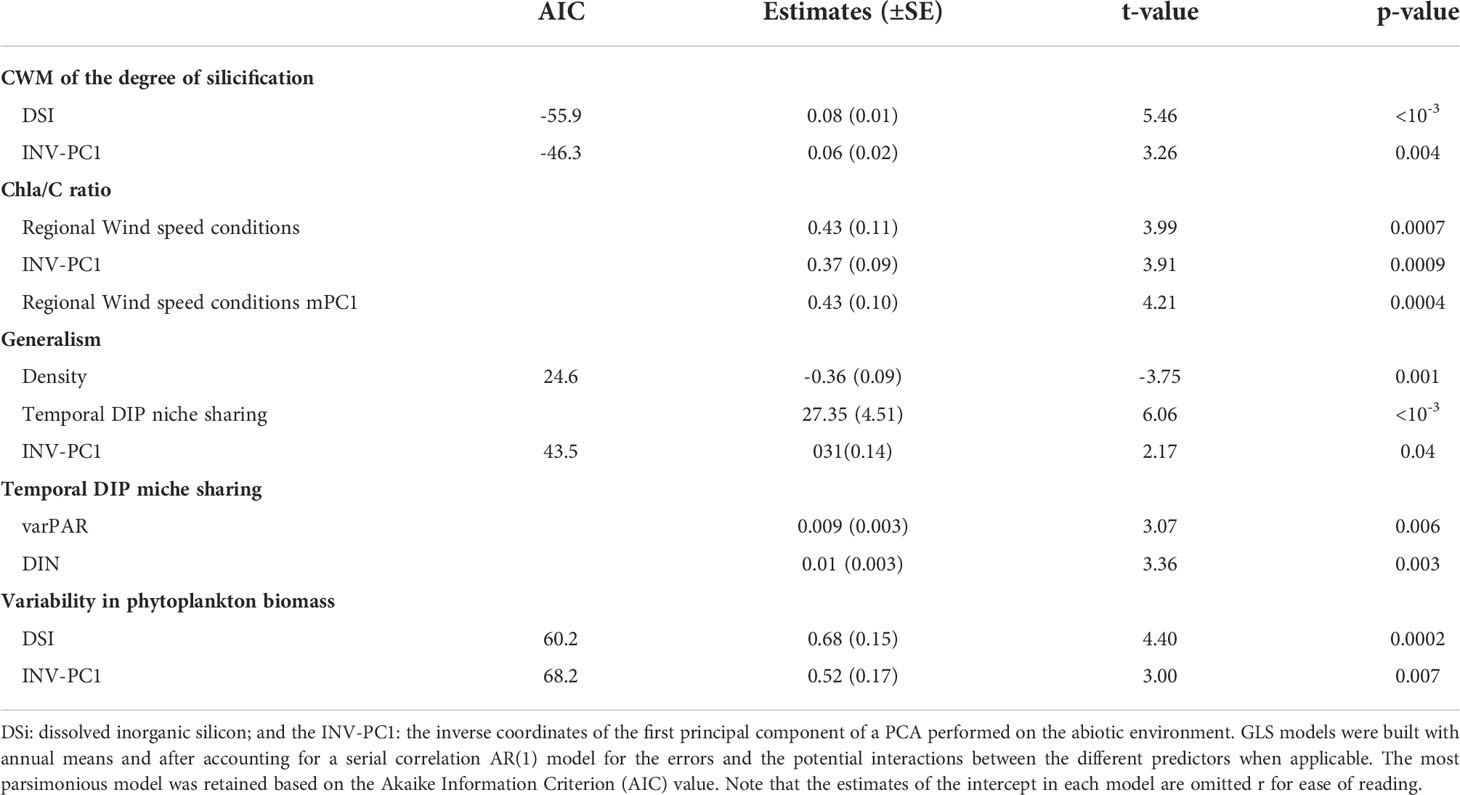
Table 3 Significant (p-value<0.05) coefficient estimates ( ± SE) from Generalized Least Squares (GLS) models to explore the driver-responses relationships of the Community-weight mean of the degree of silicification (CWM), the degree of generalism, the chlorophyll a-to-carbon ratio (Chla/C ratio), the temporal DIP niche sharing and the variability of phytoplankton biomass in coastal waters of the eastern English Channel from 1996 to 2019.
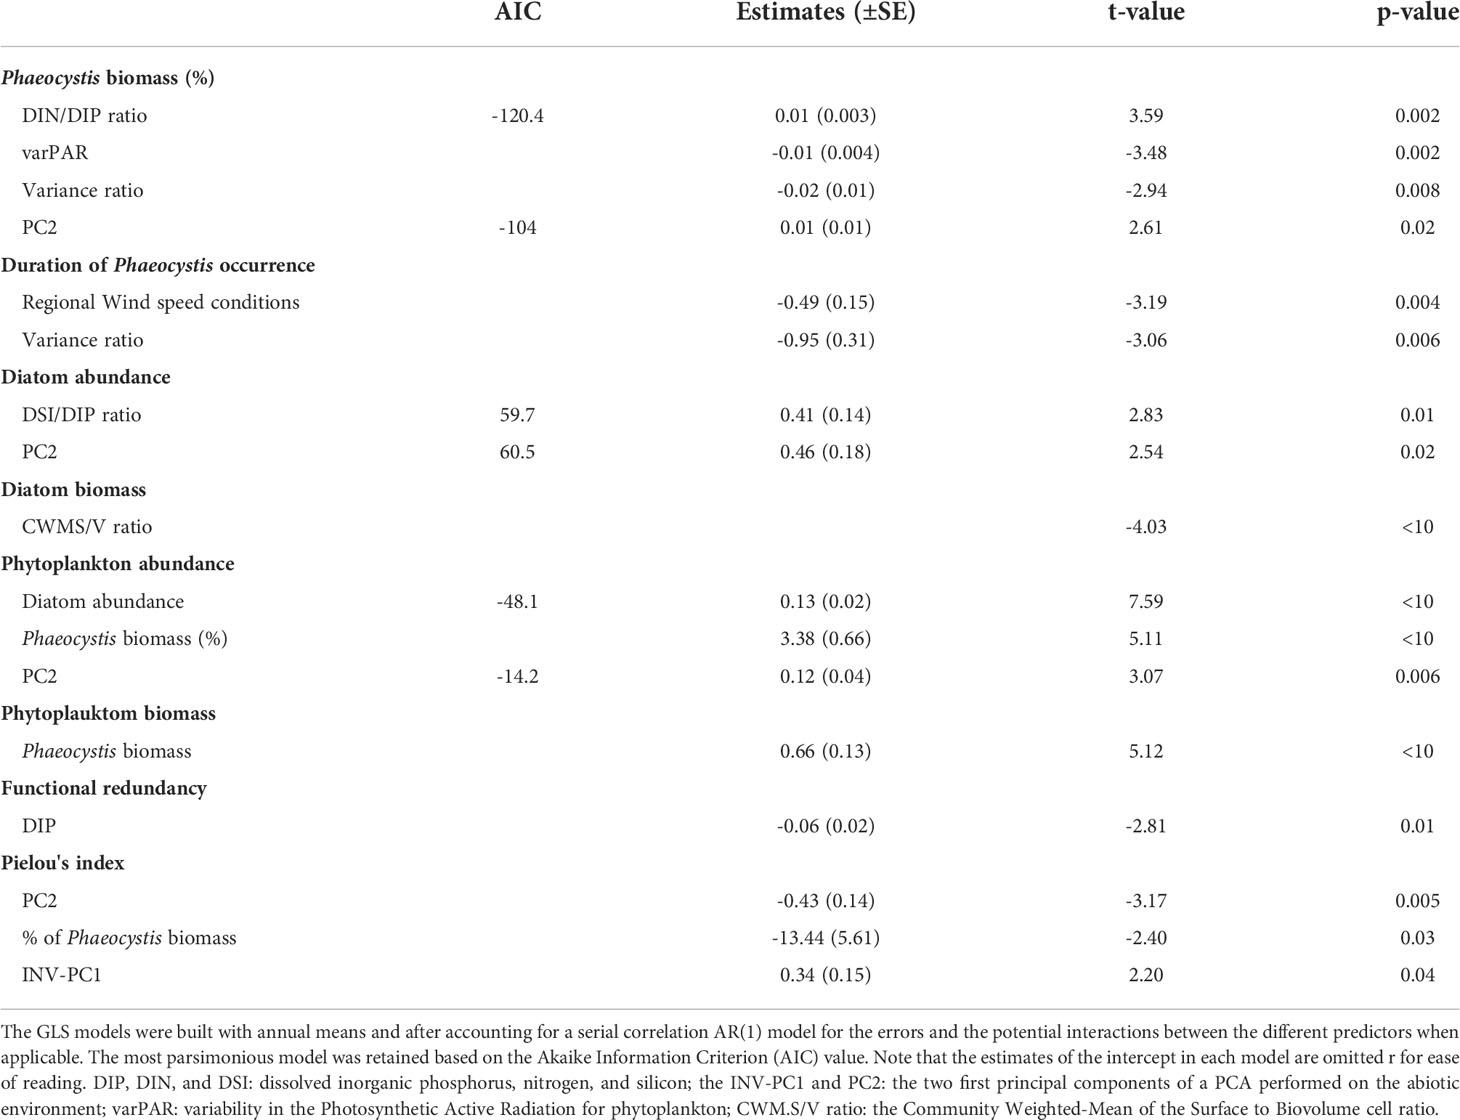
Table 4 Significant (p-value<0.05) coefficient estimates ( ± SE) from Generalized Least Squares (GLS) models to explore the driver-responses relationships of the contribution of Phaeocystis to total phytoplankton biomass (%), the duration of the seasonal Phaeocystis occurrence, the diatom abundance and biomass, the total phytoplankton abundance and biomass, the functional redundancy, and the Pielou’s evenness of the phytoplankton community in coastal waters of the eastern English Channel from 1996 to 2019. were positively and negatively related to DIP, respectively.
In contrast to the Cusums of phytoplankton biomass (Figure 6C) and its variability (Figure 5E), the Cusum of the temporal stability of community-level biomass (Figure 8), which results from both biomass and its variability, is unlike any other. However, GLS modelling indicated that the temporal stability of community-level biomass was significantly related to diatom biomass.
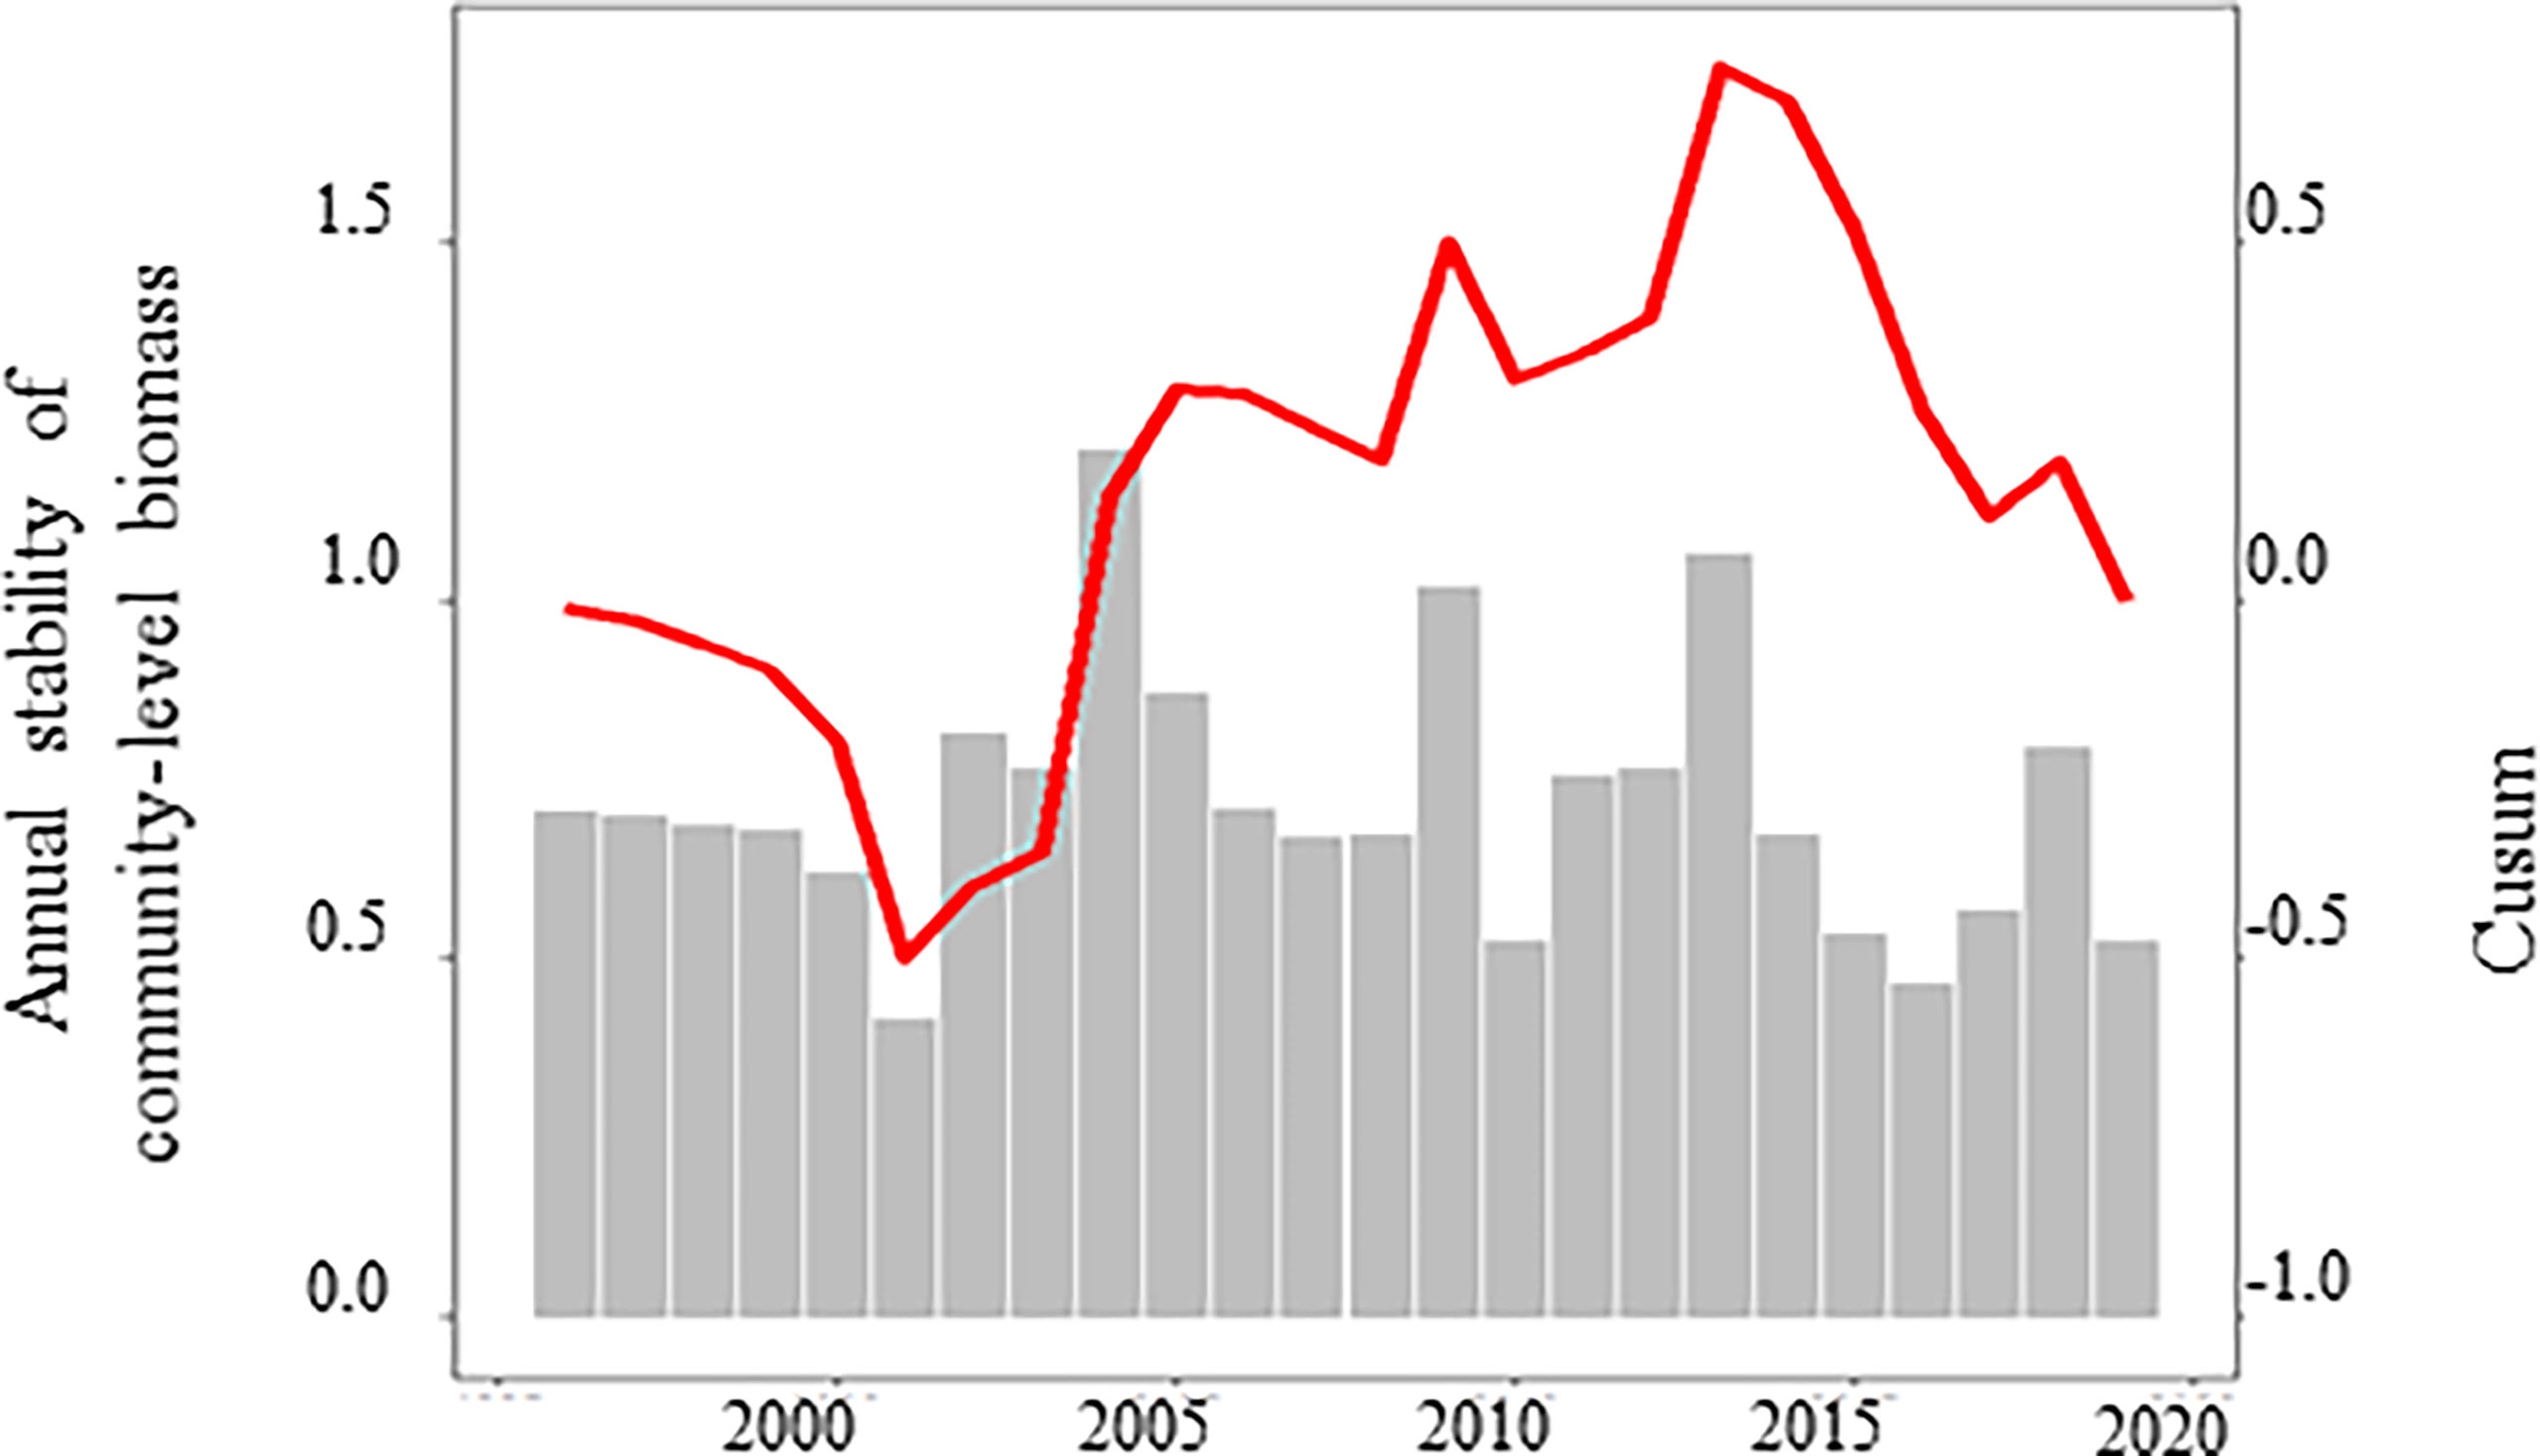
Figure 8 Temporal variations of the annual stability of community-level biomass (grey sticks) and its Cusum (red line).
Phytoplankton species richness and functional diversity (FRic and RaoQ) are displayed on Figures 9B–D. The FRic and RaoQ values for the diatom community and Phaeocystis were always significantly lower than values expected for random community analysis (i.e., 5th< SES< 95th percentile of the random distribution, i.e. [-1.96<SES<1.96], in grey in Figures 9B, C and S7A, B), indicating a strong environmental filtering on phytoplankton communities from 1996 to 2019. The inspection of the Cusum of SES-RaoQ (Figure 9B) showed a tendency towards traits divergence from 1996 to early 2004, however, followed by a period of traits convergence. By contrast to the observed phytoplankton community patterns, the response of functional biodiversity (SES-RaoQ and SES-FRic), the degree of generalism for DIP (Figure 9E) and the variance ratio (Figure 9F) increased along with DIP (Figures 9A–C). Although the variance ratio showed a trend towards compensation over the last decade (VR<1), null model testing indicated that VR values were never significantly different from one, and consequently; that species did not significantly covary. We detected the inverse pattern described above for species richness and defense against predation (Figures 9D, G). This suggests that the contribution of specialists for acquiring/using DIP and well-defended species within the community, and for which the phytoplankton community tend towards compensation dynamics, increased as DIP decreased. We revealed that temporal changes in the Cusum of defense was synchronous with that of phytoplankton biomass and inversely related to that of the Pielou’s evenness (see Figure S8). GLS modelling confirmed that the variance ratio and the niche breadth for DIP, and the CWM of defense against predation were positively and negatively related to DIP, respectively (Table 5). By contrast, the functional divergence (SES-RaoQ) was related to the total phytoplankton abundance. Moreover, species richness was inversely related to the functional divergence and the niche breadth for DIP. Note that although no clear driver-response relationships was found for synchrony based on the Cusum calculation, GLS modelling showed that synchrony was related to the regional wind speed conditions and the variance ratio (positively).
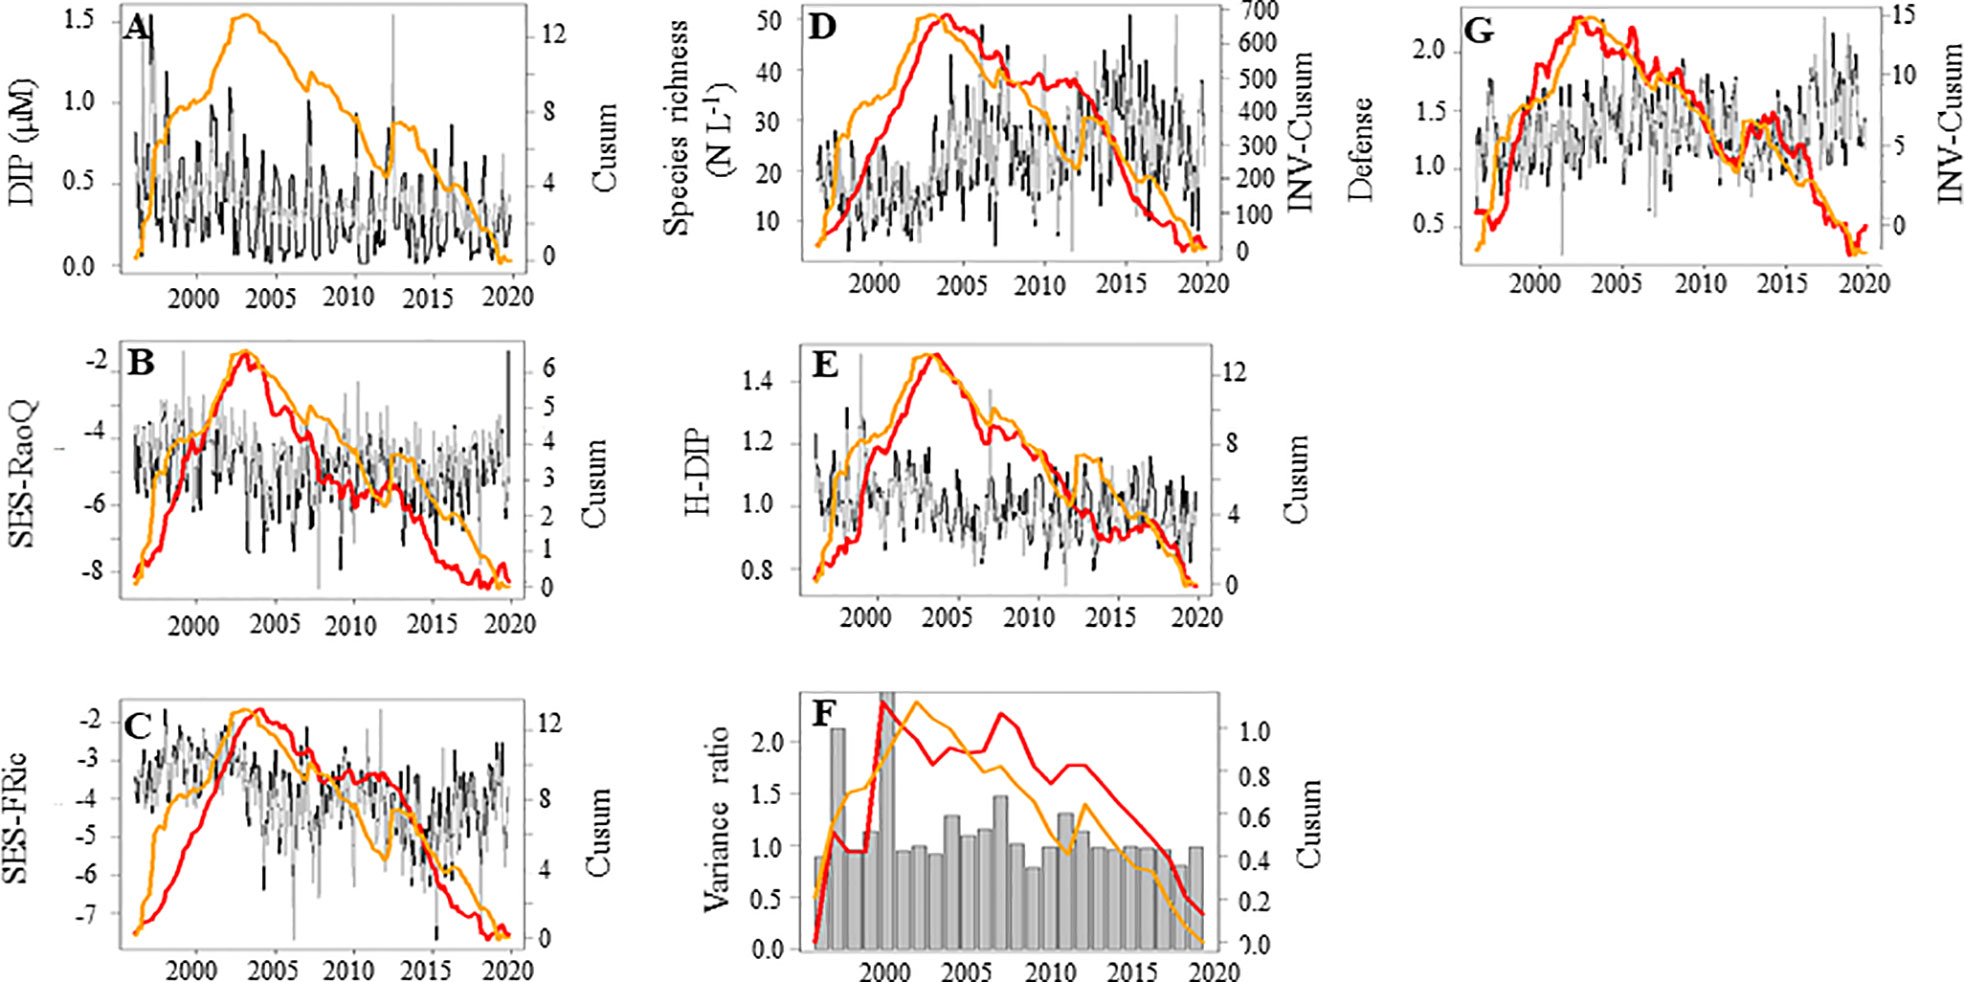
Figure 9 Temporal variations of the biodiversity (red lines) in relation with the concentration of dissolved inorganic phosphorous (DIP, µM, orange line) in coastal waters of the eastern English Channel over the period 1996-2019. (A) DIP (µM), (B) the functional divergence (SES-RaoQ), (C): the functional richness (SES-FRic), (D): the species richness (N L-1), (E) the degree of specialization for DIP, (F) the variance ratio, and (G) the phytoplankton defense. Black and grey lines: monthly raw and seasonally adjusted time-series, respectively. Grey sticks: annual value. Orange line: the Cusum of DIP. Red line: the other Cusum. Right axes are for seasonally adjusted and Cusum. Note that the Cusums of species richness and defense are inverted (INV-Cusum) for ease of reading.
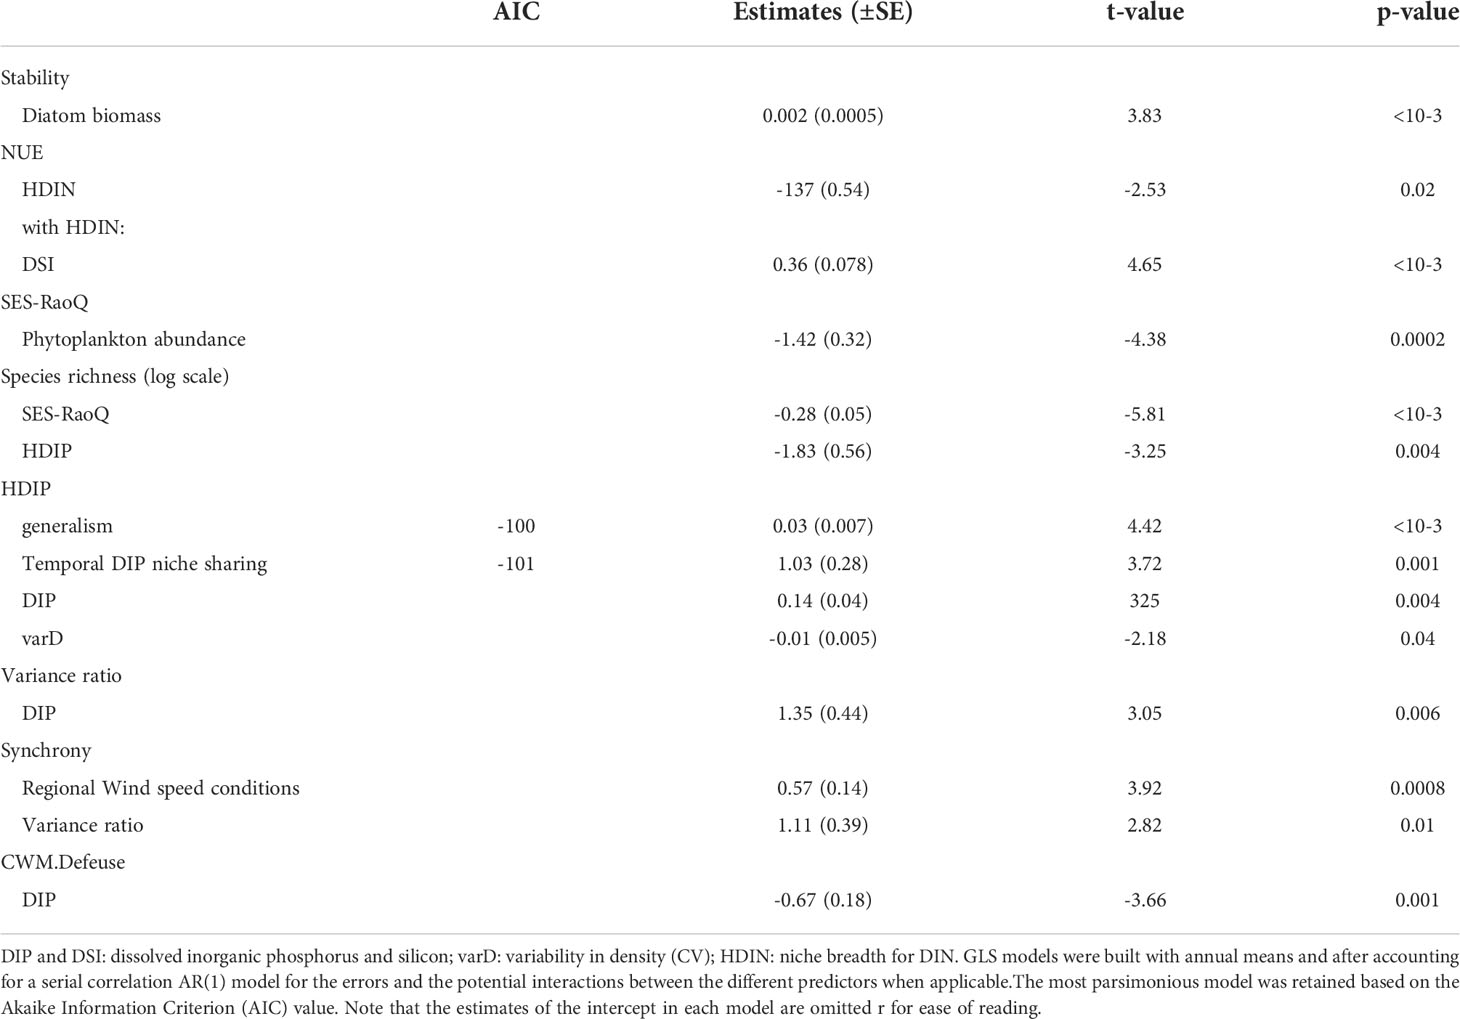
Table 5 Significant (p-value<0.05) coefficient estimates ( ± SE) from Generalized Least Squares (GLS) models to explore the driver-responses relationships of the temporal stability of community-level biomass and the Nitrogen Use Efficiency (NUE), the functional divergence (SES-RaoQ), species richness, the niche breadth for DIP (HDIP), the variance ratio, the synchrony, and the community weighted-mean of defense against predation (CWM-Defense) of the phytoplankton community in coastal waters of the eastern English Channel from 1996 to 2019.
The Cusums of the ecological specialization for the acquisition and/or use of DIN (i.e., the inverse niche breadth for DIN, Figure 10B) and the Nitrogen Use Efficiency (NUE, Figure 10C) followed that of Kd, i.e., a proxy of clarity in the seawater column (Figure 10A). The lower the Kd value (i.e., higher light availability), the lower the number of DIN-specialists species, and the NUE. The Cusum of Kd paralleled the Cusum obtained for regional wind speed (Figure S3C; S6A, B). GLS modelling confirmed the relationships between NUE and the degree of ecological specialization for DIN but not for Kd (Table 5). The degree of ecological specialization for DIN was inversely related to DSI.
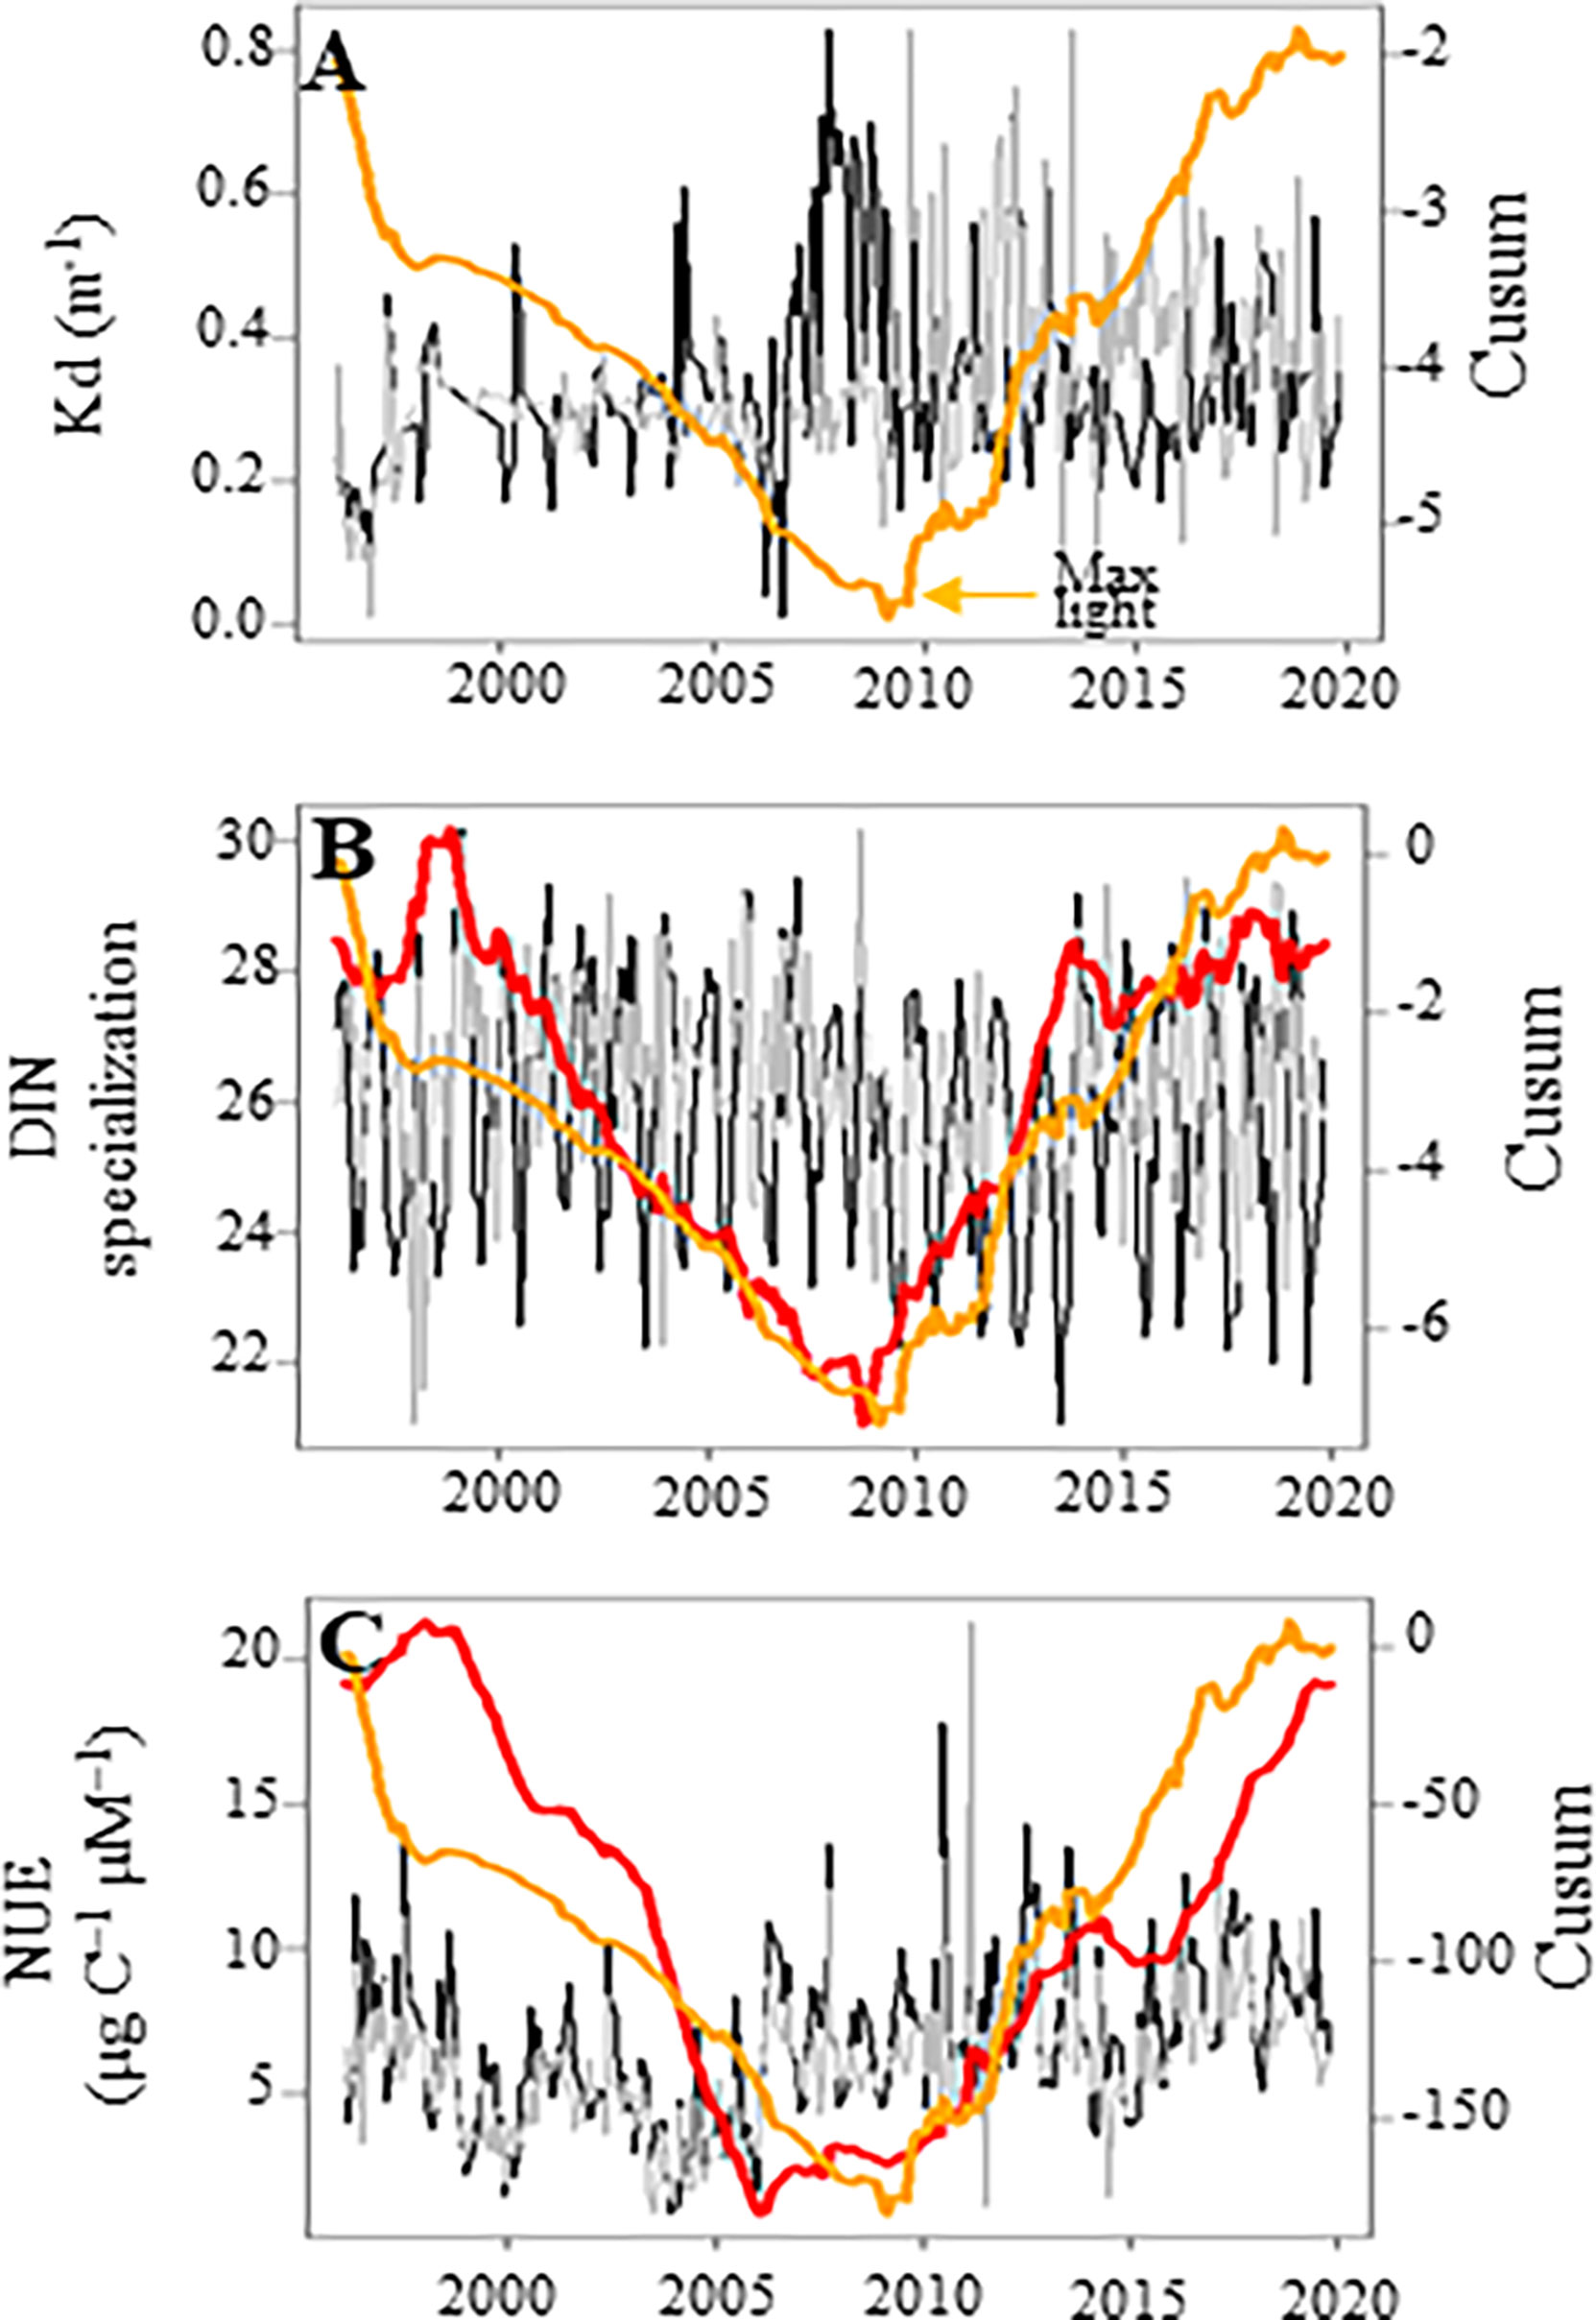
Figure 10 Temporal variations of (A) the vertical light attenuation coefficient (Kd, m-1) as a proxy of the quantity of light available in the water column for phytoplankton, (B) the degree of specialization for DIN, and (C) Nitrogen Use Efficiency (μg C–1 μM–1) in coastal waters of the eastern English Channel over the period 1996-2019. Black and grey lines: monthly raw and seasonally adjusted time-series, respectively, except for PC1 in (A), which represents seasonal adjusted ones. Orange line: the Cusum of Kd. Red line: the other Cusum. Right axes are for seasonally adjusted and Cusum.
Finally, although no correspondence was found between the Cusums of the degree of coloniality of the phytoplankton community and any other variable, GLS analyses revealed that coloniality was inversely related to DIN and variability in density (Table S3).
By studying resource requirement, acquisition and/or use traits over the last two decades, we demonstrated that environmental filtering (SES-RaoQ<-1.96) played a major role in structuring the phytoplankton communities of the coastal waters of the EEC. Such a general functional trait under-dispersion is in line with the finding that communities composed of functionally similar species are more frequent than previously reported (e.g., Segura et al., 2013; Bottin et al., 2016; Burson et al., 2019; Keck and Kahlert, 2019). From our Cusum analyses, the opposition between SES-RaoQ and the CWM of defense, as shown at the seasonal scale with the same datasets (Breton et al., 2021), suggests strongly that a competition-defense trade off played a key role in the regulation of phytoplankton species richness over the two last decades. The competition-defense trade-off provide a refuge for weak competitors that are better protected against predator attacks (e.g., Chase et al., 2002; Huot et al., 2014; Züst and Agrawal, 2017; Cadier et al., 2019; Ehrlich et al., 2020). The investment into defense mechanisms leads to relax competitive exclusion, through the predation pressure exerted on the competitively dominant species (Ehrlich et al., 2020), as we detected with the shift of SES-RaoQ towards higher functional clustering (Mayfield and Levine, 2010). Investing into defense has a metabolic cost at the expense of growth, however, such as a lower maximum growth rate or a lower competitive ability (Ehrlich et al., 2020). The suspicion of a competition-defense trade off was reinforced by the parallelism between the Cusums of defense and phytoplankton biomass, and the anti-parallelism between them and Pielou’s evenness (see Figure S8). Accordingly, competition-defense theory predicts that predation increase prey richness in more productive environments (Chase et al., 2002), when prey communities have low evenness (Worm et al., 2002; Hillebrand et al., 2007). Although the theory predicts that defense leads to increased coexistence only under eutrophic conditions (i.e., high nutrient levels; Våge et al., 2014), we observed an inverse pattern both with Cusums and GLS modelling (i.e., predation increased as DIP decreased). This discrepancy might be explained by the fact that nutrients levels are still high in our region of interest, despite significant re-oligotrophication.
Although we did not measure phytoplankton growth rate, the Chl a:C ratio is a potential relevant proxy for maximum growth rate (Cloern et al., 1995). Accordingly, this ratio decreases with increasing growth irradiance (Geider et al., 1986) and can be related to light-limited growth rate, rather than against irradiance directly (Langdon, 1988): the ratio increases linearly with growth rate when nutrients are limiting, and decreases curvilinearly with growth rate when light was limiting (Laws and Bannister, 1980). This suggests that phytoplankton growth rate in the EEC was maximal over the period 1996-2019 when nutrients were replete and light-limited, but slowed down as nutrients decreased. The trend towards an increase in the degree of coloniality of the phytoplankton community over time (i.e., as DIN decreased) reinforce the suspicion of a trend towards a growth slowdown over time. Colony formation involve physiological costs related to growth (Yokota and Sterner, 2011) caused by nutrient shielding (Ploug et al., 1999; Lavrentovich et al., 2013), as shown for Phaeocystis (Ploug et al., 1999). Here, we indirectly revealed a patent link between the Chl a:C ratio, DIP level through the PCA computed on abiotic forcing, and the opposition between the Cusums of DIP level and defense, and the parallelism between the Cusums of Chl a:C ratio and DIP level suggest that a growth-defense trade off might have operated at the same time than a competition-defense trade off. During high Chl a:C ratio periods, the link between precipitation and environmental forcing suggested a potential influence of light-limiting conditions on ratio variations; even if no direct influence of light was found. We detected a shift towards random species distribution with increasing precipitation, wind stress, and nutrient concentrations, but a reduction in species richness, that suggests either a competition for light (e.g., Sommer, 1988; Hautier et al., 2009) or stochastic effects under disturbed abiotic conditions (Weiher and Keddy, 1995). As stressed by Alvarez-Fernandez and Riegman (2014), the large variations in the Chl a:C ratio over the two last decades strengthened that using chlorophyll-a as a proxy of phytoplankton biomass must be done cautiously.
The correspondence between the apparent degree of silicification and wind-driven abiotic forcing/freshwater influence, as previously shown at the seasonal scale (Breton et al., 2021), is coherent with species requirements for cell wall rigidity (i.e., heavily silicified) and to counteract cell wall expansion provoked by haline shock (Logares et al., 2009; Hoef-Emden, 2014; Suescún-Bolívar and Thomé, 2015). As we found in the present and at the seasonal scale (Breton et al., 2021) heavier silicified species are expected to occur in environments with higher DSi level (Martin-Jézéquel et al., 2000; Martin-Jézéquel and Lopez, 2003), but the progressive decrease in silicification observed over the period 1996-2019 may have increased species palatability, favoring species investment into defense against predators. Competition–defense/growth-defense trade-offs are known to promote species diversity by reducing the fitness of superior competitors (i.e., slowing prey growth) and, therefore, fitness inequalities between competitors. Competition–defense/growth-defense trade-offs can therefore be considered as a fitness equalizing mechanism. In order to maintain long-term coexistence, stabilizing niche differences (i.e., reduction in niche overlap) are, however, required besides the need of the superior competitor to survive to predation (Chesson, 2000; Chesson and Kuang, 2008). Although specialization is often associated to fine niche differences (McArthur, 1972; Mason et al., 2008; Pigot et al., 2016), our results showed that variations in functional similarity (i.e., niche overlap) followed fluctuations of ecological specialization for DIP, as previously shown at the seasonal scale (Breton et al., 2021). The opposition between niche breadth for DIP and species richness that we revealed at the scale of the coastal waters of the EEC is consistent with the widespread pattern characterized by Granot and Belmaker (2019) for a large variety of taxa and ecosystems. The shift towards the dominance of generalists in response to abiotic forcing is clearly supported by the ability of such species to adapt to disturbed environments, eutrophicated systems, and unstable environmental conditions (Hautier et al., 2009; Hautier et al., 2015; Blüthgen et al., 2016; Pálffy and Vőrős, 2019). Ecological specialization of species may also reflect lower resource requirements (Carscadden et al., 2020).
While the traits used in this study may be too coarse to detect subtle niche partitioning, we showed a trend towards asynchronous variations (i.e., a decrease in the variance ratio) between species’ occurrences as DIP concentration decreased that suggest trade-off mechanisms related to competition for phosphate, such as competition versus defense against predation, or competition versus growth under high nutrient concentrations; mechanisms which can be invoked to explain niche differentiation. The correspondence between the temporal niche differentiation and abiotic forcing was explained by the key role of climatic stability on temporal niche differentiation. Environmental forcing - especially when severe and frequent - is known to synchronize population fluctuations (Loreau and de Mazancourt, 2008) and to favor stress-tolerant species over specialists (Levins, 1962; Purvis et al., 2000; Sultan and Spencer, 2002; Chase, 2007). Ecosystem stability requires some form of temporal niche differentiation to allow species to respond specifically to environmental variations, leading to asynchronous fluctuations. This process was illustrated in the coastal waters of the EEC by both the trend towards synchronous response of species to wind-driven abiotic forcing and the opposition to the degree of ecological specialization and environmental tolerance. Taken together, our results highlighted that (i) biogeographical history, (ii) abiotic filtering through change in salinity and resources, and (iii) biotic interactions (competition, and predation) were the main mechanisms that shaped phytoplankton communities and influenced species diversity in the coastal waters of the EEC over the two last decades: heavily silicified phytoplankton species that resist to changes in salinity and wind-driven turbulence were favored, as well as species that are morphologically well-defended Nutrient levels, especially DIP, have clearly contributed to structure phytoplankton communities in the coastal waters of the EEC during the period 1996-2019.
We did not detect any deleterious effect of Phaeocystis on diatoms and phytoplankton diversity, as previously shown at the seasonal scale (Breton et al., 2021). The strong correspondence between the unbalanced DIP reduction (see the correlations between biotic variables and PC2; Figure S3C, and GLS modelling on Table 4) and the contribution of Phaeocystis to total phytoplankton biomass clearly demonstrates that this species is well-adapted to anthropogenic disturbance, such as the European unbalanced reduction of nutrient loads (Loebl et al., 2009; Burson et al., 2016). A high capacity for efficient phosphate (P) acquisition and conservation are key traits for the success of invasive plants under P-limited environments (Olde Venterink, 2011 and references therein; Funk, 2013). Phaeocystis is fundamentally characterized by its ability to grow on dissolved organic phosphorus compounds (DOP) through alkaline phosphatase activity (APA, van Boekel and Veldhuis, 1990) and to form mucilaginous colonies, which act as a P reservoir (Moestrup and Larsen, 1992; Schoemann et al., 2005; Rousseau et al., 2007) and provide protection against predation (Nejstgaard et al., 2007). Our results therefore support the need for DIN abatement and/or a rebalancing of the DIN : DIP ratio in order to mitigate Phaeocystis blooms in the future. Our results showed that variability in PAR was another significant negative predictor of Phaeocystis biomass. It’s somewhat surprising given that Phaeocystis is considered to be able to photoadapt quickly to varying light conditions (Schoemann et al., 2005). By contrast, the fact that strong winds reduced significantly the seasonal duration of Phaeocystis occurrence is coherent with experimental works on the negative effect of turbulence on Phaeocystis (Schapira et al., 2006). The concurrent increase in Phaeocystis biomass, total diatom abundance, and functional clustering suggests that Phaeocystis (and also diatoms) might have also benefited from a density-dependent symmetric facilitation (i.e., mutualism; Gallien et al., 2018) cascade induced by the increase in total phytoplankton abundance: a high abundance of benefactors gives more chance for DOP compounds to be present, which in turn positively contribute to stronger and more efficient facilitative interactions (Krichen et al., 2019; Zhang and Tielbörger, 2020). More generally, facilitation might arise from an increase in community complexity (McIntire and Fajardo, 2014; Münkemüller et al., 2020 and references therein).
We therefore recommend that future studies explore the role of density-dependent facilitation for Phaeocystis success and the diversity of available DOP compounds. Assessment of the multiple molecular expression in species assemblages of the EEC must be carry out to confirm that DIP niche partitioning did not occur in the coastal waters of this ecosystem.
It is well known that diatoms dominate in well-mixed nitrate-rich waters (e.g., Breton et al., 2006). Our results suggest that diatoms were mainly influenced by seawater temperature, DIN concentration (indirectly through the relationship between the CWM-S/V ratio and DIN), and temporal variability in both DIN and DSi. The inverse Cusum pattern detected between diatom biomass and seawater temperature in the coastal waters of the EEC is consistent with in situ observations (Lürling et al., 2013 and references therein; Liu et al., 2020; Stockwell et al., 2020; Mancuso et al., 2021) and biogeochemical models (Bopp et al., 2005), raising concerns for the subsistence of diatom blooms under climate change conditions. Thermal stratification is often considered as the driving process of the decrease in diatom biomass (but see 2018; Kemp and Villareal, 2013), through the reduction of diatoms ability to stay in subsurface waters, where nutrient pulses typically occur (Falkowski and Oliver, 2008; Stockwell et al., 2020). In our study, no causal link between thermal stratification, nutrient concentrations and diatom biomass was found, however, with one hypothesis being that the combination of shallow waters and strong hydrodynamic conditions in the coastal waters of the EEC permanently mix the entire water column. The association between diatom biomass and temporal variability in DIN and DSi suggests a pivotal role of nutrient pulses in promoting diatom biomass. Climate warming may also directly affect the metabolism of species, or can act as a selection for the most thermally adapted species (Lewandowska et al., 2014). No link was detected with thermal niche breadth, however, and further analyses are needed to identify the underlying mechanisms behind temperature and diatom biomass in the coastal waters of the EEC.
We found no evidence that species richness and/or functional diversity are significant predictors of ecosystem functioning in the coastal waters of the EEC. Functional redundancy, crucial for ecosystem sustainability and for buffering the effects of environmental disturbances, was linked to phytoplankton productivity, the latter and NUE being driven by temporal changes in Phaeocystis biomass and the degree of specialization for DIN, respectively. In the same way, temporal stability of community-level biomass was related to diatom biomass but not species richness. Long-term changes in the assembly, structure and dynamics of phytoplankton communities of the coastal waters of the EEC therefore corroborate the ‘mass-ratio hypothesis’ (Grime, 2006) that states that the effect of each species on an ecosystem process is proportional to the relative abundance of its functional trait values; here we revealed an important role in nitrogen storage capacity and productivity. Our study also strengthens previous results obtained for the same study region, but with coarse functional groups (Breton et al., 2017), and in both the Baltic (Filstrup et al., 2014) and Wadden seas (for NUE; Hodapp et al., 2015). In contrast to Ptacnik et al. (2008) who found a positive relationship between phosphorous use efficiency, resource use efficiency, and phytoplankton genus richness in Scandinavian lakes, we revealed that the dominance of a few species explained most of NUE and productivity of the coastal waters of the EEC.
Taken together, our results showed that phytoplankton communities in the coastal waters of the eastern English Channel were shaped over the last two decades by favoring either species specialized food resources, or species with ability to invest in growth, defense, chlorophyll-a and silicification levels, with a clear influence of environmental perturbations - such as wind-driven instability, riverine nutrient loads, and unbalanced nutrient reduction - and biotic interactions (competition, predation, facilitation). Our study provides strong support for both niche-based and facilitative processes, while highlighting the challenging choices faced by managers to preserve the integrity and sustainability of ecosystems in future, mainly because of the multiple responses of the phytoplankton communities to environmental change and the trade-offs - or lack of synergy - between ecosystem functions/properties.
The original contributions presented in the study are publicly available. This data can be found here: https://doi.org/10.6084/m9.figshare.21196069.v1.
EB, EG, BS, LS, GB, DP, NG, and UC conceived the ideas and designed methodology; EB, EG, D-IS, MC, DP, CS, AC, and FG collected the data. EB, AO, and AP analysed the data; EB, EG, BS, LS, GB, D-IS, LK, MC, and UC led the writing of the manuscript. All authors contributed critically to the drafts and gave final approval for publication.
We thank the successive captains and crews of the RV Sepia II (INSU-CNRS), especially Charly Dollet, Jean-Claude Martin, Grégoire Leignel, Noël Lefiliatre, and Christophe Routier who helped during long-term monitoring in coastal waters of the eastern English Channel (1996-2019). We also thank the local SOMLIT team for sampling and physico-chemical measurements and analysis, especially N. Degros, E. Lecuyer, and Dr. V. Gentilhomme, as well as Emilie Grossteffan from the IUEM institute who analysed nutrients when local equipment was out of order. The other members of the SOMLIT Quality team (i.e., L. Oriol, P. Rimmelin, T. Cariou, S. Ferreira, E. Sultan, O. Jolly, P. Pineau, S. Mas, H. De Lary, J. Lamoureux, A. Gueux and O. Crispi) are acknowledged for their investment all along the last two decades for improving the precision and the accuracy of the environmental data. The authors also thank the students for their assistance in water sample collection and help in nutrient analysis within the context of the SOMLIT program (INSU-CNRS), and the students S. Bosc and P. Faye for their contribution to diatom species size measurements. Finally, we thank the PHYTOBS network, especially Nadine Neaud-Masson (IFREMER) for its essential role in taxonomy expertise. Microscopy and harvesting equipment got several funding over the last decades including a BQR ULCO in 2007. This work was a contribution of the project EVOLECO-NUPHY supported by the French National program LEFE (Les Enveloppes Fluides et l’Environnement). ULCO is acknowledged for the payment of the publication.
The authors declare that the research was conducted in the absence of any commercial or financial relationships that could be construed as a potential conflict of interest.
All claims expressed in this article are solely those of the authors and do not necessarily represent those of their affiliated organizations, or those of the publisher, the editors and the reviewers. Any product that may be evaluated in this article, or claim that may be made by its manufacturer, is not guaranteed or endorsed by the publisher.
The Supplementary Material for this article can be found online at: https://www.frontiersin.org/articles/10.3389/fmars.2022.914475/full#supplementary-material
Ackerly D. D. (2003). Community assembly, niche conservatism, and adaptive evolution in changing environments. Int. J. Plant Sci. 164, S165–S184. doi: 10.1086/368401
Adler P. B., HilleRisLambers J., Kyriakidis P. C., Guan Q., Levine J. M. (2006). Climate variability has a stabilizing effect on the coexistence of prairie grasses. PNAS 103, 12793–12798. doi: 10.1073/pnas.0600599103
Aitken A. C. (1936). On least-squares and linear combinations of observations. PNAS 55, 42–48. doi: 10.1017/S0370164600014346
Alexander T. J., Vonlanthen P., Seehausen O. (2016). Does eutrophication-driven evolution change aquatic ecosystem? Philos. Trans. R. Soc Lond. B Biol. Sci. 372, 20160041. doi: 10.1098/rstb.2016.0041
Alvarez-Fernandez S., Lindeboom H., Meesters E. (2012). Temporal changes in plankton of the north Sea: community shifts and environmental drivers. Mar. Ecol. Prog. Ser. 462, 21–38. doi: 10.3354/meps09817
Alvarez-Fernandez S., Riegman R. (2014). Chlorophyll in north Sea coastal and offshore waters does not reflect long-term trends of phytoplankton biomass. J. Sea Res. 91, 35–44. doi: 10.1016/j.seares.2014.04.005
Aminot A., Kérouel R. (2004). Hydrologie des écosystèmes marins: paramètres et analyses. Eds. Ifremer, Brest. 1, 335
Biggs C. R., Yeager L. A., Bolser D. G., Bonsell C., Dichiera A. M., Hou Z., et al. (2020). Does functional redundancy affect ecological stability and resilience? a review and meta-analysis. Ecosphere 117, e03184. doi: 10.1002/ecs2.3184
Bjærke O., Jonsson P. R., Alam A., Selander E. (2015). Is chain length in phytoplankton regulated to evade predation? J. Plankton Res. 37, 1110–1119. doi: 10.1093/plankt/fbv076
Blonder B., Lamanna C., Violle C., Enquis B. J. (2014). The n-dimensional hypervolume. Glob. Ecol. Biogeogr. 23, 595–609. doi: 10.1111/geb.12146
Blüthgen N., Simons N. K., Jung K., Prati D., Renner S. C., Boch S., et al. (2016). Land use imperils plant and animal community stability through changes in asynchrony rather than diversity. Nat. Commun. 12, 10697. doi: 10.1038/ncomms10697
Bonato S., Breton E., Didry M., Lizon F., Cornille V., Lécuyer E., et al. (2016). Spatio-temporal patterns in phytoplankton assemblages in coastal-offshore gradients using flow cytometry: a case study in the eastern English channel. J. Mar. Syst. 156, 76–85. doi: 10.1016/j.jmarsys.2015.11.009
Bopp L., Aumont O., Cadule P., Alvain S., Gehlen M. (2005). Response of diatoms distribution to global warming and potential implications: A global model study. Geophys. Res. Lett. 32, L19606. doi: 10.1029/2005GL023653
Borja A. (2014). Grand challenges in marine ecosystems ecology. Front. Mar. Sci. 1. doi: 10.3389/fmars.2014.00001
Botta-Dukát Z. (2005). Rao's quadratic entropy as a measure of functional diversity based on multiple traits. J. Veg. Sci. 16, 533–540. doi: 10.1111/j.1654-1103.2005.tb02393.x
Botta-Dukát Z., Czúcz B. (2016). Testing the ability of functional diversity indices to detect trait convergence and divergence using individual-based simulation. Methods Ecol. Evol. 7, 114–126. doi: 10.1111/2041-210X.12450
Bottin M., Soininen J., Alard D., Rosebery J. (2016). Diatom cooccurrence shows less segregation than predicted from niche modeling. PloS One 114, e0154581. doi: 10.1371/journal.pone.0154581
Breton E., Brunet C., Sautour B., Brylinski. J. M. (2000). Annual variations of phytoplankton biomass in the eastern English channel: comparison by pigment signatures and microscopic counts. J. Plankton Res. 22, 1423–1440. doi: 10.1093/plankt/22.8.1423
Breton E., Christaki U., Bonato S., Didry M., Artigas L. F. (2017). Functional trait variation and nitrogen use efficiency in temperate coastal phytoplankton. Mar. Ecol. Prog. Ser. 563, 35–49. doi: 10.3354/meps11974
Breton E., Christaki U., Sautour B., Demonio O., Skouroliakou D.-I., Beaugrand G., et al. (2021). Seasonal variations in the biodiversity, ecological strategy, and specialization of diatoms and copepods in a coastal system with phaeocystis blooms: The key role of trait trade-offs. Front. Mar. Sci. 8. doi: 10.3389/fmars.2021.656300
Breton E., Rousseau V., Parent J. Y., Ozer J., Lancelot C. (2006). Hydroclimatic modulation of diatom/Phaeocystis blooms in nutrient-enriched Belgian coastal waters north Sea. Limnol. Oceanogr. 51, 1401–1409. doi: 10.4319/lo.2006.51.3.1401
Brzezinski M. A. (1985). The Si:C:N ratio of marine diatoms: interspecific variability and the effect of some environmental variables. J. Phycol. 21, 347–357. doi: 10.1111/j.0022-3646.1985.00347.x
Buitenhuis E. T., Li W. K. W., Vaulot D., Lomas M. W., Landry M. R., Partensky F., et al. (2012). Picophytoplankton biomass distribution in the global ocean. Earth Syst. Sci. Data 4, 37–46. doi: 10.5194/essd-4-37-2012
Burson A., Stomp M., Akil L., Brussaard C. P. D., Huisman J. (2016). Unbalanced reduction of nutrient loads has created an offshore gradient from phosphorus to nitrogen limitation in the north Sea. Limnol. Oceanogr. 61, 869–888. doi: 10.1002/lno.10257
Burson A., Stomp M., Mekkes L., Huisman J. (2019). Stable coexistence of equivalent nutrient competitors through niche differentiation in the light spectrum. Ecology 10012, e02873. doi: 10.1002/ecy.2873
Cadier M., Andersen K. H., Visser A. W., Kiørboe T. (2019). Competition–defense tradeoff increases the diversity of microbial plankton communities and dampens trophic cascades. Oikos 128, 1027–1040. doi: 10.1111/oik.06101
Cadotte M. W., Carscadden K., Mirotchnick N. (2011). Beyond species: functional diversity and the maintenance of ecological processes and services. J. Appl. Ecol. 48, 1079–1087. doi: 10.1111/j.1365-2664.2011.02048.x
Cardinale B. J. (2011). Biodiversity improves water quality through niche partitioning. Nature 472, 86–89. doi: 10.1038/nature09904
Cardinale B. J., Duffy J. E., Gonzalez A., Hooper D. U., Perrings C., Venail P., et al. (2012). Biodiversity loss and its impact on humanity. Nature 486, 59–67. doi: 10.1038/nature11148
Cardoso P., Rigal F., Carvalho J. C. (2014) BAT: Biodiversity AssessmentTools. r package version 1.0.1. Available at: http://cran.r-project.org/package=BAT.
Carscadden K. A., Emery N. C., Arnillas C. A., Cadotte M. W., Afkhami M. E., Gravel D., et al. (2020). Niche breadth: Causes and consequences for ecology, evolution, and conservation. Q. Rev. Biol. 953, 179–214. doi: 10.1086/710388
Carvalho J. C., Cardoso P. (2018). Decomposing the causes for niche differentiation between species using hypervolumes. Front. Ecol. Evolution 8. doi: 10.3389/fevo.2020.00243
Chase J. M. (2007). Drought mediates the importance of stochastic community assembly. PNAS 104, 17430–17434. doi: 10.1073/pnas.07043501042007
Chase J. M., Abrams P. A., Grover J. P., Diehl S., Chesson P., Holt R. D., et al. (2002). The interaction between predation and competition: a review and synthesis. Ecol. Lett. 5, 302–315. doi: 10.1038/nature07248
Chessel D., Dufour A. B., Thioulouse J. (2004). The ade4 package-I-One-table methods. R News 4, 5–10. Available at: https://cran.r-project.org/doc/Rnews/
Chesson P. (2000). Mechanisms of maintenance of species diversity. Annu. Rev. Ecol. Evol. Syst. 311, 343–366. doi: 10.1146/annurev.ecolsys.31.1.343
Chesson P. (2008). “Quantifying and testing species coexistence mechanisms,” in Unity in diversity: Reflections on ecology after the legacy of ramon margalef. Eds. Valladares F., Camacho A., Elosegui A., Gracia C., Estrada M., Senar J. C., Gili J. M. (Bilbao, Spain: Fundacion BBVA), 119–164.
Chesson P., Kuang J. J. (2008). The interaction between predation and competition. Nature 4567219, 235–238. doi: 10.1038/nature07248
Cleveland R.B., Cleveland W.S. (1990). STL: A Seasonal-Trend Decomposition Procedure Based on Loess. J. Official Statistics 6, 3–33.
Cloern J. E., Grenz C., Vidergar-Lucas L. (1995). An empirical model of the phytoplankton chlorophyll : carbon ratio-the conversion factor between productivity and growth rate. Limnol. Oceanogr. 40, 1313–1321. doi: 10.4319/lo.1995.40.7.1313
Cloern J. E., Jassby A. D., Carstensen J., Bennett W. A., Kimmerer W., Nally R. M., et al. (2012). Perils of correlating CUSUM-transformed variables to infer ecological relationships. Limnol. Oceanogr. 57, 665–668. doi: 10.4319/lo.2012.57.2.0665
Cornwell W. K., Ackerly D. D. (2009). Community assembly and shifts in plant trait distributions across an environmental gradient in coastal California. Ecol. Monogr. 79, 109–126. doi: 10.1890/07-1134.1
Cottingham K. L., Brown B. L., Lennon J. T. (2001). Biodiversity may regulate the temporal variability of ecological systems. Ecol. Lett. 4, 72–85. doi: 10.1046/j.1461-0248.2001.00189.x
Debastiani V., Pillar V. (2012). SYNCSA - r tool for analysis of metacommunities based on functional traits and phylogeny of the community components. Bioinform. 28, 2067–2068. doi: 10.1093/bioinformatics/bts325
de Bello F., Lepš J., Lavorel S., Moretti M. (2007). Importance of species abundance for assessment of trait composition: an example based on pollinator communities. Community Ecol. 8, 163–170. doi: 10.1556/ComEc.8.2007.2.3
De Laender F., Rohr J. R., Ashauer R., Baird D. J., Berger U., Eisenhauer N., et al. (2016). Reintroducing environmental change drivers in biodiversity-ecosystem functioning research. Trends Ecol. Evol. 31, 905–915. doi: 10.1016/j.tree.2016.09.007
Dolédec S., Chessel D., Gimaret-Carpentier C. (2000). Niche separation in community analysis: a new method. Ecology 81, 2914–2927. doi: 10.1890/0012-96582000081
Dray S., Dufour A. B., Chessel D. (2007). The ade4 package-II: two-table and K-table methods. R News 7, 47–52. Available at: https://sdray.github.io/publication/dray-2007-a/.
Duarte C. M., Conley D. J., Carstensen J., Sánchez-Camacho M. (2009). Return to neverland: shifting baselines affect eutrophication restoration targets. Estuaries Coasts 32, 29–36. doi: 10.1007/s12237-008-9111-2
Duffy J. E. (2009). Why biodiversity is important to the functioning of real-world ecosystems. Front. Ecol. Environ. 7, 437–444. doi: 10.1890/070195
Ehrlich E., Kath N. J., Gaedke U. (2020). The shape of a defense-growth trade-off governs seasonal trait dynamics in natural phytoplankton. ISME 14, 1451–1462. doi: 10.1038/s41396-020-0619-1
European Union (1991a). Directive 91/676/EEC concerning the protection of waters against pollution caused by nitrates from agricultural sources. 1–8. Available at: https://eur-lex.europa.eu/legal-content/EN/ALL/?uri=celex%3A31991L0676
European Union (1991b). Council directive 91/271/EEC concerning urban wastewater treatment. 40–52. Available at: https://eur-lex.europa.eu/legal-content/EN/TXT/?uri=celex%3A31991L0271.
Falkowski P., Oliver M. (2008). Diatoms in a future ocean — stirring it up: reply from falkowski and Oliver. Nat. Rev. Microbiol. 6, 407. doi: 10.1038/nrmicro1751-c2
Figge F. (2004). Bio-folio: applying portfolio theory to biodiversity. Biodivers. Conserv. 13, 827–849. doi: 10.1023/B:BIOC.0000011729.93889.34
Filstrup C. T., Hillebrand H., Heathcote A. J., Harpole W. S., Downing J. A. (2014). Cyanobacteria dominance influences resource use efficiency and community turnover in phytoplankton and zooplankton communities. Ecol. Lett. 17, 464–474. doi: 10.1111/ele.12246
Fox J., Weisberg S. (2019). An r companion to applied regression. 3rd ed. (Thousand Oaks CA: Sage). Available at: https://socialsciences.mcmaster.ca/jfox/Books/Companion/.
Funk J. L. (2013). The physiology of invasive plants in low-resource environments. Conserv. Physiol. 11, cot026. doi: 10.1093/conphys/cot026
Gallien L., Zurell D., Zimmermann N. E. (2018). Frequency and intensity of facilitation reveal opposing patterns along a stress gradient. Ecol. Evol. 8, 2171–2181. doi: 10.1002/ece3.3855
Gao V. D., Morley-Fletcher S., Maccari S., Vitaterna M. H., Turek F. W. (2020). Resource competition shapes biological rhythms and promotes temporal niche differentiation in a community simulation. Ecol. Evol. 10, 11322–11334. doi: 10.1002/ece3.6770
Garnier E., Cortez J., Billes G., Navas M. L., Roumet C., Debussche M., et al. (2004). Plant functional markers capture ecosystem properties during secondary succession. Ecology 85, 2630–2637. doi: 10.1890/03-0799
Geider R. J., Osborne B. A., Raven I. A. (1986). Growth, photosynthesis and maintenance metabolic cost in the diatom phaeodactylum tricornutum at very low light levels. J. Phycol. 22, 39–48. doi: 10.1111/j.1529-8817.1986.tb02513.x
Genitsaris S., Monchy S., Breton E., Lecuyer E., Christaki U. (2016). Small-scale variability of protistan planktonic communities relative to environmental pressures and biotic interactions at two adjacent coastal stations. Mar. Ecol. Prog. Ser. 548, 61–75. doi: 10.3354/meps11647
Genitsaris S., Monchy S., Viscogliosi E., Sime-Ngando T., Ferreira S., Christaki. U. (2015). Seasonal variations of marine protist community structure based on taxon-specific traits using the eastern English channel as a model coastal system. FEMS Microbiol. Ecol. 91, fiv034. doi: 10.1093/femsec/fiv034
Glibert P. M. (2010). Long-term changes in nutrient loading and stoichiometry and their relationships with changes in the foodweb and dominant pelagic fish species in the San Francisco estuary, California. Rev. Fish. Sci. 18, 211–232. doi: 10.1080/10641262.2010.492059
Gómez F., Souissi S. (2007). The distribution and life cycle of the dinoflagellate spatulodinium pseudonoctiluca dinophyceae, noctilucales in the northeastern English channel. C.R. Biol. 330, 231–236. doi: 10.1016/j.crvi.2007.02.002
Gotelli N. J., McCabe D. J. (2002). Species Co-occurrence: A meta-analysis of j. m. diamond’s assembly rules model. Ecology 83, 2091–2096. doi: 10.1890/0012-96582002083
Gower J. C. (1971). A general coefficient of similarity and some of its properties. Biometrics 27, 857. doi: 10.2307/2528823
Granot I., Belmaker J. (2019). Niche breadth and species richness: Correlation strength, scale and mechanisms. Glob. Ecol. Biogeogr. 29, 159–170. doi: 10.1111/geb.13011
Grime J. P. (2006). Trait convergence and trait divergence in herbaceous plant communities: mechanisms and consequences. J. Veg. Sci. 17, 255–260. doi: 10.1111/j.1654-1103.2006.tb02444.x
Gross K., Cardinale B. J., Fox J. W., Gonzalez A., Loreau M., Wayne Polley H., et al. (2014). Species richness and the temporal stability of biomass production: a new analysis of recent biodiversity experiments. Am. Nat. 183, 1–12. doi: 10.1086/673915
Grover J. P. (1989). Influence of cell shape and size on algal competitive ability. J. Phycol. 25, 402–405. doi: 10.1111/j.1529-8817.1989.tb00138.x
Hafen R. (2016) Stlplus : Enhanced seasonal decomposition of time series by loess. r package version 0.5.1. Available at: https://github.com/hafen/stlplus.
Hallett L., Avolio M., Carroll I., Jones S., MacDonald A., Flynn D., et al. (2020). doi: 10.5063/F1N877Z6
Hasle G. R., Syvertsen E. E. (1996). “Chapter 2 - marine diatoms,” in Identifying marine diatoms and dinoflagellates. Ed. Tomas C. R. (Academic Press), 5–385, ISBN: ISBN 9780126930153. doi: 10.1016/B978-012693015-3/50005-X
Hastie T., Tibshirani R. (1990). Generalized additive models Vol. 1990 (New York, United States:Chapman & Hall/CRC), 352 p, ISBN: ISBN 978-0-412-34390-2.
Hautier Y., Niklaus P. A., Hector A. (2009). Competition for light causes plant biodiversity loss after eutrophication. Science 324, 636–638. doi: 10.1126/science.1169640
Hautier Y., Tilman D., Forest I., Seabloom E. W., Borer E. T., Reich P. B. (2015). Anthropogenic environmental changes affect ecosystem stability via biodiversity. Science 348, 336–340. doi: 10.1126/science.aaa1788
Hillebrand H., Dürselen C. D., Kirschtel D., Pollingher U., Zohary T. (1999). Biovolume calculation for pelagic and benthic microalgae. J. Phycol. 35, 403–424. doi: 10.1046/j.1529-8817.1999.3520403.x
Hillebrand H., Gruner D. S., Borer E. T., Bracken M. E., Cleland E. E., Elser J. J., et al. (2007). Consumer versus resource control of producer diversity depends on ecosystem type and producer community structure. Proc. Natl. Acad. Sci. U.S.A. 104, 10904–10909. doi: 10.1073/pnas.0701918104
Hodapp D., Meier S., Muijsers F., Badewien T. H., Hillebrand H. (2015). Structural equation modeling approach to the diversity-productivity relationship of wadden Sea phytoplankton. Mar. Ecol. Prog. Ser. 523, 31–40. doi: 10.3354/meps11153
Hoef-Emden K. (2014). Osmotolerance in the cryptophyceae: jacks-of-all-trades in the chroomonas clade. Protist 165, 123–143. doi: 10.1016/j.protis.2014.01.001
Holmes R. M., Aminot A., Kérouel R., Hooker B. A., Peterson B. J. (1999). A simple and precise method for measuring ammonium in marine and freshwater ecosystems. Can. Can. J. Fish. Aquat. Sci. 56, 1801–1808. doi: 10.1139/f99-128
Hoppenrath M., Elbrächter M., Drebes G. (2009). Marine phytoplankton. selected microphytoplankton from the north Sea around helgoland and sylt (Stuttgart: E. Schweizerbartsche Verlagsbuchhandlung), 264, ISBN: ISBN: 9783510613922.
Houliez E., Lizon F., Artigas L. F., Lefebvre S. F., Schmitt G. (2013). Spatio-temporal variability of phytoplankton photosynthetic activity in a macrotidal ecosystem the strait of Dover, eastern English channel. Estuar. Coast. Shelf Sci. 129, 37–48. doi: 10.1016/j.ecss.2013.06.009
Huot B., Yao J., Montgomery B. L., He S. Y. (2014). Growth-defense tradeoffs in plants: a balancing act to optimize fitness. Mol. Plant 7, 1267–1287. doi: 10.1093/mp/ssu049
Ibañez F., Fromentin J. M., Castel J. (1993). Application de la méthode des sommes cumulées à l'analyse des séries chronologiques en océanographie. comptes rendus de l'Académie des sciences de Paris. Sci. la Vie. 316, 745–748.
Jahnke J. (1989). The light and temperature dependence of growth rate and elemental composition of phaeocystis globosa scherffel and p. pouchetii (Har.) lagerh. in batchcultures. Neth. J. Sea Res. 23, 15–21. doi: 10.1016/0077-7579(89)90038-0
Jakobsen H. H., Markager S. (2016). Carbon-to-chlorophyll ratio for phytoplankton in temperate coastal waters: Seasonal patterns and relationship to nutrients. Limnol. Oceanogr. 61, 1853–1868. doi: 10.1002/lno.10338
Kalman R. E. (1960). A new approach to linear filtering and prediction problems ». J. Basic Eng. 82.1, 35–45. doi: 10.1115/1.3662552
Karp-Boss L., Boss E. (2016). “The elongated, the squat and the spherical: Selective pressures for phytoplankton shape,” in Aquatic microbial ecology and biogeochemistry: A dual perspective. Eds. Glibert P. M., Kana T. M. (Cham: Springer International Publishing), 25–34. doi: 10.1007/978-3-319-30259-1_3
Karp-Boss L., Boss E., Jumars P. A. (1996). Nutrient fluxes to planktonic osmotrophs in the presence of fluid motion. Oceanogr. Mar. Biol. 34, 71–107.
Keck F., Kahlert M. (2019). Community phylogenetic structure reveals the imprint of dispersal-related dynamics and environmental filtering by nutrient availability in freshwater diatoms. Sci. Rep. 12, 11590. doi: 10.1038/s41598-019-48125-0
Kemp A. E. S., Villareal T. A. (2013). High diatom production and export in stratified waters – a potential negative feedback to global warming. Prog. Oceanogr. 119, 4–23. doi: 10.1016/j.pocean.2013.06.004
Kemp A. E. S., Villareal T. A. (2018). The case of the diatoms and the muddled mandalas: Time to recognize diatom adaptations to stratified waters. Prog. Oceanogr. 167, 138–149. doi: 10.1016/j.pocean.2018.08.002
Key T., McCarthy A., Campbell D. A., Six C., Roy S., Finkel Z.V. (2010). Cell size trade-offs govern light exploitation strategies in marine phytoplankton. Environ. Microbiol. 12, 95–104. doi: 10.1111/j.1462-2920.2009.02046.x
Kirby R. R., Beaugrand G., Lindley J. A. (2009). Synergistic effects of climate and fishing in a marine ecosystem. Ecosystems 12, 548–561. doi: 10.1007/s10021-009-9241-9
Kneitel J. M., Chase J. M. (2004). Trade-offs in community ecology: linking spatial scales and species coexistence. Ecol. Lett. 7, 69–80. doi: 10.1046/j.1461-0248.2003.00551.x
Koroleff F. (1970). Revised version of "Direct determination of ammonia in natural waters as indophenol blue, Int. Con. Explor. Sea, C. M. 1969/C:9. ICES Information on Techniques and Methods for Sea Water Analysis Interlab, 3 19–22.
Krichen E., Rapaport A., Le Floc’H E., Fouilland. E. (2019). Demonstration of facilitation between microalgae to face environmental stress. Sci. Rep. 9, 1–12. doi: 10.1038/s41598-019-52450-9ff.ffhal-02315867
Kuhn M., Wing J., Weston S., Williams A., Keefer C., Engelhardt A., et al. (2016) Caret: Classification and regression training. r package version 6.0-71. Available at: https://CRAN.R-project.org/package=caret.
Laliberté E., Legendre P. (2010). A distance-based framework for measuring functional diversity from multiple traits. Ecology 91, 299–305. doi: 10.1890/08-2244.1
Lancelot C., Grosjean P., Rousseau V., Breton E., Glibert P. (2012). Rejoinder to "Perils of correlating CUSUM transformed variables to infer ecological relationships (Breton et al. 2006; Glibert 2010). Limnol. Oceanogr. 57, 669–670. doi: 10.4319/lo.2012.57.2.0669
Langdon C. (1988). On the causes of interspecific differences in the growth-irradiance relationship for phytoplankton. II. a general review. J. Plankton Res. 10, 1291–1312. doi: 10.1093/plankt/10.6.1291
Lavrentovich M. O., Koschwanez J. H., Nelson D. R. (2013). Nutrient shielding in clusters of cells. Phys. Rev. E Stat. Nonlin. Soft Matter Phys. 87, 62703. doi: 10.1103/PhysRevE.87.062703
Laws E. A., Bannister T. T. (1980). Nutrient- and light-limited growth of thalassiosira fluviatilis in continuous culture, with implications for phytoplankton growth in the ocean. Limnol. Oceanogr. 25, 457–473. doi: 10.4319/lo.1980.25.3.0457
Le Bouteiller A., Leynaert A., Landry M. R., Le Borgne R., Neveux J., Rodier M., et al. (2003). Primary production, new production, and growth rate in the equatorial pacific: Changes from mesotrophic to oligotrophic regime. J. Geophys. Res. 108, 8141. doi: 10.1029/2001JC000914
Lefebvre A., Guiselin N., Barbet F., Artigas L. F. (2011). Long-term hydrological and phytoplankton monitoring 1992-2007 of three potentially eutrophic systems in the eastern English channel and the southern bight of the north Sea. ICES Int. J. Mar. Sci. 68, 2029–2043. doi: 10.1093/icesjms/fsr149
Levins R. (1962). Theory of fitness in a heterogeneous environment. i. the fitness set and adaptive function. Am. Nat. 96, 361–373. doi: 10.1086/282245
Lewandowska A. M., Boyce D. G., Hofmann M., Matthiessen B., Sommer U., Worm B. (2014). Effects of sea surface warming on marine plankton. Ecol. Lett. 17, 614–623. doi: 10.1111/ele.12265
Leynaert A., Bucciarelli E., Claquin P., Dugdale R. C., Martin-Jézéquel V., Pondaven P., et al. (2004). Effect of iron deficiency on diatom cell size and silicic acid uptake kinetics. Limnol. Oceanogr. 49, 1134–1143. doi: 10.4319/lo.2004.49.4.1134
L’Helguen S., Madec C., Le Corre P. (1993). Nutrition azotée du phytoplancton dans les eaux brassées de la manche occidentale. Oceanol. Acta 16, 653–660.
Lheureux A., Savoye N., Del Amo Y., Goberville E., Bozec Y., Breton E., et al. (2021). Bi-decadal variability in physico-biogeochemical characteristics of temperate coastal ecosystems: from large-scale to local drivers. Mar. Ecol. Prog. Ser. 660, 19–35. doi: 10.3354/meps13577
Lingoes J. C. (1971). Some boundary conditions for a monotone analysis of symmetric matrices. Psychometrika 36, 195–203. doi: 10.1007/BF02291398
Litchman E., Klausmeier C. A. (2008). Trait-based community ecology of phytoplankton. Annu. Rev. Ecol. Evol. Syst. 39, 615–639. doi: 10.1146/annurev.ecolsys.39.110707.173549
Litchman E., Klausmeier C. A., Schofield O. M., Falkowski P. G. (2007). The role of functional traits and trade-offs in structuring phytoplankton communities: scaling from cellular to ecosystem level. Ecol. Lett. 10, 1170–1181. doi: 10.1111/j.1461-0248.2007.01117.x
Liu H., Wu C., Xu W., Wang X., Thangaraj S., Zhang G., et al. (2020). Surface phytoplankton assemblages and controlling factors in the strait of malacca and sunda shelf. Front. Mar. Sci. 7. doi: 10.3389/fmars.2020.00033
Loebl M., Colijn F., Justus E. E., van Beusekom J., Baretta-Bekker G., Lancelot C., et al. (2009). Recent patterns in potential phytoplankton limitation along the Northwest European continental coast. J. Sea Res. 61, 34–43. doi: 10.1016/j.seares.2008.10.002
Logares R., Bråte J., Bertilsson S., Clasen J. L., Shalchian-Tabrizi K., Rengefors K. (2009). Infrequent marine–freshwater transitions in the microbial world. Trends Microbiol. 17, 414–422. doi: 10.1016/j.tim.2009.05.010
Loreau M. (2000). Biodiversity and ecosystem functioning: recent theoretical advances. Oikos 91, 3–17. doi: 10.1034/j.1600-0706.2000.910101.x
Loreau M., de Mazancourt C. (2008). Species Synchrony and Its Drivers: Neutral and Nonneutral Community Dynamics in Fluctuating Environments. Am. Nat. 172, 2.E48–2.E66. doi: 10.1086/589746
Loreau M., Naeem S., Inchausti P. (2002). Biodiversity and ecosystem functioning: synthesis and perspectives (Oxford: Oxford University Press).
Lorenzen C. J. (1967). Determination of chlorophyll and pheopigments spectrophotometric equations. Limnol. Oceanogr. 12, 343–346. doi: 10.4319/lo.1967.12.2.0343
Lovecchio S., Climent E., Stocker R., Durham W. M. (2019). Chain formation can enhance the vertical migration of phytoplankton through turbulence. Adv. Sci. 5, eaaw7879. doi: 10.1126/sciadv.aaw7879
Lürling M., Eshetu F., Faassen E. J., Kosten S., Huszar V. L. M. (2013). Comparison of cyanobacterial and green algal growth rates at different temperatures. Freshw. Biol. 58, 552–559. doi: 10.1111/j.1365-2427.2012.02866.x
Maar M., Nielsen T. G., Richardson K., Christaki U., Hansen, O. S., Zervoudaki S., et al. (2002). Spatial and temporal variability of food web structure during the spring bloom in the skagerrak. Mar. Ecol. Prog. Ser. 239, 11–29. doi: 10.3354/meps239011
Mammola S., Cardoso P. (2020). Functional diversity metrics using kernel density n-dimensional hypervolumes. Methods Ecol. Evol. 11, 986–995. doi: 10.1111/2041-210X.13424
Mancuso C. P., Lee H., Abreu C. I., Gore J., Khalil A. S. (2021). Environmental fluctuations reshape an unexpected diversity-disturbance relationship in a microbial community. J. Comput. Syst. Biol. 10, e67175. doi: 10.7554/eLife.67175
Marie D., Partensky F., Vaulot D., Brussaard C. (1999). Enumeration of Phytoplankton, Bacteria, and Viruses in Marine Samples. Curr. Protoc. Cytom., 10, 11.11.1-11.11.15. doi: 10.1002/0471142956.cy1111s10
Martin-Jézéquel V., Hildebrand M., Brzezinski M. A. (2000). Silicon metabolism in diatoms: implications for growth. J. Phycol. 36, 821–840. doi: 10.1104/pp.107.107094
Martin-Jézéquel V., Lopez P. J. (2003). Silicon – a central metabolite for diatom growth and morphogenesis. Prog. Mol. subcell. Biol. 33, 99–124. doi: 10.1007/978-3-642-55486-5_4
Mason N. W., de Bello F., Mouillot D., Pavoine S., Dray S. (2013). A guide for using functional diversity indices to reveal changes in assembly processes along ecological gradients. J. Veg. Sci. 24, 794–806. doi: 10.1111/jvs.12013
Mason N. W. H., Irz P., Lanoiselée C., Mouillot D., Argillier C. (2008). Evidence that niche specialization explains species–energy relationships in lake fish communities. J. Anim. Ecol. 77, 285–296. doi: 10.1111/j.1365-2656.2007.01350.x
Mason N. W. H., Mouillot D., Lee W. G., Wilson J. B. (2005). Functional richness, functional evenness and functional divergence: the primary components of functional diversity. Oikos 111, 112–118. doi: 10.1111/j.0030-1299.2005.13886.x
Mayfield M. M., Levine J. M. (2010). Opposing effects of competitive exclusion on the phylogenetic structure of communities. Ecol. Lett. 13, 1085–1093. doi: 10.1111/j.1461-0248.2010.01509.x
Mc Arthur R., Levins R. (1967). Limiting similarity, convergence, and divergence of coexisting species. Am. Nat. 101, 377–385. doi: 10.1086/282505
McGill B. J., Dornelas M., Gotelli N. J., Magurran A. E. (2015). Fifteen forms of biodiversity trend in the anthropocene. Trends Ecol. Evol. 30, 104–113. doi: 10.1016/j.tree.2014.11.006
McGill B. J., Enquist B. J., Weiher E., Westoby M. (2006). Rebuilding community ecology from functional traits. Trends Ecol. Evol. 21, 178–185. doi: 10.1016/j.tree.2006.02.002
McIntire E.J.B., Fajardo A. (2014). Facilitation as a ubiquitous driver of biodiversity. New Phytol 201, 403–416. doi: 10.1111/nph.12478
McLean M. J., Mouillot D., Goascoz N., Schlaich I., Auber A. (201). Functional reorganization of marine fish nurseries under climate warming. Glob. Chang. Biol. 25, 660–674. doi: 10.1111/gcb.14501
McQuatters-Gollop A., Raitsos D. E., Edwards M., Pradhan Y., Mee L., Lavender S. J., et al. (2007). A long-term chlorophyll data set reveals regime shift in north Sea phytoplankton biomass unconnected to nutrient trendsLimnol. Oceanogr. 2, 635–648. doi: 10.4319/lo.2007.52.2.0635
Menden-Deuer S., Lessard E. J. (2000). Carbon to volume relationships for dinoflagellates, diatoms, and other protist plankton. Limnol. Oceanogr. 45, 569–579. doi: 10.4319/lo.2000.45.3.0569
Millero F. J., Chen C.-T., Bradshaw A., Schleicher K. (1980). A new high-pressure equation of state for seawater. Deep Sea Res. 27, 255–264. doi: 10.1016/0198-0149(80)90016-3
Millero F. J., Poisson A. (1981). International one-atmosphere equations of state of seawater. Deep-Sea Res. 28, 625–629. doi: 10.1016/0198-0149(81)90122-9
Moestrup Ø., Larsen J. (1992). “Potentially toxic phytoplankton: 1. haptophyceae prymnesiophyceae. ICES identification leaflets for plankton = fiches d'identification du plancton,” in ICES identification leaflets for plankton, vol. 179 . Ed. Lindley J. A. (Copenhagen: ICES), 11, ISBN: ISSN 1019-1097.
Moneta A., Veuger B., van Rijswijk P., Meysman F., Soetaert K., Middelburg J. J. (2014). Dissolved inorganic and organic nitrogen uptake in the coastal north Sea: a seasonal study. Estuar. Coast. Shelf Sci. 147, 78–86. doi: 10.1016/j.ecss.2014.05.022
Morel A., Smith R. C. (1974). Relation between total quanta and total energy for aquatic photosynthesis. Limnol. Oceanogr. 19, 591–600. doi: 10.4319/lo.1974.19.4.0591
Moritz S. (2018). Time series missing value imputation package ‘imputeTS’. Version2. Available at: https://cran.r-project.org/web/packages/imputeTS/readme/README.html.
Moritz S., Bartz-Beielstein T. (2017). ImputeTS: Time series missing value imputation in r. R J. 91, 207–218. doi: 10.32614/RJ-2017-009
Münkemüller T., Gallien L., Pollock L. J., Barros C., Carboni M., Chalmandrier L., et al. (2020). Dos and don'ts when inferring assembly rules from diversity patterns. Global Ecol. Biogeogr. 29, 1212–1229. doi: 10.1111/geb.13098
Muscarella R., Uriarte M. (2016). Do community-weighted mean functional traits reflect optimal strategies? Proc. R. Soc B: Biol. Sci. 283, 20152434. doi: 10.1098/rspb.2015.2434
Musielak M. M., Karp-Boss L., Jumars P. A., Fauci L. J. (2009). Nutrient transport and acquisition by diatom chains in a moving fluid. J. Fluid Mech. 638, 401–421. doi: 10.1017/S0022112009991108.401
Napoléon C., Raimbault V., Fiant L., Riou P., Lefebvre S., Lampert L., et al. (2012). Spatiotemporal dynamics of physicochemical and photosynthetic parameters in the central English channel. J. Sea Res. 69, 43–52. doi: 10.1016/j.seares.2012.01.005
Naselli-Flores L., Zohary T., Padisák J. (2021). Life in suspension and its impact on phytoplankton morphology: an homage to Colin s. reynolds. Hydrobiologia 848, 7–30. doi: 10.1007/s10750-020-04217-x
Nejstgaard J. C., Tang K., Steinke M., Dutz J., Koski M., Antajan E., et al. (2007). Zooplankton grazing on Phaeocystis: A quantitative review and future challenges. Biogeochemistry 83, 147–172. doi: 10.1007/s10533-007-9098-y
Oksanen J., Blanchet G. F., Kindt R., Legendre P., et al. (2011) Vegan: community ecology package. Available at: http://cran.r-project.org/web/packages/vegan/index.html.
Olden J. D., Poff N. L., Douglas M. R., Douglas M. E., Fausch K. D. (2004). Ecological and evolutionary consequences of biotic homogenization. Trends Ecol. Evol. 19, 18–24. doi: 10.1016/j.tree.2003.09.010
Olde Venterink H. (2011). Does phosphorus limitation promote species rich plant communities? Plant Soil 345, 1–9. doi: 10.1007/s11104-011-0796-9
OSPAR (1988). PARCOM recommendation 88/2 : On the reduction in nutrients to the Paris convention area (Paris Commission). Available at: https://www.ospar.org/convention/agreements?q=PARCOM%20Recommendation%2088/2%20on%20the%20Reduction%20in%20Inputs%20of%20Nutrients%20to%20the%20Paris%20Convention%20Area.
Pakeman R. J. (2014). Functional trait metrics are sensitive to the completeness of the species’ trait data? Methods Ecol. Evol. 5, 9–15. doi: 10.1111/2041-210X.12136
Pakeman R. J., Quested H. M. (2007). Sampling plant functional traits: what proportion of the species need to be measured? Appl. Veg. Sci. 10, 91–96. doi: 10.1658/1402-2001
Pálffy K., Vőrős L. (2019). Phytoplankton functional composition shows higher seasonal variability in a large shallow lake after a eutrophic past. Ecosphere 10, e02684. doi: 10.1002/ecs2.2684
Pančić M., Torres R. R., Almeda R., Kiørboe T. (2019). Silicified cell walls as a defensive trait in diatoms. Proc. R. Soc B: Biol. Sci. 24, 20190184. doi: 10.1098/rspb.2019.0184
Peperzak L., Colijn F., Gieskes W. W. C., Peeters J. C. H. (1998). Development of the diatom-phaeocystis spring bloom in the Dutch coastal zone of the north Sea: the silicon depletion versus the daily irradiance threshold hypothesis. J. Plankton Res. 20, 517–537. doi: 10.1093/plankt/20.3.517
Pielou E. (1966). The measurement of diversity in different types of biological collections. J. Theor. Biol. 13, 131–144. doi: 10.1016/0022-5193(66)90013-0
Pigot A. L., Trisos C. H., Tobias J. A. (2016). Functional traits reveal the expansion and packing of ecological niche space underlying an elevational diversity gradient in passerine birds. Proc. R. Soc B: Biol. Sci. 283, 20152013. doi: 10.1098/rspb.2015.2013
Pinheiro J., Bates D., R Core Team (2022) Nlme: Linear and nonlinear mixed effects models. r package version 3. Available at: https://CRAN.R-project.org/package=nlme.
Ploug H. S., Jørgensen W., Barker B. (1999). Diffusive boundary layers of the colony-forming plankton alga phaeocystis sp; implications for nutrient uptake and cellular growth. Limnol. Oceanog. 8. doi: 10.4319/lo.1999.44.8.1959
Podani J. (1999). Extending gower’s general coefficient of similarity to ordinal characters. Taxon 48, 331–340. doi: 10.2307/1224438
Ptacnik R., Solimini A. G., Andersen T., Tamminen T., Brettum P., Lepistö L., et al. (2008). Diversity predicts stability and resource use efficiency in natural phytoplankton communities. PNAS 105, 5134–5138. doi: 10.1073/pnas.0708328105
Purvis A., Gittleman J. L., Cowlishaw G., Mace G. M. (2000). Predicting extinction risk in declining species. Proc. R. Soc B: Biol. Sci. 267, 1947–1952. doi: 10.1098/rspb.2000.1234
Redfield A. C., Ketchum B. A., Richards F. A. (1963). “The influence of organisms on the composition of sea-water: ideas and observations on progress in the study of the seas,” in The sea, vol. Vol 2 . Ed. Hill M. N. (New York: Wiley), 26–77.
Regier P., Briceño H., Boyer J. N. (2019). Analyzing and comparing complex environmental time series using a cumulative sums approach. MethodsX 6, 779–787. doi: 10.1016/j.mex.2019.03.014
Riley G. A. (1957). Phytoplankton of the north central Sargasso Sea. Limnol. Oceanogr. 2, 252–270. doi: 10.1002/lno.1957.2.3.0252
Rousseau V., Chrétiennot-Dinet M. J., Jacobsen A., Verity P., Whipple S. (2007). The life cycle of Phaeocystis: state of knowledge and presumptive role in ecology. Biogeochemistry 83, 29–47. doi: 10.1007/s10533-007-9085-3
Rousseau V., Mathot S., Lancelot C. (1990). Calculating carbon biomass of Phaeocystis sp. from microscopic observations. Mar. Biol. 107, 305–314. doi: 10.1007/BF01319830
Saulquin B., Hamdi A., Gohin F., Populus J., Mangin A., Fanton d'Andon O. (2013). Estimation of the diffuse attenuation coefficient KdPAR using MERIS and application to seabed habitat mapping. Remote Sens. Environ. 128, 224–233. doi: 10.1016/j.rse.2012.10.002
Schapira M., Seuront L., Gentilhomme V. (2006). Effects of small-scale turbulence on phaeocystis globosa (Prymnesiophyceae) growth and life cycle. J. Exp. Ma. Biol. Ecol. 335, 27–38. doi: 10.1016/j.jembe.2006.02.018
Schiller J. (1931–1937). “Dinoflagellatae peridinineae in monographischer behandlung,” in Kryptogamen-flora von deutschland, Österreichs und der schweiz, vol. Vol. 10 . Ed. Rabenhorst L. (Leipzig: Akad. Verlag), 3.
Schluter D. (1984). A variance test for detecting species associations, with some example applications. Ecology 65, 998–1005. doi: 10.2307/1938071
Schoemann V., Becquevort S., Stefels J., Rousseau V., Lancelot C. (2005). Phaeocystis blooms in the global ocean and their controlling mechanisms: a review. J. Sea Res. 53, 43–66. doi: 10.1016/j.seares.2004.01.008
Schwaderer A. S., Yoshiyama K., De Tezanos Pinto P., Swenson N. G., Klausmeier C. A., Litchman E. (2011). Eco-evolutionary differences in light utilization traits and distributions of freshwater phytoplankton. Limnol. Oceanogr. 56, 589–598. doi: 10.4319/lo.2011.56.2.0589
Segura A. M., Kruk C., Calliari D., García-Rodriguez F., Conde D., Widdicombe C. E., et al. (2013). Competition drives clumpy species coexistence in estuarine phytoplankton. Sci. Rep. 3, 1037. doi: 10.1038/srep01037
Shimadzu H., Dornelas M., Henderson P. A., Magurran A. E. (2013). Diversity is maintained by seasonal variation in species abundance. BMC Biol. 11, 98. doi: 10.1186/1741-7007-11-98
Solorzano L. (1969). Determination of ammonia in natural waters by the phenolhypochlorite method. Limnol. Oceanogr. 14, 799–801. doi: 10.4319/lo.1969.14.5.0799
Sommer U. (1988). Phytoplankton succession in microcosm experiments under simultaneous grazing pressure and resource limitation, limnol. Oceanogr. 33, 1037–1054. doi: 10.4319/lo.1988.33.5.1037
Spaak J. W., Baert J. M., Baird D. J., Eisenhauer N., Maltby L., Pomati F., et al. (2017). Shifts of community composition and population density substantially affect ecosystem function despite invariant richness. Ecol. Lett. 20, 1315–1324. doi: 10.1111/ele.12828
Steiner C. F., Long Z. T., Krumins J. A., Morin P. J. (2005). Temporal stability of aquatic food webs: partitioning the effects of species diversity, species composition and enrichment. Ecol. Lett. 8, 819–828. doi: 10.1111/j.1461-0248.2005.00785.x
Stein A., Gerstner K., Kreft H. (2014). Environmental heterogeneity as a universal driver of species richness across taxa, biomes and spatial scales. Ecol. Lett. 17, 866–880. doi: 10.1111/ele.12277
Stockwell J. D., Doubek J. P., Adrian R., Anneville O., Carey C. C., Carvalho L., et al. (2020). Storm impacts on phytoplankton community dynamics in lakes. Glob. Chang. Biol. 26, 2756–2784. doi: 10.1111/gcb.15033
Suescún-Bolívar L. P., Thomé P. E. (2015). Osmosensing and osmoregulation in unicellular eukaryotes. World J. Microbiol. Biotechnol. 313, 435–443. doi: 10.1007/s11274-015-1811-8
Sultan S. E., Spencer H. G. (2002). Metapopulation structure favors plasticity over local adaptation. Am. Nat. 1602, 271–283. doi: 10.1086/341015
Tabakabayashi M., Lew K., Johnson A., Marchi A., Dugdale R., Wilkerson F. P. (2006). The effect of nutrient availability and temperature on chain length of the diatom Skeletonema costatum. J. Plankton Res. 28, 831–840. doi: 10.1093/plankt/fbl018
Talarmin A., Lomas M. W., Bozec Y., Savoye N., Frigstad H., Karl D. M., et al. (2016). Seasonal and long-term changes in elemental concentrations and ratios of marine particulate organic matter. Glob. Biogeochem. Cycles 30, 1699–1711. doi: 10.1002/2016GB005409
Taylor B. W., Keep C. F., Hall R. O. Jr., Koch B. J., Tronstad L. M., Flecker A. S., et al. (2007). Improving the fluorometric ammonium method: matrix effects, background fluorescence, and standard additions. J. North Am. Benthol. Soc. 26, 167–177. doi: 10.1899/0887-3593200726
Tett P., Gowen R., Mills D., Fernandes T., Gilpin L., Huxham M., et al. (2007). Defining and detecting undesirable disturbance in the context of marine eutrophication. Mar. pollut. Bull. 55, 282–297. doi: 10.1016/j.marpolbul.2006.08.028
Thackeray S. J., Jones I. D., Maberly S. C. (2008). Long-term change in the phenology of spring phytoplankton: species-specific responses to nutrient enrichment and climatic change. J. Ecol. 96, 523–535. doi: 10.1111/j.1365-2745.2008.01355.x
Tilman D., Knops J., Wedin D., Reich P., Ritchie M., Siemann E. (1997). The influence of functional diversity and composition on ecosystem processes. Science 277, 1300–1302. doi: 10.1126/science.277.5330.1300
Våge S., Storesund J. E., Giske J., Thingstad T. F. (2014). Optimal defense strategies in an idealized microbial food web under trade-off between competition and defense. PloS One 9 (7), e101415. doi: 10.1371/journal.pone.0101415
van Boekel W. H. M., Veldhuis M. J. W. (1990). Regulation of alkaline phosphatase synthesis in Phaeocystis sp. Mar. Ecol. Prog. Ser. 61, 282–289. doi: 10.3354/meps061281
Van den Hoek C., Mann D. G., Jahns H. M. (1995). Algae: An introduction to phycology (Cambridge: Cambridge University Press).
van Rijssel M., Hamm C., Gieskes W. (1997). Phaeocystis globose prymnesiophyceae colonies: hollow structures built with small amounts of polysaccharides. Eur. J. Phycol. 32, 185–192. doi: 10.1080/09670269710001737119
Villéger S., Mason N. W. H., Mouillot D. (2008). New multidimensional functional diversity indices for a multifaceted framework in functional ecology. Ecology 89, 2290–2301. doi: 10.1890/07-1206.1
Violle C., Navas M. L., Vile D., Kazakou E., Fortunel C., Hummel I., et al. (2007). Let the concept of trait be functional! Oikos 116, 882–892. doi: 10.1111/j.0030-1299.2007.15559.x
Weiher E., Clarke G. D. P., Keddy P. A. (1998). Community assembly rules, morphological dispersion, and the coexistence of plant species. Oikos 81, 309–322. doi: 10.2307/3547051
Weiher E., Keddy P. A. (1995). Assembly rules, null models, and trait dispersion: new questions from old patterns. Oikos 74, 159–164. doi: 10.2307/3545686
Wei T., Simko V. (2021) R package 'corrplot': Visualization of a correlation matrix. (Version 0.92). Available at: https://github.com/taiyun/corrplot.
Wiltshire K. H., Boersma M., Carstens K., Kraberg A. C., Peters S., Scharfe M. (2015). Control of phytoplankton in a shelf sea: Determination of the main drivers based on the helgoland roads time series. J. Sea Res. 105, 42–52. doi: 10.1016/j.seares.2015.06.022
Winder M. (2009). Photosynthetic picoplankton dynamics in lake Tahoe: temporal and spatial niche partitioning among prokaryotic and eukaryotic cells. J. Plankton Res. 31, 1307–1320. doi: 10.1093/plankt/fbp074
Wood S. (2017). Generalized Additive Models: An Introduction with R, 2nd edition. Chapman and Hall/CRC (Boca Raton, USA). 496 p. ISBN 9781498728331.
Worm B., Barbier E. B., Beaumont N., Duffy J. E., Folke C., Halpern B. S., et al. (2006). Impacts of biodiversity loss on ocean ecosystem services. Science 314, 787–790. doi: 10.1126/science.1132294
Worm B., Lotze H. K., Hillebrand H., Sommer U. (2002). Consumer versus resource control of species diversity and ecosystem functioning. Nature 417, 848–851. doi: 10.1038/nature00830
Xu X., Carsten L., Kai W. W. (2020). Less nutrients but more phytoplankton: Long-term ecosystem dynamics of the southern north Sea. Front. Mar. Sci. 7. doi: 10.3389/fmars.2020.00662
Yokota K., Sterner R. W. (2011). Trade-offs limiting the evolution of coloniality: ecological displacement rates used to measure small costs. Proc. Biol. Sci. 278, 458–463. doi: 10.1098/rspb.2010.1459
Zhang R., Tielbörger K. (2020). Density-dependence tips the change of plant-plant interactions under environmental stress. Nat. Commun. 111, 2532. doi: 10.1038/s41467-020-16286-6
Zobel M. (1997). The relative role of species pools in determining plant species richness: an alternative explanation of species coexistence? Trends Ecol. Evol. 127, 266–269. doi: 10.1016/S0169-5347(97)01096-3
Keywords: biodiversity, community assembly, diatoms, environmental change, functional traits, Phaeocystis, phytoplankton community, temporal niche partitioning
Citation: Breton E, Goberville E, Sautour B, Ouadi A, Skouroliakou D-I, Seuront L, Beaugrand G, Kléparski L, Crouvoisier M, Pecqueur D, Salmeron C, Cauvin A, Poquet A, Garcia N, Gohin F and Christaki U (2022) Multiple phytoplankton community responses to environmental change in a temperate coastal system: A trait-based approach. Front. Mar. Sci. 9:914475. doi: 10.3389/fmars.2022.914475
Received: 06 April 2022; Accepted: 15 September 2022;
Published: 06 October 2022.
Edited by:
Alberto Basset, University of Salento, ItalyReviewed by:
Kyle Edwards, University of Hawaii at Manoa, United StatesCopyright © 2022 Breton, Goberville, Sautour, Ouadi, Skouroliakou, Seuront, Beaugrand, Kléparski, Crouvoisier, Pecqueur, Salmeron, Cauvin, Poquet, Garcia, Gohin and Christaki. This is an open-access article distributed under the terms of the Creative Commons Attribution License (CC BY). The use, distribution or reproduction in other forums is permitted, provided the original author(s) and the copyright owner(s) are credited and that the original publication in this journal is cited, in accordance with accepted academic practice. No use, distribution or reproduction is permitted which does not comply with these terms.
*Correspondence: Elsa Breton, ZWxzYS5icmV0b25AdW5pdi1saXR0b3JhbC5mcg==
Disclaimer: All claims expressed in this article are solely those of the authors and do not necessarily represent those of their affiliated organizations, or those of the publisher, the editors and the reviewers. Any product that may be evaluated in this article or claim that may be made by its manufacturer is not guaranteed or endorsed by the publisher.
Research integrity at Frontiers
Learn more about the work of our research integrity team to safeguard the quality of each article we publish.