 Elisabeth S. M. Deschaseaux1,2*
 Hilton B. Swan1,2
 Damien T. Maher1,3
 Graham B. Jones1
 Kai G. Schulz1,2
 Edwin P. Koveke4
 Kei Toda4,5
 Bradley D. Eyre1,2
- 1Faculty of Science and Engineering, Southern Cross University, Lismore, NSW, Australia
- 2Centre for Coastal Biogeochemistry, Faculty of Science and Engineering, Southern Cross University, Lismore, NSW, Australia
- 3Southern Cross GeoScience, Faculty of Science and Engineering, Southern Cross University, Lismore, NSW, Australia
- 4Department of Chemistry, Kumamoto University, Kumamoto, Japan
- 5International Research Organization for Advanced Science and Technology (IROAST), Kumamoto University, Kumamoto, Japan
Earth’s Radiation Budget is partly dictated by the fragile and complex balance between biogenic volatile organic compounds (BVOCs) and greenhouse gases (GHGs), which have the potential to impose cooling or warming once emitted to the atmosphere. Whilst methane (CH4) is strictly associated with global warming due to its solar-radiation absorbing properties, dimethyl sulfide (DMS) is generally considered a cooling gas through the light scattering properties of its atmospheric oxidation products. However, DMS may also partially contribute to the Earth’s warming through a small portion of it being degraded to CH4 in the water column. Coral reefs emit both DMS and CH4 but they have not previously been simultaneously measured. Here, we report DMS and CH4 fluxes as well as aerosol particle counts at Heron Island, southern Great Barrier Reef, during the austral summer of 2016. Sea-to-air DMS and CH4 fluxes were on average 24.9 ± 1.81 and 1.36 ± 0.11 µmol m-2 d-1, whilst intermediate (< 0.5-2.5 um) and large (> 2.5 um) particle number concentrations averaged 5.51 x 10⁶ ± 1.73 x 10⁵ m-3 and 1.15 x 10⁶ ± 4.63 x 10⁴ m-3, respectively. Positive correlations were found between DMS emissions and the abundance of intermediate (R2 = 0.1669, p < 0.001, n = 93) and large (R2 = 0.0869, p = 0.004, n = 93) aerosol particles, suggesting that DMS sea-to-air emissions significantly contribute to the growth of existing particles to the measured size ranges at the Heron Island lagoon. Additionally, a strong positive correlation was found between DMS and CH4 fluxes (R2 = 0.7526, p < 0.00001, n = 93), suggesting that the emission of these volatile compounds from coral reefs is closely linked. The slope of the regression between DMS and CH4 suggests that CH4 emissions at the Heron Island lagoon represent 5% of that of DMS, which is consistent with the average sea-to-air fluxes reported in this study (i.e. 24.9 ± 1.81 µmol m-2 d-1 for DMS and 1.36 ± 0.11 for CH4). These findings provide new insights on the complexity of BVOC and GHG emissions in coral reef systems and their potential role in climate regulation.
1 Introduction
Dimethyl sulfide (DMS) and methane (CH4) are key biogenic compounds in climate change processes (Carpenter et al., 2012). DMS is often associated with a cooling effect through contributing to aerosol formation that increase Earth’s radiative properties (Charlson et al., 1987). In contrast, CH4 is responsible for a warming effect with a short-term greenhouse potential that is 23 to 69 times greater than that of CO2 (Shine et al., 2005). The bulk of DMS is produced through the algal and bacterial enzymatic cleavage of dimethylsulfoniopropionate (DMSP) (Simó, 2001), a biogenic sulfur compound that is synthesised by a wide range of marine algae (Stefels, 2000), bacteria (Curson et al., 2017) and invertebrate corals (Raina et al., 2013). In contrast, the bulk of biogenic CH4 is mainly produced by anaerobic methanogenic bacterial activity through the reduction of either CO2, acetate or methyl-group containing compounds (Liu and Whitman, 2008), although recent studies show that CH4 can also be produced by plants, fungi, algae and cyanobacteria from methylated nitrogen- and sulfur-containing compounds in the presence of oxygen (Ernst et al., 2022). Thus, a small portion of CH4 can originate from the hydrolysis of DMS according to the following equation (Kiene et al., 1986; Liu and Whitman, 2008):
The link between DMS degradation and CH4 production has now been reported across several studies on anoxic marine sediments (Kiene and Visscher, 1987; Kiene, 1988; Wang et al., 2009), where methanogenic bacteria are particularly abundant (Mechalas, 1974; Barnes and Goldberg, 1976). Indeed, it seems that the DMS-to-CH4 conversion can also be mediated by methanogenic bacteria (Kiene and Visscher, 1987) but also by methylotrophic bacteria belonging to the order Methanosarcinales and Methanobacteriales (Liu and Whitman, 2008). More recently, the role of DMS as a precursor of CH4 was clearly demonstrated in upwelling waters as addition of 13C enriched-DMS led to a significant increase in 13C enriched-CH4 (Florez-Leiva et al., 2013). Interestingly, DMS was estimated to contribute to about 28% of CH4 production in both anoxic sediments (Kiene, 1988) and upwelling waters (Florez-Leiva et al., 2013), although these two marine habitats are likely to host very different bacterial communities. DMS as a potential precursor of CH4 across various marine ecosystems adds a level of complexity to the role of DMS as a climate cooling agent (Charlson et al., 1987; Quinn and Bates, 2011; Jones, 2013).
DMS is expected to be particularly concentrated in coral reef ecosystems due to the high DMSP content in corals, coral-associated symbionts and a wide range of coral reef invertebrates (Deschaseaux et al., 2016; Haydon et al., 2018). However, although coral reef sea-to-air DMS fluxes contribute to atmospheric sulfur emissions (Swan et al., 2017), a recent modelling study suggested that coral-reef-derived DMS emissions most likely have a negligible effect on the local climate of the Great Barrier Reef (Fiddes et al., 2021). Coral reef frameworks are also sites of active anoxic and suboxic organic matter oxidation, making coral reef pore waters particularly rich in CH4 and coral reef ecosystems ideal platforms for the release of CH4 to the water column and atmosphere (Sansone et al., 1993; O’Reilly et al., 2015), which could be counteracting the cooling effect of DMS emissions. A recent study showed that permeable coral reef carbonate sediments were a source of DMS and CH4 into the water column and that CH4 production could be a sink for DMS in coral reef systems (Deschaseaux et al., 2019). Since sea-to-air DMS and CH4 fluxes from coral reef systems have been independently reported by previous studies, the focus of this study was to simultaneously quantify and report sea-to-air DMS and CH4 fluxes from the Heron Island reef lagoon, southern Great Barrier Reef, to assess the interplay of atmospheric DMS and CH4 emissions.
We hypothesised that coral-reef DMS emissions would contribute to the growth of aerosol nanoparticles and that coral-reef DMS and CH4 emissions are linked due to a small portion of DMS being hydrolysed to CH4 in coral reef waters.
2 Material and Methods
2.1 Study Site and Sampling
A field campaign was conducted on Heron Island, southern Great Barrier Reef (23.44°S, 151.91°E), in the austral summer of 2016 (4th to the 17th of February) where dissolved CH4 and CO2 were measured alongside dissolved DMS (DMSw) using a cavity-ring-down spectrometer (Picarro G2201-i) (Maher et al., 2013) and a Vapor Generation – Chemiluminescence (VG-CL) device (Nagahata et al., 2013), respectively. A Gas Chromatograph (Varian CP3800 GC) equipped with a pulsed flame photometric detector (GC-PFPD) was used to measure atmospheric DMS (DMSa) (Swan et al., 2015; Swan et al., 2017).
A water pump and a 60 m suction-rated pipe were used to pump seawater from the Heron Island reef flat to the Heron Island Research Station (HIRS), where all instruments were operated. The seawater inlet was attached to a cinder block 50 cm above the sediment bed and about 50 cm below the low-tide mark. A non-return valve and a 1 mm mesh net were placed around the suction pipe inlet to prevent large pieces of sediment and seaweed getting through the suction line. The mesh was cleaned every 2-3 days to prevent biofouling. Part of the pumped seawater was diverted into a showerhead exchanger that was connected in line with the cavity-ring-down spectrometer for CH4 and CO2 measurements, while the remainder was diverted to the HIRS’ flow-through seawater recycling system. The recycling water outlet was used to manually sample seawater at a low flow rate using a 50 mL syringe for DMSw analysis. A HYDROLAB HL4 sonde was placed within 1 m of the water intake to record seawater temperature, salinity, dissolved oxygen (DO), and depth, every 15 min. Tide predictions were sourced from the Bureau of Meteorology (BoM) with low tide times locally adjusted +1.25 h for the Heron Island reef flat according to Swan et al. (2017).
An air intake consisting of ~10 m Teflon™ tubing was fixed to the roof of the HIRS, within ~100 m in line of sight to the reef flat location where seawater was continuously pumped from. The air intake was shielded from rain. A wireless automated weather station (AWS, model XC0348, Electus Distribution) mounted within 1 m of the air intake provided data for wind speed (WS, ± 1 m s-1 for WS < 10 m s-1 and ± 10% for WS > 10 m s-1), wind direction (WD), rainfall, air temperature (± 1°C), humidity (± 5%) and barometric pressure (± 3hPa), at 5-min intervals. Meteorological data at 5 min intervals was used to match to the 15 min interval chemical measurements. Solar irradiance at the proximity of the air intake was recorded using a HOBO (Onset Co., USA) light logger (upper limit ~6000 μE m-2 s-1). Light intensity HOBO Lux units were adjusted to a maximum light intensity of 2000 μEm−2 s−1. First and last daytime lights were at 5:14 and 18:57 respectively on average over the sampling period. An air quality monitor laser particle counter (Dylos DC1700, Dylos Corp, CA, USA) was used to record 1-min averaged particle number concentrations at ambient humidity in the two size range fractions 0.5-2.5 µm and > 2.5 µm every 15 min. The air quality monitor was placed in a shielded location near the air intake.
2.2 DMSw and DMSa Measurements
DMSw concentrations were determined in triplicate every 15 min by placing 10 mL of seawater into a 50 mL sample tube that was manually shaken for 1 min, then pressurised with 30 mL of air and injected onto the chemiluminescence device (VG-CL) (Nagahata et al., 2013). When DMSw mixes with ozone in the VG-CL, it generates an instant chemiluminescent emission where the light intensity is converted into a quantifiable electrical signal. The injection tube was rinsed with deionised water in between each injection to prevent analyte carry-over. A 6-point calibration was run at the beginning of the field campaign, and either a 4 nM or 10 nM DMSP standard was randomly run each day to monitor the reproducibility and stability of the system over time. Because these measurements are labour-intensive and could not be automated, sampling occurred at random times of the day and night over the 2-week field campaign.
DMSa concentrations were determined on the GC-PFPD using an automated cryogenic trapping system that collected ~4L of air for analysis, providing a 0.1 nmol m-3 (0.002 ppb) limit of detection. The expanded relative measurement uncertainty of the automated GC-PFPD was 13% (k = 2, for a 95% CI). A complete description of the configuration, operation, calibration, and uncertainty analysis of the automated GC-PFPD is described by Swan et al. (2015).
2.3 Flux Calculations
Sea-to-air DMS fluxes were estimated based on the different parameterisations proposed by Liss and Merlivat (1986) (LM86), Nightingale et al. (2000) (N00) and Wanninkhof (2014) (W14) and by applying the approach of Lana et al. (2011) (L11) (see details in Supplementary Table 1). The sea-to-air DMS fluxes and uncertainties presented here correspond to the median and standard error of these combined fluxes.
Briefly, sea-to-air fluxes of DMS (FDMS) (in µmol m-2 d-1) were estimated based on the following equation:
Where KT is the gas transfer velocity constant (in m d-1), α is the dimensionless Henry’s Law constant and Cw and Cg are DMS concentrations (in µmol m-3) in the water and gas phase, respectively, with each parameterisation using a different approach to estimate KT.
The dimensionless Henry’s Law Constant (α) for DMS solubility in seawater was calculated using the following equation:
Where HK (atm L mol-1) is the Henry’s Law Constant for DMS, R is the universal gas constant (0.082 L atm K−1 mol−1) and T is the seawater temperature in Kelvin. HK was calculated based on the following equation by Dacey et al. (1984):
Sea-to-air CH4, CO2 and O2 fluxes were calculated based on the parameterisation approaches proposed by Ho et al. (2006) and Wanninkhof (2014). Atmospheric concentrations were assumed to be constant (CH4 1.8 ppm, CO2 400 ppm and O2 21000 ppm). Solubility coefficients for CH4 (Wiesenburg and Guinasso Jr, 1979), CO2 (Weiss, 1974) and O2 (Benson and Krause Jr, 1984) were calculated based on temperature and salinity.
2.4 Reef Production
Reef DMS, CH4, CO2 and O2 production (RP, mol m-2 h-1) were calculated around each low tide using the following equation:
Where ΔCW is the difference in dissolved concentrations between the highest point following low tide and the actual low tide, ΔT is the time difference between these 2 points, D is the average depth for that time period and MeanFlux is the average sea-to-air flux for that period.
2.5 Statistical Analysis
The significance of the correlations between DMS, CH4, CO2 and O2 were evaluated using the Pearson correlation method. Given that DMS and CH4 showed the strongest correlation (R2 = 0.7526, p <0.00001, n = 93), we specifically assessed what drives DMS and CH4 fluxes by carrying out stepwise multiple linear regressions (MLRs) against seven potential predictors and their interactions (salinity, pH, depth, wind direction, dewpoint, windchill and solar irradiance). In order to avoid over-fitting and find a balance between model complexity and explanatory power, we followed a backward elimination process based on the Akaike Information Criterion (AIC, details in Supplementary Figure 1) starting with all seven potential measured predictors. Note that we opted not to include temperature and wind speed, which are covariates in flux calculations. Windchill and dewpoint are influenced by air temperature, which is not a covariate in flux calculations, and wind direction is not correlated to wind speed. Calculations were performed using the functions “boxplot”, “stepwisefit”, and “plotEffects” in MATLAB.
3 Results
3.1 Environmental Data
Sea surface temperature (SST) within the Heron Island reef lagoon fluctuated between 25.0 and 29.2°C over the course of the campaign with an average SST of 27.3 ± 0.94°C. Salinity and pH were on average 37.0 ± 0.25 ppt and 8.18 ± 0.19, respectively. Seawater depth ranged from 0.46 to 1.38 m, 10 m wind speed from 0 to 9.20 m s-1, windchill from 21.3 to 29.9°C, dewpoint from 20.0 to 23.4°C and light intensity from 0 to 2000 µE m-2 s-1.
3.2 Sea-to-Air Fluxes and Relationships
Sea-to-air DMS fluxes varied from not-detectable to 69.5 µmol m-2 d-1 with an average flux of 24.9 ± 1.81 µmol m-2 d-1 (mean± SE, n = 93; Figure 1A). Sea-to-air CH4 fluxes varied from -0.12 to 3.91 µmol m-2 d-1 with an average flux of 1.36 ± 0.11 µmol m-2 d-1 (Figure 1B). Atmospheric CO2 and O2 fluxes varied from -15.4 to 30.7 mmol m-2 d-1 and from -188 to 403 mmol m-2 d-1, with mean CO2 and O2 fluxes of 0.30 ± 0.71 and 70.5 ± 12.3 mmol m-2 d-1, respectively (Figures 1C, D).
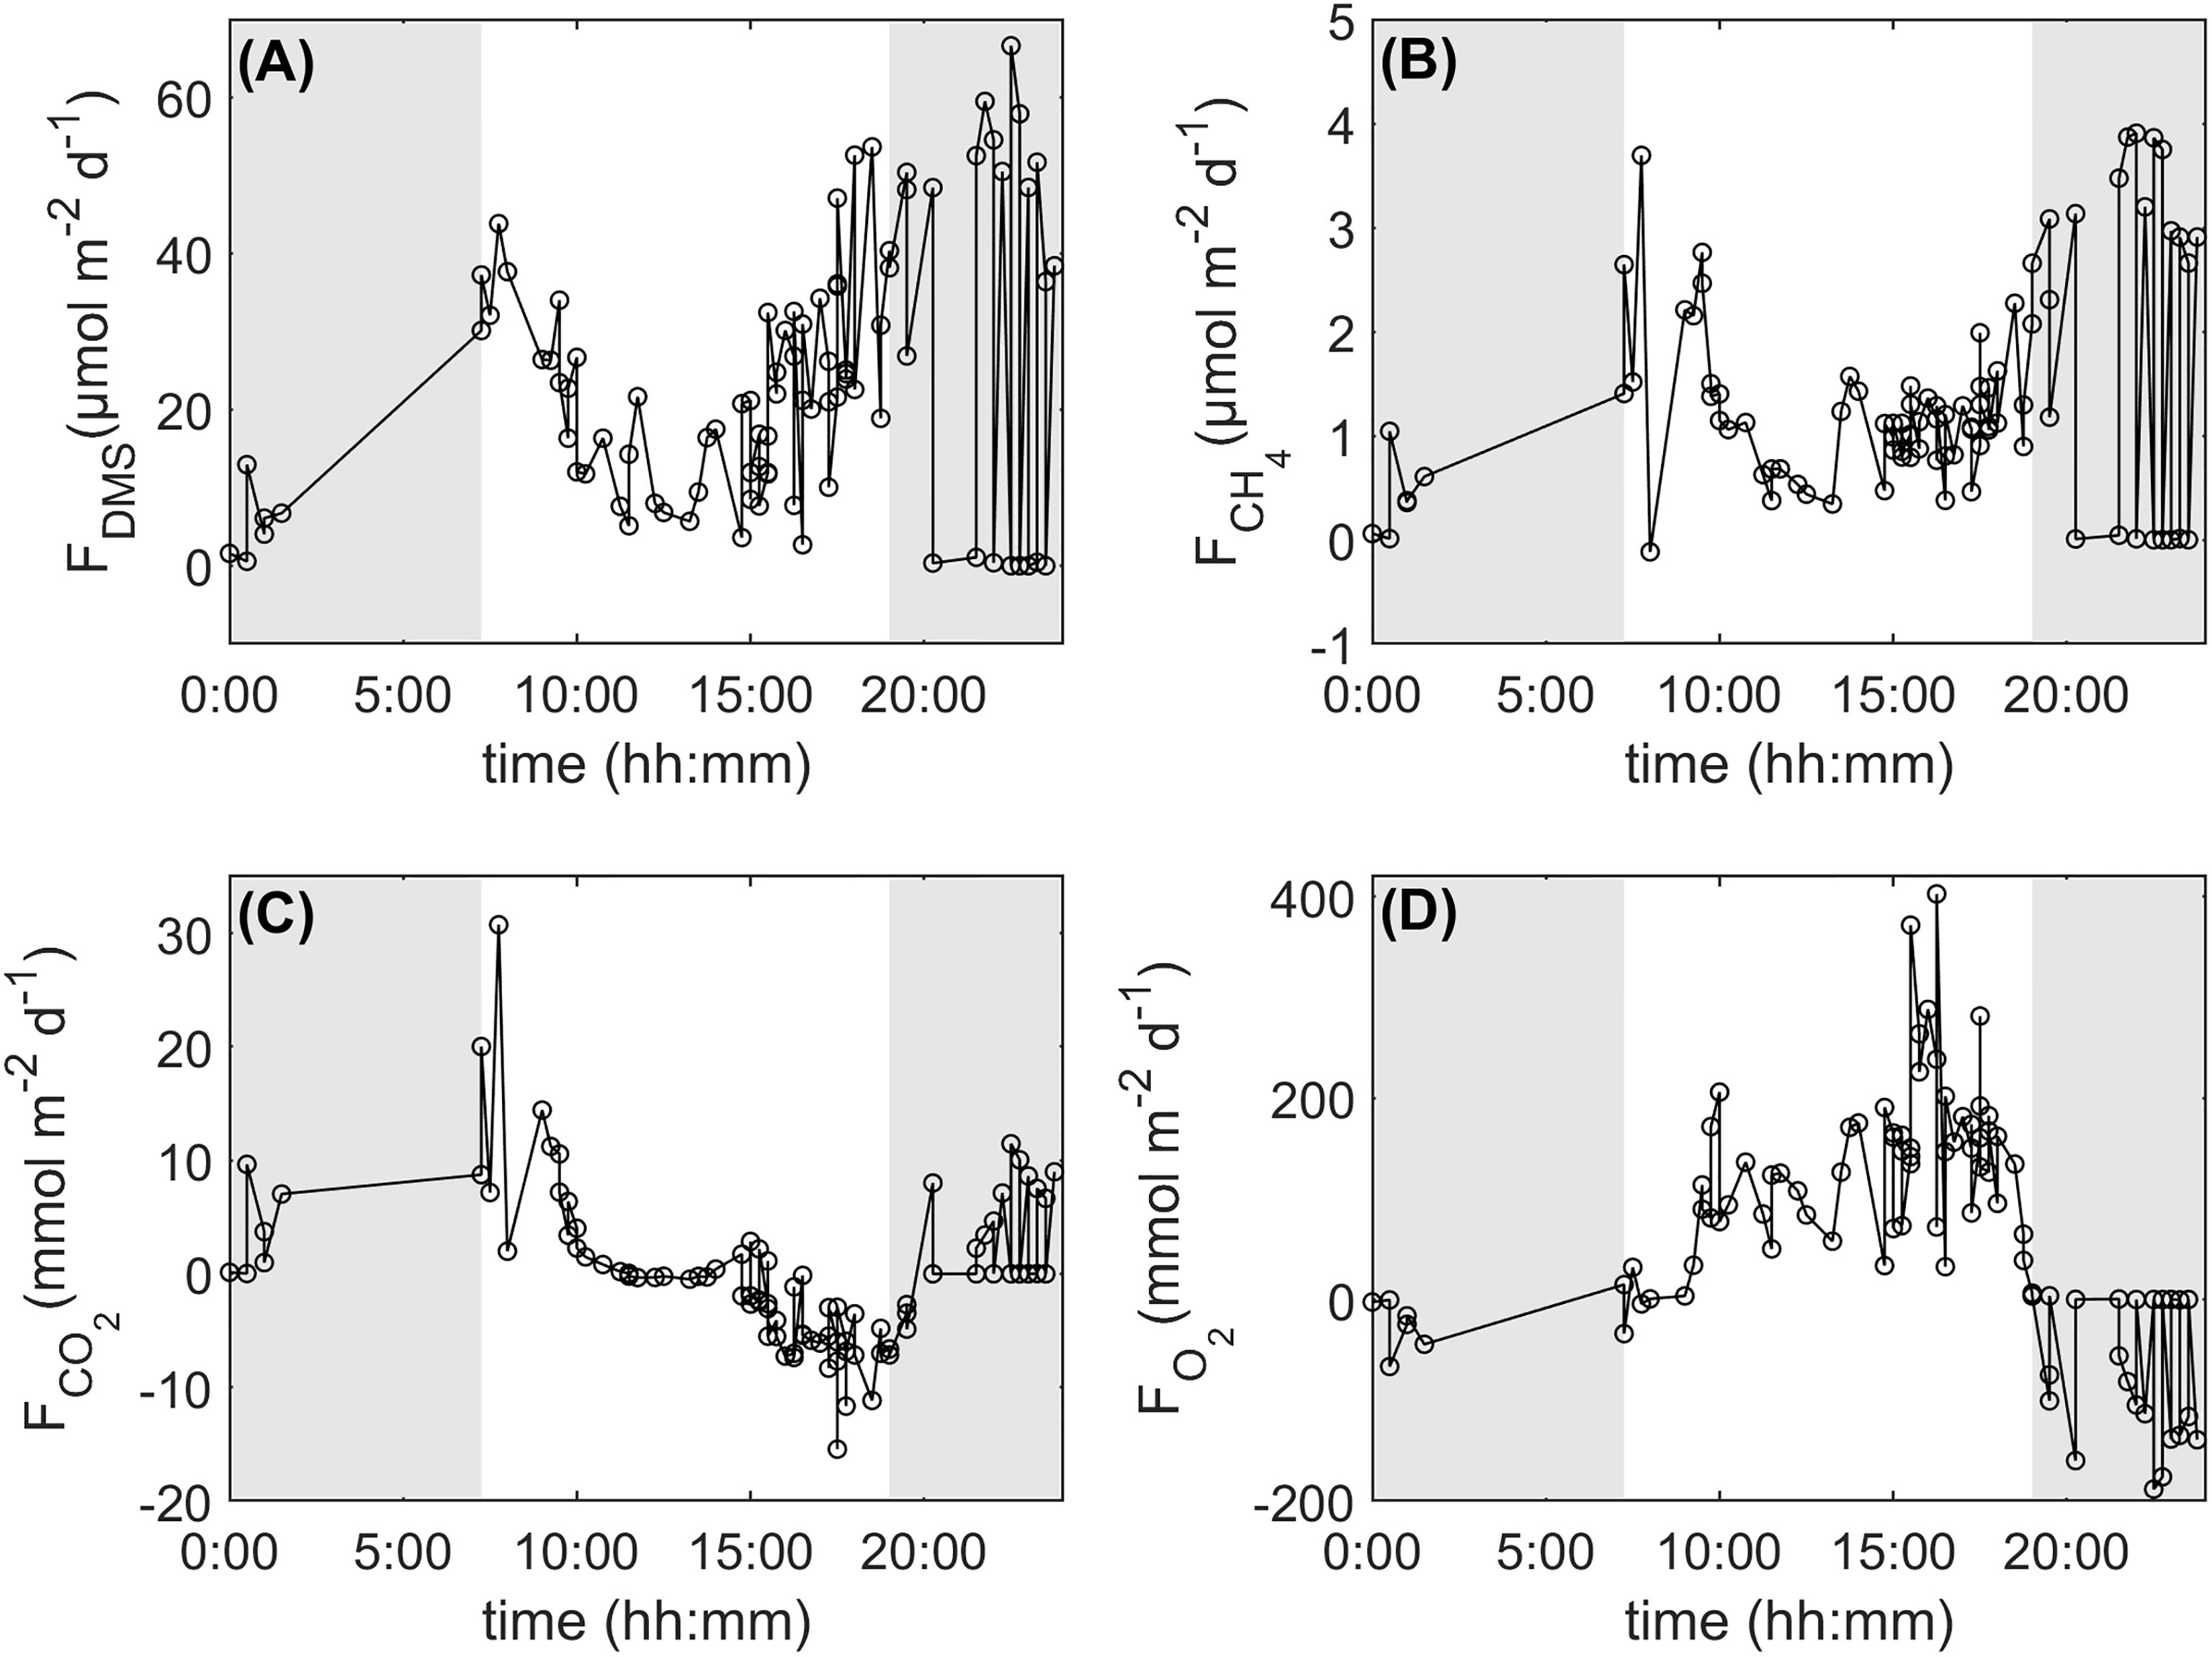
Figure 1 24-h integrated DMS (A), CH4 (B), CO2 (C) and O2 (D) fluxes from the Heron Island reef, southern Great Barrier Reef, for the period 4-17 February, 2016. Shaded areas represent hours of darkness.
All 24h-integrated sea-to-air fluxes showed a diurnal trend with DMS, CO2 and CH4 fluxes being generally greater at night than during the day while O2 fluxes showed the opposite trend (Figure 1). Sea-to-air CO2 fluxes showed the most variability during the first hours of sunlight while DMS and O2 fluxes showed the most variability between dusk and midnight. CH4 fluxes showed the most variability both at night and during the first hours of sunlight.
Sea-to-air O2 fluxes negatively correlated with DMS (R2 = 0.0569, n = 93, p = 0.02), CH4 (R2 = 0.1476, n = 93, p < 0.001) and CO2 (R2 = 0.346, n = 93, p <0.00001), although the negative relationship between O2 and CO2 was clearly the strongest (Figure 2). Sea-to-air CO2 and CH4 fluxes were weakly positively correlated (R2 = 0.1709, n = 93, p <0.001) while CO2 and DMS fluxes were not significantly correlated (R2 = 0.0242, n = 93, p > 0.05). Sea-to-air DMS and CH4 fluxes showed the strongest positive correlation (R2 = 0.7526, n = 93; p < 0.00001).
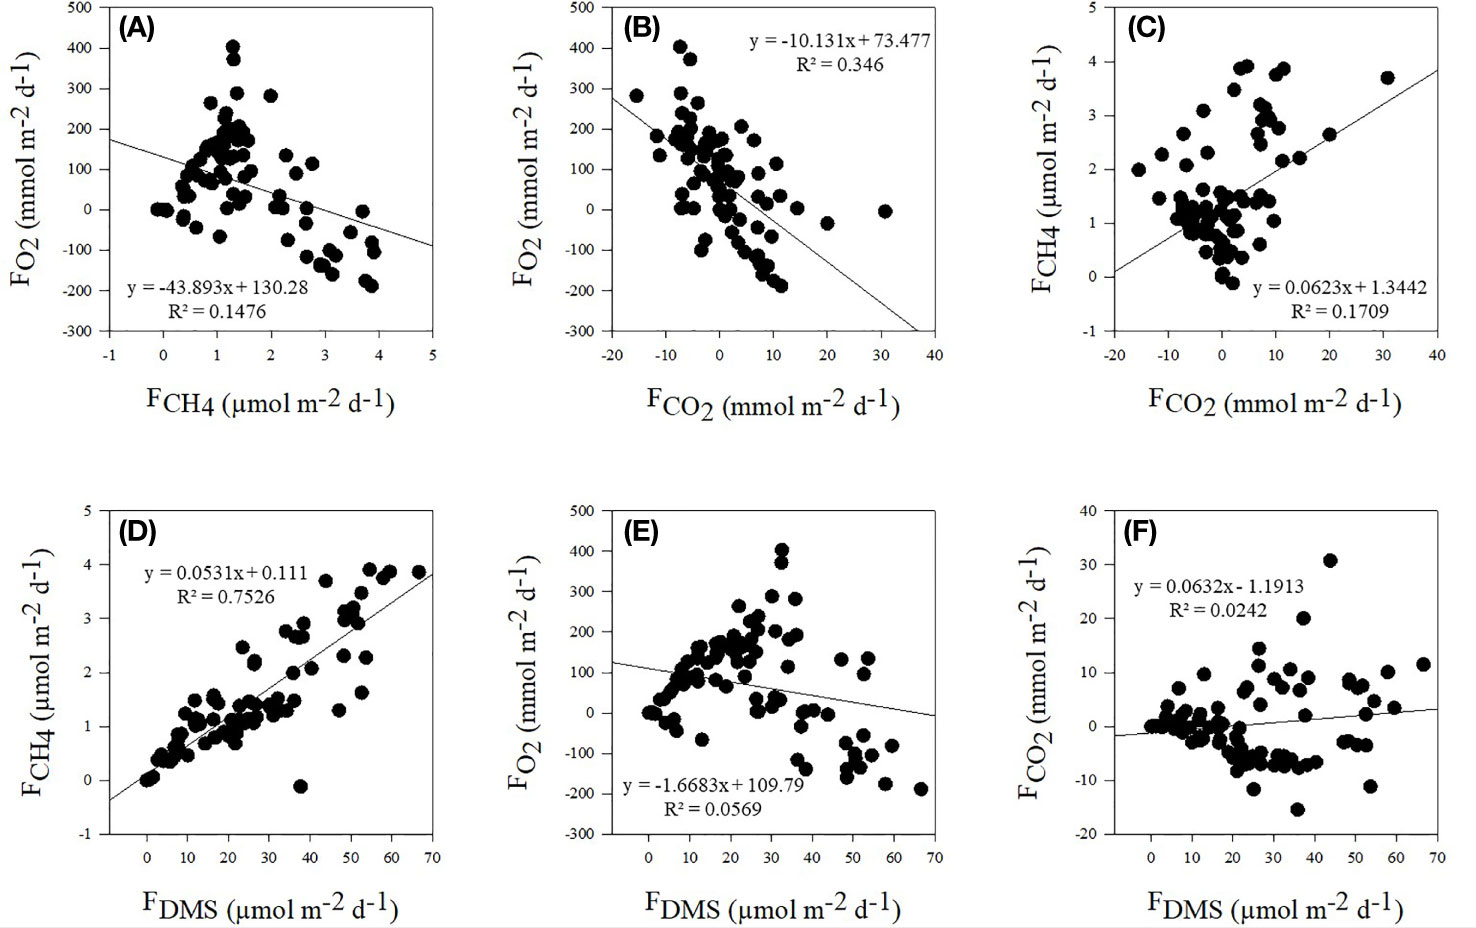
Figure 2 Correlations between sea-to-air fluxes of CH4 and O2 (A), CO2 and O2 (B) and CO2 and CH4 (C) as well as between fluxes of DMS and CH4 (D), O2 (E) and CO2 (F). Trendlines, regression equation and R2 values are displayed for each correlation.
Dissolved DMS, CH4, CO2 and O2 concentrations are presented in the supplementary material (Supplementary Figure 2). Because fluxes are calculated based on concentrations and transfer velocity, and the transfer velocity is shared across fluxes, the relationships between dissolved DMS and dissolved CH4, CO2 and O2 concentrations were also plotted. Dissolved DMS concentrations positively correlated with dissolved CH4 (R2 = 0.7706, n = 93) and CO2 (R2 = 0.2273, n = 93) concentrations and negatively correlated with dissolved O2 concentrations (R2 = 0.3847, n = 93) (Supplementary Figure 3, p < 0.00001).
3.3 Multiple Linear Regressions
The backward elimination process used in the stepwise Multiple Linear Regressions (MLRs) revealed that salinity, pH, depth, wind direction, dewpoint and wind chill were the six main drivers of sea-to-air DMS fluxes and that pH, depth, wind direction, dewpoint, wind chill and light were the six main drivers of CH4 fluxes (Table 1). The linear fit between measured and predicted DMS and CH4 fluxes exhibited an R2 of 0.717 and 0.631 (n = 93, p <0.00001), respectively (Figures 3A, B). The most negative drivers of DMS emissions were wind chill and pH whereas the most positive driver was wind direction (Figure 3C). Similarly, the main negative and positive drivers of CH4 emissions were pH and wind direction, respectively (Figure 3D). When plotting wind direction (in azimuth degrees) against DMS and CH4 fluxes (Supplementary Figure 4), it appeared that the wind direction leading to the greatest DMS and CH4 emissions was predominantly at 180°, which corresponds to the direction of the dominant southerly trade winds at Heron Island.
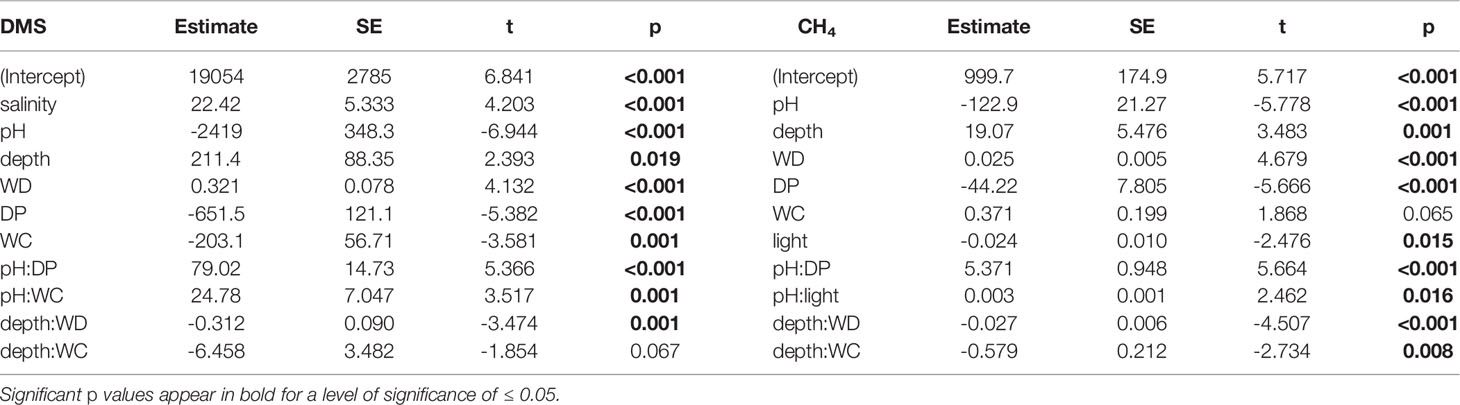
Table 1 Multiple Linear Regression (MLR) statistics (estimated coefficient, standard error – SE; t and p values), describing sea-to-air DMS and CH4 fluxes in response to various environmental variables (salinity, pH, depth, wind direction – WD, dewpoint – DP, windchill – WC and light) with interactions, for the best six-variable model using the Akaike Information Criterion (AIC, Supp. Mat.), i.e. lowest number (compare to Figure 3).
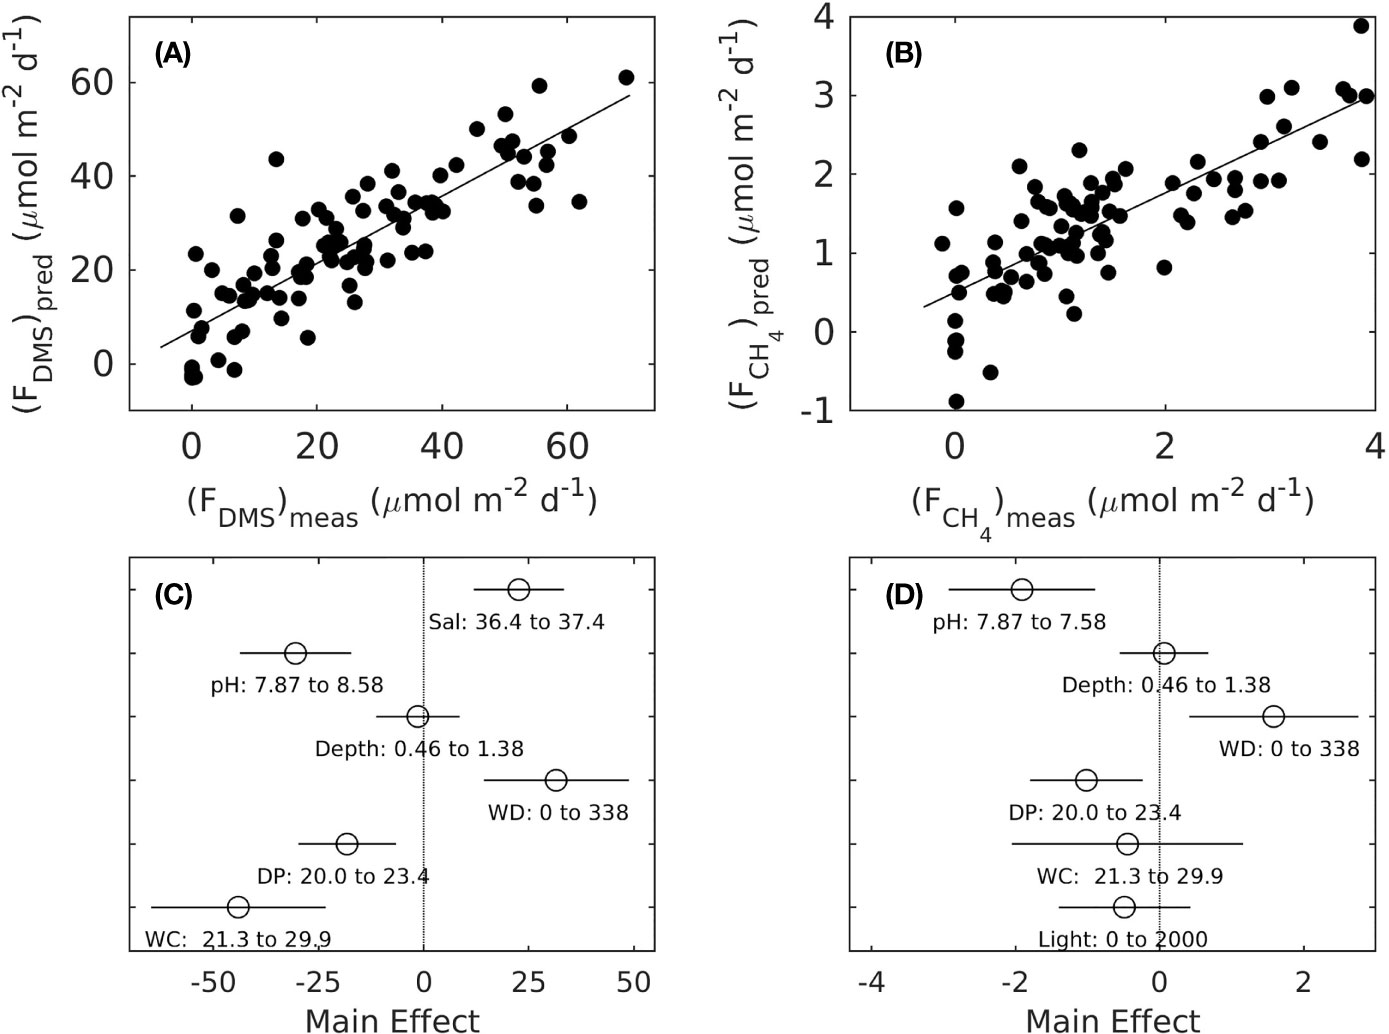
Figure 3 Linear fits through in situ and predicted sea-to-air DMS (A, R2 = 0.717) and CH4 (B, R2 = 0.631) fluxes by the stepwise Multiple Linear Regression (MLR) model with the lowest Akaike Information Criterion (AIC) with six main variables, and resulting main effect sizes of salinity, pH, depth, wind direction (WD), Dewpoint (DP) and Wind Chill (WC) for DMS fluxes (C) and of pH, depth, WD, DP and WC and light for CH4 fluxes (D) (compare to Table 1).
3.4 Reef Production
The DMS reef production exhibited positive values at all times, with a few sporadic spikes around peak hours of sunlight (~ 11:00) and in the middle of the night (~23:00) (Figure 4A). Although an order of magnitude lower, the CH4 reef production was also positive at all times but with greater values recorded at night (Figure 4B). The CO2 reef production was positive at night and for the first half of the day but negative from about 12:00 to 20:00 (Figure 4C). As expected, the O2 reef production was essentially positive during the day until dusk, and negative at night (Figure 4D).
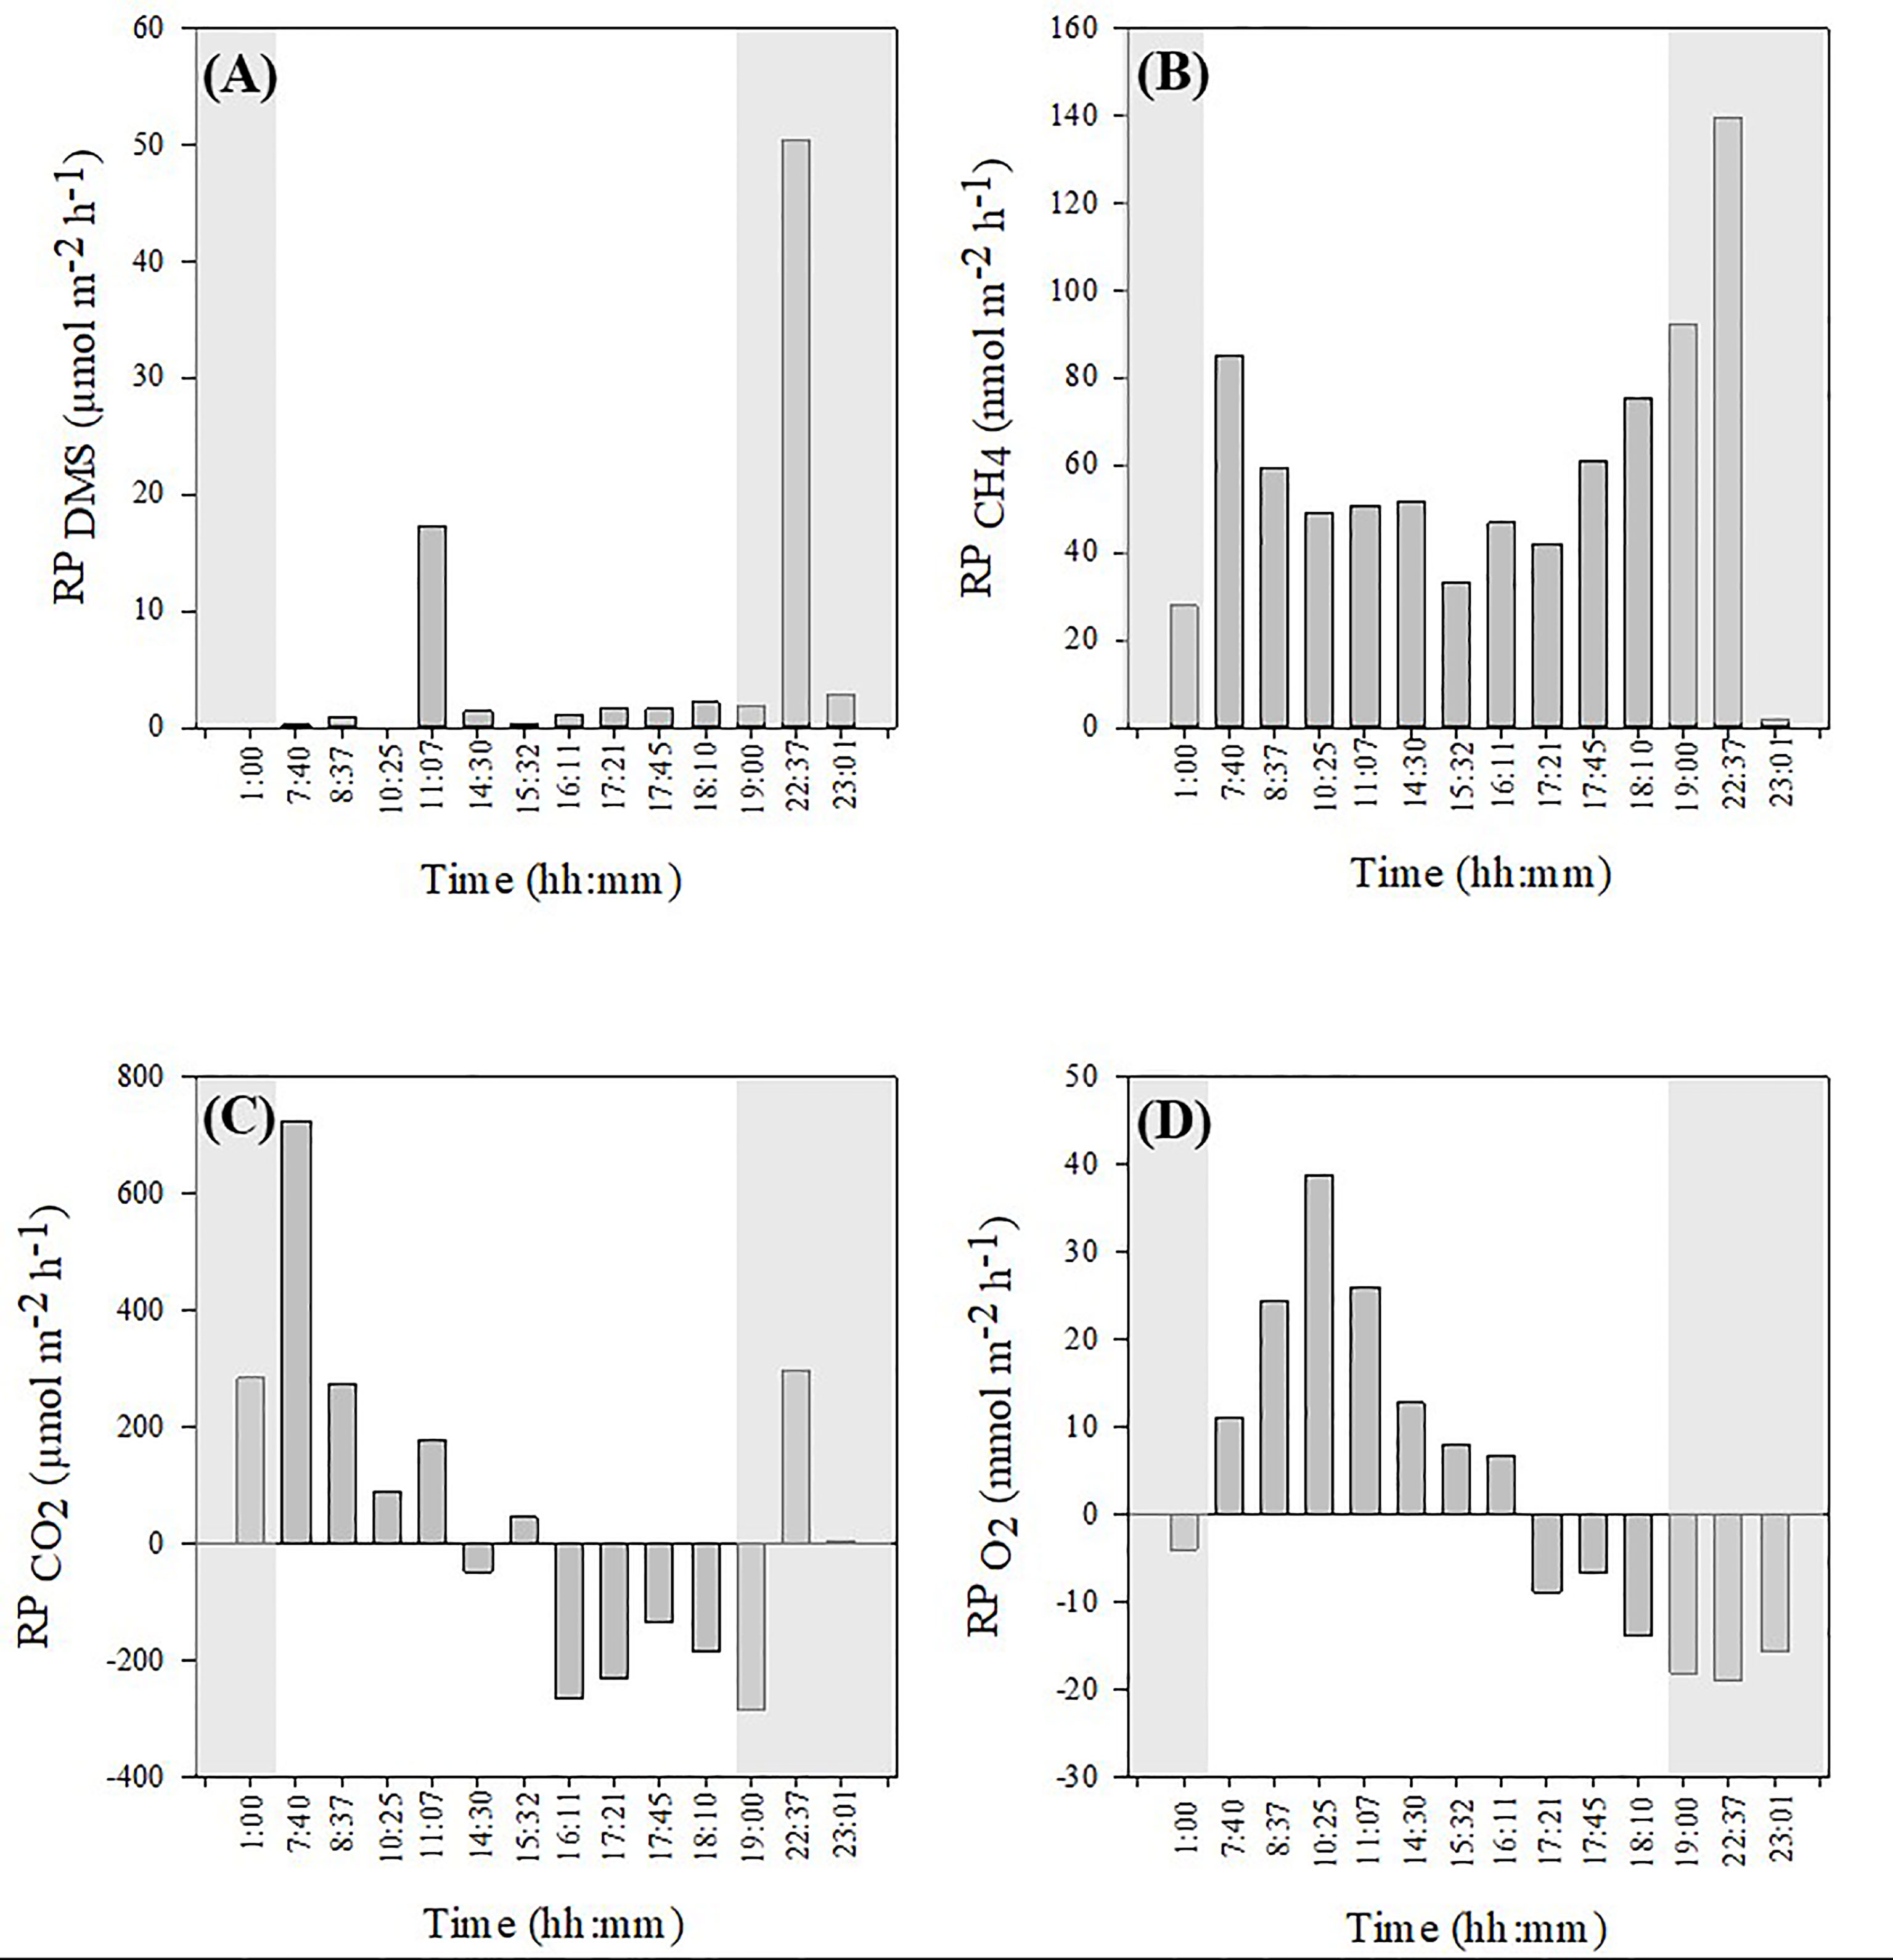
Figure 4 24h-integrated reef production (RP) for DMS (A), CH4 (B), CO2 (C) and O2 (D) calculated around each low-tide period. Shaded areas represent hours of darkness.
3.5 Particle Number Concentrations and Their Relationship With Wind Speed and DMS Exchange
Over the course of the study, intermediate (< 0.5-2.5 µm) and large (> 2.5 µm) aerosol particle number concentrations averaged 5.51 x 10⁶ ± 1.73 x 10⁵ m-3 and 1.15 x 10⁶ ± 4.63 x 10⁴ m-3, respectively (Figures 5A, B). Particle numbers in the 0.5µm-2.5 µm portion size fraction were highest in the early morning (7:00 and 11:00) and again at the end of the day around and following sunset (from 18:30 to 20:00). Particle numbers in the > 2.5 µm size fraction occurred slightly later in the morning (~11:00), early afternoon (11:00 to 15:00) and in the evening between 18:30 and 20:00.
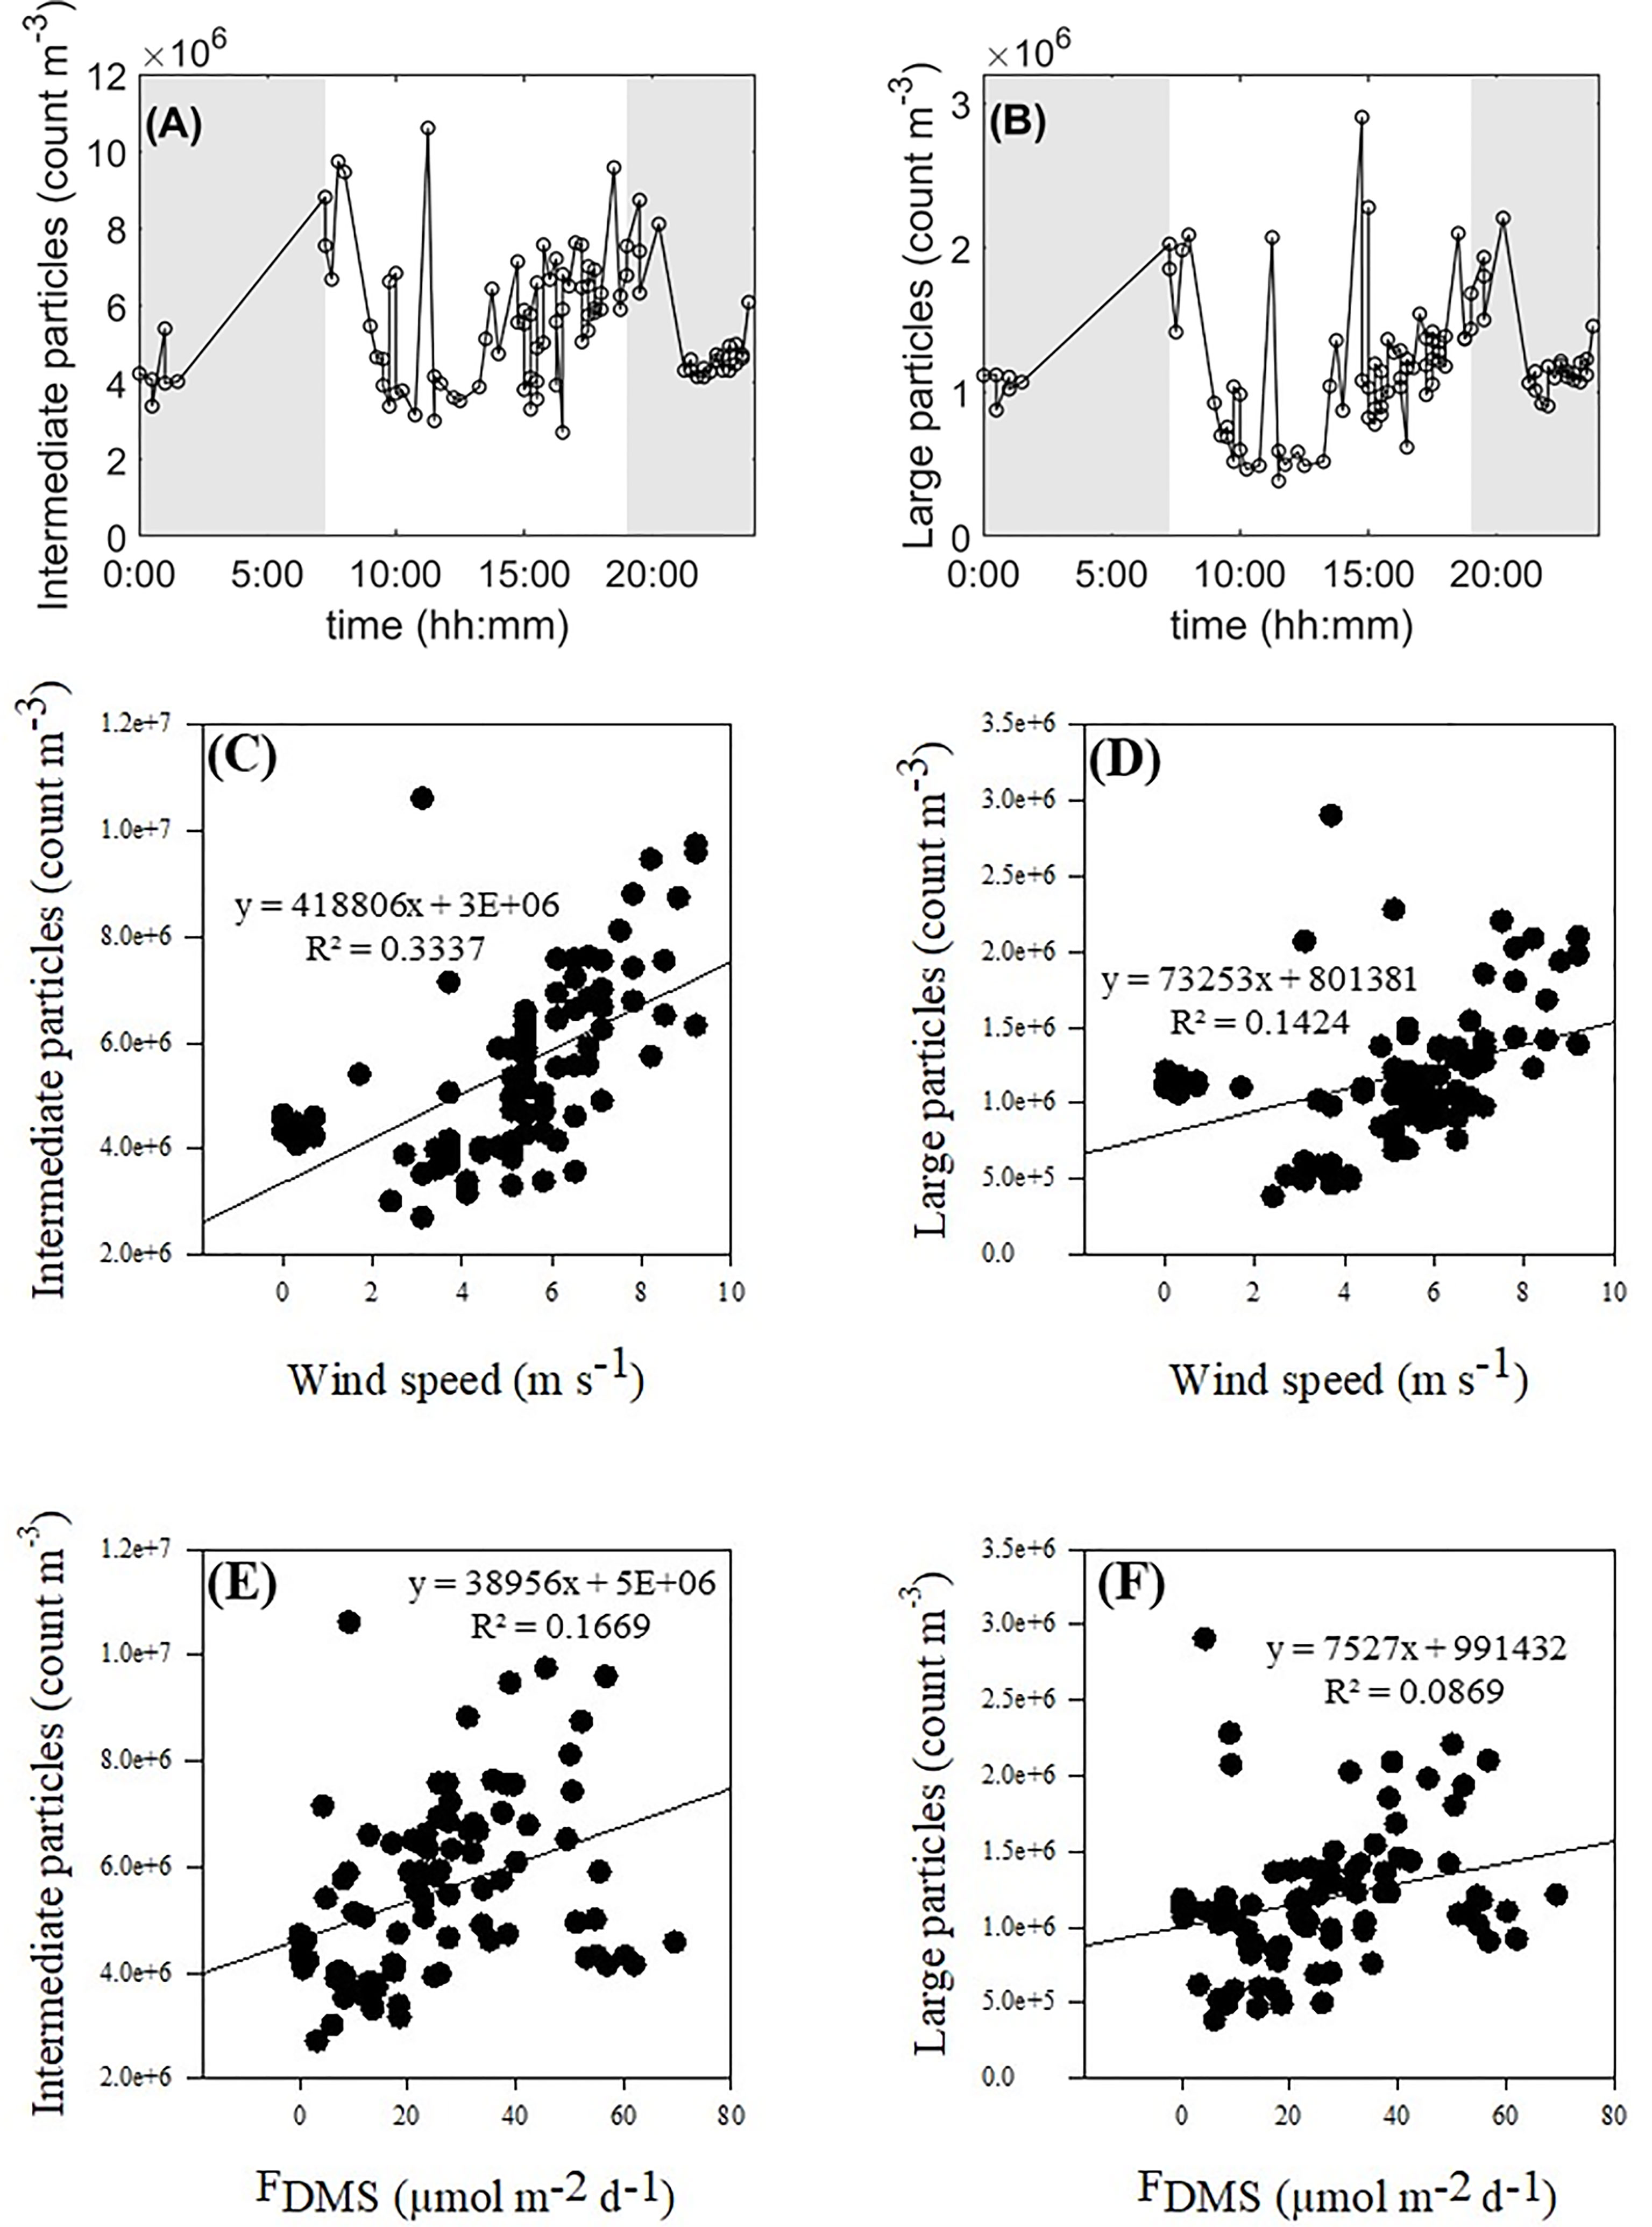
Figure 5 24h-integrated abundance of intermediate (0.5-2.5 µm) (A) and large (>2.5 µm) (B) aerosol particles and their relationships with wind speed (C, D) and sea-to-air DMS fluxes (E, F), respectively. Shaded areas represent hours of darkness.
Wind speed positively correlated with the abundance of intermediate (R2 = 0.3337, n = 93, p < 0.0001) and large (R2 = 0.1424, n = 93, p = 0.0002) aerosol particles (Figures 5C, D). Sea-to-air DMS fluxes also positively correlated with the abundance of intermediate (R2 = 0.1669, n = 93, p = 0.0001) and large (R2 = 0.0869, n = 93, p = 0.004) aerosol particles (Figures 5E, F).
4 Discussion
4.1 Flux Estimations
DMS fluxes reported in this study (Min = not-detectable, Max = 69.5 µmol m-2 d-1, Mean = 24.9 ± 1.81 µmol m-2 d-1, n = 93) fell within the range of previously reported sea-to-air DMS fluxes for 5 coral reef systems across the Great Barrier Reef, which varied from not-detectable to 153 µmol m-2 d-1 in the austral summer wet season (Jones et al., 2018). However, seasonal DMS fluxes recorded in the current study were about five and four times greater on average than the 2012 summer wet season study conducted on Heron Island (5.0 µmol m-2 d-1, n = 651) (Swan et al., 2017) and the average DMS fluxes reported by Jones et al. (2018) (6.4 µmol m-2 d-1, n = 237), respectively. Since DMSa (mean ± SD) at Heron Island in the 2012 and 2016 summers were similar (i.e. 3.9 ± 1.5, n = 651, and 3.7 ± 0.8, n = 761 nmol m-3, respectively, data not shown), the high fluxes in this study most likely result from temporally elevated DMS production in the Heron Island reef lagoon in the year 2016 or on the section of the Heron Island reef flat where seawater samples were collected. The significant differences in the average DMS fluxes for the summers of 2012 and 2016 at Heron Island might also reflect differences in the employed flux calculation (photochemical ambient mass balance approach used by Swan et al. (2017) as opposed to the gradient method flux calculation used in this study). Similarly, Jones et al. (2018) used the LM86 gradient method flux parameterisation, which was shown to give much lower flux estimates than the other gradient method flux parameterisations used in the current study (see Supplementary Table 1), hence indicating that the approach employed can lead to significantly different values. The estimated flux difference might also reflect the limitations of the non-automated VG-CL instrument used in this study, which ultimately led to preferential DMSw sampling during the day and evenings, with a lack of night-time measurements to match with the continuous DMSa measurements.
Sea-to-air fluxes for CH4 (Min = −0.12 µmol m-2 d-1, Max = 3.91 µmol m-2 d-1, mean = 1.36 ± 1.03 mmol m-2 d-1) and CO2 (Min = −15.4, Max = 30.7 mmol m-2 d-1, mean = 0.30 mmol m-2 d-1) were consistent with previously reported water-air fluxes for the Great Barrier Reef (3.4 ± 0.1 µmol m-2 d-1 (O’Reilly et al., 2015) and 2.2 ± 0.5 µmol m-2 d-1 (Reading et al., 2021) for CH4; −5.4 ± 0.8 mmol m-2 d-1 (O’Reilly et al., 2015), 1.44 ± 0.15 mmol m−2 d−1 (Lønborg et al., 2019) and 1.9 ± 0.4 mmol m-2 d-1 (Reading et al., 2021) for CO2).
Sea-to-air O2 fluxes in this study (Min = −188 mmol m-2 d-1, Max = 403 mmol m-2 d-1, mean = 70 ± 12 mmol m-2 d-1) were similar to water-air fluxes reported for a Puerto Rican coral reef, with rates varying between −285 and 329 mmol m-2 d-1 (McGillis et al., 2011). However, they were rather low compared to O2 fluxes reported for another coral reef system in the Florida Keys, (Min = −450 mmol m-2 d-1, Max = 4500 mmol m-2 d-1) (Long et al., 2013), which most likely reflects differences between the phototrophic communities of different reef systems (e.g. algal versus coral cover, phytoplankton composition).
4.2 The Interplay Between DMS and CH4
The strong positive correlation between water-air DMS and CH4 fluxes (R2 = 0.7526) suggests that DMS and CH4 emissions from the Heron Island reef lagoon are closely linked. Further to this observation, the MLR analysis revealed that sea-to-air DMS and CH4 fluxes were both driven by pH, depth, wind direction, dewpoint and wind chill. This indicates that DMS and CH4 fluxes are driven by very similar environmental factors, thus potentially explaining part of the correlation between DMS and CH4 emissions at the Heron Island reef lagoon. Dissolved concentrations of DMS and CH4 were also strongly correlated (Supplementary Figure 3), which indicates that the production of DMS and CH4 in this reef system is also intimately linked. In contrast there was no clear correlation between the RPs of DMS and CH4, which suggests that DMS and CH4 were subject to different accumulation rates and thus to different production and/or degradation processes.
DMS production mainly relies on the enzymatic cleavage of DMSP in the water column (Simó, 2001) while methanogenesis mainly depends on the conversion of CO2 and acetate into CH4 under anaerobic conditions (Liu and Whitman, 2008), which most likely occurs in marine sediments in coral reef ecosystems (Deschaseaux et al., 2019; Reading et al., 2021). The main sinks of dissolved DMS are expected to be biological and photochemical oxidation (del Valle et al., 2009) as well as emission fluxes from the water column to the atmosphere (Lana et al., 2011). Similarly, oceanic emissions (Weber et al., 2019) and microbial oxidation to CO2 through both aerobic and anaerobic pathways (Pain et al., 2019) are considered the main sinks of dissolved CH4 in marine systems. However, the rate and magnitude of DMS and CH4 sinks rely on different degradation processes (e.g. microbial communities, vertical distribution in the water column). For instance, the magnitude of the aerobic and anaerobic CH4 oxidation sinks is dictated by oxygen gradients and groundwater residence time, respectively (Pain et al., 2019). The different sources and sinks of DMS and CH4 in coral reef systems thus most likely explain the divergence in correlation between DMS and CH4 sea-to-air emissions on one hand and the RPs of DMS and CH4 on the other hand.
At the Heron Island reef lagoon, negative correlations were found between dark DMS and CH4 fluxes from permeable carbonate coral reef sediments to the water column (Deschaseaux et al., 2019), suggesting that part of the DMS produced in coral reef sediments was degraded to CH4 under dark anoxic conditions, most likely by anaerobic methanogens (Kiene and Visscher, 1987). However, CH4 production can also occur under aerobic conditions and across all living organisms, including marine phytoplankton (Klintzsch et al., 2019; Ernst et al., 2022). As such, DMS-to-CH4 hydrolysis may not only occurs in permeable carbonate coral reef sediments, but also in reef waters through phytoplankton activity and possibly within the coral tissue, where DMS plays a major role in structuring coral-associated bacterial communities (Raina et al., 2010).
Growing evidence shows that organic compounds containing sulfur- bonded methyl groups such as DMS are a source of CH4 under both anaerobic and aerobic conditions (Liu and Whitman, 2008; Ernst et al., 2022), with CH4 production by certain bacteria being enhanced in the presence of reactive oxygen species under oxidative stress (Ernst et al., 2022). DMS concentrations in marine algae and corals also increase under oxidative stress due to DMS being used as an antioxidant (Sunda et al., 2002; Deschaseaux et al., 2014). This suggests that the increase in CH4 production might be due to more sulfur-methylated compounds made readily available to methylotrophs in various types of organisms.
It was estimated that DMS contributes up to 28% of CH4 production in various marine systems (Kiene, 1988; Florez-Leiva et al., 2013), which could well be the case for coral reef ecosystems. At the Heron Island reef lagoon, it was estimated that a small portion (~6.5%) of the CH4 produced in coral reef sediments under dark anoxic conditions might originate from DMS (Deschaseaux et al., 2019). Here, the slope of the regression between DMS and CH4 indicates that 0.05 mole of CH4 is emitted for each mole of DMS being emitted to the atmosphere. This shows that sea-to-air CH4 emissions from the Heron Island reef lagoon represents 5% of that of DMS, which is consistent with the average sea-to-air DMS (24.9 ± 1.81 µmol m-2 d-1) and CH4 (1.36 ± 0.11 µmol m-2 d-1) fluxes reported in this study. However, without using isotopic tracers, we cannot draw conclusions on the actual portion of CH4 emissions from coral reef systems that actually originate from DMS hydrolysis.
4.3 Drivers of DMS and CH4 in Coral Reef Systems
In addition to pH, depth, wind direction, dewpoint and wind chill, DMS emissions were also positively driven by salinity. These findings could be counter intuitive given that the most intense plume of DMS measured over the Heron Island reef occurred in the winter of 2013 at low tide when rainfall on the aerially exposed reef apparently caused a combined hypo-salinity osmotic and hypo-thermic temperature shock to the coral (Swan et al., 2017). However, salinity in this study only ranged from 36.4 to 37.4 ppt, and thus DMS emissions under rainfall at low tide was not captured. Nevertheless, it could also be that it was not only low salinity that led to high DMS emissions reported by Swan et al. (2017), but also temperature stress and/or other rain-induced environmental conditions. For instance, rain increases transfer velocity (Ho et al., 1997), which could explain the higher emissions in Swan et al. (2017) under rainfall at low tide.
Similarly, in addition to pH, depth, wind direction, dewpoint and wind chill, CH4 emissions were also negatively affected by light whereas previous studies show that CH4 production by phytoplankton was accentuated under increased light conditions (Klintzsch et al., 2020). Given that light mainly influences photosynthesis and O2 production in biological systems, this data suggests that light-driven O2 production might negatively impact CH4 production or lead to enhanced CH4 oxidation in coral reefs. This is consistent with sea-to-air O2 fluxes being negatively correlated with both CH4 and CO2 in this study, with CO2 being a precursor of CH4 production (Liu and Whitman, 2008). Although CH4 can originate from various biogenic sources in the presence of oxygen (Ernst et al., 2022), it could be that the main source of CH4 in coral reef systems are methanogen-rich permeable carbonate sediments (Deschaseaux et al., 2019), which are productive under dark anoxic conditions.
Maximum dissolved DMS and DMSP concentrations in coral reef systems coincide with low pH, especially over areas dominated by seagrass and macroalgae (Burdett et al., 2013), which is consistent with pH negatively affecting DMS emissions in the current study. Coral-reef DMS emissions are thus expected to increase under low pH conditions, possibly due to macroalgae using DMSP to maintain metabolic functions during periods of low carbonate saturation state (Burdett et al., 2013). Sea-to-air CH4 fluxes at Heron Island were also negatively correlated with pH, which suggests that ocean acidification may increase CH4 emissions in coral reef systems, possibly due to low pH enhancing organic matter degradation in coral reefs like it is the case in seagrass sediments (Ravaglioli et al., 2020).
Spikes in DMS emissions at the Heron Island reef lagoon were previously detected at low tide generally under low wind speeds < 2 m s-1 (Swan et al., 2017), which agrees with depth being a negative driver of DMS emissions in this study. On the other hand, it is unknown whether dewpoint and windchill have ever been considered as environmental factors driving DMS and CH4 emissions in marine systems, although it seems that low dewpoint and air temperatures coincided with high DMS and CH4 emissions at the Heron Island reef system. This suggests that air temperature also plays a role in the gas transfer velocity of DMS and CH4, most likely as it influences water temperature and thus the temperature-dependent gas solubility of these two compounds.
DMS and CH4 emissions were highest under southerly winds, which travelled over the Heron Island’s reef and the adjacent large Wistari reef, directly south of our sampling site. This indicates that Wistari reef is possibly the major source of coral-reef-derived DMSa measured at Heron Island and that coral reefs are a more predominant source of DMS and CH4 than the surrounding ocean.
4.4 DMS and Climate in Coral Reef Systems
Although there is insufficient information to attribute the particle counts in this study to new particle formation, because the measured size ranges are far above that of new nanoparticles (Clarke et al., 2006), it was interesting to see that sea-to-air DMS fluxes positively correlated with intermediate (0.5-2.5 µm) and large (> 2.5 µm) particles, and that a stronger correlation occurred between DMS emissions and the abundance of particles in the intermediate size range. This likely indicates that DMS oxidation products possibly contributed to the growth of existing particles within the 0.5-2.5 µm measured size range, which are suspected to be predominantly sea spray aerosols (SSA) (Quinn et al., 2015). Given that number concentrations of intermediate size particles were correlated with wind speed (R2 = 0.3337, Figure 5C) and that wind speed is a covariate in DMS flux, the observed correlation is expected to be linked to wind speed, which exchanges more DMS and SSA from the ocean. Given that coral-reef derived DMS and CH4 emissions could be linked, with a small portion of DMS being hydrolysed to CH4 in the water column, and that CH4 is a GHG with a stronger greenhouse potential than that of CO2 (Shine et al., 2005), it is important to consider both dissolved DMS and CH4 when predicting BVOC and GHG emissions from marine systems.
5 Conclusion
To our knowledge, this study is the first to simultaneously measure and report sea-to-air DMS fluxes alongside sea-to-air CH4 fluxes in a coral reef ecosystem. Depth, pH, wind direction, dewpoint and wind chill were common drivers of DMS and CH4 emissions at Heron Island, a coral reef system on the southern Great Barrier Reef. Additionally, salinity was a positive driver of DMS emissions while light negatively affected sea-to-air CH4 fluxes. This research also showed the strong correlation that exists between DMS and CH4 emissions at Heron Island. Although it is not possible at this stage to estimate the portion of CH4 that derives from DMS hydrolysis, it is clear that DMS and CH4 emissions from the Heron Island reef are intimately linked, with potential consequences on ocean warming. DMS emissions were well correlated with the abundance of intermediate size particles (0.5-2.5 µm), which indicates that DMS contributes to the growth of existing aerosol particles, which could eventually form cloud condensation nuclei and induce cloud-mediated cooling on a local scale. This study highlights the complexity of BVOC and GHG co-emissions and the potential impact they may have on the regional climate of the Great Barrier Reef.
Data Availability Statement
The data collected for this study has been made publicly available from the Southern Cross University online repository at: https://doi.org/https://doi.org/10.4226/47/59c460fbe8322 and https://doi.org/10.25918/data.193.
Author Contributions
ED, BE, GJ, HS and DM conceptualised the experimental design. ED conducted the DMSw analysis, DMSw data processing, all data compiling, and manuscript writing. HS conducted the analysis and processing of DMSa and particle number concentrations. DM conducted the analysis and processing of CH4 and CO2 data. ED and DM conducted the flux calculations for DMS and CH4, CO2 and O2, respectively. KS conducted the MLR analysis and data processing on MATLAB. EK and KT designed the VG-CL and provided analytical support in the field. BE and GJ funded this research. All authors contributed to the article and approved the submitted version.
Funding
This research was funded by the ARC Discovery Project grants DP150102092 (recipient BE), “Dissolution of calcium carbonate in sediments in an acidifying ocean” and DP150101649 (recipient GJ), “The Great Barrier Reef as a significant source of climatically relevant aerosol particles”.
Conflict of Interest
The authors declare that the research was conducted in the absence of any commercial or financial relationships that could be construed as a potential conflict of interest.
Publisher’s Note
All claims expressed in this article are solely those of the authors and do not necessarily represent those of their affiliated organizations, or those of the publisher, the editors and the reviewers. Any product that may be evaluated in this article, or claim that may be made by its manufacturer, is not guaranteed or endorsed by the publisher.
Acknowledgments
We would like to thank the staff at the Heron Island Research Station for their assistance.
Supplementary Material
The Supplementary Material for this article can be found online at: https://www.frontiersin.org/articles/10.3389/fmars.2022.910441/full#supplementary-material
References
Barnes R., Goldberg E. (1976). Methane Production and Consumption in Anoxic Marine Sediments. Geology 4, 297–300. doi: 10.1130/0091-7613(1976)4<297:MPACIA>2.0.CO;2
Benson B. B., Krause D. Jr (1984). The Concentration and Isotopic Fractionation of Oxygen Dissolved in Freshwater and Seawater in Equilibrium With the Atmosphere 1. Limnol. Oceanogr. 29, 620–632. doi: 10.4319/lo.1984.29.3.0620
Burdett H. L., Donohue P. J. C., Hatton A. D., Alwany M. A., Kamenos N. A. (2013). Spatiotemporal Variability of Dimethylsulphoniopropionate on a Fringing Coral Reef: The Role of Reefal Carbonate Chemistry and Environmental Variability. PloS One 8, e64651. doi: 10.1371/journal.pone.0064651
Carpenter L. J., Archer S. D., Beale R. (2012). Ocean-Atmosphere Trace Gas Exchange. Chem. Soc. Rev. 41, 6473–6506. doi: 10.1039/c2cs35121h
Charlson R. J., Lovelock J. E., Andreae M. O., Warren S. G. (1987). Oceanic Phytoplankton, Atmospheric Sulfur, Cloud Albedo and Climate. Nature 326, 655–661. doi: 10.1038/326655a0
Clarke A. D., Owens S. R., Zhou J. (2006). An Ultrafine Sea-Salt Flux From Breaking Waves: Implications for Cloud Condensation Nuclei in the Remote Marine Atmosphere. J. Geophys. Res.: Atmosph. 111, 1–14. doi: 10.1029/2005JD006565
Curson A. R., Liu J., Martínez A. B., Green R. T., Chan Y., Carrión O., et al. (2017). Dimethylsulfoniopropionate Biosynthesis in Marine Bacteria and Identification of the Key Gene in This Process. Nat. Microbiol. 2, 17001–17009. doi: 10.1038/nmicrobiol.2017.9
Dacey J. W., Wakeham S. G., Howes B. L. (1984). Henry's Law Constants for Dimethylsulfide in Freshwater and Seawater. Geophys. Res. Lett. 11, 991–994. doi: 10.1029/GL011i010p00991
del Valle D. A., Kieber D. J., Toole D. A., Bisgrove J., Kiene R. P. (2009). Dissolved DMSO Production via Biological and Photochemical Oxidation of Dissolved DMS in the Ross Sea, Antarctica. Deep. Sea. Res. Part I.: Oceanogr. Res. Paper. 56, 166–177. doi: 10.1016/j.dsr.2008.09.005
Deschaseaux E. S., Jones G. B., Deseo M. A., Shepherd K. M., Kiene R., Swan H., et al. (2014). Effects of Environmental Factors on Dimethylated Sulfur Compounds and Their Potential Role in the Antioxidant System of the Coral Holobiont. Limnol. Oceanogr. 59, 758–768. doi: 10.4319/lo.2014.59.3.0758
Deschaseaux E., Jones G., Swan H. (2016). Dimethylated Sulfur Compounds in Coral-Reef Ecosystems. Environ. Chem. 13, 239–251. doi: 10.1071/EN14258
Deschaseaux E., Stoltenberg L., Hrebien V., Koveke E. P., Toda K., Eyre B. D. (2019). Dimethylsulfide (DMS) Fluxes From Permeable Coral Reef Carbonate Sediments. Mar. Chem. 208, 1–10. doi: 10.1016/j.marchem.2018.11.008
Ernst L., Steinfeld B., Barayeu U., Klintzsch T., Kurth M., Grimm D., et al. (2022). Methane Formation Driven by Reactive Oxygen Species Across All Living Organisms. Nature 603 (7901), 482–487. doi: 10.1038/s41586-022-04511-9
Fiddes S., Woodhouse M., Utembe S., Schofield R., Alroe J., Chambers S., et al. (2021). The Contribution of Coral Reef-Derived Dimethyl Sulfide to Aerosol Burden Over the Great Barrier Reef: A Modelling Study. Atmosph. Chem. Phys. Discuss. 22 (4), 2419–2445. doi: 10.5194/acp-2021-507
Florez-Leiva L., Damm E., Farías L. (2013). Methane Production Induced by Dimethylsulfide in Surface Water of an Upwelling Ecosystem. Prog. Oceanogr. 112, 38–48. doi: 10.1016/j.pocean.2013.03.005
Haydon T. D., Seymour J. R., Suggett D. J. (2018). Soft Corals Are Significant DMSP Producers in Tropical and Temperate Reefs. Mar. Biol. 165, 1–7. doi: 10.1007/s00227-018-3367-2
Ho D. T., Bliven L. F., Wanninkhof R., Schlosser P. (1997). The Effect of Rain on Air-Water Gas Exchange. Tellus. B. 49, 149–158. doi: 10.3402/tellusb.v49i2.15957
Ho D. T., Law C. S., Smith M. J., Schlosser P., Harvey M., Hill P. (2006). Measurements of Air-Sea Gas Exchange at High Wind Speeds in the Southern Ocean: Implications for Global Parameterizations. Geophys. Res. Lett. 33, 1–6. doi: 10.1029/2006GL026817
Jones G. (2013). Coral Animals Combat Stress With Sulphur. Nature 502, 634–635. doi: 10.1038/nature12698
Jones G., Curran M., Deschaseaux E., Omori Y., Tanimoto H., Swan H., et al. (2018). The Flux and Emission of Dimethylsulfide From the Great Barrier Reef Region and Potential Influence on the Climate of NE Australia. J. Geophys. Res.: Atmosph. 123, 13,835–813,856. doi: 10.1029/2018JD029210
Kiene R. P. (1988). Dimethyl Sulfide Metabolism in Salt Marsh Sediments. FEMS Microbiol. Lett. 53, 71–78. doi: 10.1111/j.1574-6968.1988.tb02649.x
Kiene R. P., Oremland R. S., Catena A., Miller L. G., Capone D. G. (1986). Metabolim of Reduced Methylated Sulfur Compounds in Anaerobic Sediments and by a Pure Culture of an Estuarine Methanogen. Appl. Environ. Microbiol. 52, 1037–1045. doi: 10.1128/aem.52.5.1037-1045.1986
Kiene R. P., Visscher P. T. (1987). Production and Fate of Methylated Sulfur-Compounds From Methionine and Dimethylsulfoniopropionate in Anoxic Salt-Marsh Sediments. Appl. Environ. Microbiol. 53, 2426–2434. doi: 10.1128/aem.53.10.2426-2434.1987
Klintzsch T., Langer G., Nehrke G., Wieland A., Lenhart K., Keppler F. (2019). Methane Production by Three Widespread Marine Phytoplankton Species: Release Rates, Precursor Compounds, and Potential Relevance for the Environment. Biogeosciences 16, 4129–4144. doi: 10.5194/bg-16-4129-2019
Klintzsch T., Langer G., Wieland A., Geisinger H., Lenhart K., Nehrke G., et al. (2020). Effects of Temperature and Light on Methane Production of Widespread Marine Phytoplankton. J. Geophys. Res.: Biogeosci. 125, e2020JG005793. doi: 10.1029/2020JG005793
Lønborg C., Calleja M. L., Fabricius K. E., Smith J. N., Achterberg E. P. (2019). The Great Barrier Reef: A Source of CO2 to the Atmosphere. Mar. Chem. 210, 24–33. doi: 10.1016/j.marchem.2019.02.003
Lana A., Bell T. G., Simό R., Vallina S. M., Ballabrera-Poy J., Kettle A. J., et al. (2011). An Updated Climatology of Surface Dimethlysulfide Concentrations and Emission Fluxes in the Global Ocean. Global Biogeochem. Cycle. 25, 1–17. doi: 10.1029/2010GB003850
Liss P. S., Merlivat L. (1986). “Air-Sea Gas Exchange Rates: Introduction and Synthesis,” in The Role of Air-Sea Exchange in Geochemical Cycling. Ed. Buat-Ménard P. (Dordrecht/Boston/Lancaster/Tokyo: D. Reidel publishing company), 113–127.
Liu Y., Whitman W. B. (2008). Metabolic, Phylogenetic, and Ecological Diversity of the Methanogenic Archaea. Ann. New York. Acad. Sci. 1125, 171–189. doi: 10.1196/annals.1419.019
Long M. H., Berg P., De Beer D., Zieman J. C. (2013). In Situ Coral Reef Oxygen Metabolism: An Eddy Correlation Study. PloS One 8, e58581. doi: 10.1371/journal.pone.0058581
Maher D. T., Santos I. R., Leuven J. R., Oakes J. M., Erler D. V., Carvalho M. C., et al. (2013). Novel Use of Cavity Ring-Down Spectroscopy to Investigate Aquatic Carbon Cycling From Microbial to Ecosystem Scales. Environ. Sci. Technol. 47, 12938–12945. doi: 10.1021/es4027776
McGillis W. R., Langdon C., Loose B., Yates K. K., Corredor J. (2011). Productivity of a Coral Reef Using Boundary Layer and Enclosure Methods. Geophys. Res. Lett. 38, 1–5. doi: 10.1029/2010GL046179
Mechalas B. J. (1974). “Pathways and Environmental Requirements for Biogenic Gas Production in the Ocean”, in Natural Gases in Marine Sediments (Boston, MA: Springer), 11–25.
Nagahata T., Kajiwara H., Ohira S. I., Toda K. (2013). Simple Field Device for Measurement of Dimethyl Sulfide and Dimethylsulfoniopropionate in Natural Waters, Based on Vapor Generation and Chemiluminescence Detection. Analyt. Chem. 85, 4461–4467. doi: 10.1021/ac303803w
Nightingale P. D., Malin G., Law C. S., Watson A. J., Liss P. S., Liddicoat M. I., et al. (2000). In Situ Evaluation of Air-Sea Gas Exchange Parameterizations Using Novel Conservative and Volatile Tracers. Global Biogeochem. Cycle. 14, 373–387. doi: 10.1029/1999GB900091
O’Reilly C., Santos I. R., Cyronak T., Mcmahon A., Maher D. T. (2015). Nitrous Oxide and Methane Dynamics in a Coral Reef Lagoon Driven by Pore Water Exchange: Insights From Automated High-Frequency Observations. Geophys. Res. Lett. 42, 2885–2892. doi: 10.1002/2015GL063126
Pain A. J., Martin J. B., Young C. R. (2019). Sources and Sinks of CO2 and CH4 in Siliciclastic Subterranean Estuaries. Limnol. Oceanogr. 64, 1500–1514. doi: 10.1002/lno.11131
Quinn P. K., Bates T. S. (2011). The Case Against Climate Regulation via Oceanic Phytoplankton Sulphur Emissions. Nature 480, 51–56. doi: 10.1038/nature10580
Quinn P. K., Collins D. B., Grassian V. H., Prather K. A., Bates T. S. (2015). Chemistry and Related Properties of Freshly Emitted Sea Spray Aerosol. Chem. Rev. 115, 4383–4399. doi: 10.1021/cr500713g
Raina J. B., Dinsdale E. A., Willis B. L., Bourne D. G. (2010). Do the Organic Sulfur Compounds DMSP and DMS Drive Coral Microbial Associations? Trends Microbiol. 18, 101–108. doi: 10.1016/j.tim.2009.12.002
Raina J.-B., Tapiolas D. M., Foret S., Lutz A., Abrego D., Ceh J., et al. (2013). DMSP Biosynthesis by an Animal and its Role in Coral Thermal Stress Response. Nature 502, 677–680. doi: 10.1038/nature12677
Ravaglioli C., Lardicci C., Pusceddu A., Arpe E., Bianchelli S., Buschi E., et al. (2020). Ocean Acidification Alters Meiobenthic Assemblage Composition and Organic Matter Degradation Rates in Seagrass Sediments. Limnol. Oceanogr. 65, 37–50. doi: 10.1002/lno.11246
Reading M. J., Maher D. T., Santos I. R., Jeffrey L. C., Cyronak T. J., Mcmahon A., et al. (2021). Spatial Distribution of CO2, CH4, and N2O in the Great Barrier Reef Revealed Through High Resolution Sampling and Isotopic Analysis. Geophys. Res. Lett. 48, e2021GL092534. doi: 10.1029/2021GL092534
Sansone F., Chanton J., Haberstroh P., Bozeat R. (1993). “Methane Cycling in Coral Reef Frameworks,” in Trends in Microbial Ecology. Eds. Guerrero R., Pedr6s-Ali6 C. (Barcelona: Span-ish Society for Microbiology), 157–162.
Shine K. P., Fuglestvedt J. S., Hailemariam K., Stuber N. (2005). Alternatives to the Global Warming Potential for Comparing Climate Impacts of Emissions of Greenhouse Gases. Climatic. Change 68, 281–302. doi: 10.1007/s10584-005-1146-9
Simó R. (2001). Production of Atmospheric Sulfur by Oceanic Plankton: Biogeochemical, Ecological and Evolutionary Links. Trends Ecol. Evol. 16, 287–294. doi: 10.1016/S0169-5347(01)02152-8
Stefels J. (2000). Physiological Aspects of the Production and Conversion of DMSP in Marine Algae and Higher Plants. J. Sea. Res. 43, 183–197. doi: 10.1016/S1385-1101(00)00030-7
Sunda W., Kieber D. J., Kiene R. P., Huntsman S. (2002). An Antioxidant Function for DMSP and DMS in Marine Algae. Nature 418, 317–320. doi: 10.1038/nature00851
Swan H. B., Ivey J. P., Jones G. B., Eyre B. D. (2015). The Validation and Measurement Uncertainty of an Automated Gas Chromatograph for Marine Studies of Atmospheric Dimethylsulfide. Analyt. Methods 7, 3893–3902. doi: 10.1039/C5AY00269A
Swan H. B., Jones G. B., Deschaseaux E. S. M., Eyre B. D. (2017). Coral Reef Origins of Atmospheric Dimethylsulfide at Heron Island, Southern Great Barrier Reef, Australia. Biogeosciences 14, 229–239. doi: 10.5194/bg-14-229-2017
Wang J., Sun S., Qin P., Wang J., Zhong C., Xin W. (2009). “DMS and CH4 Fluxes Along an Elevational Gradient of a Coastal Salt Marsh, East China: Positive Correlations”, in Bioinformatics and Biomedical Engineering (IEEE, China: ICBBE 2009. 3rd International Conference on: IEEE), 1–6.
Wanninkhof R. (2014). Relationship Between Wind Speed and Gas Exchange Over the Ocean Revisited. Limnol. Oceanogr.: Methods 12, 351–362. doi: 10.4319/lom.2014.12.351
Weber T., Wiseman N. A., Kock A. (2019). Global Ocean Methane Emissions Dominated by Shallow Coastal Waters. Nat. Commun. 10, 1–10. doi: 10.1038/s41467-019-12541-7
Weiss R. F. (1974). Carbon Dioxide in Water and Seawater: The Solubility of a non-Ideal Gas. Mar. Chem. 2, 203–215. doi: 10.1016/0304-4203(74)90015-2
Keywords: fluxes, great barrier reef, biogenic volatile organic compounds (BVOCs), greenhouse gases (GHGs), aerosol particles, Heron Island
Citation: Deschaseaux ESM, Swan HB, Maher DT, Jones GB, Schulz KG, Koveke EP, Toda K and Eyre BD (2022) The Interplay Between Dimethyl Sulfide (DMS) and Methane (CH4) in a Coral Reef Ecosystem. Front. Mar. Sci. 9:910441. doi: 10.3389/fmars.2022.910441
Received: 01 April 2022; Accepted: 04 May 2022;
Published: 20 June 2022.
Edited by:
Cliff Ross, University of North Florida, United StatesReviewed by:
Gael John Lecellier, Université de Versailles Saint-Quentin-en-Yvelines, FranceSohiko Kameyama, Hokkaido University, Japan
Copyright © 2022 Deschaseaux, Swan, Maher, Jones, Schulz, Koveke, Toda and Eyre. This is an open-access article distributed under the terms of the Creative Commons Attribution License (CC BY). The use, distribution or reproduction in other forums is permitted, provided the original author(s) and the copyright owner(s) are credited and that the original publication in this journal is cited, in accordance with accepted academic practice. No use, distribution or reproduction is permitted which does not comply with these terms.
*Correspondence: Elisabeth S. M. Deschaseaux, ZWxpc2FiZXRoLmRlc2NoYXNlYXV4QGdtYWlsLmNvbQ==