- 1Faculty of Earth and Marine Convergence, Jeju National University, Jeju, South Korea
- 2Department of Earth and Marine Science, Jeju National University, Jeju, South Korea
- 3Jet Propulsion Laboratory, California Institute of Technology, Pasadena, CA, United States
Previous studies have suggested that westward-migrating mesoscale eddies are a dominant factor that modulate the interannual Kuroshio intensity in the East China Sea (ECS), indicating a close positive correlation between them. According to the extended record of altimetry-based sea level anomalies (SLAs) until 2020, however, the interannual variation of the Kuroshio intensity no longer has a strong positive correlation with eddy activity in the subtropical countercurrent (STCC) region since the early 2000s. Our observational analyses showed that the Kuroshio intensity in the ECS can be modulated by the combined effect of westward-migrating mesoscale eddies and westward-propagating oceanic planetary waves from the east. Until the early 2000s, the interannual variability of Kuroshio was mainly affected by eddy migration from the STCC region, associated with oceanic instability driven by large-scale wind patterns over the western North Pacific. Since then, oceanic planetary waves propagating westward across the Pacific basin have largely modulated the interannual variability of the ECS-Kuroshio intensity by superimposing the SLAs related to mesoscale eddies that propagated towards the east of Taiwan.
Introduction
The Kuroshio Current, entering the East China Sea (ECS) through the east Taiwan channel, transports heat northward from the tropics, and its variability plays an important role in modulating the regional ocean and climate along its path (Yang et al., 2018; Gan et al., 2019). The Kuroshio Current along the ECS shelf break fluctuates at various timescales, ranging from intraseasonal to decadal (Johns et al., 2001; Zhang et al., 2001; Hsin et al., 2011; Lien et al., 2014; Chang et al., 2015; Lien et al., 2015; Yang et al., 2015; Wang et al., 2019). Most research attention has been given to understanding the high-frequency variability (i.e., several days to seasonal) of the Kuroshio intensity related to mesoscale eddies arriving in the area east of Taiwan (Yang et al., 1999; Qiu, 1999; Johns et al., 2001). However, because of the limited in situ measurements available at longer timescales, the Kuroshio variability on interannual and longer timescales is currently poorly understood.
Recent advances in satellite altimetry have enabled the estimation of the interannual Kuroshio variability in the ECS. Using altimetry records from 1993 to 2008, (Andres et al, 2011) showed a strong correlation between the intensity of Kuroshio volume transport and the Pacific Decadal Oscillation (PDO) index on interannual to decadal timescales that resulted from dynamical oceanic responses (i.e., barotropic and baroclinic modes) to the PDO-related large-scale wind stress curl (WSC) pattern. Meanwhile, recent studies have suggested that mesoscale eddies propagating westward from the Subtropical Countercurrent (STCC) region play a crucial role in modulating the interannual variability of the Kuroshio Current in the ECS (Hsin et al., 2011; Yan et al., 2016). Based on altimetry sea surface height (SSH) and 29 years of tide-gauge data, Chang and Oey (2011) found a strong positive correlation between the Kuroshio intensity and eddy activity in the STCC. They argued that the interannual variability of the Kuroshio transport is directly affected by its interaction with westward-propagating eddies from the STCC band within 20–23°N. Eddy activity is also related to the baroclinic instability of the North Equatorial Current (NEC)-STCC system driven by the WSC pattern over the western North Pacific, which is consistent with the findings of Qiu and Chen, 2010; Qiu and Chen, 2013). According to their studies, the interannual modulation of eddy kinetic energy (EKE) in the STCC region is attributed to the variation in baroclinic instability caused by PDO-related wind forcing and surface heat flux forcing. Hsin et al. (2013) also reported that the interannual variability of the Kuroshio east of Taiwan is modulated by westward-propagating eddies induced by large-scale wind forcing in the western North Pacific, emphasizing the contribution of the relative intensity of anticyclonic versus cyclonic eddies east of Taiwan. Although there is still debate about the cause of the variability of the Kuroshio intensity, most studies mentioned above agree on the impact of PDO-related eddy activities in the STCC region on the interannual modulation of the Kuroshio in the ECS.
On the other hand, recent analyses of observations and ocean models have revealed that the high coherence between the Kuroshio intensity and PDO index has deteriorated since the late 1990s and/or the early 2000s (Nakamura et al., 2012; Soeyanto et al., 2014; Wu et al., 2019b). Soeyanto et al. (2014) found that the well-known correlation between the two has disappeared since roughly 2002. A more recent analysis by Wu et al. (2019b) supported this disassociation of the ECS-Kuroshio with the PDO, yielding an insignificant correlation of 0.03 for the period 1993–2013. They discussed that the disassociation may be related to changes in atmospheric circulation during a warming “hiatus” in the 2000s, which is closely linked to the phase shift of PDO (England et al., 2014; Maher et al., 2018).
The Kuroshio Current plays an important role in weather and climate through heat transport and air–sea interaction processes. Therefore, it is essential to understand how and why the Kuroshio intensity has changed over the past decades. Despite the importance of the climate system, the following aspects remain unclear: (i) the dominant mode that represents changes in the Kuroshio intensity in the ECS, (ii) how Kuroshio transport has varied interannually over the past three decades, and (iii) the key factors that modulate the interannual variability of Kuroshio intensity in the ECS. Herein, these issues are revisited by analyzing an extended record of satellite altimetry datasets until 2020 and several climate datasets
Data And Methods
Data
Satellite altimetry products from 1993 to 2020 were used in this study. The gridded daily sea level anomaly (SLA) and geostrophic velocity were obtained from the Copernicus Climate Change Service (C3S; https://cds.climate.copernicus.eu/), which was previously distributed by AVISO. These gridded altimetry products had a resolution of 1/4°×1/4°. The monthly averaged data fields were computed from daily altimetry data over the 28-year period.
To identify mesoscale eddy activities, the eddy kinetic energy (EKE) was calculated from gridded altimetry data based on geostrophic balance.
where u′ and v′ indicate the surface geostrophic current anomalies, , , h′ notes the SLA, f is the Coriolis parameter, and g is the gravitational acceleration. In addition, we used the EKE product produced by AVSIO (https://www.aviso.altimetry.fr/en/) to validate the calculated EKE field. The comparison indicated no difference between the two EKE fields; thus, the results from the AVISO product are presented in this paper.
The surface wind data used in this study were the ERA5 reanalysis product from the European Center for Medium-Range Weather Forecasts (ECMWF). NCEP/NCAR reanalysis-1 data from the National Centers for Environmental Prediction (https://psl.noaa.gov/data/gridded/data.ncep.reanalysis.html) were also used for comparison. Monthly gridded data with a resolution of 1/4° are available at C3S. PDO was also used to represent the climate variability over the western North Pacific. The monthly time series of the PDO index were obtained from the National Centers for Environmental Information of NOAA (https://www.ncdc.noaa.gov/teleconnections/pdo/). The results of two ocean reanalysis products, Hybrid Coordinate Ocean Model (HYCOM; http://tds.hycom.org/thredds/catalogs/GLBv0.08/expt_53.X.html) and Global Reanalysis (GLORYS; https://resources.marine.copernicus.eu/products/), were examined to confirm the robustness of the Kuroshio intensity in the ECS.
An empirical relationship between the Kuroshio volume transport (KVT) and sea level difference (SLD) from altimetry-based SLAs proposed by Yan and Sun (2015) was used as a proxy for the Kuroshio transport east of Taiwan.
The SLD between two locations (123.5°E, 24°N and 123.25°E, 27.25°N) was used as an optimal estimator for the KVT to the east of Taiwan. Yan and Sun (2015) suggested that this altimetry-based index serves as a good proxy for volume transport of the Kuroshio east of Taiwan.
In addition, we also utilized the result of an ocean general circulation model (OGCM), which was configured globally with a 1° spatial resolution with 30 layers (Cha et al., 2018). The ocean circulation model is the Regional Ocean Modeling System (ROMS), which is a free surface primitive equation utilized by a broad community for applications from the coastal to basin scales (Haidvogel et al., 2000; Shchepetkin and McWilliams, 2005). The model was initialized using the climatological World Ocean Atlas (Levitus et al., 2009) and was spun up for 60 years from its initial state using the ECMWF monthly climatology. After spin-up time the model was integrated using the monthly ECMWF forcing from 1979 to 2020. Here, we used the SSH of model outputs from 1993 to 2020 to compare with that from altimeters. A detailed model configuration was provided in Cha et al. (2018).
Ensemble Empirical Model Decomposition (EEMD)
To extract the variability of the KVT index with time, we used ensemble empirical mode decomposition (EEMD), which has been widely used in geophysical applications (e.g., Franzke, 2010; Ji et al., 2014; Kidwell et al., 2014; Cha et al., 2021). The EEMD method is based on empirical mode decomposition (EMD), which is designed to decompose nonstationary signals into intrinsic mode functions (IMFs) with a long-term adaptive trend, i.e., residue (Huang et al., 1998; Huang and Wu 2008). The IMFs of EEMD were obtained as an ensemble average of IMFs that were decomposed from the original time series with the addition of Gaussian white noise by EMD. This advanced method resolves the mode-mixing problem caused by intermittent signals in the original EMD (for more details, see Wu and Huang 2008). The EEMD results for the KVT east of Taiwan and the associated significance test are shown in Supplementary Figures 1, 2.
Results
Interannual Variability of Kuroshio Intensity in the ECS
The KVT east of Taiwan estimated using a linear regression method (Eq. 2) proposed by Yan and Sun (2015) is presented in Figure 1A. The volume transport averaged over 1993–2020 is approximately 20.7 Sv, with a standard deviation of 2.6 Sv, consistent with previous studies (e.g., Johns et al., 2001; Chang et al., 2015; Yan and Sun, 2015). After removing high-frequency variations, the empirical estimate of KVT exhibited a distinct interannual variability in amplitude, with peaks in 1996, 2004, and 2008 and minima in 2000 and 2013. The interannual Kuroshio transport was also well captured by the first non-seasonal empirical orthogonal function (EOF) mode of the satellite-based surface absolute velocity, which accounted for 27% of the total variance. The linear correlation coefficient between the principal component and the estimated KVT reached 0.9 (significant above the 99% level), indicating the robustness of the interannual Kuroshio intensity in the ECS. The spatial pattern of the first EOF mode showed that a strong signal occupied the mainstream of the Kuroshio Current along the ECS shelf break, with a maximum in northeast Taiwan (Figure 1B). The result of the EOF mode implies that the Kuroshio Current along the shelf break becomes stronger during the positive phase. Thus, the Kuroshio Current in the ECS is characterized by strong interannual variations in the Kuroshio intensity, which strengthen (weaken) when the SLD across the Kuroshio is high (low). The comparison between the estimated KVT and EOF analysis suggests that the interannual mode of the Kuroshio Current reported here is distinctly associated with the SLD across the Kuroshio, resulting in changes in the Kuroshio transport and its intensity along the ECS shelf break.
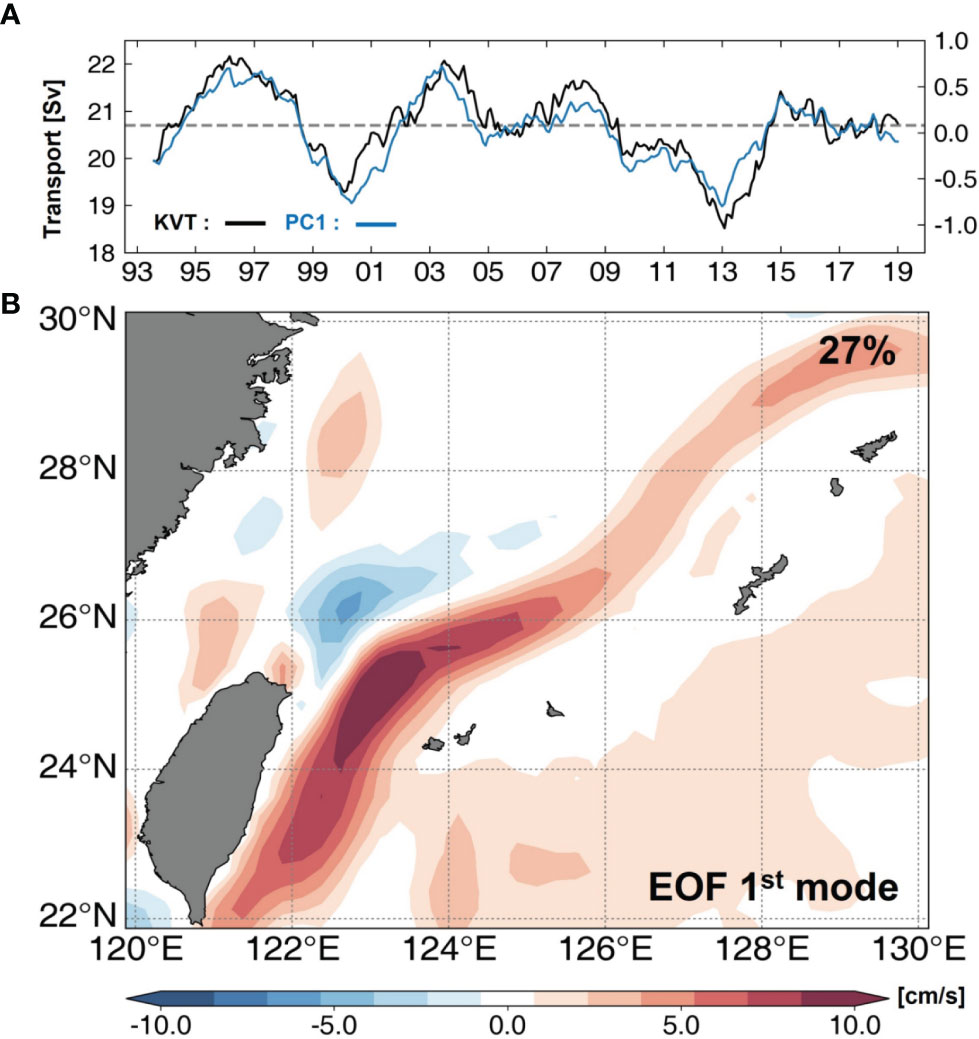
Figure 1 (A) Time series of the monthly KVT (black) and principal component (PC) of first mode for satellite-based surface velocity (blue) over 1993–2020. Two-year moving average was applied to both KVT and PC time series. Grey dashed line indicates the average of the KVT (20.7Sv) over the period. (B) Spatial pattern of first-leading mode of geostrophic velocity in the ECS region.
The two reanalysis products of HYCOM and GLORYS also showed an interannual variation in the Kuroshio intensity, which agreed well with the pattern from the altimetry-based datasets (Supplementary Figure 3). In addition, the composite analysis for SLAs sorted according to the phase of the low-pass filtered KVT further supported the interannual fluctuation of ECS-Kuroshio, showing high (low) SLD across the Kuroshio during periods of strong (weak) KVT (Figure 2). An interesting feature is that the strongest SLA signals were mainly detected in eastern Taiwan, extending eastward along the latitude band of 20–23°N. This SLA pattern corresponds to the region with abundant eddies, which is called the eddy zone (Qiu, 1999; Chelton et al., 2011). These results demonstrate the robust interannual variability of the Kuroshio intensity in the ECS, which may be associated with SLAs propagating from the interior ocean, such as mesoscale eddy migrations (Chang and Oey, 2011; Chang et al., 2015).

Figure 2 Composite maps of SLAs during the positive (A) and negative (B) periods of the KVT east of Taiwan. The positive (negative) period is referred to when the Kuroshio intensity (black line of Figure 1A) is above (below) the average.
Kuroshio Intensity Associated With Mesoscale Eddy Activities
Several studies have shown that Kuroshio transport can be influenced by westward-propagating eddies generated in the STCC, colliding with the east coast of Taiwan (Chang et al., 2015). Mesoscale eddy activities are closely related to the vertical shear instability produced by the interaction between the eastward STCC and westward NEC in the subsurface layer (Qiu and Chen, 2010; Chang and Oey, 2012; Qiu and Chen, 2013; Chang and Oey, 2014). Wind patterns over the NEC-STCC system can thus provide favorable conditions for the generation of eddies by changing the EKE owing to baroclinic instability. Qiu and Chen (2013) showed the interannual to decadal variability of the EKE in the STCC, which is related to the PDO-like large-scale WSC pattern. Hsin et al. (2013) also reported a correlation between the KVT east of Taiwan and the PDO index.
To identify the relationship between Kuroshio and PDO-related eddy activities, we compared the KVT east of Taiwan with the EKE over the STCC and the PDO index on an interannual time scale (Figure 3). During 1993–2003, the EKE and PDO indices were well correlated with the KVT east of Taiwan with correlation coefficients of 0.82 and 0.91, respectively. These high positive correlations provide strong support for the results of previous studies that indicated that PDO-like wind patterns and subsequent eddy activities in the STCC can modulate the interannual KVT east of Taiwan (Hsin et al., 2013). However, the correlation coefficients have decreased markedly over the past decade, down to 0.23 and 0.5, respectively, disagreeing with the mechanism proposed by the above-mentioned studies. This disagreement is also evident from the correlation patterns between the KVT east of Taiwan and the WSC over the western North Pacific (0–30°N, 120–170°W) on an interannual timescale (Figure 4). Before the early 2000s, the dominant correlation pattern was a strong north–south dipole in the western North Pacific, with a positive correlation in the NEC region and a negative correlation in the STCC region, similar to the PDO pattern (Supplementary Figure 4). This PDO-related wind pattern plays an important role in determining the mesoscale eddy activities in the STCC owing to the baroclinic instability of the NEC–STCC system (Qiu and Chen, 2013). In contrast, the dipole WSC pattern has not persisted since the early 2000s, disagreeing with the mechanism proposed by previous studies that indicated that the Kuroshio intensity could be modulated by PDO-related eddy activities in the STCC and their migration to the west. The NCEP/NCAR reanalysis-1 also showed a similar pattern (Supplementary Figure 4).
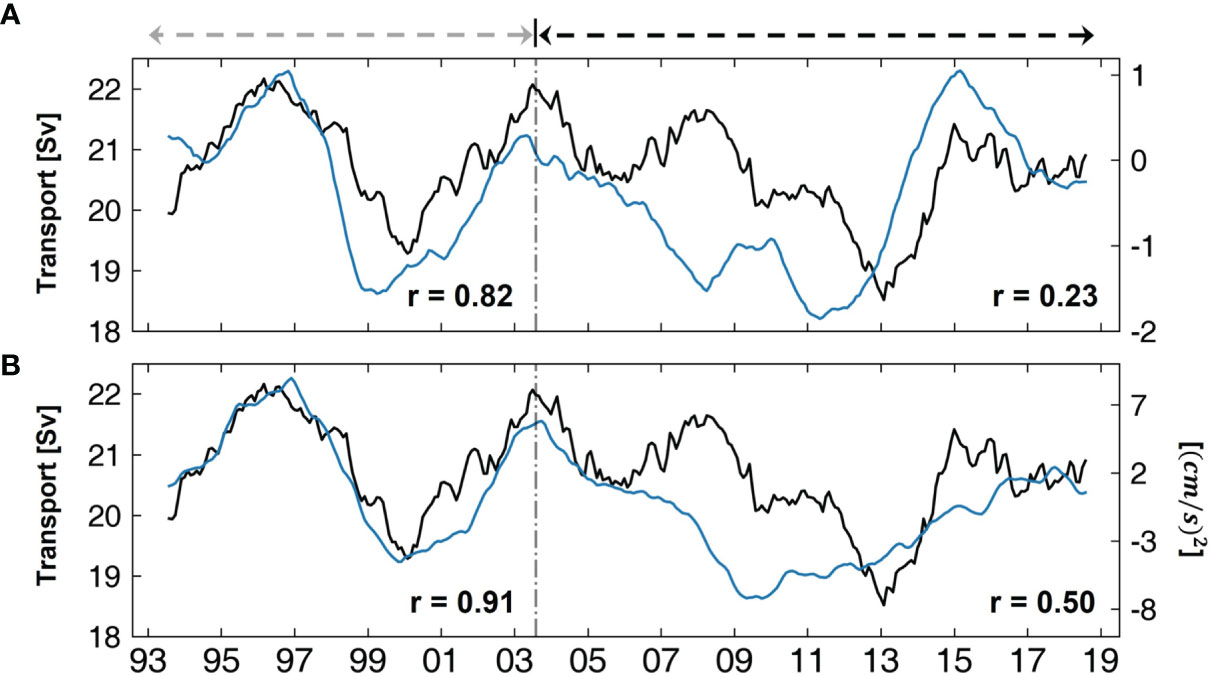
Figure 3 Comparison of the KVT east of Taiwan (black) time series with (A) PDO index (blue) and (B) EKE index (blue) averaged over the STCC region (10°–30°N, 125°–110°W) in the western North Pacific. The correlation coefficients are computed for two periods: before and after 2003 (vertical grey dashed lines).
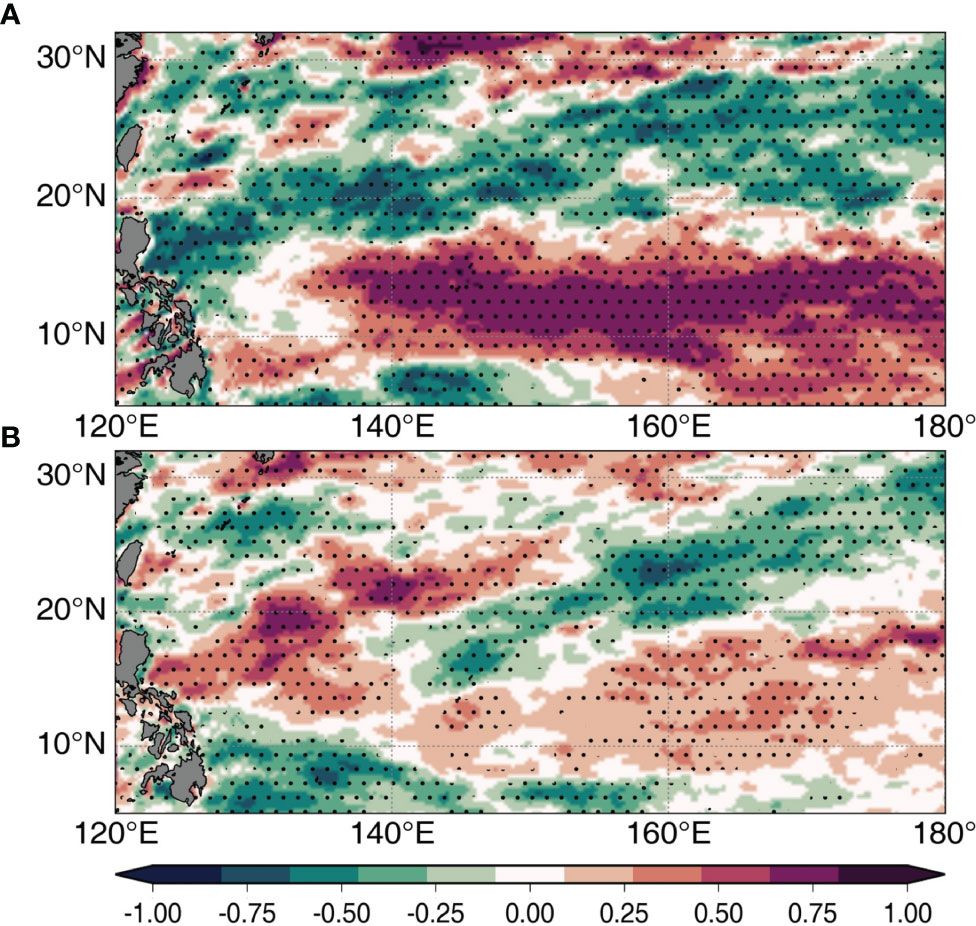
Figure 4 Correlation maps of wind stress curl (WSC) over the western North Pacific with the KVT east of Taiwan during the periods of (A) 1993–2003 and (B) 2004–2019. Two-year moving average was applied to the WSC data. Dotted areas denote the significance level above 99%.
To further clarify the effect of mesoscale eddies on the KVT east of Taiwan, EOF analysis was conducted on the temporally-varying EKE on an interannual timescale (Figure 5). The spatial pattern of the first EOF mode mainly corresponds to mesoscale structures in the region east of Taiwan (Figure 5A). This mode is associated with SLAs, which reflect mesoscale eddies that propagate from the STCC region. The principal time series was highly correlated with the KVT east of Taiwan before 2003 (r = 0.8, significance above the 99% confidence level), indicating that the migration of eddies modulated the Kuroshio intensity along the ECS on an interannual timescale (Figure 5B). This result further supports the results of Chang and Oey (2011). However, the strong relationship between the Kuroshio intensity and eddies has decreased since 2003, showing a poor correlation coefficient of 0.01. The correlation maps between the time series of the EKE east of Taiwan and the low-pass filtered SLAs in the western North Pacific further confirm the change in the response of the SLAs to eddy activity in the region east of Taiwan (Figure 6). Prior to the early 2000s, the EKE east of Taiwan was positively correlated with SLAs, showing a tilted band structure extending from the east of Taiwan to approximately 145°E. This pattern is consistent with the eddy zone in the STCC, but a different correlation pattern appeared after the early 2000s. High correlations were observed in the central and eastern North Pacific, gradually decreasing towards the west along the zonal bands. These results confirm that the influence of the eddy activity east of Taiwan on the interannual Kuroshio intensity has weakened since the early 2000s. Thus, the poor correlation suggests that the mesoscale eddy activities in the STCC region and their arrival on the east coast of Taiwan are no longer the dominant factors that modulate the interannual Kuroshio intensity along the ECS.
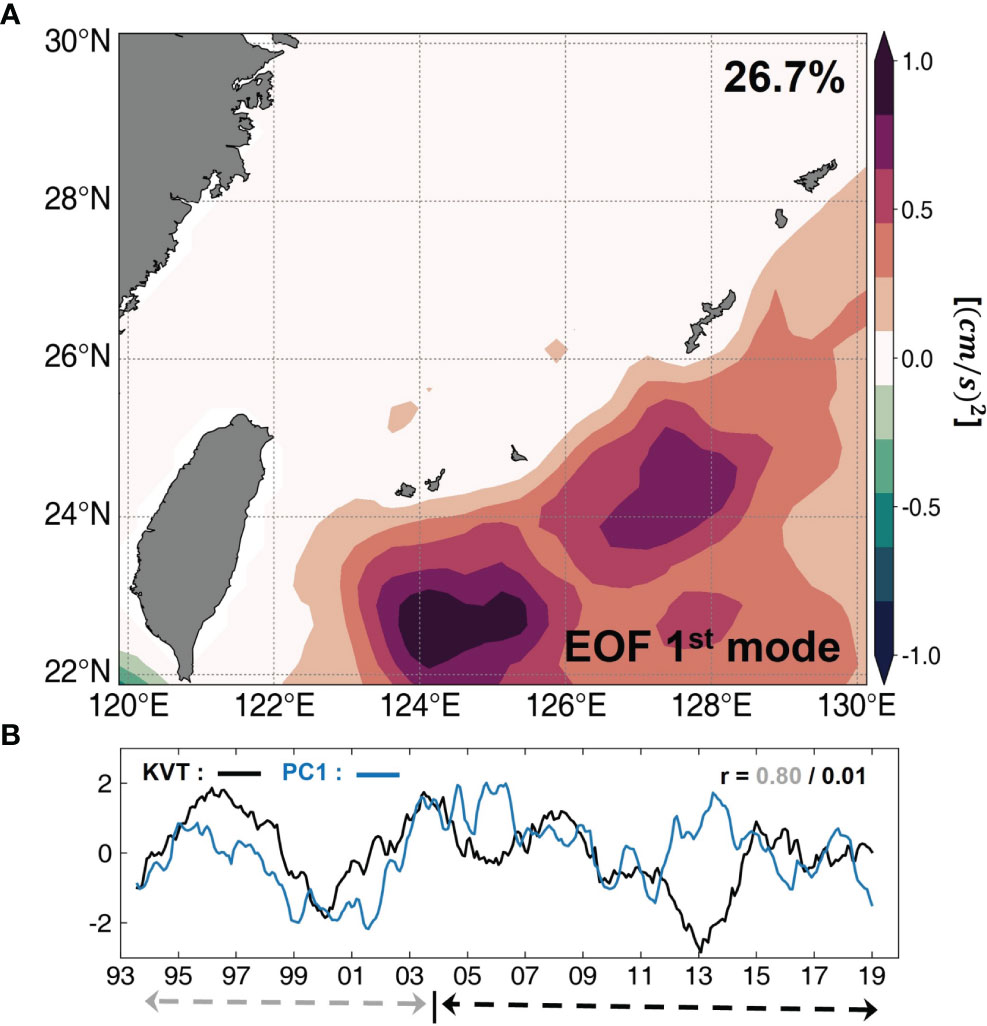
Figure 5 (A) Spatial pattern of the EOF first leading mode of the EKE in the east of Taiwan, which accounts for 26.7% of the total variance. (B) Time series of the KVT east of Taiwan (black) and the PC (blue) of the leading mode. Both time series were smoothed by two-year moving average. The correlation coefficients are computed for two periods: before and after 2003.
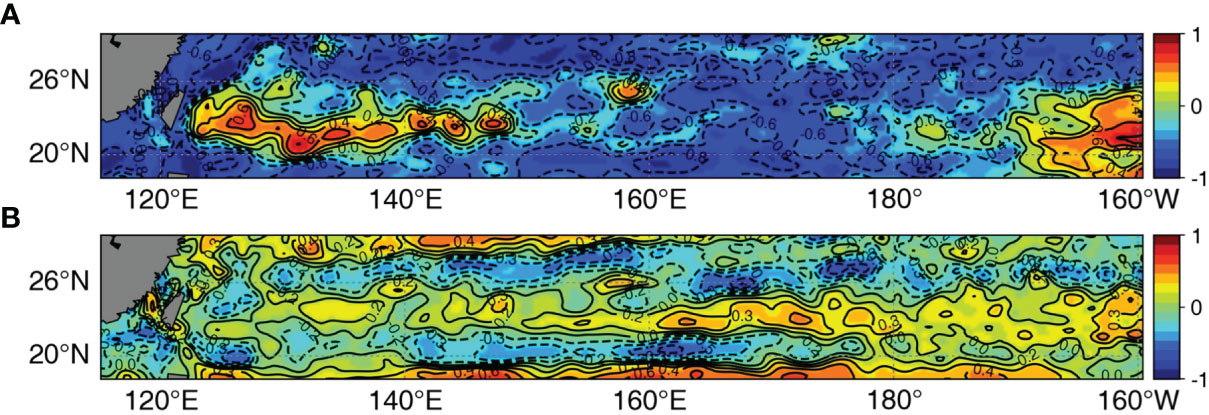
Figure 6 Correlation maps of SLAs with the EKE index during the periods of (A) 1993–2003 and (B) 2004–2019.
SLAs Propagating Westward From Central and Eastern North Pacific
As aforementioned, the interannual KVT in the ECS is determined by the SLD across the Kuroshio Current, which can be changed by SLAs east of Taiwan. To identify the SLA responses to the Kuroshio intensity, we computed the composite mean SLAs according to the strong (1995–1998 and 2006–2009) and weak (1999–2002 and 2012–2014) periods of the KVT on an interannual time scale (Figure 7). As expected, the results showed that a high (low) SLA persisted in eastern Taiwan at times when the KVT was strong (weak). However, the spatial patterns of SLAs according to the phase of the KVT were quite different before and after the early 2000s. Before 2003, strong positive and negative SLAs were confined only from the east of Taiwan to approximately 145°E along the latitude band of 20–23°N, consistent with the eddy zone in the STCC region (Figures 7A, B). However, after the early 2000s, the SLAs were characterized by a zonally elongated band structure extending from the east coast of Taiwan to the central and eastern North Pacific (Figures 7C, D). These SLA patterns further support our results, indicating that the interannual variability of Kuroshio intensity was mainly modulated by the migration of eddies from the STCC region until the early 2000s, but that their relationship no longer holds since then.
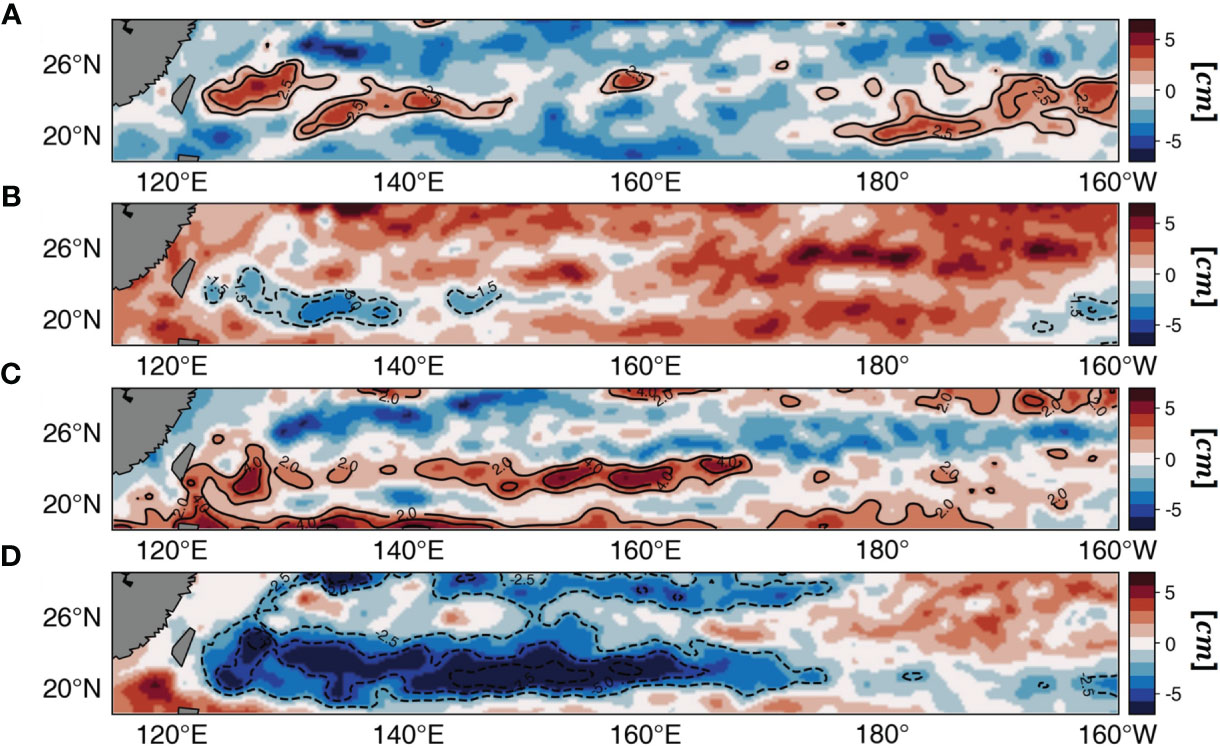
Figure 7 Composite maps of SLAs according to strong years of (A) 1995–1998 and (C) 1999–2002 and weak years of (B) 2006–2009 and (D) 2012–2014 on the KVT east of Taiwan.
Our analysis suggests that over the past three decades, the Kuroshio intensity has been influenced by not only eddy activities but also other modes on an interannual time scale. To capture the dominant modes of the KVT east of Taiwan, we used the EEMD method, which is designed to separate the original time series into several IMFs and a residual trend (Huang et al., 1998; Huang and Wu 2008). The EEMD results yielded seven IMFs and residues in ascending order from high to low frequencies (Supplementary Figure 1). Distinct interannual and subdecadal fluctuations with peak periods of ~3 and ~7 years, respectively, were identified in the KVT east of Taiwan, which can explain most of the interannual variability in the Kuroshio intensity over the past three decades (Figures 8A, B). Notably, these two modes clearly represent different spatial patterns of SLAs, as shown in the SLA regression with regard to the interannual and subdecadal modes (Figures 8C, D). The EEMD-determined interannual mode exhibited a spatial pattern of mesoscale eddy activity confined to the STCC eddy zone, similar to the pattern of the composite mean SLAs before the early 2000s (see Figures 7A, B). This mode, associated with westward-migrating eddies from the STCC region, explains the interannual modulation of the KVT east of Taiwan until the early 2000s, consistent with the findings of Soeyanto et al. (2014). In contrast, the regression map of SLA for the subdecadal mode represents the zonally elongated band at 20–23°N, which may be linked to the westward propagation of oceanic planetary waves from the central and eastern North Pacific. Unlike the interannual eddy mode, the subdecadal mode became stronger in amplitude after the early 2000s, indicating that the low-frequency variability contributed more to modulating the ECS-Kuroshio intensity through westward-propagating SLAs. To identify the surface wind patterns associated with these modes, we have projected the wind stress pattern in the Pacific upon the interannual and subdecadal modes by a linear regression approach (Figure 9). The interannual mode corresponds to wind patterns at mid- and high latitudes (north of 40°N) in the North Pacific, describing a large amplitude oscillation (Figure 9A). This pattern resembles the general pattern of PDO, showing consistency with our finding that the interannual KVT mode is linked to the PDO-related mesoscale eddy activities in the STCC region. On the other hand, the subdecadal mode is mainly driven by strong wind oscillation centered at 30°N in the central/eastern North Pacific (Figure 9B), which is different from the PDO-related wind pattern. A recent study by Wu et al. (2019b) found that the Pacific climate conditions favored the North Pacific Gyre Oscillation-like pattern since 1999 to replace the PDO, thereby showing significant variability over the central/eastern Pacific. This alternation of wind pattern since late 1990s probably contributes to low-frequency SLAs that propagate westward across the North Pacific.
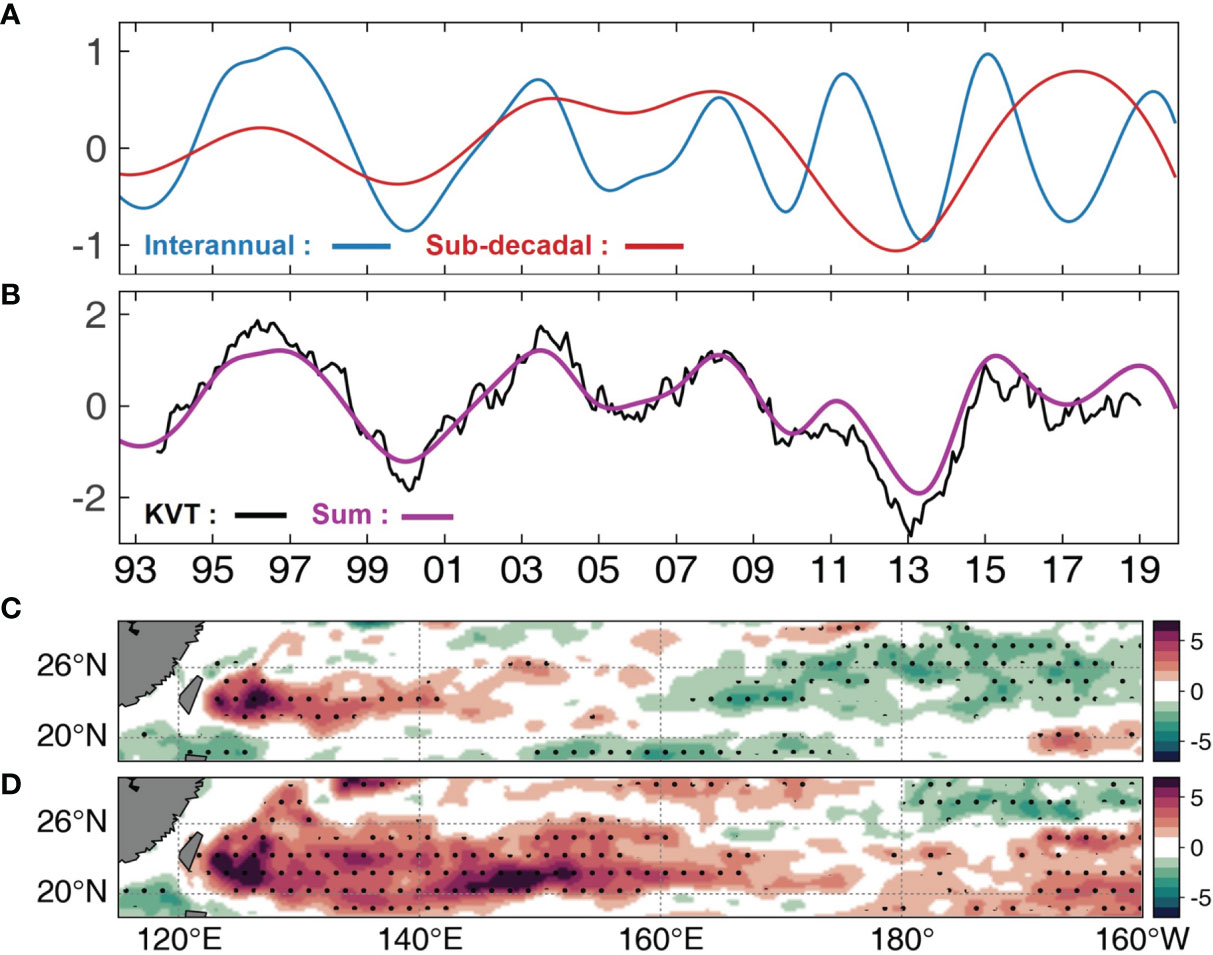
Figure 8 (A) Interannual (red) and sub-decadal (blue) modes of the KVT east of Taiwan extracted by EEMD method from 12-month low-passed filtered KVT time series. (B) Time series of the KVT east of Taiwan (black) and the sum of EEMD-determined two modes (purple) in (A). Two time series are normalized by their standard deviation. Regression maps of SLAs against (C) the interannual and (D) sub-decadal mode over the period of 1993–2020. Dotted areas represent the significance level above 95%.
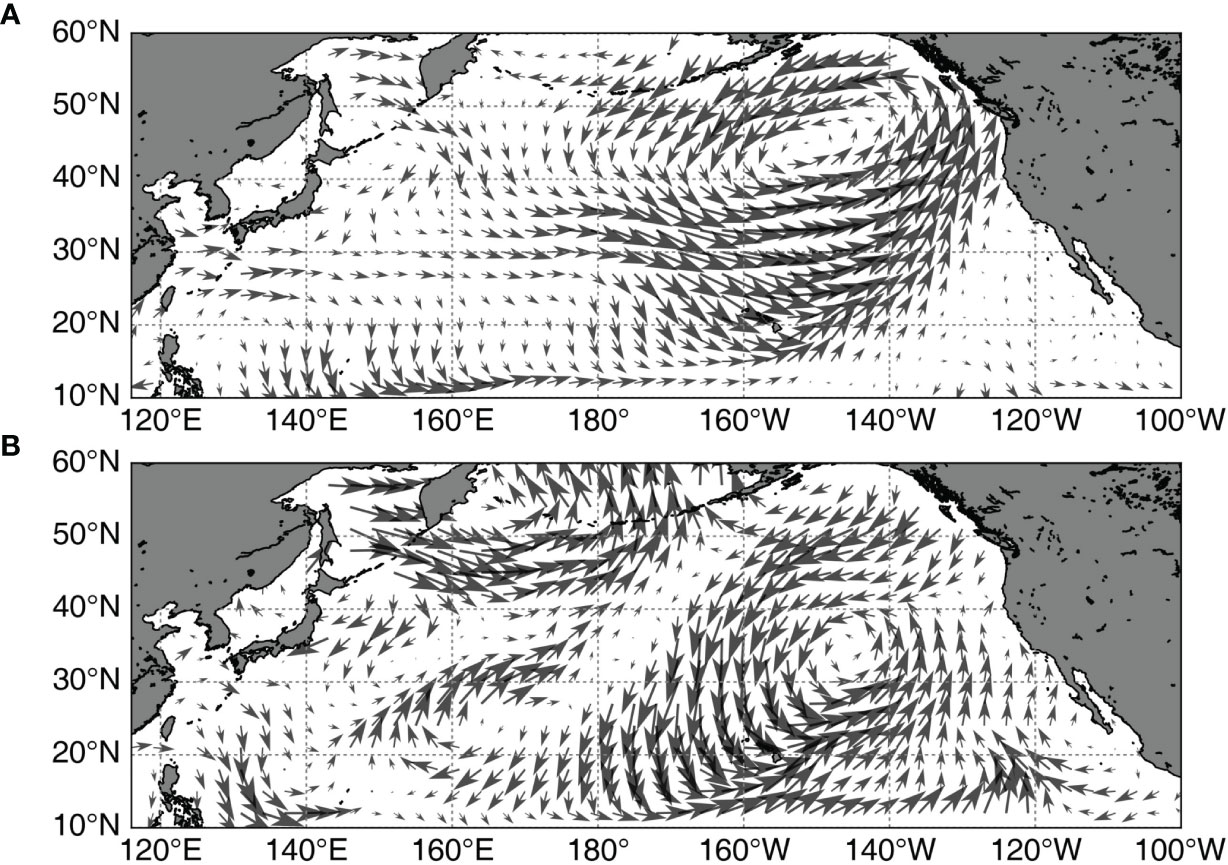
Figure 9 Regression maps of wind vectors against (A) the interannual and (B) sub-decadal mode over the period of 1993–2020. Two-year moving average was applied to the wind vectors of each grid point before regression.
The Hovmöller diagram of SLA along the 21.5–24°N band further supports the westward propagation of SLAs that modulate the KVT east of Taiwan (Figure 10). Prior to the early 2000s, the westward-propagating low and high SLAs were confined to the eddy zone in the STCC region. Since then, they have slowly traveled a long across the Pacific Basin, identified as the baroclinic Rossby waves. Assuming a propagation speed of approximately 5.5 cm s-1 in the latitude band of 22–24°N, the baroclinic waves take approximately 6.4 years to travel a distance of 110,000 km from the eastern boundary to the east coast of Taiwan (Chelton and Schlax, 1996; Andres et al., 2011). This is similar to the propagation speed estimated from the observed SLAs. To confirm the influence of wave propagation from the east on the modulation of the KVT, we also used the result of an OGCM, whose dynamic is dominated by wind-forced Rossby waves and Sverdrup balance. Notes that because the horizontal resolution is 1°, eddy activities generated by shear instability in the STCC region are not resolved in the OGCM (Figure 10C). Prior to early 2000s, the observed and modeled KVT east of Taiwan do not correlate well, suggesting that the model dynamics without mesoscale eddy generation are not dominant in producing the observed SLAs east of Taiwan. However, since 2000s the model result shows similar SLAs that propagated westward across the North Pacific as those from the altimeter. As expected, the ocean model fairly reproduced the westward-propagating SLAs from the east although their magnitude and speed were slightly weak and slow compared to those from the observation. The model-data comparison demonstrates that the observed SLAs east of Taiwan are influenced by both the mesoscale eddy activities and the westward propagation of wind-forced waves over the past three decades. This result is consistent with previous studies showing that the westward propagation of oceanic Rossby waves is linked to the modulation of Kuroshio intensity in the ECS (Andres et al., 2011; Wu et al., 2019b). Using the extended records of the SLA dataset until 2020, our results clarify that the interannual modulation of the Kuroshio intensity in the ECS is determined by a combination of two dominant modes: mesoscale eddy activities in the STCC driven by PDO-related oceanic instability (Qiu and Chen, 2013; Qiu and Chen, 2014) and low-frequency planetary waves traveling westward across the Pacific Basin (Fu and Qiu, 2002; Andres et al., 2011). These two modes contributed differently, depending on the time period, to the modulation of the ECS-Kuroshio intensity. Eddy activities in the STCC region have thus consistently fluctuated over the past three decades, whereas the low-frequency mode has strengthened since the early 2000s, thereby modulating the interannual variability of the Kuroshio intensity in the ECS.
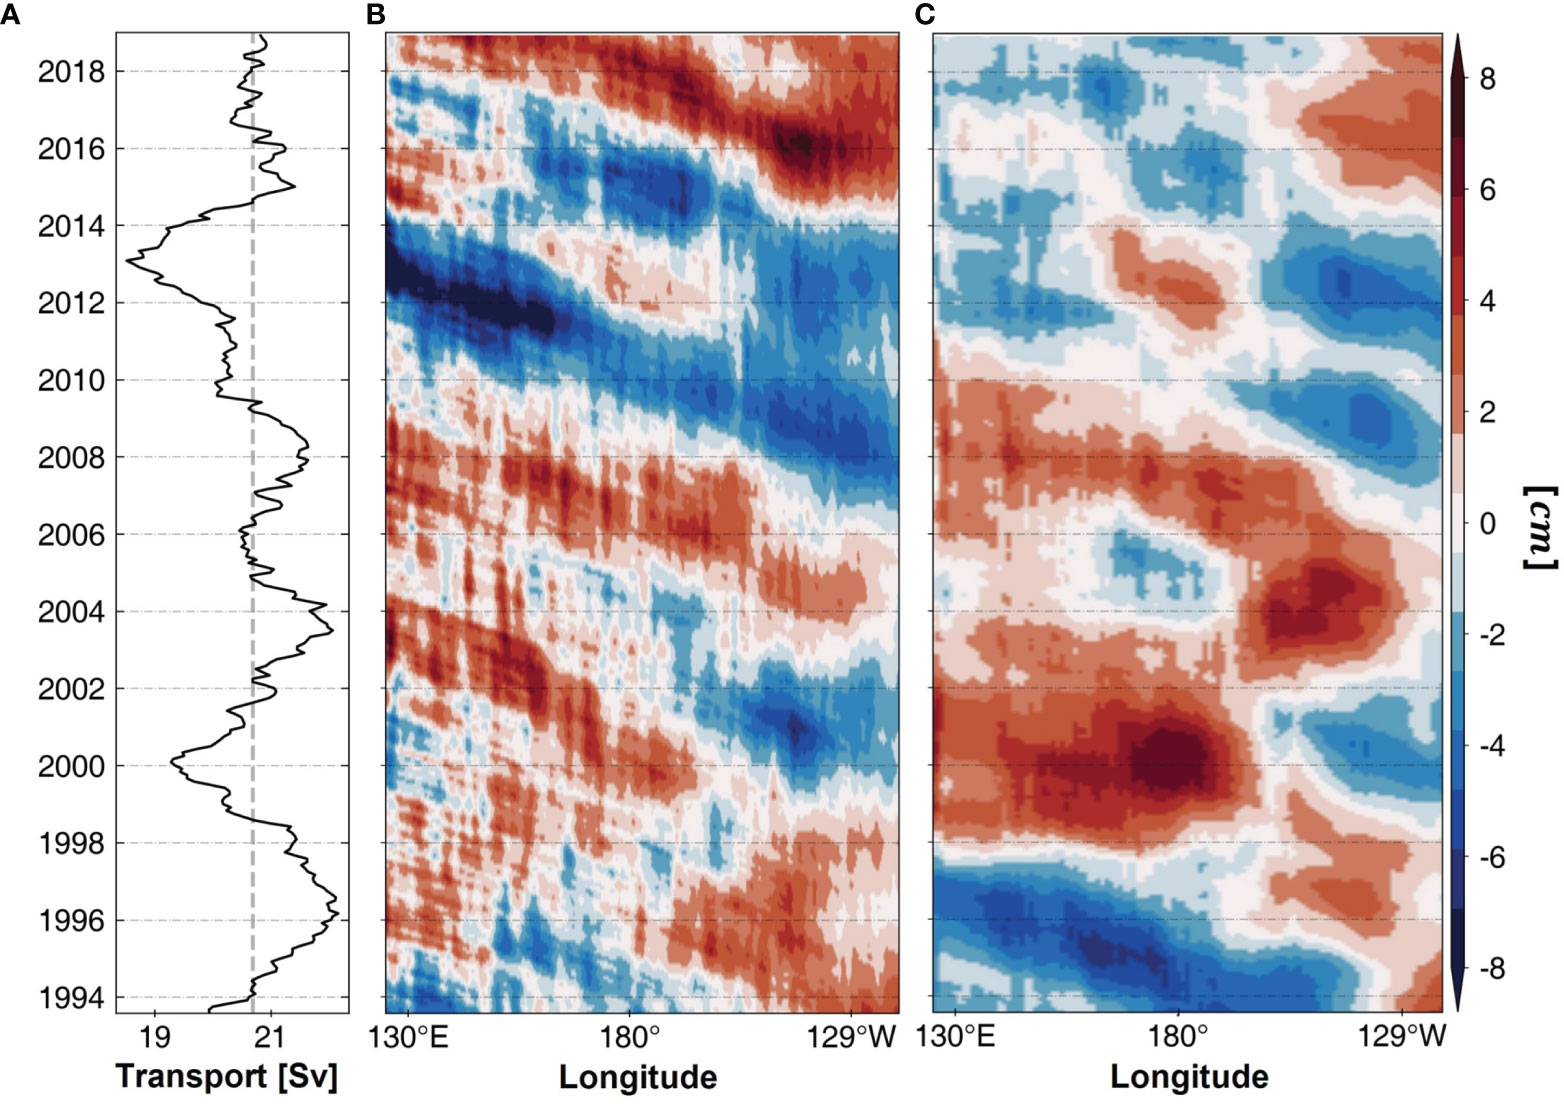
Figure 10 (A) Interannual variation of the KVT east of Taiwan over the period of 1994–2019. Hovmöller diagram of SLA of the (B) altimeters and (C) OGCM result along the latitude band of 21.5–24N Two-year moving average was applied to the data. Grey dashed line represents the mean value of the KVT east of Taiwan over the period.
Conclusion
Understanding the changes in the ECS-Kuroshio intensity can provide important information on the ocean’s role in modulating the regional climate system. In this study, we conducted observational analyses to investigate Kuroshio intensity in the ECS and its modulation on an interannual timescale. The extended record of SLAs exhibited a distinct interannual variability of the ECS-Kuroshio intensity, which is positively correlated with mesoscale eddy activities in the STCC region and provides observational support for previous studies, indicating the important role played by mesoscale eddies associated with baroclinic instability in the STCC region. However, the interannual variation of the Kuroshio intensity no longer had a strong positive correlation with eddy activities after the early 2000s. Our analysis showed that the interannual modulation of Kuroshio intensity can be determined by a combination of westward-propagating mesoscale eddies from the STCC region and oceanic planetary waves from the east. The analysis using the EEMD method demonstrated that eddy activities in the STCC region have fluctuated consistently over the past three decades, whereas the low-frequency mode has become stronger since the early 2000s, thereby modulating the interannual variability of the Kuroshio intensity. Consequently, prior to the early 2000s, the interannual variability of the Kuroshio was mainly affected by the formation and propagation of eddies from the STCC region, associated with oceanic instability in the STCC-NCE system. However, since then, low-frequency waves propagating westward across the Pacific Basin have largely modulated the Kuroshio variability in the ECS by superimposing the variability associated with eddy activities.
Unlike mesoscale eddy activities, low-frequency variability has become stronger since the early 2000s, coinciding with the recent global warming hiatus. Several studies have reported that during the hiatus period, the western Pacific experienced remarkable decade-long shifts in atmospheric and oceanic circulation (e.g., England et al., 2014; Wu et al., 2016; Cha et al., 2018; Wu et al. 2019a). Although not the focus of this study, the low-frequency mode in the ECS-Kuroshio intensity may be linked to the decadal shift in the Pacific climate during the warming hiatus. This study may thus have implications on the decadal prediction of Kuroshio intensity in the ECS, which remains a challenging issue.
Data Availability Statement
The original contributions presented in the study are included in the article/Supplementary Material. Further inquiries can be directed to the corresponding author.
Author Contributions
J-HM conceived the study and wrote the initial draft of the paper; SJ processed all datasets, performed statistical analysis, and prepared figures; TK and YS coordinated the writing and discussion; HC provided ocean model result and analysis; and all authors contributed to the writing and revision of the manuscript. All authors contributed to the article and approved the submitted version.
Funding
This research was supported by Basic Science Research Program through the National Research Foundation of Korea (NRF) founded by the Ministry of Education (NRF-2021R1I1A2050261) and Basic Science Research Program to Research Institute for Basic Science (RIBS) of Jeju National University through the NRF funded by the Ministry of Education (2019R1A6A1A10072987). TK was funded by Basic Science Research Program through the NRF funded by the Ministry of Education, Korea (NRF-2020R1I1A1A01053137).
Conflict of Interest
The authors declare that the research was conducted in the absence of any commercial or financial relationships that could be construed as a potential conflict of interest.
Publisher’s Note
All claims expressed in this article are solely those of the authors and do not necessarily represent those of their affiliated organizations, or those of the publisher, the editors and the reviewers. Any product that may be evaluated in this article, or claim that may be made by its manufacturer, is not guaranteed or endorsed by the publisher.
Acknowledgment
We are grateful for publicly avaialble products: the gridded monthly sea level anomaly data, provided by Copernicus Climate Change Service; eddy kinetic energy data from AVISO; the surface wind data from NCEP and ECMWF; ocean reanalysis products from HYCOM and GLORYS.
Supplementary Material
The Supplementary Material for this article can be found online at: https://www.frontiersin.org/articles/10.3389/fmars.2022.909349/full#supplementary-material
References
Andres M., Kwon Y.-O., Yang J. (2011). Observations of the Kuroshio’s Barotropic and Baroclinic Responses to Basin-Wide Wind Forcing. J. Geophys. Res. Ocean. 116, C04011. doi: 10.1029/2010JC006863
Cha H., Moon J. H., Kim T. K., Song Y. T. (2021). Underlying Drivers of Decade-Long Fluctuation in the Global Mean Sea-Level Rise. Environ. Res. Lett. 16, 124064. doi: 10.1088/1748-9326/ac3d58
Cha S. C., Moon J. H., Song Y. T. (2018). A Recent Shift Toward an El Niño-Like Ocean State in the Tropical Pacific and the Resumption of Ocean Warming. Geophys. Res. Lett. 45 (21), 11885–11894. doi: 10.1029/2018GL080651
Chang Y. L., Miyazawa Y., Guo X. (2015). Effects of the STCC Eddies on the Kuroshio Based on the 20-Year JCOPE2 Reanalysis Results. Prog. Oceanogr. 135, 64–76. doi: 10.1016/j.pocean.2015.04.006
Chang Y. L., Oey L. Y. (2011). Interannual and Seasonal Variations of Kuroshio Transport East of Taiwan Inferred From 29 Years of Tide-Gauge Data. Geophys. Res. Lett. 38, L08603 doi: 10.1029/2011GL047062
Chang Y. L., Oey L. Y. (2012). The Philippines-Taiwan Oscillation: Monsoonlike Interannual Oscillation of the Subtropical-Tropical Western North Pacific Wind System and Its Impact on the Ocean. J. Clim. 25, 1597–1618 doi: 10.1175/JCLI-D-11-00158.1
Chang Y. L., Oey L. Y. (2014). Instability of the North Pacific Subtropical Countercurrent. J. Phys. Oceanogr. 44, 818–833. doi: 10.1175/JPO-D-13-0162.1
Chelton D. B., Schalax M. G., Samelson R. M. (2011). Global Observation of Nonlinear Mesoscale Eddies. Prog. Oceanogr. 91, 167–217. doi: 10.1016/j.pocean.2011.01.002
Chelton D. B., Schlax M. G. (1996). Global Observations of Oceanic Rossby Waves. Science 272, 234–238. doi: 10.1126/science.272.5259.234
England M. H., McGregor S., Spence P., et al. (2014). Recent Intensification of Wind-Driven Circulation in the Pacific and the Ongoing Warming Hiatus. Nat. Clim. Change 4, 222–227. doi: 10.1038/nclimate2106
Franzke C. (2010). Long-Range Dependence and Climate Noise Characteristics of Antarctic Temperature Data. J. Climate (JCLI) 23, 6074–6081. doi: 10.1175/2010JCLI3654.1
Fu L. L., Qiu B. (2002). Low-Frequency Variability of the North Pacific Ocean: The Roles of Boundary- and Wind-Driven Baroclinic Rossby Waves. J. Geophys. Res. Ocean. 107, 13–1–13–10. doi: 10.1029/2001JC001131
Gan M., Kwon Y.-O., Joyce T. M., Chen K., Wu L. (2019). Influence of the Kuroshio Interannual Variability on the Summertime Precipitation Over the East China Sea and Adjacent Area –. J Climate (JCLI) 32, 2185–2205. doi: 10.1175/JCLI-D-18-0538.1
Haidvogel D. B., Arango H. G., Hedstrom K., Beckmann A., Malanotte-Rizoli P., Shchepetkin A. F. (2000). Model Evaluation Experiments in the North Atlantic Basin: Simulations in Nonlinear Terrain-Following Coordinates. Dyn. Atmos. Ocean. 32, 239–281. doi: 10.1016/S0377-0265(00)00049-X
Hsin Y. C., Chiang T. L., Wu C. R. (2011). Fluctuations of the Thermal Fronts Off Northeastern Taiwan. J. Geophys. Res. Ocean. 116, C10005 doi: 10.1029/2011JC007066
Hsin Y. C., Qiu B., Chiang T. L., Wu C. R. (2013). Seasonal to Interannual Variations in the Intensity and Central Position of the Surface Kuroshio East of Taiwan. J. Geophys. Res. Ocean. 118, 4305–4316. doi: 10.1002/jgrc.20323
Huang N. E., Shen Z., Long S. R., Wu M. C., Shih H. H., Zheng Q., et al. (1998). The Empirical Mode Decomposition and the Hilbert Spectrum for Nonlinear and Non-Stationary Time Series Analysis. Proc. R. Soc. Lond. A. 454, 903–995. doi: 10.1098/rspa.1998.0193
Huang N. E., Wu Z. (2008). A Review on Hilbert-Huang Transform: Method and Its Applications to Geophysical Studies. Rev. Geophys. 46, RG2006. doi: 10.1029/2007RG000228
Ji F., Wu Z., Huang J., Chassignet E. P. (2014). Evolution of Land Surface Air Temperature Trend. Nat. Clim. Change 4, 462–466. doi: 10.1038/nclimate2223
Johns W. E., Lee T. N., Zhang D., Zantopp R. J., Liu C. T., Yang Y. (2001). The Kuroshio East of Taiwan: Moored Transport Observations From the WOCE PCM-1 Array. J. Phys. Oceanogr. 31, 1031–1053. doi: 10.1175/1520-0485(2001)031<1031:TKEOTM>2.0.CO;2
Kidwell A., Jo Y. H., Yan X. H. (2014). A Closer Look at the Central Pacific El Niño and Warm Pool Migration Events From 1982 to 2011. J. Geophys. Res. Ocean. 119, 165–172. doi: 10.1002/2013JC009083
Levitus S., Antonov J. I., Boyer T. P., Locarnini R. A., Garcia H. ,. E., Mishonov A. V. (2009). Global Ocean Heat Content 1955–2008 in Light Ofrecently Revealed Instrumentation Problems. Geophys. Res. Lett. 36, L07608. doi: 10.1029/2008GL037155
Lien R. C., Ma B., Cheng Y. H., Ho C. R., Qiu B., Lee C. M., et al. (2014). Modulation of Kuroshio Transport by Mesoscale Eddies at the Luzon Strait Entrance. J. Geophys. Res. Ocean. 119, 2129–2142. doi: 10.1002/2013JC009548
Lien R. C., Ma B., Lee C. M., Sanford T. B., Mensah V., Centurioni L. R., et al. (2015). The Kuroshio and Luzon Undercurrent East of Luzon Island. Oceanography 28, 54–63. doi: 10.5670/oceanog.2015.81
Maher N., England M. H., Gupta A. S., Spence P. (2018). Role of Pacific Trade Winds in Driving Ocean Temperatures During the Recent Slowdown and Projections Under a Wind Trend Reversal. Clim Dyn 51, 321–336 (2018). doi: 10.1007/s00382-017-3923-3
Nakamura H., Nishina A., Tobata K., Higashi M., Habano A., Yamashiro T. (2012). Surface Velocity Time Series Derived From Satellite Altimetry Data in a Section Across the Kuroshio Southwest of Kyushu. J. Oceanogr. 68, 321–336. doi: 10.1007/s10872-012-0101-4
Qiu B. (1999). Seasonal Eddy Field Modulation of the North Pacific Subtropical Countercurrent: TOPEX/Poseidon Observations and Theory. J. Phys. Oceanogr. 29, 2471–2486. doi: 10.1175/1520-0485(1999)029<2471:SEFMOT>2.0.CO;2
Qiu B., Chen S. (2010). Interannual Variability of the North Pacific Subtropical Countercurrent and Its Associated Mesoscale Eddy Field. J. Phys. Oceanogr. 40, 213–225. doi: 10.1175/2009JPO4285.1
Qiu B., Chen S. (2013). Concurrent Decadal Mesoscale Eddy Modulations in the Western North Pacific Subtropical Gyre. J. Phys. Oceanogr. 43, 344–358. doi: 10.1175/JPO-D-12-0133.1
Qiu B., Chen S. (2014). Wind- Versus Eddy-Forced Regional Sea Level Trends and Variability in the North Pacific Ocean –. J. Climate (JCLI) 28, 1561–1577 doi: 10.1175/JCLI-D-14-00479.1
Shchepetkin A. ,. F., McWilliams J. ,. C. (2005). The Regional Oceanic Modeling System (ROMS): A Split-Explicit, Free-Surface, Topography-Following-Coordinate Oceanic Model. Ocean. Model. (Oxf ) 9, 347–404. doi: 10.1016/j.ocemod.2004.08.002
Soeyanto E., Guo X., Ono J., Miyazawa Y. (2014). Interannual Variations of Kuroshio Transport in the East China Sea and Its Relation to the Pacific Decadal Oscillation and Mesoscale Eddies. J. Geophys. Res. Oceans. 119, 3595–3616. doi: 10.1002/2013JC009529
Wang H., Liu Q., Yan H., Song B., Zhang W. (2019). The Interactions Between Surface Kuroshio Transport and the Eddy Field East of Taiwan Using Satellite Altimeter Data. Hai. Yang. Xue. Bao. 38, 116–126. doi: 10.1007/s13131-019-1417-3
Wu C. R., Lin Y. F., Wang Y. L., Keenlyside N., Yu J. Y. (2019a). An Atlantic-Driven Rapid Circulation Change in the North Pacific Ocean During the Late 1990s. Sci Rep 9, 14411. doi: 10.1038/s41598-019-51076-1
Wu C. R., Wang Y. L., Chao S. Y. (2019). Disassociation of the Kuroshio Current With the Pacific Decadal Oscillation Since 1999-. Remote Sensing (MDPI). 11, 2072–4292 doi: 10.3390/rs11030276
Wu C. R., Wang Y. L., Lin Y. F., Chiang T. L., Wu C.-C. (2016). Weakening of the Kuroshio Intrusion Into the South China Sea Under the Global Warming Hiatus. IEEE J. Sel. Top. Appl. Earth Obs. Remote Sens. 9, 5064–5070. doi: 10.1109/JSTARS.2016.2574941
Yang Y. J., Jan S., Chang M. H., Wang J., Mensah V., Kuo T. H., et al. (2015). Mean Structure and Fluctuations of the Kuroshio East of Taiwan From In Situ and Remote Observations. Oceanography, 28, 74–83. doi: 10.5670/oceanog.2015.83
Yang Y., Liu C. T., Hu J. H., Koga M. (1999). Taiwan Current (Kuroshio) and Impinging Eddies. J. Oceanogr. 55, 609–617. doi: 10.1023/A:1007892819134
Yang D., Yin B., Chai F., Feng X., Xue H., Gao G., et al. (2018). The Onshore Intrusion of Kuroshio Subsurface Water From February to July and a Mechanism for the Intrusion Variation. Prog. Oceanogr. 167, 97–115. doi: 10.1016/j.pocean.2018.08.004
Yan X. M., Sun C. (2015). An Altimetric Transport Index for Kuroshio Inflow Northeast of Taiwan Island. Sci. China Earth Sci. 58, 697–706. doi: 10.1007/s11430-014-5024-z
Yan X., Zhu X. H., Pang C., Zhang L. (2016). Effects of Mesoscale Eddies on the Volume Transport and Branch Pattern of the Kuroshio East of Taiwan. J. Geophys. Res. Ocean. 121, 7683–7700. doi: 10.1002/2016JC012038
Keywords: Kuroshio intensity, East China Sea (ECS), Interannual variability, Eddy kinetic energy (EKE), Planetary wave
Citation: Jo S, Moon J-H, Kim T, Song YT and Cha H (2022) Interannual Modulation of Kuroshio in the East China Sea Over the Past Three Decades. Front. Mar. Sci. 9:909349. doi: 10.3389/fmars.2022.909349
Received: 31 March 2022; Accepted: 02 May 2022;
Published: 13 June 2022.
Edited by:
Francisco Machín, University of Las Palmas de Gran Canaria, SpainCopyright © 2022 Jo, Moon, Kim, Song and Cha. This is an open-access article distributed under the terms of the Creative Commons Attribution License (CC BY). The use, distribution or reproduction in other forums is permitted, provided the original author(s) and the copyright owner(s) are credited and that the original publication in this journal is cited, in accordance with accepted academic practice. No use, distribution or reproduction is permitted which does not comply with these terms.
*Correspondence: Jae-Hong Moon, amhtb29uQGplanVudS5hYy5rcg==
 SeongHyun Jo
 Jae-Hong Moon
 Taekyun Kim
 Yuhe Tony Song3