
95% of researchers rate our articles as excellent or good
Learn more about the work of our research integrity team to safeguard the quality of each article we publish.
Find out more
ORIGINAL RESEARCH article
Front. Mar. Sci. , 20 June 2022
Sec. Marine Biogeochemistry
Volume 9 - 2022 | https://doi.org/10.3389/fmars.2022.909148
This article is part of the Research Topic Biogeochemical, Ecological and Biophysical Dynamics in the Kuroshio, Oyashio and Their Extension Regions View all 17 articles
 Tiantian Ge1†
 Chunle Luo1†Peng Ren2Hongmei Zhang1Hongtao Chen1
 Zhaohui Chen3
 Jing Zhang1,4
 Xuchen Wang1,2*
Dissolved organic carbon (DOC) in the ocean is one of the largest reduced and exchangeable organic carbon pools on Earth and plays important roles in carbon cycling and biogeochemical processes in the ocean. Here, we report the concentrations and distributions of DOC in water samples collected along a meridional transect in the western North Pacific (NP) Ocean in November 2019. Concentrations of DOC ranged from 33-102 μM, were higher in surface water, decreased rapidly with depth to 1,000 m, and then remained relatively constant. The labile fraction of DOC accounted for 20-40% of the surface bulk DOC and was respired very rapidly in the upper 200 m depth. The semi-labile fraction of DOC accounted for 15-20% of the surface bulk DOC and was exported downward and turned over at water depths of 200-2,000 m. The formation of NP Intermediate Water (NPIW) in the Kuroshio Extension (KE) region is a major process carrying some surface semi-labile DOC down. The Low concentrations of DOC (33-44 μM) were present in the entire water column below 1,000 m along the transect in the NP. Primary production and microbial consumption played major roles in the concentration and distribution of DOC in the euphotic zone, and hydrodynamic mixing and circulation of different water masses appear to be dominant factors controlling the distribution and dynamics of DOC in the deep water of the western NP.
Dissolved organic carbon (DOC) in the ocean, which amounts to ~ 680 Pg C, is one of the Earth’s greatest reservoirs of bioactive and exchangeable carbon, comparable in volume to atmospheric CO2 (Hansell et al., 2009; Carlson and Hansell, 2015). Although the pool size of DOC is only ~2% of the dissolved inorganic carbon (DIC, 38,000 Pg C) in the ocean, its sources, production, removal, and cycling are more complicated than those of DIC and play more crucial roles in biological and biogeochemical processes in the ocean (Lee and Wakeham, 1988; Hansell and Carlson, 2013; Carlson and Hansell, 2015; Repeta, 2015; Druffel et al., 2019). In the last three decades, analytical methods have been developed and improved, and in particular, a high-precision high-temperature catalytic oxidation (HTCO) technique has been introduced that has supplied quantitative and detailed oceanic DOC distributions in the global ocean (Sharp et al., 1995; Sharp et al., 2002; Hansell et al., 2009; Carlson et al., 2010; Hansell and Orellana, 2021). The information gathered through international collaborations led to a better understanding of the roles of DOC in ocean biogeochemistry and carbon cycling (Sharp et al., 1995; Sharp et al., 2002; Hansell et al., 2009; Carlson et al., 2010; Druffel et al., 2016; Druffel et al., 2019).
The majority of DOC in the ocean is produced biologically by autotrophic plankton in the ocean’s euphotic zone. After its production, the distribution of DOC is modulated rapidly by microbial degradation and physical processes such as the hydrographical structure and horizontal and vertical water mixing (Doval and Hansell, 2000; Hansell and Carlson, 2001; Carlson et al., 2010; Fontela et al., 2016). In the open oceans, concentrations of DOC usually present a strong vertical gradient, found at relatively high levels (70-90 μM) in the surface layer and rapidly decreasing down to extremely low levels (34-40 μM) at deep water depths (>1,000 m) (Carlson and Hansell, 2015; Druffel et al., 2016; Ding et al., 2019; Shan et al., 2020). The bulk DOC pool comprises countless compounds (Lee and Wakeham, 1988; Kujawinski, 2011; Repeta, 2015; Shen and Benner, 2020) that exhibit different reactivities and turnover times (Hansell and Carlson, 2013; Shen and Benner, 2020) and is operationally resolved into at least three fractions, i.e., the most biologically labile fraction of DOC (LDOC), biologically refractory DOC (RDOC) and material of intermediate lability or semi-lability (SLDOC). LDOC with rapid turnover accounts for less than 1% of the DOC in seawater. More than 90% of the DOC in seawater exists as RDOC (Hansell et al., 2009) that survives multiple meridional overturning cycles, with average 14C ages of up to 6,000 years (Williams and Druffel, 1987; Bauer et al., 1992; Druffel et al., 2019; Druffel et al., 2021).
Hydrodynamic processes are important factors in the distribution and dynamics of DOC in the western North Pacific (NP) Ocean and are influenced by major oceanic western boundary currents, including the Kuroshio Current, the Oyashio Current, and the Kuroshio Extension Current (KE) formed by the mixture of these two currents (Figure 1A). However, few observations during the World Ocean Circulation Experiments (WOCE) and the Climate Variability Predictability (CLIVAR) cruises have focused on the distribution of DOC in the western NP Ocean. The only available data on DOC in the western NP Ocean were obtained during these two observation cruises at the P02 longitudinal transect (30°N). In a recent study, we reported the concentrations and distributions of DOC at nine stations in the KE region of the NP in May 2015 and revealed that the concentrations of DOC were significantly lower (54-63 μM) in the surface waters of the KE than in other areas (Ding et al., 2019). The DOC distribution in the KE region appeared to be controlled largely by the hydrodynamic mixing of different water masses rather than biological processes and was estimated to account for 8%–20% of the shaping of the DOC distribution in the KE region (Ding et al., 2019).
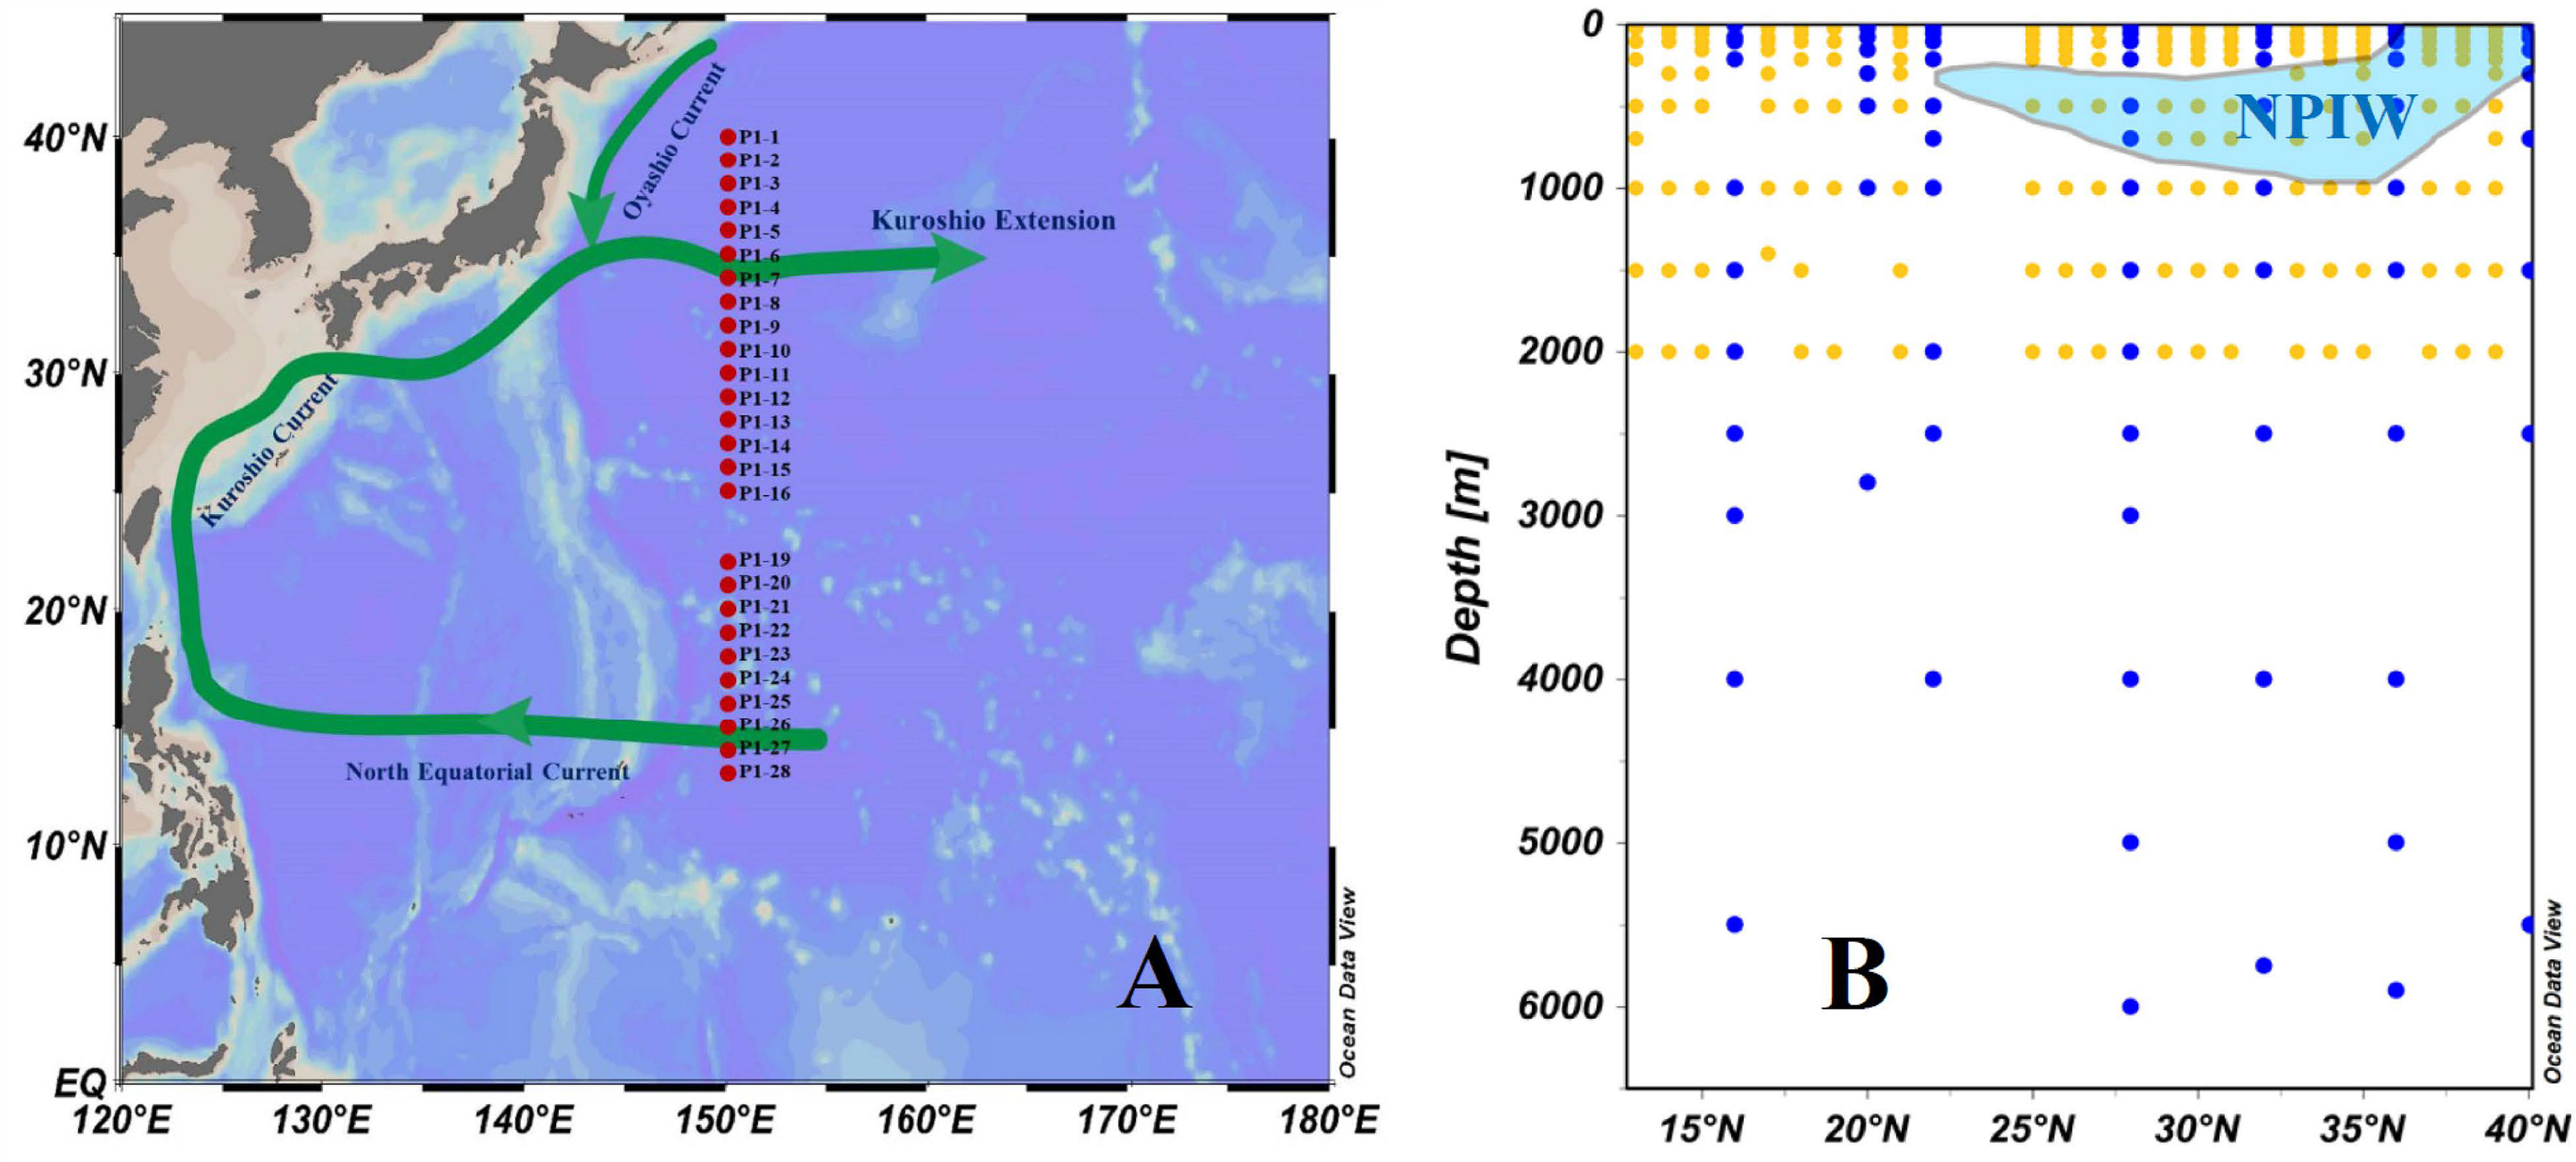
Figure 1 (A) Map of the study region plotted using Ocean Data View (ODV, Schlitzer, 2015) and the sampling transect stations of line P1 (red dots) in the northwestern North Pacific in November 2019. (B) Plot of sampling depth at the sampling transect stations of line P1. Seawater samples were collected for the full water depth at 7 stations (blue dots) and for only the upper 2,000 m at 19 stations (yellow dots).
Although the western NP Ocean, as a terminus of deep water circulation in global oceans and a region of high biological activity, is of interest in terms of the carbon cycle, data resolution remains spatially and temporally too sparse to resolve the details of the distribution and dynamics of DOC. In this work, we report the distribution of DOC and its influencing factors along a meridional transect (Figure 1B, Transect P1, 13°N-40°N, 150°E) in the western NP Ocean. This is the first data set of this large size of DOC concentration and distributions presented along a north-south transect in the western NP Ocean obtained in the recent 20 years. We focus on the North Pacific Intermediate Water (NPIW) formation area as well as the KE to evaluate for DOC dynamics and to estimate the liability of different DOC fractions in the whole water column in this region. These new results combined with other chemical and hydrological data provide useful information not only on the DOC distribution and dynamics as influenced by biological processes, water exchange and circulation patterns in the western NP, but also for the carbon cycle as a whole in the global oceans.
The western NP Ocean is a highly dynamic region that is largely influenced by western boundary currents, such as the Kuroshio and Oyashio Currents. The largest CO2 flux into the NP Ocean was found in and around the Kuroshio Current and its extension into the North Pacific transition zone (NPTZ) (Takahashi et al., 2002; Takahashi et al., 2009). The Kuroshio transports warm, saline, and oligotrophic waters of the subtropical gyre north and flows eastward at the south coast of Japan toward the open Pacific Ocean, where it is known as the KE. The Oyashio carries low temperature, low salinity, and high nutrient water south from subarctic regions. At approximately 34°N-37°N, the Oyashio front meets the KE Current and forms the Kuroshio-Oyashio interfrontal zone (Yasuda et al., 1996; Yasuda, 2004; Qiu and Chen, 2011; Hu et al., 2015). The KE is the most dynamic region that changes spatially and seasonally in the NP with respect to sea surface height, eddy activity, and sea surface temperature (SST), and it is the region where the most heat is lost from the ocean to the atmosphere (Qiu and Chen, 2011). The confluence of different oceanographic processes and the formation of eddies cause turbulence and transport of nutrients from deeper waters, fueling more phytoplankton blooms (Isada et al., 2009; Shiozaki et al., 2014).
The NPIW is a water mass characterized by a low salinity (as low as 33.8) and low oxygen (50–150 μM) at a potential density range of 26.6–27.4σ0 in the Pacific subtropical gyre (Talley et al., 1995; Tsunogai et al., 1995). Fresh NPIW is transported through the south-flowing Oyashio along the western boundary from the subarctic region to the Kuroshio-Oyashio interfrontal zone (Yasuda, 2004). In this area, cold and fresh subarctic Oyashio water merges with the KE and intrudes into the intermediate layer of warm and salty subtropical Kuroshio water, forming a new NPIW (Figure 1B). Newly formed NPIW consists of 55% Kuroshio and 45% Oyashio waters and eventually mixes into the intermediate layer of the NP subtropical gyre as a low salinity tongue (Talley et al., 1995). The depth range for NPIW is from 300 to 1,000 m, and the position of its southern boundary varies from 15°N-20°N seasonally (Talley, 1993; Yasuda et al., 1996; Talley, 1997; Itou et al., 2003). NPIW is important for anthropogenic CO2 absorption and long-term climate variability, as it is the densest and deepest water mass with abundant anthropogenic CO2 ventilated in the NP (Tsunogai et al., 1995; Yasuda et al., 1996; Qiu and Chen, 2011).
Water samples were collected at 26 stations along the north–south transect P1 (13°N-40°N, 150°E) in the NP onboard the R/V Dongfanghong 3 during 6-18 November 2019 (Figure 1). General information on the sampling stations is provided in the Supplementary Material (Supplementary Table 1). Seawater samples were collected at greater water depths at 7 stations and only to the upper 2,000 m depth at 19 stations (Figure 1, Supplementary Table 1). Water was collected using 12-L Niskin bottles attached to a rosette sampler with a calibrated SeaBird CTD (model SBE 911) that recorded the water temperature, salinity, and depth profiles. After the CDT recovery, water samples for dissolved oxygen (DO) were collected first from the Niskin bottles. Immediately after sampling, samples for DO measurement were fixed by adding 1 mL of manganese chloride and 1 mL of alkaline iodide reagent. For DOC analysis, water was collected (after allowing ~100 mL to overflow) directly into a 1 L precombusted (at 550°C for 4 h) glass bottle that had been rinsed three times with in situ seawater. Water in the upper 500 m was immediately filtered through 0.7 μm Whatman GF/F filters (precombusted at 550°C for 4 h), and water below 500 was unfiltered. All samples for DOC were acidified with ultrapure 85% H3PO4 (Aladdin®) to a pH = 2 and then kept frozen at -20°C for chemical analysis.
The concentration of DOC was analyzed by HTCO methods (Sharp et al., 2002) using a Shimadzu TOC-L analyzer equipped with an ASI-V autosampler. As an important nutrient for reference, we also simultaneously analyzed the total dissolved nitrogen (TDN) in the samples. Potassium hydrogen phthalate (KHP) and potassium nitrate (KNO3) dissolved in high-purity Milli-Q water were used as the DOC and TDN standards, respectively (Ding et al., 2019; Shan et al., 2020). The quality assessments for the DOC and TDN measurements were checked against a deep seawater reference (CRM Batch 13 provided by Dr. Hansell’s Biogeochemical Laboratory at the University of Miami, USA). The instrument was calibrated using 6-point calibration curves derived from prepared DOC and TND standard solutions. Blank subtraction was carried out using Milli-Q water, which was analyzed before running each sample. The average blank of the DOC and TDN measurements was ≤ 4 μM, and the analytical precision on triplicate injections was ±3%. The DO concentration was analyzed by the traditional Winkler titration method (Bryan et al., 1976) with a precision < 2 μM.
The water temperature, salinity, and concentrations of DO, DOC and TDN of all samples are summarized in Supplementary Table 1 of the Supplementary Material. The hydrographic parameters (temperature, salinity and density) of the 26 stations along the P1 transect are plotted as depth profiles and cross transect latitudinal distributions in Figure 2. The temperature of the surface water (5 m depth) ranged from 14.5°C to 29.4°C and was higher at low latitudes than at high latitudes. Surface water had the lowest water temperature (14.5°C) at Station P1-1 (40.04°N, 149.89°E) and the highest temperature (29.4°C) at Station P1-28 (13.00°N, 149.99°E). The water temperature decreased rapidly from the surface down to 1,500 m (<3°C) and then remained constant below 1,500 m (Figure 2A). As shown in Figure 2B, the latitudinal distributions of water temperature along the P1 transect exhibited very clear layers in the upper 1,000 m. In the KE region (36°N-40°N), low surface water temperature was largely influenced by the Oyashio Current, which brings cold subarctic water into the region (Ge et al., 2022).
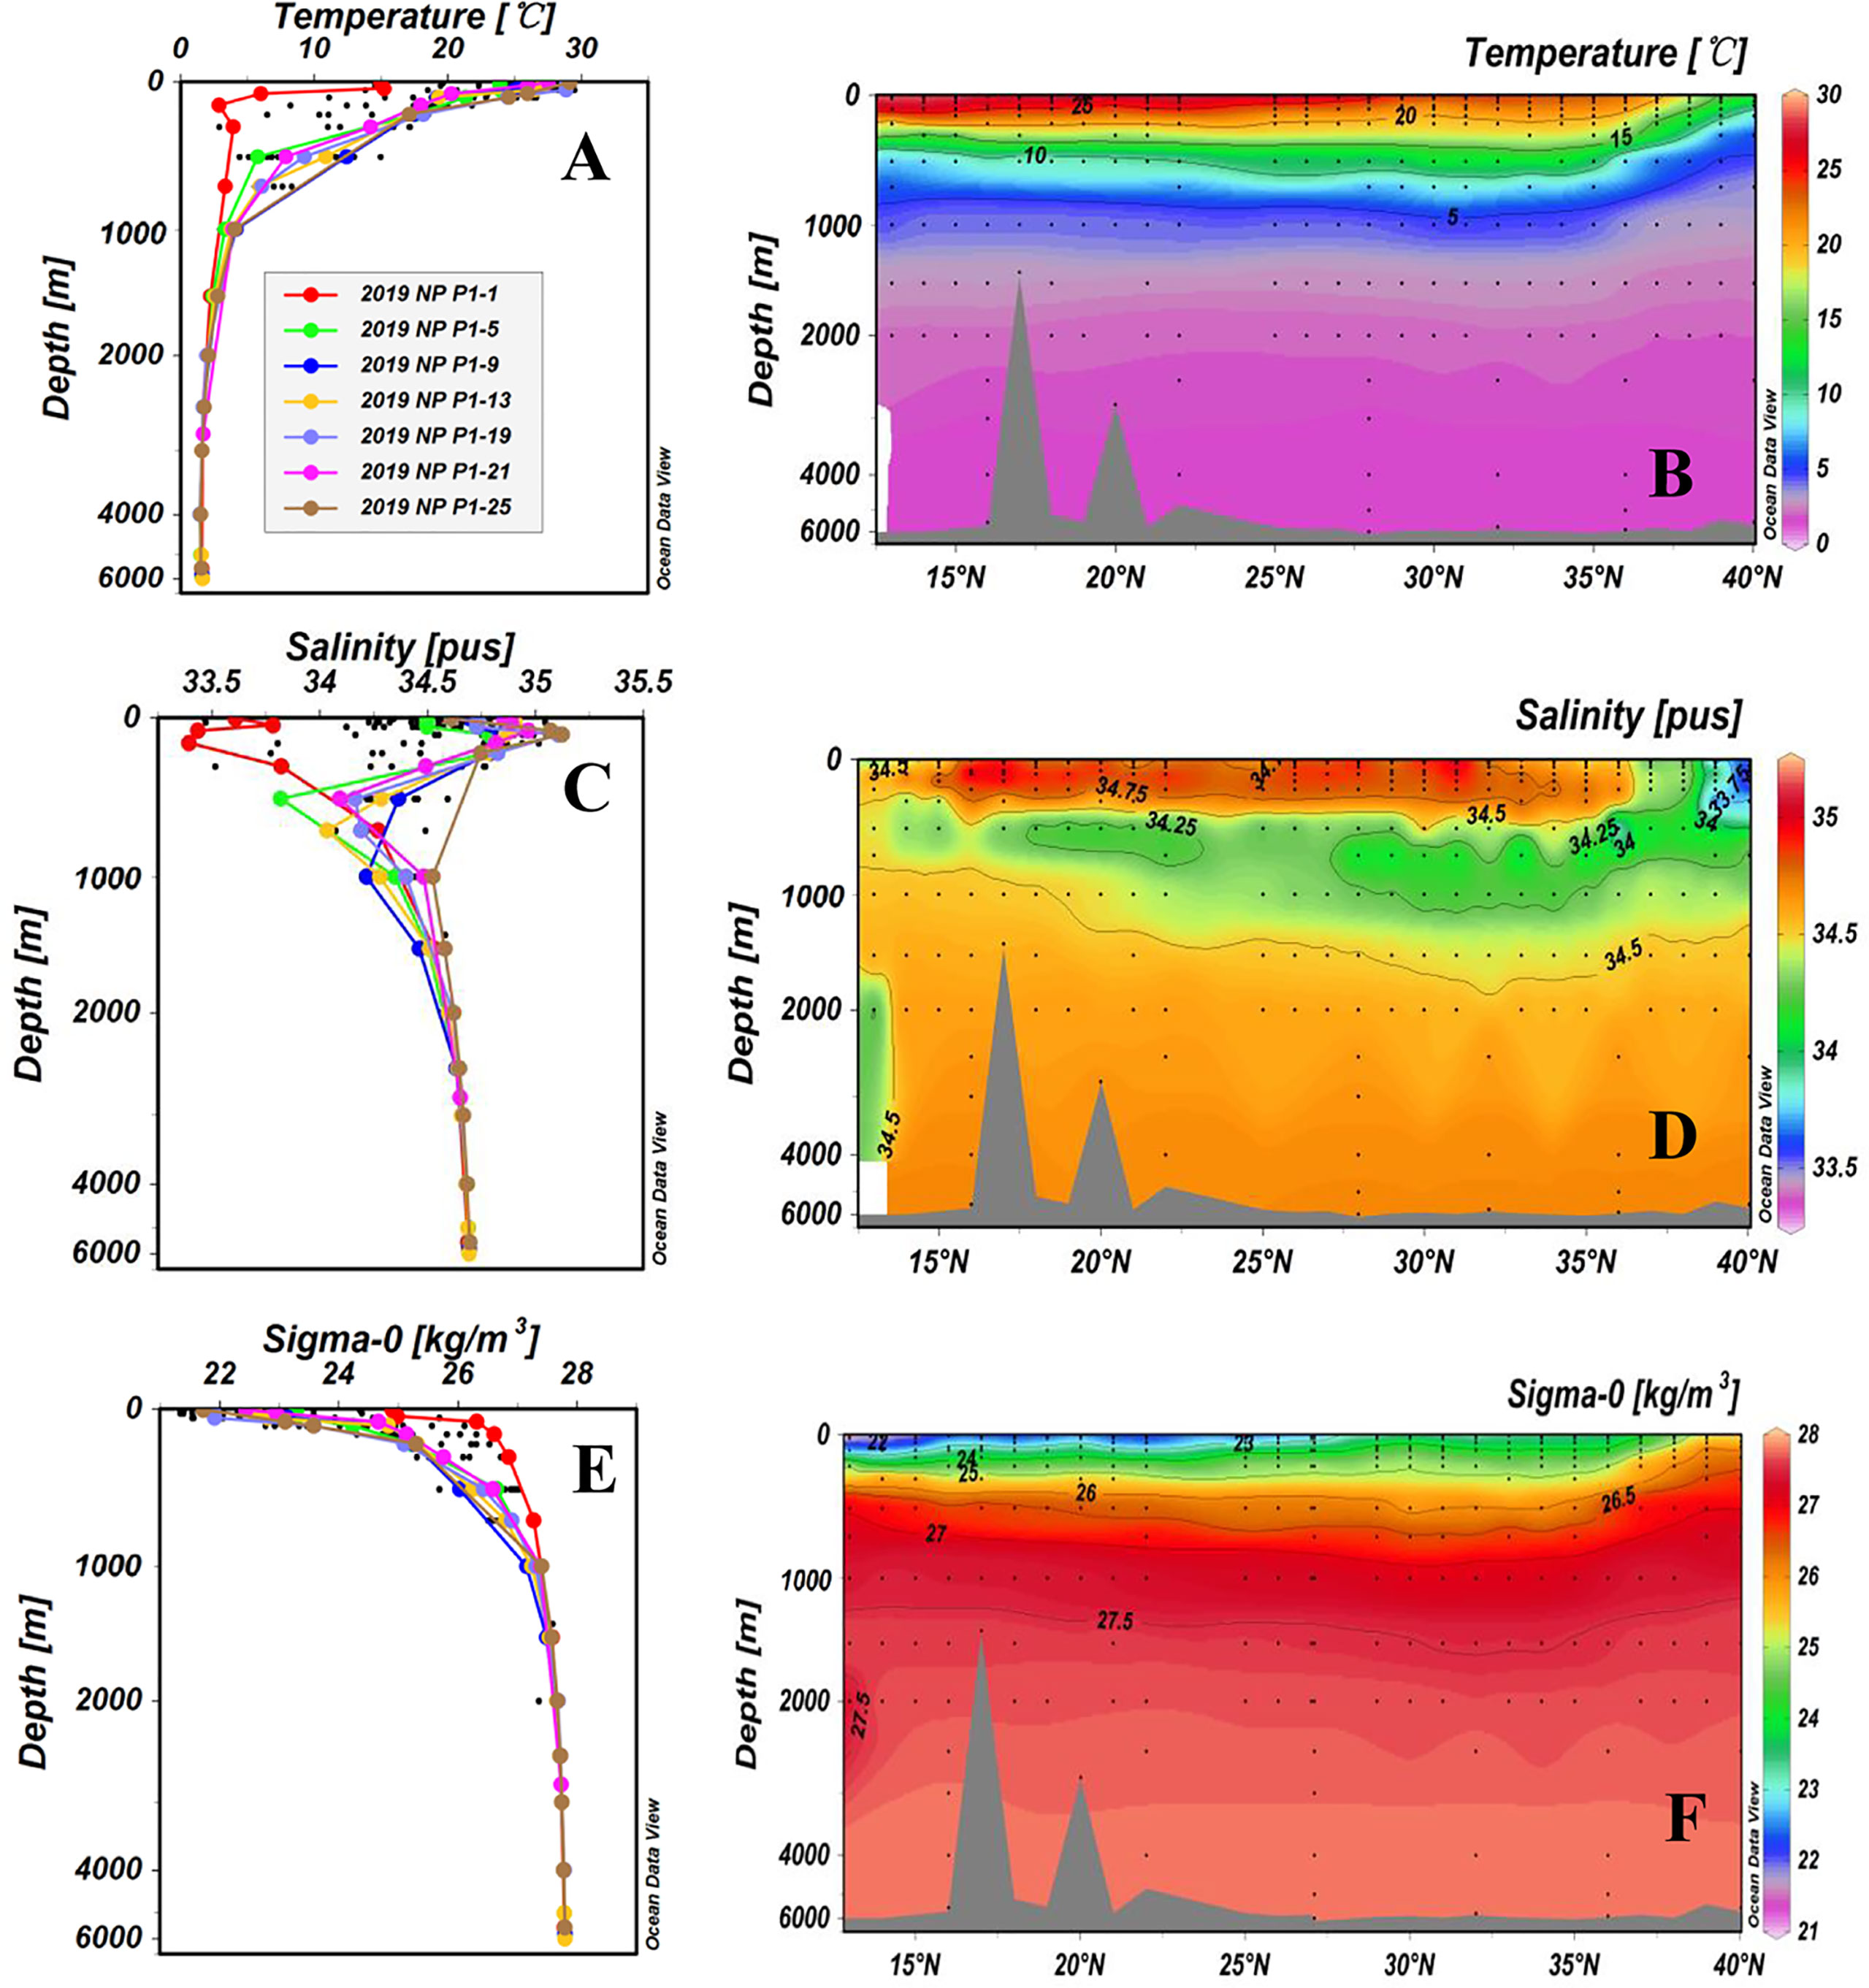
Figure 2 Depth profiles and latitudinal distributions of water temperature (A, B), salinity (C, D), and density (E, F) for stations along the P1 transect in the western NP in November 2019. The potential density data (σ0) were calculated by ODV (Schlitzer, 2015). Data from the upper 2,000 m depth of the sampling stations are shown as black dots in the depth profiles. This figure is cited in our recent publication (Ge et al., 2022).
The water salinity ranged from 33.463 to 35.044 and exhibited a reversed S shape profile (Figure 2C), i.e., lower at the surface, increasing with depth to the maximum at ~150 m, then decreasing again to 300-500 m. Water salinity remained relatively constant below a 1,500 m depth at all stations. The largest variations in water salinity were also observed in the upper 1,000 m of the water column (Figure 2). Salinities in the upper 500 m of the high latitude stations (P1-1, P1-2, P1-3 and P1-4) were lower than those at the other stations (Figure 2D). Station P1-2 had the lowest salinity (33.463), and Station P1-10 had the highest salinity (35.044) in the surface layer. The water density along the P1 transect stations was consistent with the salinity, showing dense water at high northern latitudes and low-density water at the surface at low latitudes (< 25°N) (Figure 2F). Water density was also quite constant (>34.5, σ0 ≥ 27.5) below a 1,500 m depth at all stations (Figures 2E, F).
Depth profiles and latitudinal distributions of the concentrations of DO, DOC and TDN for all stations are shown in Figure 3. The concentrations of DO ranged from 35 μM to 239 μM, with the highest values (164 μM to 239 μM) in the upper water layer (< 200 m) and decreasing rapidly with depth to ~ 1,000 m for all stations (Figure 3A). The largest changes in DO were seen in the upper 1,000 m depth along the P1 transect. Concentrations of DO were the highest in the upper 200 m water depth at Station P1-1 and decreased very rapidly to the lowest concentrations at 800 m. For Station P1-9, the concentration of DO was well mixed down to 500 m and then decreased to a minimum level at 1,000 m before increasing again (Figures 3A, B). The lowest DO values, ranging from 35 μM to 98 μM, were found between 700 and 1,500 m depths at all stations in the oxygen minimum zone (OMZ) and then increased with depth. The minimum values at the OMZs at high latitudes (25°N-40°N) were lower than those at low latitudes (13°N-24°N).
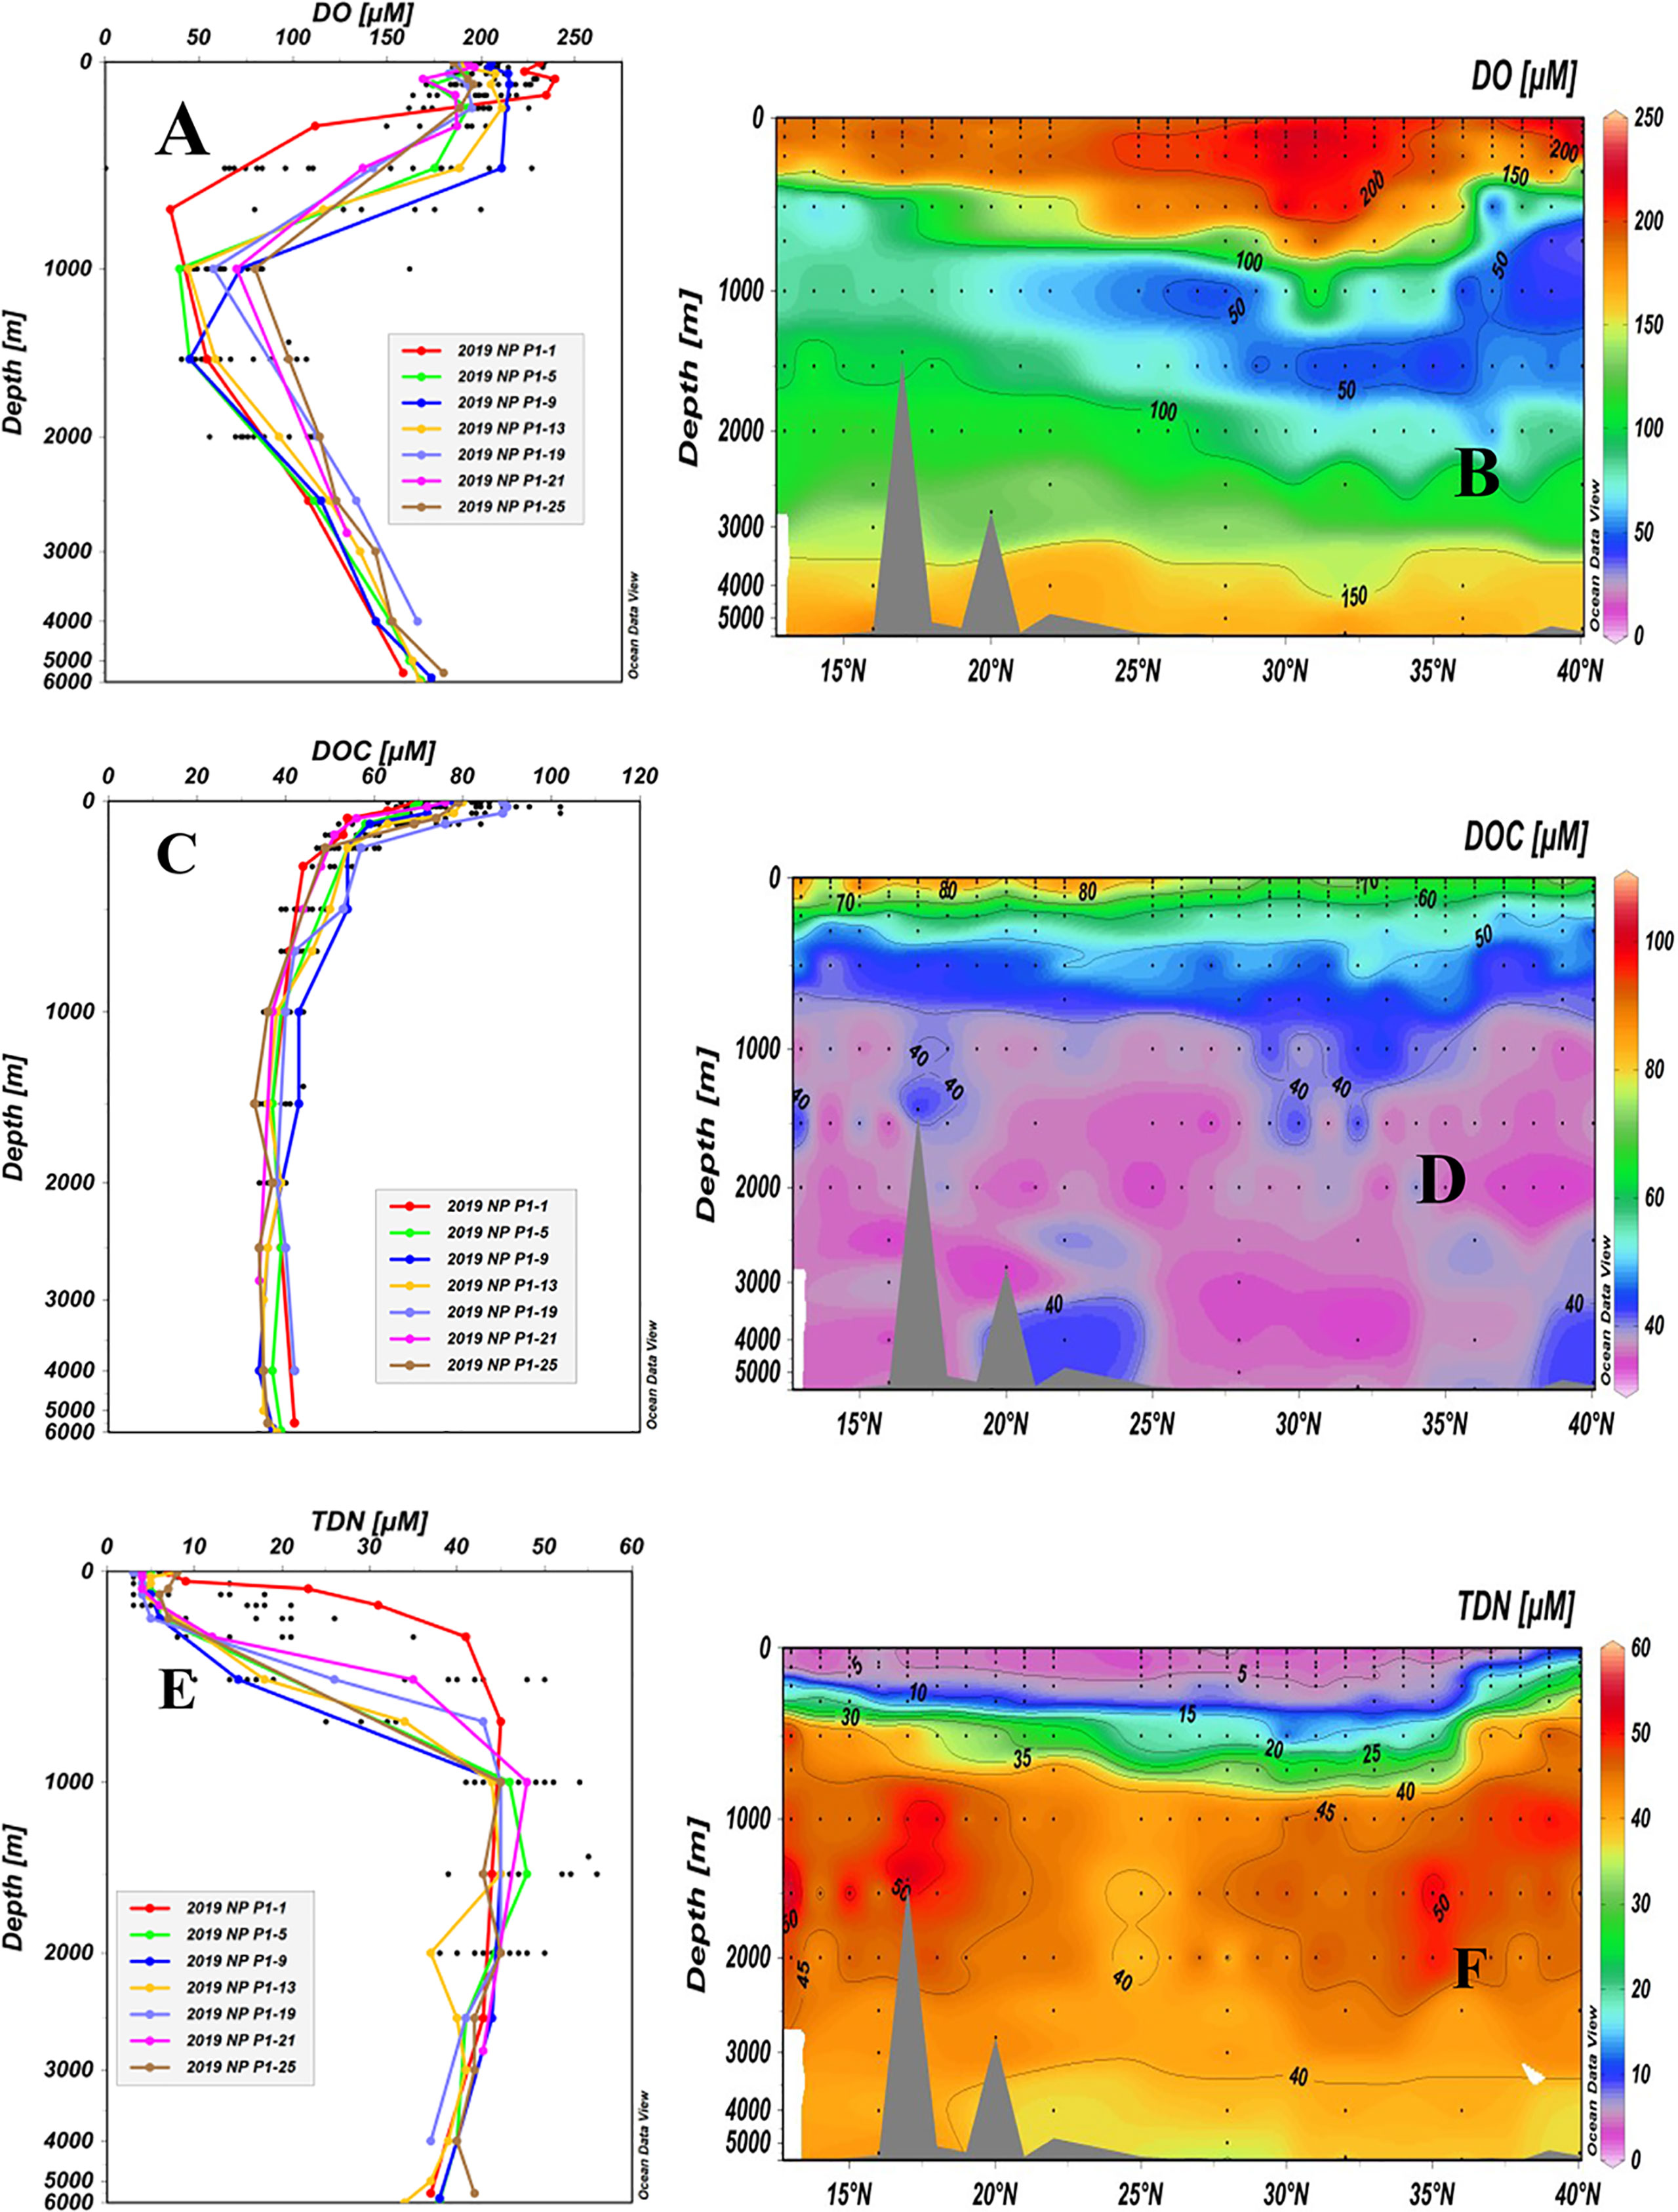
Figure 3 Depth profiles and latitudinal distributions of DO (A, B), DOC (C, D) and TDN (E, F) in water samples collected from stations along the P1 transect in the northwestern NP in November 2019. Data from the upper 2,000 m depth of the sampling stations are shown as black dots in the depth profiles.
The concentrations of DOC ranged from 33 μM to 102 μM, and the depth profiles appeared more similar across all stations (Figure 3C). In general, the concentrations of DOC had maximum values in the upper 50 m, decreased from the surface down to ~1,000 m, and then remained relatively constant at levels of 33-44 μM (Figure 3C). The small concentration variations in DOC below the 1,000 m water depth among the stations most likely reflected analytical errors (4-5 μM). As plotted in Figure 3D, the latitudinal distribution of DOC along the P1 transect showed that DOC concentrations (72-102 μM) in the upper water (<55 m) at low latitudes (13°N-28°N) were significantly higher than those at other stations (63-82 μM, 29°N-40°N). Low DOC concentrations (≤ 40 μM) were seen in the entire water column below a 1,000 m depth along the P1 transect in the western NP (Figure 3D). As a comparison, we summarized the available concentrations of DOC measured in the NP Ocean from other cruises (Supplementary Table 2). Due to the different sampling sites, we summarized the concentrations of DOC into three water depths: the euphotic zone < 200 m, intermediate water depth of 200-1000 m and deep water depth >1000 m. It can be seen that the concentrations of DOC in the NP obtained in different cruises in recent 20 years are quite consistent, in general, with the same distribution patterns.
Concentrations of TDN also varied largely from 3 μM to 56 μM and the depth profiles showed an opposite trend from those of the DOC concentration profiles, with low TDN concentrations in the surface water that rapidly increased with depth (Figure 3E). The surface layer (5 m) in the P1 transect had the lowest TDN values, all of them being less than 10 μM (3-8 μM). The largest variations in TDN concentrations were seen in the upper 1,000 m at the P1-1 to P1-4 Stations at high latitude in the KE region where a significantly higher TDN was found than in other stations (Figures 3E, F). The highest values (38-56 μM) of TDN were observed between the depths of 1,000 and 1,500 m for all stations and then decreased slightly with depth.
Autotrophic production in the euphotic zone is the main source of DOC in the open ocean, while microbial mineralization is the dominant sink (Ogawa et al., 2001; Hansell et al, 2009). Biological and physical processes could both affect the level of DOC and its spatial and temporal distribution in the ocean (Hansell et al., 2009; Carlson et al., 2010; Bercovici and Hansell, 2016; Hansell and Orellana, 2021). A high accumulation of DOC (72-102 μM) was observed in the surface layer (<55 m) along the P1 transect (Figures 3C, D). The relative high concentrations and the strong gradient of DOC in the upper 1,000 m water depth along the P1 transect (Figure 3C) clearly indicates this balance between autotrophic production and microbial respiration of DOC. The fractions of LDOC and SLDOC in the upper 1,000 m represent a large flux of organic carbon in the ocean, but with rapid turnover, they constitute a very small fraction (< 1%) of the deep ocean DOC inventory (Hansell et al., 2009; Jiao et al., 2010). The results of relatively constant and low concentrations of DOC (33-44 μM, average 37 μM) found in the entire water column below 1,000 m along the P1 transect in the western NP (Figure 3B) are consistent with distribution of DOC reported for the deep NP Ocean (Hansell et al., 2009; Ding et al., 2019; Druffel et al., 2019) and the deep South Pacific (34–43 μM) (Druffel and Griffin, 2015). These uniformly low levels of DOC indicate a homogeneous distribution and a more refractory fraction presumably left behind in deeper waters in the NP (Carlson et al., 2010; Hansell and Carlson, 2013; Follett et al., 2014; Druffel et al., 2019). The old radiocarbon ages of DOC (5,900-6,300 years) in the deep waters of the KE region (Wang et al., unpublished data) provide strong evidence confirming the fraction of RDOC that has been cycled in the ocean for a long time (Williams and Druffel, 1987; Ding et al., 2018; Druffel et al., 2019; Druffel et al., 2021).
Using 37 μM as the background RDOC level in the deep NP and the DOC concentration at ~200 m as the average SLDOC level in the upper 200 m, we calculated the depth distributions of the fractions of LDOC, SLDOC and RDOC based on the concentration gradient with depth along the P1 transect (Figure 4). Considering that the LDOC with a lifetime of days to months is largely limited to the euphotic zone (Hansell and Carlson, 2001; Carlson et al., 2010; Jiao et al., 2010), the fraction of LDOC (15-35 μM) accounted for 20-40% of the bulk DOC and was respired very rapidly in the upper 200 m depth (Figure 4). The SLDOC fraction (10-20 μM) accounted for 15-20% of the surface DOC and was further exported downward and turned over at a water depth of 200-2,000 m, making it as dominant fraction reducing the vertical concentration gradient and contributing to carbon export at intermediate (to 1,000 m) and upper layer depths (Figure 4). In contrast, the RDOC fraction dominated (> 90%) the deep water DOC pool in the western NP, consistent with the previous studies on DOC in the ocean (Hansell et al., 2009; Carlson et al., 2010; Druffel et al., 2019). The small fractions of SLDOC below 2,000 m at some stations (Figure 4) are perhaps due to abiotic transformation of organic particles that could sink quickly and introduce DOC to great depths (Druffel et al., 1992; Smith et al., 2018; Lopez et al., 2020; Hansell and Orellana., 2021).
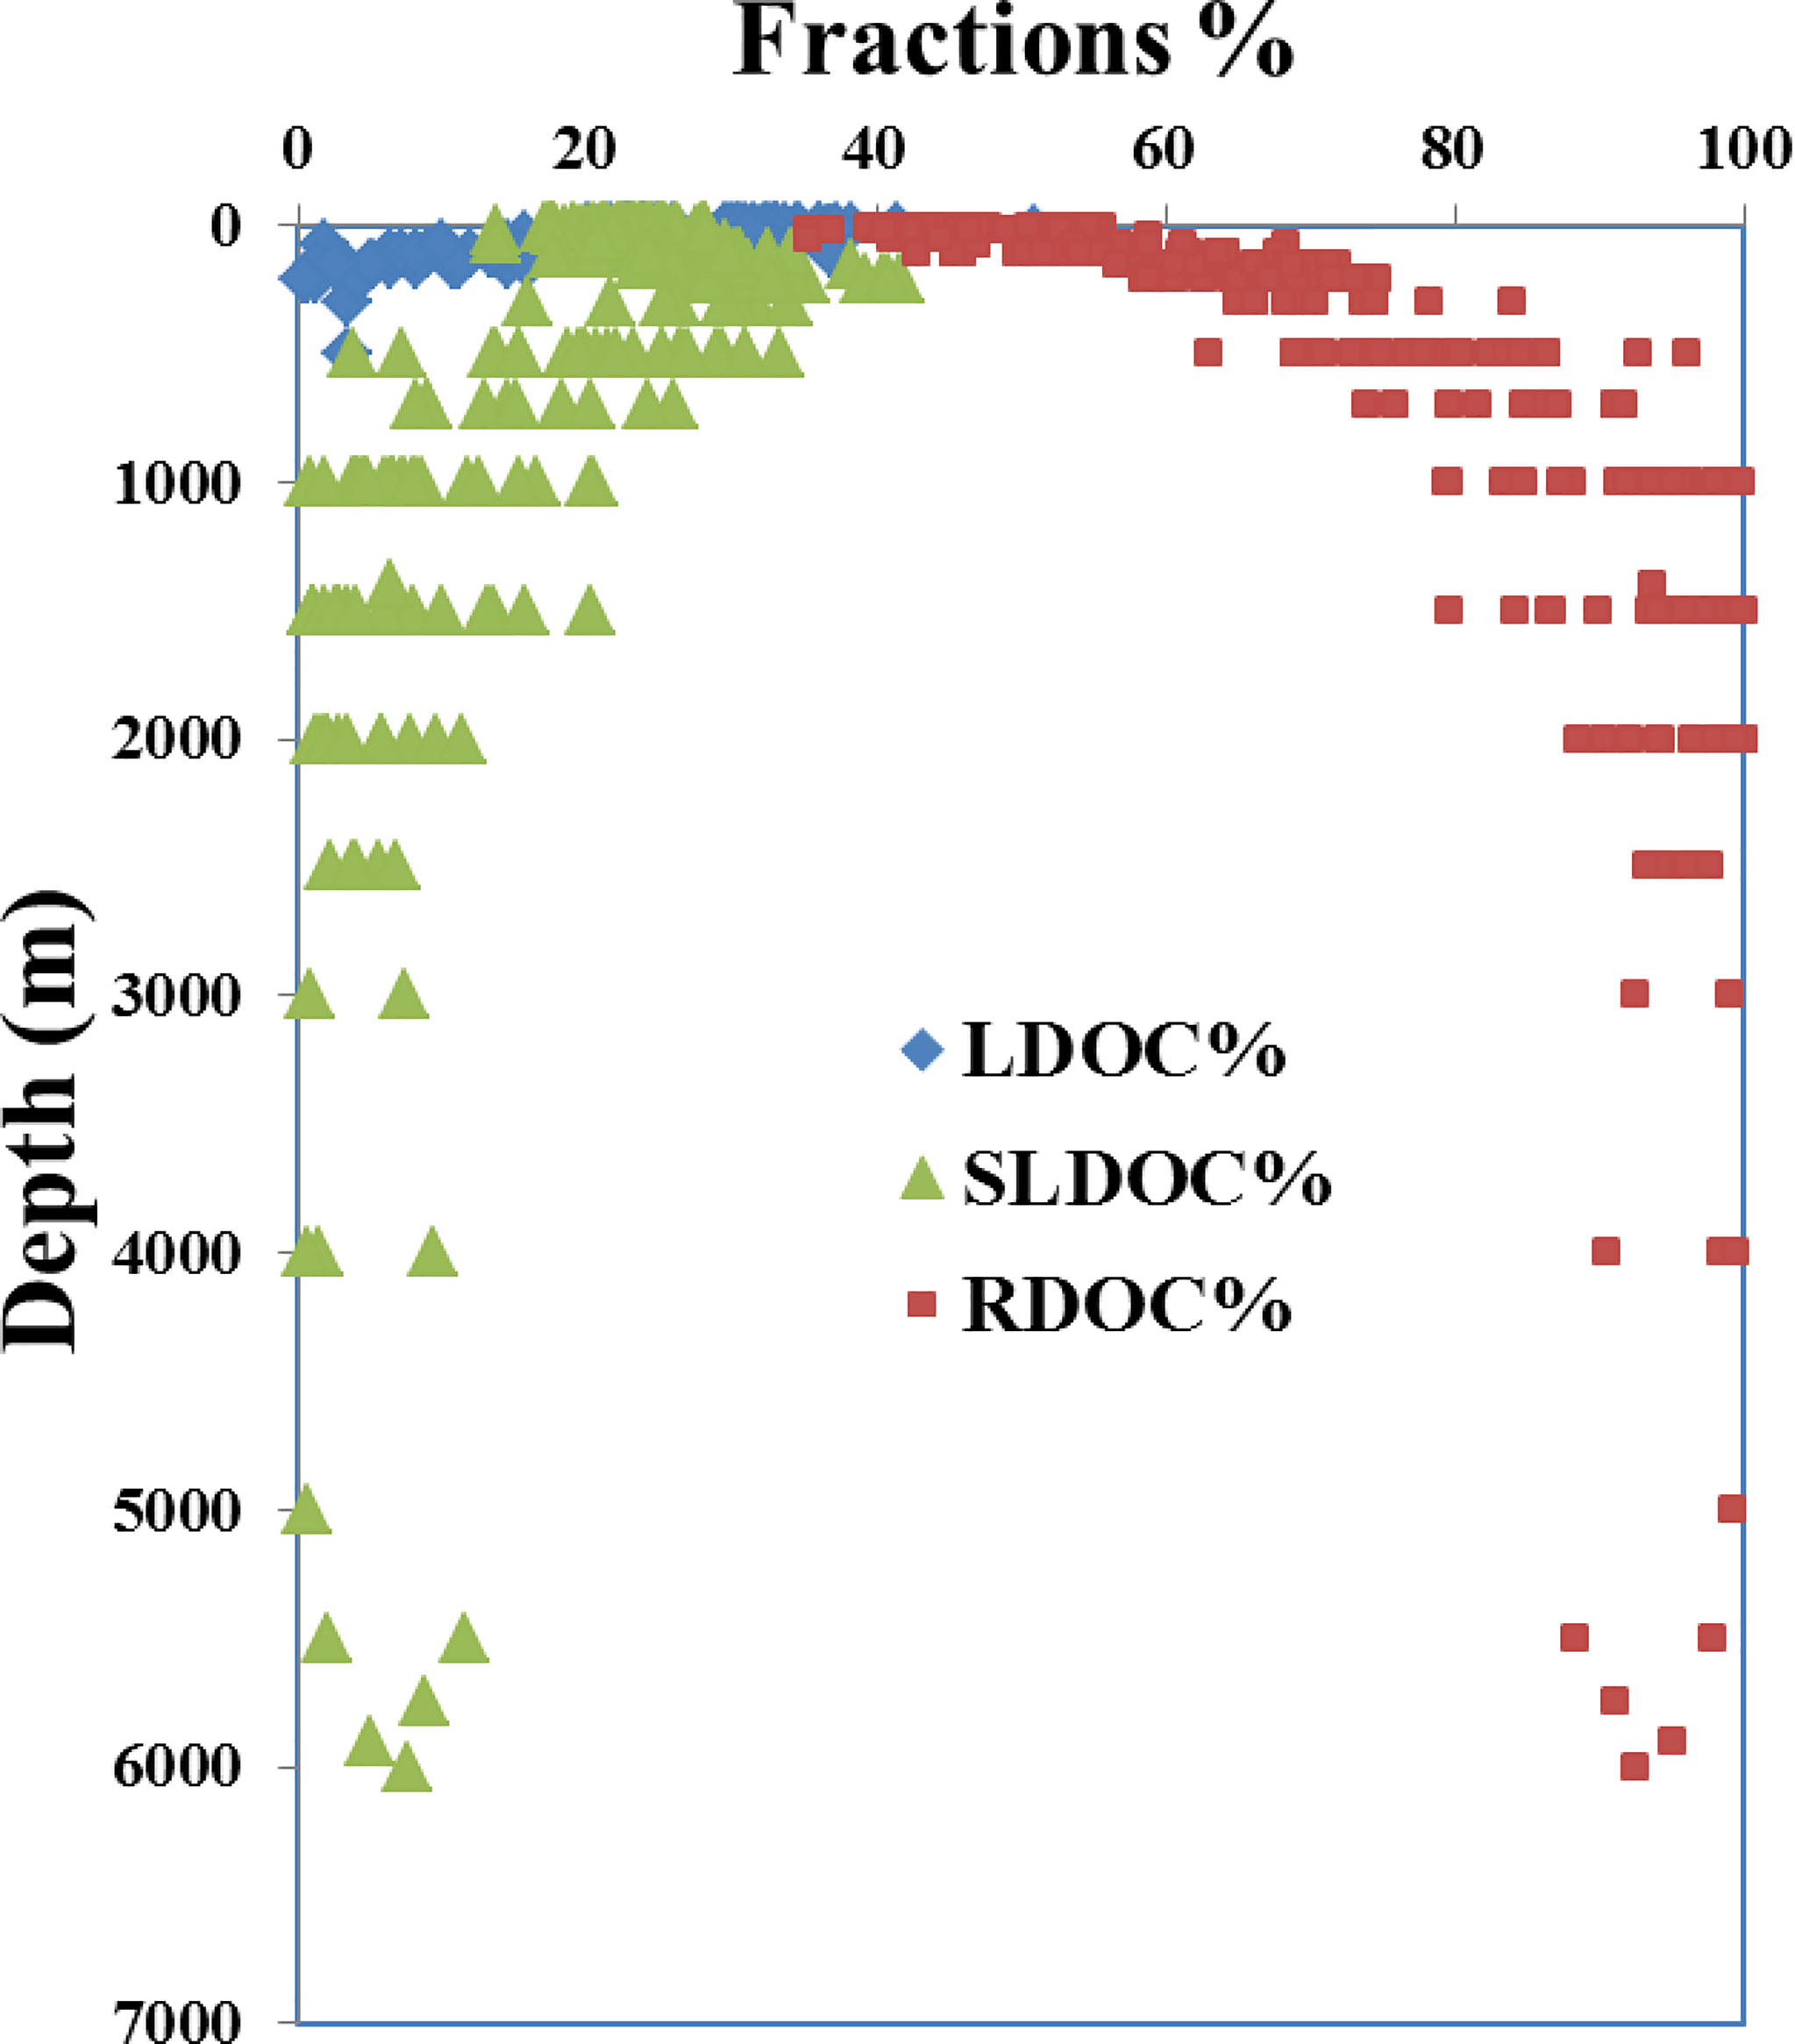
Figure 4 Plot of the depth profiles of calculated fractions of LDOC (blue diamonds), SLDOC (green triangles) and RDOC (red squares) in water samples collected at the 26 stations along the P1 transect in the western NP in November 2019.
We examined other processes influencing the distribution of DOC along the P1 transect in the western NP. As shown in Figure 5, the concentrations of DOC in the upper 105 m water depth had a negative correlation with increased latitude (Figure 5A). This is strongly related to the water temperature. Positive correlations existed for DOC and water temperature in both the upper 105 m depth (R2 = 0.52, p<0.001) and below the 105 m depth (R2 = 0.81, p<0.001) along the P1 transect, as shown in Figure 5B. This influence of water temperature on DOC may stem from the high production of DOC from plankton degradation, grazing and excretion at upper water depths (Lee and Wakeham, 1988; Arıstegui et al., 2002; Hansell and Orellana, 2021; Moran et al., 2022). In deep water, a reduced microbial degradation rate at low temperatures could play an important role in affecting the concentration of DOC (Carlson et al., 2010; Hansell and Carlson, 2013). Concentrations of DOC were also well correlated with the Apparent oxygen utilization (AOU) (R2 = 0.73, p<0.001; Figure 5C) along the P1 transect. The concentrations of DOC decreased more rapidly with a rapid increase in AOU, suggesting that oxygen respiration might dominate the microbial consumption of DOC at water depths along the P1 transect. Overall O2 consumption rates are low in bathypelagic waters relative to surface waters, but total bathypelagic respiration in the dark part of the ocean is a major component of the carbon flux in the biosphere. DOC respiration accounts for only <10% of the AOU below 200 m, and the bulk of the respiration within the mesopelagic zone might be mainly supported by the flux of sinking POC (Druffel et al., 1992; Arıstegui et al., 2002). At the upper 105 m water depth where the concentration of TDN was low (<10 μM), the correlation of DOC and TDN was poor (R2 = 0.10), but it was much stronger (R2 = 0.74, p<0.001) at deeper water depths (>105 m). The concentration of DOC changed less, but TDN increased more rapidly (Figure 5D). This is consistent with the refractory nature of DOC and the production of nitrogen from the degradation of sinking POC in the deep oceans (Maita and Yanada, 1993; Hansell and Carlson, 2013). In the deep NP, hydrodynamic processes such as water mixing and circulation likely play a more dominant role in affecting the distribution of DOC, as found in other oceanic regions (Bercovici and Hansell, 2016; Beaupre et al., 2020; Ding et al., 2020).
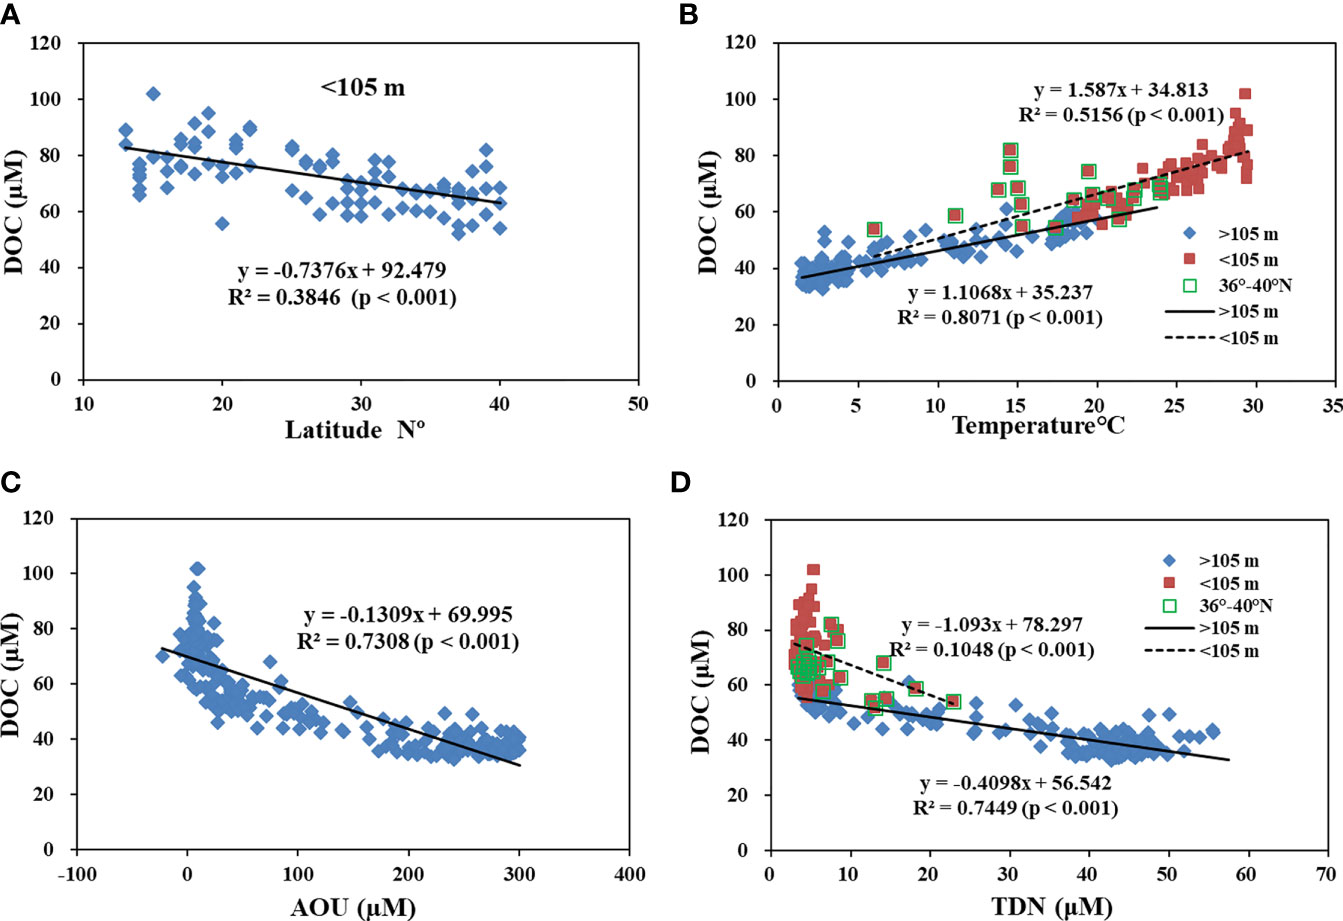
Figure 5 Plots of (A) concentrations of DOC versus latitude in the upper 105 m water depth; (B) concentrations of DOC versus water temperature in the upper 105 m depth and below the 105 m water depth; (C) concentrations of DOC versus apparent oxygen utilization (AOU) for water samples along transect P1; and (D) concentrations of DOC versus TDN for water samples in the upper 105 m depth and below the 105 m water depth along the P1 transect in the western NP. The lines are linear regressions that are fit to the data.
The KE in the western NP is a highly dynamic region with high production and rapid hydrodynamic mixing (Isada et al., 2009; Shiozaki et al., 2014). In our previous study, we collected limited water samples and measured DOC and TDN during spring high production in May 2015 (Ding et al., 2019; 29°N-37°N, TDN data is not published). Here, we compared the seasonal distributions of DOC in November 2019 and May 2015, and plotted DOC, TDN as well as Net Primary Production (NPP) in the euphotic zone (<200 m) as a function of latitude in Figure 6. In the same region (29°N-37°N), the DOC concentrations (68-72 μM) were actually higher than the DOC values (43-63 μM) in the surface water (< 200 m) in May 2015 (Figure 6), but the DOC concentrations in the low latitudes were more accumulated than in the high latitude region (Figure 6). In contrast, the concentration of TDN was much lower in May 2015 (Figure 6B), but the NPP was much higher, especially in the high latitude KE region (up to 2,500 mg/m2/day), and less DOC was accumulated in the water column (Figure 6B). This indicated that during the high NPP spring season, dissolved N was used up rapidly and reached a very low level in the western NP. Nutrient availability, NPP and microbial degradation acted together to control the concentration and distribution of DOC in the upper water depth along the P1 transect in the NP.
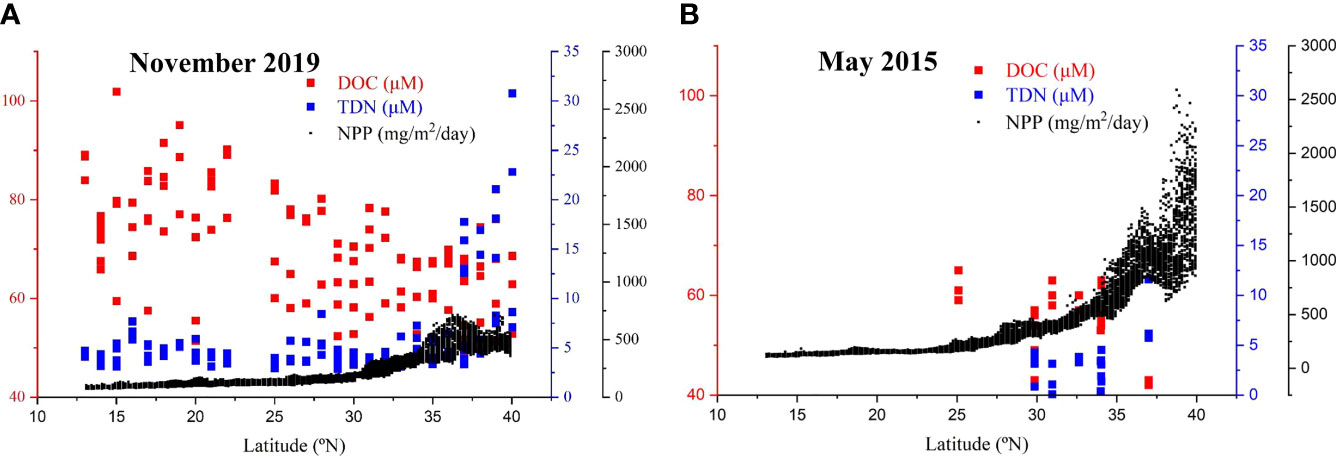
Figure 6 Plots of concentrations of DOC (red) and total dissolved nitrogen (TDN, blue) in the upper water depth (< 200 m) and net primary production (NPP, black) as a function of latitude for samples collected in (A) November 2019 and (B) May 2015. The May 2015 DOC values (Ding et al., 2019) and TDN values (unpublished data) were from our previous study. The calculated NPP was for the surface water in the 145°E -155°E, 13°N -40°N region in the northwestern NP. The NPP was calculated based on satellite chlorophyll data using a vertically generalized production model (VGPM, http://sites.science.oregonstate.edu/ocean.productivity/custom.php, Behrenfeld and Falkowski, 1997).
The temperature of the upper water (200 m) around the KE region was significantly lower in late spring than in November in 2019 (see Supplementary Figure S1), which could be caused by the variability in the Kuroshio/Oyashio system. In May, strong westerly winds in spring drive the cold and nutrient-rich subarctic water south across the subarctic-subtropical boundary (Liu et al., 2004; Isada et al., 2009; Shiozaki et al., 2014), which is related to phytoplankton blooms in the KE region (Figure 6B). The relative high contribution of the subarctic Oyashio water caused the surface water in May 2015 with lower temperature and higher density, resulting in a weak vertical stratification of the upper water column. This could not favor the accumulation of DOC in the surface layer (Hansell et al., 2009; Ding et al., 2019; Hansell and Orellana, 2021). However, our data is still limited in the KE region and further studies are necessary to gain better understanding of the production and cycling of DOC in this region.
The formation of NPIW in the KE in the western NP is a dominant oceanographic process affecting the water movement in the NP (Yasuda et al., 1996; Talley, 1997; Itou et al., 2003; Qiu and Chen, 2011). By examining the T-S diagram (water temperature versus salinity, Figure 7 as well as the significant correlation between DOC and σ0 (Supplementary Figure S2), it demonstrates that the distribution of DOC was strongly related to water masses with different physical properties (temperature and density) along the P1 transect. As shown in Figure 7 and referred to in Figure 2E, we divided the water masses to five regions. Region A has low-density and high-temperature water at the upper 200 m depth at low latitudes (13°N-30°N) with highest DOC concentrations. Region B represents the mixed water at the upper 200-300 m depth, which also has relatively high DOC concentrations. The C region is the mixed water at depths of 300-1,000 m and represents the NPIW water mass in the western NP. Region D represents deep water below a 1,000 m depth along the P1 transect in the western NP, and this water mass has the lowest DOC concentrations. Region E represents the denser and colder water in the upper water of the KE region (36°N-40°N) that is characterized by a relative low DOC concentration.
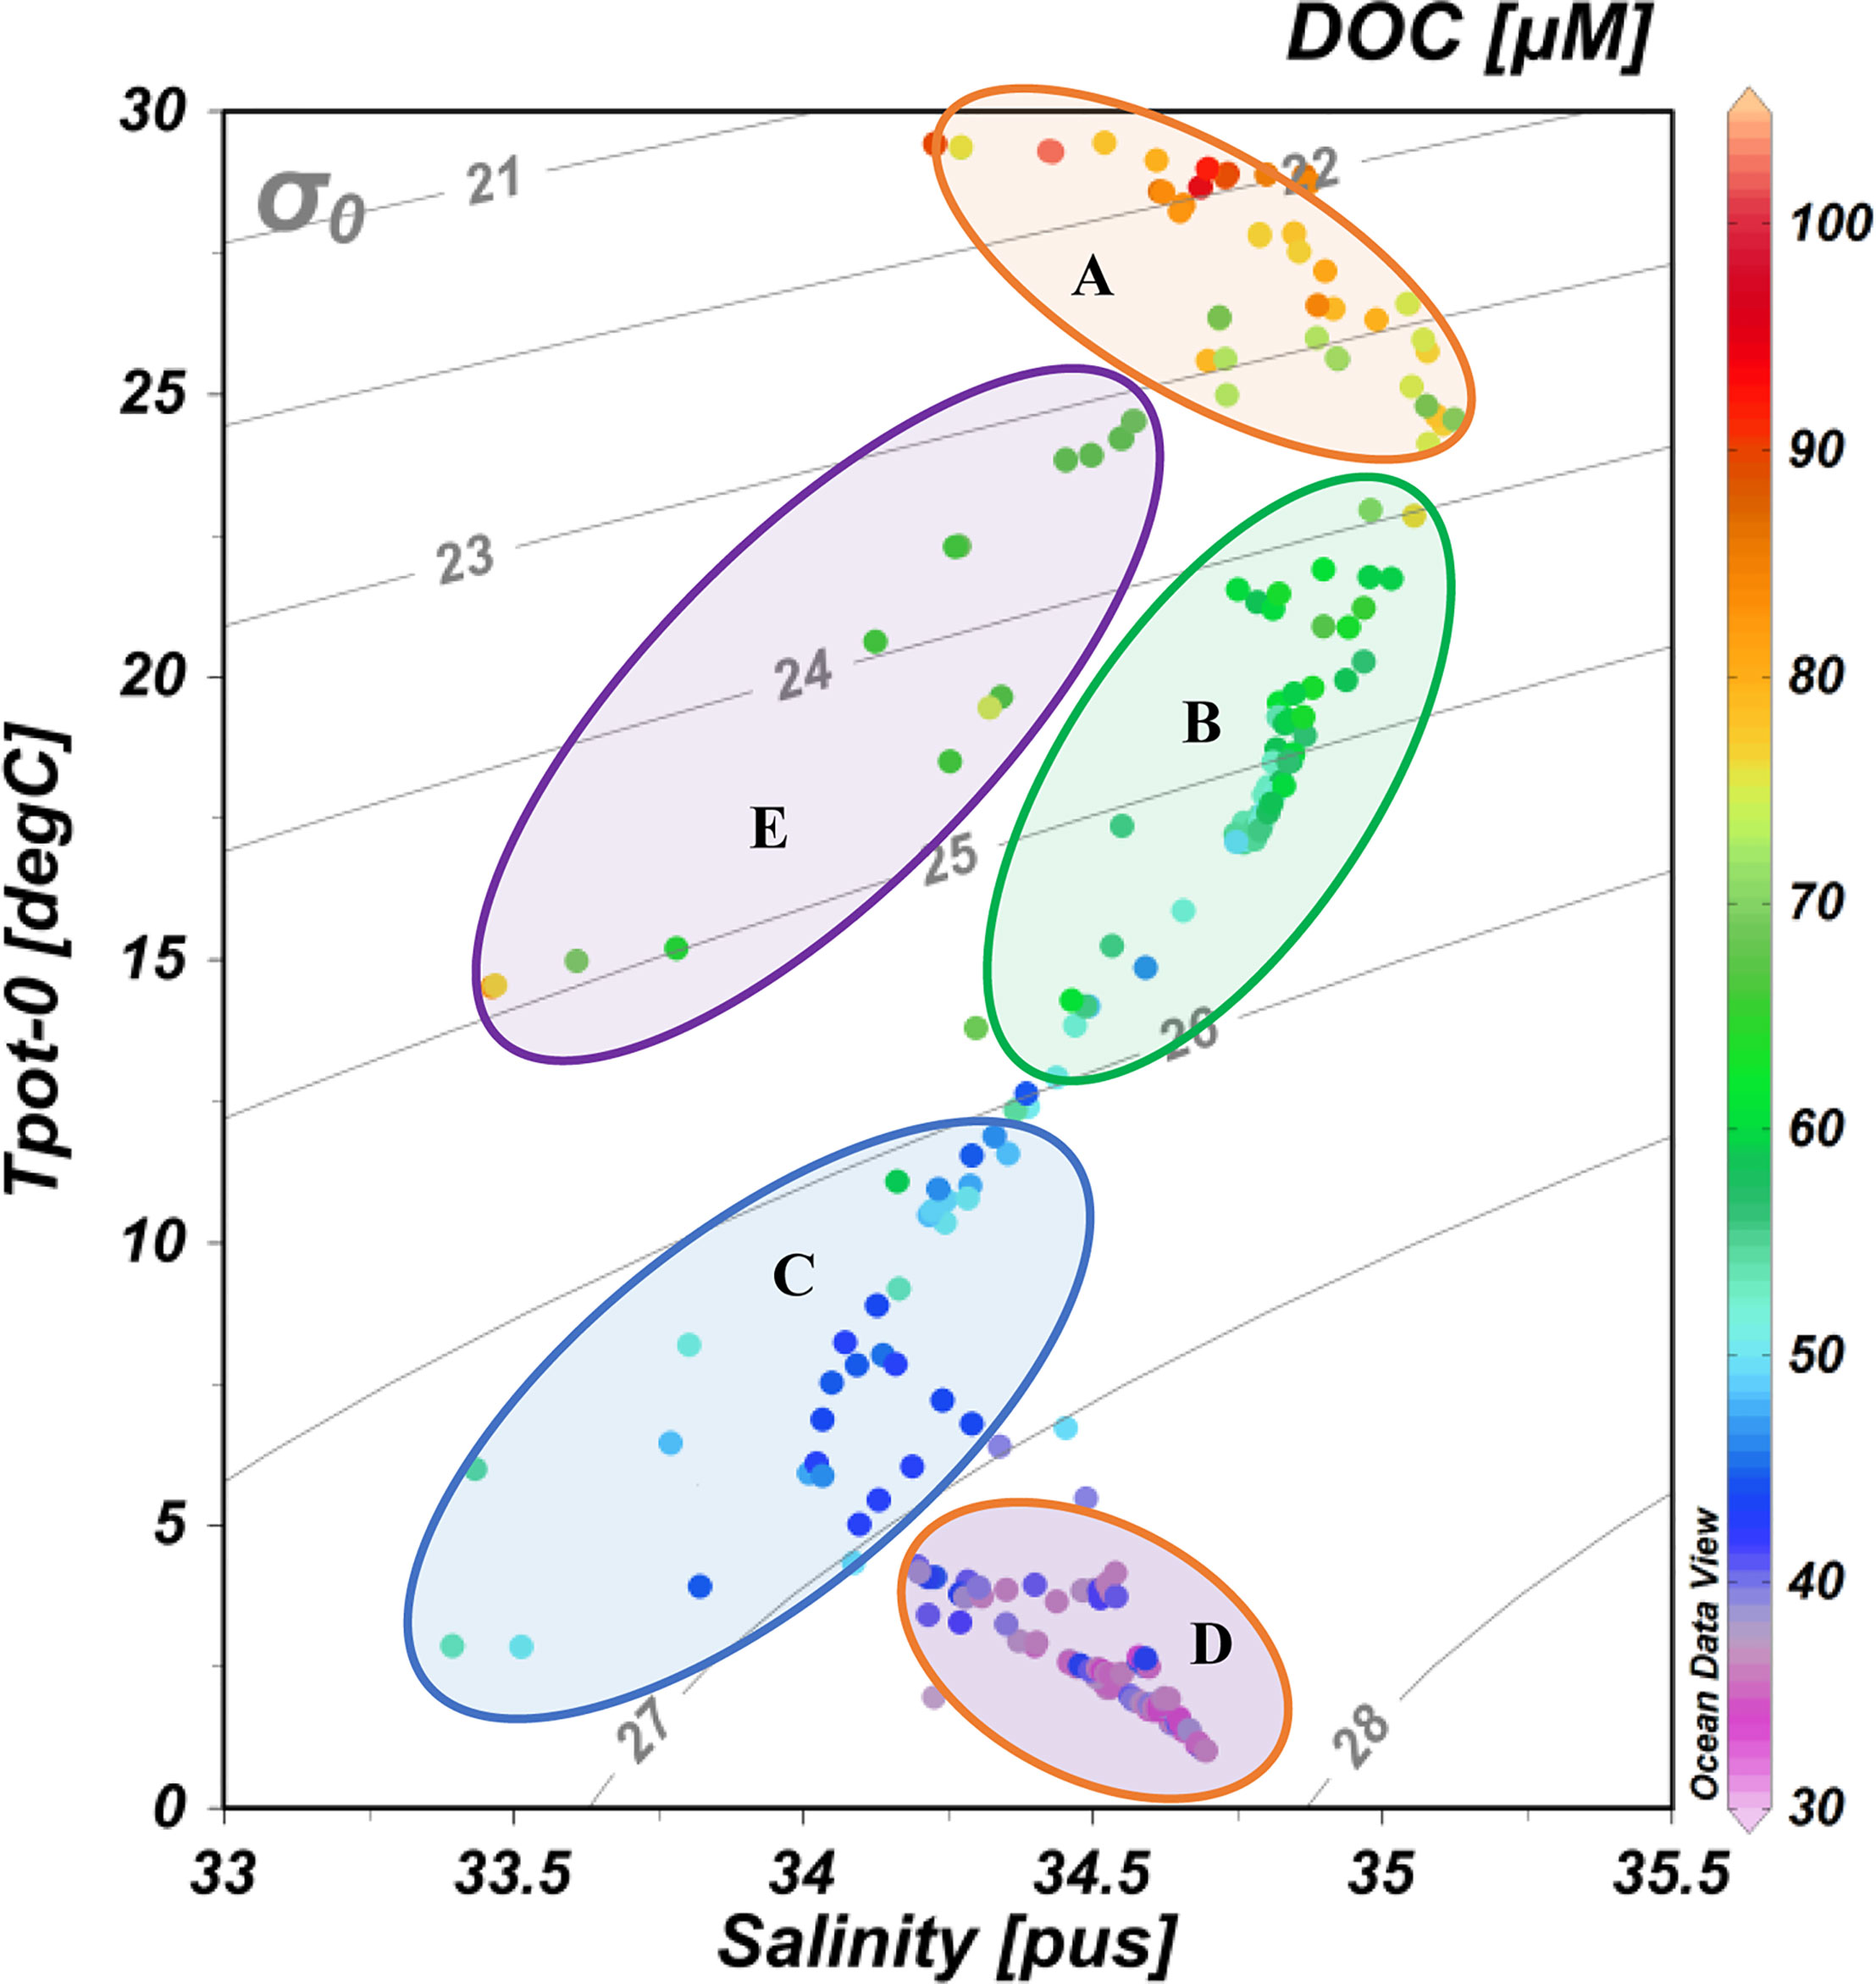
Figure 7 DOC concentrations superimposed on plots of potential temperature vs. salinity at the sampling stations along the P1 transect in the western NP in November 2019. The σ0 isolines are included in the figures. The five circular areas (A–E) represent different water masses with different water temperatures and densities (see discussion in the text). The color bar on the right side indicates DOC concentrations.
The newly formed NPIW in the subtropical Pacific is transported eastward at depths of 300–1,000 m (Figure 1B), and it is characterized by low salinity (as low as 33.8) and low oxygen (50–150 μM) levels and a relatively narrow density range (26.6–27.4σ0, averaging 26.8σ0; Dickson et al., 2000). The NPIW is considered to be the initial mixture of the ventilated subpolar water and subtropical water of equal densities in the mixed water region, and is considered a significant sink for anthropogenic carbon dioxide (Tsunogai et al., 1995; Yasuda et al., 1996; Qiu and Chen, 2011). The eastward transport of newly formed NPIW out of the mixed water depth was estimated at 6.1 Sv (1 Sverdrup = 106 m3/s) for 26.6–27.4σ0 (Talley, 1993; Talley, 1997). Based on the DOC concentration gradient in the density range of 26.6–27.4σ0 in our study (see Supplementary Figure S3), we estimated that the export of SLDOC from the mixed water depth could be ~100 ± 20 Tg C y-1 (1 Tg = 1012 g). These SLDOC fractions were mixed into the subtropical gyre along the NPIW circulation paths. There was a slight southward decrease in the DOC concentrations with latitude (Supplementary Figure S3), and the net export of DOC with the subduction of the NPIW water could be 26 Tg C yr-1, based on the concentration gradient between the subpolar water site (Station P1-1) and the south boundary site (Station P1-27). Microbial consumption could have significantly reduced the concentration of SLDOC as the NPIW travels southward. Ogura (1970) reported that one-third of the biological consumption of oxygen in the beginning of the newly formed NPIW was due to the oxidation of DOC. In the upper water, our results are consistent with this value (~ 30%, Supplementary Figure S3). However, in our study, there was far more oxygen consumption than what could be accounted for by DOC utilization in the subduction of the NPIW water, which accounted for only ~10% of the oxygen consumption (Supplementary Figure S3). Most of the SLDOC mineralization could have occurred at the very beginning of the water circulation of the NPIW, when the water masses met with intensive force. Other factors, such as diapycnal mixing and horizontal mixing, as well as sinking biogenic particles, could also influence the distribution of DOC (Hansell et al., 2002). As reported by Druffel et al. (1996), only approximately 7% of the sinking POC could account for the influence on the DOC at intermediate depths of the NP. We expect that the solubilization process from the sinking POC might not have a quantitatively significant influence on the changes in DOC in the NPIW water in the NP. Previous analyses of this physical system (Yasuda et al., 1996; Talley, 1997) have suggested that the NPIW was dominated by horizontal mixing. Our recent study along the P1 transect also showed different trends in temporal variations of Δ14C-DIC from north to south in the NPIW, indicating a strong influence of advection-diffusion of material at intermediate water depths (Ge et al., 2022).
The results of our study revealed that the concentration of DOC showed large variations in the water depth of the euphotic zone along the P1 transect in the western NP in November 2019. High levels of DOC (63-102 μM) were present in the surface water (25 m) with higher concentrations of DOC at lower latitudes (13°N-25°N) and lower concentrations of DOC at middle to high latitudes (25°N-40°N). The KE region had a high primary production but low concentrations of DOC, largely due to the rapid mixing of the water in the region. The depth profiles of DOC showed a strong vertical gradient, with concentrations of DOC decreasing very rapidly from the surface to a 200 m depth. We estimated that the LDOC fraction that accounted for 20-40% of the surface bulk DOC was respired rapidly at the upper 200 m depth, and the SLDOC fraction that accounted for 15-20% of the surface bulk DOC was exported downward and turned over at water depths of 200-2,000 m. Low concentrations of DOC (~37 μM) were uniformly distributed in deep water (>1,000 m) along the P1 transect in the western NP. In addition to these biological processes, water mixing and regional circulation could play dominant roles in modulating the distribution of DOC below the surface along this transect in the NP. The NPIW is a major transport belt that could carry ~100 ± 20 Tg C y-1 of SLDOC to great depths from the upper mixed layer. The net export of DOC with the subduction of NPIW could be 26 Tg/yr, thus serving as an important pathway of carbon cycling in the deep NP Ocean.
The original contributions presented in the study are included in the article/Supplementary Material. Further inquiries can be directed to the corresponding author.
XW, JZ, ZC designed the study and helped on the cruise. TG participated in the study and wrote the manuscript. CL and PR collected samples. CL, HZ, TG, and HC carried out chemical analyses of the samples. All authors provided intellectual input for data interpretation and writing of the manuscript. All authors contributed to the article and approved the submitted version.
Financial support for this work was provided by the Ocean Program of the National Natural Science Foundation of China (Grant numbers 91858210 and 41476057) and the Western Pacific P1 Section Observation Voyage of the Shandong Major Science and Technology Innovation Project (2018SDKJ0105-1).
The authors declare that the research was conducted in the absence of any commercial or financial relationships that could be construed as a potential conflict of interest.
All claims expressed in this article are solely those of the authors and do not necessarily represent those of their affiliated organizations, or those of the publisher, the editors and the reviewers. Any product that may be evaluated in this article, or claim that may be made by its manufacturer, is not guaranteed or endorsed by the publisher.
We thank the captain and crew of the R/V Dongfanghong-3 for their assistance during the cruise. We thank Editor Dr. Zhaohui Zhang and the three reviewers for the valuable and constructive comments. The raw data from this study are provided in Supplementary Table 1 of the Supplementary Material.
The Supplementary Material for this article can be found online at: https://www.frontiersin.org/articles/10.3389/fmars.2022.909148/full#supplementary-material
Arıstegui J., Duarte C. M., Agustı S., Doval M., Álvarez-Salgado X. A., Hansell D. A. (2002). Dissolved Organic Carbon Support of Respiration in the Dark Ocean. Science 298 (5600), 1967–1967. doi: 10.1126/science.1076746
Bauer J. E., Williams P. M., Druffel E. R. M. (1992). 14C Activity of Dissolved Organic Carbon Fractions in the North Central Pacific and Sargasso Sea. Nature 357, 667–670. doi: 10.1038/357667a0
Beaupre S. R., Walker B. D., Druffel E. R. (2020). The Two-Component Model Coincidence: Evaluating the Validity of Marine Dissolved Organic Radiocarbon as a Stable-Conservative Tracer at Station M. Deep. Sea. Res. Part II. 173, 104737. doi: 10.1016/j.dsr2.2020.104737
Behrenfeld M. J., Falkowski P. G. (1997). Photosynthetic Rates Derived From Satellite Based Chlorophyll Concentration. Limnol. Oceanogr. 42, 1–20. doi: 10.4319/lo.1997.42.1.0001
Bercovici S. K., Hansell D. A. (2016). Dissolved Organic Carbon in the Deep Southern Ocean: Local Versus Distant Controls. Global Biogeochem. Cycles. 30 (2), 350–360. doi: 10.1002/2015GB005252
Bryan J. R., Rlley J. P., Williams P. L. (1976). A Winkler Procedure for Making Precise Measurements of Oxygen Concentration for Productivity and Related Studies. J. Exp. Mar. Biol. Ecol. 21 (3), 191–197. doi: 10.1016/0022-0981(76)90114-3
Carlson C. A., Hansell D. A. (2015). “DOM Sources, Sinks, Reactivity, and Budgets,” in Biogeochemistry of marine dissolved organic matter. 2nd Edi. Eds. Hansell D. A., Carlson C. A. (Burlington: Academic Press), 65–126.
Carlson C. A., Hansell D. A., Nelson N. B., Siegel D. A., Smethie W. M., Khatiwala S., et al. (2010). Dissolved Organic Carbon Export and Subsequent Remineralization in the Mesopelagic and Bathypelagic Realms of the North Atlantic Basin. Deep. Sea. Res. Part II. 57, 1433–1445. doi: 10.1016/j.dsr2.2010.02.013
Dickson R., Hurrell J., Bindoff N., Wong A., Arbic B., Owens B., et al. (2000). “The World During WOCE,” in Ocean Circulation and Climate Observing and Modelling the Global Ocean. Eds. Siedler G., Church J., Gould J. (Burlington: Academic Press), 557–585.
Ding L., Ge T., Gao H., Luo C., Xue Y., Druffel E. R. M., et al. (2018). Large Variability of Dissolved Inorganic Radiocarbon in the Kuroshio Extension of the Northwest North Pacific. Radiocarbon 60 (2), 691–704. doi: 10.1017/RDC.2017.143
Ding L., Ge T., Wang X. (2019). Dissolved Organic Carbon Dynamics in the East China Sea and the Northwest Pacific Ocean. Ocean. Sci. 15 (5), 1177–1190. doi: 10.5194/os-15-1177-2019
Ding L., Qi Y., Shan S., Ge T., Luo C., Wang X. (2020). Radiocarbon in Dissolved Organic and Inorganic Carbon of the South China Sea. J. Geophys. Res. Oceans 124, 1–14. doi: 10.1029/2020JC016073
Doval M. D., Hansell D. A. (2000). Organic Carbon and Apparent Oxygen Utilization in the Western South Pacific and the Central Indian Oceans. Mar. Chem. 68, 249–264. doi: 10.1016/S0304-4203(99)00081-X
Druffel E. R., Bauer J. E., Williams P. M., Griffin S., Wolgast D. (1996). Seasonal Variability of Particulate Organic Radiocarbon in the Northeast Pacific Ocean. J. Geophys. Res. 101 (C9), 20543–20552. doi: 10.1029/96JC01850
Druffel E. R. M., Griffin S., Coppola A. I., Walker B. D. (2016). Radiocarbon in Dissolved Organic Carbon of the Atlantic Ocean. Geophys. Res. Lett. 43, 5279–5286. doi: 10.1002/2016GL068746
Druffel E. R., Griffin S., Lewis C. B., Rudresh M., Garcia N. G., Key R. M., et al. (2021). Dissolved Organic Radiocarbon in the Eastern Pacific and Southern Oceans. Geophys. Res. Lett. 48 (10), e2021GL092904. doi: 10.1029/2021GL092904
Druffel E. R. M., Griffin S., Wang N., Garcia N. G., McNichol A. P., Key R. M., et al. (2019). Dissolved Organic Radiocarbon in the Central Pacific Ocean. Geophys. Res. Lett. 46 (10), 5396–5403. doi: 10.1029/2019GL083149
Druffel E. R., Williams P. M., Bauer J. E., Ertel J. R. (1992). Cycling of Dissolved and Particulate Organic Matter in the Open Ocean. J. Geophys. Res. Oceans 97 (C10), 15639–15659. doi: 10.1029/92JC01511
Druffel E. R. M., Griffin S. (2015). Radiocarbon in Dissolved Organic Carbon of the South Pacific Ocean. Geophys. Res. Lett. 42(10), 4096–4101. doi: 10.1002/2015GL063764
Follett C. L., Repeta D. J., Rothman D. H., Xu L., Santinelli C. (2014). Hidden Cycle of Dissolved Organic Carbon in the Deep Ocean. P. Natl. Acad. Sci. U.S.A. 111 (47), 16706–16711. doi: 10.1073/pnas.1407445111
Fontela M., García-Ibáñez M. I., Hansell D. A., Mercier H., Pérez F. F. (2016). Dissolved Organic Carbon in the North Atlantic Meridional Overturning Circulation. Sci. Rep. 6 (1), 1–9. doi: 10.1038/srep26931
Ge T., Luo C., Ren P., Zhang H., Chen Z., Sun S., et al. (2022). Decadal Variations in Radiocarbon in Dissolved Inorganic Carbon (DIC) Along a Transect in the Western North Pacific Ocean. J. Geophys. Res. Oceans 127, e2021JC017845. doi: 10.1029/2021JC017845
Hansell D. A., Carlson C. A. (2001). Marine Dissolved Organic Matter and the Carbon Cycle. Oceanography 14 (4), 41–49. doi: 10.5670/oceanog.2001.05
Hansell D. A., Carlson C. A. (2013). Localized Refractory Dissolved Organic Carbon Sinks in the Deep Ocean. Global Biogeochem. Cycles. 27 (3), 705–710. doi: 10.1002/gbc.20067
Hansell D. A., Carlson C. A., Repeta D. J., Schlitzer R. (2009). Dissolved Organic Matter in the Ocean: New Insights Stimulated by a Controversy. Oceanography 22, 202–211. doi: 10.5670/oceanog.2009.109
Hansell D. A., Carlson C. A., Suzuki Y. (2002). Dissolved Organic Carbon Export With North Pacific Intermediate Water Formation. Global Biogeochem. Cycles. 16 (1), 7–1. doi: 10.1029/2000GB001361
Hansell D. A., Orellana M. V. (2021). Dissolved Organic Matter in the Global Ocean: A Primer. Gels 7 (3), 128. doi: 10.3390/gels7030128
Hu D., Wu L., Cai W., Gupta A. S., Ganachaud A., Qiu B., et al. (2015). Pacific Western Boundary Currents and Their Roles in Climate. Nature 522 (7556), 299–308. doi: 10.1038/nature14504
Isada T., Kuwata A., Saito H., Ono T., Ishii M., Yoshikawa-Inoue H., et al. (2009). Photosynthetic Features and Primary Productivity of Phytoplankton in the Oyashio and Kuroshio–Oyashio Transition Regions of the Northwest Pacific. J. Plankton. Res. 31 (9), 1009–1025. doi: 10.1093/plankt/fbp050
Itou M., Ono T., Noriki S. (2003). Provenance of Intermediate Waters in the Western North Pacific Deduced From Thermodynamic Imprint On δ13C of DIC. J. Geophys. Res. 108 (C11), 3347. doi: 10.1029/2002JC001746
Jiao N., Herndl G. J., Hansell D. A., Benner R., Kattner G., Wilhelm S. W., et al. (2010). Microbial Production of Recalcitrant Dissolved Organic Matter: Long-Term Carbon Storage in the Global Ocean. Nat. Rev. Microbiol. 8, 593–599. doi: 10.1038/nrmicro2386
Kujawinski E. B. (2011). The Impact of Microbial Metabolism on Marine Dissolved Organic Matter. Annu. Rev. Mar. Sci. 3, 567–599. doi: 10.1146/annurev-marine-120308-081003
Lee C., Wakeham S. (1988). “Chemical Oceanography,” in Organic matter in Seawater: Biogeochemical Processes. Ed. Riley J. P. (Burlington: Academic Press), 1–27.
Liu H., Suzuki K., Saito H. (2004). Community Structure and Dynamics of Phytoplankton in the Western Subarctic Pacific Ocean: A Synthesis. J. Oceanogr. 60, 119–137.
Lopez C. N., Robert M., Galbraith M., Bercovici S. K., Orellana M. V., Hansell D. A. (2020). High Temporal Variability of Total Organic Carbon in the Deep Northeastern Pacific. Front. Earth Sci. 8. doi: 10.3389/feart.2020.00080
Maita Y., Yanada M. (1993). “Distribution of Dissolved Organic Nitrogen in the North Pacific Ocean,” in Deep ocean circulation: physical and chemical aspects. Ed. Teramoto T. (Amseerdam: Elsevier science publisher), 185–197.
Moran M. A., Ferrer-González F. X., Fu H., Nowinski B., Olofsson M., Powers M. A, et al. (2022). The Ocean's Labile DOC Supply Chain. Limnol. Oceanogr. 67, 1007–1021. doi: 10.1002/lno.12053
Ogawa H., Amagai Y., Koike I., Kaiser K., Benner R. (2001). Production of Refractory Dissolved Organic Matter by Bacteria. Science 292 (5518), 917–920. doi: 10.1126/science.1057627
Ogura N. (1970). The Relation Between Dissolved Organic Carbon and Apparent Oxygen Utilization in the Western North Pacific. Deep. Sea. Res. 17, 221–231. doi: 10.1016/0011-7471(70)90016-1
Qiu B. O., Chen S. (2011). Effect of Decadal Kuroshio Extension Jet and Eddy Variability on the Modification of North Pacific Intermediate Water. J. Phys. Oceanogr. 41 (3), 503–515. doi: 10.1175/2010JPO4575.1
Repeta D. J. (2015). “Chemical Characterization and Cycling of Dissolved Organic Matter,” in Biogeochemistry of marine dissolved organic matter, 2nd Edn. Eds. Hansell D. A., Carlson C. A. (Burlington: Academic Press), 21–63.
Schlitzer R. (2015) Ocean data view. Available at: http://odv.awi.de.
Shan S., Qi Y., Tian J., Wang X., Luo C., Zhou C., et al. (2020). Carbon Cycling in the Deep Mariana Trench in the Western North Pacific Ocean: Insights From Radiocarbon Proxy Data. Deep. Sea. Res. Part I 164, 103370. doi: 10.1016/j.dsr.2020.103370
Sharp J. H., Benner R., Bennett L., Carlson C. A., Fitzwater S. E., Peltzer E. T., et al. (1995). Analyses of Dissolved Organic Carbon in Seawater: The JGOFS EqPac Methods Comparison. Mar. Chem. 48 (2), 91–108. doi: 10.1016/0304-4203(94)00040-K
Sharp J. H., Carlson C. A., Peltzer E. T., Castle-Ward D. M., Savidge K. B., Rinker K. R. (2002). Final Dissolved Organic Carbon Broad Community Intercalibration and Preliminary Use of DOC Reference Materials. Mar. Chem. 77 (4), 239–253. doi: 10.1016/S0304-4203(02)00002-6
Shen Y., Benner R. (2020). Molecular Properties Are a Primary Control on the Microbial Utilization of Dissolved Organic Matter in the Ocean. Limnol. Oceanogr. 65 (5), 1061–1071. doi: 10.1002/lno.11369
Shiozaki T., Ito S., Takahashi K., Saito H., Nagata T., Furuya K. (2014). Regional Variability of Factors Controlling the Onset Timing and Magnitude of Spring Algal Blooms in the Northwestern North Pacific. J. Geophys. Res. Oceans 119, 253–265. doi: 10.1002/2013JC009187
Smith K. L., Ruhl H. A., Huffard C. L., Messié M., Kahru M. (2018). Episodic Organic Carbon Fluxes From Surface Ocean to Abyssal Depths During Long-Term Monitoring in NE Pacific. Proc. Natl. Acad. Sci. U.S.A. 115 (48), 12235–12240. doi: 10.1073/pnas.1814559115
Takahashi T., Sutherland S. C., Sweeney C., Poisson A., Metzl N., Tilbrook B., et al. (2002). Global Sea–air CO2 Flux Based on Climatological Surface Ocean pCO2, and Seasonal Biological and Temperature Effects. Deep. Sea. Res. Part II. 49 (9–10), 1601–1622. doi: 10.1016/S0967-0645(02)00003-6
Takahashi T., Sutherland S. C., Wanninkhof R., Sweeney C., Feely R., et al. (2009). Climatological Mean and Decadal Change in Surface Ocean pCO2, and Net Sea-Air CO2 Flux Over the Global Oceans. Deep. Sea. Res. Part II. 56 (8–10), 554–577. doi: 10.1016/j.dsr2.2008.12.009
Talley L. D. (1993). Distribution and Formation of North Pacific Intermediate Water. J. Phys. Oceanogr. 23 (3), 517–538. doi: 10.1175/1520-0485(1993)0232.0.CO;2
Talley L. D. (1997). North Pacific Intermediate Water Transports in the Mixed Water Region. J. Phys. Oceanogr. 27 (8), 1795–1803. doi: 10.1175/1520-0485(1997)027<1795:NPIWTI>2.0.CO;2
Talley L. D., Nagata Y., Fujimura M., Iwao T., Kono T., Inagake D., et al. (1995). North Pacific Intermediate Water in the Kuroshio/Oyashio Mixed Water Region. J. Phys. Oceanogr. 25 (4), 475–501. doi: 10.1175/1520-0485(1995)025<0475:NPIWIT>2.0.CO;2
Tsunogai S., Watanabe S., Honda M., Aramaki T. (1995). North Pacific Intermediate Water Studied Chiefly With Radiocarbon. J. Oceanogr. 51 (5), 519–536. doi: 10.1007/BF02270522
Williams P. M., Druffel E. R. M. (1987). Radiocarbon in Dissolved Organic Matter in the Central North Pacific Ocean. Nature 330 (6145), 246–248. doi: 10.1038/330246a0
Yasuda I. (2004). North Pacific Intermediate Water: Progress in Sage (Subarctic Gyre Experiment) and Related Projects. J. Oceanogr. 60 (2), 385–395. doi: 10.1023/B:JOCE.0000038344.25081.42
Keywords: ocean carbon cycle, dissolved organic carbon, Western North Pacific Ocean, Kuroshio Extension, North Pacific Intermediate Water
Citation: Ge T, Luo C, Ren P, Zhang H, Chen H, Chen Z, Zhang J and Wang X (2022) Dissolved Organic Carbon Along a Meridional Transect in the Western North Pacific Ocean: Distribution, Variation and Controlling Processes. Front. Mar. Sci. 9:909148. doi: 10.3389/fmars.2022.909148
Received: 31 March 2022; Accepted: 24 May 2022;
Published: 20 June 2022.
Edited by:
Zhaohui Zhang, Zhejiang University, ChinaReviewed by:
Laodong Guo, University of Wisconsin–Milwaukee, United StatesCopyright © 2022 Ge, Luo, Ren, Zhang, Chen, Chen, Zhang and Wang. This is an open-access article distributed under the terms of the Creative Commons Attribution License (CC BY). The use, distribution or reproduction in other forums is permitted, provided the original author(s) and the copyright owner(s) are credited and that the original publication in this journal is cited, in accordance with accepted academic practice. No use, distribution or reproduction is permitted which does not comply with these terms.
*Correspondence: Xuchen Wang, eHVjaGVud2FuZ0BvdWMuZWR1LmNu
†These authors have contributed equally to this work and share first authorship
Disclaimer: All claims expressed in this article are solely those of the authors and do not necessarily represent those of their affiliated organizations, or those of the publisher, the editors and the reviewers. Any product that may be evaluated in this article or claim that may be made by its manufacturer is not guaranteed or endorsed by the publisher.
Research integrity at Frontiers
Learn more about the work of our research integrity team to safeguard the quality of each article we publish.