- 1Fish Nutrition Research Laboratory, Department of Zoology, University of Kashmir, Srinagar, India
- 2Department of Biochemistry, University of Kashmir, Srinagar, India
- 3Department of Biotechnology, University of Kashmir, Srinagar, India
We evaluated the effect of arginine on growth, hemato-biochemical variables, intestinal enzymes, antioxidant ability, and expression of target of rapamycin (TOR) signaling pathway related genes in fingerling Oncorhynchus mykiss. A series of six uniform diets consisting of 450 g kg-1 of protein and 20.9 g-1 of energy with graduated levels (10.0, 12.5, 15.0, 17.5, 20.0, and 22.5 g kg-1) of arginine were formulated. Significant (p < 0.05) variations were observed in various analyzed parameters. Growth parameters showed a positive linear trend with increasing arginine levels up to 17.5 g kg-1. Fish offered 17.5 g kg-1 of dietary arginine exhibited highest body protein, lowest moisture, and intermediate fat contents, whereas, body ash content did not significantly (p > 0.05) change with respect to each dietary arginine offered diet, except for the lowest levels. Each group also produced significant (p < 0.05) changes in their hematological variables with maximum hemoglobin (Hb), hematocrit (Hct) content, and red blood cell (RBC) count noted at 17.5 g kg-1 arginine diet. Although the majority of blood plasma parameters were insignificantly (p > 0.05) different with respect to varied arginine fed diets, plasma aspartate transaminase (AST) showed significant (p < 0.05) variations across the treatments. Moreover, total protein, alkaline phosphatase (ALP) and albumin contents increased significantly (p < 0.05) with increasing arginine concentrations up to 17.5 g kg-1 and, thereafter, a declined trend in these parameters were noted. Intestinal enzymes and antioxidant properties showed significant (p < 0.05) variations, except plasma amylase, which showed insignificant variation. The maximum up-regulation of TOR and 4E-BP1 gene expression levels were found for fish fed 17.5 g kg-1 of dietary arginine compared to the lower (10.0 and 12.5 g kg-1) and higher (20.0 and 22.5 g kg-1) arginine levels, which indicates that fish utilize arginine more efficiently at this point. Quadratic regression analysis of live weight gain (LWG), feed conversion ratio (FCR), protein efficiency ratio (PER) and body protein deposition (BPD) indicated the optimal arginine requirement of rainbow trout to be 17.61 g kg-1 of dry diet, corresponding to 39.13 g kg-1 of dietary protein, which enhances growth, immunity, antioxidant ability, and also promote TOR signaling pathway in rainbow trout.
Introduction
Aquafarming has a great potential to provide a source of good quality protein and calories that help in supplying nutritionally rich food to a large segment of the world’s population (FAO, 2020). In recent years, aquafarming has gained a momentum and gets the attention of the world due to its innate advantages (Hardy, 2010). Since, the productivity return in aquaculture is many folds higher than that of traditional agriculture, it is considered one of the best available alternatives to aquaculture, both in developed as well as developing countries (Tacon and Metian, 2013). The proteins obtained from fish has an edge over the animal sources and is thus considered as the best source of food being produced presently (FAO, 2020). However, the main problem presently faced by fish farmers in the world is the availability of low-cost, good-quality fish feed ingredients, especially at the time when demands and price for many of the commonly used fish feed ingredients have drastically increased [NRC (National Research Council), 2011]. Hence, there is a need for putting additional efforts in one of the crucial areas of aquaculture, i.e., supplementary feeding, which has become a life line for the commercial success of aquaculture (Gatlin, 2010). The success of getting a good return through aquaculture is mainly based on the knowledge of optimum quantitative and qualitative dietary requirements of both macro and micro nutrients of the concerned fish species (Khan and Khan, 2021). Therefore, the prerequisite of additional feed, together with essential macro and micro nutrient needs by the fish, has become the chief factor of any farming system (Khan and Khan, 2022).
Among both macro and micro nutrients required by fish, amino acids are considered an essential micronutrient that is actually obtained from a good quality protein diet (Ahmed, 2013). These are building blocks for tissue proteins and acts as effective antioxidants as well as hormone secretion regulators (Jobgen et al., 2006; Larson et al., 2007; Wang et al., 2007; Hu et al., 2008). Arginine, as one of the essential amino acid in fish, is treated as one of the most versatile amino acids and has different physiological roles such as nitrogen metabolism, inflammation, immune responses, and is considered the significant substrate for the production of nitric oxide (Jobgen et al., 2006; Costas et al., 2011; Zhou et al., 2015; Hoseini et al., 2020). It is also involved in protein metabolism (Liang et al., 2016) and the synthesis of creatine, ornithine, glutamate, polyamines, and agmatine (Wu and Morris, 1998; Liang et al., 2016). Moreover, arginine provides the amino group for creatine synthesis and plays a significant part in high-energy phosphate for ATP recovery in the fish muscle (Zhou et al., 2012). Furthermore, supplementation of arginine has been accounted to stimulate macrophages for cytokine secretion (Barbul, 1995). It has additionally been proven that arginine might expand total leucocyte counts due to its main function as a substrate for polyamine biosynthesis purpose, which are fundamental for cell expansion and differentiation, and further associated with haematopoiesis (Narita et al., 1995; Shah et al., 2002). The role of arginine has obviously been exhibited in different growth-related mechanisms together with insulinotropic impact (Plisetskaya et al., 1991). Past studies revealed that 10.0–32.0 g kg-1 of dietary arginine is suitable for the proper growth of fish [NRC (National Research Council), 2011]. The role of arginine for the improvement of growth and other immune related processes has clearly been demonstrated in several fish species (Cheng et al., 2011; Chen et al., 2012; Zehra and Khan, 2013; Jiang et al., 2015; Liang et al., 2016).
Moreover, translation initiation limits protein synthesis, which is a major component of the mechanisms involved in growth response (Anthony et al., 2001). The ribosomal protein S6 kinase-polypeptide 1 (S6K1) and the eukaryotic translation initiation factor 4E-binding proteins (4E-BPs) are well known to initiate translation and drive protein synthesis by TOR (Liang et al., 2016). In mammalian studies, the TOR signalling system has become a hotspot and the fundamental purpose of arginine in protein synthesis is to activate the TOR signalling system, which controls fish protein synthesis and cell development (Wullschleger et al., 2006). Furthermore, dietary arginine supplementation has been shown to boost TOR signalling activity (Holz et al., 2005; Liang et al., 2016).
Rainbow trout is one of the chief priced fish and has tremendous scope for its captive culture due to the fast growth, good nutritional value, and high market demands. At the present time, determination of any amino acid requirement is a top priority in nutritional research. Although, in the past, several studies pertaining to arginine requirement have been conducted on several fish species including rainbow trout based on a conventional dose-response study [Ogino, 1980; NRC (National Research Council), 2011; Fauzi et al., 2019; Wang et al., 2022], however, the impact of arginine on other growth and health related parameters as well as TOR signaling pathway has not been evaluated. Since arginine has a pivotal effect on protein synthesis and signaling pathway, it is essential to analyze all these parameters for establishing the exact arginine requirement for this fish.
Materials and Methods
2.1 Diet Preparation
Six isoproteic (450 g kg-1) and isoenergetic (20.90 kj g-1, GE) diets containing elevated levels of arginine [Loba Chemie, Mumbai, India (98% purity)] 10.0, 12.5, 15.0, 17.5, 20.0, and 22.5 g kg-1 were first prepared possessing casein (fat-free), gelatin, and L-crystalline amino acid premix (Table 1). In all the diets, protein content was fixed on the basis of our previous study conducted under similar conditions (Ahmed and Ahmad, 2020). The amino acid content of all the diets used in the present study was adjusted to mimic the 40% whole egg protein, except arginine, which was supplied in gradation of 2.5 g kg-1 in each diet. Casein and gelatin quantity was fixed in the diets according to the criteria that provided the lowest quantity of arginine and highest quantity of rest amino acids. The amount of arginine was increased by replacing aspartic acid, serine, and glycine in order to obtain the constant nitrogen in experimental diets. The doses of arginine in the testing diets were designed based on the literature available on fish arginine requirements [Halver, 2002; NRC (National Research Council), 2011]. The same method was followed for diet preparation as described earlier (Ahmed, 2014). For the preparation of vitamin and mineral premixes, the Halver (2002) method was employed. Feed pellets were formed using a pelletizer fitted with a 2mm die, oven dried at 40°C so the moisture content was reduced to below 100 g kg−1 and then thoroughly crushed, sealed in airtight polythene bags and stored at 4°C until use.
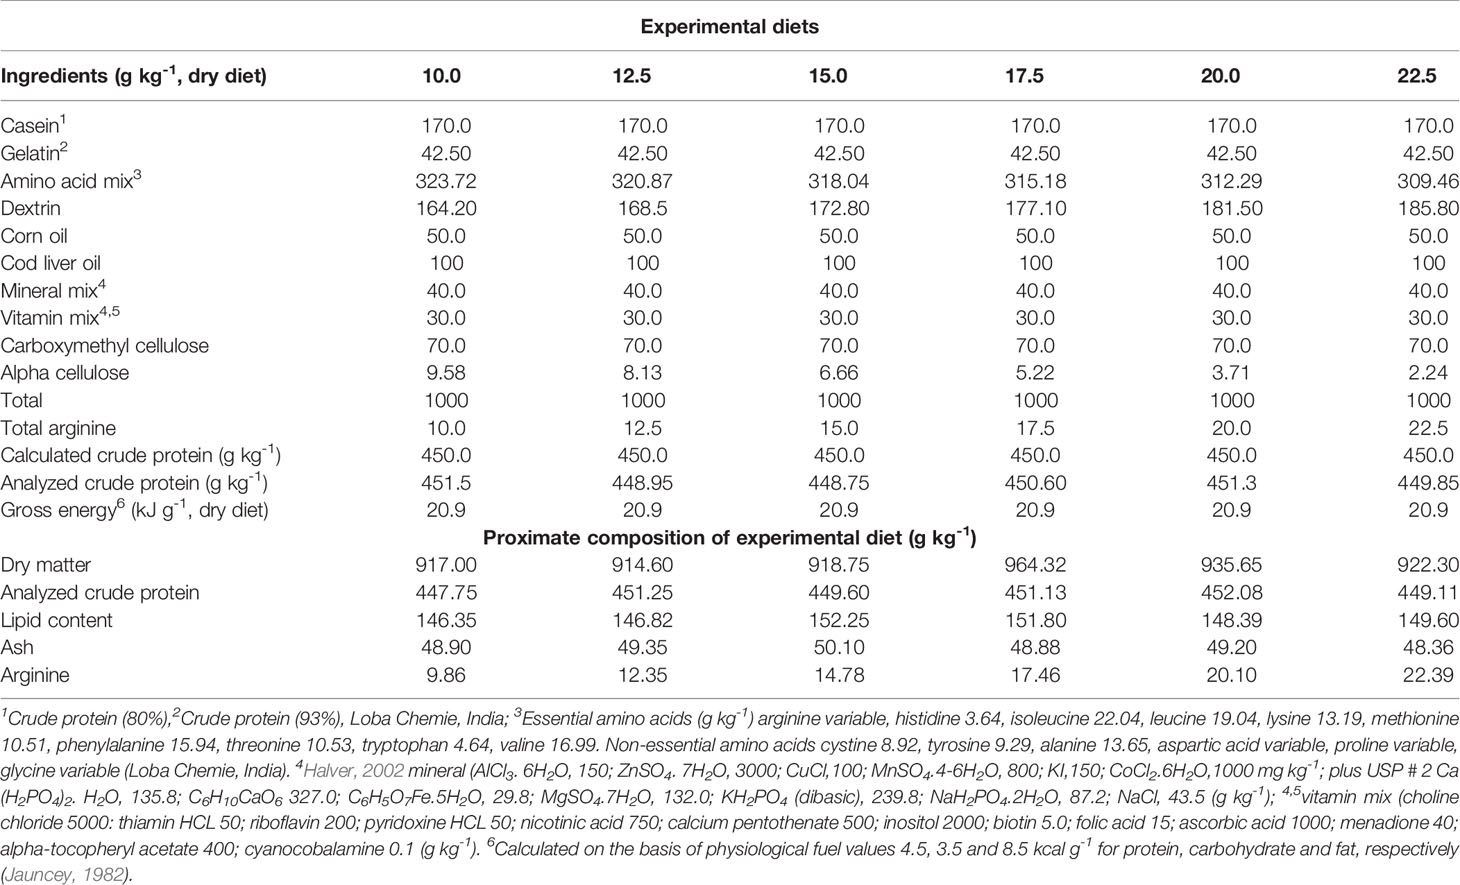
Table 1 Composition of experimental diets used for estimating the dietary arginine requirement of fingerling rainbow trout, Oncorhynchus mykiss.
2.2 Fish and Experimental Procedure
From the local fish government hatchery, Laribal Dachigam in Srinagar, rainbow trout fingerlings of equal size and in visibly good health were procured and shipped to the wet laboratory at Kashmir University. First, the fish were given a dip of potassium permanganate (KMno4) to rule out any possible infectivity and were then stocked under a nonstop flow-through system for a period of 15 days. During this period, fish were offered a mixture of practical diet. After that, around 450 fingerlings were taken out from the whole batch and then again acclimated on synthetic diet for a 2-week period (Halver, 2002). Then 360 fingerlings (1.75 ± 0.03 g; 5.34 ± 0.31 cm) from the same batch were distributed with 20 fish per trough in triplicates in 70 L circular tanks (water volume 60 L) connected to a running water system with a flow rate of 2-2.5 Lmin−1. They were offered experimental diets at morning (09:00) and evening (17:00h) time at the rate of 5% BW day-1 (Ahmed, 2012). The whole experimental process was lasted for 8-weeks. The remaining procedure of the experimental trial was similar to the one detailed earlier (Ahmed and Ahmad, 2020).
2.3 Water Quality Analysis
On an alternate daily basis, the estimation of water quality variables was assayed. Samples were taken during morning (09:00 h) time. Water temperature (10.9-15.8°C) was analyzed with the help of mercury thermometer, while remaining variables such as dissolved oxygen (6.7-7.2 mg L−1), free carbon dioxide (6.0-11.9 mg L−1), and total alkalinity (74-79 mg L−1) were estimated by the APHA (1992) method. Moreover, pH (6.3-7.2) was recorded using pH meter (pH ep-HI 98107, USA).
2.4 Chemical Analysis
The standard method AOAC (1995) was employed for the estimation of proximate analysis of experimental diets and fish samples. For the determination of moisture, the oven drying method at 105 ± 1°C for 22 h was used, the N-Kjeldhal × 6.25 Kjeltec 8400 (FOSS Denmark) method for crude protein, the solvent extraction method with petroleum ether B.P. 40-60°C using soxlet extraction technique (FOSS Avanti automatic 2050, Sweden) for the estimation of crude lipid was used, while the oven incineration at 650°C for 2-4 h (Muffle furnace YSPL-532, India) method was used for ash determination. Analysis of amino acid content in the diets was performed from an ISO 9001:2015 certified professional laboratory Aakaar Biotechnologies Private Limited Lucknow, India using HPLC technique (Waters Alliance 2695 HPLC System) and further assayed by the method adapted by Ahmed and Khan (2004). The 100 mg dry powdered test sample was added 2 ml of 8 N sulphuric acid and the contents were sealed in a glass ampule under vacuum. The content was boiled at 110°C for 18-20 h for complete hydrolysis of protein, cooled, and neutralized with saturated barium chloride solution and centrifuged at 10,000 x g to get a clear supernatant of hydrolyzed protein. The amino acids contained in the hydrolyzed sample were derivatized using phenylisothiocyanate. A 100 µl sample was mixed with 1 ml of coupling buffer (methanol/pyridine/TEA/water, 10:5:2:3) followed by the addition of 50 µl of phenylisothiocyanate. After 5 min at room temperature, the solvents were removed to a desiccator. The dried sample was then resolubilized in the starting buffer and filtered. A known amount of the derivatized sample was injected for chromatography into the Beckman System Gold HPLC unit. A mixture of methanol–sodium acetate buffer (6.8 pH) was used as the solvent. Separation was carried out on an ultrasphere ODS reverse phase column fitted to HPLC system. Alkaline hydrolysis was carried out using barium hydroxide (3.2 g in 5 ml distilled water) in the similar way to analyze amino acids destroyed during the acid hydrolysis. The content was neutralized by adding the required amount of 8 N sulphuric acid. The chromatogram obtained was compared with that of the standard amino acids and the content of different amino acids quantified.
2.5 Sample Collection
2.5.1 Hematological Estimation and Analysis of Hepatosomatic Index (HSI)
For the estimation of all haematological variables and hepatosomatic index (HSI), three fish were randomly chosen from each dietary treatment replicate (n=3×3). Blood samples for analysis were collected in heparinized (Na-heparinised) capillary tubes from the haemal arch after severing the caudal peduncle. Pooled sample of blood was taken from each treatment group and stored in heparin coated plastic vials for further analysis. All the hematological analysis was carried out within 2 h after each extraction.
Hemoglobin content of blood was estimated by adopting the Drabkin (1946) method and 20 μl of blood was mixed with 5 ml of Drabkin solution (Loba chemie, India) in a test tube and left to stand for at least 15 minutes. The color was developed and absorbance of the sample was measured spectrophotometrically (GENESYS 10S UV-VIS) at 540 nm and compared to that of hemoglobin standard (Ranbaxy, India). Hematocrit was determined on the basis of sedimentation of blood. Heparinised blood (50 μl) was taken in a micro-hematocrit capillary (Na-heparinised) and spun in a micro-hematocrit centrifuge (REMI RM-12C, India) at 12,000 × g for 5 min in order to obtain hematocrit values. The hematocrit values were measured with the help of hematocrit reader and the Hct values were presented as percentage by adopting the method given by Del Rio-Zaragoza et al. (2008). For red blood cell (RBC) count, a blood sample (20 μl) was taken with the help of micro pipette (Finpipette, Finland) and diluted with NattHerrick (1952) diluent (1:200). The diluted sample was placed in a Neubauer improved hemocytometer (Marienfeld-Superior, Lauda-Konigshofen, Germany) and then the blood cells were counted under light microscope (Magnus-MLM, India). White blood cell count (WBC) was done with the same technique as used during the RBC count. ESR was measured by using the Wintrobe tube method (Wedemeyer et al., 1983). The anticoagulated blood was filled in a Wintrobe tube up to the zero mark on top and kept undisturbed in vertical position in a rack. This allows the sedimentation of erythrocytes. After one hour, level of fall of the column of sediment was noted as ESR and expressed in mm per hour. The erythrocyte indices including MCH, MCHC, and MCV were calculated using standard formula (Dacie and Lewis, 1991).
After blood collection, the liver was removed from the same sample and weighed subsequently nearby 0.1 mg (Sartorius AG Germany CPA224S) for hepatosomatic index (HSI) study. The formula used to calculate the hepatosomatic index is as follows: (Rajaguru, 1992)
2.5.2 Plasma and Immune Response Parameters Analysis
After the termination of experimental trial, pooled blood (n=2×3) samples were collected and placed in eppendorf tubes for centrifugation (4100 × g) for 10 min at 4°C (Tarson MC-02). After centrifugation, the separated plasma was then used to estimate the plasma variables and non-specific immune variables such as alkaline phosphatase (ALP), alanine transaminase (ALT), aspartate transaminase (AST), glucose, urea, uric acid, total protein, albumin, globulin, cholesterol and triglycerides by using veterinary biochemistry analyzer (VS2 Abaxis, USA). The activities of lysozyme, total nitric oxide synthase (T-NOS), and NO content were estimated with the help of commercial specified kits (Sigma-Aldrich) and were further assayed as per the manufacture’s protocol.
2.5.3 Intestinal Enzyme Activities and Antioxidant Status Analysis
After proper dissection of fish, intestine samples (n = 2×3) were homogenized in a 10 volume of ice-cold physiological saline solution and further centrifuged at 6000 × g for 20 min at 4°C. The supernatant was then frozen at −20°C for further examination. The activities of trypsin and chymotrypsin were measured using the Hummel (1959) method, and amylase lipase were measured by the Furne et al. (2005) method. The Bergmeyer and Bernt (1974a; Bergmeyer and Bernt, 1974b) methods were employed for the determination of alanine transaminase (ALT) and aspartate transaminase (AST) activities. The response of superoxide dismutase (SOD), catalase (CAT), glutathione peroxidase (GPx), glutathione reductase (GR) and malondialdehyde (MDA) were estimated with the help of different kits (Antioxidant Assay Kit, Sigma-Aldrich) and were further assayed as per the procedure given by Zhang et al. (2008).
2.6 Analysis of TOR and 4E-BP1 Gene Expression
Relative expression levels of TOR and 4E-BP mRNA signaling pathway were determined by the same method as mentioned in our previous studies (Ahmad et al., 2021a; Ahmad et al., 2021b; Ahmad et al., 2022) with the following methodology: total RNA was extracted from skeletal muscle by TRIzol method. Briefly 1 ml TRIzol reagent was added to per 50-100 mg of tissue sample and was homogenized by using pestle and mortar. After that, incubation of the homogenized sample was conducted for 5 minutes at room temperature in order to permit complete dissociation of the nucleoprotein complex. Then, 0.2 ml of chloroform per 1 ml of TRIzol reagent was used for further homogenization and sample tube was shaken vigorously by hand for 15 seconds. Again, incubation was carried out for 2-3 minutes at room temperature and the sample was centrifuged at 12,000 × g for 15 minutes at 4°C. Then, the aqueous phase of the sample was removed by angling the tube at 45° and pipetting out the solution. Afterwards, the aqueous phase was placed into a new tube and proceeded to RNA isolation. 0.5 ml of 100% isopropanol was added first to the aqueous phase, per 1 ml of TRIzol reagent used for homogenization. Then homogenate sample was incubated at room temperature for 10 minutes followed again by centrifugation at 12,000 × g for 10 minutes at 4°C and finally the supernatant was removed from the tube, leaving only RNA pellet. After that, the RNA pellet was washed with 1 ml of TRIzol reagent used in the initial homogenization and the sample was vortexed briefly and centrifuged at 7500 × g for 5 minutes at 4°C. Then, after discarding the wash, the RNA pellet was vacuumed or air dried for 5-10 minutes. After which, the RNA pellet was resuspended in RNase free water or 0.5% SDS solution (20-50 µl) by passing the solution up and down several times through a pipette tip. Finally, the RNA sample was incubated in a water bath or heat block set at 55-60°C for 10-15 minutes. Then complementary DNA was synthesized using a cDNA synthesis kit (iScript™cDNA Synthesis Kit Biorad, Hercules, CA), according to the manufacturer’s protocol. The identified genes (TOR, 4E-BP1 and β-actin) were synthesized by using specific primers (Table 2). PCR confirmation of identified genes was done by running 2% agarose gel. The real-time, PCR was employed for the above genes (LightCycler Roche, USA). PCR amplication was carried out for these genes with the help of Chromo 4TM fluorescence detector (Bio-Rad, Hercules, CA, USA) under different thermo cycling conditions. Melting curve analysis was performed by running a gradient from 95–50°C in order to confirm the presence of single PCR products. The 2-ΔΔCt method was carried out to find out the TOR signaling gene expression and also for 4EBP1 gene comparative to those for β-actin as per the method given by Livak and Schmittgen (2001).
2.7 Calculation of Growth Parameters
The calculation of growth data were performed by the formula earlier described (Ahmed, 2014). Below are the formulas which were used for the evaluation of growth performance of Oncorhynchus mykiss fingerlings.
Where BWi and BWf = mean initial and final body weight (g), BCPi and BCFf = mean initial and final percentage of muscle protein, TF = Total amount of diet consumed and CP = Percentage of crude protein of the diet.
2.8 Statistical Analysis
The data were analyzed by one-way analysis of variance (ANOVA) (Snedcor and Cochran, 1967; Sokal and Rohlf, 1981) followed by Duncan’s Multiple Range Test (Duncan, 1955). Polynomial contrast method (Yossa and Verdegem, 2015) was applied to predict the significant (p < 0.05) variations among the treatments. For determining the optimal arginine requirement, second-degree polynomial regression (Y=a+bx+cx2) analysis was applied (Zeitoun et al., 1976). Origin software (version 8.5.1; San Clemente, CA) was used for all the statistical analyses.
Results
3.1 Growth Performance
Growth performance data fed diets providing varied levels of arginine over the 8-week feeding trial are presented in Table 3. At the termination of the experiment, all the growth parameters were found to be affected with the elevation of dietary arginine levels. The fish fed 17.5 g kg-1 arginine diet indicated significantly (p < 0.05) highest (363.82) LWG%, SGR (2.74), best-FCR (1.32) and higher PER (1.70) values. Those containing lower arginine levels clearly showed the importance of arginine as a growth promoter in rainbow trout. We did not find any significant (p > 0.05) change in the survival rate across the groups, except in those containing the lowest arginine fed diet, i.e., 10.0 g kg-1, where a 95% survival rate was noted. Hepatosomatic index (HSI) was not affected (p > 0.05) with the elevated arginine containing diets, except those fed lowest arginine possessing diets, i.e., 10.0 and 12.5 g kg-1, where significantly (p < 0.05) maximum HSI values were recorded. On subjected to quadratic regression analysis for obtaining the precise break-points with respect to each attribute, growth parameters such as LWG%, FCR, PER, and BPD revealed that the break-points occurred at 17.62, 17.54, 17.58, and 17.71 g kg-1, respectively (Figures 1–4).
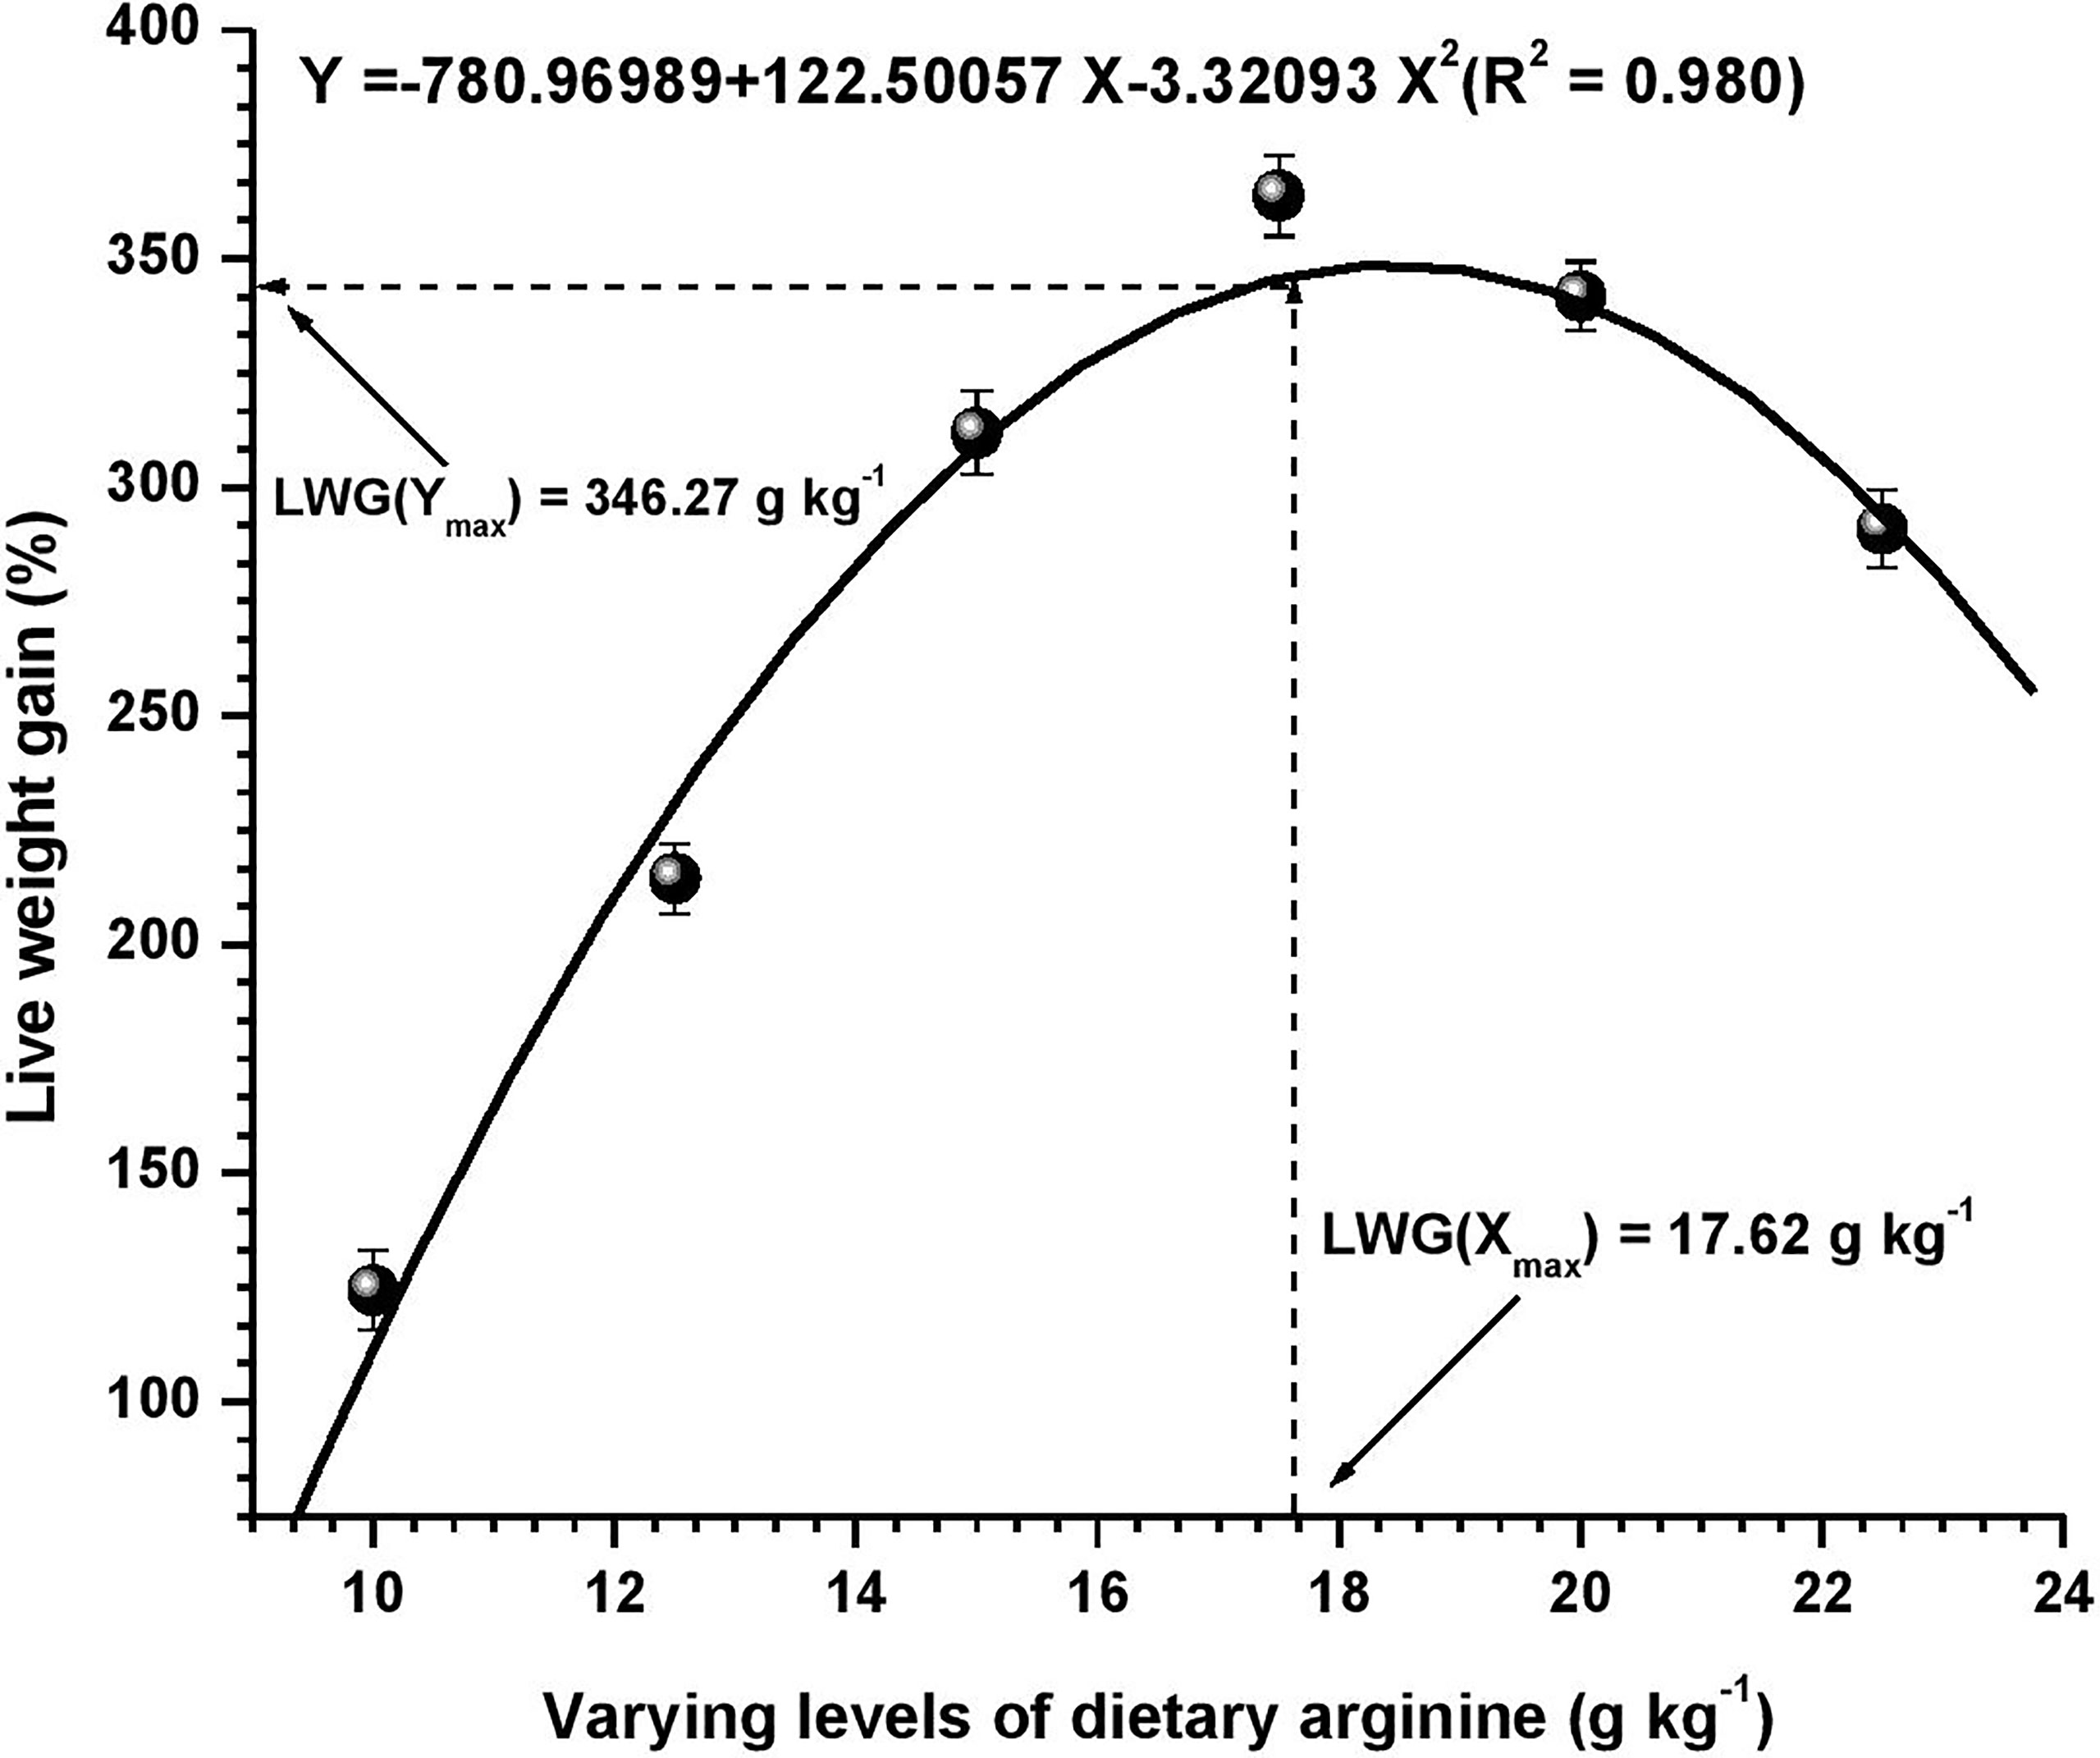
Figure 1 Quadratic regression analysis between dietary arginine levels and live weight gain (LWG %) of Oncorhynchus mykiss (g kg-1).
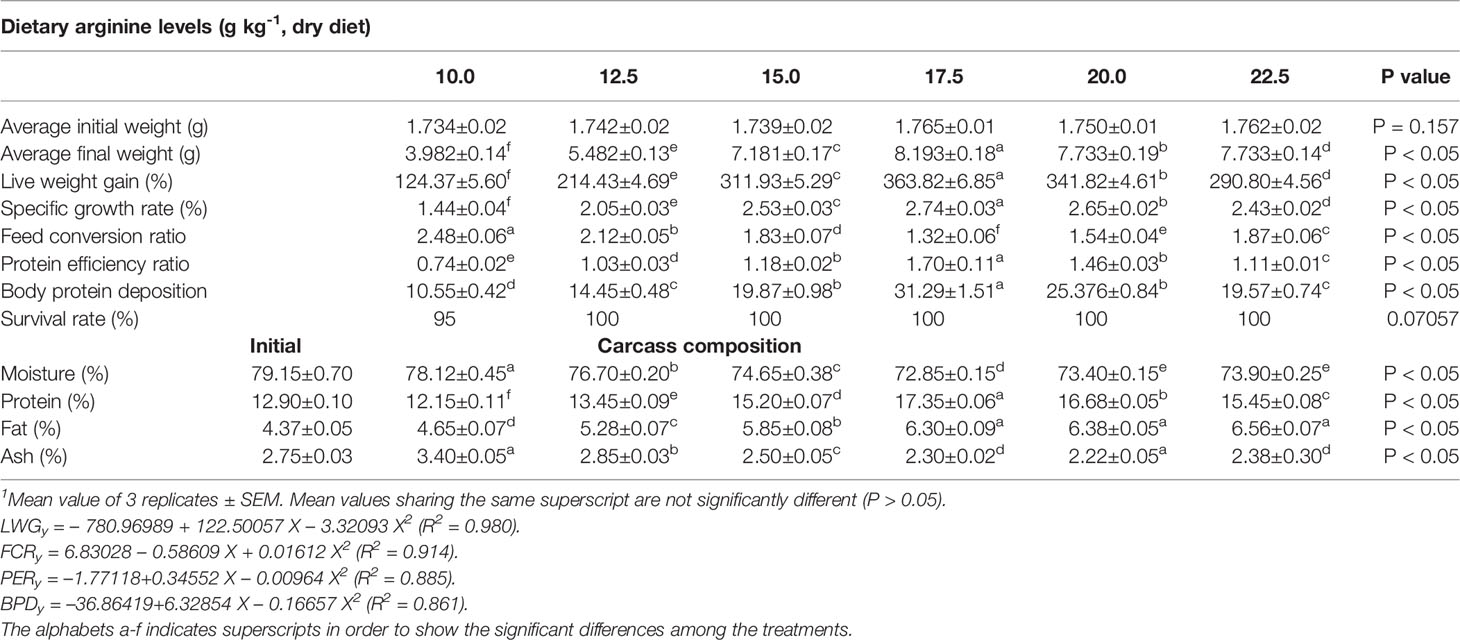
Table 3 Growth parameters, percentage survival and carcass composition of rainbow trout, Oncorhynchus mykiss fingerlings fed diets containing varying levels of dietary arginine for 8-weeks (mean values of 3 replicates ± SEM; n = 3)1.
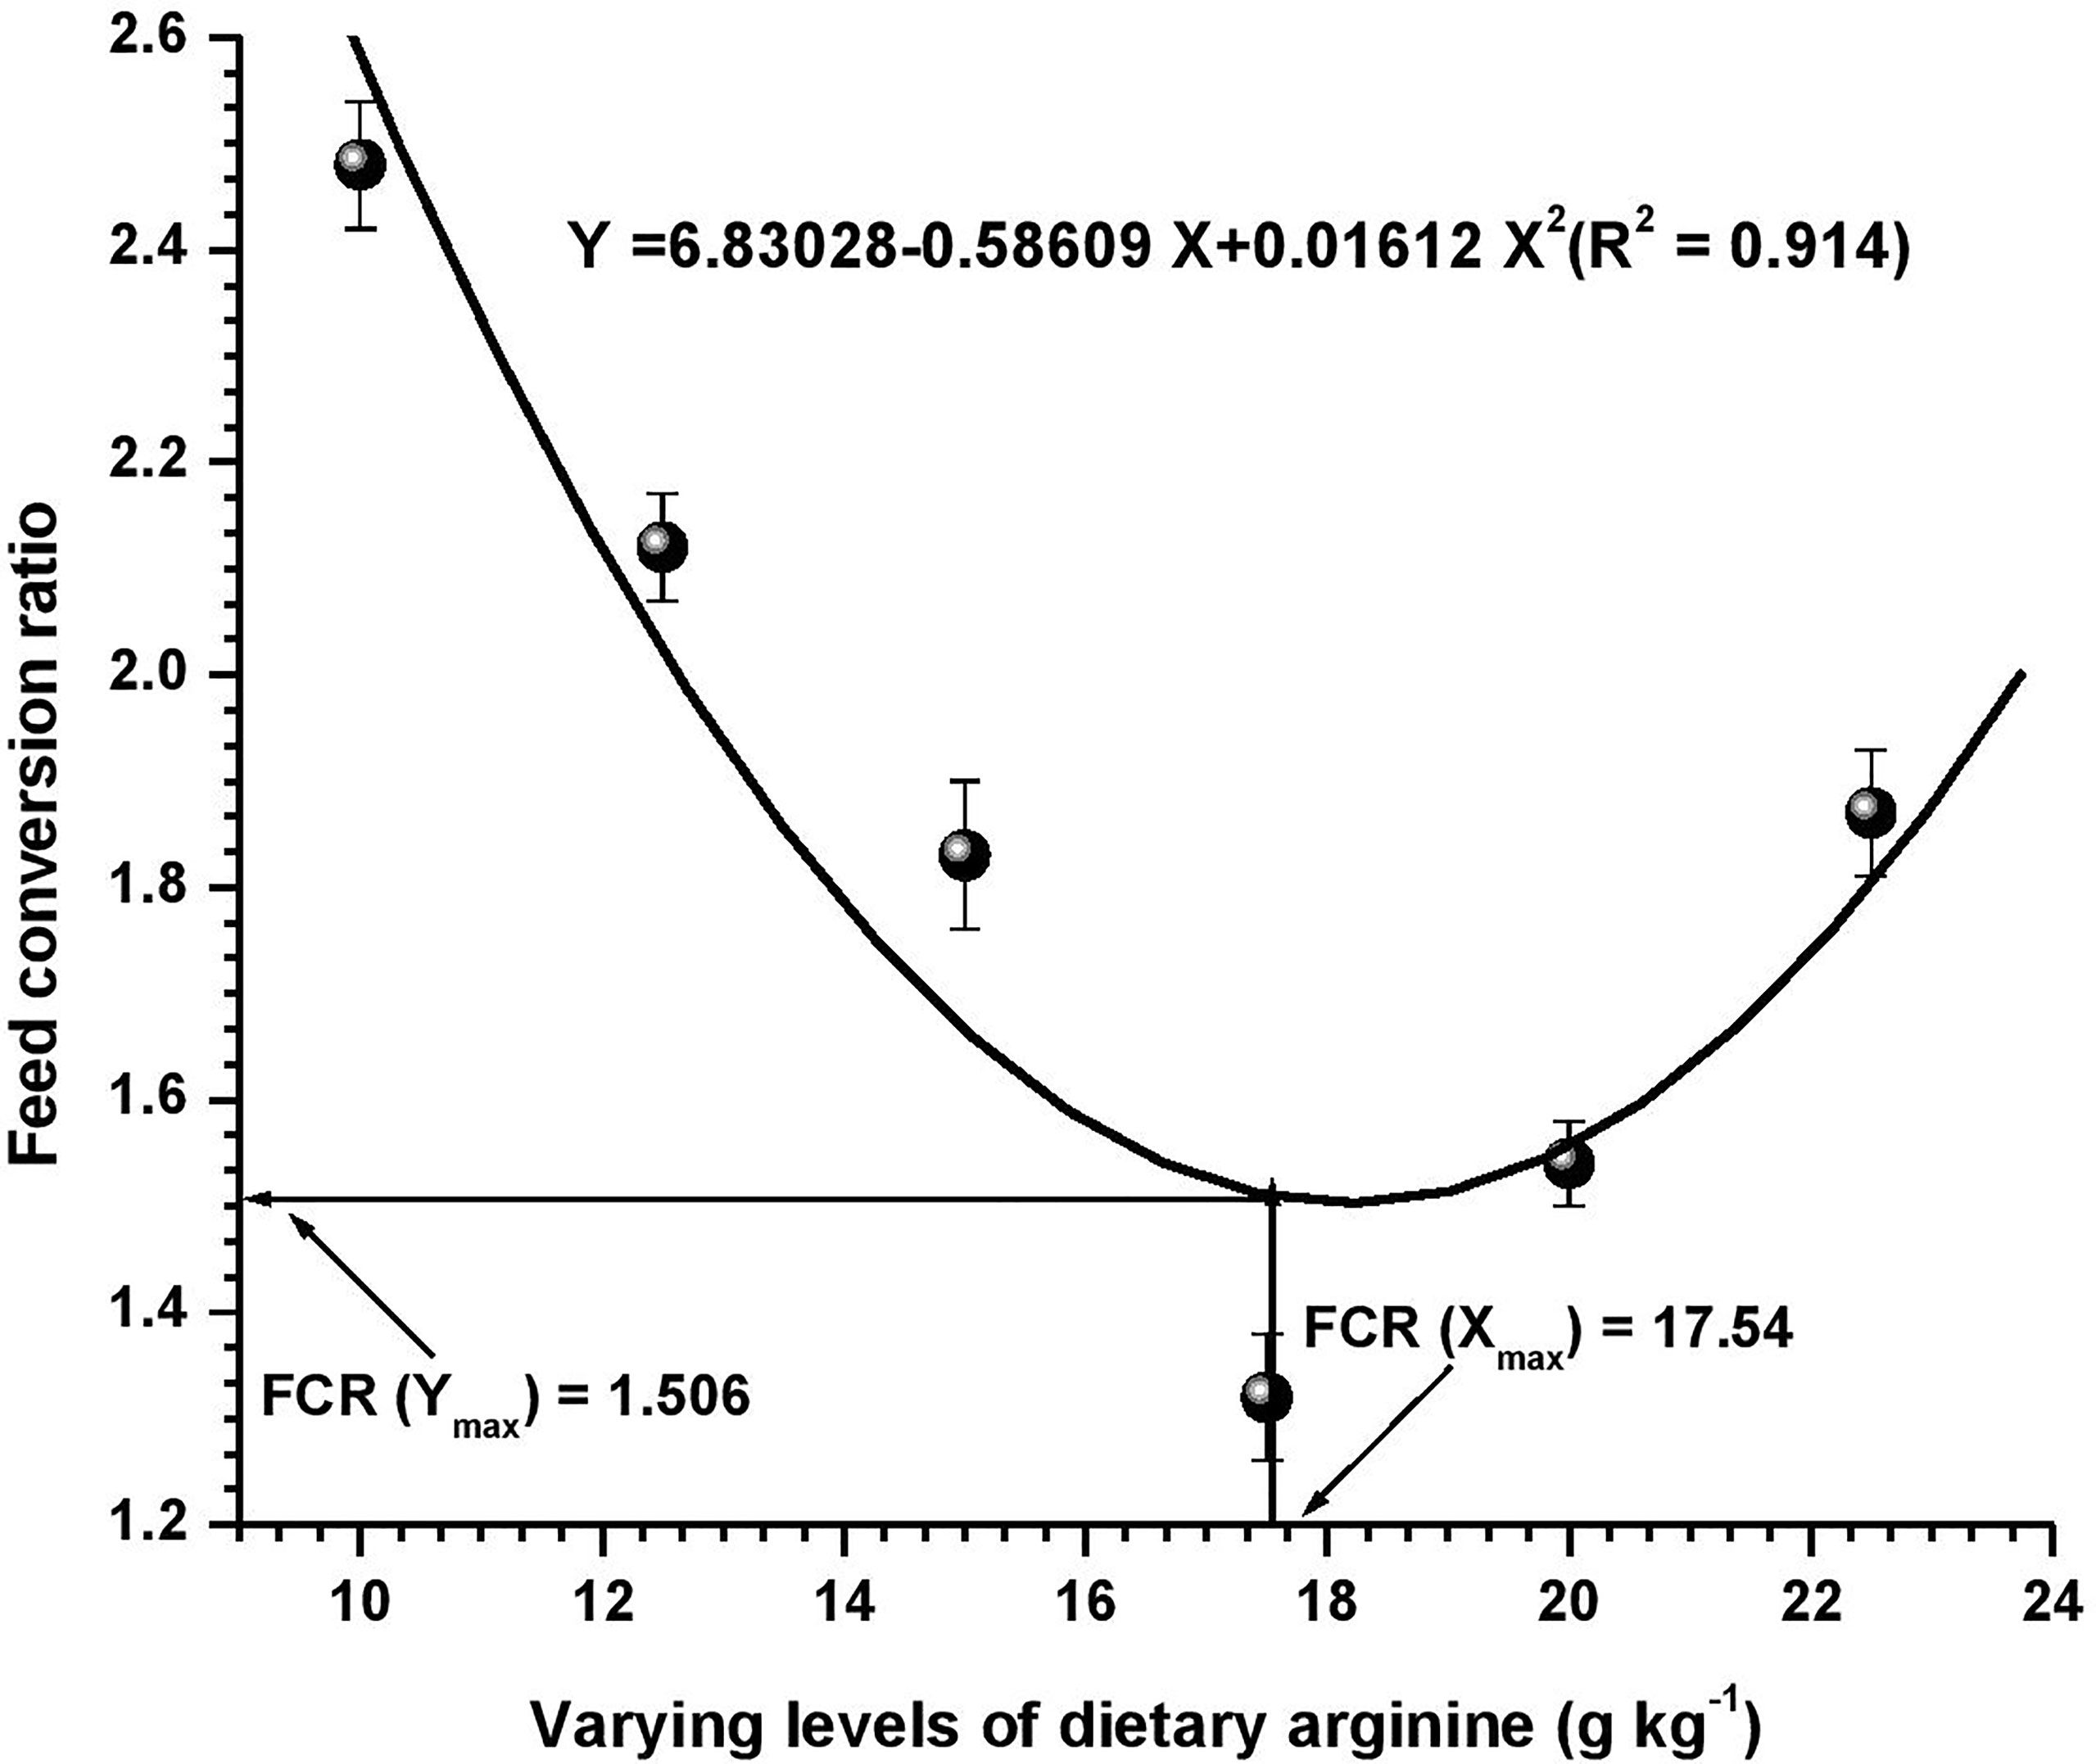
Figure 2 Quadratic regression analysis between dietary arginine levels and feed conversion ratio (FCR) of Oncorhynchus mykiss (g kg-1).
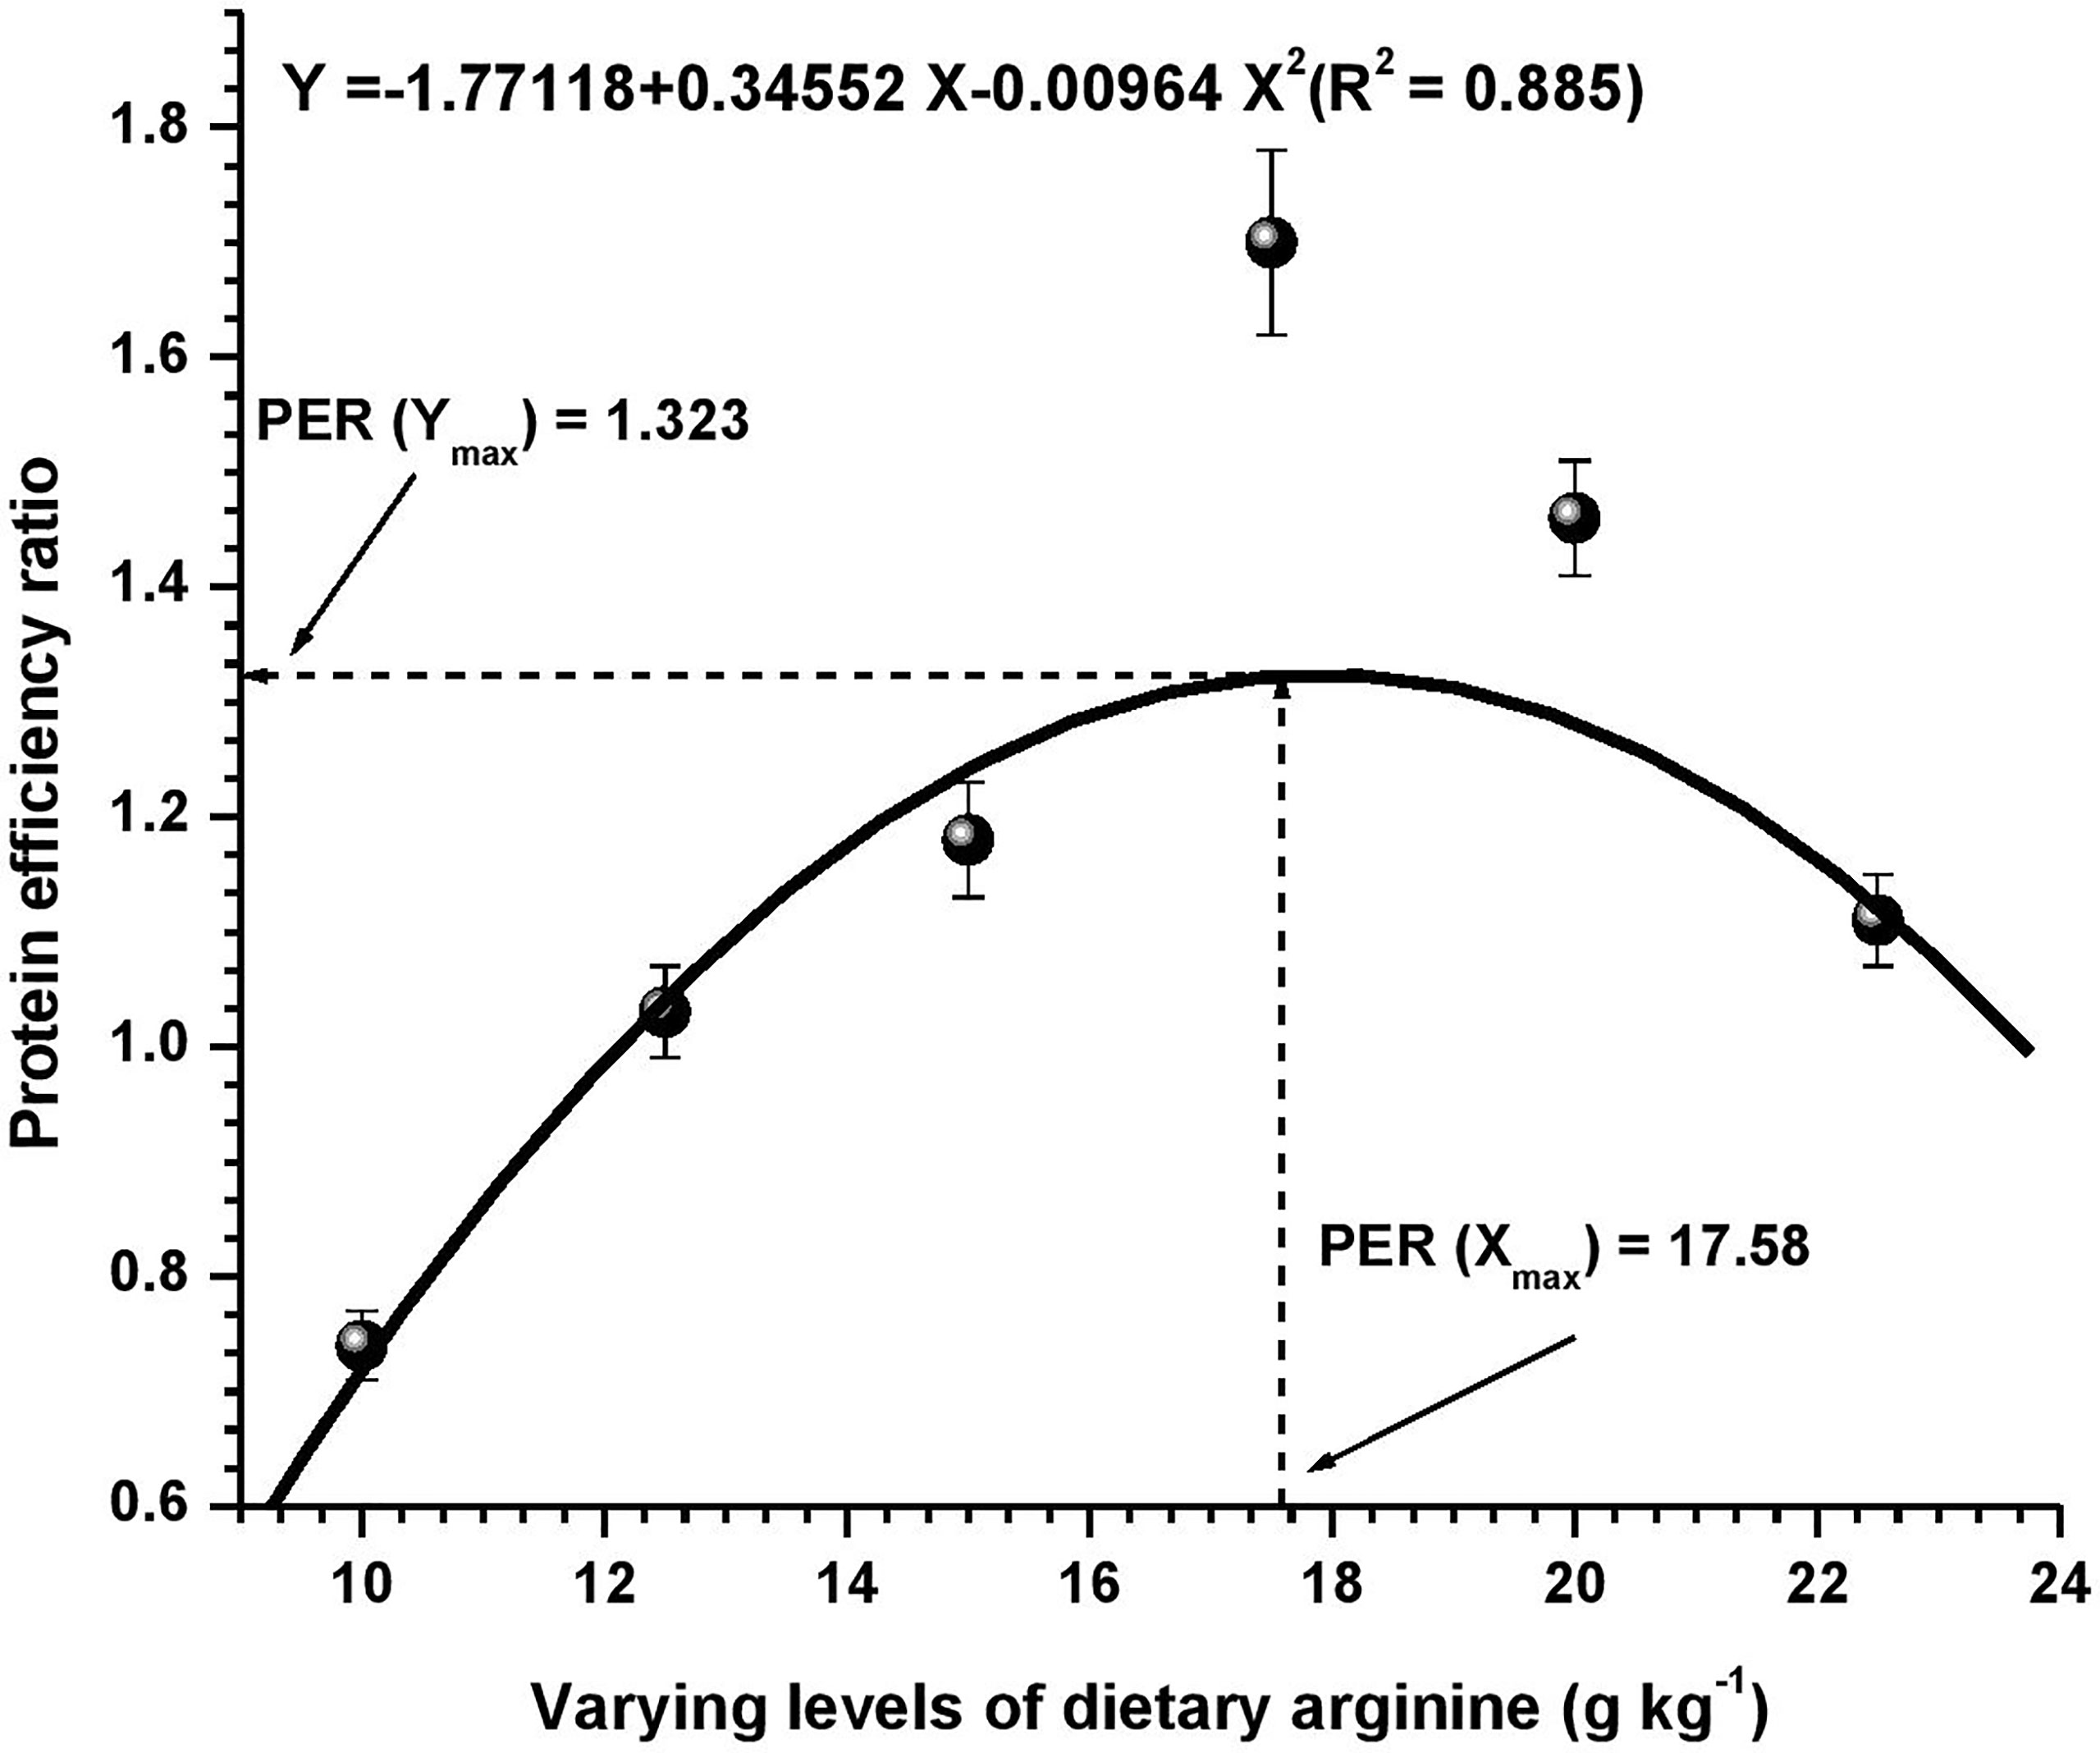
Figure 3 Quadratic regression analysis between dietary arginine levels and protein efficiency ratio (PER) of Oncorhynchus mykiss (g kg-1).
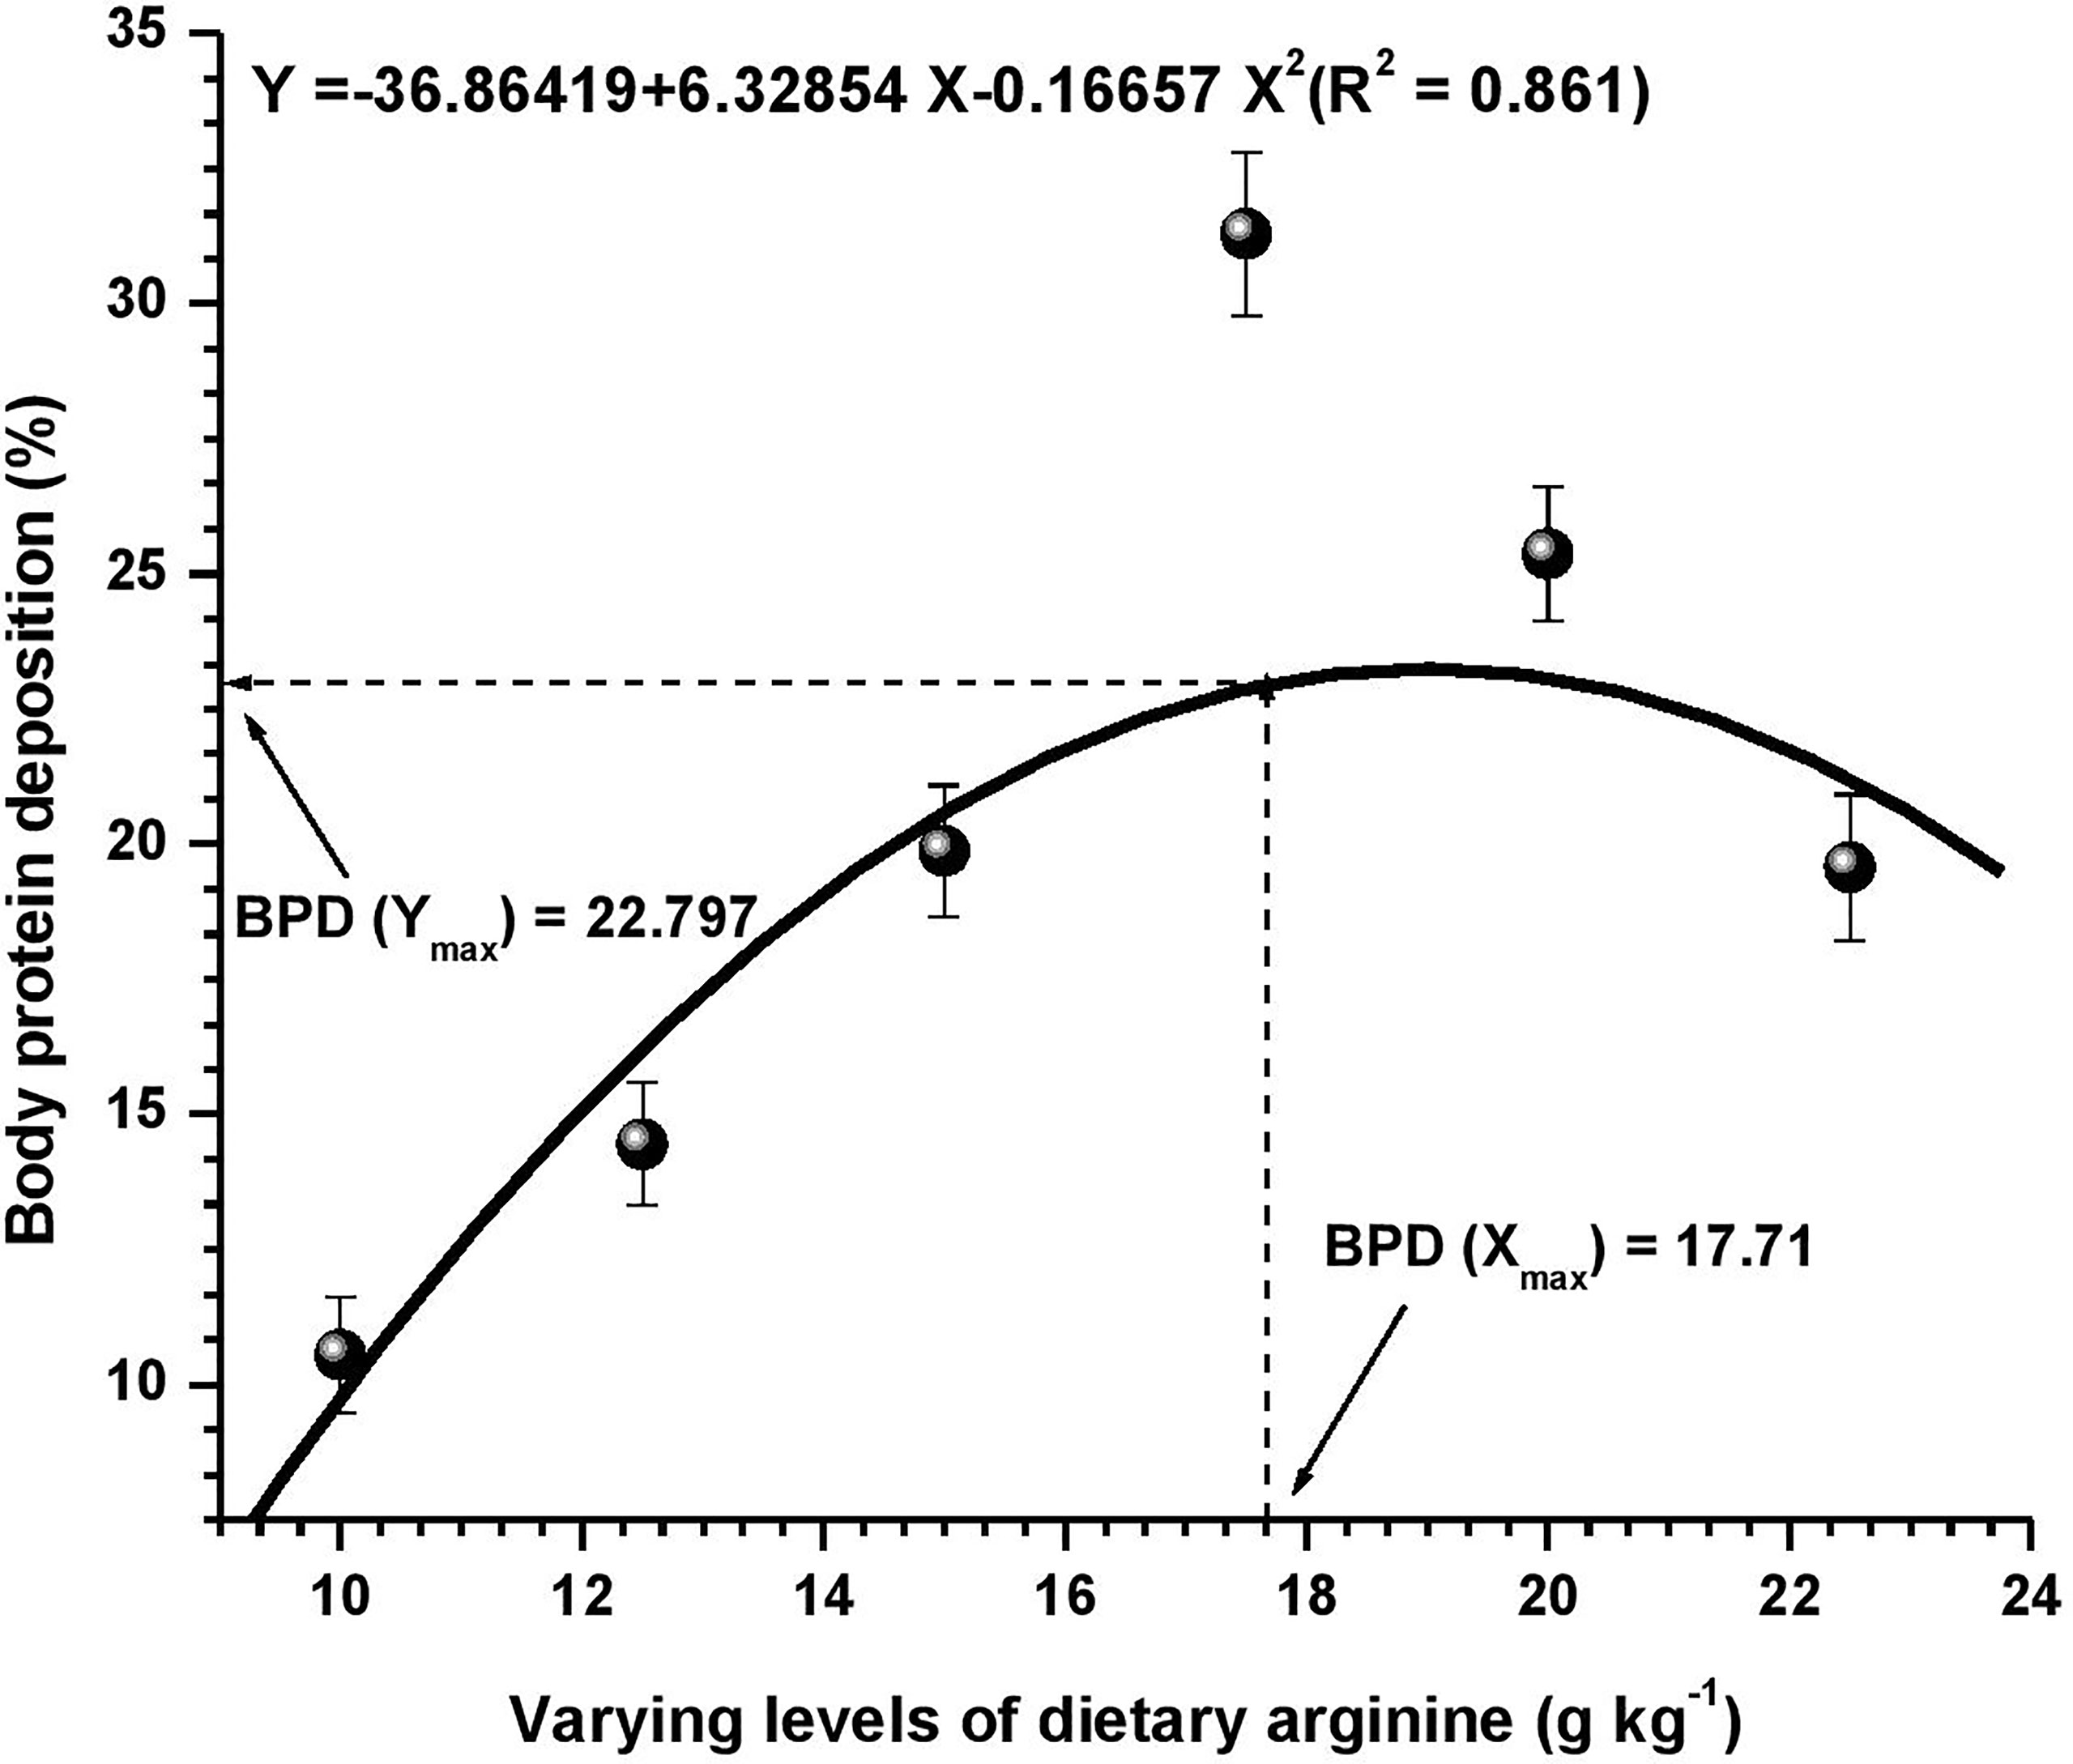
Figure 4 Quadratic regression analysis between dietary arginine levels and body protein deposition (BPD) of Oncorhynchus mykiss (g kg-1).
3.2 Whole Body Composition
Significant (p < 0.05) changes were noted in whole body composition and the data are illustrated in Table 3. The lowest moisture content (72.85%) was observed at 17.5 g kg-1 arginine fed group with a linear decline due to an elevated arginine concentration. Body protein progressively ameliorated (p < 0.05) with each increasing arginine level up to 17.5 g kg-1 and, furthermore, a diminished pattern in protein content was recorded. Whole body fat content continuously ameliorated across all the treatments and highest value was noted at 22.5 g kg-1. Contrary to this, body ash content showed highest ash values in fish supplied lower dietary arginine doses, i.e., 10.0 and 12.5 g kg-1, while lower values of ash content were recorded for rest treatments.
3.3 Haematological Parameters
During the study, it was observed that changing arginine content in the diets produced significant (p < 0.05) impact on hematological profile of fingerling O. mykiss (Table 4). The hematological attributes such as hemoglobin (Hb), hematocrit (Hct), and red blood cell (RBC) count was significantly (P < 0.05) affected with the elevation of arginine in each diet up to 17.5 g kg-1, and thereafter, a decrease in the above three parameters were noted. White blood cell (WBC) count also showed significant (P < 0.05) changes across all the groups with highest (3.42 x 103 mm-3) WBC count noted in lowest arginine fed group i.e. 10.0 g kg-1. Conversely, lowest (1.85 mm h-1) erythrocyte sedimentation rate (ESR) was obtained at 17.5 g kg-1 arginine fed diet and maximum (2.72 and 2.65 mm h-1) values were observed at lower dietary arginine fed groups, i.e., 10.0 and 12.5 g kg-1, respectively. Mean corpuscular value (MCV) also showed significant (p < 0.05) changes across the treatments and maximum (168.22 and 177.97 fl) values were observed at higher arginine concentrations, and lower value was obtained at minimum arginine fed diets, i.e., 10.0 g kg-1. However, other erythrocyte indices such as MCH and MCHC values were insignificant (p > 0.05) across all the groups.
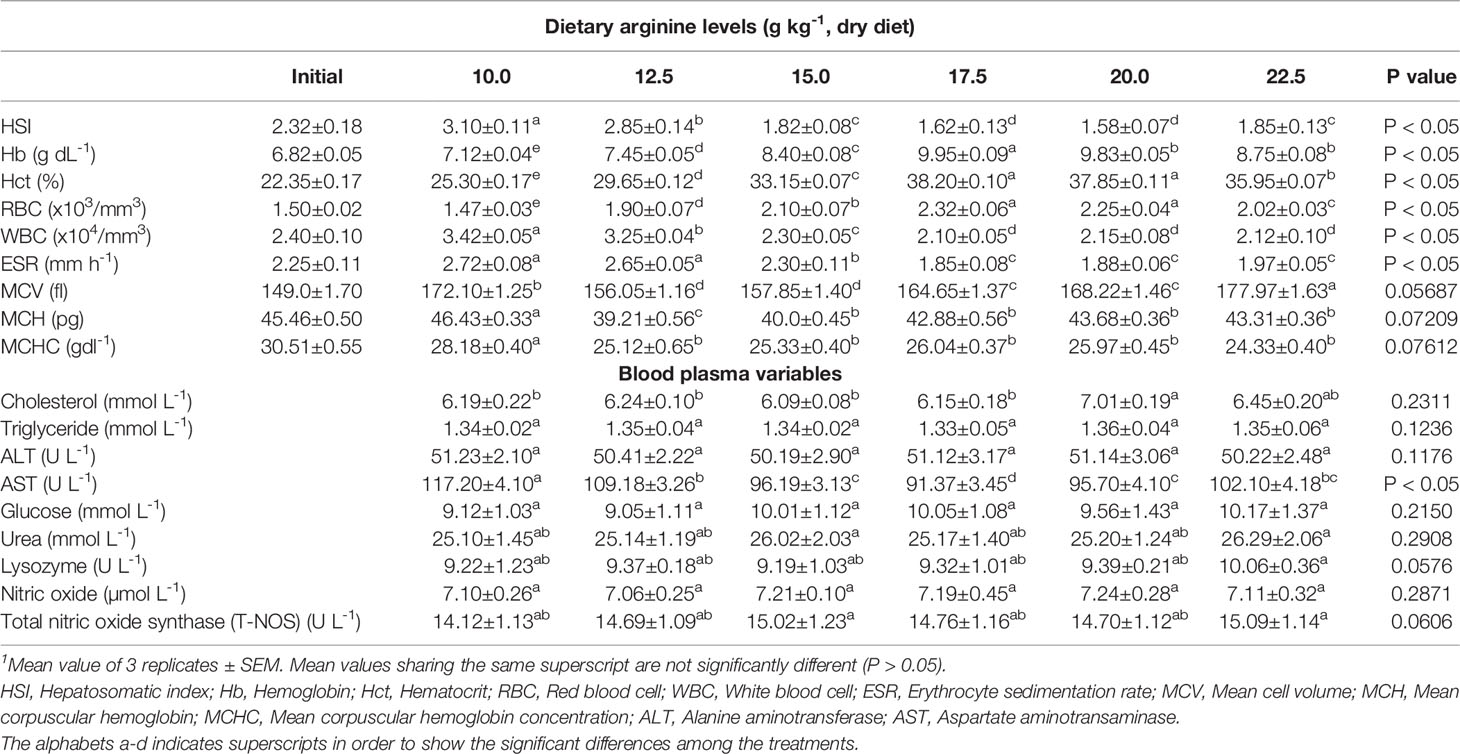
Table 4 Hepatosomatic, haematological indices, and blood plasma variables of rainbow trout, Oncorhynchus mykiss fingerlings fed diets containing varying levels of dietary arginine for 8-weeks (mean values of 3 replicates ± SEM; n = 3)1.
3.4 Plasma Biochemistry and Immune Parameters
Results of the plasma variables are presented in Table 4 and immune response variables are shown in Figure 5. Among blood plasma variables, some parameters such as cholesterol (CHO), triglycerides (TG), alanine transaminase (ALT), glucose, urea, lysozyme, nitric oxide (NO), and total nitric oxide synthase (T-NOS) contents were insignificant (p > 0.05) across the treatments, while aspartate transaminase (AST) content showed a declining (p < 0.05) pattern with the incremental addition of arginine up to 17.5 g kg-1. Plasma total protein, alkaline phosphatase (ALP), and albumin contents significantly (p < 0.05) elevates with each incremental arginine level up to 17.5 g kg-1 diet, and further decrease in these parameters was observed. In contrary to above three parameters, globulin content was insignificant (p > 0.05) across all the groups.
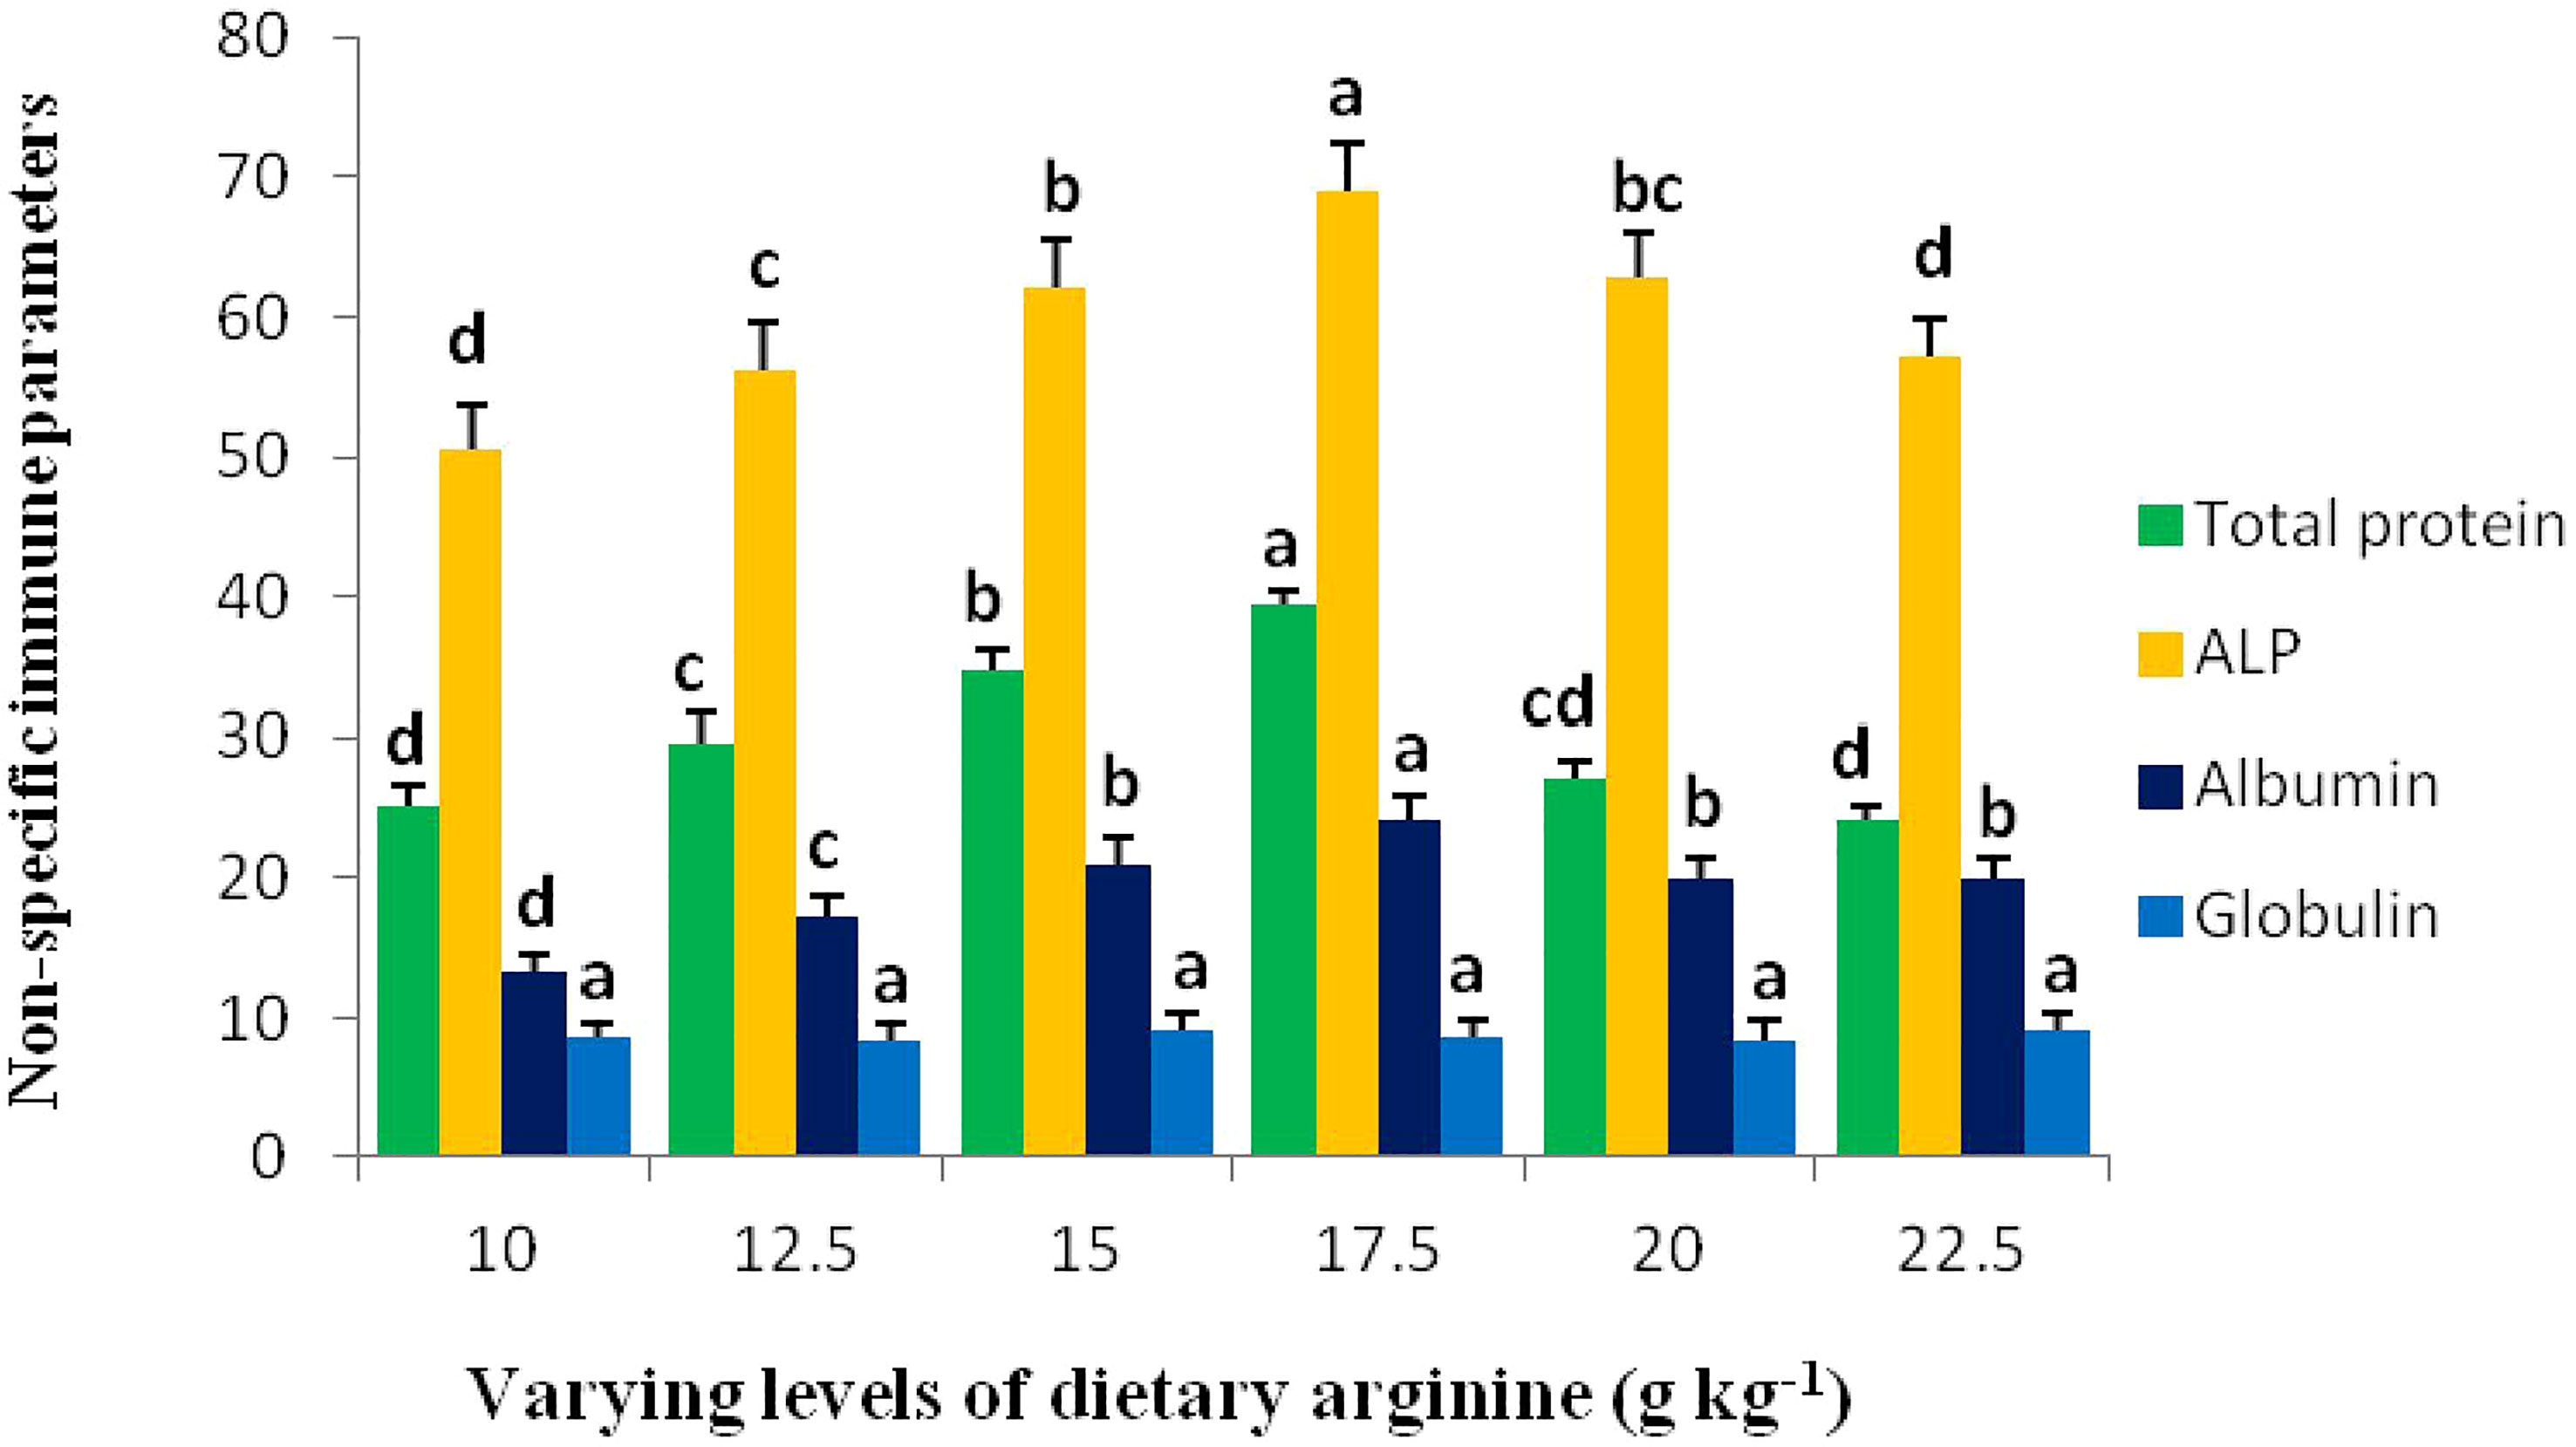
Figure 5 Non-specific immune response of rainbow trout, Oncorhynchus mykiss fingerlings fed diets containing graded levels of arginine (g kg-1). The alphabets a-d indicates superscripts in order to show the significant differences among the treatments.
3.5 Intestinal Enzyme and Antioxidant Status
Digestive intestinal enzymatic activity and antioxidant capability results are illustrated in Figures 6A, B and 7, respectively. The activities of trypsin, chymotrypsin, lipase, aspartate transaminase (AST), and alanine transaminase (ALT) produced significant (p < 0.05) variations among the treatments, and indicated an elevated pattern up to 17.5 g kg-1 arginine fed diet, while no significant (p > 0.05) differences were noted in amylase activity. Intestinal antioxidant data showed that the activities of SOD, CAT, GPx, and GR were ameliorated in the fish that received the 17.5 g kg-1 arginine diet. Furthermore, a decrease in these variables were observed, while MDA content showed a declining trend in the 17.5 g kg-1 arginine fed group and were found to be maximum at a lower level, i.e., 10.0 g kg-1.
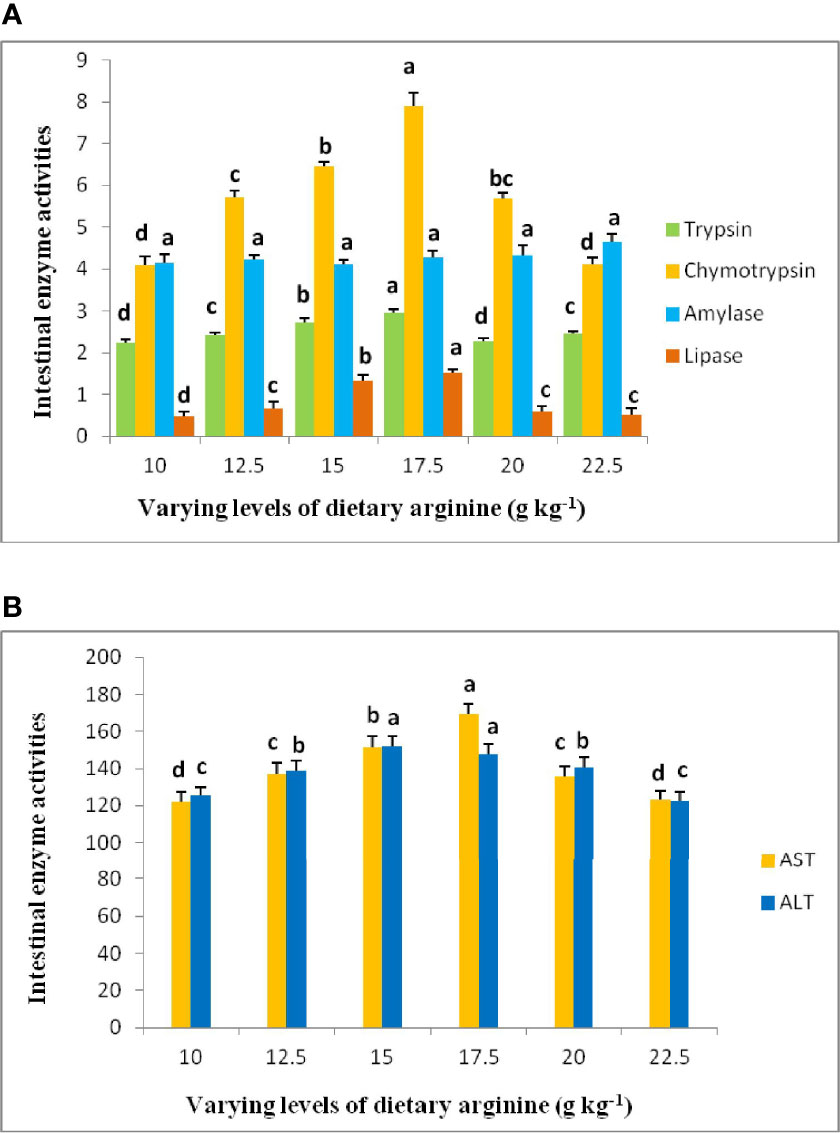
Figure 6 (A, B) Digestive intestinal enzyme activities of rainbow trout, Oncorhynchus mykiss fingerlings fed diets containing graded levels of arginine (g kg-1). The alphabets a-d indicates superscripts in order to show the significant differences among the treatments.
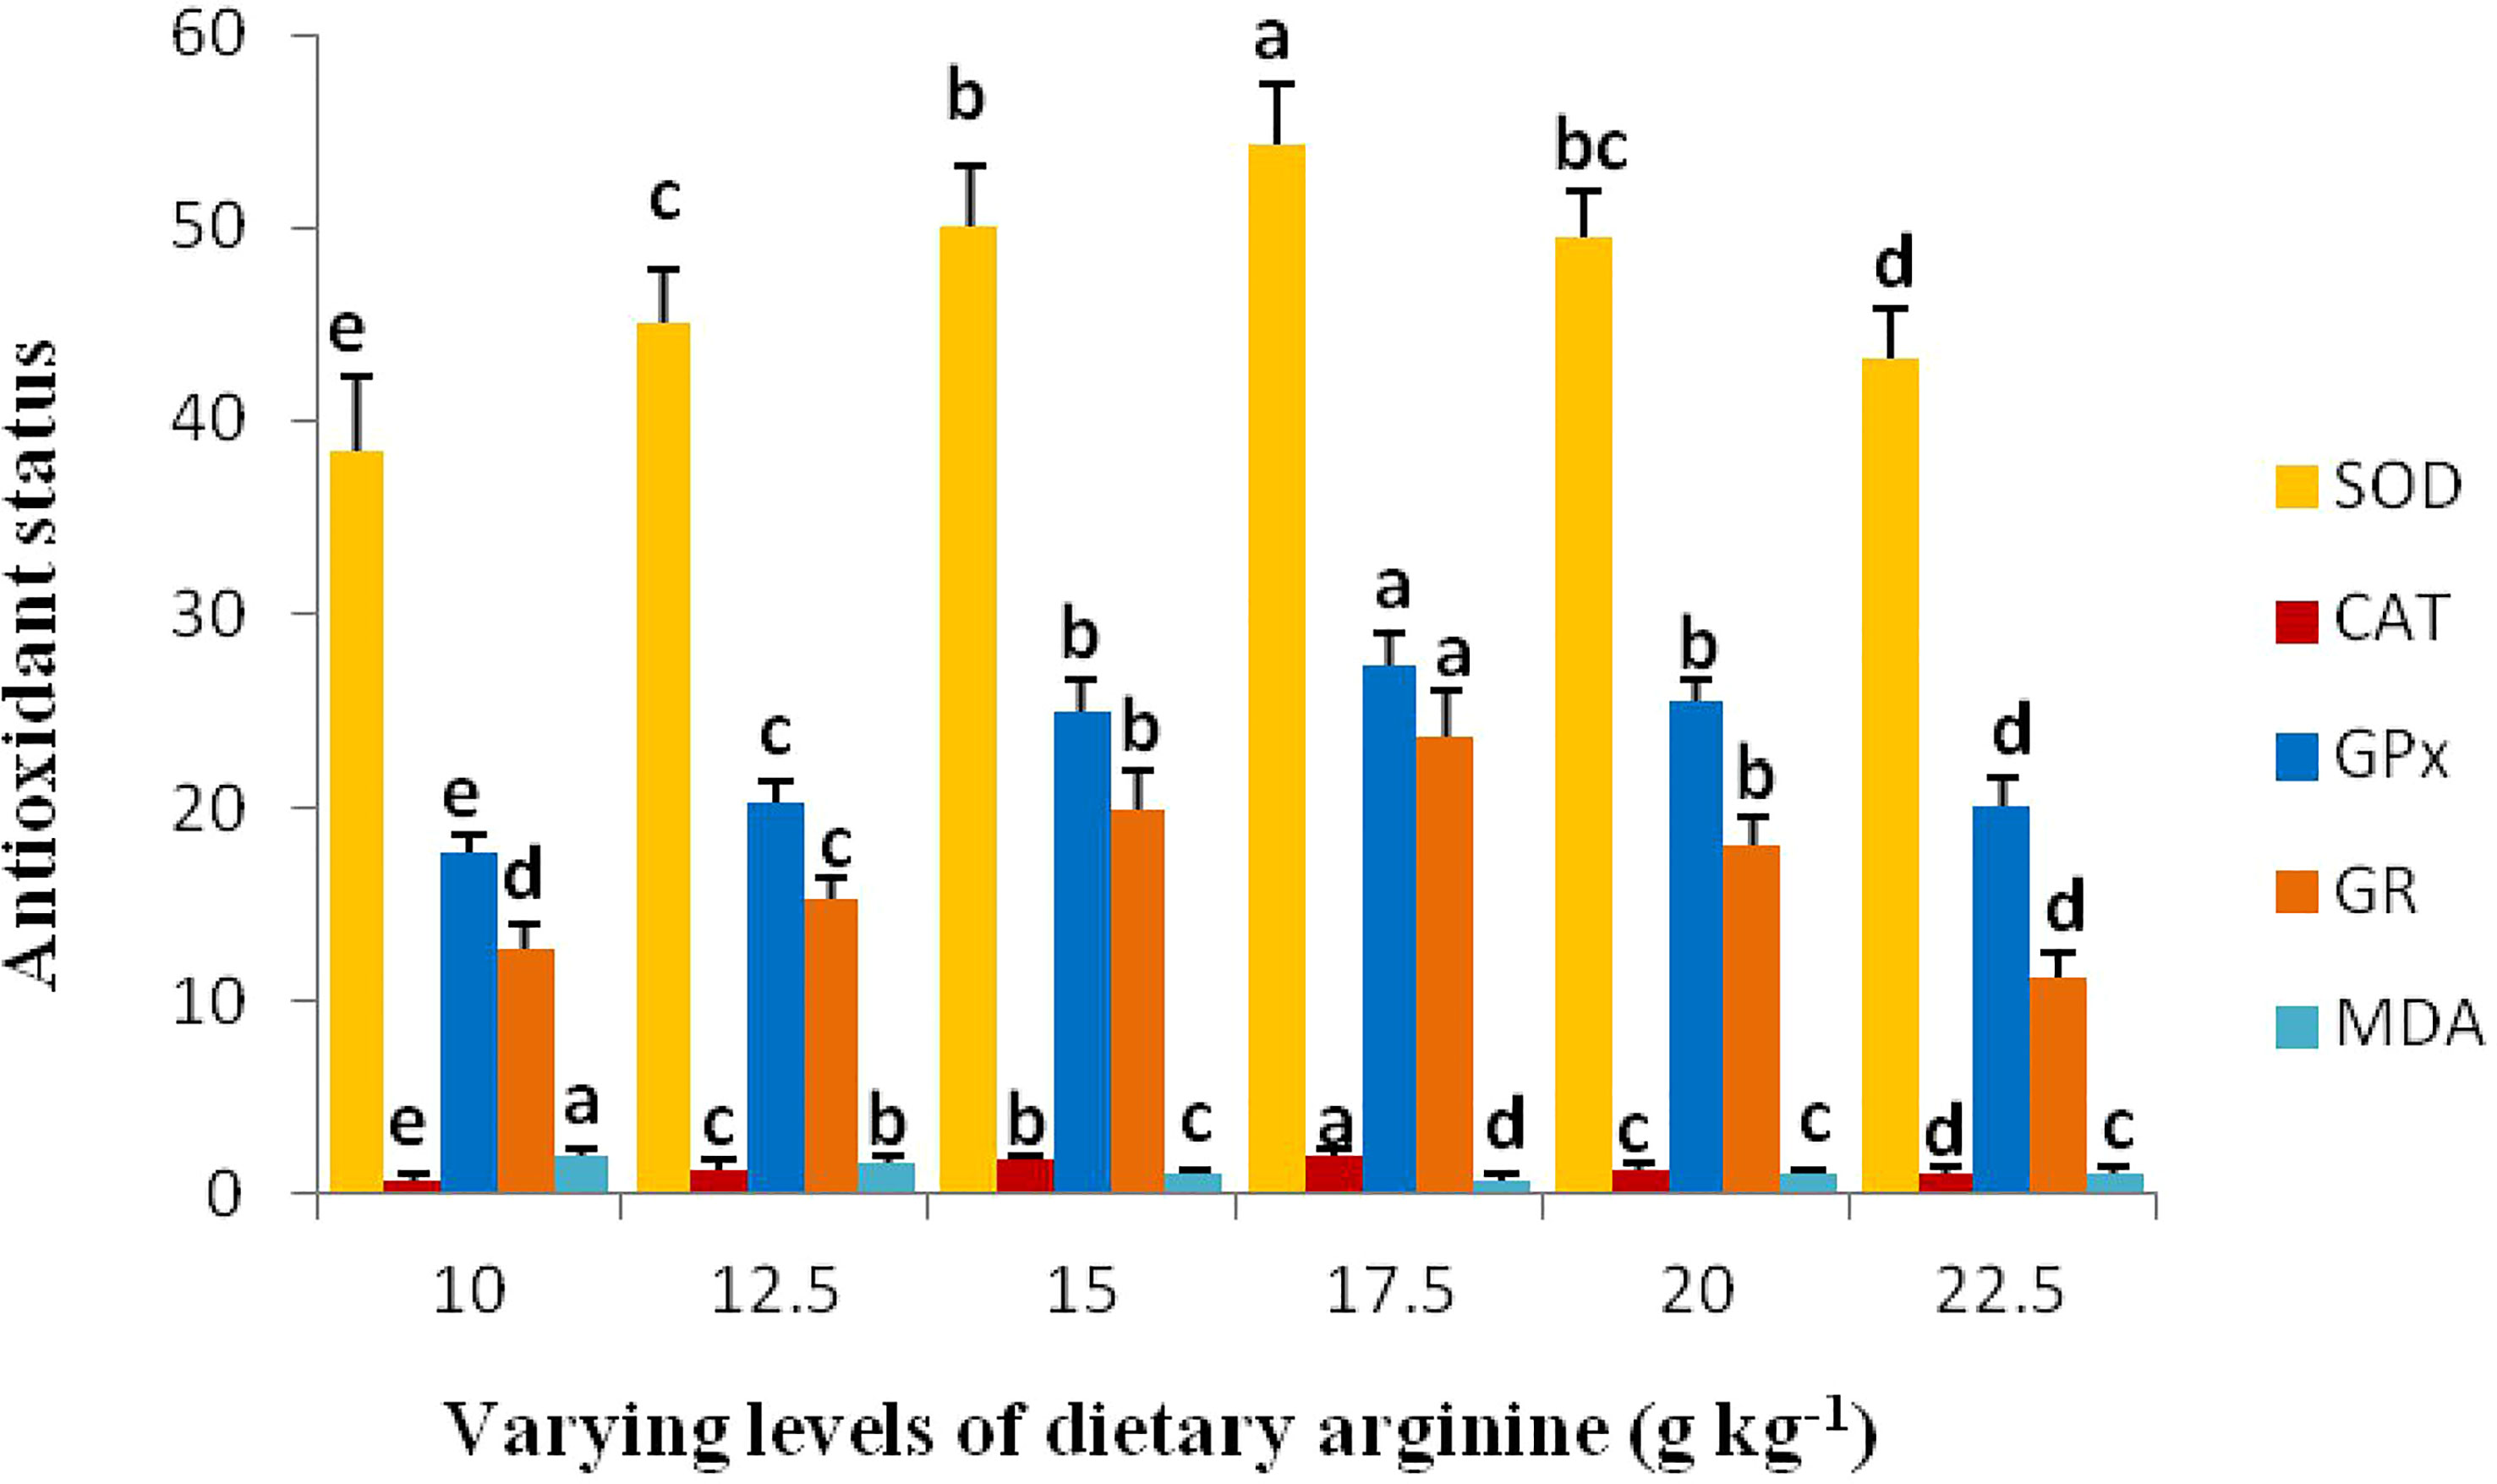
Figure 7 Antioxidant capability of rainbow trout, Oncorhynchus mykiss fingerlings fed diets containing graded levels of arginine (g kg-1). The alphabets a-e indicates superscripts in order to show the significant differences among the treatments.
3.6 Relative Expression of Target of TOR and 4E-BP1 Genes
The study on the expression levels of TOR and its related gene, i.e., 4E-BP1 mRNA, was also carried out in response to the gradation of each arginine level (Figure 8). The expression level of TOR significantly (p < 0.05) ameliorated with the increase in arginine concentrations up to 17.5 g kg-1 diet, and thereafter, a decreasing trend in the expression of the TOR gene was observed. However, at 8.5 and 11.0 g kg-1 arginine fed groups, we found lower expression level of 4E-BP1 in comparison to other groups. However, highest expression of TOR and 4E-BP1 genes occurred at 17.5 g kg-1 arginine fed group.
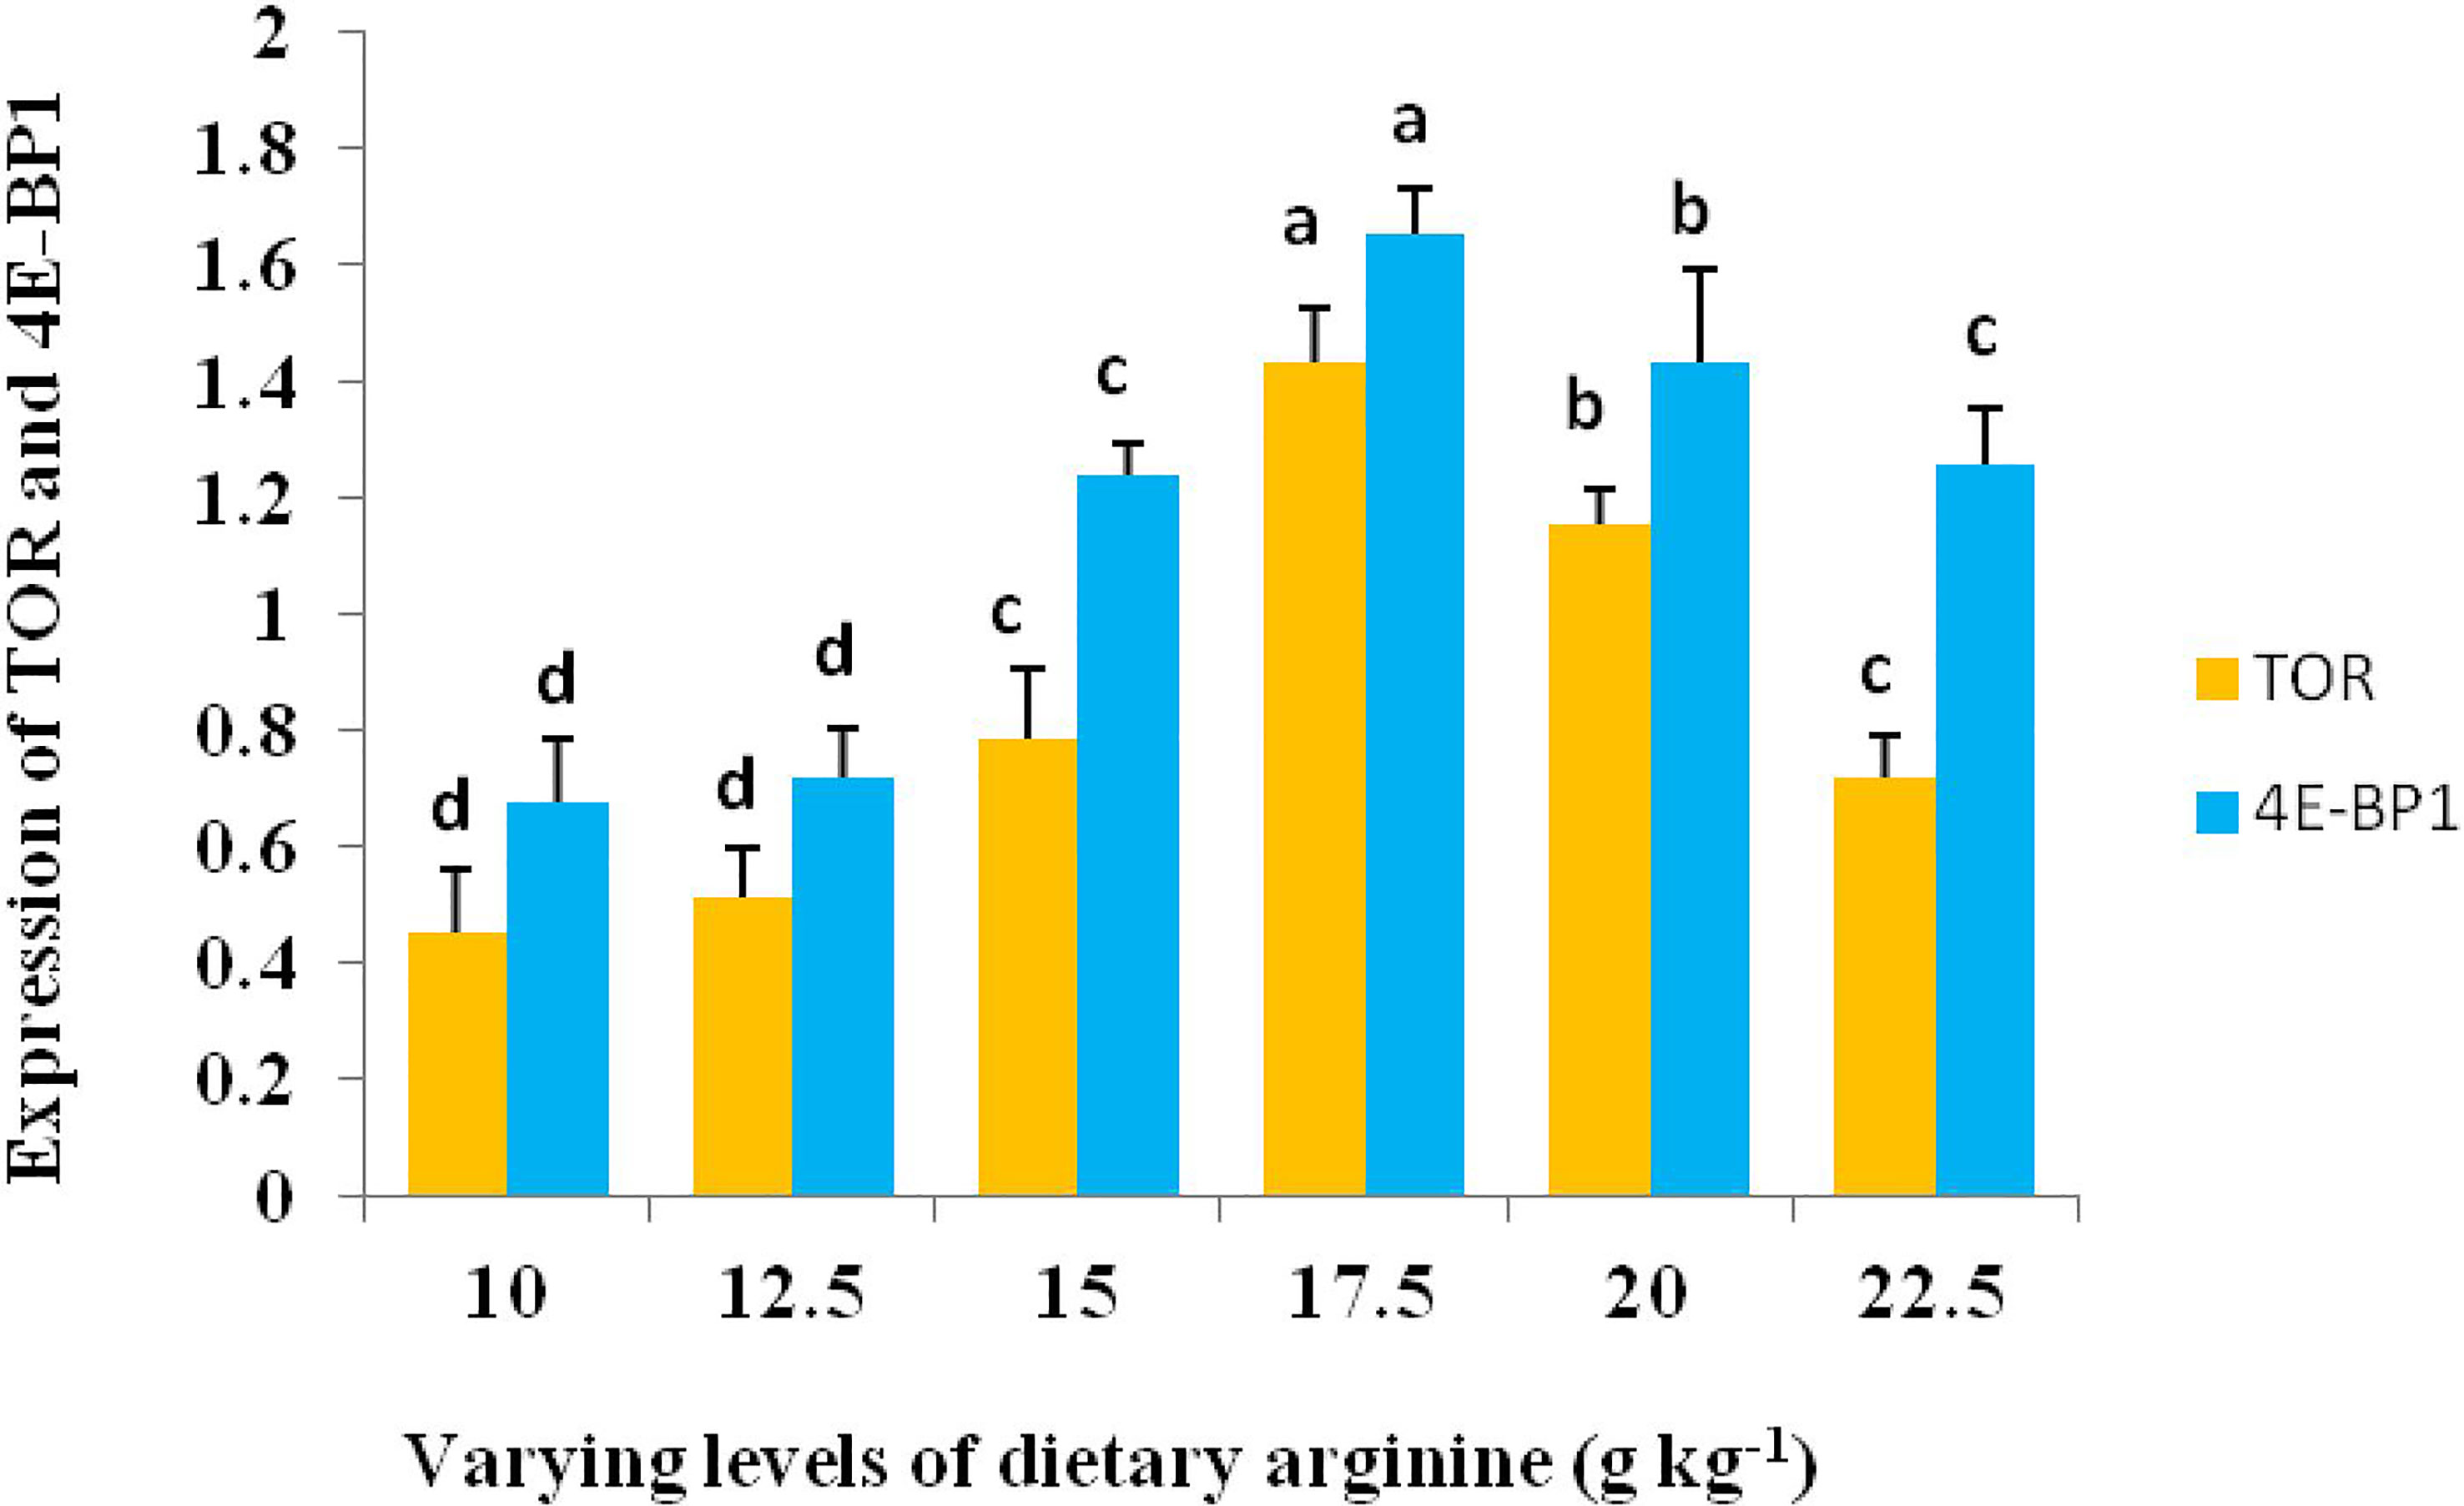
Figure 8 Relative expression level of target of rapamycin (TOR) and elF-4E binding protein (4E-BP1) gene in the muscle of rainbow trout, Oncorhynchus mykiss fingerlings fed varied dietary arginine levels (g kg-1). The alphabets a-d indicates superscripts in order to show the significant differences among the treatments.
Discussion
Arginine is considered as one of the vital amino acid (AA) as it plays a significant part in creatine and nitric oxide (NO) synthesis and also takes part in growth, nitrogen metabolism, and immune function in fish (Luo et al., 2004; Cheng et al., 2011). The most common application of arginine is in the production of protein for growth (Wu and Morris, 1998). Besides, arginine is implicated in various growth-related activities, including insulin and IGF-1 stimulation and also acts as a precursor in the synthesis of polyamines (Zhou et al., 2012). In the present study, the best growth performance and feed efficiency were noted in the 17.5 g kg-1 arginine diet, while quadratic regression results revealed that 17.61 g kg-1 of the dry diet, corresponding to 39.13 g kg-1 of dietary protein arginine, is suitable for optimum growth of this fish species and the same value was compared to the arginine requirements reported for other fish species (Table 5).
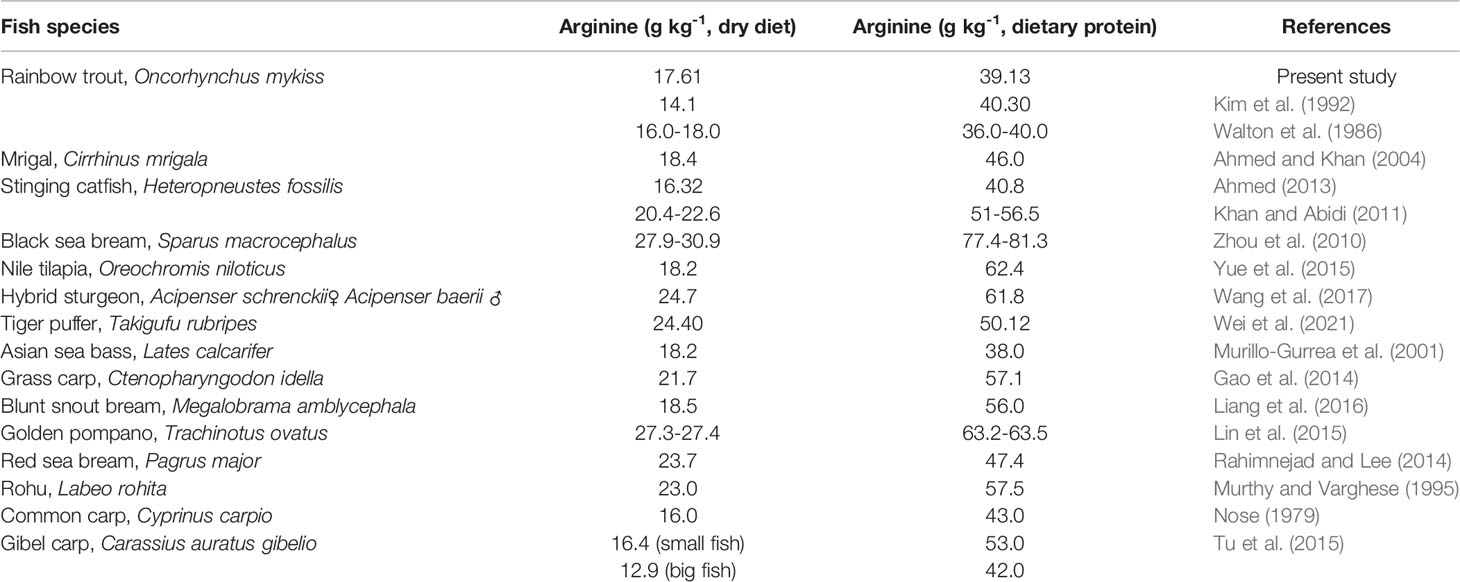
Table 5 Quantitative arginine requirement of different fish species compared with rainbow trout, Oncorhynchus mykiss fingerlings.
During the investigation, we observed that when the dietary arginine levels elevated from 17.5 to 22.5 g kg-1, live weight gain, SGR, and PER data did not show any improvement, which is in accordance with other studies on different fish species (Ahmed and Khan, 2004; Khan and Abidi, 2011; Ahmed, 2013). Variations in arginine requirement on different fish species might be due to species differentiation, experimental treatment differences, protein quality differences, and other biological attributes (Millamena et al., 1998). In channel catfish, Buentello and Gatlin (2000) reported that for the endogenous synthesis of arginine, use of glutamate is required, particularly when there is deficiency of arginine in the diet. In addition to this, fish age, size, feeding regimes, fish rearing, design of the experiment, and proximate composition of diets may also affect the dietary requirements (Kim et al., 1992; Ahmed and Khan, 2006; Zhou et al., 2007; Ahmed, 2013; Zehra and Khan, 2015). Moreover, energy content and crystalline AA profile could also be responsible for affecting AA requirements (De Silva et al., 2000; Zhang et al., 2017). Apart from all these factors, one of the important factors which has been reported to affect the nutrient requirements, is the use of different mathematical models (Rodehutscord et al., 2000; Ahmed and Khan, 2004), as there are several models to define the fish requirements such as quadratic regression, broken-line, and saturation-kinetic models. All these models have merits and demerits, hence, there is no model that is most appropriate (Pesti et al., 2009) but some previous studies have reported that among all these parameters, quadratic regression analysis has been found more useful in determining the nutrient requirements (Wilson, 2002), thus same model was used in the present study to establish arginine requirement of trout. Moreover, the data were a good fit to quadratic regression analysis as indicated by highest R2 value and least value of sum of squares of regression (Zeitoun et al., 1976), and the arginine requirement is recommended on the basis of quadratic regression analysis of the data.
During the study period, both deficiency (10.0 and 12.5 g kg-1) or excessive (20.0 and 22.5 g kg-1) addition of dietary arginine caused a fall in growth performance and feed efficiency in comparison to those fed 17.5 g kg-1 arginine diet. In the past, similar findings on the adverse effects of arginine have been observed by different authors on several fish species such as hybrid catfish, Clarias garipinus (Singh and Khan, 2007), Indian major carp, Labeo rohita (Abidi and Khan, 2009), rainbow trout, O. mykiss (Fournier et al., 2002); yellow grouper (Zhou et al., 2012) and H. fossilis (Ahmed, 2013). It has also been suggested by some workers that high amount of dietary arginine in the diet may cause fish to expend more energy, which results in high stress and toxic effects that negatively impact fish growth performance (Walton et al., 1986; Ahmed and Khan, 2004; Ahmed, 2013).
Incorporation of arginine in the diets produced a significant effect on whole-body proximate composition. Body protein significantly elevated with the amelioration of arginine concentrations up to 17.5 g kg-1, and showed a decrease with the increase in further arginine content in remaining diets. Similar findings on the body protein content of arginine fed diets have also been obtained in several fish species such as C. mrigala (Ahmed and Khan, 2004); H. fossilis (Ahmed, 2013) and C. catla (Zehra and Khan, 2013). The increase in whole body protein content with the elevation of arginine concentrations could support the hypothesis that at optimum nutrient level, fish utilize maximum nutrients, which lead to the transamination process (Ahmed and Khan, 2004). Moreover, it could be attributed to the fact that arginine can be digested and absorbed by fish and deposited in the body, however, excessive arginine will not be utilized or may even impede the process (Chen et al., 2016). Whole body fat content also showed an increased trend with each incremental arginine level, which results in diminished moisture content. Previously, many workers found that moisture and fat contents had an inverse relationship with each other, which is in accordance with the present study. Another reason for maximum fat values at highest arginine fed diets could be due to storage of large proportion of triglycerides at these levels by substitution for water [Dumas et al., 2007; NRC (National Research Council), 2011]. Ash content did not show any significant changes, excluding low arginine fed levels, where maximum ash content was observed. Maximum ash content at lowest arginine fed diets confirms that at these treatments, fish are not able to grow as per cube law, which results in the formation of more skeleton in comparison to muscle. Moreover, during the study period, highest HSI values were observed at low arginine levels compared to fish fed higher levels, as in lower treatments fish could not receive the appropriate quantity of nutrients which can negatively impact the health of fish. According to Farhat Khan (2012), fish fed higher levels of dietary arginine showed lower HSI values than fish fed lower concentrations. Body protein deposition appears to be the key determinant of live weight gain in fish. The close connection between weight gain and protein mass is due to the close association of water with protein (Dumas et al., 2007). During the study period, body protein deposition also showed significant changes among the treatments with maximum value was obtained at 17.5 g kg-1 arginine fed diet. The highest body protein deposition recorded at this level supports the growth performance data and affirms that at the 17.5 g kg-1 level, fish have the capability to utilize appropriate nutrients for proper growth and metabolism, thereby, producing best growth and feed efficiency. In the past, comparable results have also been reported on different fish species (Ahmed and Khan, 2004; Ahmed, 2013).
In the current study, significant changes in some hematological variables with response to dietary arginine levels were noted. Among these parameters, hemoglobin (Hb), hematocrit (Hct), and red blood cell (RBC) values were progressively influenced with elevated dietary arginine levels up to 17.5 g kg-1. The maximum values reported for Hb, Hct, and RBC at this level could be due to increase in fish growth performance, which provides blood oxygen transport throughout the body. Interestingly, erythrocyte sedimentation rate (ESR) tended to decrease as incremental arginine concentrations were increased, with the lowest value recorded at 16.0 g kg-1 of arginine diet, which could be attributed to high blood uniformity, resulting in an elevated erythrocyte count. The lower and higher fed groups, i.e., 10.0 and 22.5 g kg-1 actuated macrocytic anemia, as increased erythrocyte indices values were recorded at these treatments. MCH and MCHC values were insignificant, which supports our already published studies, i.e., leucine (Ahmad et al., 2021a) and valine (Ahmad et al., 2021b) requirement of same fish species under same experimental conditions.
The use of blood plasma and immune response variables has proven to be very effectual to monitor the health condition of fish (Chen et al., 2016; Ahmad et al., 2021; Nabi et al., 2022) along with the nutrition status and the ability of fish to adapt to the environment when external physiological or pathological changes occur. Over the past few years, the immunological activity of arginine in cultured fish has gradually received attention (Zhou et al., 2012). During the study period, we did not observe any significant changes in plasma parameters such as cholesterol, triglycerides, ALT, glucose, urea, lysozyme, nitric oxide, and total nitric oxide synthase. Several studies suggest that arginine is vital in providing the necessary substrate for nitric oxide production and may boost the expression of nitric oxide synthase (Buentello and Gatlin, 2000; Javanmard et al., 2009). However, plasma AST showed a decreased pattern up to 17.5 g kg-1, and thereafter, elevation in AST was observed, which supports previous studies on several fish species such as red sea bream, Pargus major (Rahimnejad and Lee, 2014), golden pompano (Lin et al., 2015) and yellow catfish, Pelteobagrus fulvidraco (Chen et al., 2016). Moreover, by augmenting dietary arginine concentrations up to the 17.5 g kg-1 level, plasma immune parameters such as total protein, alkaline phosphatase, and albumin showed a significant increasing trend, while as no significant changes were observed in plasma globulin levels. In the past, several studies have shown that a rise in blood plasma variables is connected with improved innate immune reactions in fish (Wiegertjes et al., 1996; Rahimnejad and Lee, 2014). Besides, there are other reports which suggest that change in blood plasma and immune parameters might be caused due to stress or by some change of amino acids in the diet (Lin et al., 2015; Chen et al., 2016).
In fish, the role of nutrients in the digestion process is also vital as absorption and digestion of nutrients play a crucial role in the growth performance, which is governed by the activities of digestive enzymes (Klein et al., 1998; Zhao et al., 2012; Ahmed and Ahmad, 2021). This study’s results show significant improvement in the intestinal enzymatic activities up to fish fed a 17.5 g kg-1 arginine diet except for amylase activity, which could be ascribed to optimum arginine level influencing digestion capacity, which supports the findings of Feng et al. (2013) and Tang et al. (2013), in which they observed progressive improvement in AST and ALT up to a certain point in hepatopancrease and muscle of C. carpio fed other amino acids, i.e., threonine and tryptophan diets, respectively. While as amylase did not produce any significant variations across the groups in our study, antioxidant enzyme activities have been evaluated in several fish species, which have a significant role in nutritional studies (Zhao et al., 2014). Among the nutrients, most of the amino acids possess antioxidant function (El-Sayed, 2014; Hoseini et al., 2019). Superoxide dismutase (SOD) has the ability to catalyze the reaction of super anions, converting them to H2O2 and O2, allowing it to scavenge super anions in tissue. As a result, SOD is regarded as an indication of oxidative stress (Zhou et al., 2012). During the study period, the activities of antioxidant parameters such as SOD, catalase (CAT), Glutathione peroxidase (GPx) and Glutathione reductase (GR) were significantly increased with elevated dietary arginine levels up to 17.5 g kg-1, except MDA, which indicated that arginine prevented oxidative damage and enzymatic activities of antioxidants in the intestine of O. mykiss. Similar findings have also been observed on different fish species (Zhou et al., 2012; Ren et al., 2013). Moreover, Coutinho et al. (2016) found insignificant differences in CAT, GR and lipid peroxidation in the liver and intestine of S. aurata, but observed incremental increase in the activity of SOD with the increasing concentrations of dietary arginine. Conversely, decline in MDA content up to 17.5 g kg-1 was noted in the present study, which demonstrated that the optimum concentration of dietary arginine might impede the lipid peroxidation of fish. Excessive antioxidant enzyme activity can contribute to an excess of malondialdehyde buildup (Qiang et al., 2011). MDA can cross link with the nucleophilic groups of proteins, nucleic acids, and amino phospholipids, increasing cell toxicity and speeding up cell and tissue destruction (Zhou et al., 2015). Furthermore, it has been found that arginine insufficiency leads to various immune-related problems such as decrease in lysozyme activities, complement system, nitric oxide, and superoxide anions. (Cheng et al., 2011; Costas et al., 2013; Rahimnejad and Lee, 2014; Hoseini et al., 2020).
Muscle is considered the vital organ, having largest deposition of protein in the body of organisms including fish (Bonaldo and Sandri, 2013; Wei et al., 2021). In the TOR signalling pathway, translation initiation is the first step in regulating protein synthesis (Holz et al., 2005; Chen et al., 2012). Moreover, the effect of dietary arginine on protein synthesis is attributed to the direct regulation of amino acid dependent the TOR signalling pathway (Carroll et al., 2016; Wei et al., 2021). In the present study, expression levels of TOR along its downstream effector, i.e., 4E-BP1, were positively ameliorated with an increase in dietary arginine up to a certain point. Several other reports in the past have also showed the up-regulation in gene expression of the TOR signalling pathway with response to varied levels of dietary arginine in different fish species (Chen et al., 2012; Tu et al., 2015), which is in accordance with the current results. The maximum TOR and 4E-BP1 gene expression levels were noted at the 17.5 g kg-1 arginine fed diet and for both genes, lowest expression levels were observed at lower doses of arginine, i.e., 10.0 and 12.5 g kg-1. We also found significant changes in the TOR signalling gene expression levels between an optimal level and imbalance or excessive fed groups, which is in support with the study of Chen et al. (2012). The possible reason could be that among different fish tissues, the expressions of TOR and its downstream effectors responded differently to graded levels of dietary arginine (Wei et al., 2021). Moreover, previously, we found that dietary leucine and valine have a potential role in the up-regulation of protein synthesis by triggering the TOR signalling pathway (Ahmad et al., 2021a; Ahmad et al., 2021b). In fish, it is apparent that several previous studies have focused on the TOR signaling pathway but an exact mechanism is not explicit, and hence, more investigation is needed.
Conclusions
We found that optimum arginine concentration could improve the growth performance, plasma biochemical indices, intestinal enzyme activities, and digestive ability of rainbow trout. Quadratic regression analysis results revealed that the optimum arginine requirement of rainbow trout was estimated to be at a 17.61 g kg-1 diet, corresponding to 39.13 g kg-1 of dietary protein. Besides, TOR and 4E-BP1 expression levels in muscle showed up-regulation that results in the enhancement of fish growth. This information would be applicable to the further investigation of the composition of a nutritionally sound arginine-based diet.
Data Availability Statement
The raw data supporting the conclusions of this article will be made available by the authors, without undue reservation.
Ethics Statement
All the protocols used have been approved by Animal Ethical Committee registered under R. No. 801/Go/RE/S/2003/CPCSEA.
Author Contributions
ImA: study design, formulated feed, review and editing, statistical analysis, and supervision; IsA: conducted feeding trial, biochemical analysis, molecular work, manuscript writing; BM: RNA extraction, cDNA synthesis, and manuscript drafting; BA: manuscript drafting and RT-PCR expression; ZW: RT-PCR expression and molecular calculations; YMK: manuscript drafting and editing. All authors contributed to the article and approved the submitted version.
Funding
This study was partially supported by the Department of Biotechnology (DBT), Government of India, New Delhi under the project on nutrient requirement of trout fingerlings (Grant No.BT/PR10573/AAQ/3/654/2013).
Conflict of Interest
The authors declare that the research was conducted in the absence of any commercial or financial relationships that could be construed as a potential conflict of interest.
Publisher’s Note
All claims expressed in this article are solely those of the authors and do not necessarily represent those of their affiliated organizations, or those of the publisher, the editors and the reviewers. Any product that may be evaluated in this article, or claim that may be made by its manufacturer, is not guaranteed or endorsed by the publisher.
Acknowledgments
The authors would like to extend their sincere gratitude to the Head, Department of Zoology, University of Kashmir, Hazratbal, Srinagar, India, for providing the laboratory facilities. We are also grateful to the Department of Fisheries, Seed Hatchery, Dachigam, Laribal, Srinagar (Jammu & Kashmir) for providing trout fingerlings to carry out this experiment.
References
Abidi S. F., Khan M. A. (2009). Dietary Arginine Requirement of Fingerling Indian Major Carp, Labeo Rohita (Hamilton) Based on Growth, Nutrient Retention Efficiencies, RNA/DNA Ratio and Body Composition. J. Appl. Ichthyol. 25, 707–714. doi: 10.1111/j.1439-0426.2009.01270.x
Ahmad I., Ahmed I., Dar N. A. (2021a). Effects of Dietary Leucine Levels on Growth Performance, Hemato-Biochemical Parameters, Liver Profile, Intestinal Enzyme Activities and Target of Rapamycin Signaling Pathway Related Gene Expression in Rainbow Trout, Oncorhynchus Mykiss Fingerlings. Aquac. Nutr. 27, 1837–1852. doi: 10.1111/anu.13321
Ahmad I., Ahmed I., Dar N. A. (2021b). Dietary Valine Improved Growth, Immunity, Enzymatic Activities and Expression of TOR Signaling Cascade Genes in Rainbow Trout, Oncorhynchus Mykiss Fingerlings. Sci. Rep. 11, 22089. doi: 10.1038/s41598-021-01142-4
Ahmad I., Ahmed I., Dar N. A. (2022). Effects of Dietary Isoleucine on Growth Performance, Enzymatic Activities, Antioxidant Properties and Expression of TOR Related Genes in Rainbow Trout, Oncorhynchus Mykiss Fingerlings. Aquac. Res. 53, 2366–2382. doi: 10.1111/are.15755
Ahmad I., Ahmed I., Fatma S., Peres H. (2021). Role of Branched Chain Amino Acids on Growth, Physiology and Metabolism of Different Fish Species: A Review. Aquac. Nutr. 27, 1270–1289. doi: 10.1111/anu.13267
Ahmed I. (2012). Dietary Amino Acid L-Tryptophan Requirement of Fingerling Indian Catfish, Heteropneustes Fossilis (Bloch) Estimated by Growth and Haemato-Biochemical Parameters. Fish. Physiol. Biochem. 38, 1195–1209. doi: 10.1007/s10695-012-9609-1
Ahmed I. (2013). Dietary Arginine Requirement of Fingerling Indian Catfish (Heteropneustes Fossilis, Bloch). Aquac. Int. 21, 255–271. doi: 10.1007/s10499-012-9548-y
Ahmed I. (2014). Dietary Amino Acid L-Methionine Requirement of Fingerling Indian Catfish, Heteropneustes Fossilis (Bloch-1974) Estimated by Growth & Haemato-Biochemical Parameters. Aquac. Res. 45, 243–258. doi: 10.1111/j.1365-2109.2012.03221.x
Ahmed I., Ahmad I. (2020). Effect of Dietary Protein Levels on Growth Performance, Hematological Profile and Biochemical Composition of Fingerlings Rainbow Trout, Oncorhynchus Mykiss Reared in Indian Himalayan Region. Aquac. Rep. 16, 100268. doi: 10.1016/j.aqrep.2019.100268
Ahmed I., Ahmad I. (2021). Dietary Lysine Modulates Growth Performance, Haemato-Biochemical Indices, Non-Specific Immune Response, Intestinal Enzymatic Activities And Antioxidant Properties of Rainbow Trout, Oncorhynchus mykiss fingerlings. Aquac. Nutr. 27, 124–139. doi: 10.1111/anu.13409
Ahmed I., Khan M. A. (2004). Dietary Arginine Requirement of Fingerling India Major Carp, Cirrhinus Mrigala (Hamilton). Aquac. Nutr. 10, 217–225. doi: 10.1111/j.1365-2095.2004.00293.x
Ahmed I., Khan M. A. (2006). Dietary Branched-Chain Amino Acid Valine, Isoleucine and Leucine Requirements of Fingerling Indian Major Carp, Cirrhinus Mrigala (Hamilton). Br. J. Nutr. 96, 450–460. doi: 10.1079/BJN20061845
Anthony J. C., Anthony T. G., Kimball S. R., Jefferson L. S. (2001). Orally Administered Leucine Stimulates Ribosomal Protein mRNA Translation But Not Global Rates of Protein Synthesis in the Liver of Rats. J. Nutr. 131, 1171–1176. doi: 10.1093/jn/131.4.1171
AOAC (1995). Official Methods of Analysis of the Association of Official Analytical Chemists. 16th edition. Ed. Cunniff P. (Arlington, Virginia, USA: Association of Official Analytical Chemists).
APHA (1992). Standard Methods for the Examination of Water and Waste Water. 18th edition (Washington DC: American Public Health Association), 1268 pp.
Barbul A. (1995). “The Use of Arginine in Clinical Practice,” in Amino Acid Metabolism and Therapy in Health and Nutritional Disease. Ed. Cynober L. A. (Boca Raton, Florida: CRC Press), 361–372.
Bergmeyer H. U., Bernt E. (1974a). “Glutamate-Oxaloacetate Transaminase, UV-Assay, Manual Method,” in Methods of Enzymatic Analysis. Ed. Bermeyer H. U. (New York: Academic Press), 2727–2733.
Bergmeyer H. U., Bernt E. (1974b). “Glutamate-Pyruvate Transaminase, UV-Assay, Manual Method,” in Methods of Enzymatic Analysis. Ed. Bermeyer H. U. (New York: Academic Press), 2752–2758.
Bonaldo P., Sandri M. (2013). Cellular and Molecular Mechanisms of Muscle Atrophy. Dis. Model Mech. 6, 25–39. doi: 10.1242/dmm.010389
Buentello J. A., Gatlin III D. M. (2000). The Dietary Arginine Requirement of Channel Catfish (Ictalurus Punctatus) is Influenced by Endogenous Synthesis of Arginine From Glutamic Acid. Aquaculture 188, 311–321. doi: 10.1016/S0044-8486(00)00344-6
Carroll B., Maetzel D., Maddocks O. D., Otten G., Ratcliff M., Smith G. R., et al. (2016). Control of TSC2-Rheb Signaling Axis by Arginine Regulates Mtorc1 Activity. eLife 5, e11058. doi: 10.7554/eLife.11058.001
Chen G., Feng L., Kuang S., Liu Y., Jiang J., Hu K., et al. (2012). Effect of Dietary Arginine on Growth, Intestinal Enzyme Activities and Gene Expression in Muscle, Hepatopancreas and Intestine of Juvenile Jian Carp (Cyprinus Carpio Var. Jian). Br. J. Nutr. 108, 195–207. doi: 10.1017/S0007114511005459
Cheng Z., Buentello A., Gatlin D. M. III (2011). Effects of Dietary Arginine and Glutamine on Growth Performance, Immune Responses and Intestinal Structure of Red Drum, Sciaenops Ocellatus. Aquaculture 319, 247–252. doi: 10.1016/j.aquaculture.2011.06.025
Chen Q., Zhao H., Huang Y., Cao J., Wang G., Sun Y., et al. (2016). Effects of Dietary Arginine Levels on Growth Performance, Body Composition, Serum Biochemical Indices and Resistance Ability Against Ammonia-Nitrogen Stress in Juvenile Yellow Catfish (Pelteobagrus Fulvidraco). Anim. Nutr 2, 204–210. doi: 10.1016/j.aninu.2016.07.001
Costas B., Conceicao L. E., Dias J., Novoa B., Figueras A., Afonso A. (2011). Dietary Arginine and Repeated Handling Increase Disease Resistance and Modulate Innate Immune Mechanisms of Senegalese Sole (Solea Senegalensis Kaup 1858). Fish. Shellf. Immunol. 31, 838–847. doi: 10.1016/j.fsi.2011.07.024
Costas B., Rego P., Conceicao L., Dias J., Afonso A. (2013). Dietary Arginine Supplementation Decreases Plasma Cortisol Levels and Modulates Immune Mechanisms in Chronically Stressed Turbot (Scophthalmus Maximus). Aquac. Nutr. 19, 25–38. doi: 10.1111/anu.12086
Coutinho F., Castro C., Rufino-Palomares E., Ordonez-Grande B., Gallardo M., Kaushik S., et al. (2016). Dietary Arginine Surplus Does Not Improve Intestinal Nutrient Absorption Capacity, Amino Acid Metabolism and Oxidative Status of Gilthead Sea Bream (Sparus Aurata) Juveniles. Aquaculture 464, 480–488. doi: 10.1016/j.aquaculture.2016.07.032
Dacie J. V., Lewis S. M. (1991). Practical Haematology. 7th edition (England: ELSB with Church Hill Living stone), 37–85.
Del Rio-Zaragoza O. B., Hernandez-Rodriguez M., Buckle-Ramirez L. F. (2008). Thermal Stress Effect on Tilapia Oreochromis Mossambicus (Pisces: Cichlidae) Blood Parameters. Mar. Freshw. Behav. Physiol. 41, 79–89. doi: 10.1080/10236240801896223
De Silva S. S., Gunasekara R. M., Gooley G. (2000). Digestibility and Amino Acid Availability of Three Protein-Rich Ingredient-Incorporated Diets by Murray Cod Maccullochella Peelii Peelii (Mitchell) and Australian Shortfin Eel Anguilla Australis Richardson. Aquac. Res. 31, 195–205. doi: 10.1046/j.1365-2109.2000.00432.x
Drabkin D. L. (1946). Spectrometric Studies. XIV. The Crystallographic and Optimal Properties of the Hemoglobin of Man Comparison With Those of Other Species. J. Biol. Chem. 164, 703–723. doi: 10.1016/S0021-9258(17)41272-5
Dumas A., France J., Bureau D. P. (2007). Evidence of Three Growth Stanzas in Rainbow Trout (Oncorhynchus Mykiss) Across Life Stages and Adaptation of the Thermal-Unit Growth Coefficient. Aquaculture 267, 139–146. doi: 10.1016/j.aquaculture.2007.01.041
Duncan D. B. (1955). Multiple Range and Multiple ‘F’ Tests. Biometrics 11, 1–42. doi: 10.2307/3001478
El-Sayed A. F. M. (2014). Is Dietary Taurine Supplementation Beneficial for Farmed Fish and Shrimp? A Comprehensive Review. Rev. Aquac. 6, 241–255. doi: 10.1111/raq.12042
Farhat Khan M. A. (2012). Effects of Dietary Arginine Levels on Growth, Feed Conversion, Protein Productive Value and Carcass Composition of Stinging Catfish Fingerling Heteropneustes Fossilis (Bloch). Aquac. Int. 20, 935–950. doi: 10.1007/s10499-012-9519-3
Fauzi I. A., Haga Y., Kondo H., Hirono I., Satoh S. (2019). Effects of Arginine Supplementation on Growth Performance and Plasma Arginine, Ornithine and Citrulline Dynamics of Rainbow Trout, Oncorhynchus Mykiss. Aquacult. Res. 50, 1277–1290. doi: 10.1111/are.14004
Feng L., Peng Y., Wu P., Hu K., Jiang W. D., Liu Y., et al. (2013). Threonine Affects Intestinal Function Protein Synthesis and Gene Expression of TOR in Jian Carp (Cyprinus Carpio Var. Jian). PloS One 8, e69974. doi: 10.1371/journal.pone.0069974
Fournier V., Gouillou-Coustans M. F., Metailler R., Vachot C., Moriceau J., Le Delliou H., et al. (2002). Excess Dietary Arginine Affects Urea Excretion But Does Not Improve N Utilisation in Rainbow Trout, Oncorhynchus Mykiss and Turbot Psetta Maxima. Aquaculture 217, 559–576. doi: 10.1016/S0044-8486(02)00420-9
Furne M., Hidalgo M. C., López A., Lopez A., García-Gallego M., Morales A. E., et al. (2005). Digestive Enzyme Activities in Adriatic Sturgeon Acipenser Naccarii and Rainbow Trout Oncorhynchus Mykiss. A Comparative Study. Aquaculture 250, 391–398. doi: 10.1016/j.aquaculture.2005.05.017
Gao Y. J., Yang H. J., Liu Y. J., Chen S. J., Guo D. Q., Yu Y., et al. (2014). Effects of Graded Levels of Threonine on Growth Performance, Biochemical Parameters and Intestine Morphology of Juvenile Grass Carp Ctenopharyngodon Idella. Aquaculture 424-425, 113–119. doi: 10.1016/j.aquaculture.2013.12.043
Gatlin D. M. III (2010). Principles of Fish Nutrition (Stoneville, Mississipi: Principles of Fish Nutrition. Southern Regional Aquaculture Centre, Mississipi state university, Delta Research and Extension Center).
Halver J. E. (2002). “The Vitamins,” in Fish Nutrition, 3rd edition. Eds. Halver J. E., Hardy R. W. (San Diego, CA: Academic Press), 61–141.
Hardy R. W. (2010). Utilization of Plant Proteins in Fish Diets: Effects of Global Demand and Supplies of Fishmeal. Aquac. Res. 41, 770–776. doi: 10.1111/j.1365-2109.2009.02349.x
Holz M. K., Ballif B. A., Gygi S. P., Blenis J. (2005). mTOR and S6K1 Mediate Assembly of the Translation Preinitiation Complex Through Dynamic Protein Interchange and Ordered Phosphorylation Events. Cell 123, 569–580. doi: 10.1016/j.cell.2005.10.024
Hoseini S. M., Khan M. A., Yousefi M., Costas B. (2020). Roles of Arginine in Fish Nutrition and Health: Insights for Future Researches. Rev. Aquac.12, 2091–2108. doi: 10.1111/raq.12424
Hoseini S. M., Yousefi M., Hoseinifar S. H., Van Doan H. (2019). Effects of Dietary Arginine Supplementation on Growth, Biochemical, and Immunological Responses of Common Carp (Cyprinus Carpio L.), Stressed by Stocking Density. Aquaculture 503, 452–459. doi: 10.1016/j.aquaculture.2019.01.031
Hu C. A., Khalil S., Zhaorigetu S., Liu Z., Tyler M., Wan G., et al. (2008). Human Δ1-Pyrroline-5-Carboxylate Synthase: Function and Regulation. Amino Acids 35, 665–672. doi: 10.1007/s00726-008-0075-0
Hummel B. C. W. (1959). A Modified Spectrophotometric Determination of Chymotrypsin, Trypsin, and Thrombin. Can. J. Biochem. 37, 1393–1399. doi: 10.1139/059-157
Jauncey K. (1982). The Effects of Varying Dietary Protein Level on The Growth, Food Conversion, Protein Utilization and Body Composition of Juvenile Tilapias (Sarotherodon Mossambicus). Aquaculture 27, 43–54. doi: 10.1016/0044-8486(82)90108 -9.
Javanmard S. H., Nematbakhsh M., Mahmoodi F., Mohajeri M. R. (2009). Arginine Supplementation Enhances eNOS Expression in Experimental Model of Hypercholesterolemic Rabbits Aorta. Pathophysiology 16, 9–13. doi: 10.1016/j.pathophys.2008.11.003
Jiang J., Shi D., Zhou X. Q., Hu Y., Feng L., Liu Y., et al. (2015). In Vitro and In Vivo Protective Effect of Arginine Against Lipopolysaccharide Induced Inflammatory Response in the Intestine of Juvenile Jian Carp (Cyprinus Carpio Var. Jian). Fish. Shellf. Immunol. 42, 457–464. doi: 10.1016/j.fsi.2014.11.030
Jobgen W. S., Fried S. K., Fu W. J., Meininger C. J., Wu G. (2006). Regulatory Role for the Arginine-Nitric Oxide Pathway in Metabolism of Energy Substrates. J. Nutr. Biochem. 17, 571–588. doi: 10.1016/j.jnutbio.2005.12.001
Khan A. M., Abidi S. F. (2011). Dietary Arginine Requirement of Heteropneustes Fossilis Fry (Bloch) Based on Growth, Nutrient Retention and Haematological Parameters. Aquac. Nutr. 17, 418–428. doi: 10.1111/j.1365-2095.2010.00819.x
Khan Y. M., Khan M. A. (2021). Optimization of Dietary Pyridoxine Improved Growth Performance, Hematological Indices, Antioxidant Capacity, Intestinal Enzyme Activity, non-Specific Immune Response and Liver Pyridoxine Concentration of Fingerling Major Carp Catla Catla (Hamilton). Aquaculture 541, 736815. doi: 10.1016/j.aquaculture.2021.736815
Khan Y. M., Khan M. A. (2022). Effects of Dietary Pantothenic Acid on Growth Performance, Intestinal Enzyme Activity, non-Specific Immune Response, Antioxidant Capacity, Hematological Parameters, Carcass Composition and Liver Pantothenic Acid Concentration of Fingerling Catla, Catla Catla (Hamilton). Anim. Feed. Sci. Technol. 285, 115245. doi: 10.1016/j.anifeedsci.2022.115245
Kim K. I., Kayes T. B., Amundson C. H. (1992). Requirements for Lysine and Arginine by Rainbow Trout (Oncorhynchus Mykiss). Aquaculture 106, 333–344. doi: 10.1016/0044-8486(92)90265-M
Klein S., Cohn S. M., Alpers D. H. (1998). “The Alimentary Tract in Nutrition,” in Modern Nutrition in Health and Disease. Eds. Shils M. E., Olson A. J., Shike M., Ross A. C. (Baltimore: Williams and Wilkins), 605–630.
Larson S. D., Li J., Chung D. H., Evers B. M. (2007). Molecular Mechanisms Contributing to Glutamine-Mediated Intestinal Cell Survival. Am. J. Physiol. Gastrointest. Liv. Physiol. 293, G1262–G1271. doi: 10.1152/ajpgi.00254.2007
Liang H., Habte-Tsion H. M., Ge X., Ren M., Xie J., Miao L., et al. (2018). Dietary Arginine Affects the Insulin Signaling Pathway, Glucose Metabolism and Lipogenesis in Juvenile Blunt Snout Bream, Megalobrama Amblycephala. Sci. Rep. 7, 7864. doi: 10.1038/s41598-017-06104-3
Liang H., Ren M., Habte-Tsion H. M., Ge X., Xie J., Mi H., et al. (2016). Dietary Arginine Affects Growth Performance, Plasma Amino Acid Contents and Gene Expressions of the TOR Signaling Pathway in Juvenile Blunt Snout Bream, Megalobrama Amblycephala. Aquaculture 461, 1–8. doi: 10.1016/j.aquaculture.2016.04.009
Lin H., Tan X., Zhou C., Niu J., Xia D., Huang Z., et al. (2015). Effect of Dietary Arginine Levels on the Growth Performance, Feed Utilization, non-Specific Immune Response and Disease Resistance of Juvenile Golden Pompano Trachinotus Ovatus. Aquaculture 437, 382–389. doi: 10.1016/j.aquaculture.2014.12.025
Livak K. J., Schmittgen T. D. (2001). Analysis of Relative Gene Expression Data Using Realtime Quantitative PCR and the 2-ΔΔC(T) Method. Methods 25, 402–408. doi: 10.1006/meth.2001.1262
Luo Z., Liu Y. J., Mai K. S., Tian L. X. (2004). Advance in Researches on Arginine Requirement for Fish: A Review. J. Fish. China 28, 450–459.
Millamena O., Bautista-Teruel M. N., Reyes O. S., Kanazawa A. (1998). Requirements of Juvenile Marine Shrimp, Penaeus Monodon (Fabricius) for Lysine and Arginine. Aquaculture 164, 95–104. doi: 10.1016/S0044-8486(98)00179-3
Murillo-Gurrea D. P., Coloso R. M., Borlongan I. G., Serrano A. E. (2001). Lysine and Arginine Requirements of Juvenile Asian Sea Bass (Lates Calcarifer). J. Appl. Ichthyol. 17, 49–53. doi: 10.1046/j.1439-0426.2001.00242.x
Murthy H. S., Varghese T. J. (1995). Arginine and Histidine Requirements of the Indian Major Carp, Labeo Rohita (Hamilton). Aquacult. Nutr. 1, 235–239. doi: 10.1111/j.1365-2095.1995.tb00049.x
Nabi N., Ahmed I., Wani G. B. (2022). Hematological and Serum Biochemical Reference Intervals of Rainbow Trout, Oncorhynchus Mykiss Cultured in Himalayan Aquaculture: Morphology, Morphometrics and Quantification of Peripheral Blood Cells. Saudi. J. Biol. Sci. 29, 2942–2957. doi: 10.1016/j.sjbs.2022.01.019
Narita I., Border W. A., Ketteler M., Ruoslahti E., Noble N. A. (1995). L-Arginine may Mediate the Therapeutic Effects of Low-Protein Diets. Proc. Nat. Acad. Sci. U.S.A. 92, 4552–4556. doi: 10.1073/pnas.92.10.4552
Natt M. P., Herrick C. A. (1952). A New Blood Diluent for Counting the Erythrocytes and Leucocytes of the Chicken. Poult. Sci. 31, 735–738. doi: 10.3382/ps.0310735
Nose T. (1979). “Summary Report on the Requirements of Essential Amino Acids for Carp,” in Finfish Nutrition and Fish Feed Technology, vol. Vol. 1 . Eds. Halver J. E., Tiews K. (Berlin, Germany: Heenemann, GmbH), 145–156.
NRC (National Research Council) (1993). Nutrient Requirements of Fish (Washington DC, USA: National Academy Press).
NRC (National Research Council) (2011). Nutrient Requirement of Fish and Shrimp (Washington, DC: The National Academies Press).
Ogino C. (1980). Requirements of Carp and Rainbow Trout for Essential Amino Acids. Bull. Jpn. Soc Sci. Fish. Sci. 46, 171–174. doi: 10.2331/suisan.46.171
Pesti G. M., Vedenov D., Cason J. A., Billard L. (2009). A Comparison of Methods to Estimate Nutritional Requirements From Experimental Data. Br. Poult. Sci. 50, 16–32. doi: 10.1080/00071660802530639
Plisetskaya E. M., Buchelli-Narvaez L. I., Hardy R. W., Dickhoff W. W. (1991). Effects of Injected and Dietary Arginine on Plasma Insulin Levels and Growth of Pacific Salmon and Rainbow Trout. Comp. Biochem. Physiol. A. 98, 165–170. doi: 10.1016/0300-9629(91)90595-4
Qiang J., Xu P., He J., Wang H., Li R. (2011). The Combined Effects of External Ammonia and Crowding Stress on Growth and Biochemical Activities in Liver of (GIFT) Nile Tilapia Juvenile (Oreochromis Niloticus). J. Fish. China 12, 1837–1848. doi: 10.1111/are.13507
Rahimnejad S., Lee K. J. (2014). Dietary Arginine Requirement of Juvenile Red Sea Bream Pagrus Major. Aquaculture 434, 418–424. doi: 10.1016/j.aquaculture.2014.09.003
Rajaguru A. (1992). Biology of Two Co-Occurring Tongue Fishes, Cynoglossus Arel and C. Lida (Pleuronectiformes: Cynoglossidae), From Porto Nova, Southeast Coast of India. Fish. Bull. 90, 328–367.
Ren M. C., Liao Y. J., Xie J., Liu B., Zhou Q. L., Ge X., et al. (2013). Dietary Arginine Requirement of Juvenile Blunt Snout Bream, Megalobrama Amblycephala. Aquaculture 414-415, 229–234. doi: 10.1016/j.aquaculture.2013.08.021
Rodehutscord M., Borchert F., Gregus Z., Pfeffer E. (2000). Availability and Utilisation of Free Lysine in Rainbow Trout (Oncorhynchus Mykiss). Aquaculture 187, 177–183. doi: 10.1016/S0044-8486(99)00389-0
Shah A., Shin-ichi T., Shunsuke K. (2002). Arginine Requirement of Juvenile Japanese Flounder Paralichthys Olivaceus Estimated by Growth and Biochemical Parameters. Aquaculture 205, 127–140. doi: 10.1016/S0044-8486(01)00670-6
Singh S., Khan M. A. (2007). Dietary Arginine Requirement of Fingerling Hybrid Clarias (Clarias Gariepinus×Clarias Macrocephalus). Aquac. Res. 38, 17–25. doi: 10.1111/j.1365-2109.2006.01618.x
Snedecor G. W., Cochran W. G. (1967). Statistical Methods. 6th edition (Ames, Iowa: Iowa State University Press), 593.
Tacon A. G. J., Metian M. (2013). Fish Matters: Importance of Aquatic Foods in Human Nutrition and Global Food Supply. Rev. Fish. Sci. 21, 22–38. doi: 10.1080/10641262.2012.753405
Tang L., Feng L., Sun C. Y., Chen G. F., Jiang W. D., Hu K., et al. (2013). Effect of Tryptophan on Growth, Intestinal Enzyme Activities and TOR Gene Expression in Juvenile Jian Carp (Cyprinus Carpio Var. Jian): Studies In Vivo and In Vitro. Aquaculture 412-413, 25–33. doi: 10.1016/j.aquaculture.2013.07.002
Tu Y. Q., Xie S. Q., Han D., Yang Y. X., Jin J. Y., Zhu X. M. (2015). Dietary Arginine Requirement for Gibel Carp (Carassis Auratus Gibelio Var. CAS III) Reduces With Fish Size From 50g to 150g Associated With Modulation of Genes Involved in TOR Signaling Pathway. Aquaculture 449, 37–47. doi: 10.1016/j.aquaculture.2015.02.031
Walton M. J., Cowey C. B., Coloso R. M., Knox D., Adron J. W. (1986). Dietary Requirement of Rainbow Trout for Tryptophan, Lysine and Arginine Determined by Growth and Biochemical Measurement. Fish. Physiol. Biochem. 2, 161–169. doi: 10.1007/BF02264084
Wang X., Qiao S. Y., Yin Y. L., Yue L. Y., Wang Z. Y., Wu G. (2007). A Deficiency or Excess of Dietary Threonine Reduces Protein Synthesis in Jejunum and Skeletal Muscle of Young Pigs. J. Nutr. 137, 1442–1446. doi: 10.1093/jn/137.6.1442
Wang Y., Wang C., Liu S., Zhang S., Lu S., Liu H., et al. (2022). Effects of Dietary Arginine on Growth Performance, Digestion, Absorption Ability, Antioxidant Capability, Gene Expression of Intestinal Protein Synthesis, and Inflammation-Related Genes of Triploid Juvenile Oncorhynchus Mykiss Fed a Low-Fishmeal Diet. Aquacult. Nutr. 2022, 1–14.. doi: 10.1155/2022/3793727
Wang L., Wu J., Wang C., Li J., Zhao Z., Luo L., et al. (2017). Dietary Arginine Requirement of Juvenile Hybrid Sturgeon (Acipenser Schrenckii♀ × Acipenser Baerii♂). Aquac. Res. 48, 5193–5201. doi: 10.1111/are.13331
Wedemeyer G. A., Gould R. W., Yasutake W. T. (1983). Some Potentials and Limits of the 1 Eucorit Test as a Fish Health Assessment Method. J. Fish. Biol. 23, 711–716. doi: 10.1111/j.1095-8649.1983.tb02948.x
Wei Y., Zhang Q., Jia L., Xu H., Liang M. (2021). Effects of Dietary Arginine Levels on Growth, Intestinal Peptide and Amino Acid Transporters, and Gene Expressions of the TOR Signaling Pathway in Tiger Puffer, Takifugu Rubripes. Aquaculture 532, 736086. doi: 10.1016/j.aquaculture.2020.736086
Wiegertjes G. F., Stet R. J. M., Parmentiert H. K., van Muiswinkel W. B. (1996). Immunogenetics of Disease Resistance in Fish: A Comparative Approach. Dev. Comp. Immunol. 20, 365–381. doi: 10.1016/S0145-305X(96)00032-8
Wilson R. P. (2002). “Amino Acids and Proteins,” in Fish Nutrition. Eds. Halver J. E., Hardy R. W. (New York: Academic Press), 143–179.
Wullschleger S., Loewith R., Hall M. N. (2006). TOR Signaling in Growth and Metabolism. Cell 124, 471–484. doi: 10.1016/j.cell.2006.01.016
Wu G., Morris S. M. Jr. (1998). Arginine Metabolism: Nitric Oxide and Beyond. Biochem. J. 336, 1–17. doi: 10.1042/bj3360001
Yossa R., Verdegem M. (2015). Misuse of Multiple Comparison Tests and Underuse of Contrast Procedures in Aquaculture Publications. Aquaculture 437, 344–350. doi: 10.1016/j.aquaculture.2014.12.023
Yue Y., Zou Z., Zhu J., Li D., Xiao W., Han J., et al. (2015). Effects of Dietary Arginine on Growth Performance, Feed Utilization, Haematological Parameters and Non-Specific Immune Responses of Juvenile Nile Tilapia (Oreochromis Niloticus L.). Aquac. Res. 46, 1801–1809. doi: 10.1111/are.12333
Zehra S., Khan M. A. (2013). Dietary Arginine Requirement of Fingerling Indian Major Carp, Catla Catla (Hamilton). J. World Aquac. Soc 44, 363–373. doi: 10.1111/jwas.12046
Zehra S., Khan M. A. (2015). Dietary Tryptophan Requirement of Fingerling Catla Catla (Hamilton) Based on Growth, Protein Gain, RNA/DNA Ratio, Haematological Parameters and Carcass Composition. Aquac. Nutr. 21, 690–701. doi: 10.1111/anu.12198
Zeitoun I. H., Ulrey D. E., Magee W. T., Gill J. L., Bergen W. G. (1976). Quantifying Nutrient Requirements of Fish. J. Fish. Res. Board. Can. 33, 167–172. doi: 10.1139/f76-019
Zhang K., Mai K., Xu W., Liufu Z., Zhang Y., Peng M., et al. (2017). Effects of Dietary Arginine and Glutamine on Growth Performance, Nonspecific Immunity, and Disease Resistance in Relation to Arginine Catabolism in Juvenile Turbot (Scophthalmus Maximus L). Aquaculture 468, 246–254. doi: 10.1016/j.aquaculture.2016.10.021
Zhang X. D., Zhu Y. F., Cai L. S., Wu T. X. (2008). Effects of Fasting on the Meat Quality and Antioxidant Defenses of Market-Size Farmed Large Yellow Croaker (Pseudosciaena Crocea). Aquaculture 280, 136–139. doi: 10.1016/j.aquaculture.2008.05.010
Zhao J., Feng L., Liu Y., Jiang W., Wu P., Jiang J., et al. (2014). Effect of Dietary Isoleucine on the Immunity, Antioxidant Status, Tight Junctions and Microflora in the Intestine of Juvenile Jian Carp (Cyprinus Carpio Var. Jian). Fish. Shellf. Immunol. 41, 663–673. doi: 10.1016/j.fsi.2014.10.002
Zhao J., Liu Y., Jiang J., Wu P., Chen G., Jiang W., et al. (2012). Effects of Dietary Isoleucine on Growth, the Digestion and Absorption Capacity and Gene Expression in Hepatopancreas and Intestine of Juvenile Jian Carp (Cyprinus Carpio Var. Jian). Aquaculture 368-369, 117–128. doi: 10.1016/j.aquaculture.2012.09.019
Zhou Q., Jin M., Elmada Z. C., Liang X., Mai K. (2015). Growth, Immune Response and Resistance to Aeromonas Hydrophila of Juvenile Yellow Catfish, Pelteobagrus Fulvidraco, Fed Diets With Different Arginine Levels. Aquaculture 437, 84–91. doi: 10.1016/j.aquaculture.2014.11.030
Zhou Q. C., Wu Z. H., Chi S. Y., Yang Q. H. (2007). Dietary Lysine Requirement of Juvenile Cobia (Rachycentron Canadum). Aquaculture 273, 634–640. doi: 10.1016/j.aquaculture.2007.08.056
Zhou F., Xiong W., Xiao J. X., Shao Q. J., Bergo O. N., Hua Y., et al. (2010). Optimum Arginine Requirement of Juvenile Black Sea Bream, Sparus Macrocephalus. Aquac. Res. 41, 418–430. doi: 10.1111/j.1365-2109.2009.02474.x
Keywords: rainbow trout, arginine level, enzymatic activities, target of rapamycin (TOR), fingerling
Citation: Ahmed I, Ahmad I, Malla BA, Shah BA, Wani ZA and Khan YM (2022) Dietary Arginine Modulates Growth Performance, Hemato-Biochemical Indices, Intestinal Enzymes, Antioxidant Ability and Gene Expression of TOR and 4E-BP1 in Rainbow Trout, Oncorhynchus mykiss Fingerlings. Front. Mar. Sci. 9:908581. doi: 10.3389/fmars.2022.908581
Received: 31 March 2022; Accepted: 29 April 2022;
Published: 10 June 2022.
Edited by:
Samad Rahimnejad, University of South Bohemia in České Budějovice, CzechiaReviewed by:
Mahmoud A. O. Dawood, Kafrelsheikh University, EgyptOmid Safari, Ferdowsi University of Mashhad, Iran
Mingchun Ren, Chinese Academy of Fishery Sciences, China
Copyright © 2022 Ahmed, Ahmad, Malla, Shah, Wani and Khan. This is an open-access article distributed under the terms of the Creative Commons Attribution License (CC BY). The use, distribution or reproduction in other forums is permitted, provided the original author(s) and the copyright owner(s) are credited and that the original publication in this journal is cited, in accordance with accepted academic practice. No use, distribution or reproduction is permitted which does not comply with these terms.
*Correspondence: Imtiaz Ahmed, aW10aWF6YW11MUB5YWhvby5jb20=
 Imtiaz Ahmed
 Ishtiyaq Ahmad
 Bashir Ahmad Malla2