 Joanna Buckee
 Yasha Hetzel
 William Edge2,3
 Jennifer Verduin
 Chari Pattiaratchi
- 1Centre for Sustainable Aquatic Ecosystems, Harry Butler Institute, Murdoch University, Perth, WA, Australia
- 2Oceans Graduate School, The University of Western Australia, Perth, WA, Australia
- 3The UWA Oceans Institute, Indian Ocean Marine Research Centre, Perth, WA, Australia
Sea level exerts a fundamental influence on the intertidal zone, where organisms are subject to immersion and emersion at varying timescales and frequencies. While emersed, intertidal organisms are exposed to atmospheric stressors which show marked diurnal and seasonal variability, therefore the daily and seasonal timing of low water is a key determinant of survival and growth in this zone. Using the example of shallow coral reefs, the coincidence of emersion with selected stressors was investigated for eight locations around the Australian coastline. Hourly water levels (1992 – 2016) from a high-resolution sea level hindcast (http://sealevelx.ems.uwa.edu.au), were linked to maximum surface solar radiation data from the Copernicus ERA5 atmospheric model and minimum atmospheric temperature observations from the Australian Bureau of Meteorology to identify seasonal patterns and historical occurrence of coral emersion mortality risk. Local tidal characteristics were found to dictate the time of day when low water, and therefore emersion mortality risk occurs, varying on a seasonal and regional basis. In general, risk was found to be greatest during the Austral spring when mean sea levels are lowest and a phase change in solar tidal constituents occurs. For all Great Barrier Reef sites, low tide occurs close to midday during winter and midnight in the summer, which may be fundamental factor supporting the historical bio-geographical development of the reef. Interannual variability in emersion mortality risk was mostly driven by non-tidal factors, particularly along the West Coast where El Niño events are associated with lower mean sea levels. This paper highlights the importance of considering emersion history when assessing intertidal environments, including shallow coral reef platform habitats, where critical low water events intrinsically influence coral health and cover. The study addresses a fundamental knowledge gap in both the field of water level science and intertidal biology in relation to the daily timing of low tide, which varies predictably on a seasonal and regional basis.
Introduction
The intertidal zone, the region that is above the water level at low tide and underwater at high tide, is one of the harshest environments on the planet (Underwood and Chapman, 1999). Sea level variability at different time scales fundamentally impacts intertidal benthic organisms which are periodically submerged by sea water and exposed to air, and tidal characteristics play a significant role in defining the biogeography of these zones (Shepherd and Edgar, 2013). Although not typically regarded as intertidal organisms, corals are commonly found on, and indeed form, intertidal reef platforms (Yonge, 1940; Davies and Marshall, 1980; Richards et al., 2015) where vertical growth is inherently constrained by an inability to grow in the air (Achituv and Dubinsky, 1990). Temporal variability in sea level is an important, but under-reported driver of temporal dynamics in shallow coral reef habitats and has the potential to confound the assessment of coral cover in relation to other factors, including temperature and climate drivers such as the El-Niño Southern Oscillation (ENSO) (Ampou et al., 2017; Zapata, 2017; Buckee et al., 2019; Dunne et al., 2021). The investigation of sea level variability in relation to coral reefs has broad and fundamental implications for all intertidal habitats, including seagrass beds, mangroves, salt marshes and rocky shores.
Mass mortalities of corals following extreme low tides and high solar radiation have been reported in Guam (Yamaguchi, 1975), Eastern Pacific (Glynn, 1976; Eakin, 1996; Zapata et al., 2010; Mejía-Rentería et al., 2019), the Red Sea (Fishelson, 1973; Loya, 1976), Hawaii (Krupp, 1984), Thailand (Brown et al., 1994) the Central Great Barrier Reef (GBR) in Australia (Anthony and Kerswell, 2007), and Indonesia (Ampou et al., 2017). Armstrong et al. (2007) report a cold weather emersion event for Ningaloo in Western Australia, and Hoegh-Guldberg et al. (2005) describe extensive coral bleaching and subsequent partial mortality following a low water level event at Heron Island in the GBR in which corals were exposed to unusually cold conditions and dry winds. Similarly, Fadlallah et al. (1995) notes mass coral mortality in the western Arabian Gulf coincident with winter low tides. In addition to these stressors, low salinities associated with rainfall during low water level events have also been linked to coral mortality Slack-smith (1960), and earlier records summarised in Loya, (1976). Wind stress is also reported to result in bleaching of coral branches facing into the wind during emersion (Leggat et al., 2006). This aspect of coral reef disturbance has received little attention in recent years; however, it is logical that emersion mortality events will inevitably occur on all shallow reef flats, due to the combination of upward coral growth and water level fluctuations at seasonal and interannual time scales.
Processes that drive sea level variability over time can be classified as tidal or non-tidal. Tides are primarily the result of gravitational interactions of the world’s oceans with the moon and sun (Pugh and Woodworth, 2014). Tides can be described as long and regular shallow-water waves, and at any time water levels due to astronomical effects reflect the amplitude, period and phase of all constituent waves (NOAA, 2021). For every location in the ocean there is a unique combination of constituents and therefore a unique tidal sequence, which is highly predictable and can be described for each location based on the number of tides per day; i.e. semi-diurnal (twice daily) and diurnal (once daily), the timing of largest and smallest tides over an approximately monthly cycle (neap and spring; tropic and equatorial tides), timing of largest tides over a semi- annual cycle (solstice and equinox tides) and longer-term periodicity (including the 18.61-year nodal cycle and 4.4-year modulation due to lunar perigee) (Pattiaratchi and Eliot, 2008; Pugh and Woodworth, 2014). Tidal form, defined by the relative contribution of diurnal and semi-diurnal constituents, affects not only the periodicity and seasonal timing of tidal range and extreme water level events on a daily scale, but also at semi-annual and inter-annual timescales (Eliot, 2018; Ray and Merrifield, 2019). In the Australian coastal zone, tidal range varies from< 1 m in southwestern Australia where diurnal tides dominate, to > 10 m in northwestern Australia where tides are semi-diurnal (Figures 1A, B).
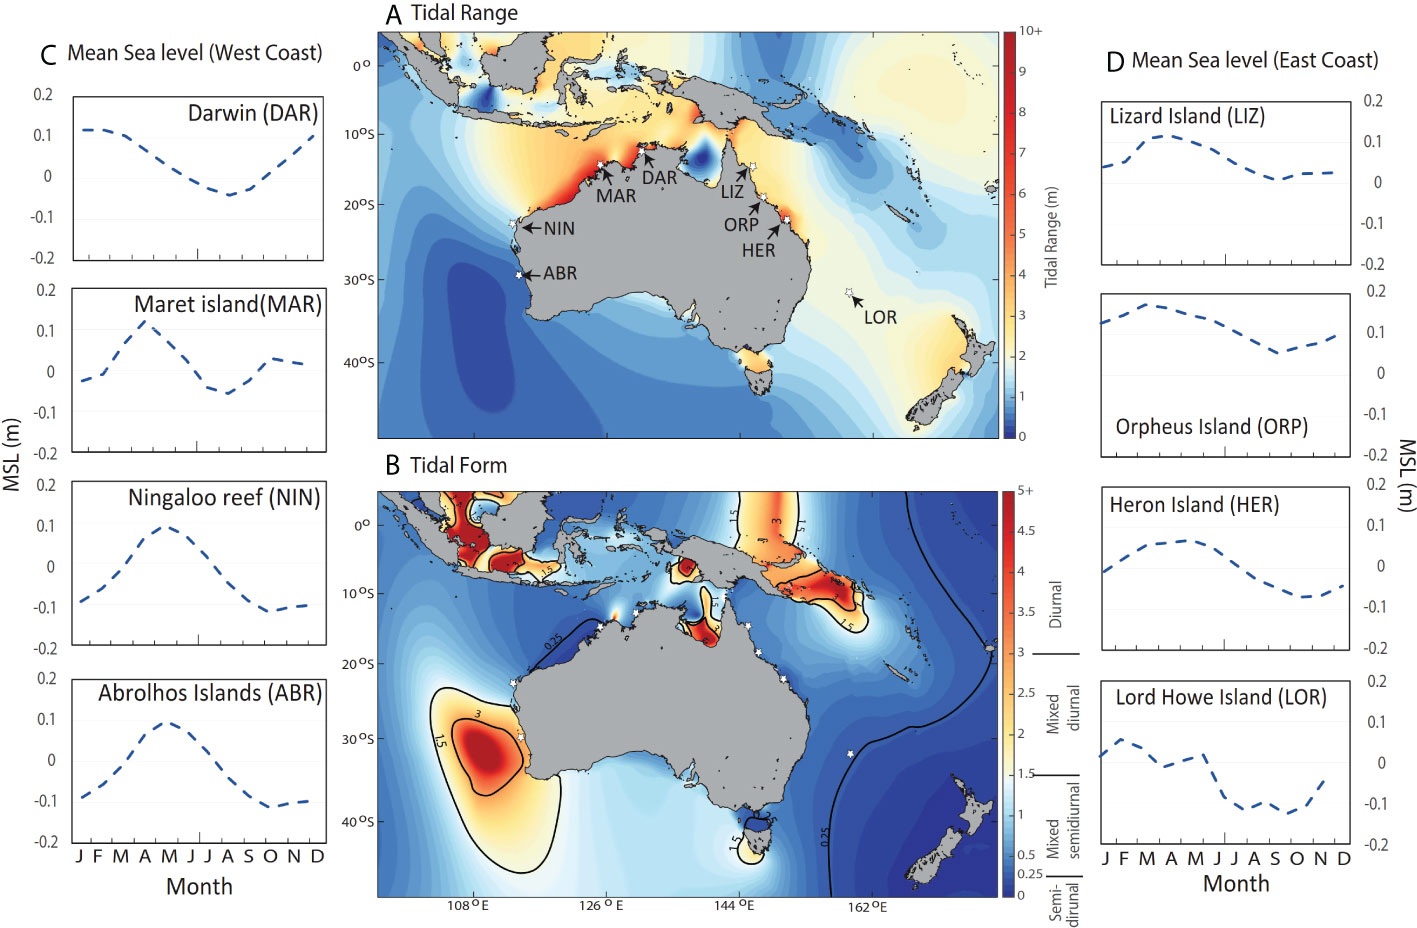
Figure 1 Study sites in relation to (A) tidal range (difference between highest and lowest astronomical tidal heights in meters) and (B) tidal form, (ratio of major diurnal to semi-diurnal tidal constituents) and mean sea level (MSL) (1992 – 2016) for (C) West Coast and (D) East Coast study sites. Tidal characteristics for A and B were obtained from the ozROMS model (Wijeratne et al., 2018).
The daily timing of high and low tide varies both temporally and spatially and is predictable based on astronomical components which have been modelled globally (Haigh et al., 2011b). At some coral reef locations extreme low tides have been found to always occur at the same time of the day, such as in the Western Indian Ocean (Pugh and Rayner, 1981) and the Kimberley region of Western Australia (Richards et al., 2018). In contrast, seasonal variability in the daily timing of low tide has been observed for the Caribbean (Glynn, 1968) and at the Abrolhos Islands (Buckee et al., 2019).
Absolute sea levels result from the combination of the astronomical and non-astronomical forcing with the latter influencing mean sea levels (MSL), inter-annual and seasonal variability, and over period of days and hours due to oceanographic factors, climate and weather-related (e.g. storm surges) variability (Pattiaratchi, 2011). Seasonal variability of MSL in coastal waters around Australia is related to the dominant poleward flowing ocean currents, the East Australia Current in the east (Ridgway and Godfrey, 1997), the Leeuwin Current in the west and reversal of monsoon/trade winds in the north (Pattiaratchi and Eliot, 2008; Feng et al., 2009; Haigh et al. 2011a; White et al., 2014). Short term air pressure effects, or inverse barometer effects, drive short term changes in sea level due to synoptic weather systems (Pugh and Woodworth, 2014).
Interannual variability in MSL is closely linked to a number of climate drivers including the El Niño Southern Oscillation (ENSO), which is the oscillation between El Niño and La Niña conditions in the Pacific Ocean. The intensity of ENSO events is indicated by the Southern Oscillation Index (SOI) which is calculated using the pressure differences between Tahiti and Darwin (BOM, 2021a). ENSO events exert a global, but spatially variable influence on MSL (Menéndez and Woodworth, 2010). La Niña conditions are typically associated with high water levels around the whole of the Australian coastline, but the effect is greatest in the west (Pattiaratchi, 2011; White et al., 2014). Conversely, El Niño conditions are associated with low water levels throughout the western Pacific, which have previously been associated with widespread emersion-related coral mortality (Ampou et al., 2017).
Coral ecosystems are under threat world-wide, and there is a high level of valid concern regarding the increase in frequency and severity of thermal bleaching and mortality events (Hughes et al., 2017; Sheppard et al., 2018). Thermal bleaching is known to be closely linked to ENSO events, which bring extensive warming of the central and eastern tropical Pacific Ocean. Considerable research effort has been directed towards investigation and reporting in this area, as evidenced by a meta-analysis conducted by Claar et al. (2018) which lists over 140 primary publications on the impacts of ENSO related events on coral reefs but does not include water level variability as a contributing factor to coral reef disturbance. Despite thermal bleaching being an urgent issue that warrants prioritisation, it remains fundamentally important to also consider water level influences when assessing the temporal change in coral cover on shallow reefs. There appear to be few, if any, systematic studies of coral reef emersion stress.
This study encompasses the extensive Australian coral reef systems extending over a coastline of > 7200 km. This includes the largest coral reef in the world, the Great Barrier Reef (GBR) which spans approximately 2600 km (Wolanski, 2000), Ningaloo Reef (around 290 km in length (UNESCO, 2021)) and a multitude of reef systems across the Kimberley, Western Australia (Richards et al., 2018). As elsewhere in the world, Australian coral reefs are mostly confined to tropical regions (Veron, 1993), but due to the warmer waters of the Leeuwin and East Australia Currents, they also exist at higher latitudes at the Houtman Abrolhos Islands in the west (around 100 km in length) and Lord Howe Island in the east [which, despite being only 6 km long, is of great conservation value due to its unique and remote location (Edgar et al., 2009)]. With such a wide distribution, Australian coral reefs span a range of tidal settings, from the microtidal diurnal environment in the southwest of Western Australia to macrotidal semi-diurnal systems of the Kimberley (Easton, 1970).
As introduced above, low sea level events have been shown to cause coral mortality when coincident with key stressors, including high solar irradiance or low air temperature. These stressors vary in severity over time and space, at times exceeding coral tolerance thresholds. It is logical, therefore, that for any one place, the risk of coral emersion mortality, due to coincidence of seasonal low water levels (due to tidal and non-tidal factors) and seasonal stressor threshold exceedances, also varies seasonally. Similarly, the daily timing of low tide is a critical risk factor since key environmental stressors in the intertidal zone, such as temperature and solar radiation, also vary diurnally. As noted by Pugh and Rayner (1981) and Pugh and Woodworth (2014) p 349), when low spring tides occur around midday, corals will be more vulnerable to “solar heating”, a term which encompasses both high temperatures and solar irradiation stress.
The aims of this study are to examine the daily, seasonal and inter-annual occurrence of low water level events and how they interrelate to (1) investigate seasonality of emersion-related coral mortality risk; and (2) infer historical occurrence of critical emersion events, on selected Australian coral reefs. This is undertaken through the analysis of long-term water levels from a numerical model, solar irradiance from atmospheric reanalysis and meteorological observations of atmospheric temperature over the period 1992 – 2016. It is expected that the results of this study will have global implications for all intertidal environments.
Materials and methods
Approach
A lack of historical data precludes certainty about past coral mortality; therefore, this study employs the term “Emersion Mortality Risk” (EMR) to identify occasions over the time period 1992 – 2016 when coral emersion coincided with atmospheric stressors likely to exceed coral tolerance. Potential stressors include a range of factors such as rainfall and wind, however for this this preliminary study analyses focused on high solar irradiance and low atmospheric temperature. These were selected due to published events related to these factors (Anthony and Kerswell, 2007; Armstrong et al., 2007 and Hoegh-Guldberg et al., 2005; Buckee et al., 2019). Threshold values were defined for emersion (ƟWL), high solar irradiance (ƟSI) and low atmospheric temperature (ƟT). Data, at hourly intervals, were obtained from a range of sources (as described below) and analysed over the period 1992 – 2016 for eight sites around Australia, to identify when coral EMR has occurred at these sites. Seasonal and diurnal variability in low water levels and stressors are examined to identify the role of the daily timing of low tide.
Study locations
Coral reef locations around Australia were selected to represent varying tidal regimes, latitudes and climates (Figures 1, 2). Where possible this included sites where coral emersion mortality events have been recorded in the past (Table 1). Sites were grouped as West Coast sites: Darwin (DAR), Maret Island (MAR), Ningaloo Reef (NIN) and Abrolhos Islands (ABR) and East Coast sites: Lizard (LIZ), Orpheus (ORP), Heron (HER) and Lord Howe (LOR) Islands (Figure 1). For some of the analyses, results and discussion we refer to GBR sites (LIZ, ORP and HER) as a single group.
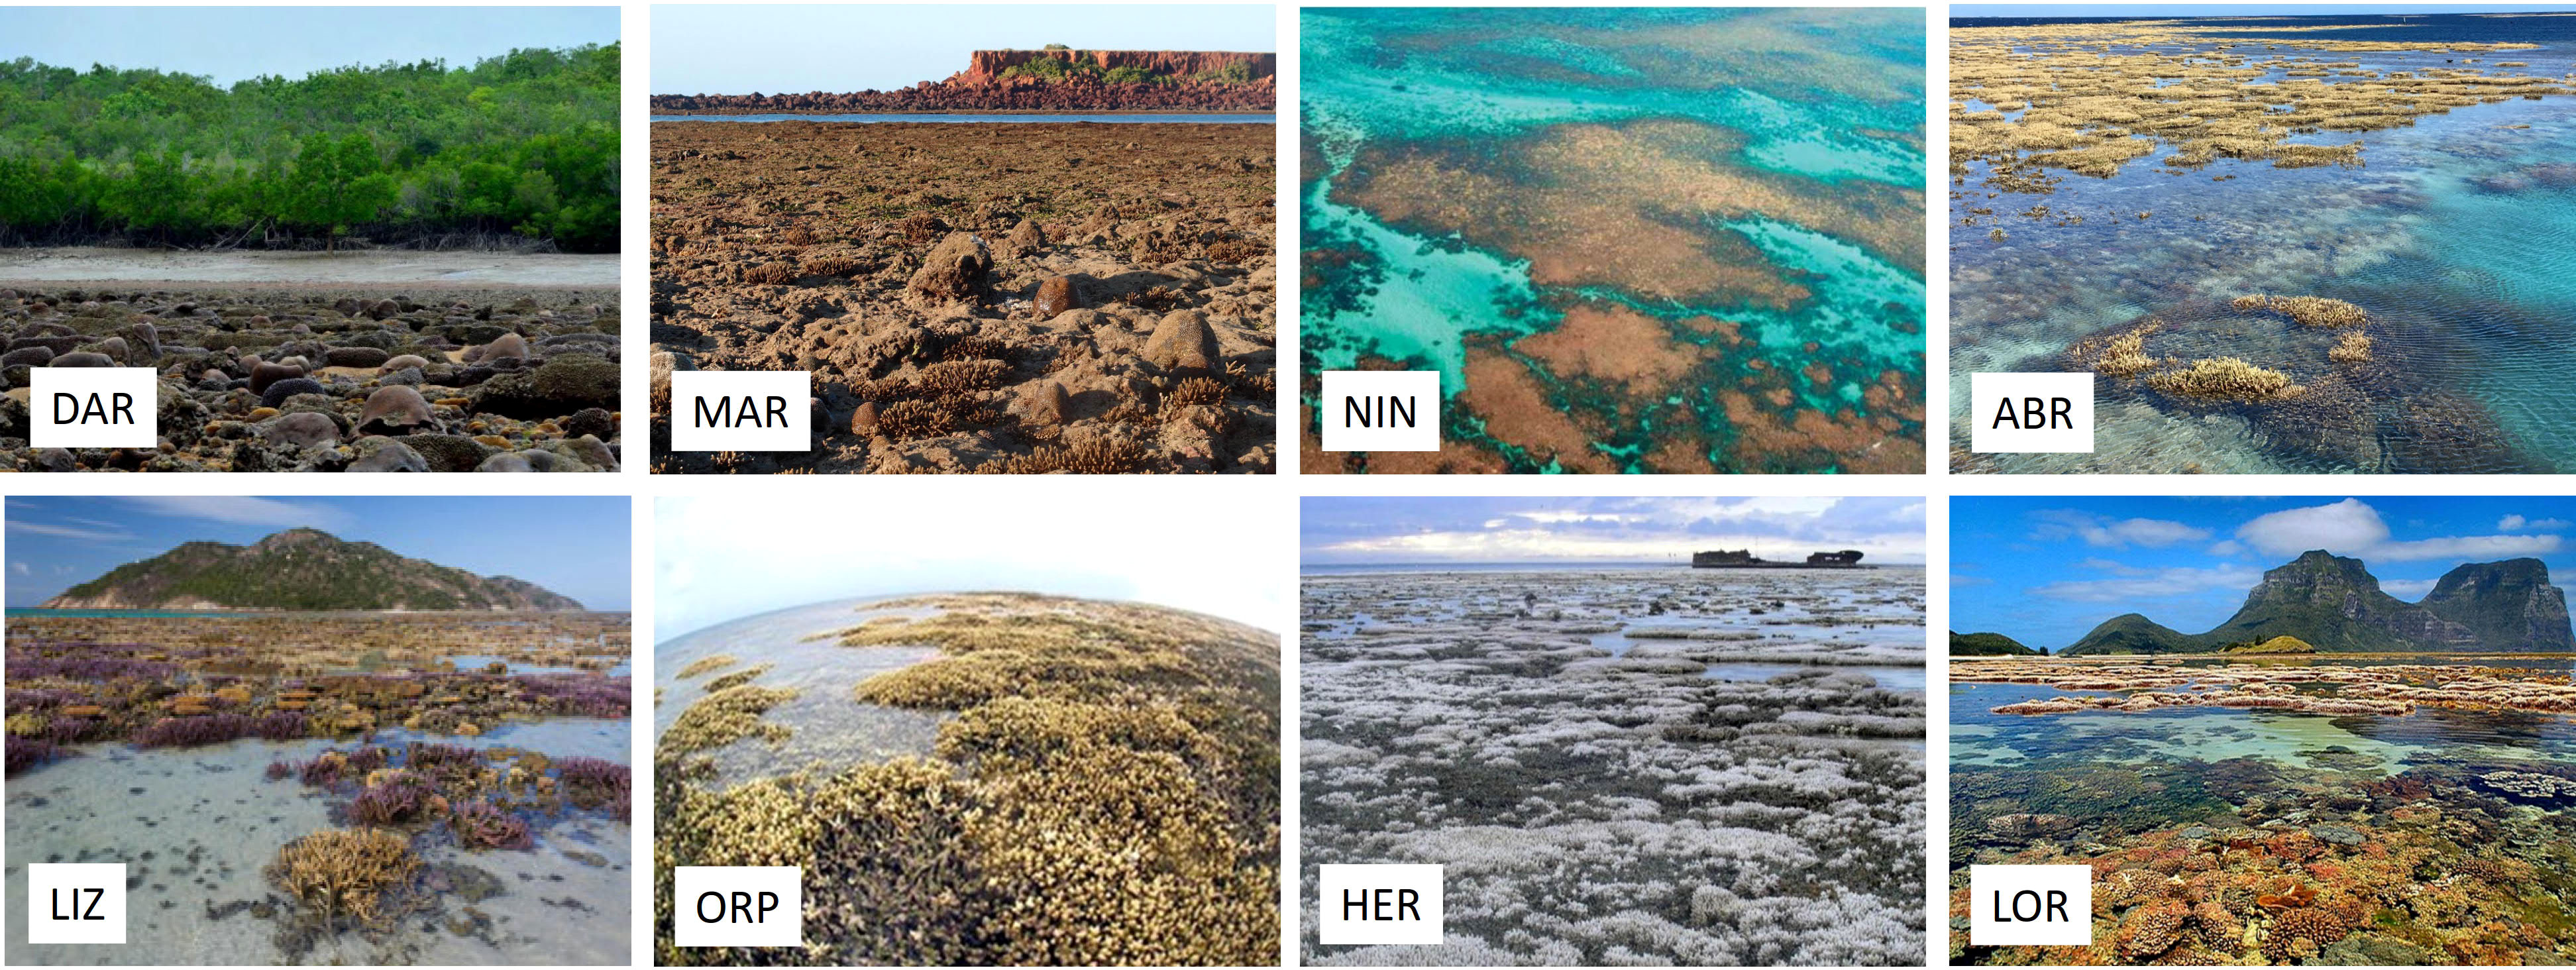
Figure 2 Photos depicting recorded emersion events for each study site. Photographs reproduced with permission from the following individuals and organizations: DAR (photo credit Craig Blount, ©INPEX), MAR (photo credit Zoe Richards), NIN (from Armstrong et al., 2007, © Department of Biodiversity Conservation and Attractions), ABR (photo credit Jo Buckee), LIZ (photo credit Michael Bok), ORP (© Centre for Excellence in Coral Reef Studies), HER (photo credit Andrew Thurber), LOR (Image Courtesy Black Diamond Images).
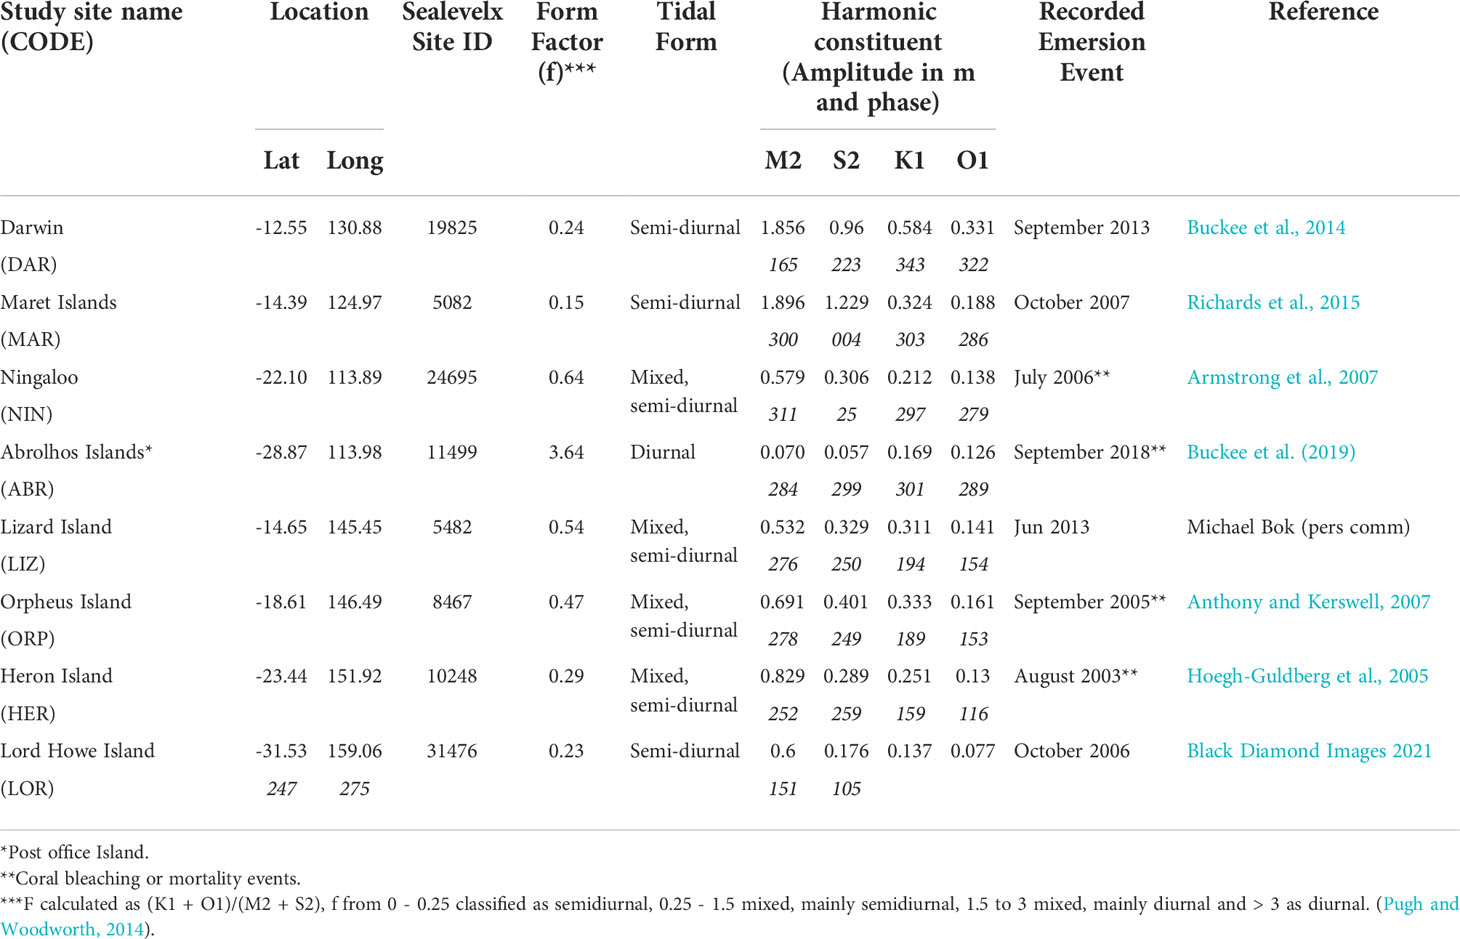
Table 1 Study sites coordinates, Sealevelx identifier (http://sealevelx.ems.uwa.edu.au), form factor (f) and harmonic constituents for the nearest Australian National Tide Tables (ANTT) port, and details of recorded emersion events used to estimate reef height levels.
Water levels
Tide gauge observations are not available for the majority of coral reefs around Australia including the eight sites studied here. Therefore, sea level data for the eight study locations were extracted from a high-resolution (~100 meters at the coast) unstructured numerical sea level hindcast model output over the period 1958-2016 (Pattiaratchi et al., 2018; http://sealevelx.ems.uwa.edu.au). The model provided hourly sea level data including forcing from astronomical tides, meteorology (winds, air pressure), and other processes such as ocean currents and ENSO events at 2 km intervals around the Australian coast (including islands). The model was validated using observations at 30 tide gauge sites around Australia and included amplitude and phase of the main tidal constituents determined from harmonic tidal analysis. Model outputs were corrected using satellite altimetry data available after 1992 to ensure monthly (and longer) mean sea levels were accurate (Pattiaratchi et al., 2018). Total sea level data (tidal + non-tidal) were then analysed to determine seasonality of daily minimum water levels (WLmin) and the daily timing of low water for each location. Sea level data coinciding with known periods of emersion were used to estimate reef platform height and this was then used to calculate the overall frequency of emersion.
Hourly water level time series (1992 – 2016) were analysed to show seasonality in daily water level minima, the relative contribution of tidal and non-tidal factors and the daily timing of low water for each of the 8 sites. Hourly data were sorted into 24 bins representing hour of the day (local time), and the lowest WL was extracted at each hour and for each day of the year to reveal seasonal patterns in the daily timing of low tide annually.
Solar irradiance and atmospheric temperature
Potential meteorological stressors during emersion were investigated using observations and atmospheric model reanalysis data (Table 1) For many of the coral reef sites, the nearest Bureau of Meteorology (BOM) station is a considerable distance away (Table 2).
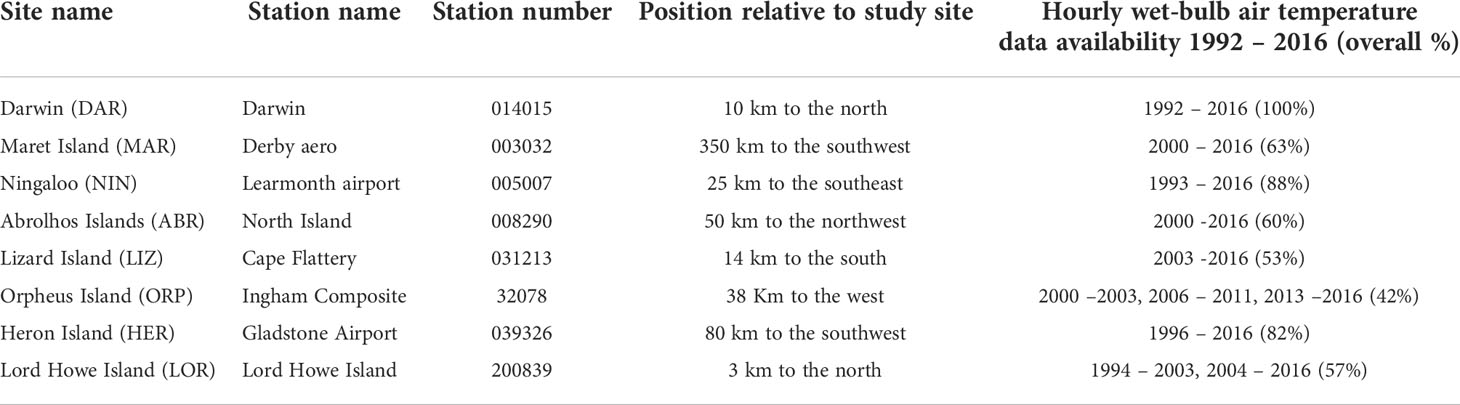
Table 2 Details of Bureau of Meteorology (BOM) stations and availability of wet-bulb temperature data used in analyses (for details see Supplementary Material 1).
High solar irradiance (SI) stress on corals was therefore estimated using hourly downward surface solar radiation (SSRD) data (1992 – 2016) obtained from the ECMWF ERA5 atmospheric reanalysis (ERA5 data) (Hersbach et al., 2020).
Low atmospheric temperature stress was estimated using BOM hourly wet-bulb thermometer temperature data from the nearest weather station (Table 2). This metric was selected since we were unable to identify cold air emersion related coral bleaching events reported by Hoegh-Guldberg et al. (2005) at Heron Island (HER) in early August 2003, or at Ningaloo reef (NIN) in July 2006 (Armstrong et al., 2007) using observed air temperature data. However, using wet-bulb air temperature (consistent with the approach taken by Hoegh-Guldberg et al. (2005)), we were able to identify the published events at these sites. This was likely due to the fact that, in highly evaporative environments, wet-bulb observations were generally lower than dry-bulb observations, with significantly lower daytime maxima. Therefore, in this manuscript the term atmospheric temperature (Tw) is used to represent the observed wet-bulb atmospheric temperature recorded at weather stations closest to each site, with data availability as shown in Electronic Supplementary Material (ESM) 1.
Solar irradiance and atmospheric temperature data were analysed to investigate seasonal and diurnal variability and threshold exceedance per site. Two threshold levels were selected for each atmospheric stressor, informed by values coinciding with published events (Hoegh-Guldberg et al., 2005; Armstrong et al., 2007; Buckee et al., 2019). High solar irradiance thresholds (as SSRD) were: ƟSI 1 = 3,000,000 (Joules per square meter (J m-2)) and ƟSI 2 = 3,500,000 J m-2); and low atmospheric temperature thresholds were: ƟTw1 = 12 degrees Celsius (°C) and ƟTw2 = 10°C.
Emersion mortality risk
Coral EMR due to high solar irradiance (EMRSI) was inferred from the coincidence at an hourly scale of emersion (ƟWL) with high solar irradiance (SI), and coral EMR due to low atmospheric temperature (EMRT) was inferred from the coincidence at an hourly scale of emersion (ƟWL) with or low atmospheric temperature (Tw):
For each atmospheric stressor, calculations considered the two threshold levels, resulting in two levels of EMR (EMR 1 indicating high risk and EMR 2 indicating extreme risk).
Results
Seasonality in coral emersion and atmospheric stressors
Seasonal variability in water levels and atmospheric stressors is a fundamental constraint to the preconditions for EMR; namely emersion (WL< ƟWL), high solar irradiance (SI > ƟSI) or low atmospheric temperatures (Tw< ƟTw). Emersion occurred in all months of the year at all sites, however seasonality was evident in minimum values and frequency of emersion (Figures 3A–H, Table 3, ESM 2A). As expected, solar irradiance exceeding thresholds generally occurred over the Austral summer, and lower atmospheric temperatures occurred mainly during winter, however there were differences between the sites as discussed below. It is worth noting that whilst WL and SI data were mostly complete for 1992 – 2016, temperature data were not available for all years and sites (Table 2, ESM 1).
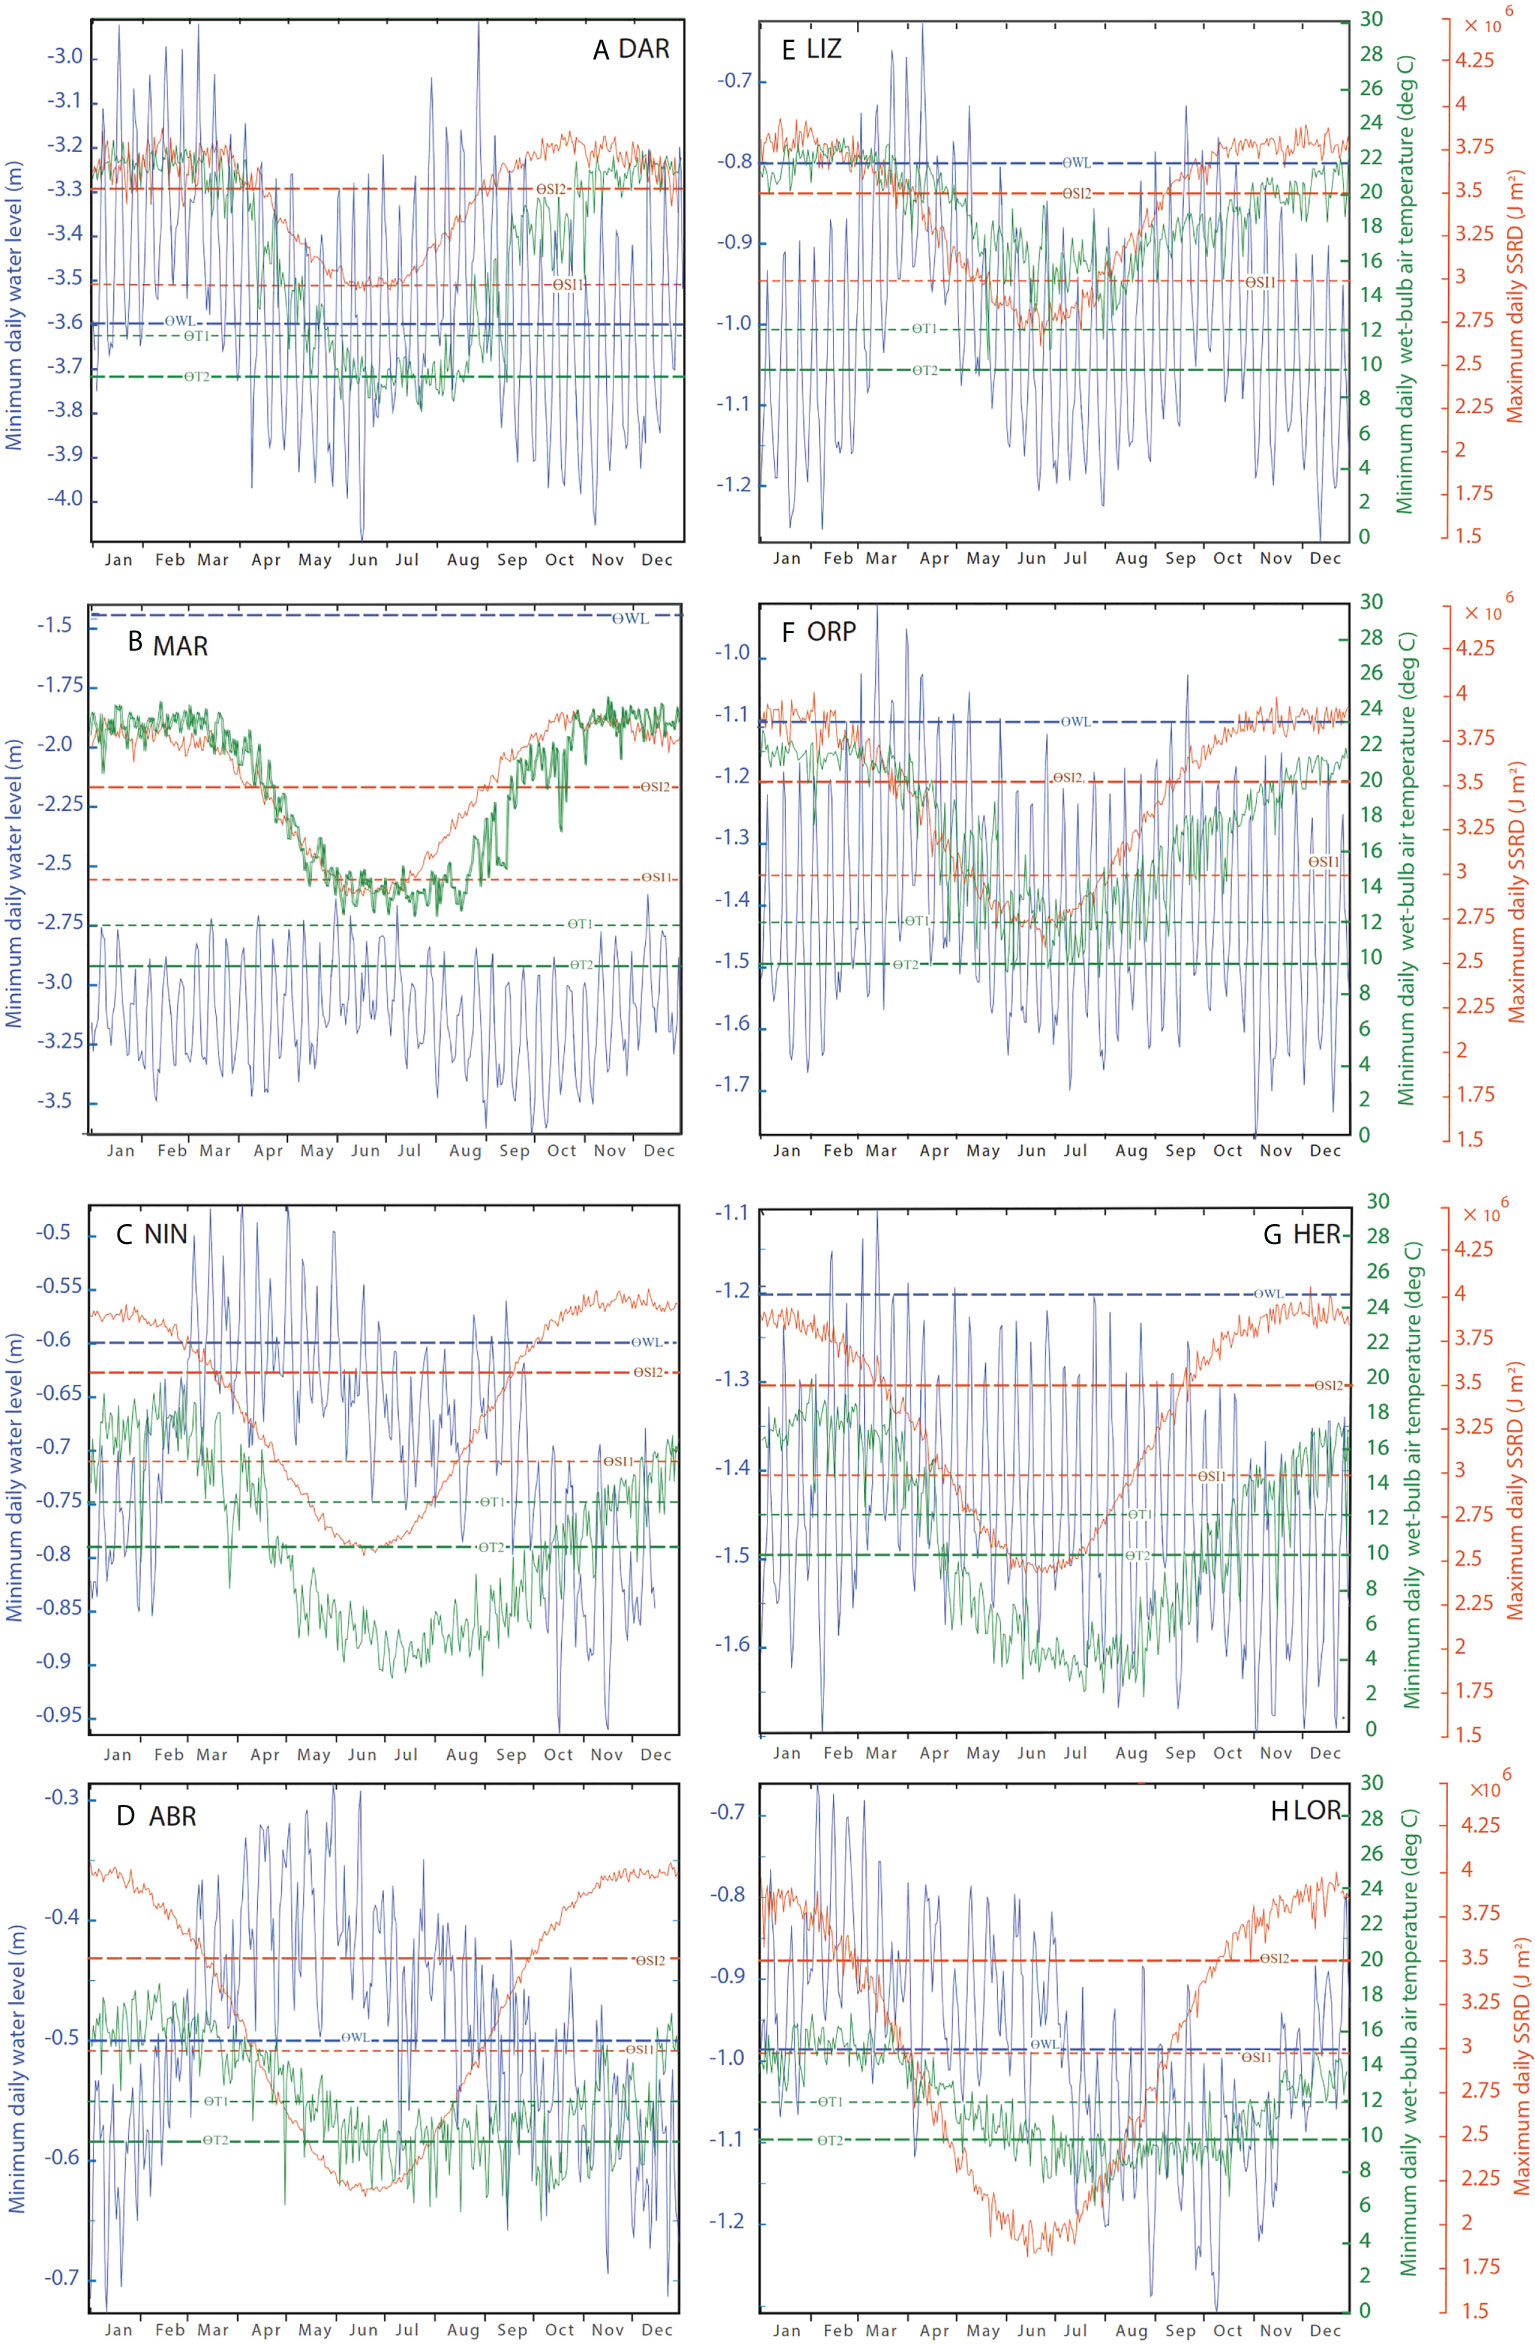
Figure 3 Extreme values: for sites (A) Darwin (DAR), (B) Maret Island (MAR), (C) Ningaloo Reef (NIN), (D) Abrolhos Islands (ABR), (E) Lizard Island (LIZ), (F) Orpheus Island (ORP), (G) Heron Island (HER) and (H) Lord Howe Island (LOR) from hourly data for each calendar day over the years 1992- 2016, for minimum water level, blue (http://sealevelx.ems.uwa.edu.au), maximum daily solar irradiance, orange (ECMWF ERA5 atmospheric reanalysis) and minimum atmospheric temperature, green (Bureau of Meteorology wet-bulb temperature observations) per site. Dashed lines show emersion threshold (ƟWL), solar irradiance thresholds (ƟSI 1 and ƟSI 2), and temperature thresholds (ƟTw 1 and ƟTw 2).
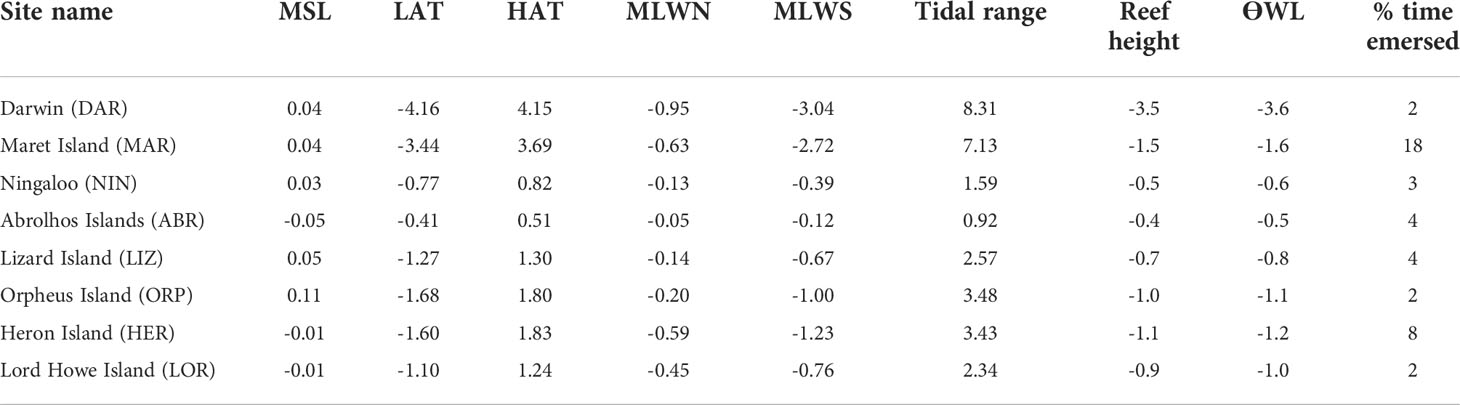
Table 3 Water level characteristics (m); mean sea level (MSL), lowest and highest astronomical tides (LAT/HAT), mean low water neaps (MLWN) and mean low water springs (MLWS) (from http://sealevelx.ems.uwa.edu.au), calculated tidal range, reef height estimate, emersion threshold (Ɵ) and percentage (%) time emersed for each study site.
Time of year when WL minima were lowest, and emersion was most likely to occur, varied among the sites. Along the west coast at MAR (Figure 3B) emersion was recorded for each calendar day, with corals being emersed for 18% of the time (Table 3). Lowest WL minima at this site (emersion of around 2 m) occurred in September/October, whilst further south at Ningaloo reef (NIN), WL minima were lowest in October/November, and at the Abrolhos Islands (ABR), LW minima occurred between November and January. This pattern is consistent with lower mean sea levels at these times (Figure 1C). In the north of Western Australia, and Darwin (DAR) emersion was most likely to occur between April to June and September to December, and emersion was least likely to occur from July to August and January to March. On the east coast, sites LIZ and ORP showed very similar seasonal patterns with lowest WL minima recorded from November to January and highest minima occurring in March/April. At HER, timing of the lowest and highest WLmin was similar to LIZ and ORP, but less pronounced. At LOR, WLmin occurred from August to October, and emersion was least likely to occur around February. The relative contribution of tidal and non-tidal factors in driving seasonality in WL minima also varied among sites (ESM 3), but in general the lowest water levels occurred due to a combination of both low tides and negative non-tidal residuals. Seasonal differences in maximum solar irradiance and minimum atmospheric temperature (Figures 3A–H, ESM 2B, C) were mostly (but not entirely) attributable to latitude (Figures 1A-H, Table 1). Maximum SI at all sites exceeded threshold values ƟSI1 (3,000,000 J m-2) and ƟSI2 (3,500,000 J m–2) between October and February. Northern sites exceeded both SI thresholds for more days of the year than southern sites. At DAR (Lat -12.5° S), SI was close to or greater than ƟSI1 for all days of the year (Figure 3A). In contrast, SI at the southernmost site LOR (Lat -31.5° S) was below ƟSI1 from March to September (Figure 3). At sites north of the Tropic of Capricorn, DAR, MAR and LIZ (Figures 3A, B, E), SI max was lower and more variable over summer months, with peak SI occurring closer to equinox (March and September) when the sun is above the equator.
Minimum atmospheric temperature remained above the temperature threshold ƟTw1 (12°C) and ƟTw2 (10°C) all year at MAR (Figure 3B) and most of the year at LIZ (Figure 3E), but not at DAR (Figure 3A). At ORP temperatures dropped below ƟTw1 between April and August but was mostly above ƟTw2 all year. At the southern sites NIN, ABR, HER, and LOR (Figures 3C, D, G, H), all experienced periods of minimum temperature less than ƟTw1 and ƟTw2 from around April/May to October/November. Despite being further south, the offshore island sites ABR and LOR (Figures 3D, H) both showed less extreme minimum temperatures than NIN and HER (Figures 3C, G) which are located closer to the Australian mainland (Figure 1A). This is most likely due to the moderating effect of the ocean on the extreme temperatures.
Diurnal variability in atmospheric stressors
Solar irradiance peaked close to midday at all sites and seasons (as represented by the months December, March June and September) as expected, however the number of hours of SI threshold exceedance varied among sites and seasons (Figures 4A–H). As with seasonality, diurnal solar irradiance differences between sites were mainly attributable to latitude (Table 1). SI exceeded thresholds ƟSI1 and ƟSI2 around midday in December at all sites, however duration of exceedance was greater in southern sites than northern sites. All sites except ABR (Figure 4D) and LOR (Figure 4H) also reached ƟSI2 in March and September, but only for a brief period over midday, and no sites exceeded this threshold in June. In December, across all sites, the lower SI threshold (ƟSI1) was exceeded for around 5 to 6 hours per day, from ~9:00 am to ~3:00 pm.
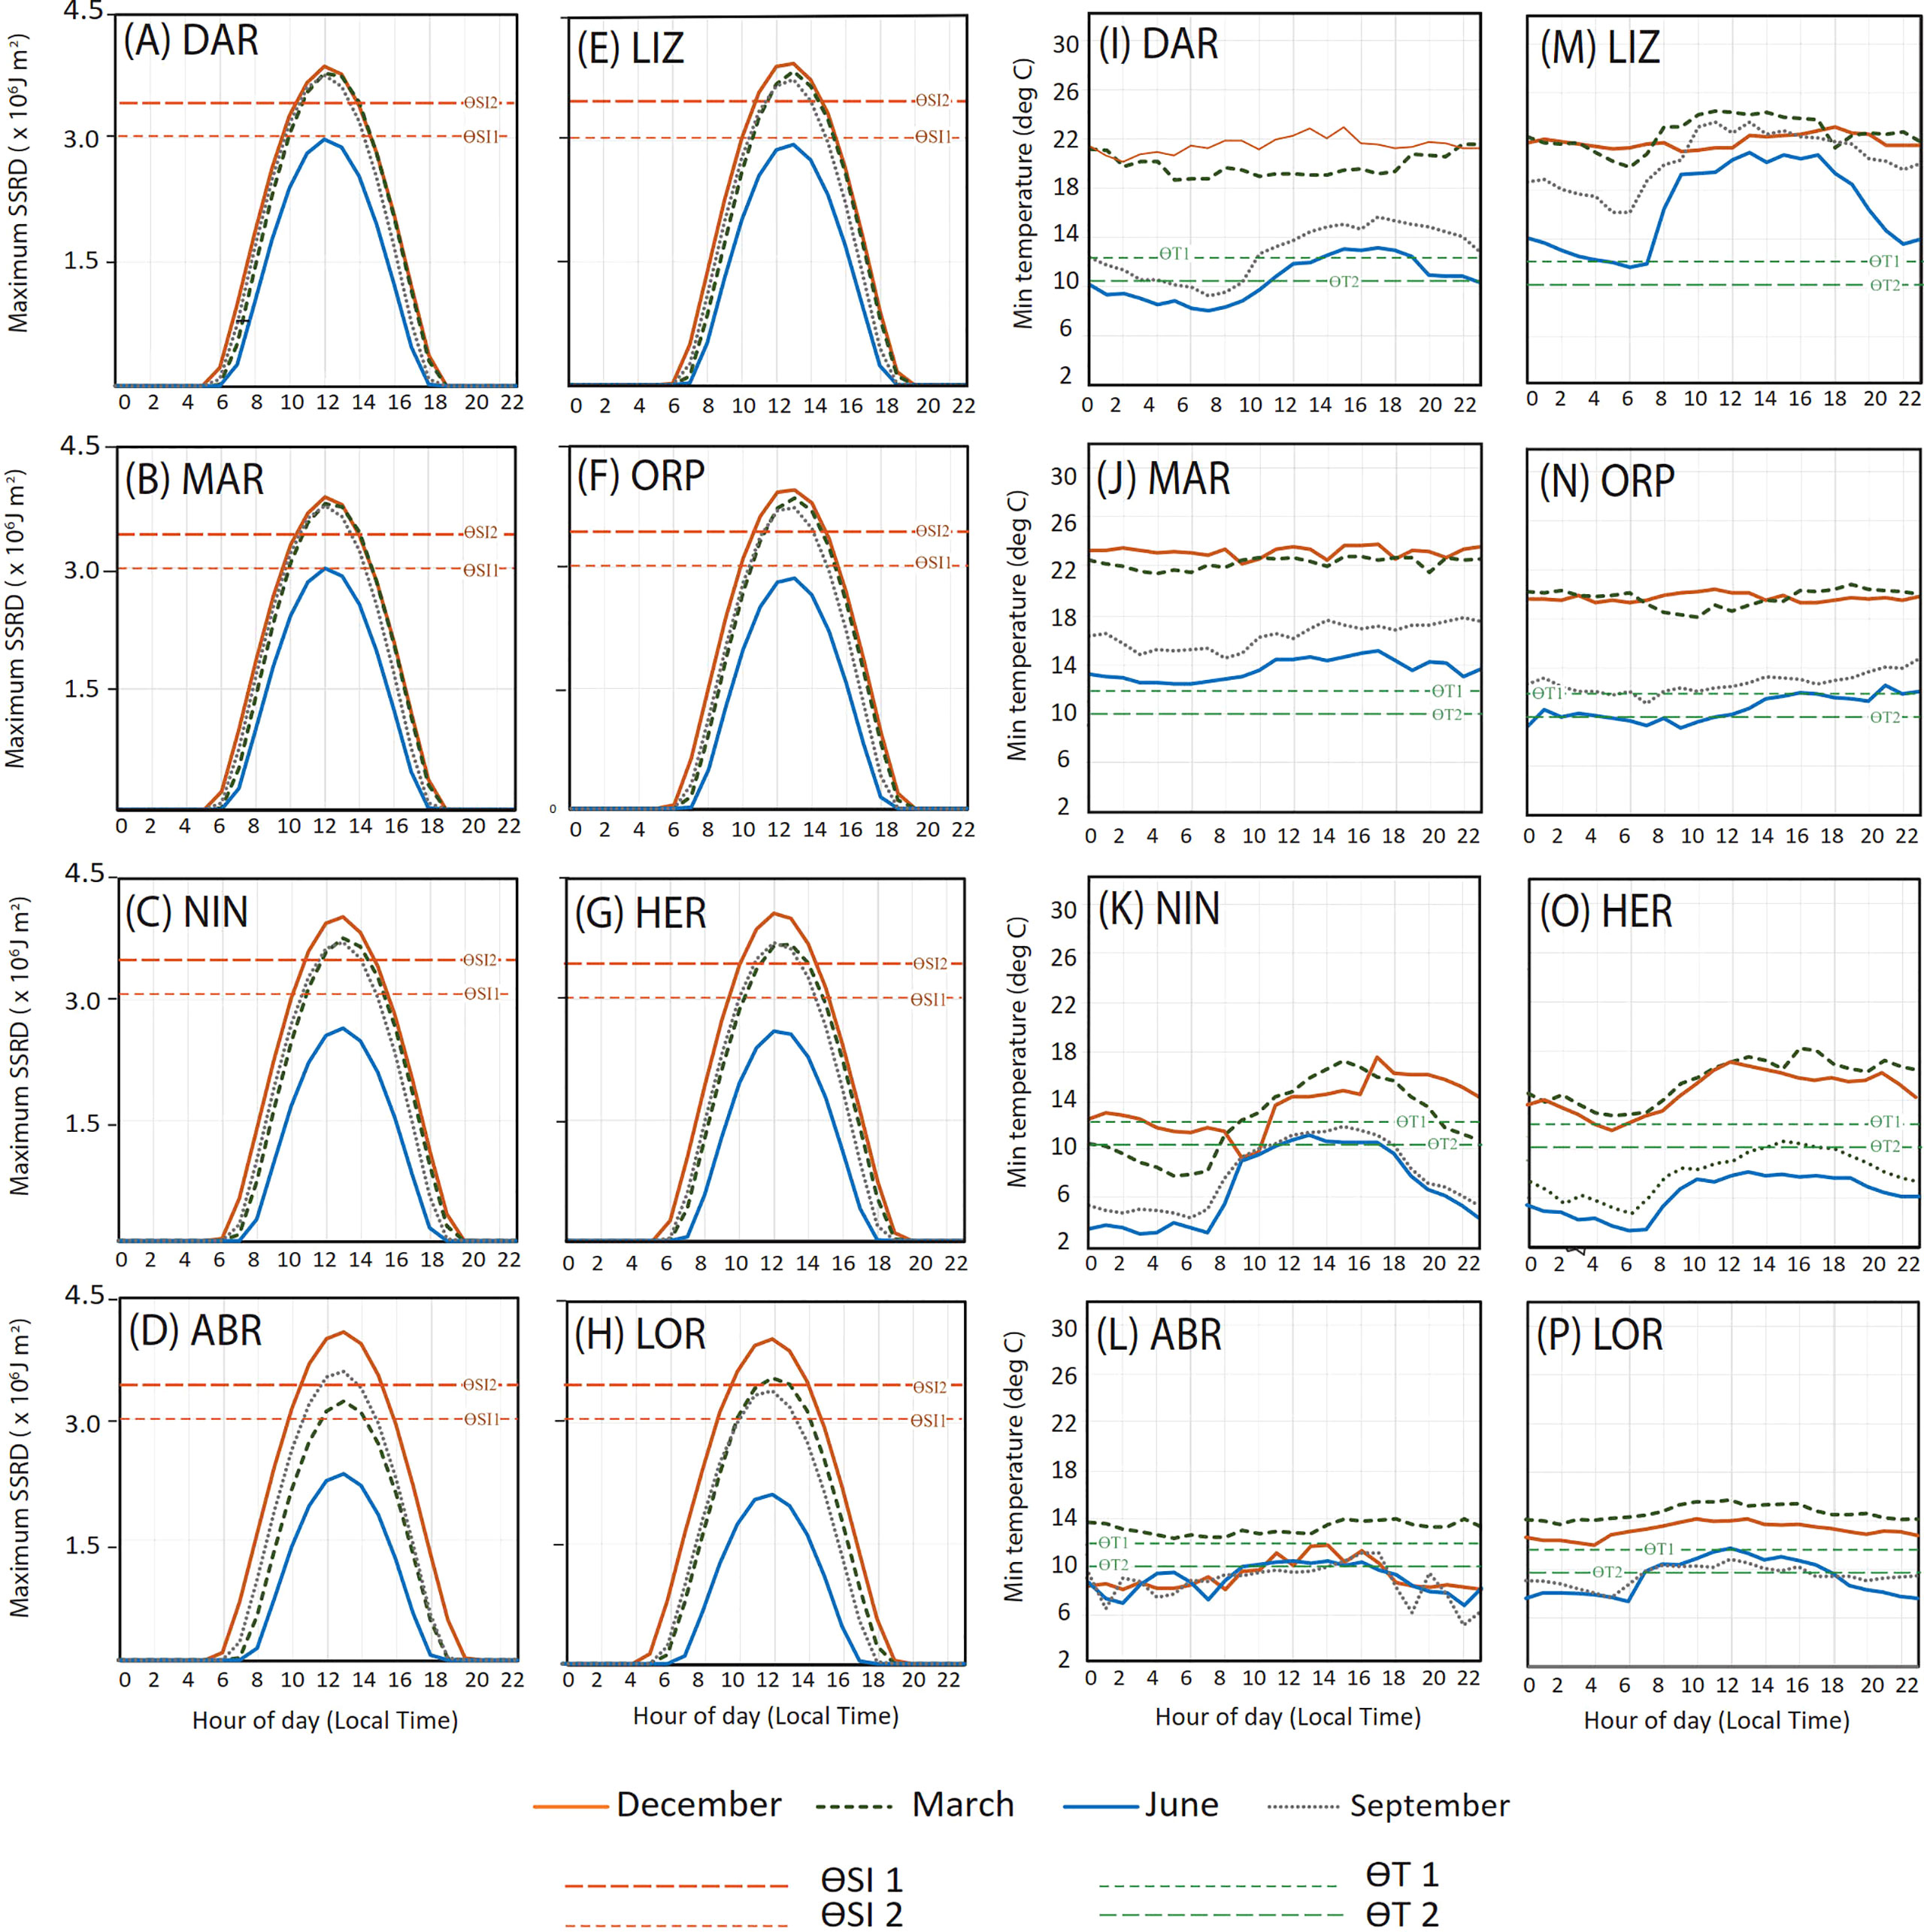
Figure 4 Diurnal variability in a) maximum solar irradiance (SSRD) and minimum atmospheric temperature (°C) for sites (A, I) Darwin (DAR), (B, J) Maret Island (MAR), (C, K) Ningaloo Reef (NIN), (D, L) Abrolhos Islands (ABR), (E, M) Lizard Island (LIZ), (F, N) Orpheus Island (ORP), (G, O) Heron Island (HER) and (H, P) Lord Howe Island (LOR). from hourly data for each calendar day over the years 1992 - 2016 for selected months illustrating seasonal extremes. Threshold values for solar irradiance (ƟSI 1 and ƟSI 2), and atmospheric temperature (ƟTw 1 and ƟTw 2) indicated by dashed lines.
Temperature minima also varied diurnally, with lowest values tending to occur between midnight and 6 am (Figures 4I–P). At all sites (other than LIZ and MAR) temperature minima fell below ƟTw2 in June, but excepting HER (Figure 4O), this only occurred during the night and early morning. At southern sites ABR and HER (Figures 4L, P) temperature minima below ƟTw1 were recorded for all hours of the day in June and most hours in September.
Seasonal variability in daily timing of low tide
All the sites displayed a distinct annual cycle in the daily timing of low tide, as illustrated by daily WL minima (1992 – 2016) relative to the emersion threshold for selected hours (Figures 5A–H). Minimum WLs at midday (when SI is greatest), at midnight (for contrast) and at 6 am (indicating coldest atmospheric temperatures) highlight the seasonality in minimum WLs for each hour of the day. For further illustration of the seasonal pattern in hourly water by site, see ESM 4 which provides graphs of the average hourly water level per site for each hour and day of the year (1992 – 2016).
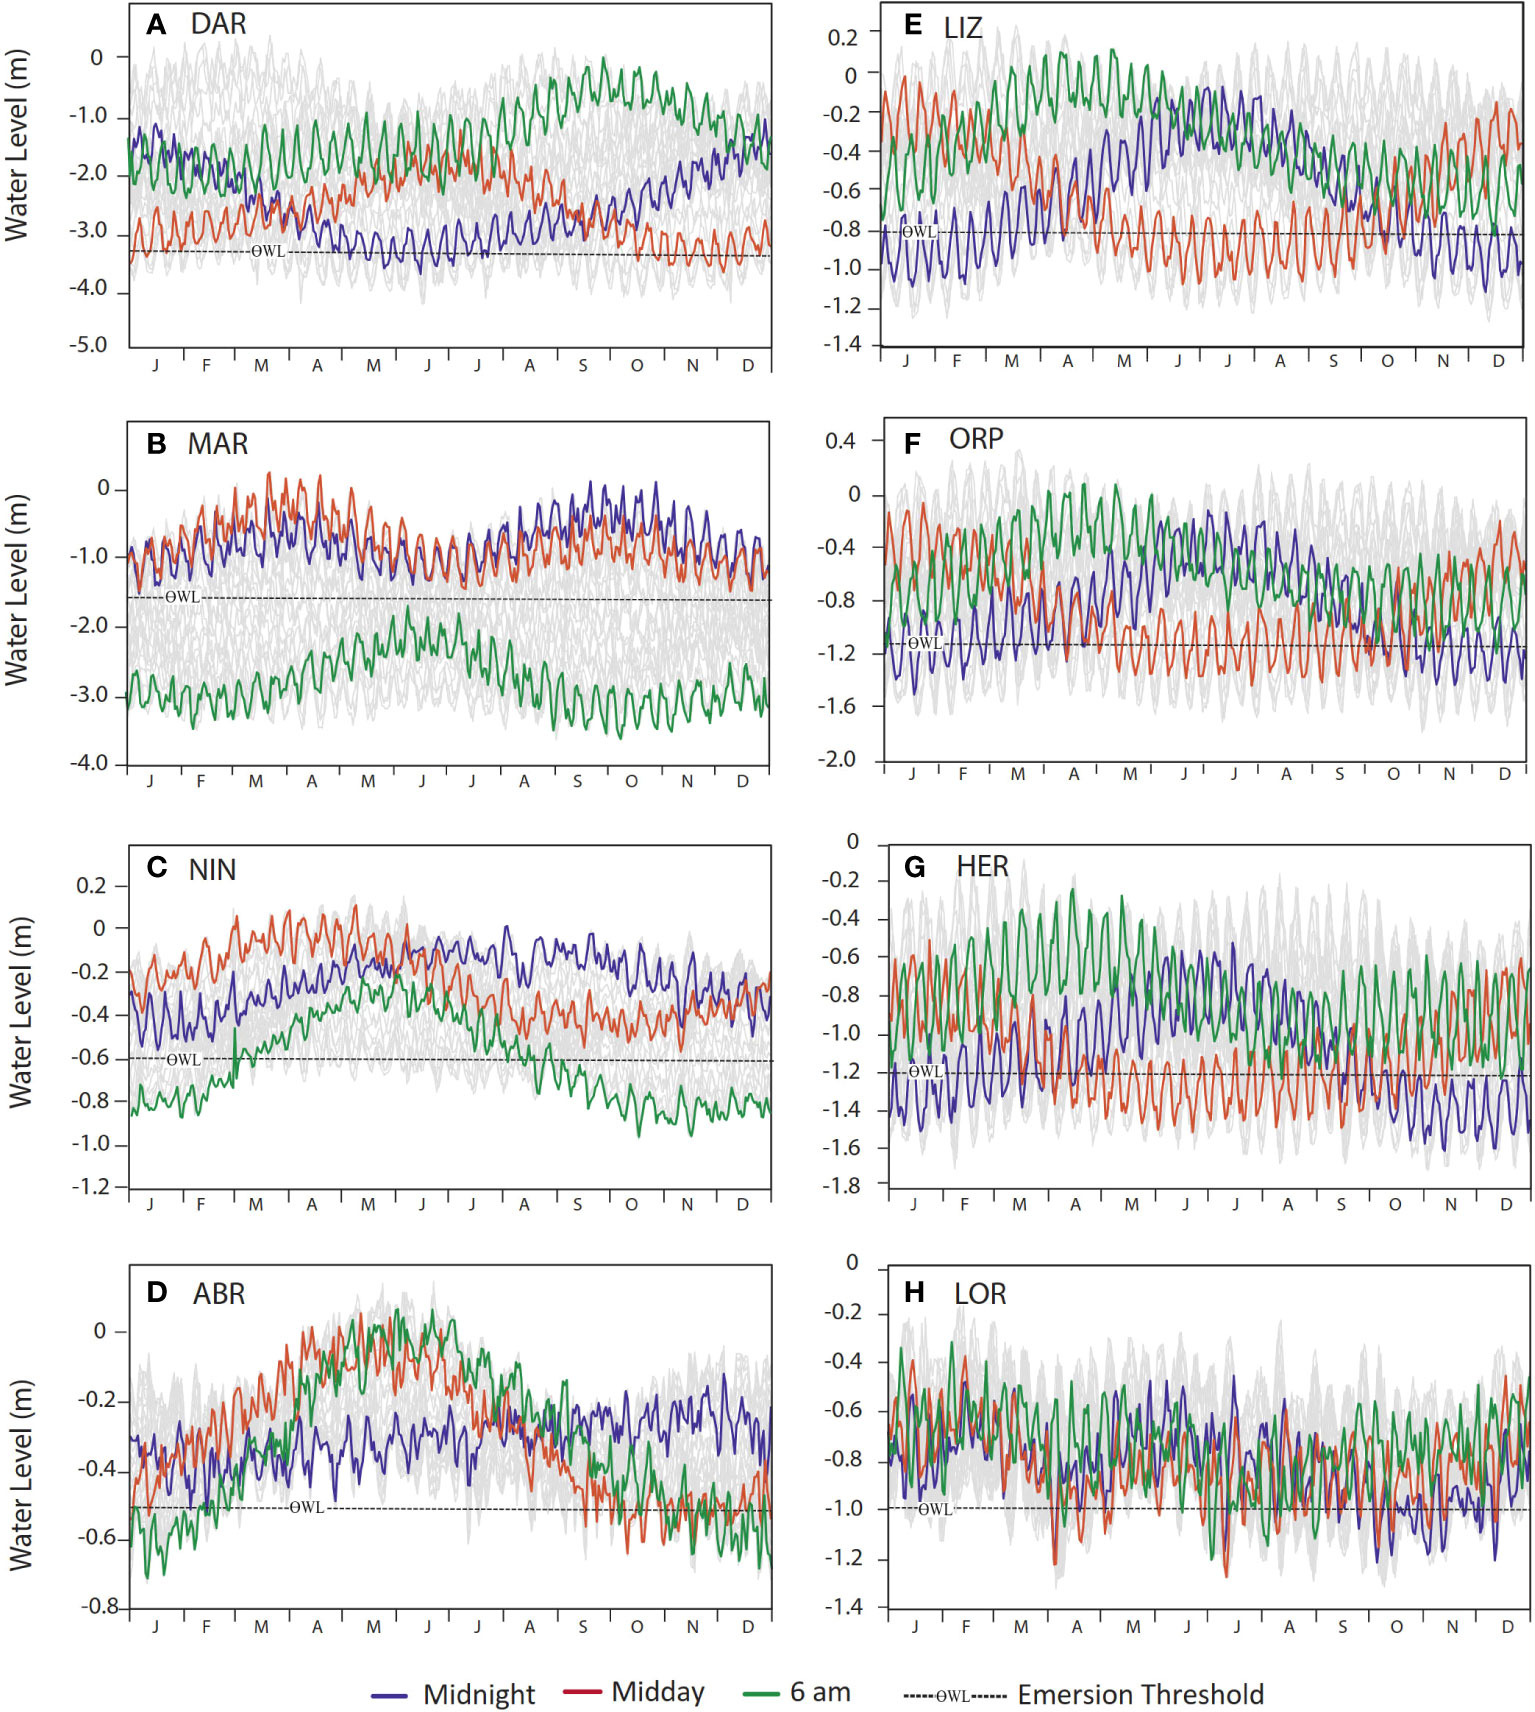
Figure 5 Seasonality in the daily timing of low tide for sites (A) Darwin (DAR), (B) Maret Island (MAR), (C) Ningaloo Reef (NIN), (D) Abrolhos Islands (ABR), (E) Lizard Island (LIZ), (F) Orpheus Island (ORP), (G) Heron Island (HER) and (H) Lord Howe Island (LOR), illustrated by the minimum recorded low water levels (from hourly data for each calendar day over the years1992 – 2016) for each site, highlighting minimum midday (red), midnight (blue) and 6 am (green) water levels for each day of the year. Dashed lines show emersion threshold (ƟWL).
At West Coast sites MAR and NIN emersion did not occur close to midday at any time of the year, with lowest tides generally occurring in the early morning, evening or night when solar irradiance was minimal or non-existent (Figures 5B, C). Although these sites experienced some of the lowest water levels during seasons when solar irradiance was high, the timing of the low water away from midday minimised solar exposure of corals at these sites. At the GBR sites (LIZ, ORP, HER) the lowest daytime water levels occurred during winter when solar irradiance was below threshold levels, and during summer lowest water levels occurred around midnight (Figures 5E, F, G). Similarly, at ABR midday WL minima were lowest in October, however emersion at midday occurred at this site on several occasions between September and January. At LOR, the annual pattern was much less distinct, with midday emersion occurring infrequently through the year except between January and March (Figure 5H).
At Ningaloo (NIN), emersion occurred at 6 am on all days of the year except from April to June, thus potentially subjecting corals to lower atmospheric temperatures over many months (Figure 5C). At ABR emersion occurred at 6 am from October to March, with the lowest tides of the year at this time of day occurring in December and January (Figure 5D). At the GBR sites (LIZ, ORP and HER), corals were never exposed at 6 am (Figures 5D–F), when temperatures are the coldest, however as shown at the southernmost site, HER (Figure 5G), temperatures may fall below threshold values for all hours of the day during winter months (Figure 4O).
Seasonality and diurnal timing of emersion mortality risk
The coincidence of reef emersion with atmospheric stressor threshold exceedance for hourly data indicated a distinct seasonal and diurnal pattern at each site (Figures 6A–H). All the sites, except NIN, experienced EMR due to high solar irradiance (EMRSI) at some time of the year. At MAR and LIZ, only EMRSI was recorded, since atmospheric temperatures were above threshold values at all times (Figures 3B, E). EMR due to cold atmospheric temperatures (EMRTw) occurred at all southern sites (NIN, HER, ABR and LOR) and also very occasionally at ORP in July/August and at DAR between June and August. Patterns in EMRSI were similar at all GBR sites, with events mostly occurring between 12 to 1 pm between August and November and less often from March to May, avoiding the highest summer SI due to the timing of low water (Figures 5E–G), with the highest risk during spring and autumn.
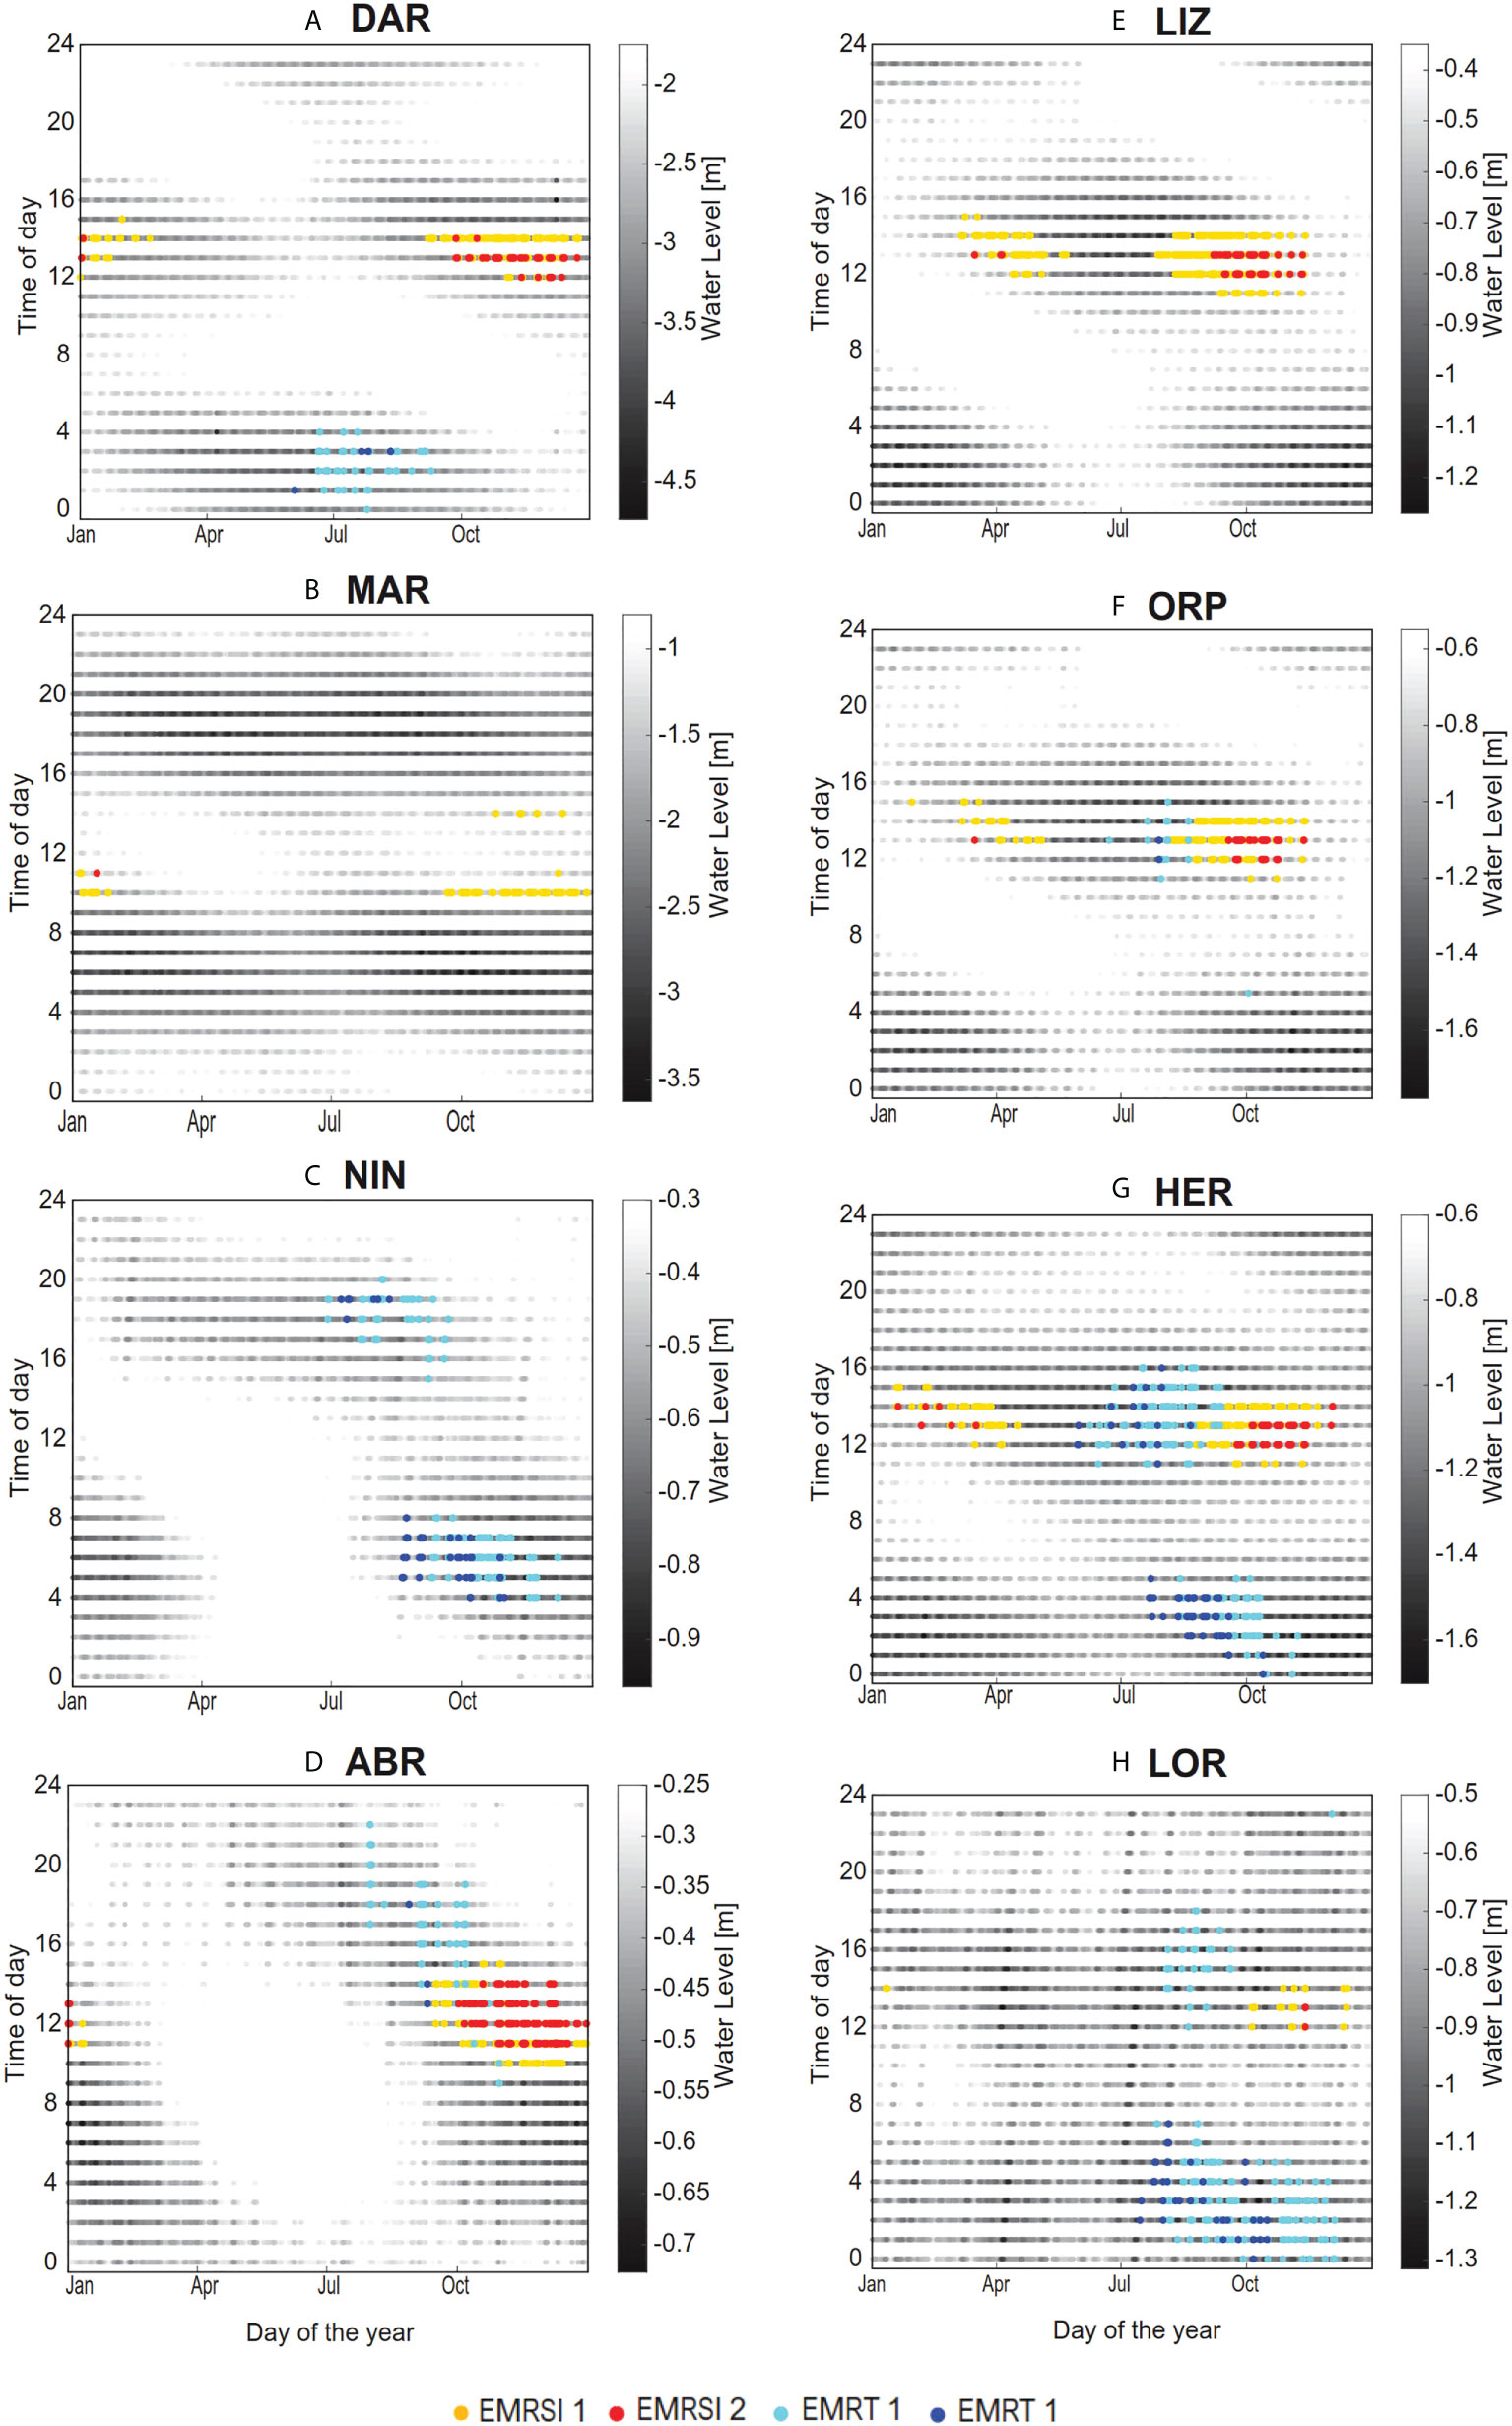
Figure 6 Seasonal and daily timing of water levels (m) for sites (A) Darwin (DAR), (B) Maret Island (MAR), (C) Ningaloo Reef (NIN), (D) Abrolhos Islands (ABR), (E) Lizard Island (LIZ), (F) Orpheus Island (ORP), (G) Heron Island (HER) and (H) Lord Howe Island (LOR) based on hourly data for each calendar day over the years 1992 – 2016, highlighting emersion mortality risk due to high solar irradiance and low atmospheric temperature. Coincidence of emersion with values above ƟSI 1 are indicated in yellow (EMRSI 1) and ƟSI 2 in red (EMRSI 2), and coincidence of emersion with temperature values less than ƟTw 1 (EMRTw 1) are indicated in light blue and ƟTw 2 (EMRTw 2) in darker blue.
Interpretation of the seasonal and diurnal pattern of EMR for each site draws on constraints illustrated by Figures 3, 4, and 5. For example, at DAR (Figure 6A) EMRSI occurred between 12 to 2 pm during spring and summer, most often in November when water levels were lowest and, solar irradiance was highest (Figure 3A) and emersion occurs at midday (Figure 5A). Despite being the northernmost site, DAR also experienced some cold exposure EMR, due to low nighttime atmospheric temperatures during winter (Figure 4I). At MAR (Figure 6B), EMRSI occurred in spring and summer (September to January), between 10 am and 11 am, and to a lesser extent at 2 pm. Higher levels of exposure were limited due to the timing of the low water away from midday as noted previously. At NIN (Figure 6C) EMRTw occurred between June and September in the evening (between 6 pm and 8 pm), and in the early morning (between 4 am to 8 am) from August to November. No EMRSI was recorded at NIN due an absence of daytime low tides (Figure 6C). At ABR (Figure 6D), EMRSI events occurred in the spring and summer (October to January), from 11 am to 2 pm as WL minima fell and SI increased above threshold levels (Figure 3D), and low tides occurred in the middle of the day (Figure 4D). At LIZ (Figure 6E) EMRSI events mostly occurred between 12 to 1 pm from August to November and less often from March to May, again avoiding the highest summer SI due to the timing of low water (Figure 5D), with highest risk during spring and autumn. Patterns in EMRSI were similar for the other GBR sites; ORP and HER (Figures 6F, G).
Contribution of daily timing of low tide in determining emersion risk was demonstrated by the combined assessment of risk factors. Across all sites and years, strong seasonality was apparent in the number of hours when threshold values were exceeded for solar irradiance (Figure 7B) and atmospheric temperature (Figure 7B). Emersion also showed some overall seasonality, with the greatest number of emersed hours (across all sites) from October to January, and least total hours from February to June (Figures 7A, B). Despite combined risk factors remaining high over summer, the peak in EMR (Figure 7C) occurred in September/October, and decreased after November, due to reduced EMRSI associated with nighttime low tides at many sites (Figures 6A–H). In contrast to EMRSI, seasonality in EMRTw (Figure 7C) was generally aligned with the peak in number of hours when air temperatures were lowest (Figure 7B). Breakdown of seasonal EMR by site showed that all sites except NIN exhibited peak EMRSI between September and November (Figure 8A). The peak in EMRTw occurred during July-August, when all sites except MAR and LIZ experienced some level of EMR due to low atmospheric temperature (Figure 8B).
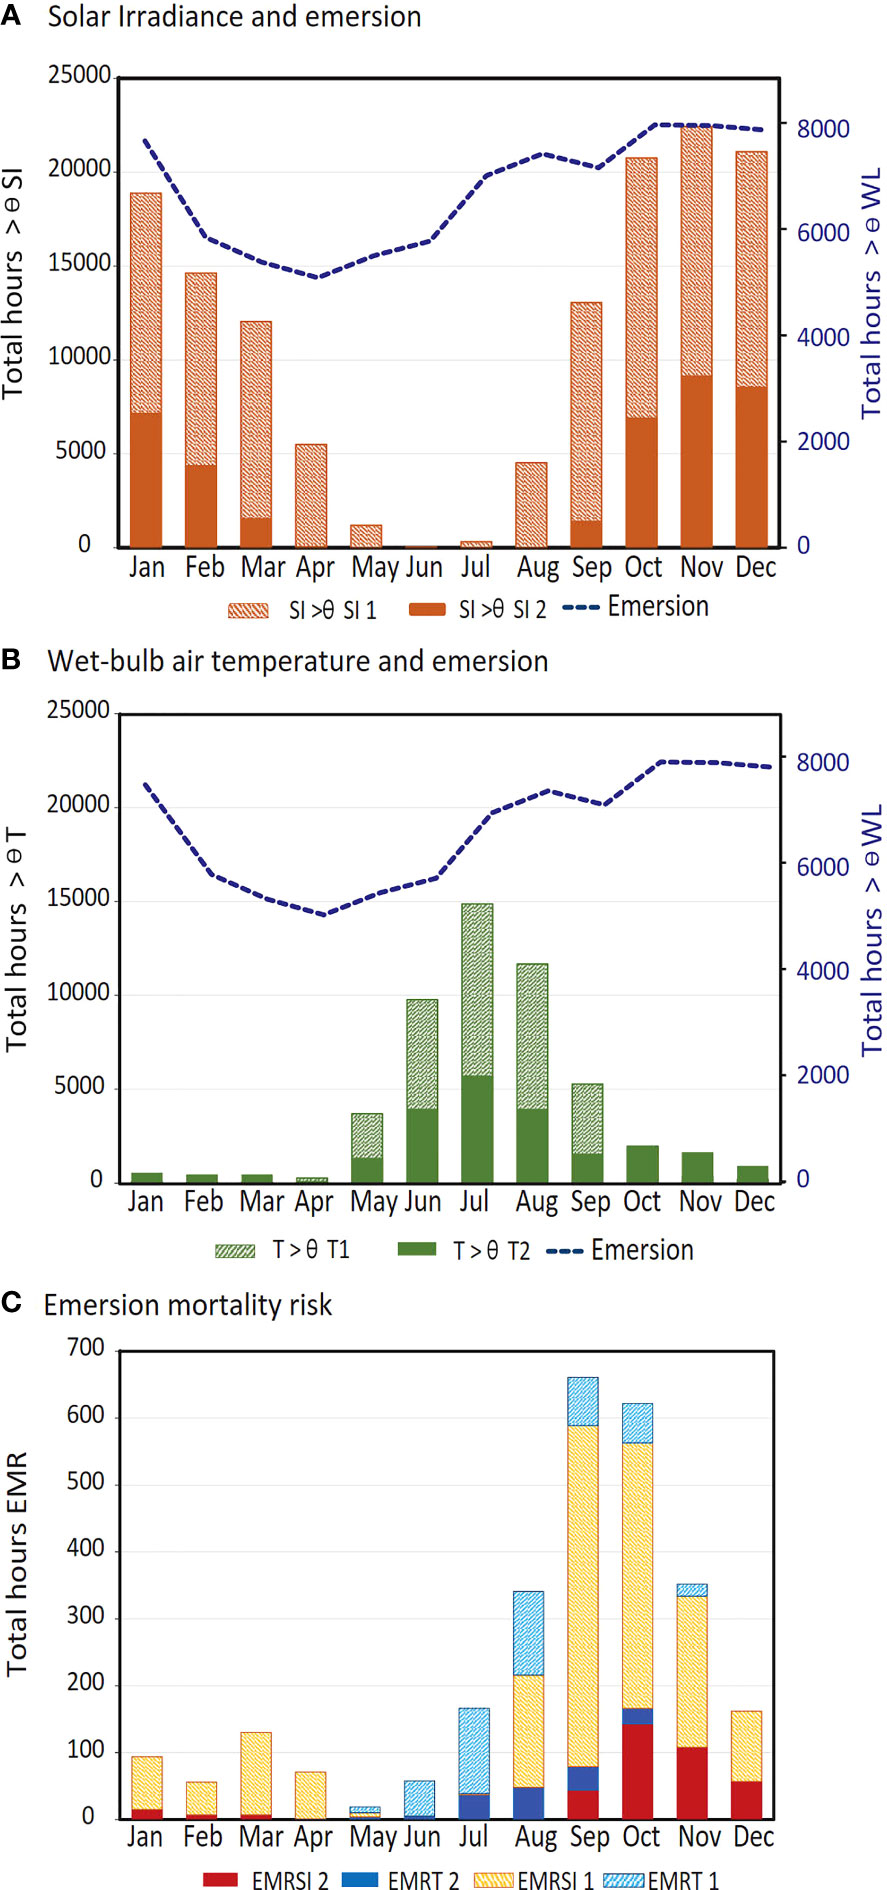
Figure 7 Seasonality in the total number of hours (all sites combined, hourly data from 1992 – 2016) of (A) solar irradiance above threshold values (ƟSI 1 and ƟSI 2) and emersion (WL< ƟWL), (B) atmospheric temperature below threshold values (ƟTw 1 and ƟSI 2) and emersion (WL< ƟWL), and (C) emersion mortality risk (EMR) due to high solar irradiance (SI) and low atmospheric temperature (Tw).
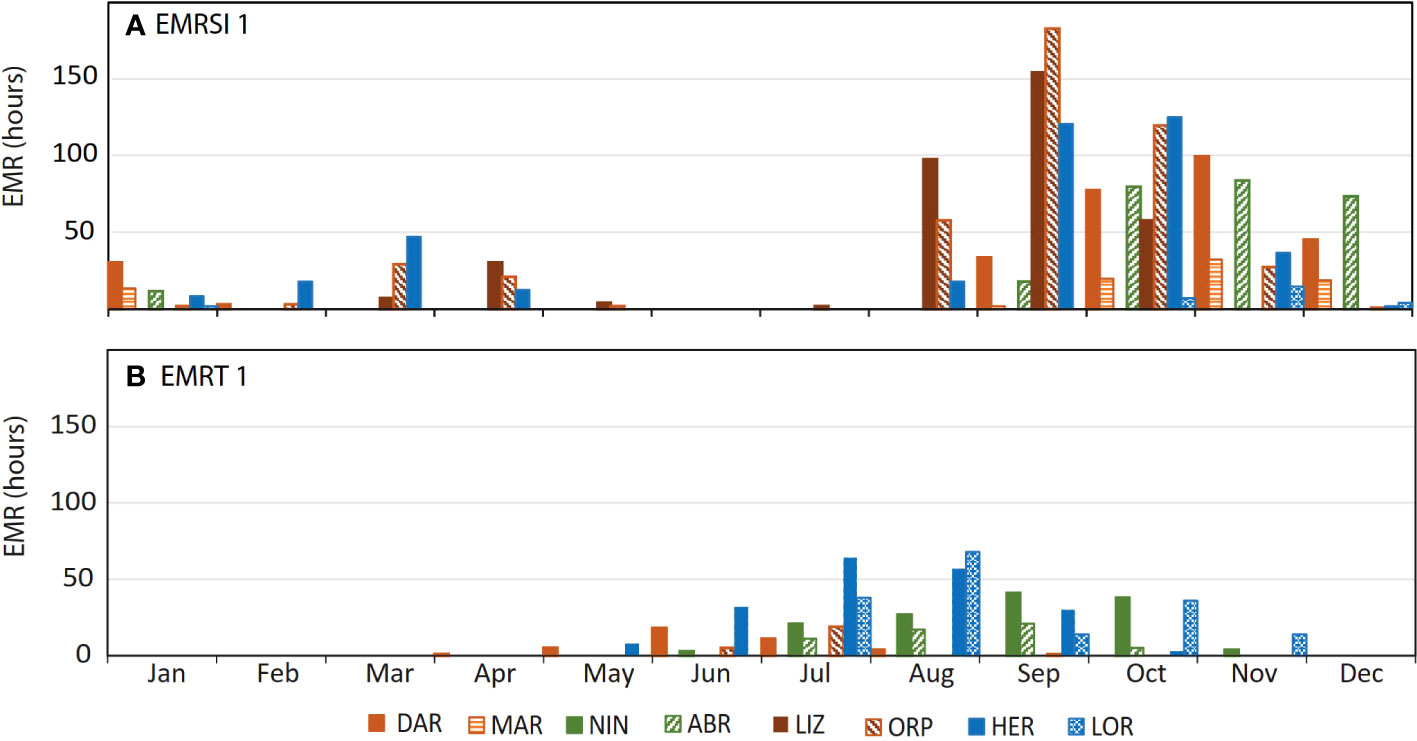
Figure 8 Seasonality by site of total hours of emersion mortality risk (EMR) (hourly data from 1992 – 2016) due to (A) high solar irradiance (EMRSI 1) and (B) low atmospheric temperature (EMRTw 1).
Historical occurrence of emersion mortality risk
Historical occurrences of emersion mortality risk were identified for each site (Figures 9A–G). Coral emersion mortality events reported for NIN in 2006 (Armstrong et al., 2007), ORP in 2005 (Anthony and Kerswell, 2007) and HER (Hoegh-Guldberg et al., 2005) can be seen in Figures 9C, F, G respectively. All sites recorded EMR events in 1997/1998, with these occurring during winter at NIN and HER (Figures 9C, G), and spring/summer at all other sites. Overall patterns in EMR were similar for West Coast sites; DAR, MAR, NIN and ABR where there was a peak in EMR around 2002 and 2009 (Figures 9A–D). GBR sites showed fewer similarities between sites, although all sites recorded a peak in EMR in 2004 (Figures 9E, F). At ABR, EMR dropped below zero from 2010 to 2016, since emersion did not occur at all for a number of years, due to higher mean sea level raising the minimum water levels above the emersion threshold (Figure 9D).
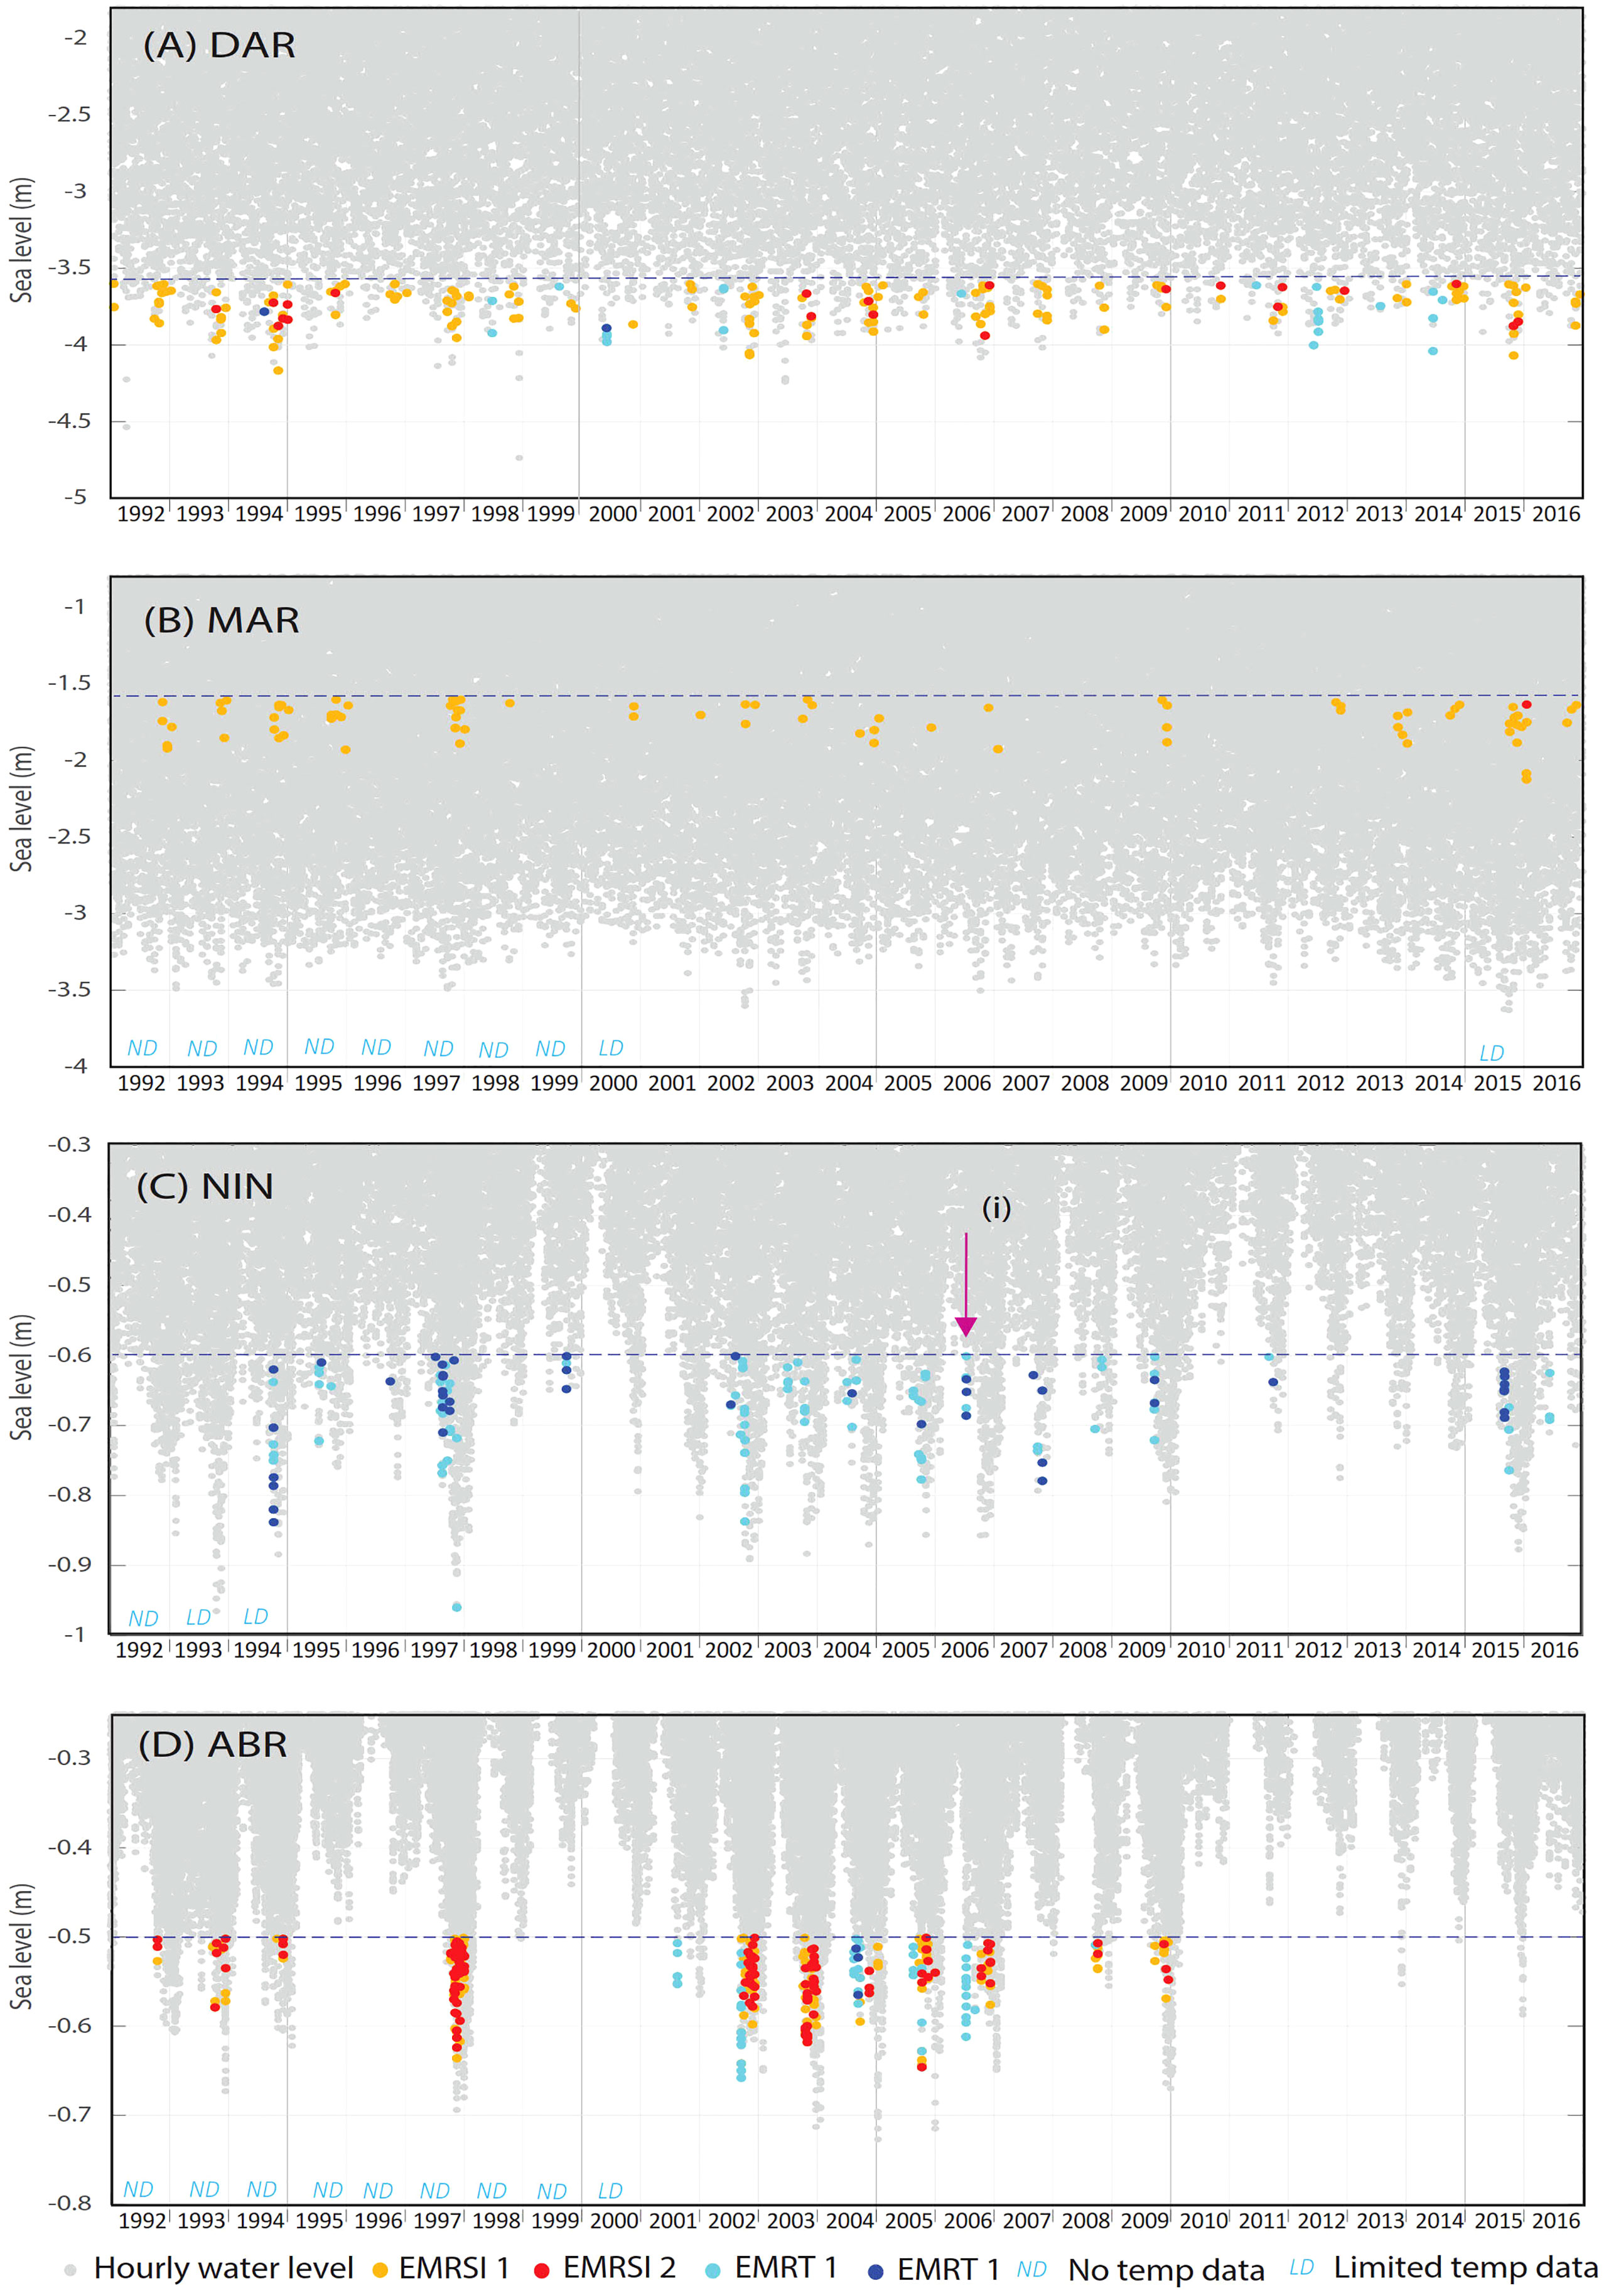
Figure 9 (Continued)
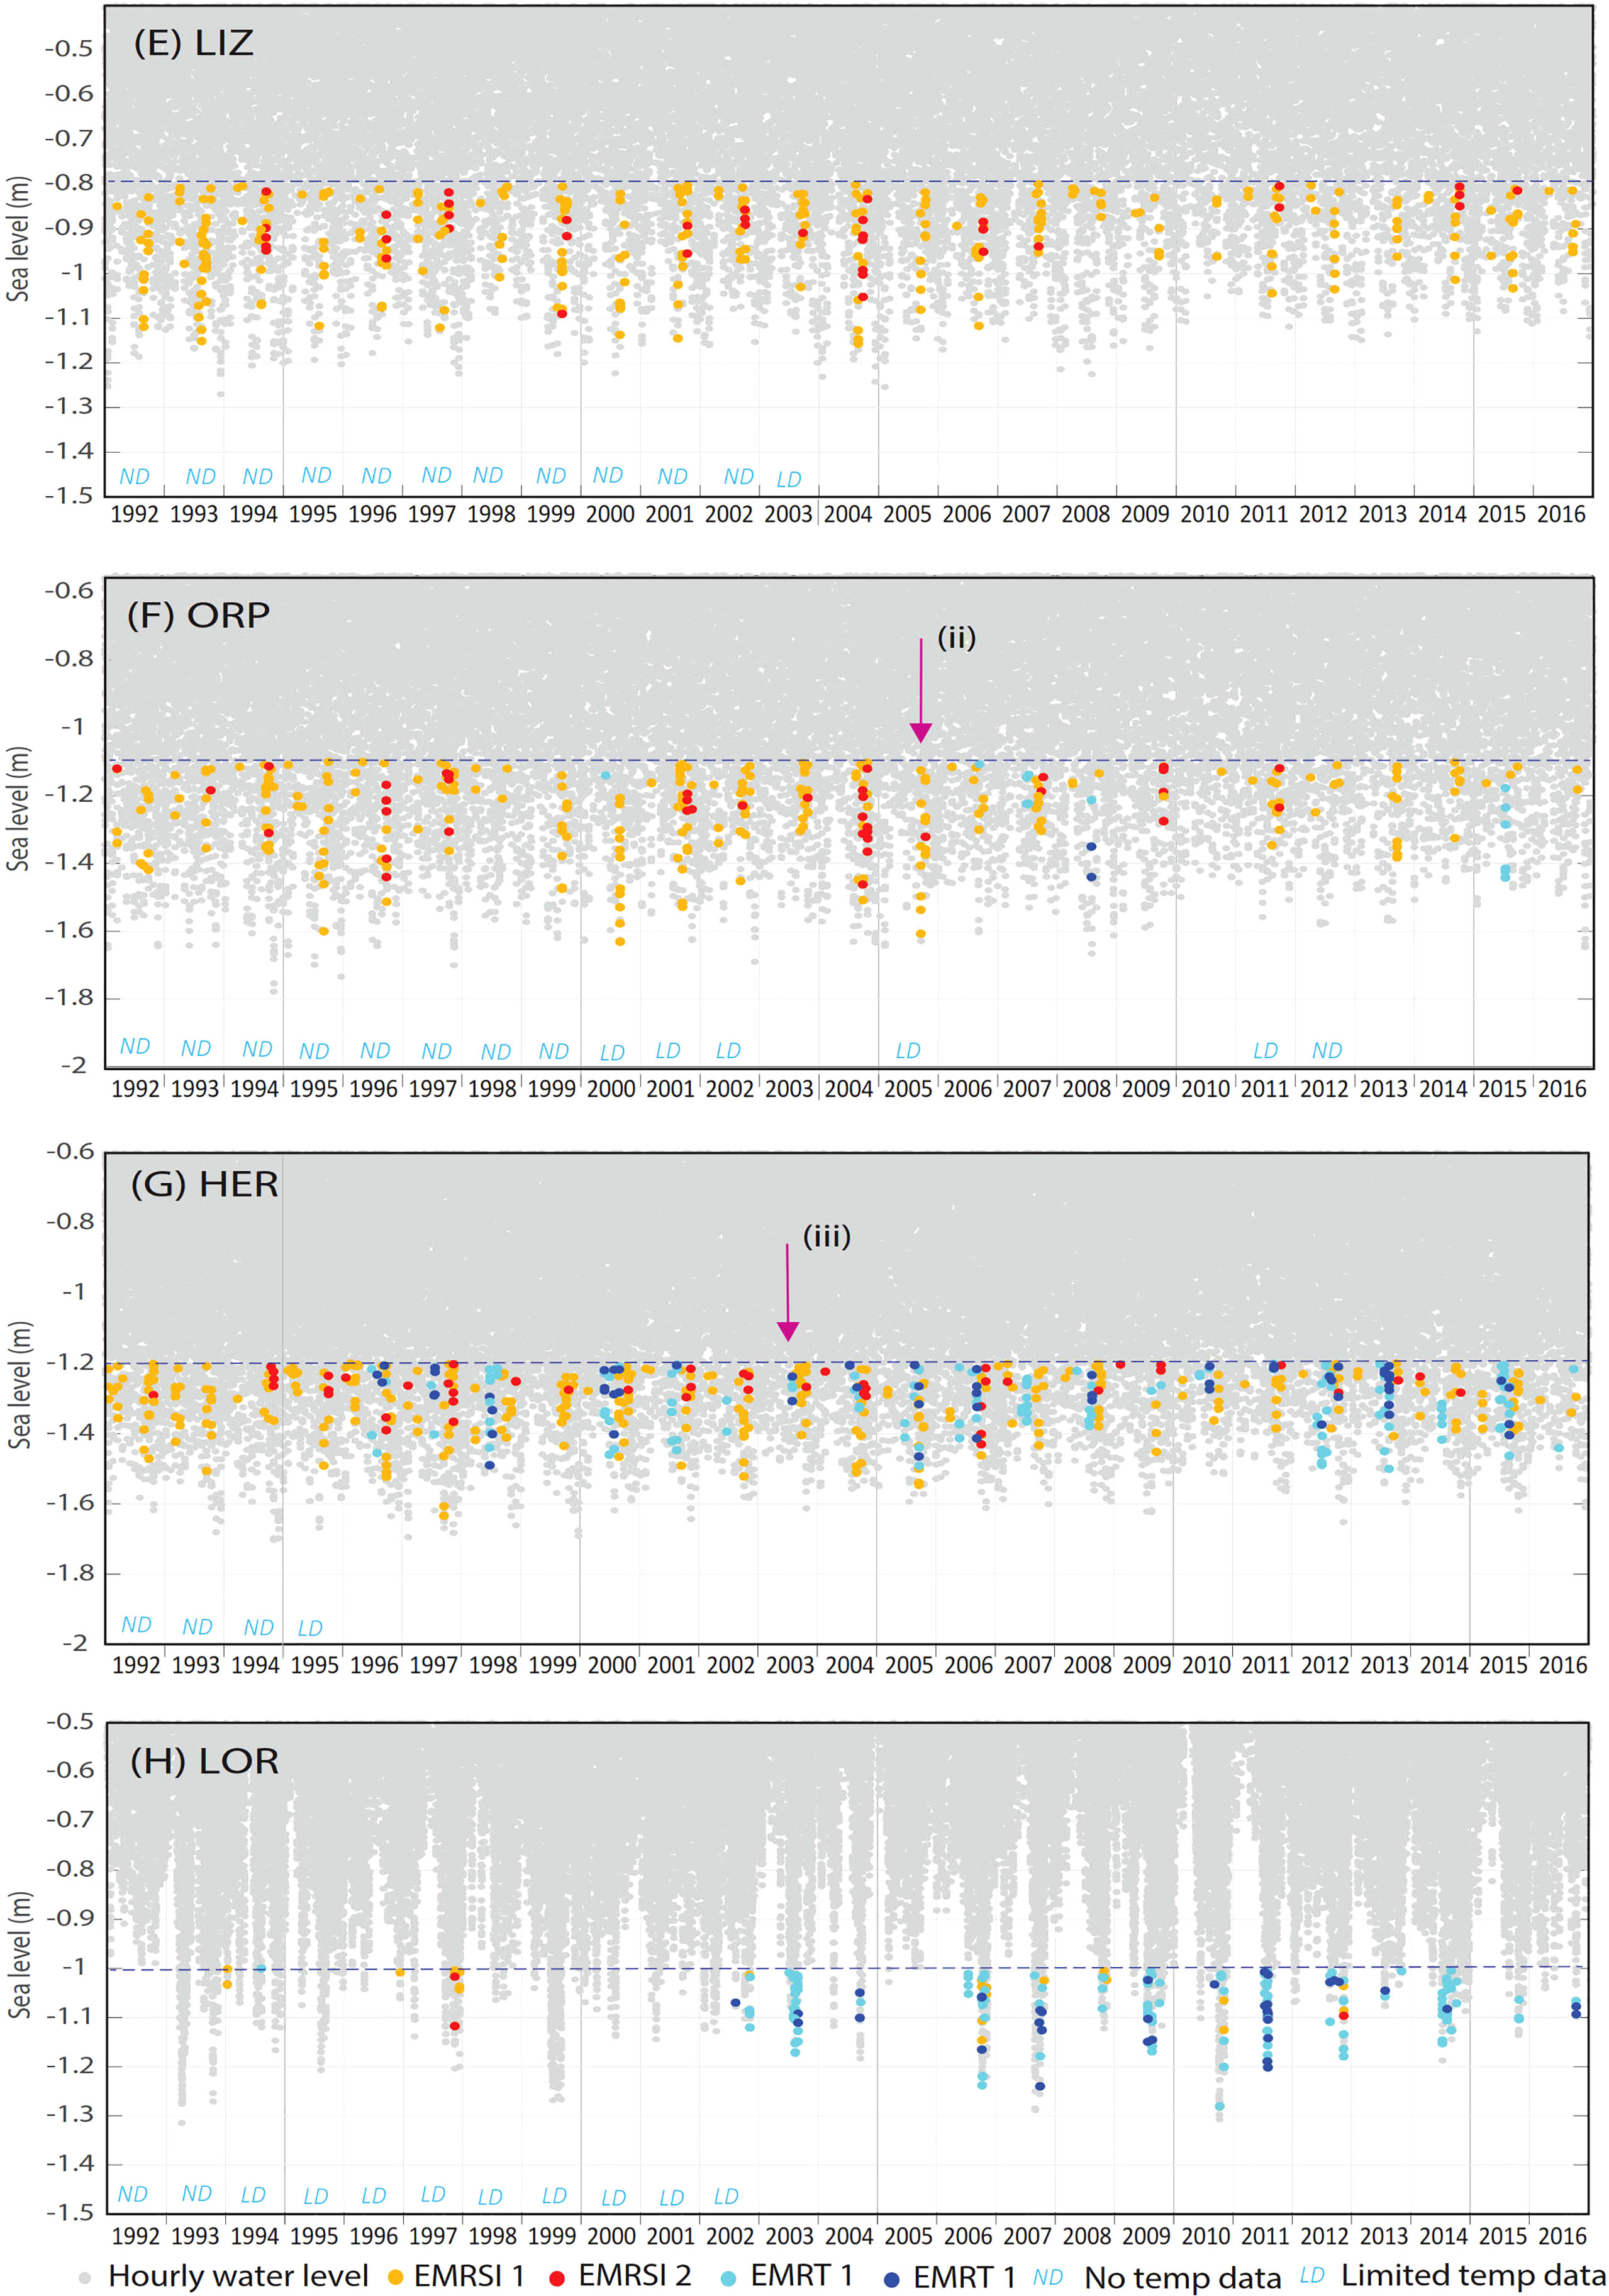
Figure 9 (Continued) Hourly water levels (1992 – 2016) for sites (A) Darwin (DAR), (B) Maret Island (MAR), (C) Ningaloo Reef (NIN), (D) Abrolhos Islands (ABR), (E) Lizard Island (LIZ), (F) Orpheus Island (ORP), (G) Heron Island (HER) and (H) Lord Howe Island (LOR) showing historical occurrence of coral emersion mortality risk due to high solar irradiance (EMRSI) and low atmospheric temperature (EMRTw). Missing or limited temperature data per year is indicated for each site. Reported coral mortality events are indicated by arrows at (i) Ningaloo in July 2006 (Armstrong et al., 2007), (ii) Orpheus Island in September 2006 (Anthony and Kerswell, 2007) and (iii) Heron Island in August 2003 (Hoegh-Guldberg et al., 2005). (A) Darwin (DAR), (B) Maret Island (MAR), (C) Ningaloo Reef (NIN), (D) Abrolhos Islands (ABR), (E) Lizard Island (LIZ), (F) Orpheus Island (ORP), (G) Heron Island (HER) and (H) Lord Howe Island (LOR).
Combining EMR for West Coast sites shows a negative relationship with the Southern Oscillation Index (SOI), with an overall increase in both EMRSI and EMRTw associated with positive SOI (El Niño) conditions (Figure 10A). The relationship with SOI was less clear for East Coast sites. (Figure 10B).
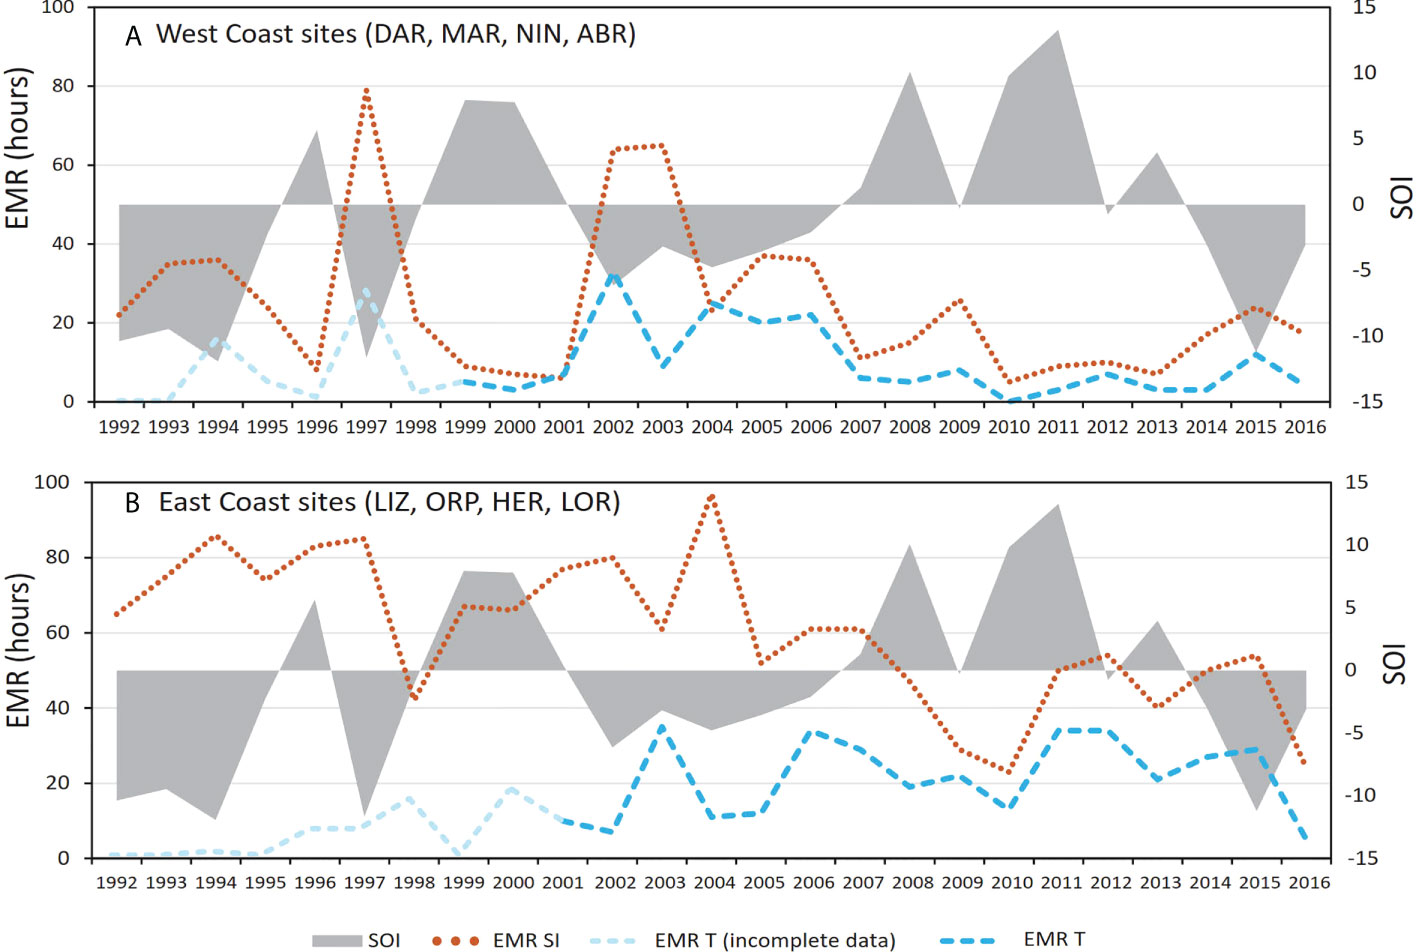
Figure 10 Total emersion mortality risk due to high solar irradiance (EMRSI 1) and low atmospheric temperature (EMRTw 1) for (A) West Coast sites (DAR, MAR, NIN and ABR) and (B) East Coast sites (LIZ, ORP. HER and LOR) combined, and the Southern Oscillation Index (SOI), from 1992 to 2016. Annual temperature data availability is indicated for each group of sites.
Discussion
Tidal drivers of emersion mortality risk
Seasonal and diurnal variability in solar irradiance and atmospheric temperature is a matter of common knowledge, however seasonality in the daily timing of lower water levels is rarely described either in the field of sea level science (Pugh and Woodworth, 2014) or intertidal biology (Raffaelli and Hawkins, 2012; Shepherd and Edgar, 2013). All eight sites studied here showed a distinct annual cycle in diurnal WL minima (Figures 5A–H, ESM 2A–C), although this was more obvious in the average than minimum WLs at LOR (see ESM 4). The universal, predictable and biologically critical nature of this aspect of tidal periodicity appears poorly understood. Our study examines this tidal characteristic systematically for multiple sites, and although our focus has been on corals, this work is also applicable to all intertidal habitats, including seagrass beds, mangroves, salt marshes and rocky shores.
Seasonal variation in the daily timing of tidal extremes appears to vary with tidal form, as defined by the relative contribution of diurnal and semi-diurnal tidal constituents (Pugh and Woodworth, 2014). At our study sites, the influence of tidal form (Table 1, Figure 1A) can be seen in the degree of seasonal variability in minimum water levels for each hour of the day (Figures 5A–H and ESM 4). Semidiurnal tides were most dominant at MAR, (form factor of 0.15), where the daily timing of low tide showed the least seasonal variability. This aligns with observations by Richards et al. (2015) and the findings of Eliot (2018) who notes that, for semi-diurnal tides in Western Australia, although the timing of low and high-water changes according to the lunar day (24 hours and 50 minutes), maximum spring tidal levels are always near midnight and midday, and low water spring tides occur around 6 am and 6 pm. In contrast, the most diurnal site ABR (form factor of 3.64) showed the highest level of seasonal variability in the daily timing of low tide, also apparent as banding in Figure 6D. Our findings for diurnal sites agree with the observation by Pugh and Woodworth (2014), p 53): ‘At times and places where solar diurnal tides are important, if the diurnal high- water levels occur between midnight and noon during summer, they will occur between noon and midnight during the winter’. Mixed tides also showed a high level of seasonal variability in the hourly water levels, qualitatively appearing to decrease with form factor.
Consistency in daily timing of low water extremes in semi-diurnal locations is explained by Pugh and Rayner (1981), p397) in their study of tidal regimes of three western Indian Ocean atolls. In this area “extreme low water on spring tides occurs when the lunar and solar semidiurnal tides are simultaneously at a minimum which, since the solar semidiurnal tide (S2) is phase-locked to the solar day, means that they always occur at the same part of the day and night for each particular location”. The authors acknowledge that regional variation in the timing of extreme low water and exposure to extremes of solar radiation is of great importance to organisms in shallow water areas and summarise this as “The phase relationship between tidal level and the daily cycle of solar radiation”, concluding that the most vulnerable areas are sites where S2 phase is close to 180° in local time. Mapping based on this premise (Pugh and Rayner, 1981, p405) indicates that the Great Barrier Reef has maximum exposure near 6 am and 8 am, but this is not substantiated by our findings possibly because of additional influences such as the phase of diurnal, semi-annual or annual solar constituents. In contrast to the consistency observed in semi-diurnal regimes, Pugh and Woodworth (2014), p51) attribute seasonality in the time of day of diurnal high-water levels to “the phase reversal of the equilibrium solar bulges and hence diurnal solar forces”, further noting that “This effect is also noticeable where semi-diurnal tides dominate, as it affects the phasing of the diurnal inequality, night or day”. Given the annual periodicity of the seasonality, declination of the sun is the obvious underlying driver of this phase reversal.
It can be surmised, therefore, that the daily timing of low tide extremes for any location is closely linked to the phase of both semi-diurnal and diurnal solar tidal constituents, whilst seasonal variation is mostly due to the phase of diurnal solar constituents. The differences between diurnal and semi-diurnal sites and overall similarities across GBR sites (Figures 5E–G) aligned with overarching tidal similarities (Figure 1). It is suggested, therefore, that the daily timing of low tide could be mapped globally using a theoretical approach, as per the mapping of tidal constituents and modulations by Kowalik (2004) and Haigh et al. (2011b).
Tidal factors also influence the seasonality of low water levels at semi-annual and interannual timescales (ESM 3), varying with tidal form which affects the seasonal timing of tidal range and extreme WL events at semi-annual and interannual timescales (Eliot, 2018; Ray and Merrifield, 2019). For example, in Western Australia, where diurnal tides dominate tidal range is greatest at the solstice (for example see ABR in Figure 6D), and at the equinox where tides are semi-diurnal (for example see MAR in Figure 6B). Also, in the longer-term the 18.6-year nodal and the 4.4-year lunar perigee cycles dominate for diurnal and semi-diurnal tidally dominated regions, respectively (Haigh et al., 2011b), potentially driving a periodic increase in EMR when tidal ranges are greatest.
Non-tidal drivers of emersion mortality risk
Globally, extreme sea level events are largely due to seasonal and interannual variability in mean sea level (Menéndez and Woodworth, 2010). In this study, extreme low water levels (Figures 3A–H) and consequent risk to corals (Figures 6A–H and 9A–H) were generally associated with negative non-tidal residuals coincident with periods of low tide (ESM 3, ESM 5A–H). At the West Coast sites MAR, NIN and ABR, increased MSLs, and therefore higher WL minima are associated with the Leeuwin Current during April to June (Feng et al., 2009; Pattiaratchi, 2011) and, to a lesser extent, the East Australian Current in summer (Ridgway and Godfrey, 1997). The timing and amplitude of seasonal MSL effects vary along the coast of Western Australia (Haigh et al., 2011a), but on average MSL along the southern portion of the west coast varies approximately 0.2 m seasonally due to the Leeuwin Current (Pattiaratchi, 2011; Wijeratne et al., 2018) (Figure 1C). Overall, whilst MSL minima tend to occur during spring at most sites (Figures 1C, D), coinciding with highest EMR, seasonal patterns in MSL differ from patterns in WL minima (Figures 3A–H) and frequency of emersion (Figures 7A, B), due to tidal factors as discussed above.
Interannual variability in EMR appears to be mostly due to non-tidal factors, with EMR at West Coast sites qualitatively showing a strong relationship with SOI (Figure 10A). This is most apparent in the timeseries for NIN and ABR (ESM 5C, D) where lower MSL and therefore WL minima are associated with El Niño conditions (Pattiaratchi and Eliot, 2008; Feng et al., 2009; Haigh et al., 2011a) and the frequency of emersion was greatly reduced during La Niña conditions (Figures 9C, D). At both sites, it is likely that a significant emersion mortality occurred in 1997, and repeated events occurred from 2003 to 2007. At NIN, the emersion bleaching event reported for 2006 was detected (Figure 9C, ESM 5C). At ABR, emersion mortality was recorded in 2018 (Buckee et al., 2019) following an extended absence of emersion (Figure 9D, ESM 5D). In contrast to West Coast sites, East Coast sites showed a weaker relationship with SOI (Figure 10B), however the association of coral emersion mortality with El Niño conditions in the Western Pacific has been highlighted previously by Ampou et al. (2015) and more recently by Dunne et al. (2021), and the results of this study generally substantiate those findings. Similarly, Glynn et al. (2017) note that catastrophic mortalities of corals can occur due to extreme reef flat exposures during La Niña events that decrease the mean sea level in the Eastern Pacific.
In addition to overall trends in seasonality and interannual variability in MSL, short-term non-tidal depression in sea level associated with weather systems are known to be associated with the actual occurrence of EMR on a particular day (Buckee et al., 2019). In Western Australia (affecting sites NIN and ABR), non-tidal residuals can be of a similar magnitude to the overall tidal range, due not only to atmospheric effects, but also to remotely generated long period continental shelf waves (Pattiaratchi and Eliot, 2008).
Seasonality in emersion mortality risk
Across all sites, emersion mortality risk was most common during Austral spring (Figure 8D), however, it appeared that causal mechanisms were different. MSL was lowest at this time of year for most sites (Figures 1C, D), and some sites (such as LOR) experienced annual WL minima at this time, but many did not, including all the GBR sites (Figures 3E–G) and ABR (Figure 3D). At these sites, the spring peak in EMR (mostly EMRSI) occurred as SI increased above threshold values and the daily timing of low tide transitioned from daytime to night-time. In contrast to GBR sites, midday low tides occurred over summer in Darwin. However, peak solar irradiance does not occur at this time in this area (Figure 3A), not only due to the declination of the sun, but also due to the northern monsoonal wet season (BOM, 2021b), and EMR was therefore greatest at DAR at the end of the dry season (November) (Figure 6A).
Sensitivity of analyses
Inference of historical occurrence of coral mortality events is sensitive to threshold selection, but conclusions regarding seasonality are robust since this is largely related to the seasonality of stressors and the daily timing of low tide. Identifying the historical coincidence of stressor threshold exceedance and emersion relies on both water level and site-specific stressor data being available and accurate. EMR events due to localized, short-term weather-related extreme low water levels may have not been captured. The water level hindcast model was validated with long-term tide gauge data (Pattiaratchi et al., 2018), however measurements were not available for many remote reef locations. Meteorological records were also mostly unavailable for coral reef locations, and even when available, the recorded solar irradiance data were too patchy to be useful for this study, hence the use of simulated SSRD data which provided spatial accuracy (i.e., predicted for the exact location of the coral reef), but may not have been accurate for all hours (for example if clouds were present).
Observed wet-bulb atmospheric temperature data were patchy in the early years; however, this metric was preferred over dry-bulb air temperature because it was better at capturing known cold events. It also better reflects temperatures experienced by emersed corals, which are exposed to greater evaporative cooling (latent heat loss) when the air is dryer. We were able to identify the 2006 Ningaloo event (Armstrong et al., 2007, ESM 5C) in the wet-bulb temperature record (Figure 9C), but not in dry-bulb temperature recordings or 2-meter air temperature data from the ERA model. The coral mortality event described by Hoegh-Guldberg et al. (2005), ESM 5G) was also captured (Figure 9F). Our study did not specifically examine duration of exposure, or cumulative solar irradiance [as per Anthony and Kerswell (2007)], although this is implicit in the time series when water levels are at their lowest. The study also did not examine high air temperature stress, which would occur later in the day than high solar, thereby affecting seasonality due to the daily timing of low tide. Additional environmental factors with the potential to influence EMR, such as wind speed (Leggat et al., 2006) and rainfall (Slack-Smith, 1960) could be included in future analyses.
Refinement of threshold values could potentially improve the detection of historical emersion risk events. The study used a simplistic approach whereby the same stressor threshold values were applied all around Australia for all years (1992 – 2016). This approach does not consider localized adaptation, for example as demonstrated in the Kimberley, where shallow corals are regularly exposed to higher temperatures and are known to have a higher thermal tolerance than deeper water corals (Schoepf et al., 2015). Similarly, low temperature thresholds may be higher for sites such as LIZ and MAR, and an absence of EMRTw in our study does not mean that this never occurs. Further, high latitude sites such as ABR, HER and LOR may be able to withstand lower temperatures, so the inference of EMRTw may be greater than actually occurs. This study also used an estimated emersion threshold for each site based on date-stamped photographic evidence and simulated sea levels, since reef height survey data were unavailable for any of the sites.
Our approach takes neither mean sea level rise nor vertical coral growth into consideration. Relative to a fixed level, EMR could be expected to decrease over time due to sea level rise (Figure 10). In reality, vertical coral growth of fast-growing species on reef platforms can occur at a rate in excess of sea level rise, and coral growth and mortality occurs in a “two steps forward, one step back” manner (Buckee et al., 2019). The results of the time series analyses are therefore preliminary. It was found that minor changes to the reef height estimates, and stressor threshold values resulted in relatively large changes the frequency of EMR (not shown), but not the seasonality, which was the primary focus of this study.
Emersion tolerance
The risk of coral mortality did not necessarily coincide with seasonal WL minima or emersion frequency, and we assumed that corals can tolerate emersion, on occasion or regularly, at all the sites. Despite being a universal stress factor and known cause of bleaching and disturbance events (Hughes and Connell, 1999; Baker and Cunning, 2015) emersion tolerance in corals has rarely been studied experimentally. Glynn (1976) subjected small colonies from three genera to different regimes of increasing daytime exposure, 2.5 hours and 4.5 hours respectively, and percentage mortality was recorded after 20 days. Mortality ranged from around 7 to 100%, increasing with duration of emersion and exposure to sunlight. His results conferred with those of Fishelson (1973) who found that ‘brain-like’ corals, were more resistant to emersion than the delicate ‘bush-like’ forms. This may be due to thicker tissue layers being present in some massive genera (Brown et al., 1994; Anthony and Kerswell, 2007) and mucus production which prevents desiccation during emersion (Krupp, 1984). More recently Castrillón-Cifuentes et al. (2017) found exposure to air simulating naturally occurring tidal exposure did not cause lethal bleaching or reduce growth rates, but that sexual reproduction was negatively affected. Further studies into emersion tolerance would be useful to refine thresholds and improve the detection of EMR.
Implications for coral reef biogeography
Sea level variability is a fundamental driver of coral reef formation (Buddemeier and Smith, 1988), with leeward margins of coral reefs growing vertically to the ‘standstill sea level position’ (Davies and Marshall, 1980). In our study, reef height estimates varied considerably in relation to tidal range, and frequency of emersion. For example, at MAR the reef height was meters above the lowest WLs and corals were emersed~18% of the time (Table 3). Richards et al. (2015) attributed the survival of corals at this site to the daily timing of low tide (with low tides always occurring around 6 am or 6 pm when solar irradiance is low), and the results of our study agree with that conclusion. Further it may be that it is the daily timing of low tide that is responsible for the high reef height at MAR and elsewhere, since the lowest midday water levels in spring and summer generally coincided with the estimated reef height at all the sites (Figure 5).
It is also possible that low tides occurring in the middle of the day during winter rather than summer, may be a fundamental factor supporting the biogeographical development of the GBR. At all three GBR sites (LIZ, ORP and HER) the daily timing of low tide transitioned from daytime to nighttime low tides during the Austral spring (Figures 5E, F), at which time EMR events were most likely to occur (Figures 6E–G). Seasonal similarities displayed at the GBR sites in relation to EMR were clearly due to a similarity in tidal characteristics (Table 1, Figures 1A, B), which can also be seen in maps showing amplitude and co-tidal lines for the major tidal constituents (Kowalik, 2004; Haigh et al., 2011b; Ray and Merrifield, 2019). More work is needed to link tidal factors with coral reef biogeography, globally. Our study indicates a relationship between coral reef distribution and seasonal daily timing of low tide, and it is possible that regions which experience low water at midday during summer, may be found to have little or no coral reef development.
Implications for monitoring and attribution of change
EMR clearly occurs in all intertidal environments, due to inherent spatial variability in water levels and atmospheric stressors, therefore it is important to include emersion history as a potential factor when assessing change in benthic cover over time in these environments. For coral reefs, periods of elevated sea level can promote an increase in coral cover (Brown et al., 2011), and low water events can account for reduced cover (Zapata et al., 2010). It is essential, therefore, that emersion as a fundamental driver of coral cover be considered if monitoring sites include shallow reef platform habitats. Clark et al. (2016) examined photographic evidence of change over time in intertidal coral cover at two sites on the GBR, finding losses at one of the sites to be due to extreme low minimum water events (based on monthly minima) in 1989 and 1990. However, some publications, include photographs of intertidal coral loss without considering EMR (e.g. Hughes et al., 2017). More broadly, whilst coral decline due to thermal bleaching is of great concern many publications link this to ENSO variability (Claar et al., 2018), our study substantiates the conclusions of Ampou et al. (2017); Glynn et al. (2017) and Buckee et al. (2019) that coral disturbance associated with ENSO events is not only confined to warmer ocean temperatures. Despite these observations, it is important to note that our study in no way denies climate change or suggests that the threat to coral reefs from anthropogenic global warming is not real.
Emersion history also needs to be considered when assessing change in coral cover using remote sensing techniques since change detection typically does not differentiate between intertidal and subtidal environments (for example Palandro et al., 2003).
Using the methods described here, seasonal EMR due to high solar irradiance or low atmospheric temperature is predictable for any coastal location in Australia using publicly available data, and the likelihood of past disturbance to benthic communities due to emersion can also be assessed. Seasonality in EMR should be taken into consideration when planning biological field studies or remote sensing that includes intertidal environments, and ENSO forecasting (BOM, 2021b) can also be used to predict the likelihood of EMR at monthly to annual scales.
Conclusions
Emersion is a fundamental mortality risk factor in all intertidal environments, including shallow coral reefs. EMR occurs due to tidal and non-tidal water level drivers, as well as diurnal patterns and seasonality in atmospheric stressors. The predictable daily timing of low tide is seasonally and spatially variable, and EMR can be determined based on the global modelling of tidal constituents. Non-tidal factors such as the boundary currents and ENSO effects also drive seasonal and interannual variability in MSL, and weather effects drive low water extremes at the scale of days.
In general, coral emersion mortality risk was found to be greatest during the Austral spring, when MSLs were generally at a minimum and a phase change in solar tidal constituents occurs. Across all sites, emersion rates were higher in summer, but EMR due to high solar irradiance was reduced due to an absence of low tides in the middle of the day coinciding with high solar irradiance. For all GBR sites, low tide occurred close to midday during winter and at night in the summer, which may be a fundamental factor supporting the long-term bio-geographical development of the reef.
Historical occurrence of EMR appears related to ENSO events, particularly on the West Coast, where extended La Niña conditions were associated with elevated MSL and reduced EMR, and El Niño conditions were associated with lower MSL and elevated EMR. The relationship was less clear on the East Coast.
Emersion mortality has the potential to be a significant driver of change in coral cover on shallow reefs and needs to be taken into consideration when assessing temporal changes in cover in these ecosystems.
While our study focused on coral reef environments, it has far-reaching implications for all intertidal environments, and addresses a gap in fundamental knowledge in the fields of both water level science and intertidal biology in relation to the daily timing of low tide, which varies predictably on a seasonal and regional basis.
Data availability statement
All data used in this study are publicly available. Sea level data used in this study can be found online at http://sealevelx.ems.uwa.edu.au, ERA5 global reanalysis solar irradiance data can be downloaded from https://www.ecmwf.int/en/forecasts/datasets/reanalysis-datasets/era5 and Bureau of Meteorology data can be obtained by application online at http://www.bom.gov.au/climate/dataservices/.
Author contributions
JB conceptualised the study, sourced data, performed analyses, wrote the manuscript and produced figures and tables. YH and WE sourced and analysed data and produced figures. JV and CP provided supervision. All authors reviewed the draft and final manuscript and approved the submitted version.
Funding
This project was funded by a Murdoch University Research Training Program Scholarship (19045344).
Acknowledgments
The authors would like to acknowledge the support of the Coastal Oceanography Group at the University of Western Australia, and access to extreme sea level data from the ‘Developing Better Predictions for Extreme Water Levels’ project, funded by the Australian Government and licensed under the Creative Commons Attribution-Non-Commercial 4.0 International License. Dr Sarath Wijeratne provided the model output from the ozROMS model that was used to create Figures 1A, B for which we are extremely thankful. We are grateful for the permission to use photographs in Figure 2, granted by INPEX Australia Pty Ltd, Dr Zoe Richards from the West Australia Museum, The Western Australian Department of Biodiversity, Conservation and Attractions, Dr. Michael Bok, ARC Centre for Excellence for Coral Reef Studies, and Black Diamond Images.
Conflict of interest
The authors declare that the research was conducted in the absence of any commercial or financial relationships that could be construed as a potential conflict of interest.
Publisher’s note
All claims expressed in this article are solely those of the authors and do not necessarily represent those of their affiliated organizations, or those of the publisher, the editors and the reviewers. Any product that may be evaluated in this article, or claim that may be made by its manufacturer, is not guaranteed or endorsed by the publisher.
Supplementary material
The Supplementary Material for this article can be found online at: https://www.frontiersin.org/articles/10.3389/fmars.2022.904191/full#supplementary-material
Abbreviations
BOM, Australian Bureau of Meteorology; EMR, Emersion mortality risk; EMRSI, Emersion mortality risk due to high solar irradiance; EMRTw, Emersion mortality risk due to low atmospheric wet-bulb temperature; ENSO, El Niño Southern Oscillation; GBR, Great Barrier Reef; MSL, Mean Sea Level; SOI, Southern Oscillation Index; WL, Water level; ƟWL, Emersion threshold; ƟSI, Solar irradiance threshold; ƟT, Temperature threshold.
References
ABC (2016) Bleached coral near heron island. Available at: https://www.abc.net.au/news/2016-02-19/bleached-coral-near-heron-island-in-2011-qld/7183922. (Accessed 05/10/2021)
Achituv Y., Dubinsky Z. (1990). Evolution and zoogeography of coral reefs (Amsterdam: Ecosystems of the World - Coral Reefs. Elsevier).
Ampou E. E., Johan O., Menkes C. E., Niño F., Birol F., Ouillon S., et al. (2017). Coral mortality induced by the 2015–2016 El-niño in Indonesia: The effect of rapid sea level fall. Biogeosciences 14 (4), 817–826. doi: 10.5194/bg-14-817-2017
Anthony K. R. N., Kerswell A. P. (2007). Coral mortality following extreme low tides and high solar radiation. Mar. Biol. 151 (5), 1623–1631. doi: 10.1007/s00227-006-0573-0
Armstrong S., Webster F., Kendrick A., Mau R., Onton K. (2007). “Low temperatures cause coral bleaching at ningaloo reef, Western Australia,” in Ningaloo marine park symposium, July 2007. West Australian Department of Environment and Conservation Available at: https://www.dpaw.wa.gov.au/images/documents/about/science/pubs/posters/ningaloo-bleaching.pdf.
Baker A. C., Cunning R. (2015). “Coral “bleaching” as a generalized stress response to environmental disturbance,” in Diseases of coral Eds. Woodley C. M., Downs C. A., Bruckner A. W., Porter J. W., Galloway S. B. John Willey & Sons, Inc., Hoboken, New Jersey 396–409. doi: 10.1002/9781118828502.ch30
Black Diamond Images (2021). Available at: https://blackdiamondimages.zenfolio.com/lordhoweisland (Accessed 05/10/21).
BOM (2021a). Climate driver update. (Australia Bureau of Meteorology) Available at: http://www.bom.gov.au/climate/enso/ (Accessed 17/08/2021).
BOM (2021b) Northern rainfall onset (Australia Bureau of Meteorology) Available at: http://www.bom.gov.au/climate/rainfall-onset/#tabs=Outlook. (Accessed 17/08/2021).
Brown B. E., Dunne R. P., Phongsuwan N., Somerfield P. J. (2011). Increased sea level promotes coral cover on shallow reef flats in the Andaman Sea, eastern Indian ocean. Coral Reefs 30 (4), 867. doi: 10.1007/s00338-011-0804-9
Brown B. E., Dunne R. P., Scoffin T. P., Le Tissioe M. D. A. (1994). Solar damage in intertidal corals. Mar. Ecol. Prog. Ser. 105, 219–230. http://www.jstor.org/stable/24844862
Buckee J., Jimenez I., Blount C., Roberts C., Hughes M., van Senden D., et al. (2014). Darwin Harbour – A summary of the Ichthys LNG Project Nearshore Environmental Monitoring Program. INPEX Operations Australia Pty Ltd October 2014. Available at: https://www.inpex.com.au/projects/ichthyslng/reports/
Buckee J., Pattiaratchi C., Verduin J. (2019). Partial mortality of intertidal corals due to seasonal daytime low water levels at the houtman abrolhos islands. Coral Reefs 39(3), 537–543. doi: 10.1007/s00338-019-01887-5
Buddemeier R. W., Smith S. V. (1988). Coral reef growth in an era of rapidly rising sea level: Predictions and suggestions for long-term research. Coral Reefs 7, 51. doi: 10.1007/BF00301982.pdf
Castrillón-Cifuentes A. L., Lozano-Cortés D. F., Zapata F. A. (2017). Effect of short-term subaerial exposure on the cauliflower coral, pocillopora damicornis, during a simulated extreme low-tide event. Coral Reefs 36 (2), 401–414. doi: 10.1007/s00338-017-1552-2
Claar D. C., Szostek L., McDevitt-Irwin J. M., Schanze J. J., Baum J. K. (2018). Global patterns and impacts of El niño events on coral reefs: A meta-analysis. PloS One 13 (2), e0190957. doi: 10.1371/journal.pone.0190957
Clark T., Leonard N., Zhao Jx., Brodie J., McCook L., Watchenfeld D., et al. (2016). Historical photographs revisited: A case study for dating and characterizing recent loss of coral cover on the inshore great barrier reef. Sci. Rep. 6, 19285. doi: 10.1038/srep19285
Davies P. J., Marshall J. F. (1980). A model of epicontinental reef growth. Nature 287, 37. doi: 10.1038/287037a0
Dunne R. P., Brown B. E., Phongsuwan N., Putchim L. (2021). The Indian ocean dipole and El niño southern oscillation as major drivers of coral cover on shallow reefs in the Andaman Sea. Global Change Biol 27(14), 3312–3323. doi: 10.1111/gcb.15640
Eakin C. M. (1996). Low tidal exposures and reef mortalities in the Eastern pacific. Coral Reefs 15(2).
Edgar G. J., Davey A., Kelly G., Mawbey R. B., Parsons K. (2010). Biogeographical and ecological context for managing threats to coral and rocky reef communities in the Lord Howe Island Marine Park, southwestern Pacific. Aquatic Conserv: Mar. Freshw. Ecosyst. 20, 378–396. https://doi.org/10.1002/aqc.1075
Eliot M. (2018). Western Australian Sea Level variability (Thesis presented for the degree of Doctor of Philosophy of The University of Western Australia). doi: 10.26182/5be4d7a36b9f7
Fadlallah Y. H., Allen K. W., Estudillo R. A. (1995). Mortality of shallow reef corals in the Western Arabian gulf following aerial exposure in winter. Coral Reefs 14, 99–107. doi: 10.1007/BF00303430.pdf
Feng M., Weller E., Hill K. (2009). “The leeuwin current,” in A marine climate change impacts and adaptation report card for Australia 2009. Eds. Poloczanska E. S., Hobday A. J., Richardson A. J. (Natural Environment Research Council, United Kingdom). Available at: http://nora.nerc.ac.uk/id/eprint/528666
Fishelson L. (1973). Ecological and biological phenomena influencing coral-species composition on the reef tables at eilat (Gulf of aqaba, red Sea). Mar. Biol. 19, 183–196.
Glynn P. W. (1968). Mass mortalities of echinoids and other reef flat organisms coincident with midday, low water exposures in Puerto Rico. Mar. Biol. 1, 226–243.
Glynn P. W. (1976). Some physical and biological determinants of coral community structure in the Eastern pacific. Ecol. Monogr. 4, 431–456.
Glynn P. W., Mones A. B., Podestá G. P., Colbert A., Colgan M. W. (2017). “El Niño-southern oscillation: Effects on Eastern pacific coral reefs and associated biota,” in Coral reefs of the Eastern tropical pacific. coral reefs of the world, vol. vol 8 . Eds. Glynn P., Manzello D., Enochs I. (Dordrecht: Springer). doi: 10.1007/978-94-017-7499-4_8
Haigh I., Eliot M., Pattiaratchi C., Wahl T. (2011a). “Regional changes in mean sea level around Western Australia between 1897 and 2008,” in Proceedings of the 20th Australasian Coastal and Ocean Engineering conference and the 13th Australasian Port and Harbour Conference, Perth, Western Australia.
Haigh I., Eliot M., Pattiaratchi C. (2011b). Global influences of the 18.61 year nodal cycle and 8.85 year cycle of lunar perigee on high tidal levels. J. Geophys. Res. 116, C06025. doi: 10.1029/2010JC006645
Hersbach H., Bell B., Berrisford P., Hirahara S. A., Thépaut J.-N. (2020). The ERA5 global reanalysis. Q J. R Meteorol Soc 146, 1999–2049. doi: 10.1002/qj.3803
Hoegh-Guldberg O., Fine M., Skirving W., Johnstone R., Dove S., Strong A. (2005). Coral bleaching following wintry weather. Limnology Oceanography 50 (1), 265–271. doi: 10.4319/lo.2005.50.1.0265
Hughes T. P., Connell J. H. (1999). Multiple stressors on coral reefs: a long-term perspective. Limnology Oceanography 44 (3 part 2), 932–940. doi: 10.4319/lo.1999.44.3_part_2.0932
Hughes T. P., Kerry J. T., Álvarez-Noriega M., Álvarez-Romero J. G., Anderson K. D., Baird A. H., et al. (2017). Global warming and recurrent mass bleaching of corals. Nature 543 (7645), 373–377. doi: 10.1038/nature21707
Krupp D. (1984). Mucus production by corals exposed during an extreme low tide. Pacific Sci. 38, 1–11.
Leggat W., Ainsworth T. D., Dove S., Hoegh-Guldberg O. (2006). Aerial exposure influences bleaching patterns. Coral Reefs 25 (3), 452–452. doi: 10.1007/s00338-006-0128-3. Lowe and Falter (2015).
Loya Y. (1976). Recolonization of red Sea corals affected by natural catastrophes and man-made perturbations. Ecology 57 (2), 278–289. doi: 10.2307/1934816
Mejía-Rentería J. C., Castellanos-Galindo G. A., Osorio-Cano J. D., Casella E. (2019). Subaerial exposure of coral reefs during spring low tides in the eastern pacific. Bull. Mar. Sci 96(1), 219–220. doi: 10.5343/bms.2019.0085
Menéndez M., Woodworth P. L. (2010). Changes in extreme high water levels based on a quasi-global tide-gauge data set. J. Geophysical Research: Oceans 115 (C10), C10011. doi: 10.1029/2009JC005997
NOAA (2021) What are tides? national ocean service (National Oceanic and Atmospheric Administration). Available at: https://oceanservice.noaa.gov/facts/tides.html (Accessed 22/11/2021).
Palandro D., Andréfouët S., Muller-Karger F. E., Dustan P., Hu C., Hallock P. (2003). Detection of changes in coral reef communities using landsat-5 TM and landsat-7 ETM+ data. Can. J. Remote Sens. 29 (2), 201–209. doi: 10.5589/m02-095
Pattiaratchi C. (2011). “Coastal tide guage observations: Dynamic processes present in the fremantle record,” in Operational oceanography in the 21st century. Eds. Schiller A., Brassington G. B. (pp. 185–202). Springer, Dordrecht.
Pattiaratchi C., Eliot M. (2008). “Sea Level variability in south-west Australia: from hours to decades,” in Proceedings of the 31st ASCE International Conference on Coastal Engineering, Hamburg, Germany, 2008. 1186–1198.
Pattiaratchi C., Hetzel Y., Janekovic I. (2018). Developing better predictions for extreme water levels. Final Data Report. Prepared for the Australian Government Department of Industry Innovation and Science. doi: 10.1142/9789814277426_0099
Pugh D. T., Rayner R. F. (1981). The tidal regimes of three Indian ocean atolls and some ecological implications. Estuarine Coast. Shelf Sci. 13 (4), 389–407. doi: 10.1016/S0302-3524(81)80036-9
Pugh D. T., Woodworth P. L. (2014). Sea-Level science: understanding tides, surges tsunamis and mean sea-level changes (Cambridge University Press, United Kingdom), 407pp.
Raffaelli D., Hawkins S. J. (2012). Intertidal ecology (Springer Science & Business Media, United Kingdom).
Ray R. D., Merrifield M. A. (2019). The semiannual and 4.4‐Year modulations of extreme high tides. J. Geophysical Research: Oceans 124 (8), 5907–5922. doi: 10.1029/2019JC015061
Richards Z. T., Bryce M., Bryce C. (2018). The composition and structure of shallow benthic reef communities in the Kimberley, north-west Australia. Records of the Australian Museum Supplement. 85, 075–103. doi: 10.18195/issn.0313-122x.85.2018.075-103
Richards Z. T., Garcia R. A., Wallace C. C., Rosser N. L., Muir P. R. (2015). A diverse assemblage of reef corals thriving in a dynamic intertidal reef setting (Bonaparte archipelago, Kimberley, Australia). PloS One 10 (2), e0117791. doi: 10.1371/journal.pone.0117791
Ridgway K. R., Godfrey J. S. (1997). Seasonal cycle of the East Australian current. J. Geophysical Research: Oceans 102 (C10), 22921–22936. doi: 10.1029/97JC00227
Schoepf V., Stat M., Falter J. L., McCulloch M. T. (2015). Limits to the thermal tolerance of corals adapted to a highly fluctuating, naturally extreme temperature environment. Sci. Rep. 5, 17639. doi: 10.1038/srep17639
Shepherd S., Edgar G. (2013). Ecology of Australian temperate reefs: The unique south (CSIRO Publishing, Dordrecht, Germany).
Sheppard C. R., Davy S. K., Pilling G. M., Graham A. J. (2018). The biology of coral reefs. 2nd ed. (Oxford University Press, Australia).
Slack-Smith R. J. (1960). An investigation of coral deaths at peel island, moreton bay, in early 1956. University of Queensland Press, Brisbane.
Underwood A. J., Chapman M. G. (1999). Coastal marine ecology of temperate (University of New South Wales, Australia).
UNESCO (2021) Ningaloo coast. united nations educational, scientific and cultural organization (World heritage). Available at: https://whc.unesco.org/en/list/1369 (Accessed 04/10/21).
Veron J. E. N. (1993). Corals of Australia and the indo-pacific (University of Hawaii Press, Hawaii).
White N. J., Haigh I. D., Church J. A., Koen T., Watson C. S., Pritchard T. R., et al. (2014). Australian Sea levels–trends, regional variability and influencing factors. Earth-Science Rev. 136, 155–174. doi: 10.1016/j.earscirev.2014.05.011
Wijeratne S., Pattiaratchi C., Proctor R. (2018). Estimates of surface and subsurface boundary current transport around Australia. J. Geophysical Research: Oceans 123 (5), 3444–3466. doi: 10.1029/2017JC013221
Wolanski E. (2000). Oceanographic processes of coral reefs: physical and biological links in the great barrier reef (CRC Press, Florida, USA).
Yamaguchi M. (1975). Sea Level fluctuations and mass mortalities of reef animals in Guam, Mariana islands. Micronesica 11 (2), 227–243.
Yonge C. M. (1940). The biology of reef-building corals. Sci. Rep. Great Barrier Reef Exped 1, 353–391.
Zapata F. A. (2017). Temporal dynamics of coral and algal cover and their drivers on a coral reef of gorgona island, Colombia (Eastern tropical pacific). Rev. la Academia Colombiana Cienc. Exactas Físicas y Naturales 41 (160), 306–310. doi: 10.18257/raccefyn.486
Zapata F. A., Rodríguez-Ramírez A., Caro-Zambrano C., Garzón-Ferreira J. (2010). Mid-term coral-algal dynamics and conservation status of a gorgona island (Tropical Eastern pacific) coral reef. Revista de Biologia Tropical. 58, 81–94. Available from http://www.scielo.sa.cr/scielo.php?script=sci_arttext&pid=S0034-77442010000500007&lng=en&nrm=iso. Accessed 16 /08/2022.
Keywords: tidal regime, coral reef disturbance, coral reef formation, sub-aerial exposure, sea level variability, El Niño southern oscillation
Citation: Buckee J, Hetzel Y, Edge W, Verduin J and Pattiaratchi C (2022) Daily timing of low tide drives seasonality in intertidal emersion mortality risk. Front. Mar. Sci. 9:904191. doi: 10.3389/fmars.2022.904191
Received: 25 March 2022; Accepted: 05 August 2022;
Published: 13 September 2022.
Edited by:
Matthew Lewis, Bangor University, United KingdomReviewed by:
Sophie-Berenice Wilmes, Bangor University, United KingdomGrant Alexander Smith, Bureau of Meteorology, Australia
Copyright © 2022 Buckee, Hetzel, Edge, Verduin and Pattiaratchi. This is an open-access article distributed under the terms of the Creative Commons Attribution License (CC BY). The use, distribution or reproduction in other forums is permitted, provided the original author(s) and the copyright owner(s) are credited and that the original publication in this journal is cited, in accordance with accepted academic practice. No use, distribution or reproduction is permitted which does not comply with these terms.
*Correspondence: Joanna Buckee, Sm8uQnVja2VlQHRsYS5uZXQuYXU=