 Zachary M. Topor
 Kelly L. Robinson
 Andrea Turcu
95% of researchers rate our articles as excellent or good
Learn more about the work of our research integrity team to safeguard the quality of each article we publish.
Find out more
CORRECTION article
Front. Mar. Sci. , 20 April 2022
Sec. Marine Ecosystem Ecology
Volume 9 - 2022 | https://doi.org/10.3389/fmars.2022.903054
A Corrigendum on:
Investigating Seasonal Succession Patterns in Mesozooplankton Community Structure Following Hurricane Harvey
By Topor ZM, Robinson KL and Turcu A (2020). Front. Mar. Sci. 7:462. doi: 10.3389/fmars.2020.00462
In the original article, there was a mistake in the legend for Figure 1 as published. The legend states that nearshore stations are orange when they are printed as white. The correct legend appears below:
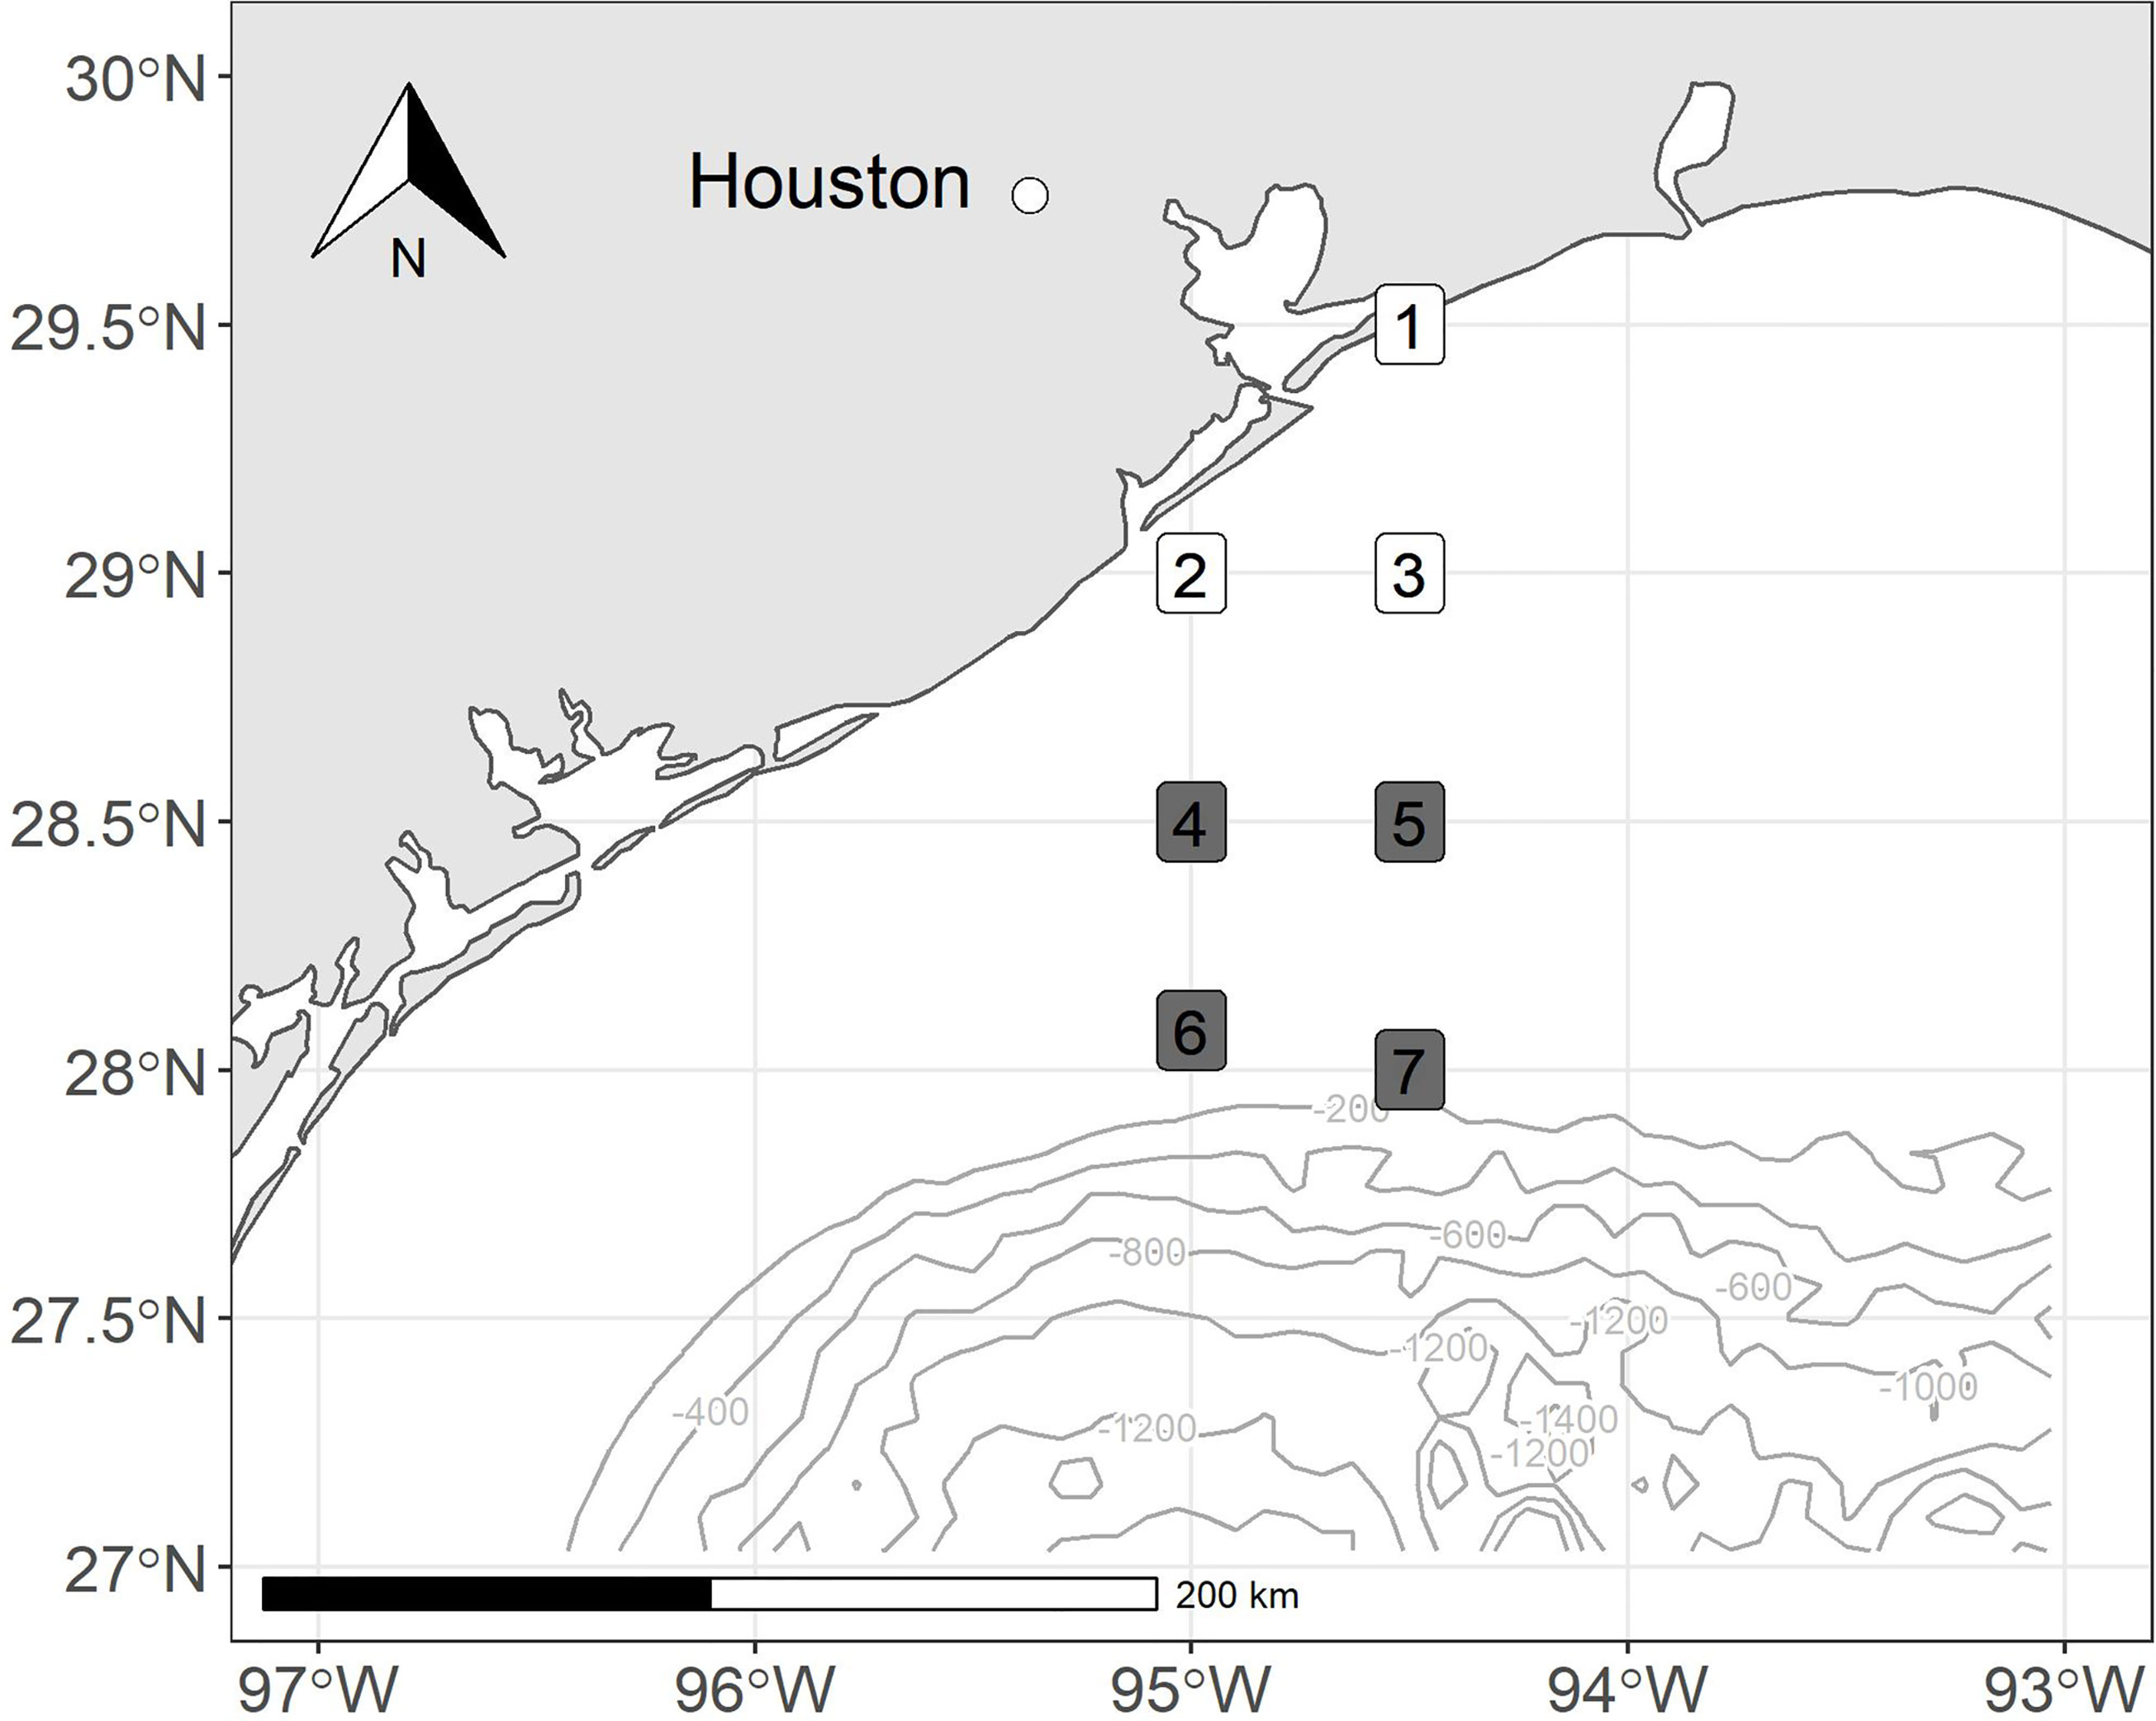
Figure 1 Map of stations sampled off the coast of Texas, United States. Colors correspond to depth bin (nearshore = white, shelf = gray).
“Figure 1. Map of stations sampled off the coast of Texas, United States. Colors correspond to depth bin (nearshore = white, shelf = gray).”
In the original article, there was a mistake in Figure 2 as published. A taxonomic group previously sorted into the Cyclopoida taxa, were found to be misidentified and were changed to their proper identification of ‘Calanoida’. As such, all figures with underlying community data were modified, however, no change to the results or discussion have occurred. The corrected Figure 2 appears below.
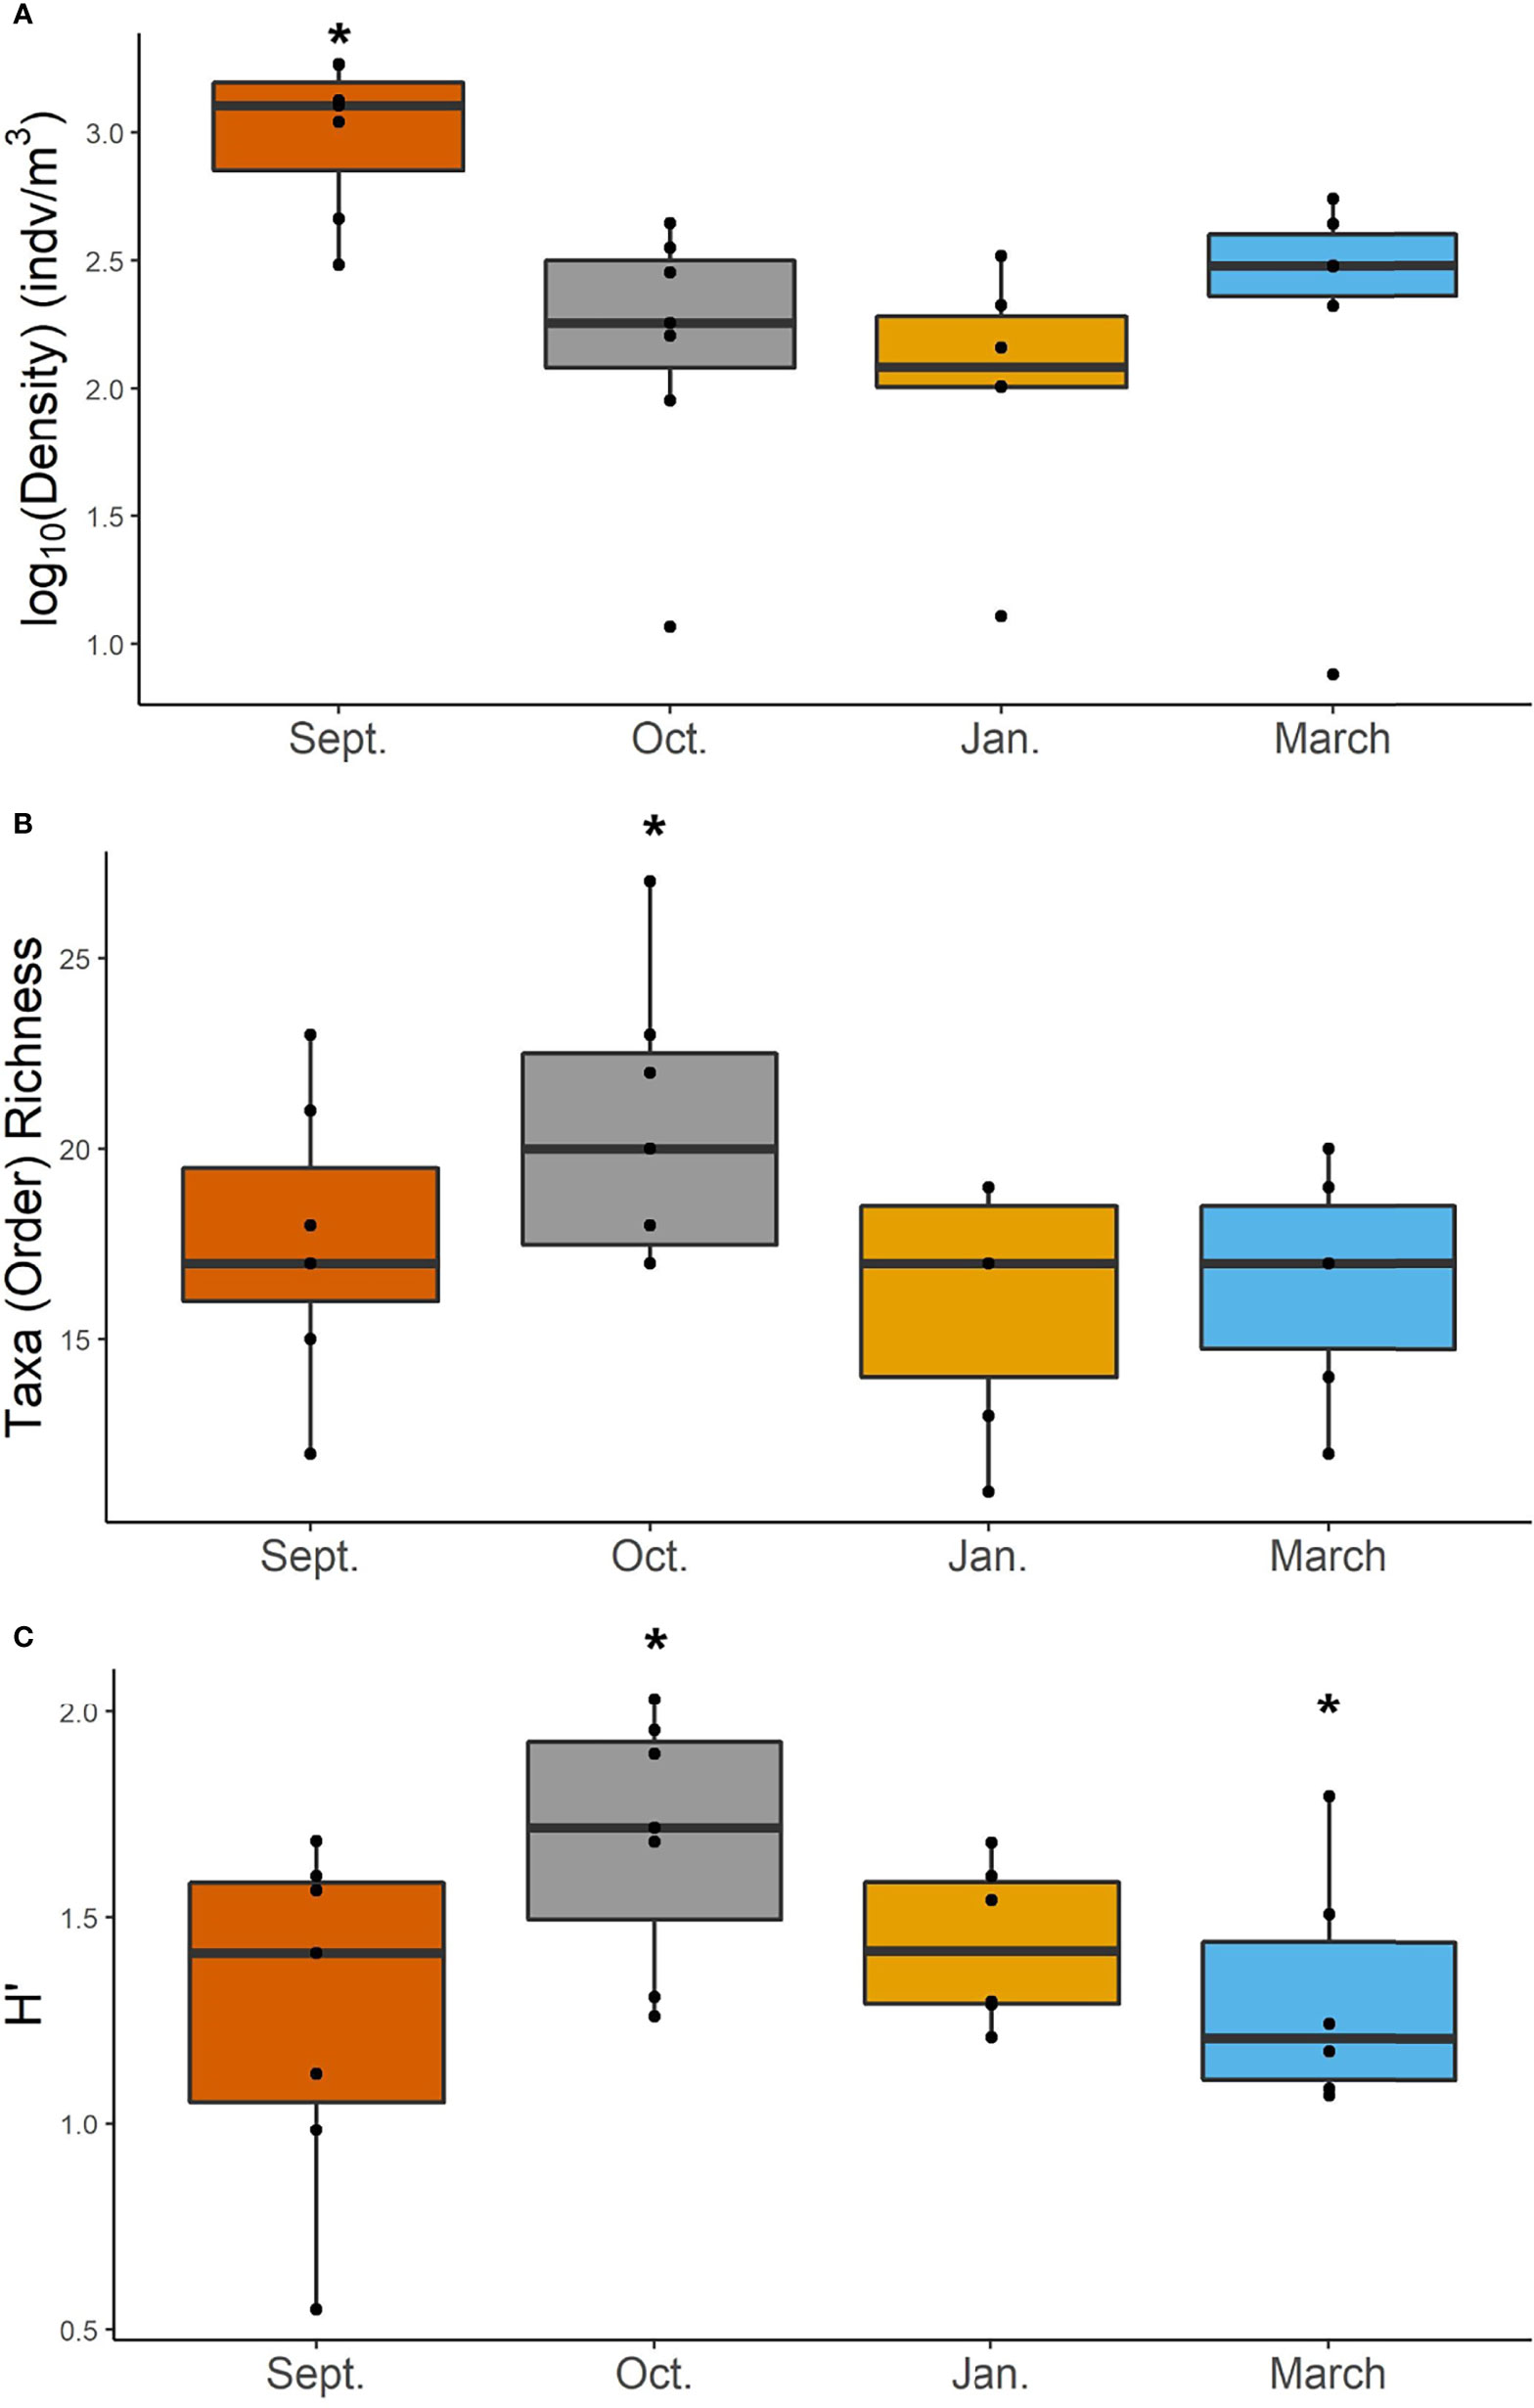
Figure 2 Density (log10 transformed) (A), taxa richness at order (B), and Shannon-Weiner diversity (H′) (C) of mesozooplankton for each cruise. Asterisk denotes groups that are significantly different based on a two-way ANOVA and post-hoc Tukey test. Differences in abundance were determined using a Kruskal–Wallis and pairwise-Wilcox test.
In the original article, there was a mistake in Figure 3 as published. The new PERMANOVA results showed no differentiation with a conservative Bonferroni correction. The corrected Figure 3 appears below.
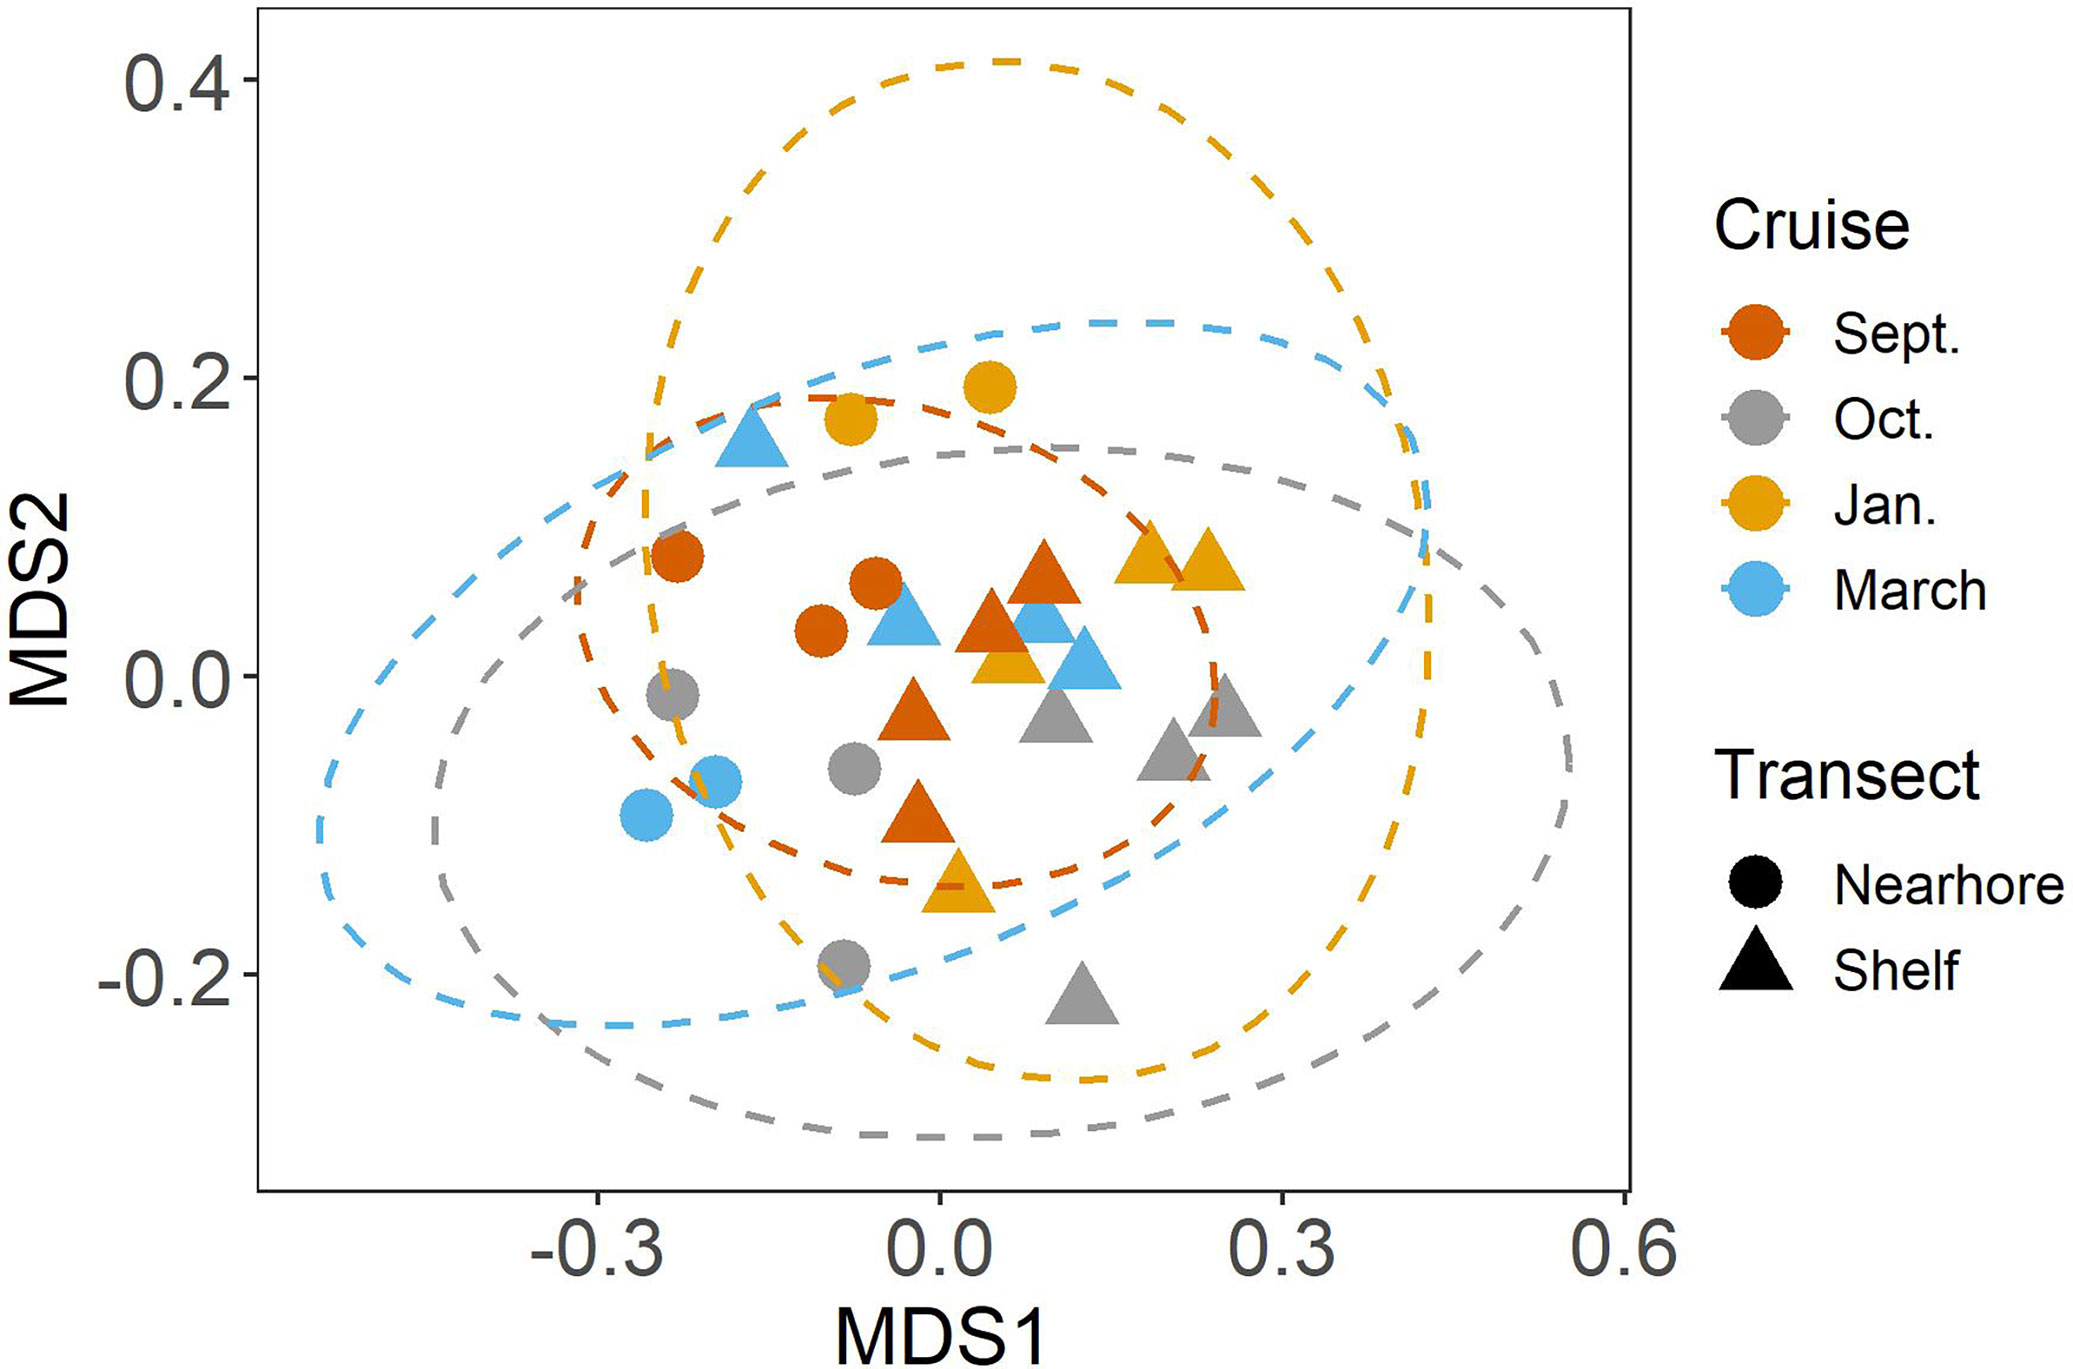
Figure 3 NMDS analysis of mesozooplankton community structure. Colors indicate cruise month. Ellipses represent 95% CI (Solid lines = significant differences in community structure from PERMANOVA, p < 0.05).
In the original article, there was a mistake in Figure 4 as published. The new PERMANOVA results showed no differentiation with a conservative Bonferroni correction. As such, all cruises, rather than just Oct. and March, were compared in the subsequent SIMPER test and displayed in the updated Figure 4.
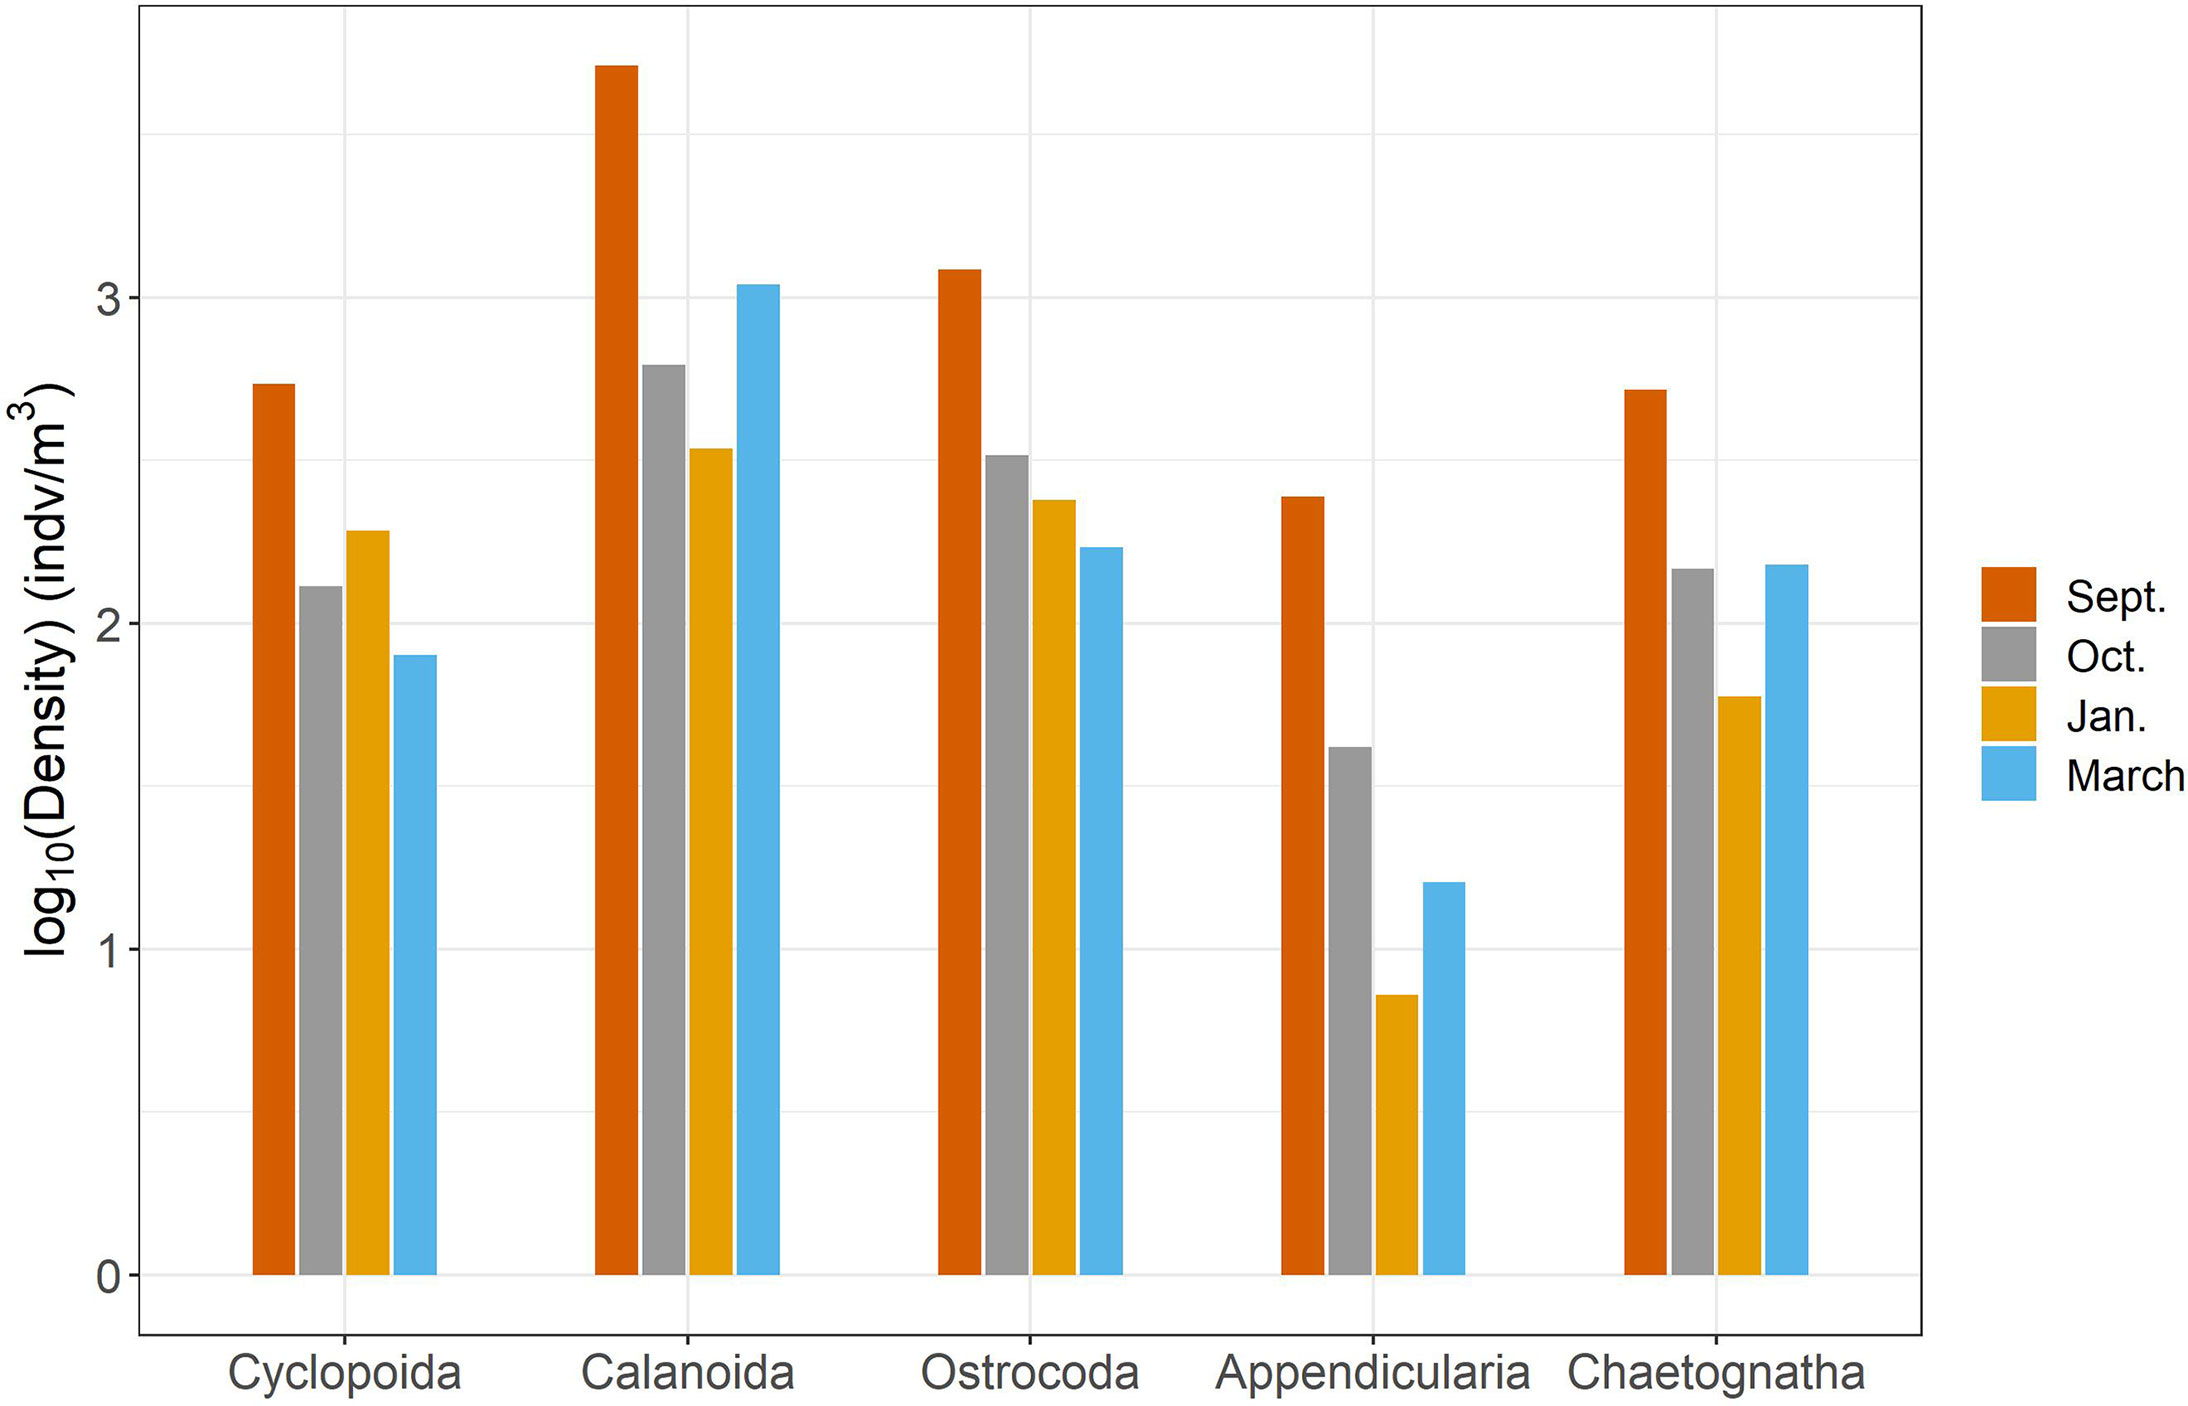
Figure 4 Results of SIMPER analysis between cruises. Top five highest contributing taxa to structural differences were chosen to explain over 50% of the variance.
In the original article, there was a mistake in Figure 5 as published. Abundance values are corrected for Cyclopoida and Calanoida to reflect the new taxonomic distinction. The corrected Figure 5 appears below.
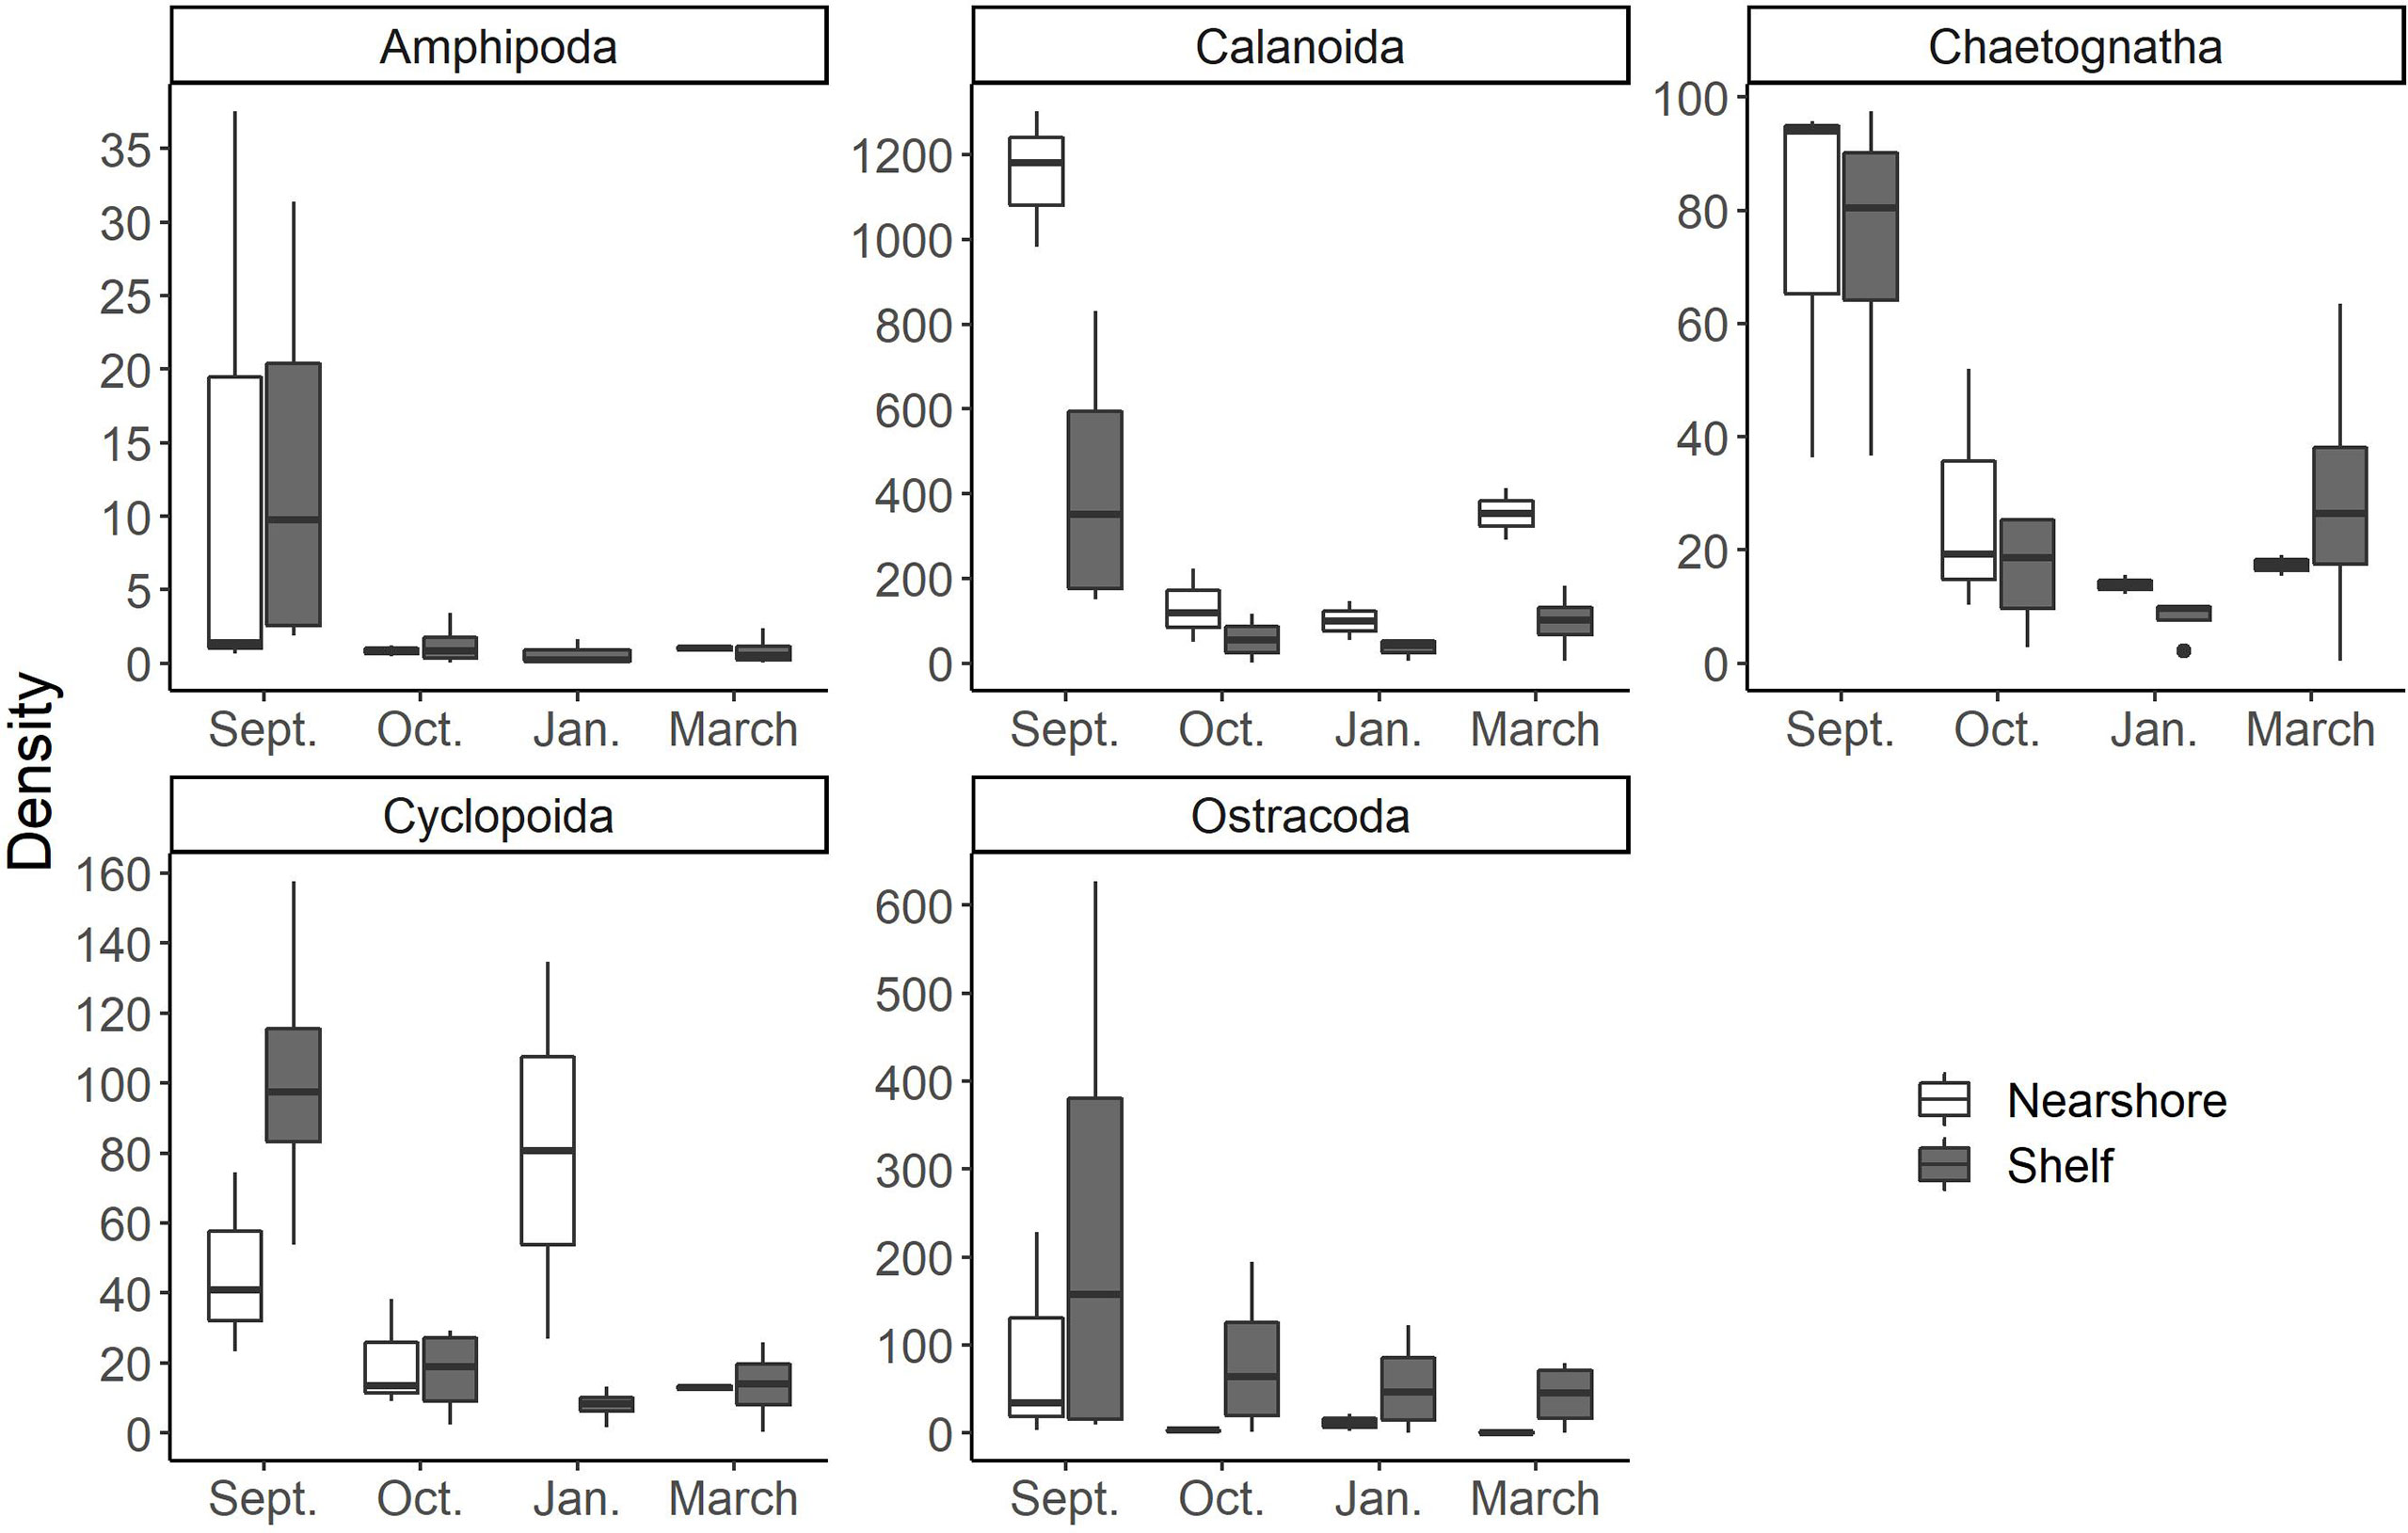
Figure 5 Common mesozooplankton taxa found in larval fish gut contents at the study area according to McAskill et al. (in prep). Note differences in scale of the y axis (density; indv m–3). Nearshore stations are white and shelf stations are gray.
In the original article, there was a mistake in Table 1 as published. A taxonomic group previously sorted into the Cyclopoida taxa, were found to be misidentified and were changed to their proper identification of ‘Calanoida’. As such, all statistics with underlying community data were modified. The new two-way ANOVAs and Kruskall-Wallance values are presented in the updated Table 1. No difference in results were found. The correct Table 1 appears below.
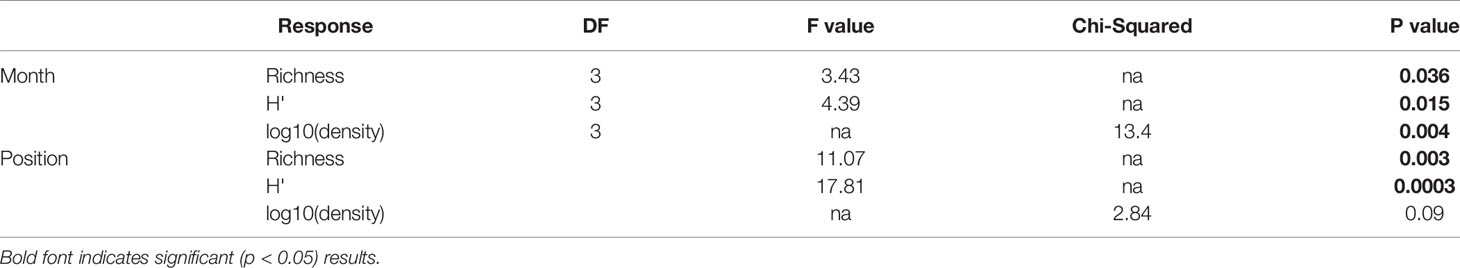
Table 1 Results of two-way ANOVAs (richness, H′) and Kruskal–Wallis test [log10(density)] against cruise and spatial position.
In the original article, there was a mistake in Table 2 as published. The new PERMANOVA values are presented in the updated Table 2. Former significant differences were no longer found in the revised analysis due to a conservative Bonferroni correction. The correct Table 2 appears below.
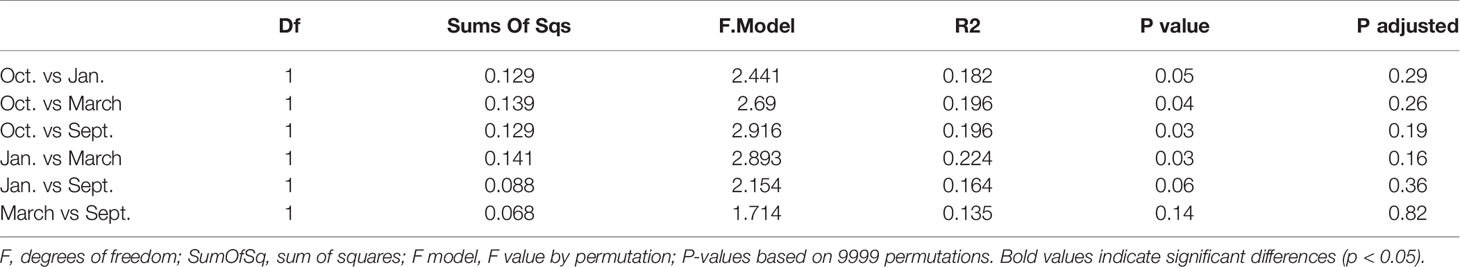
Table 2 Pairwise-PERMANOVA results based on Bray-Curtis dissimilarity on Hellinger standardized densities of zooplankton community structure in relation to cruise.
In the original article, there was a mistake in Table 3 as published. The new BIOENV values are presented in the updated Table 3. The corrected Table 3 appears below.
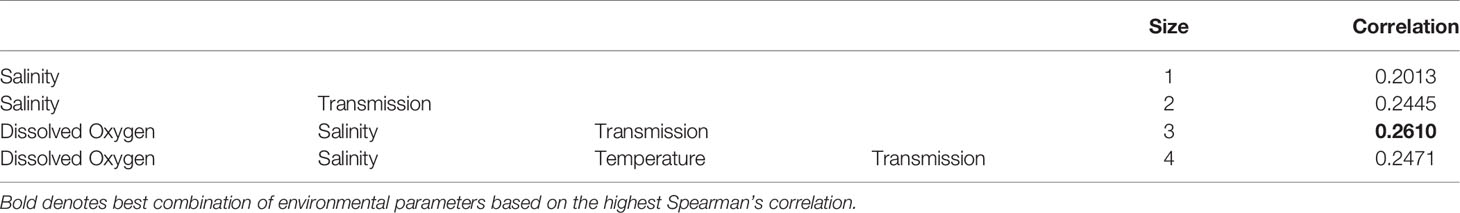
Table 3 Results from BIOENV analysis.
In the original article, there was an error. We found that a taxonomic group within the ‘Cyclopoida’ were erroneously sorted and have been changed to their proper identification of ‘Calanoida’. As such, all analysis were rerun, with no major changes to the conclusions of this paper.
A correction has been made within the Results, paragraph 1 to update the p-values of each Tukey HSD tests:
“Taxa richness was slightly higher in October relative to other months (Table 1 and Figure 2B). A difference in richness was also found between nearshore and shelf stations (Table 1, p = 0.01) with higher richness found at shelf stations (Supplementary Figure S2). Diversity followed a “hump-shaped” over the 6 months sampled. Diversity peaked during October 2017 (Figure 2C) and was found to be statistically different from September (Tukey HSD, p = 0.04) and March 2018 (Tukey HSD, p = 0.02)”.
When reanalyzing the data, we found that the temporal community structure was no longer differentiated at the pairwise level when using a highly conservative test. However, the abundance pattern with peaked September values remains across our major groups. No changes were made to the results about community structure differences in space.
A correction has been made within the Results, paragraph 2:
“The post-hoc pairwise PERMANOVA, using a conservative Bonferroni corrected p-value, could not reveal any differences between the months. Raw p-values indicate differences between each month, except September and March (Table 2), but this should be interpreted carefully as Type I error is likely inflated. Closer inspection of the most abundant taxa revealed that all groups exhibited higher densities during the September cruise relative to other months, with calanoid copepods exhibiting an especially pronounced peak (Figure 4). Nearshore and shelf stations had significantly different mesozooplankton community structures (Df = 1, Sum Sq = 0.28, Pseudo-F = 6.15, R2 = 0.204, p << 0.001) which was driven by ostracods (18%), calanoid copepods, cyclopoid copepods, salps, chaetognaths, and appendicularians (Figure 4). Combined, these six taxa accounted for over half the spatial variation in community structure (55%)”.
A correction has been made within the Results Section, paragraph 2, to update correlation values of the BIOENV analysis:
“The BIOENV analysis revealed that mesozooplankton community structure was related to mean salinity, dissolved oxygen, and transmission (correlation = 0.261, Table 3)”.
The authors apologize for these errors and state that they do not change the scientific conclusions of the article in any way. The original article has been updated.
All claims expressed in this article are solely those of the authors and do not necessarily represent those of their affiliated organizations, or those of the publisher, the editors and the reviewers. Any product that may be evaluated in this article, or claim that may be made by its manufacturer, is not guaranteed or endorsed by the publisher.
The Supplementary Material for this article can be found online at: https://www.frontiersin.org/articles/10.3389/fmars.2022.903054/full#supplementary-material
Keywords: Gulf of Mexico, zooplankton, hurricane, tropical cyclone, flood, community, diversity, disturbance
Citation: Topor ZM, Robinson KL and Turcu A (2022) Corrigendum: Investigating Seasonal Succession Patterns in Mesozooplankton Community Structure Following Hurricane Harvey. Front. Mar. Sci. 9:903054. doi: 10.3389/fmars.2022.903054
Received: 23 March 2022; Accepted: 25 March 2022;
Published: 20 April 2022.
Edited and reviewed by:
Xosé Anxelu G. Morán, Spanish Institute of Oceanography, SpainCopyright © 2022 Topor, Robinson and Turcu. This is an open-access article distributed under the terms of the Creative Commons Attribution License (CC BY). The use, distribution or reproduction in other forums is permitted, provided the original author(s) and the copyright owner(s) are credited and that the original publication in this journal is cited, in accordance with accepted academic practice. No use, distribution or reproduction is permitted which does not comply with these terms.
*Correspondence: Zachary M. Topor, dG9wb3Iuem1AZ21haWwuY29t
Disclaimer: All claims expressed in this article are solely those of the authors and do not necessarily represent those of their affiliated organizations, or those of the publisher, the editors and the reviewers. Any product that may be evaluated in this article or claim that may be made by its manufacturer is not guaranteed or endorsed by the publisher.
Research integrity at Frontiers
Learn more about the work of our research integrity team to safeguard the quality of each article we publish.