- 1Frontiers Science Center for Deep Ocean Multispheres and Earth System, School of Marine Technology, Ocean University of China, Qingdao, China
- 2Laboratory for Regional Oceanography and Numerical Modeling, Qingdao National Laboratory for Marine Science and Technology, Qingdao, China
- 3Department of Information and Files, North China Sea Marine Forecasting Center of State Oceanic Administration, Qingdao, China
Climate change impacts have driven a transformation of the global energy system. The utilization of renewable energies is required to meet energy demands while protecting the environment. Wind-generated waves, carrying energy from the atmosphere, are a possible energy supply. However, global and long-term variability in wave resources due to the effects of climate change remain uncertain. This study quantified the spatiotemporal patterns and availability of global wave power (GWP) based on the ERA5 hourly and monthly reanalysis products, spanning from 1979 to 2020. The most promising wave resources appeared centralized in the westerlies of both hemispheres, and the wave power exhibited a “rich-get-richer” trend in the Southern Ocean, dominating the overall distribution and variability of GWP. Significant seasonal and interannual oscillation trends in GWP were observed, but with little variations on daily and hourly time scales. We found the average GWP in ERA5 products increased by 12.89% suddenly in 1991, mainly caused by the beginning of altimeter assimilation. This also implies the potential underestimation of wave fields in the modeling results before the advent of altimeter. In the altimeter era, annual GWP exhibits (quasi-) decadal oscillation (variation near ±4%), which differed from the monotonous increases previously reported. An analysis and source tracing based on the climate teleconnections indexes revealed that the primary climate driver of the variability was the Southern Annual Mode (r = 0.84). This study provides scientific guidance for wave power utilization and helps deepen our understanding of air-sea interactions.
1 Introduction
Global warming is one of the most significant manifestations of climate change and poses the most immediately foreseeable threat to human existence today. The emissions from fossil fuels consumption are regarded as the soundest indicator for defining climate policies (Rosa and Ribeiro, 2001). Most recently, China has committed to peak carbon dioxide emissions by 2030 and become carbon neutral before 2060 (Mallapaty, 2020). However, reducing the energy-consumption presents the most significant challenge in achieving this commitment because coal is the principal fuel providing more than half (60%) of China’s electricity generation in 2019 (Outlook, 2020). Given that dependencies like this exist worldwide (Moriarty and Honnery, 2012), transitioning away from the dominance of fossil fuels becomes a desperate challenge that all countries must solve. The development and utilization of green energies, to a great extent, is an effective strategy to maintain development while ensuring environmental sustainability.
Renewable energy sources are naturally replenishing, but are generally flow-limited (i.e., an almost infinite duration but a finite amount of energy available per unit of time). In the face of lower cost and often more convenient alternatives, the potentially large scale of renewables only contributes a very small share of world primary energy, with major portions being hydropower and traditional biomass fuels in developing countries (Gross et al., 2003). According to the International Energy Statistics (IEA, 2018), the global renewable generation capacity (non-combustible) amounted to 6,254,184 GWh (23.40% of the total electricity), of which hydropower accounted for 69.15%, wind power for 20.36%, solar power for 9.05%, geothermal energy for 1.42%, and marine energy for just less than 0.02% (e.g., tide, wave, and ocean current generation). The strikingly tiny proportion from marine energy sources reveals the severe lack of marine energy utilization. There are many dynamic phenomena that occur at different spatial-temporal scales within the ocean, each of which represent an enormous energy resource. The aggregate potential of global ocean energy sources is significantly greater than our global electricity consumption (Gross et al., 2003; Melikoglu, 2018). As the two most developed ocean energies, the potential global tidal energy dissipation is estimated at nearly 3.5 TW (Egbert and Ray, 2000), and that of wave energy dissipation is around 3.0 TW (Gregg, 1973), while the world electricity demand is less than 3.0 TW (Sleiti, 2017). However, the progress in exploiting these resources is much slower than conventional energy because the technologies are still mostly under development.
Wind-generated surface gravity waves (hereafter called waves) dominate the ocean wave spectrum in terms of energy and are generally the focus of oceanography studies. Wave energy converters can harvest energy from the potential and kinetic energy of ocean waves. Systems for harvesting utility-scale electrical power from ocean waves were proposed more than 40 years ago (e.g., Salter, 1974). The potential of wave energy resource is promising, especially on the west-facing coasts of westerly zones (latitudes between 35° and 65°) in both hemispheres, but the potential costs of grid integration have limited its application (Scruggs and Jacob, 2009). Limited by the investment costs and technological development, only a small amount of wave power is efficiently extracted near ocean coastlines, islands, or in semi-enclosed basins (Rusu, 2014). However, energy transition goals have increased the demand for renewable energy and helped address the underdeveloped status of these technologies. Indeed, the study and harvest of ocean wave power have become hot topics in oceanography once again. The worldwide wave power potential is estimated at around 29,500 TWh/a (Rusu and Onea, 2018), roughly equivalent to the current global electricity consumption. Besides, previous estimations of global wave power (GWP) have varied widely, ranging from 16,025 to 32,000 TWh/a (e.g., Mo̸rk et al., 2010; Gunn and Stock-Williams, 2012; Reguero et al., 2015). With improvements in ocean modeling and assimilation technology, the spatial distribution and the long-term variability of wave energy can be further clarified. Moreover, these ubiquitous surface waves can be classified into two main types: wind waves (or wind sea, which refers to young waves with short wavelengths that are undergrowth or inequilibrium with the forcing of local wind) and swell (generally formed remotely by storms and propagated thousands of kilometers across the ocean, without momentum input from wind) (e.g., Chen et al., 2002; Hanley et al., 2010). Their role in understanding the redistribution and spatiotemporal variability of GWP need to be further explored.
Surface waves are the most intuitive response of the ocean to the influence of the atmosphere, and they can be seen as a potential climate change indicator (e.g., Young et al., 2011; Jiang and Mu, 2019; Young and Ribal, 2019). The relationship between waves and climate variability has been widely studied, but most studies have focused on historical trends using mean and extreme wave height values. This is evidenced by Patra et al. (2020), who presented a detailed summary on the topic (see details in their Table 1). However, wave heights are not the only parameter influenced by atmospheric forcing, and the wave period and direction should be considered (e.g., Dodet et al., 2010; Hemer et al., 2010). Wave power increases nonlinearly with significant wave height and linearly with peak wave period, so considering both will provide a more comprehensive picture of the response of ocean waves to climate change. Bromirski and Cayan (2015) indicated that wave power exhibited a decreasing trend across the North Atlantic from 2000 to 2008, and was strongly influenced by the North Atlantic Oscillation. Recently, Reguero et al. (2019) found that upper-ocean warming changed the global wave climate and made waves stronger, and observed slow increases in GWP of 0.41% per year from 1948 to 2008. The wave energy estimates for given regions have significant variations in monthly, seasonal, and annual patterns and therefore should not be ignored (e.g., Kamranzad et al., 2013; Bingölbali et al., 2020; Vieira et al., 2020). Wave powers show both regional diversity and long-term uncertainty. Therefore, the spatio-temporal variability of global ocean wave power is reinvestigated based on the new ERA5 data, with the goal of providing scientific guidance for the upcoming renewable energy harvesting boom. The remainder of this paper is organized as follows: A brief description of the data and the methodology of wave power evaluation is provided in section 2. The spatial distribution, temporal variability, and the optimal harvesting zones for ocean wave sources are analyzed and described in section 3. Discussions on the variational mechanism of wave power and conclusions are given in section 4 and 5.
2 Data and method
2.1 ERA5 dataset
The European Center for Medium-Range Weather Forecasts (ECMWF) has a long history of reanalysis in climate monitoring applications. The state-of-the-art product of ERA5 was released in April 2019, replacing the widely used ERA-Interim reanalysis. ERA5 is the fifth generation reanalysis product from the ECMWF for global climate and weather over the past 4 to 7 decades. Besides, ERA5 is highly regarded in the Copernicus Climate Change Service (C3S), which provides a precise and consistent record for a large number of basic climate variations for the C3S Climate Data Store (CDS). See the detail descriptions in Hersbach et al. (2020).
In this study, the hourly and monthly ocean-wave products are used from 1979 to 2020 from CDS, interpolated to a regular grid with a 0.5° × 0.5° spatial resolution. The key parameters include the significant wave height, mean wave period, and mean wave direction, as derived from the wave spectrum. These parameters were classified into three types: wind-sea wave components, swell components, and ensemble waves of both.
2.2 Evaluation of wave power
Wave power Pw (W/m) is defined as the wave energy flux per unit of wave-crest length (Dean and Dalrymple, 1991) and wave energy transport at wave group velocity (cg). Thus, wave power in the wave propagation direction can be written as , where S(f,θ) is the directional spectrum corresponding to the wave frequency (f) and direction (θ). It is simplified as Pw=Ew·cg , with (J/m2) being the averaged wave energy density per unit horizontal area (including the kinetic and potential energy), where Hs is the significant wave height; g=9.80 (m/s2) is the acceleration of gravity; and the ρ=1025 (kg/m3) is the averaged density of the seawater. Furthermore, the wave power (Pw) can be determined from Te and Hs in deep waters as follows:
where Te is the wave energy period. The determination of this parameter was controversial in previous studies. Reguero et al. (2015); Reguero et al. (2019) assumed that Te=α·T01=0.538T01 (s) for the JONSWAP spectrum. While Fairley et al. (2017) and Rusu and Rusu (2021) used the mean wave periods for wave power assessment. As introduced in ECMWF documentation, the mean period (Tm−1) is also known as the energy period (ECMWF, 2020) and can be used in Eq.(1) directly.
Due to the “shoaling” effects, as waves move from the open ocean into shallow water, their crests become steeper, increase in height, and shorten in wavelength. The difference in averaged wave power between deep and shallow water is caused by their group velocities (Izadparast and Niedzwecki, 2011). According to the dispersion relationship in shallow water (ω2=gk2d , where ω is the angular frequency; k is wave number; and the d is the water depth), the group and phase velocities are both determined solely from water depth (), and wave power in shallow waters can be expressed as:
Thus, wave power varies with the square root of water depth and is independent of wave period. Generally, average wavelengths near shore are less than 100 m, and Eq. (2) should be applied when water depths are less than 5 m based on the shallow-water limit () of linear wave theory. Since the grid resolution of ERA5 data is 0.5° (about 55 km in ground distance) and a minimum water depth is 5 m, the impacts of shallow water conditions on wave power estimation are trivial and can be neglected in this study. Additionally, a parametrization scheme of subgrid bathymetry was implemented in ERA5 data to correct the wave propagation and wave energy flux (ECMWF, 2020). Ozkan and Mayo (2019) indicated that the simplified equation potentially underestimates available wave power in coastal Florida compared with the spectral wave power equation. However, only three wave parameters mentioned above were selected in the ERA5 hourly product, but bring a huge amount of data. The computational burdens limit the application of spectral methods in wave power assessment. Altimeter measurements can only provide Hs in the assimilation process of wave modeling (Hersbach et al., 2020), potentially supporting more reliable wave height products. Therefore, Eq. (1) was used to estimate the wave power in this study.
Furthermore, the mean wave direction (oceanographical convention) for wave power analysis is introduced. The mean wave direction was decomposed into zonal and meridional components based on significant wave height (θHs=[Hs·sinθ0,Hs·cosθ0] ) and wave power (θWP=[Pw·sinθ0,Pw·cosθ0] ). Then the climate direction of Hs and Pw could be estimated.
2.3 Related climate teleconnection indexes
Various factors that affect wave power can be used, for example, since surface waves are extensions of past wind forcing, predicted changes in wind patterns can inform future predictions of surface waves. Particularly, the interannual or decadal variations in GWP reflect the long-term climate variability (e.g., Vieira et al., 2020; Reguero et al., 2019), which can be spontaneously connected with the climate teleconnection patterns.
According to geostrophic relationships, pressure gradients determine wind fields (Pedlosky, 1987). Therefore, the climate indexes related to pressure (or wind) are good candidates for analyzing potential relationships with wave power. Chen (2014) has made systematic works on characterizing the spatiotemporal patterns of significant atmospheric oscillations over global oceans. Thus, the following indexes were selected for analysis: The Pacific Decadal Oscillation (PDO; index for Pacific climate variability based on SST anomalies with time scales usually greater than 10 years), the North Atlantic Oscillation (NAO; index based on surface sea-level pressure difference between the subtropical (Azores) high and the subpolar low pressure), the Southern Oscillation (SOI; a bimodal variation index based on sea-level barometric pressure differences between observation stations at Darwin, Australia and Tahiti), the Arctic Oscillation (AO; a climate pattern index characterized by winds circulating counterclockwise around the Arctic at a latitude around 55°N, with a positive phase when colder air masses are confined in polar regions, and a negative phase when southward penetration occurs), and the Southern Annual Mode (SAM; i.e., the Antarctic Oscillation; dependent on atmospheric pressures at the Antarctic and at about 40°S-50°S). Each of these indexes is related to the variability in atmospheric circulation and, therefore, is linked to surface waves via wind forcing. The SAM index was acquired from National Center for Atmospheric Research (NCAR; Marshall, 2003), while all other climate index data were downloaded from the National Oceanic and Atmospheric Administration (NOAA).
3 Spatial-temporal characteristics of ocean wave power
3.1 Spatial distribution
In this section the wave power from total wave, swell, and wind-sea are presented and computed at the global level based on monthly ERA5 data. Figure 1 shows the averaged Hs, Te, and Pw fields, calculated from the total wave fields over the 42-year time interval (1979~2020). The Hs and Pw fields exhibited similar patterns, with higher values concentrated in the latitude bands from 40° to 60° (interior of the prevailing westerlies zones) in both hemispheres, and smaller values mainly appearing in tropical and nearshore areas. The distributions and magnitudes were similar to those obtained by Rusu and Rusu (2021). Te exhibited a pattern that was different from Hs and Pw, with values in the Southern Hemisphere being significantly larger than those in the Northern Hemisphere, and the Pacific and Indian Oceans having larger values than the Atlantic Ocean. The eastern portions of ocean basins generally had larger values than their respective western portions, and some jet-shaped patterns can be seen in Figure 1B, with values exceeding 11 s. Secondly, the maximum value of Pw beyond 100 kW/m was located in the Southern Ocean, and Pw transport occurred in three main directions, as indicated by the arrows in Figure 1C. The pattern in wave power showed deflection southward (northward) upon approaching the Antarctic continent (the lower latitude ocean), and along the path eastward there was a sharp decrease to the east of the Drake Passage (See the schematic arrows in the figure). The tracks leading to the Atlantic Ocean exhibited a lower Pw field than the Indian and Pacific Oceans in the southern hemisphere. As a result, the strongest wave power field (approximately 60 kW/m) of the Atlantic Ocean was in the westerly zone of the Northern Hemisphere. Additionally, there were dominant trends showing ocean waves traveling and transporting energy from high latitude to equatorial regions and towards shores. Meanwhile, Pw values were reduced sharply during the propagating processes, and were only one-third of their original magnitudes after leaving the westerlies (see Figure 1C).
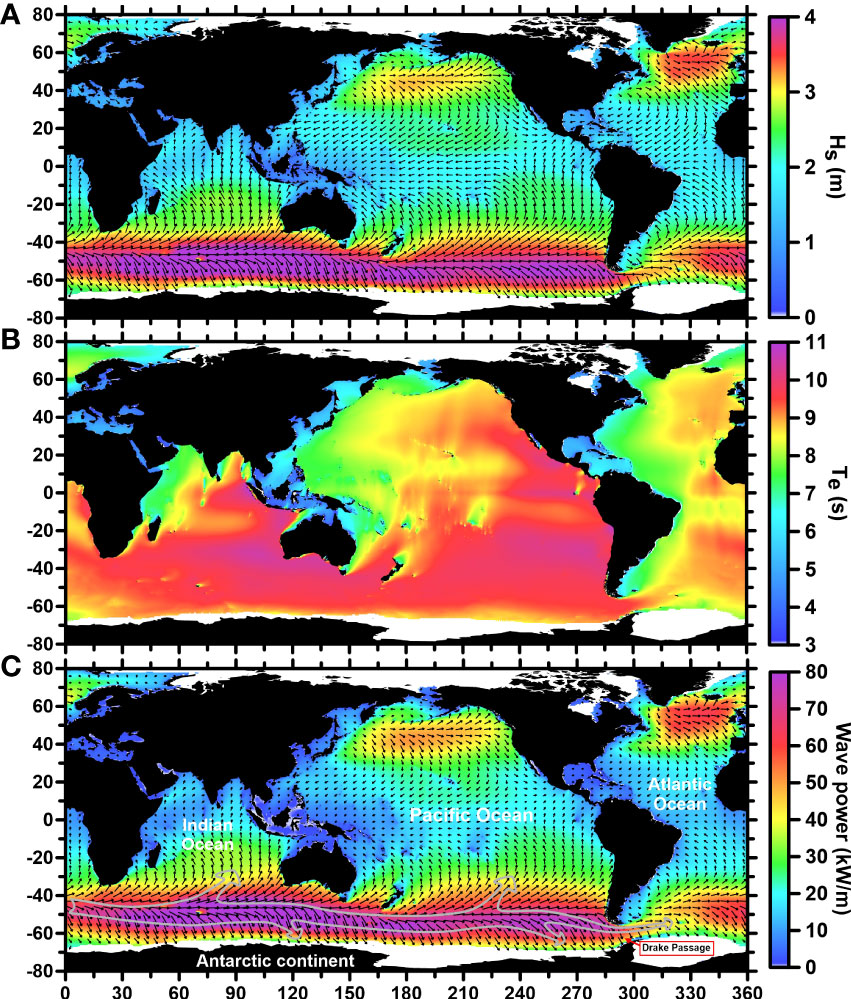
Figure 1 Spatial distributions of averaged total wave fields per 0.5°×0.5° cell from 1979 to 2020. (A–C) Yearly-averaged significant wave height (m), wave energy period (s), and wave power (kW/m) fields. The arrows represent the averaged direction and the magnitude corresponding to the Hs and wave power, respectively.
Studies on global wave power (GWP) have rarely compared swell and wind-sea waves. However, wave parameters integrated from the entire wave spectrum might only provide a limited description of the wavefield (Qian et al., 2019). The swell fields (Figures 2A–C) exhibited the same patterns as the total wave fields (Figures 1A–C), but had slightly larger wave periods and lower significant wave heights (Hs) and wave power (Pw). Wind-sea wave fields exhibit the weakest magnitude of wave parameters (see Figures 2D–F). There was a region with remarkably low Pw values along the equator in the wind-sea field (the white belt zone in Figure 2F), which corresponded to a calm belt near the equator. Furthermore, the transport directions of Pw in the wind-sea field were different from those in the swell field. In particular, all the Hs and Pw in the Southern Ocean moved poleward across the westerlies and approached Antarctica. By comparing the averaged fields of the total waves, swell, and wind-sea, it was found that significant wave energy potential existed in the two zones with prevailing westerlies, and the swell components contributed most of the total wave power.
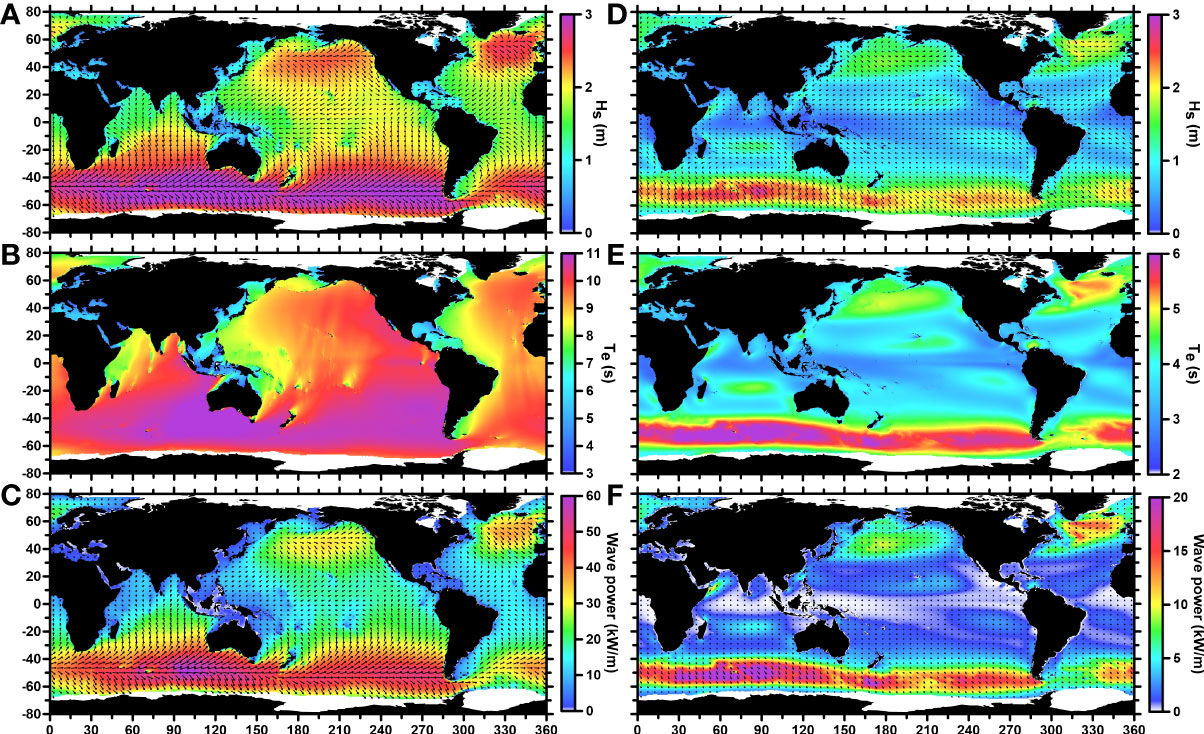
Figure 2 Swell and wind-sea wave components, as in Figure 1. Panels show Hs, Te, and Pw for the (A–C) swell and (D–F) wind-sea wave fields, respectively. Averaged wave powers of less than 1 kW/m are shown as approaching white.
3.2 Temporal variability
The period of surface waves was generally less than twenty seconds. However, they were forced by the seasonal or long-term winds (or wind stress curl) and, as such, carry the atmosphere’s imprint. Analyzing temporal variability is helpful for evaluating Pw and accurately predicting its trends. Thus, the time-series of averaged global wave power (GWP) were calculated at yearly and monthly resolutions using the ERA5 monthly products and at daily and hourly resolutions using the ERA5 hourly products. Note that valid data are used for GWP statistics (e.g., some locations at certain times of the year may experience ice coverage, and only grid with ice-free periods longer than half a year are valid). The results over the 42-year period are shown in Figure 3, and the GWPs of the total wave, swell, and wind-sea are marked by the black, red, and blue lines, respectively.
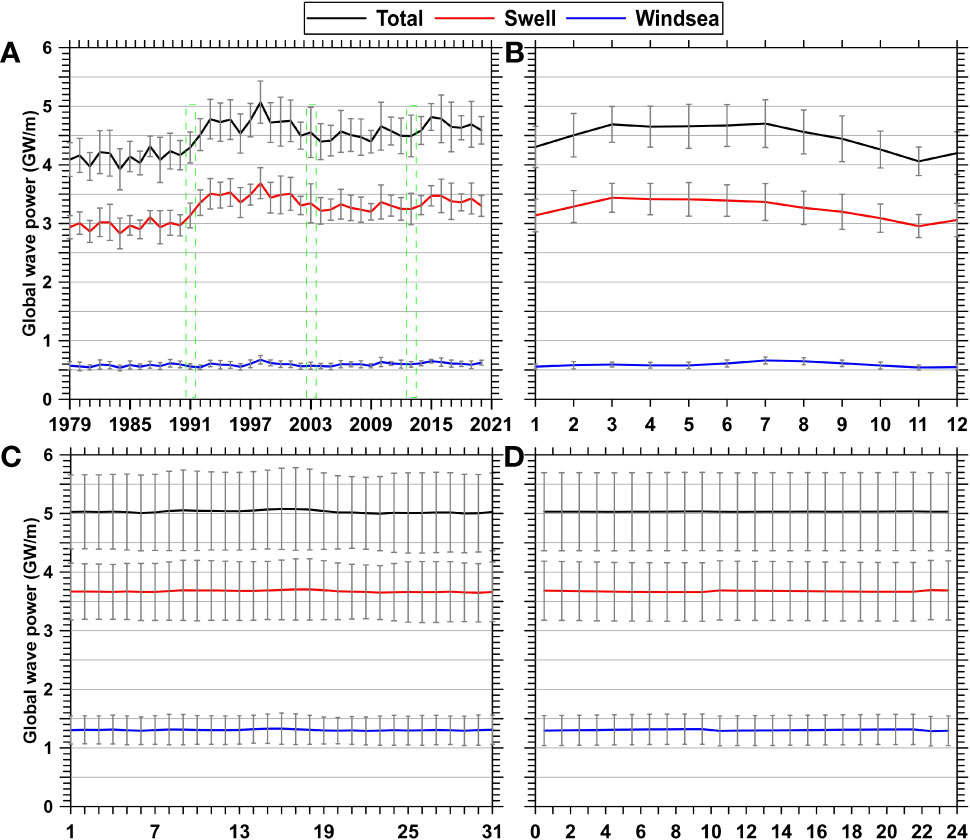
Figure 3 Temporal changes in the averaged wave power calculated globally from 1979 to 2020. (A) Yearly and (B) monthly global wave power based on the monthly product, and (C) daily and (D) hourly global wave power based on the hourly product. The error bars represent the standard deviations.
These results also support that swell components dominate the total GWP, including the trends in magnitudes and variation. One unanticipated finding was that annual GWP (Figure 3A) did not exhibit a steady increase, instead there was a sharp increase after 1991 accompanied by a (quasi) decadal fluctuation. As suggested by Hersbach et al. (2020), the altimeter assimilation of wave information began in 1991, and validation of matched buoy results has also shown much smaller errors (scatter index less than 16%) in the ERA5 products since then. Similar “jump” phenomenon can be found in the results of Reguero et al. (2019); and Muhammed Naseef and Sanil Kumar (2019); which may indicate the intrinsic dependence of contemporary wave models on altimeter assimilation, and potential underestimate wave power or wave fields prior to the appearance of altimeter observations. Validation results with in-situ observations (e.g., Muhammed Naseef and Sanil Kumar, 2019; Wang and Wang, 2021) give us more confidence in the wave model products in the altimeter era. The grey error bars represent the standard deviations, and the longer-term averaged GWPs tended to have lower standard deviations. Interestingly, the variabilities in the total GWP at the inter-annual (Figure 3A) and seasonal (Figure 3B) scales were remarkable, while there was barely any variability at daily and hourly scales (Figures 3C, D). Moreover, the values of the averaged GWP from the monthly product were slightly smaller than from the hourly product. The former fluctuated over the range from 4 to 5 GW/m, while the latter was steady at 5 GW/m. This may have been because the short-term variability in winds resulted in short-term high Pw values in the hourly product, while the process of merging monthly products smoothed out these short-term anomalies.
By focusing on the fluctuating trends in total GWP (Figure 3A), the decadal oscillation phases in the series appear to be separated by years 1991, 2003, and 2014 (marked by the green dotted lines in Figure 3A). Because long-term variability was our primary concern, the distribution of averaged Pw was further compared within the four phases to understand the cause of GWP variation, and their time-averaged fields were shown in Figures 4A–D. There were significant differences in the intensities of Pw among the Southern Ocean (SO), Northern Pacific, and Atlantic oceans (NP and NA), but the mean directions of wave powers were generally similar. Furthermore, Figure 4E shows the positive discrepancy between the averages of years 1992-2003 (Figure 4B) and 1979-1991 (Figure 4A), with a maximum difference that was more than 10 (5) kW/m in the SO (NP and NA). In contrast, a negative discrepancy field (Figure 4F) was obtained when Figure 4C was subtracted from Figure 4B. The wave power reduction in Figure 4F was significantly lower than the increases in wave power in Figure 4E. In short, there was a net increment of GWP during 1979 ~ 2013. Notably, the reduction in wave power in the SO was smaller than those in the Northern Hemisphere basins, which may imply that SO had a larger role in the overall enhancement of total GWP (in Figure 3A) after 1991. Meanwhile, another major positive difference field was produced (not shown) by comparing Figures 4D, C. Furthermore, when looking differences between the four phases, the averaged rates of change in GWP were 12.89%, -3.97%, and 4.05%, respectively. Therefore, the sudden increases, general fluctuations, and decadal oscillations in GWP were quantified in our results. Particularly, accurate simulation of wave fields in the Southern Ocean is the core to improving wave models in the future.
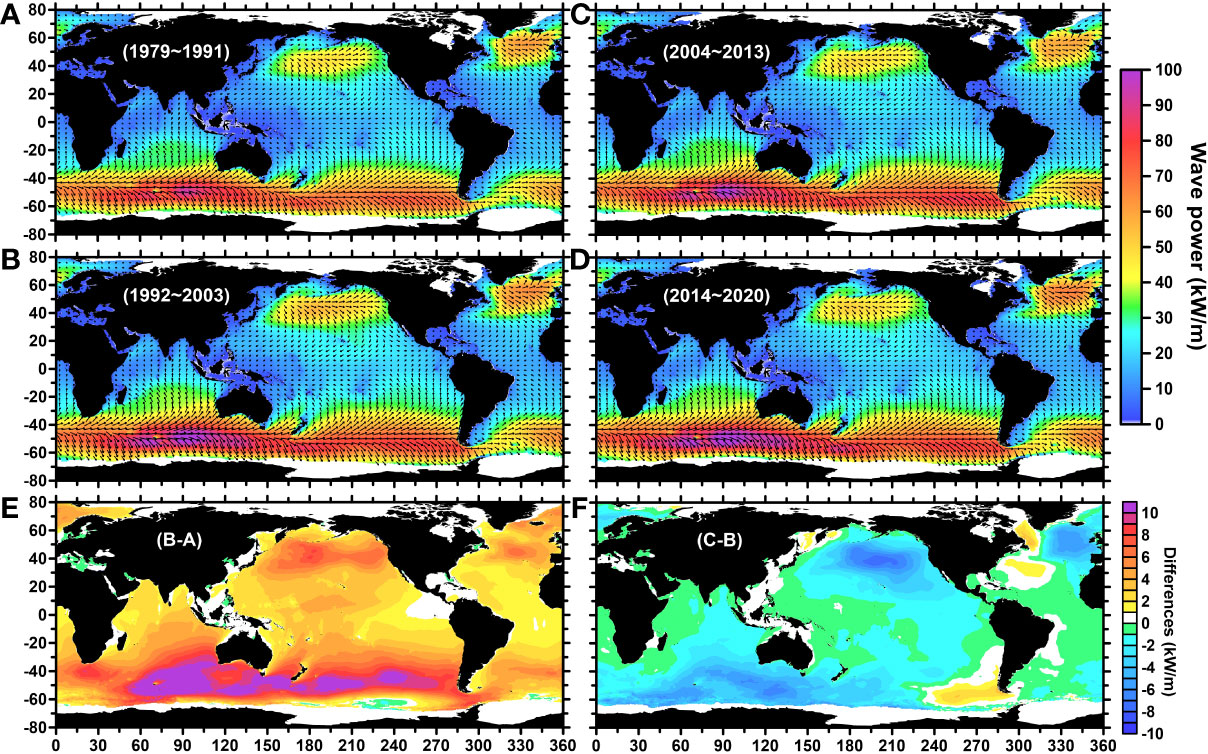
Figure 4 Year-averaged global wave power fields and decadal variability. (A) Averaged wave power from 1979 to 1991, (B) from 1992 to 2003, (C) from 2004 to 2013, and (D) from 2014 to 2020. (E) The averaged differences in wave power between (A) and (B); and (F) the averaged differences in wave power between (C, B).
Additionally, Figure 3B shows evidence of seasonal variation. The maximum GWP values were near 4.7 GW/m in March and July (which likely corresponded to times of high intensity wave action in both hemispheres), while the minimum value was slightly less than 4.1 GW/m in November. Moreover, a slight GWP peak in the wind-sea appeared from June to October. Therefore, the seasonal wave power fields (seasons here correspond to seasons in the Northern Hemisphere) are calculated, as shown in Figure 5. The strongest wave power field occurred in winter (DJF), with extreme values of more than 100 kW/m in the NP and NA (Figure 5A), while this season (i.e., summer in the Southern Hemisphere) had the weakest wave power field in the SO with extreme values remaining below 60 kW/m. In contrast, the weakest wave power field in the Northern Hemisphere (almost below 10 kW/m) occurred in summer (Figure 5C). Notably, the Northern Indian Ocean had the highest Pw field (exceeding 50 kW/m) in the year due to the incoming wave power from the Southern Ocean Swell. The Pw distributions exhibited similar patterns in spring and autumn (i.e., two transition seasons between winter and summer), and there were only slight differences in Pw between the two westerlies.
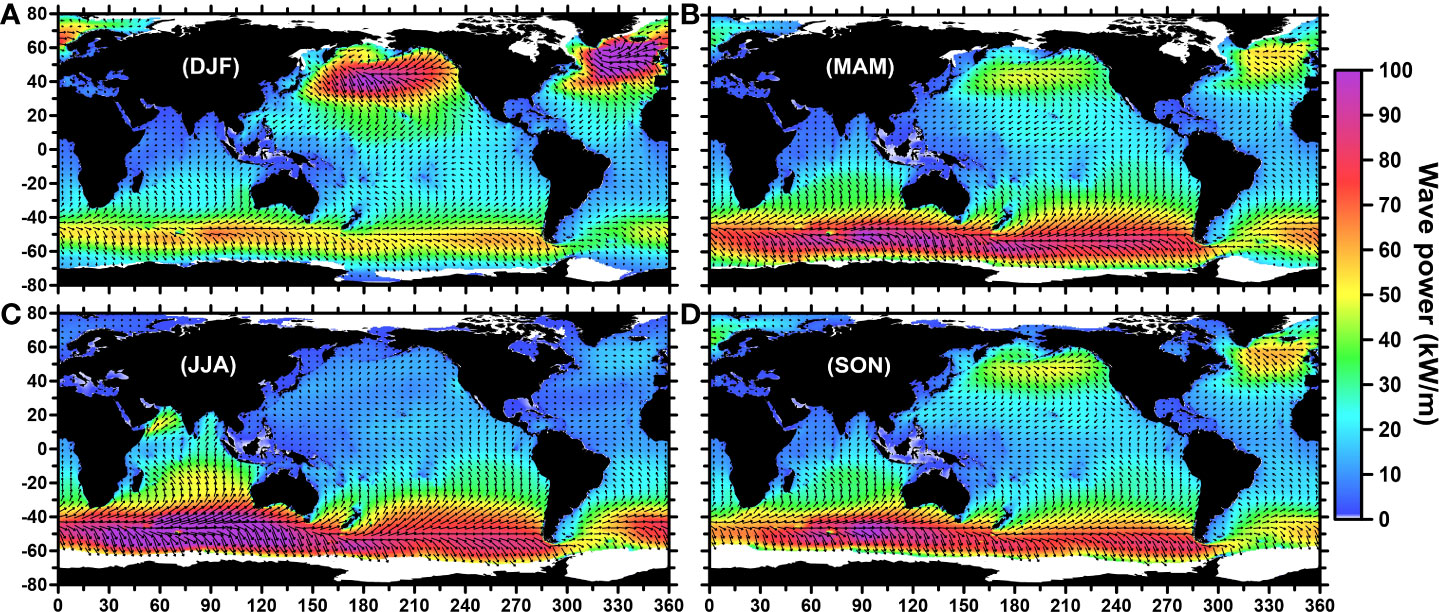
Figure 5 Seasonal distribution of the averaged wave power (seasons correspond to the Northern Hemisphere). (A) Winter (DJF: December, January, February), (B) spring (MAM: March, April, May), (C) summer (JJA: June, July, August), and (D) autumn (SON: September, October, November).
The stability of wave resources is an essential factor for reliable energy harvesting. Thus, the coefficient of variation (standard deviation divided by the mean, ) is calculated within the four seasonal fields. The lowest variabilities in Pw were observed in winter (Figure 6A) and summer (Figure 6C), with CVs lower than 25%, while the highest CV values were mainly concentrated in nearshore areas. However, there was significant variability in Pw in spring (Figure 6B) and autumn (Figure 6D). Specifically, their CVs were higher than 35% in the Northern Hemisphere, while a small variability (lower than 10%) was exhibited in the tropical oceans but the magnitudes of Pw in these oceans were also lower than 10 kW/m (see Figures 5B, D). These results show that the Southern Hemisphere contains more stable wave resources which make it an ideal energy harvesting field.
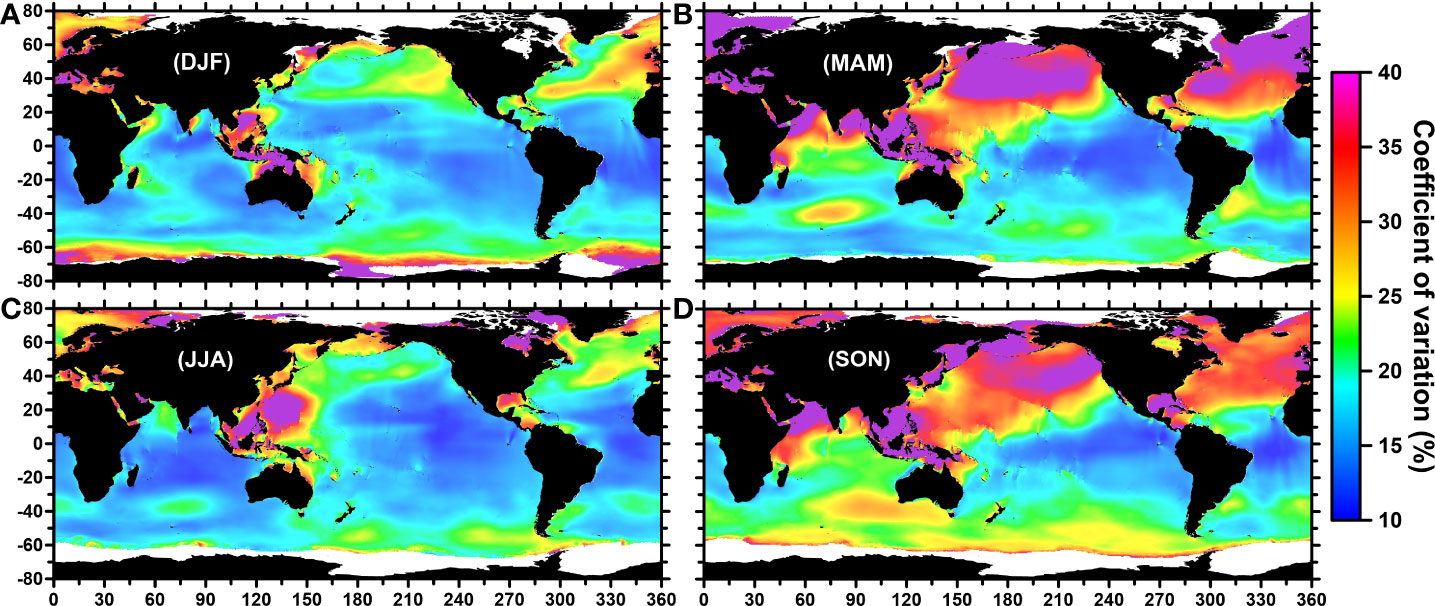
Figure 6 Coefficient of variation of seasonal wave power (seasons correspond to the Northern Hemisphere). (A) Winter (DJF: December, January, February), (B) spring (MAM: March, April, May), (C) summer (JJA: June, July, August), and (D) autumn (SON: September, October, November).
The hourly variation in GWP was rarely trivial, as suggested by Figure 3D. However, it is well understood that the air-temperature differences between day and night can significantly change the wind field which will influence ocean waves. Therefore, to examine the difference between day and night periods, the distributions of wave power during the day (i.e., the local time between 6 am to 6 pm) and night were calculated separately. Figures 7A, B show the day and night wave power distributions. As expected, their patterns were very similar (i.e., the energetic wave power was mainly concentrated in the westerly zones). However, the difference between the day and night distribution produced a novel result, revealing some large-scale “bubble” or wave-like patterns, as shown in Figure 7C, and significant differences were mainly concentrated in higher latitudes. Since this result was obtained by averaging hourly climate data, these spatial scales were too large to be attributed to local noise. Their morphological features were intuitively reminiscent of the widespread eddies or Rossby waves which form in the ocean and atmosphere. These striped patterns also revealed a significant trend of westward intensification or propagation from latitudes ~ ± 40° equatorward, with more divergence patterns in higher latitudes. These patterns may be related to wind stress, and exhibited similar patterns in previous studies (e.g., Chelton et al., 2004). Due to the lack of further evidence and because its dynamic mechanisms were outside of our scope of this study, we supposed this may be a mirror effect imposed on the ocean by atmospheric forcing in the sea-air coupled model of ERA5 products.
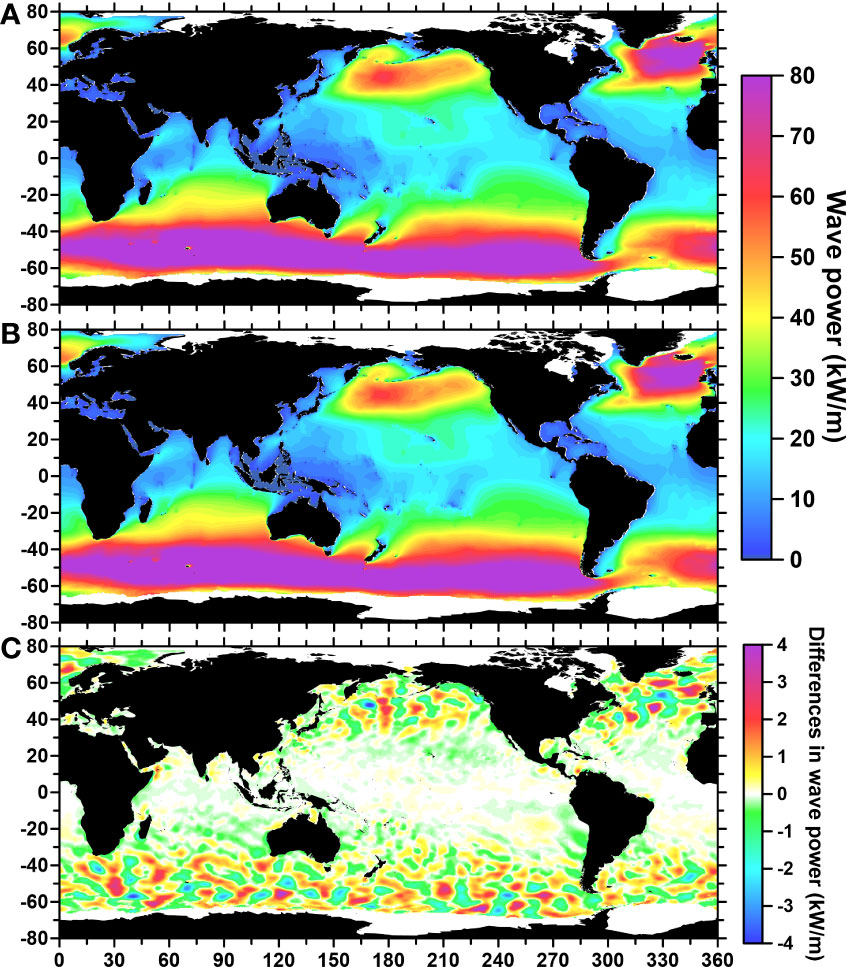
Figure 7 Wave power distribution in the day and night. (A) Day, (B) night, and (C) the differences in wave power between the two.
3.3 Optimal wave power resources
The ultimate goal of studying the spatiotemporal distribution and variability of GWP is to scientifically identify the best strategy for the development and harvesting of ocean wave resources. Therefore, the probability distribution of Pw per 0.5° cell over the 42-year data series with a high temporal resolution is calculated in Figure 8. The probability is also considered as the evaluation of the potential working time of the wave energy converters during which a specific Pw threshold would be met. The low-efficiency region where the probability was less than 0.3 (i.e., the effective working time would be less than 2600 hours in a year) is defined. In contrast, the high-efficiency regions had probabilities greater than 0.8 (i.e., the effective working time is higher than 7,000 hours in a year). Moreover, to identify optimal locations for power generation, water depth must be considered. In nearshore areas, wave energy is dissipated as waves interact with the seabed. However, deploying wave power plants and connecting it to a shore-based power station is often impractical and uneconomical in deeper water conditions. Generally, optimal depths are between 40 and 1000 m, which had large wave periods and amplitudes (Scruggs and Jacob, 2009). Therefore, the 1000 m water depth is marked on the maps with red contours.
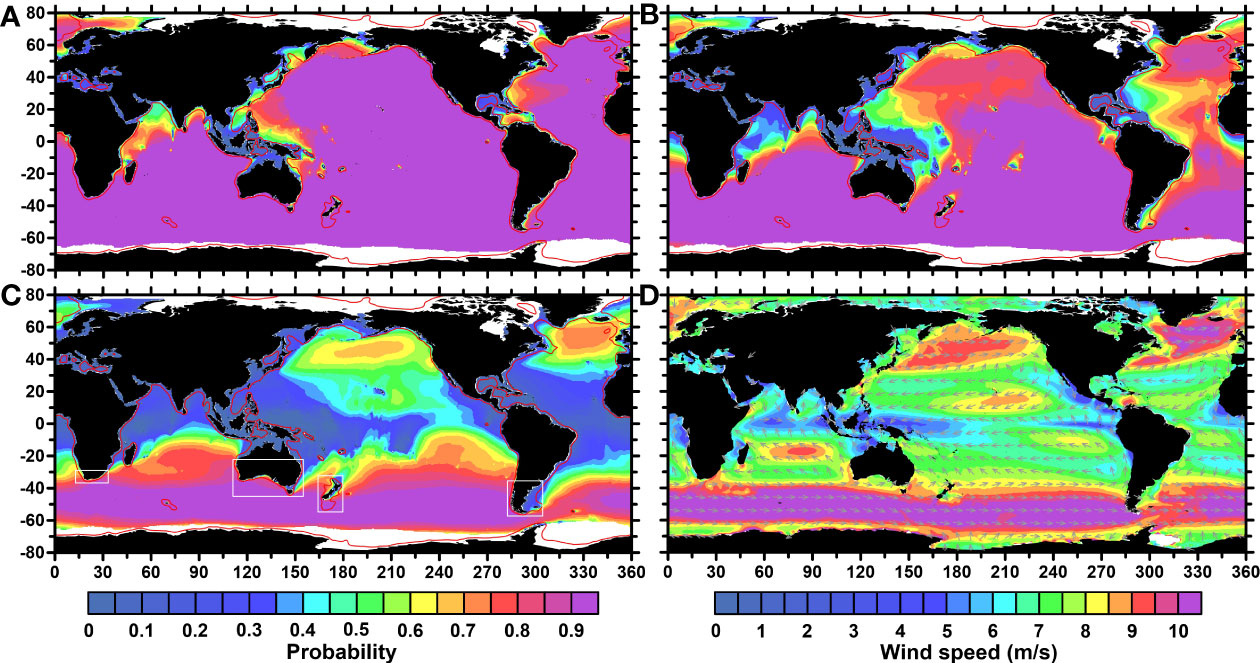
Figure 8 Distributions of the daily wave power and wind speed per 0.5° × 0.5° cell. Probabilities for wave power values great than (A) 5, (B) 10, and (C) 20 kW/m. (D) Averaged wind speeds. The red lines denote water depths contours of 1000 m, while the white rectangles mark regions with high wave power harvesting potential.
As is shown in Figure 8A, the high-efficiency regions covered almost the entire the ocean basins when the criterion of Pw ≥ 5 kW/m was used, except in nearshore areas and oceanic western boundary zones. In particular, China’s most promising wave resources were apparent in the South China Sea where the probability was near 0.55, indicating that the working time would be approximately 4800 hours/year. Furthermore, the highly-effective regions were significantly reduced in the Northern Hemisphere when a threshold of 10 kW/m was used (Figure 8B), while there were only a few differences in the Southern Hemisphere. Notably, only the westerlies of the Southern Hemisphere were identified as high-efficiency regions when the criterion was increased to 20 kW/m (Figure 8C). The nearshore areas close to the Southern Ocean are geographically predisposed to obtaining more wave energy. According to the optimized criteria for water depth, effective working times, and wave power, regions with high potential for wave energy harvesting are identified (white rectangles in Figure 8C). These included the southern coast of Africa, the western and southern coasts of Australia, the nearshore area of New Zealand, and the southern coast of South America. These regions were all close to the westerlies of the Southern Ocean, benefitting from their proximity to the significant wind fields therein (Figure 8D). Therefore, these regions are optimal for the efficient harvest of wave and wind energies simultaneously.
4 Variational mechanism of global wave power
When identifying regions to invest in for wave energy harvesting, anticipating how climate variability will affect the prospects or predictability of GWP is critical. In addition to altimeter assimilation, the widely mentioned climate change is also highly expected to explain part of variation trends of GWP, and should be the dominate factor in the altimeter era. Figure 3A provides insight into the potentially interannual or decadal variability factors affecting the wave power.
The correlation coefficients between the climate pattern indexes and the global wave power anomaly (GWPA; yearly GWP minus climate average GWP) were calculated over the entire 42-year time series. A 5-year running mean was adopted for removing small-scale variability (Figure 9), and the decadal-oscillation trends were apparent in the GWPA time series. According to the statistical analyses, the SAM (PDO) Index and GWPA had the largest positive (negative) correlation coefficient at 0.84 (-0.57), as shown in Figure 9A. Furthermore, to evaluate the different roles of the climate patterns in modulating local ocean basins, the coefficients were independently estimated from the wave power anomalies (WPA) of the Southern Ocean (40°S ~80°S), North Pacific Ocean (130°E~250°E), and Northern Atlantic Ocean (310°E~360°E), and the results are shown in Figure 9B. The correlation coefficients (r) between the SAM index and WPA were the largest in all three basins, with values of 0.86, 0.72, and 0.61, respectively. The PDO index had the strongest negative correlation (r = -0.51) with WPA in the SO, which was consistent with the strong negative correlation between PDO and GWPA (Figure 9A). However, r is only equal to -0.25 in the northern Pacific Ocean, which indicated that the role of PDO was weaker in the wave climates of the northern Pacific Ocean. The AO index and WPA had the strongest correlation (r = 0.56) in the Northern Atlantic Ocean, but it was irrelevant to the WPA in the Northern Pacific Ocean (r = 0.06). Therefore, the SAM index was most closely related to the variability in wave power in all three oceans, while the AO index was vital for Pw in the Northern Atlantic Ocean. The PDO index was negatively correlated with wave power and better correlated with WPA in the Southern Ocean (r = -0.51). Therefore, wave power seemed to bridge SAM and other climate indexes. Clearly, local climate variability can drive the wave power variability throughout the oceans, which means that the GWP can also be seen as an effective indicator of climate change.
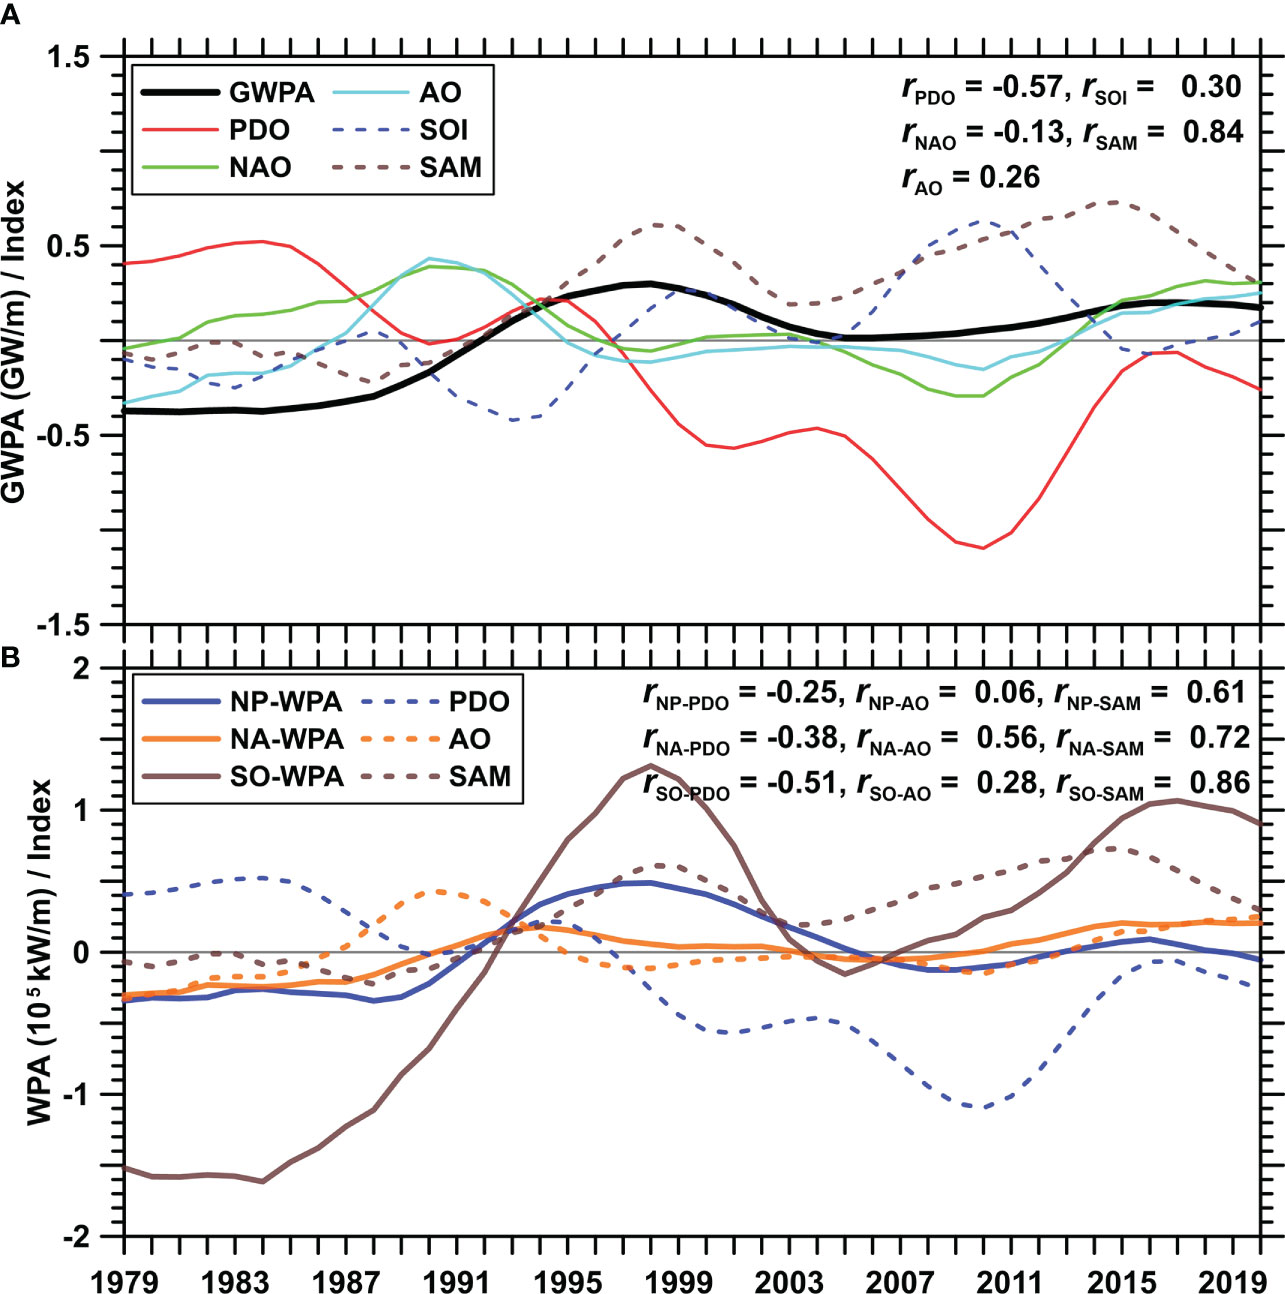
Figure 9 Time series of the wave power anomaly and the climate variability indexes (PDO, Pacific Decadal Oscillation; NAO, North Atlantic Oscillation; AO, Arctic Oscillation; SOI, Southern Oscillation Index; SAM, Southern Annular Mode). (A) For annual global wave power anomaly, (B) for wave power anomaly in the North Pacific (NP, 130°E~250°E), North Atlantic (NA, 310°E~360°E), and Southern Oceans (SO, 40°S~80°S). Their correlation coefficients are shown in the panels.
Since the station-based SAM index is derived by the analyzing the zonal pressure differences between twelve stations at around 65°S and 40°S (Marshall, 2003), it is an actual indicator independent from model products and altimeter observations. These data supported that the transformation of the SAM index from negative to positive was another reason for the sharp increase in GWP after 1991. In the subsequent time series, the SAM index maintained a positive (quasi-) decadal oscillating trend, forming the variation patterns of GWP. Meanwhile, the weak influences of other climate indexes may also modulate the oscillating trends (see in Figure 8A). Furthermore, the GWPA is predicted to maintain its downward trend after 2020, and the SAM index appears close to the trough of an oscillation, as suggested by Figure 9, which means that the GWP may soon reach the lowest level of almost two decades.
5 Conclusions
The urgent need to reduce carbon emissions has recently promoted an upsurge of research into renewable energies. Oceanic resources are abundant and diversified in composition, but the investment and utilization rates are remarkably low. As the most ubiquitous dynamic ocean phenomenon, wave energy has been identified as a good energy harvesting resource. The GWP distribution and variability are systematically analyzed based on recent ERA5 reanalysis data with hourly and monthly temporal resolutions. The main conclusions were as follows:
1) Global wave power is mainly centralized in two westerly zones (latitude bands of 40°~60° in both hemispheres), and swell dominates the magnitude (approximately to 70%) and distribution characteristics of total wave energy. With global warming, potential wave power in the Southern Ocean is growing (like the economic term “rich-get-richer”), and the composited information on the direction of wave power confirms its importance to the GWP distribution.
2) Wave power exhibits seasonal characteristics. The strongest wave power (greater than 100 kW/m) occur during the local winter, while the weakest (less than 10 kW/m in the Northern Hemisphere and less than 60 kW/m in the Southern Hemisphere) occur in the local summer. These two seasons also correspond to the lowest variabilities in wave power, generally less than 25%. Besides, the differences in wave power between day and night revealed novel wave-like patterns, implicating a mirroring effect in the oceanic response to atmospheric forcing.
3) A decadal oscillation was apparent in the GWP, rather than a monotonously increasing trend as observed in previous studies. The start of altimeter assimilation is an intrinsic cause of the abrupt increase of GWP values in ERA5 products by 12.89% in 1991. Then, a quasi-decadal period variation of wave power (variation near ±4%) can be revealed by more reliable model products in the altimeter era. Furthermore, the potentially relevant climate teleconnection indexes (PDO, NAO, AO, SOI, and SAM) are introduced to explain the variability rule of GWP. It is found that SAM had the strongest positive correlation (0.84) with GWP, and the transformation in the SAM index from negative to positive value was the main climate driver behind the sharp increase of GWP after 1991. Also, SAM was highly correlated with wave power in other local basins, implicating ocean waves as a potential mediator between the climate teleconnection patterns. Accurate simulation of the wave field in the Southern Ocean is central to the improvement of the wave model.
A better understanding of the spatiotemporal variability in GWP can help inform wave energy system design and large-scale deployment. Presently, the potential of global wave energy resources remains high but underdeveloped. In addition to paying more attention to the untapped energy reserve of ocean waves, improving funding for wave energy extraction technology is fundamental to its advancement. Besides, achieving high-accuracy simulations, independent of concurrent observational data, is still highly expected in the future ocean wave modelling.
Data availability statement
The original contributions presented in the study are included in the article/supplementary material. Further inquiries can be directed to the corresponding author. The data used to support the findings of this study are available as follows. The ERA5 data for this study can be found in the Copernicus Climate Change Service (C3S, https://cds.climate.copernicus.eu/). The wind fields can be obtained from the Remote Sensing System (https://www.remss.com). The climate teleconnection indexes can be downloaded from the National Oceanic and Atmospheric Administration (NOAA, https://www.ncdc.noaa.gov/teleconnections/) and National Center for Atmospheric Research (NCAR, https://climatedataguide.ucar.edu/climate-data).
Author contributions
CC performed methodology, software, validation, data curation, visualization, and writing of the original draft. GC contributed to conceptualization, and supervision. CQ performed methodology, validation, and investigation. JS performed validation and review. All authors contributed to the article and approved the submitted version.
Funding
This research was jointly supported by the Marine S & T Fund of Shandong Province for National Laboratory for Marine Science and Technology (Qingdao) (No. 2022QNLM050301-1), the National Natural Science Foundation of China (Grant No. 41906182), and Open Funding Project of Shandong Provincial Key Laboratory of Marine Ecology and Environment and Disaster Prevention and Mitigation (No. 201901).
Conflict of interest
The authors declare that the research was conducted in the absence of any commercial or financial relationships that could be construed as a potential conflict of interest.
Publisher’s note
All claims expressed in this article are solely those of the authors and do not necessarily represent those of their affiliated organizations, or those of the publisher, the editors and the reviewers. Any product that may be evaluated in this article, or claim that may be made by its manufacturer, is not guaranteed or endorsed by the publisher.
References
Bingölbali B., Jafali H., Akpınar A., Bekiroğlu S. (2020). Wave energy potential and variability for the south west coasts of the black Sea: The WEB-based wave energy atlas. Renew. Energy 154, 136–150. doi: 10.1016/j.renene.2020.03.014
Bromirski P. D., Cayan D. R. (2015). Wave power variability and trends across the north Atlantic influenced by decadal climate patterns. J. Geophys. Res.: Oceans 120, 3419–3443. doi: 10.1002/2014jc010440
Chelton D. B., Schlax M. G., Freilich M. H., Milliff R. F. (2004). Satellite measurements reveal persistent small-scale features in ocean winds. Science 303, 978–983. doi: 10.1126/science.1091901
Chen G. (2014). Revisit to atmospheric oscillations over global oceans: a combined climatology/modality approach. Int. J. Climatol. 34, 2715–2729. doi: 10.1002/joc.3870
Chen G., Chapron B., Ezraty R., Vandemark D. (2002). A global view of swell and wind sea climate in the ocean by satellite altimeter and scatterometer. J. Atmospheric Oceanic Technol. 19, 1849–1859. doi: 10.1175/1520-0426(2002)019<1849:Agvosa>2.0.Co;2
Dean R. G., Dalrymple R. A. (1991). Water wave mechanics for engineers and scientists Vol. 2 (Singapore: World Scientific Publishing Co. Pte.).
Dodet G., Bertin X., Taborda R. (2010). Wave climate variability in the north-East Atlantic ocean over the last six decades. Ocean Model. 31, 120–131. doi: 10.1016/j.ocemod.2009.10.010
ECMWF (2020) IFS documentation-Cy47r1 "Part VII: ECMWF WAVE MODEL". e. coli. Available at: https://www.ecmwf.int/node/19751 (Accessed June 30, 2020).
Egbert G. D., Ray R. D. (2000). Significant dissipation of tidal energy in the deep ocean inferred from satellite altimeter data. Nature 405, 775–778. doi: 10.1038/35015531
Fairley I., Smith H. C. M., Robertson B., Abusara M., Masters I. (2017). Spatio-temporal variation in wave power and implications for electricity supply. Renew. Energy 114, 154–165. doi: 10.1016/j.renene.2017.03.075
Gross R., Leach M., Bauen A. (2003). Progress in Renew. energy. Environ. Int. 29, 105–122. doi: 10.1016/s0160-4120(02)00130-7
Gunn K., Stock-Williams C. (2012). Quantifying the global wave power resource. Renew. Energy 44, 296–304. doi: 10.1016/j.renene.2012.01.101
Hanley K. E., Belcher S. E., Sullivan P. P. (2010). A global climatology of wind–wave interaction. J. Phys. Oceanogr. 40, 1263–1282. doi: 10.1175/2010jpo4377.1
Hemer M. A., Church J. A., Hunter J. R. (2010). Variability and trends in the directional wave climate of the southern hemisphere. Int. J. Climatol. 30, 475–491. doi: 10.1002/joc.1900
Hersbach H., Bell B., Berrisford P., Hirahara S., Horányi A., Muñoz-Sabater J., et al. (2020). The ERA5 global reanalysis. Q. J. R. Meteorol. Soc. 146, 1999–2049. doi: 10.1002/qj.3803
IEA (2018) International energy agency. data and statistics. Available at: https://www.iea.org/data-and-statistics/.
Izadparast A. H., Niedzwecki J. M. (2011). Estimating the potential of ocean wave power resources. Ocean Eng. 38, 177–185. doi: 10.1016/j.oceaneng.2010.10.010
Jiang H., Mu L. (2019). Wave climate from spectra and its connections with local and remote wind climate. J. Phys. Oceanogr. 49, 543–559. doi: 10.1175/jpo-d-18-0149.1
Kamranzad B., Etemad-shahidi A., Chegini V. (2013). Assessment of wave energy variation in the Persian gulf. Ocean Eng. 70, 72–80. doi: 10.1016/j.oceaneng.2013.05.027
Mallapaty S. (2020). How China could be carbon neutral by mid-century. Nature 586, 482–483. doi: 10.1038/d41586-020-02927-9
Marshall G. J. (2003). Trends in the southern annular mode from observations and reanalyses. J. Climate 16, 4134–4143. doi: 10.1175/1520-0442(2003)016<4134:Titsam>2.0.Co;2
Melikoglu M. (2018). Current status and future of ocean energy sources: A global review. Ocean Eng. 148, 563–573. doi: 10.1016/j.oceaneng.2017.11.045
Mo̸rk G., Barstow S., Kabuth A., Pontes M. T. (2010). “Assessing the global wave energy potential,” 29th International Conference on Ocean, Offshore and Arctic Engineering, Vol. 3. doi: 10.1115/OMAE2010-20473
Moriarty P., Honnery D. (2012). What is the global potential for Renewable energy? Renew. Sustain. Energy Rev. 16, 244–252. doi: 10.1016/j.rser.2011.07.151
Muhammed Naseef T., Sanil Kumar V. (2019). Climatology and trends of the Indian ocean surface waves based on 39-year long ERA5 reanalysis data. Int. J. Climatol. 40, 979–1006. doi: 10.1002/joc.6251
Outlook E. (2020) International energy outlook 2020. e. coli. Available at: https://www.eia.gov/outlooks/ieo/section_issue_Asia.php (Accessed October 14, 2020).
Ozkan C., Mayo T. (2019). The Renewable wave energy resource in coastal regions of the Florida peninsula. Renew. Energy 139, 530–537. doi: 10.1016/j.renene.2019.02.090
Patra A., Min S. K., Seong M. G. (2020). Climate variability impacts on global extreme wave heights: Seasonal assessment using satellite data and ERA5 reanalysis. J. Geophys. Res.: Oceans 125(12), e2020JC016754. doi: 10.1029/2020jc016754
Qian C., Jiang H., Wang X., Chen G. (2019). Climatology of wind-seas and swells in the China seas from wave hindcast. J. Ocean Univ. China 19, 90–100. doi: 10.1007/s11802-020-3924-4
Reguero B. G., Losada I. J., Méndez F. J. (2015). A global wave power resource and its seasonal, interannual and long-term variability. Appl. Energy 148, 366–380. doi: 10.1016/j.apenergy.2015.03.114
Reguero B. G., Losada I. J., Mendez F. J. (2019). A recent increase in global wave power as a consequence of oceanic warming. Nat. Commun. 10, 205. doi: 10.1038/s41467-018-08066-0
Rosa L. P., Ribeiro S. K. (2001). The present, past, and future contributions to global warming of CO2 emissions from fuels. Climatic Change 48, 289–308. doi: 10.1023/A:1010720931557
Rusu E. (2014). Evaluation of the wave energy conversion efficiency in various coastal environments. Energies 7, 4002–4018. doi: 10.3390/en7064002
Rusu E., Onea F. (2018). A review of the technologies for wave energy extraction. Clean Energy 2, 10–19. doi: 10.1093/ce/zky003
Rusu L., Rusu E. (2021). Evaluation of the worldwide wave energy distribution based on ERA5 data and altimeter measurements. Energies 14 (2), 394. doi: 10.3390/en14020394
Scruggs J., Jacob P. (2009). Engineering. harvesting ocean wave energy. Science 323, 1176–1178. doi: 10.1126/science.1168245
Sleiti A. K. (2017). Tidal power technology review with potential applications in gulf stream. Renew. Sustain. Energy Rev. 69, 435–441. doi: 10.1016/j.rser.2016.11.150
Vieira F., Calvacante G., Campos E., Taveira-Pinto F. (2020). Wave energy flux variability and trend along the United Arab Emirates coastline based on a 40-year hindcast. Renew. Energy 160, 1194–1205. doi: 10.1016/j.renene.2020.07.072
Wang J., Wang Y. (2021). Evaluation of the ERA5 significant wave height against NDBC buoy data from 1979 to 2019. Mar. Geodesy 45, 151–165. doi: 10.1080/01490419.2021.2011502
Young I. R., Ribal A. (2019). Multiplatform evaluation of global trends in wind speed and wave height. Science 364, 548–552. doi: 10.1126/science.aav9527
Keywords: renewable energy, ocean wave power, spatiotemporal variability, decadal oscillation, climate teleconnections
Citation: Cao C, Chen G, Qian C and Shang J (2022) Spatiotemporal variability and climate teleconnections of global ocean wave power. Front. Mar. Sci. 9:900950. doi: 10.3389/fmars.2022.900950
Received: 21 March 2022; Accepted: 22 August 2022;
Published: 09 September 2022.
Edited by:
Bahareh Kamranzad, Kyoto University, JapanReviewed by:
Francisco Taveira-Pinto, University of Porto, PortugalTalea L. Mayo, Emory University, United States
Ian Young, The University of Melbourne, Australia
Copyright © 2022 Cao, Chen, Qian and Shang. This is an open-access article distributed under the terms of the Creative Commons Attribution License (CC BY). The use, distribution or reproduction in other forums is permitted, provided the original author(s) and the copyright owner(s) are credited and that the original publication in this journal is cited, in accordance with accepted academic practice. No use, distribution or reproduction is permitted which does not comply with these terms.
*Correspondence: Chengcheng Qian, cS5jaGVuZ2NoZW5nQDE2My5jb20=
 Chuanchuan Cao
 Ge Chen
 Chengcheng Qian3*