 Yi-Chen Cheng1
 Sen Jan
 Chung-Chi Chen
- 1Institute of Oceanography, National Taiwan University, Taipei, Taiwan
- 2Department of Life Science, National Taiwan Normal University, Taipei, Taiwan
Swordtip squid (Uroteuthis edulis) is a primary target species of the commercial fishery in the southern East China Sea (ECS), and they normally migrate to a quasi-permanent upwelling zone (called a cold dome) off northeastern Taiwan for spawning and growth during spring (March–May) and fall (October–December) in a year. We examined the connection of the variability in its standardized annual catch per unit effort (CPUE) during 2009–2017 in regard to the physical processes on the southern shelf of the ECS using temperature and wind observations from an isle north of Taiwan (Peng-jia-yu) as well as satellite sea surface temperature and absolute geostrophic velocity. The annual CPUE is positively correlated with the daily temperature anomaly at Peng-jia-yu in the cold dome in October of the previous year and April of the year. A warmer environment favors the recruitment and consequently the catch of the swordtip squid. During the spawning periods of the 9 years, the warm water carried by the Kuroshio frequently intruded atop the cold dome, which benefited the growth of the larvae and consequently helped maintain a certain value of the standardized annual CPUE. The anomalously low CPUE in 2012 and 2016 is attributed to the blocking of the Kuroshio intrusion due to cold and less salty China Coastal Water atop the cold dome in the spring spawning of 2012 and 2016. Based on the velocity strength in the cold dome and in a specified shelf region together with the daily temperature anomaly at Peng-jia-yu, an occupation intensity factor is used to evaluate the dominance of warm Kuroshio water and cold shelf water in the cold dome, which could help predict annual catches.
Introduction
The swordtip squid (Uroteuthis edulis) has been a primary target species for commercial fisheries over the southern continental shelf of the East China Sea (ECS) since the 1950s (Chyn et al., 1998; Song et al., 2008; Wang et al., 2008; Wang et al., 2010; Liao et al., 2018). The swordtip squid supplies ~65% of the total cephalopod production in Taiwan (Liao et al., 2018), and the economic value of an annual catch can reach tens of millions of US dollars (Wang et al., 2008; Fisheries Agency, 2016). Doubtlessly, a better understanding of the swordtip squid’s spawning, maturation, and population, which have been investigated by Liao et al. (2006); Liao et al. (2018) and Wang et al. (2008); Wang et al. (2010); Wang et al. (2013), and their dependence on the environmental variables in the southern East China Sea is crucial to better managing swordtip squid resources regarding their commercial value.
The swordtip squid is a migratory species with a lifespan of approximately 9 months (Wang et al., 2008; Yamaguchi et al., 2015). This species primarily spawns and hatches in spring from March to May and also in fall from October to December each year and then migrates to the southern East China Sea shelf for feeding and growing (Wang et al., 2008; Wang et al., 2010; Wang et al., 2013). The fishing activity of swordtip squid occurs between the 100- and 200-m isobaths in the southern East China Sea (Liao et al., 2018). Wang et al. (2008) suggested that the swordtip squid spawning ground is in and around the coastal water off the northern coast of Taiwan. Liao et al. (2018) concluded that higher catch rates occurred in the front region and vicinity in areas with a sea surface temperature (SST) of ~20°C–26°C, chlorophyll-a of ~0.05–2.0 mg m−3, and sea-level anomaly (SLA) of 0–2.0 m for an eddy-like sea-level feature. Chang K.-Y. et al. (2018) further found that a higher SST increases the growth rate of swordtip squid during the larval stage and hence helps shorten the prey period. The spawning, nursery, feeding, and fishing grounds of swordtip squid are shown in the inset in Figure 1 (transparent purple shading area), which are from the northern coast of Taiwan, extending northeastward along 100–200-m isobaths to ~29°N in the central-eastern shelf of the ECS. The positive correlation between the swordtip squid abundance and catch and the oceanic variability was also addressed in the aforementioned papers. However, the underlying physical dynamics of swordtip squid catch-related, event-driven environmental variations have been less discussed in the open literature.
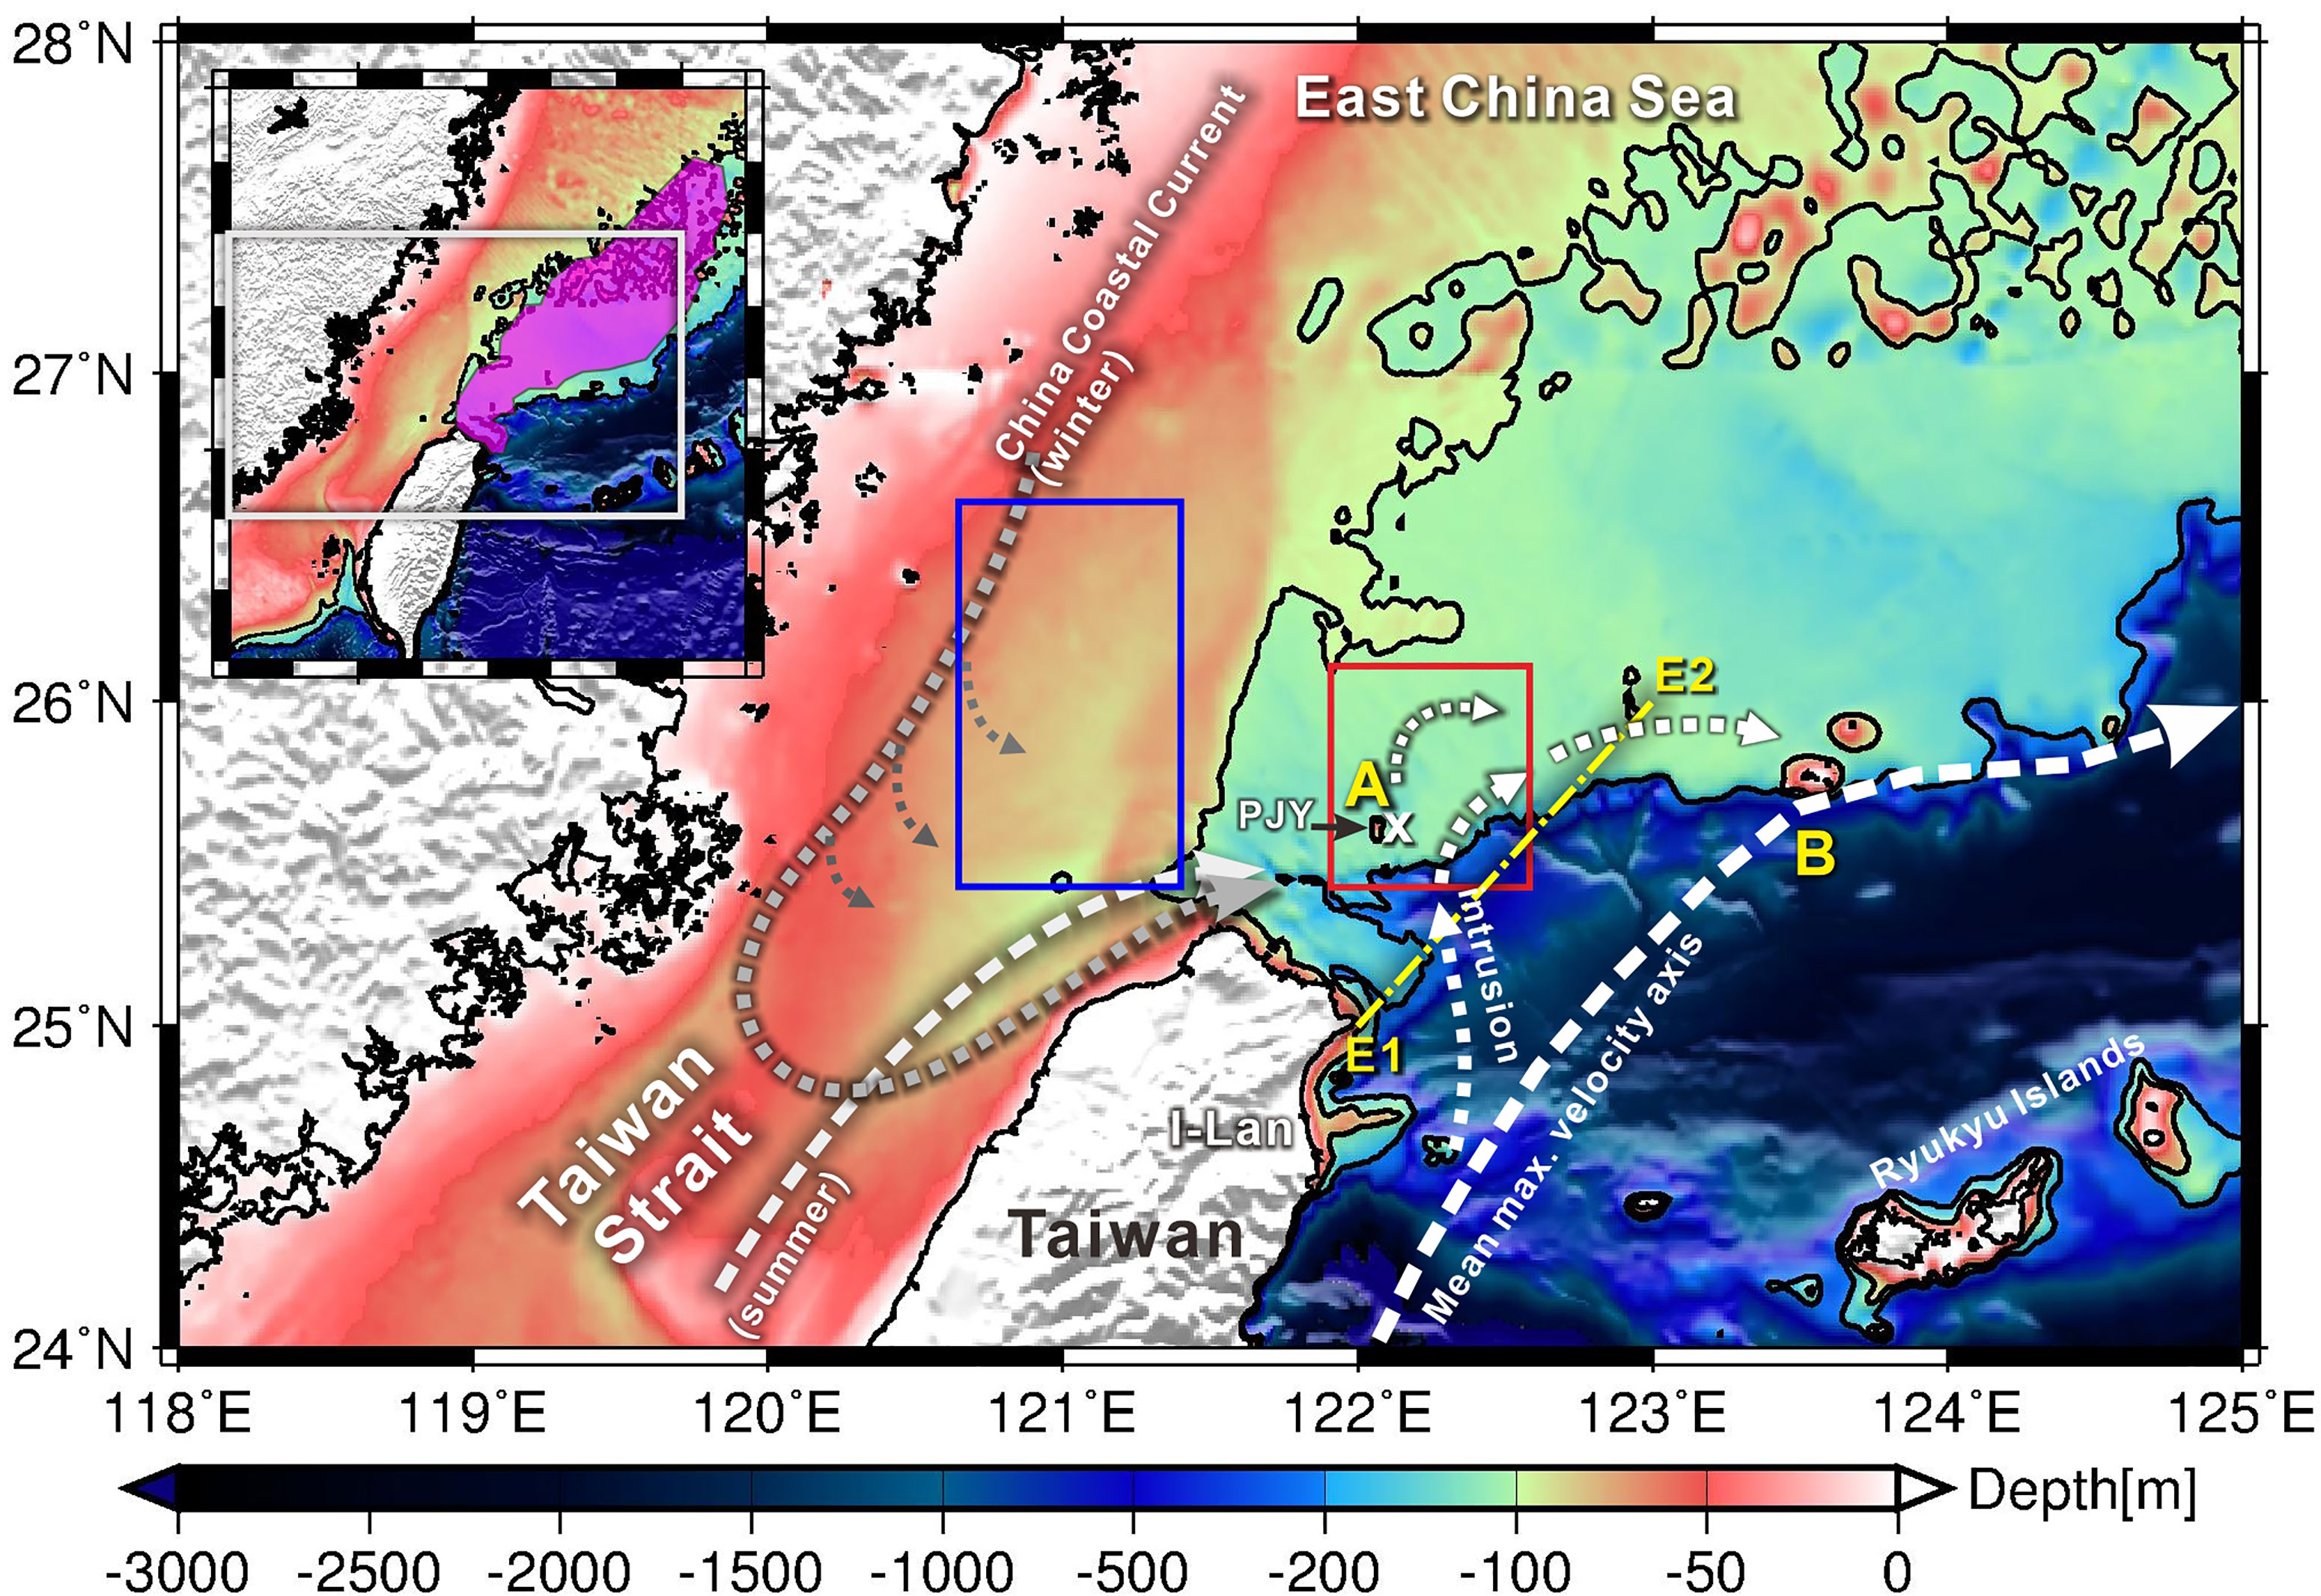
Figure 1 Topography and schematic routes of major currents around northern Taiwan. “X” indicates the mean center position of relatively low-temperature surface water in the cold dome (Jan et al., 2011). The transparent purple shading region in the inset bounds the majority of vessel locations with swordtip squid catches. Red and blue rectangles are used to evaluate the velocity dominance of the Kuroshio intrusion and China Coastal Current, respectively, in the cold dome region. Points A and B are used to calculate the satellite SST difference between the Kuroshio’s mean maximum velocity axis and the cold dome. The E1–E2 section (dotted yellow line) is used in the calculation of cross-shelf Ekman transport.
The hydrography on the shelf and shelf break of the southern ECS are subject to the intrusion of the Kuroshio (e.g., Chao, 1991; Hsueh et al., 1992; Chern and Wang, 1994; Chuang and Liang, 1994), the Taiwan Strait current coming from the southwest (e.g., Chern and Wang, 1992; Jan et al., 2002), the China coastal current in winter (e.g., Jan et al., 2002; Jan et al., 2006), the impingement of mesoscale eddies from the Philippine Sea (e.g., Yang et al., 1999; Johns et al., 2001; Zhang et al., 2001; Vélez-Belchí et al., 2013; Wu et al., 2014), barotropic and baroclinic tides (Hu et al., 2010; Lien et al., 2013), and quasi-permanent upwelling (named the “cold dome” after Chern and Wang, 1990). Atmospheric forcing, particularly the northeasterly monsoon in winter and typhoons in summer, also modifies the hydrography there (Chuang and Liang, 1994; Tsai et al., 2008; Morimoto et al., 2009). Importantly, in association with high biological production (Liu et al., 1992; Chen et al., 2021), the cold dome area and vicinity have been recognized as a primary swordtip squid spawning ground (Wang et al., 2010), and according to Chang K.-Y. et al. (2018), the surface temperature in and around the cold dome is a primary variable influencing species spawning and associated catches. We therefore focus on physical processes causing surface temperature variability on the southern shelf of the ECS, particularly in the cold dome region.
The formation of the cold dome has been attributed to quasi-permanent upwelling from upcanyon flows consisting of cold (<21°C) and saltier (>34.5) subsurface water of the Kuroshio (Chern and Wang, 1990; Tang et al., 2000; Wu et al., 2008; Shen et al., 2011; Jan et al., 2011). It presents a cold patch with a cyclonic flow pattern in satellite SST and geostrophic velocity or is overlaid by warmer water from the Kuroshio intrusion (Tang et al., 2000; Jan et al., 2011; Chen et al., 2015). According to the summary in Jan et al. (2011), the mean center position of the cold surface water in the cold dome is 122.125°E, 25.625°N, with a length scale of ~100 km and a cyclonic flow pattern, particularly in summer. The Kuroshio intrusion could spread over the cold dome and thus reduce the surface appearance of the cold dome. A higher chlorophyll-a concentration sourced from the upwelled nutrient-rich subsurface water (e.g., Chen et al., 2017; Chen et al., 2021; Chen et al., 2022), and therefore higher primary productivity has been observed year-round in the cold dome region (Liu et al., 1992).
The Kuroshio intrusion is an important physical process affecting the hydrographic variability of the cold dome. Over the past three decades, the dynamics underlying the Kuroshio intrusion have been widely studied and attributed to winter monsoon-induced shoreward Ekman transport (Chao, 1991), surface water compensation-induced vortex stretching due to the subsidence of cold dense shelf water in winter (Chuang and Liang, 1994), the joint effect of baroclinicity and bottom relief (JEBAR) (Oey et al., 2010), the topographic beta (β, the planetary vorticity gradient) spiral induced by the upwelling created as the Kuroshio impinges onto the shelf break (Yang et al., 2018a; Yang et al., 2018b), and typhoons across northern Taiwan (Chern et al., 1990; Tang et al., 1999). In addition to these physical processes, an increasing amount of comprehensive in situ and satellite remote sensing data show that the impingement of westward-propagating eddies on the Kuroshio east of Taiwan and the associated dynamic adjustment contribute to the Kuroshio intrusion (Jan et al., 2015; Tsai et al., 2015; Yang et al., 2015; Andres et al., 2017; Jan et al., 2017; Chang, M.-H. et al., 2018; Mensah et al., 2020). On the other hand, the China Coastal Current could bring cold and brackish water to fill the cold dome in winter, and the warm but less saline Taiwan Strait current could occupy the cold dome in summer (Jan et al., 2011).
The primary objective of this study is thus to examine the dynamic processes causing the upper layer temperature anomaly and, in turn, the spawning and associated catch of swordtip squid in and around the cold dome. The standardized annual catch per unit effort (CPUE in kg day−1 per vessel) of swordtip squid over 2009–2017 obtained from Chang K.-Y. et al. (2018) is used to explore its relationship with the environmental variables. The dynamics related to the variability in these parameters are subsequently examined using field and satellite observations.
Data and Methods
The CPUE is often positively related to the availability of fisheries and regarded as an indicator of fish abundance (Yu et al., 2018; Liu et al., 2019). Therefore, the catch and CPUE data were used to represent the abundance of swordtip squid in the southern ECS in study. The region covering most vessel locations of the catch is depicted in the inset in Figure 1 (transparent purple shading area). The annual CPUE was calculated from the annual total catches and the total fishing days of the total fishing boats documented in the logbooks for the years from 2009 to 2017 (Wang et al., 2008; Chang K.-Y. et al., 2018) as
The CPUE was further standardized by excluding the bonito fishing effort (Chang et al., 2015a), and hereafter, the standardized CPUE time series was used to find the correlation with the environmental parameters.
To understand the (temporal) serial correlation of swordtip squid resources, autocorrelation analysis was applied using the 9 years’ standardized CPUE. Furthermore, to evaluate how the squid abundance (using the standardized annual CPUE as index) associates with the environmental variables, the Pearson correlation coefficient was used to quantify the correlations of the standardized annual CPUE and the monthly mean satellite chlorophyll-a concentrations in the cold dome or temperature at Peng-jia-yu, similar to that in Waluda et al. (1999) and Chang et al. (2015b). is calculated by
where cov(X, Y) is the covariance between variables X and Y; E is the expected value; μ is the mean value; and σX and σY are the standard deviation of X and Y, respectively. The monthly mean chlorophyll-a concentration and temperature of July through December in the previous year (i.e., from 2008 to 2016) and of January through June in the year (i.e., from 2009 to 2017) was used to calculate the correlation coefficient with the standardized annual CPUE over the 9 years.
Sea level and seawater temperature observed at the Peng-jia-yu isle in the southern ECS (122.0792°E, 23.6283°N; Figure 1) since April 2008 were used to supplement the analysis of the relationship between the standardized annual CPUE and the physical processes over the southern shelf of the ECS. The sea level and temperature were measured every 10 min by a Sea-Bird SBE-39. The wind speed and direction were measured by the Central Weather Bureau of Taiwan at the Peng-jia-yu weather station and were obtained from https://e-service.cwb.gov.tw/HistoryDataQuery/index.jsp. The 10-min sea level and temperature data were time averaged every 60 min and resampled to hourly data. A low-pass filter with a cutoff frequency of 0.05 cycles per day (equivalent to a period of 20 days) was applied to the hourly resampled data to exclude tidally induced variability. The daily mean temperature at the Peng-jia-yu isle was also obtained by averaging the raw temperature data over 2008–2021 and was also 20-day low-pass filtered for the estimate of daily temperature anomaly.
The corresponding daily satellite remote-sensing products, including SST, sea surface height (SSH), sea-level anomaly (SLA), and chlorophyll-a concentrations, were collected from the Copernicus Marine Environment Monitoring Service (CMEMS, available at https://marine.copernicus.eu/) in the range of 118°E–128°E and 18°N–28°N. The horizontal resolution is 0.05° (~6 km) in longitude and latitude for SST, 0.25° (~27.5 km) for SLA, and ~4 km for SSC. The daily SST anomaly (SSTa) is relative to the mean daily temperature calculated from SST during 2008–2018. The SLA was compared to the mean sea level calculated from SSH during 1993–2012. The absolute geostrophic velocity was further calculated from the satellite SSH and associated mean dynamic topography.
The Kuroshio intrusion in the southern ECS is identified by considering satellite SST, absolute geostrophic velocity, and the daily mean temperature anomaly at the Peng-jia-yu isle. Vélez-Belchí et al. (2013) defined an index using the difference in SST in the mean position of the non-intruding Kuroshio northeast of Taiwan and a point at 122.5°E and 26.75°N to evaluate the Kuroshio intrusion. The smaller the value is, the more likely the Kuroshio intrusion occurs because the intruding warm water on the ECS shelf decreases the temperature contrast between these two locations. A similar SST difference index was adopted, but the locations for the calculation of SST difference were shifted to points A (122.077°E, 25.629°N) in the cold dome and B (123.525°E, 25.525°N) in the mean maximum velocity axis of the Kuroshio (points A and B in Figure 1). The change in the shelf point directly evaluates whether the Kuroshio intrudes into the cold dome region. Wu et al. (2014) set a criterion to evaluate the Kuroshio intrusion by checking if the 0.2 m s−1 isotach of the satellite geostrophic velocity crosses the 200-m isobath on the southern shelf of the ECS. We adopt this idea but modify the criterion to indicate that the area average velocity, calculated byas v > 0 in the red box in Figure 1, is larger than 0.2 m s−1 to indicate the Kuroshio intrusion. The two criteria are further supplemented with the maximum increase in the low-pass-filtered daily temperature anomaly at the Peng-jia-yu isle during the intrusion period (i.e., ΔTmax > 0.5°C as the Kuroshio intrusion) to reduce the uncertainty in evaluating the Kuroshio intrusion.
To further analyze the potential dynamics for the Kuroshio intrusion, we integrated associated weather conditions from the Central Weather Bureau of Taiwan, satellite SSH, and geostrophic current and calculated wind-induced Ekman transport. The Ekman transport (QEk) across the shelf break (yellow dotted line E1–E2 in Figure 1) is calculated by
where ρo (1025 kg m−3) is a reference density, f is the Coriolis parameter at 25.5°N (6.26 × 10⁻⁵ s−1), and τ is the wind stress in the northeast and southwest directions. The wind data collected at the Peng-jia-yu weather station are used to calculate and represent τ along the E1–E2 line (Figure 1).
Results
Variability of Temperature and Sea Level at Peng-jia-yu Over 2008–2021
Figure 2 shows the hourly temperature and sea level observed at the Peng-jia-yu isle from April 2008 to October 2021. The 20-day low-pass-filtered and linear regression of the temperature and sea-level observations are also shown in Figure 2. Note that the linear regressions of temperature and sea level suggest that the temperature increased by 0.71°C and sea level increased by 2 cm during the observation period. For a comparison between this temperature increasing rate and that of global temperature, the annual global mean SST anomalies during 2008 and 2018 were obtained from the National Centers for Environmental Information (https://www.ncdc.noaa.gov/cag/global/time-series). A similar linear regression was applied to the annual SST anomalies, and we obtained a 0.32°C increase over the 10-year dataset. A further discussion on the long-term changes in temperature and sea level at the Peng-jia-yu isle is not given here because this is not the central focus of this study. Additionally, the CPUE data used in this study are too short (9 years) to correlate with climate timescale temperature variability. Notably, there are intermittently missing data in the observations but the total time is less than 5% of the approximately 14 years of temperature and sea-level time series. These gaps in the time series have no significant influence on the results of low-pass filter and linear regression analyses.
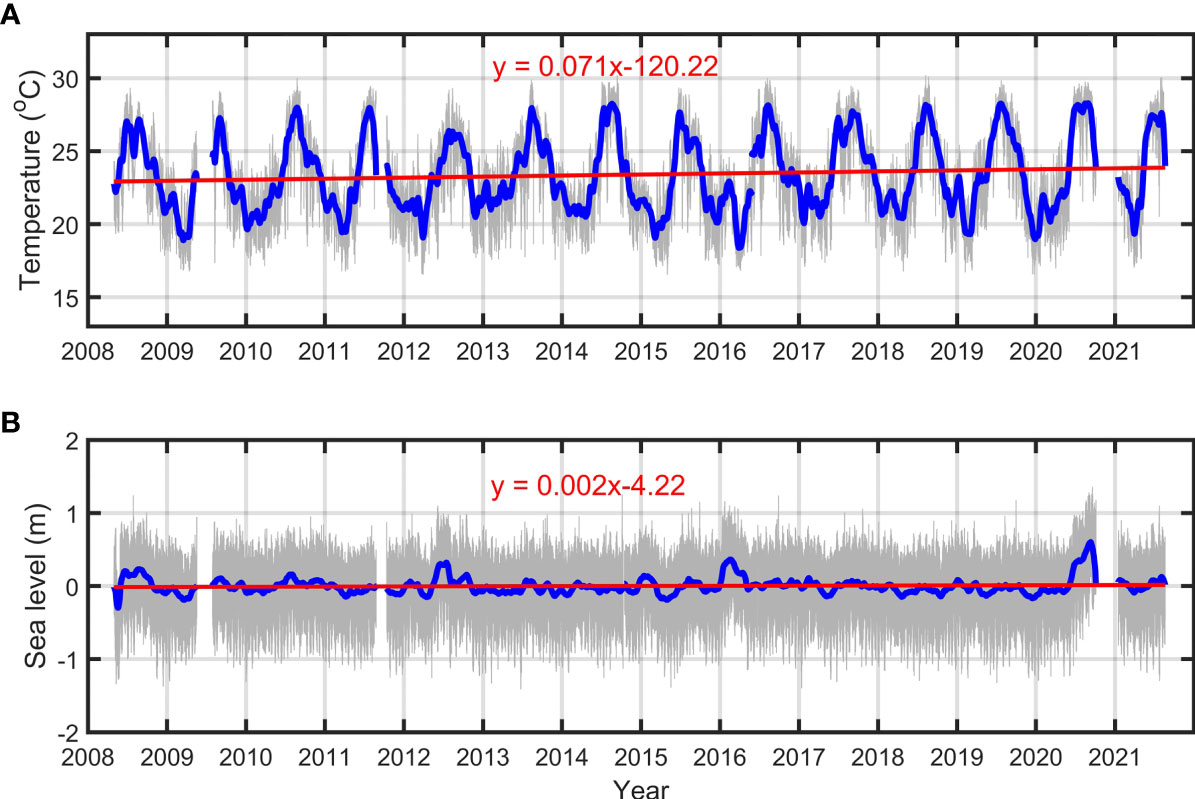
Figure 2 (A) Temperature and (B) sea level measured at the Peng-jia-yu isle during 2008–2021. Gray, blue, and red lines represent hourly average and resampled data, 20-day low-pass-filtered data, and the linear regression of the data, respectively.
The 20-day low-pass-filtered daily mean temperature illustrated in Figure 3 is a base for calculating the daily mean temperature anomaly. The spawning periods of the swordtip squid in a year are marked in Figure 3 for reference. The two periods correspond to the two low-temperature periods in the year.
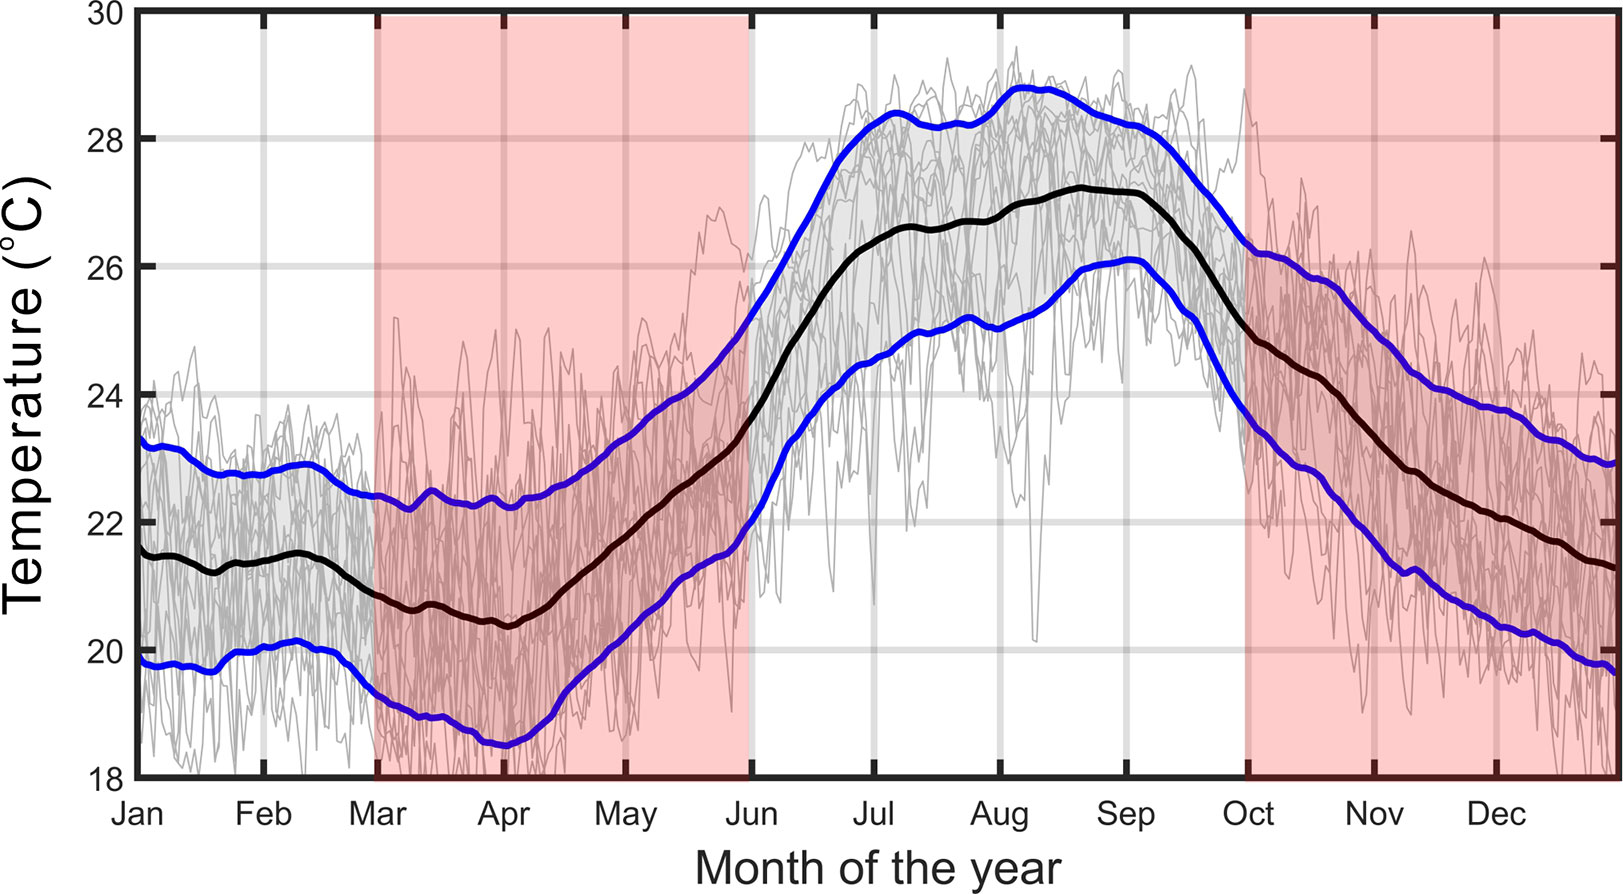
Figure 3 The 20-day low-pass-filtered daily mean temperature (black line) calculated from the temperature observed at the Peng-jia-yu isle from 2008 to 2021. The ± one standard deviation from the mean value is bounded by the two blue lines. The gray lines are the raw temperature records of each year. Transparent pink shading indicates the spawning periods of the swordtip squid in the year.
Correlations of Standardized Annual CPUE and Environmental Variables
The standardized annual CPUE in Figure 4 shows interannual variation with one peak in 2013 and two relative lows in 2012 and 2016. The highest CPUE (2013; ca. 260 kg day−1 per vessel) reached ~2 times the lowest CPUE (2016; ca. 125 kg day−1 per vessel) over the 9 years. The autocorrelation analysis of the standardized annual CPUE (Supplementary Figure 1), however, suggests that there was no significant correlation between the resources in the previous year and its coming years, which is consistent with that concluded by Chang K.-Y. et al. (2018). An insignificant correlation between the standardized annual CPUE is plausible because the swordtip squid is an annual species (Wang et al., 2008; Yamaguchi et al., 2015); therefore, it is known that its population abundance is primarily influenced by the variability of environmental variables on an approximately seasonal timescale. Physical processes possibly leading to this interannual variation are examined with available data collected at fixed stations and from satellite remote sensing later.
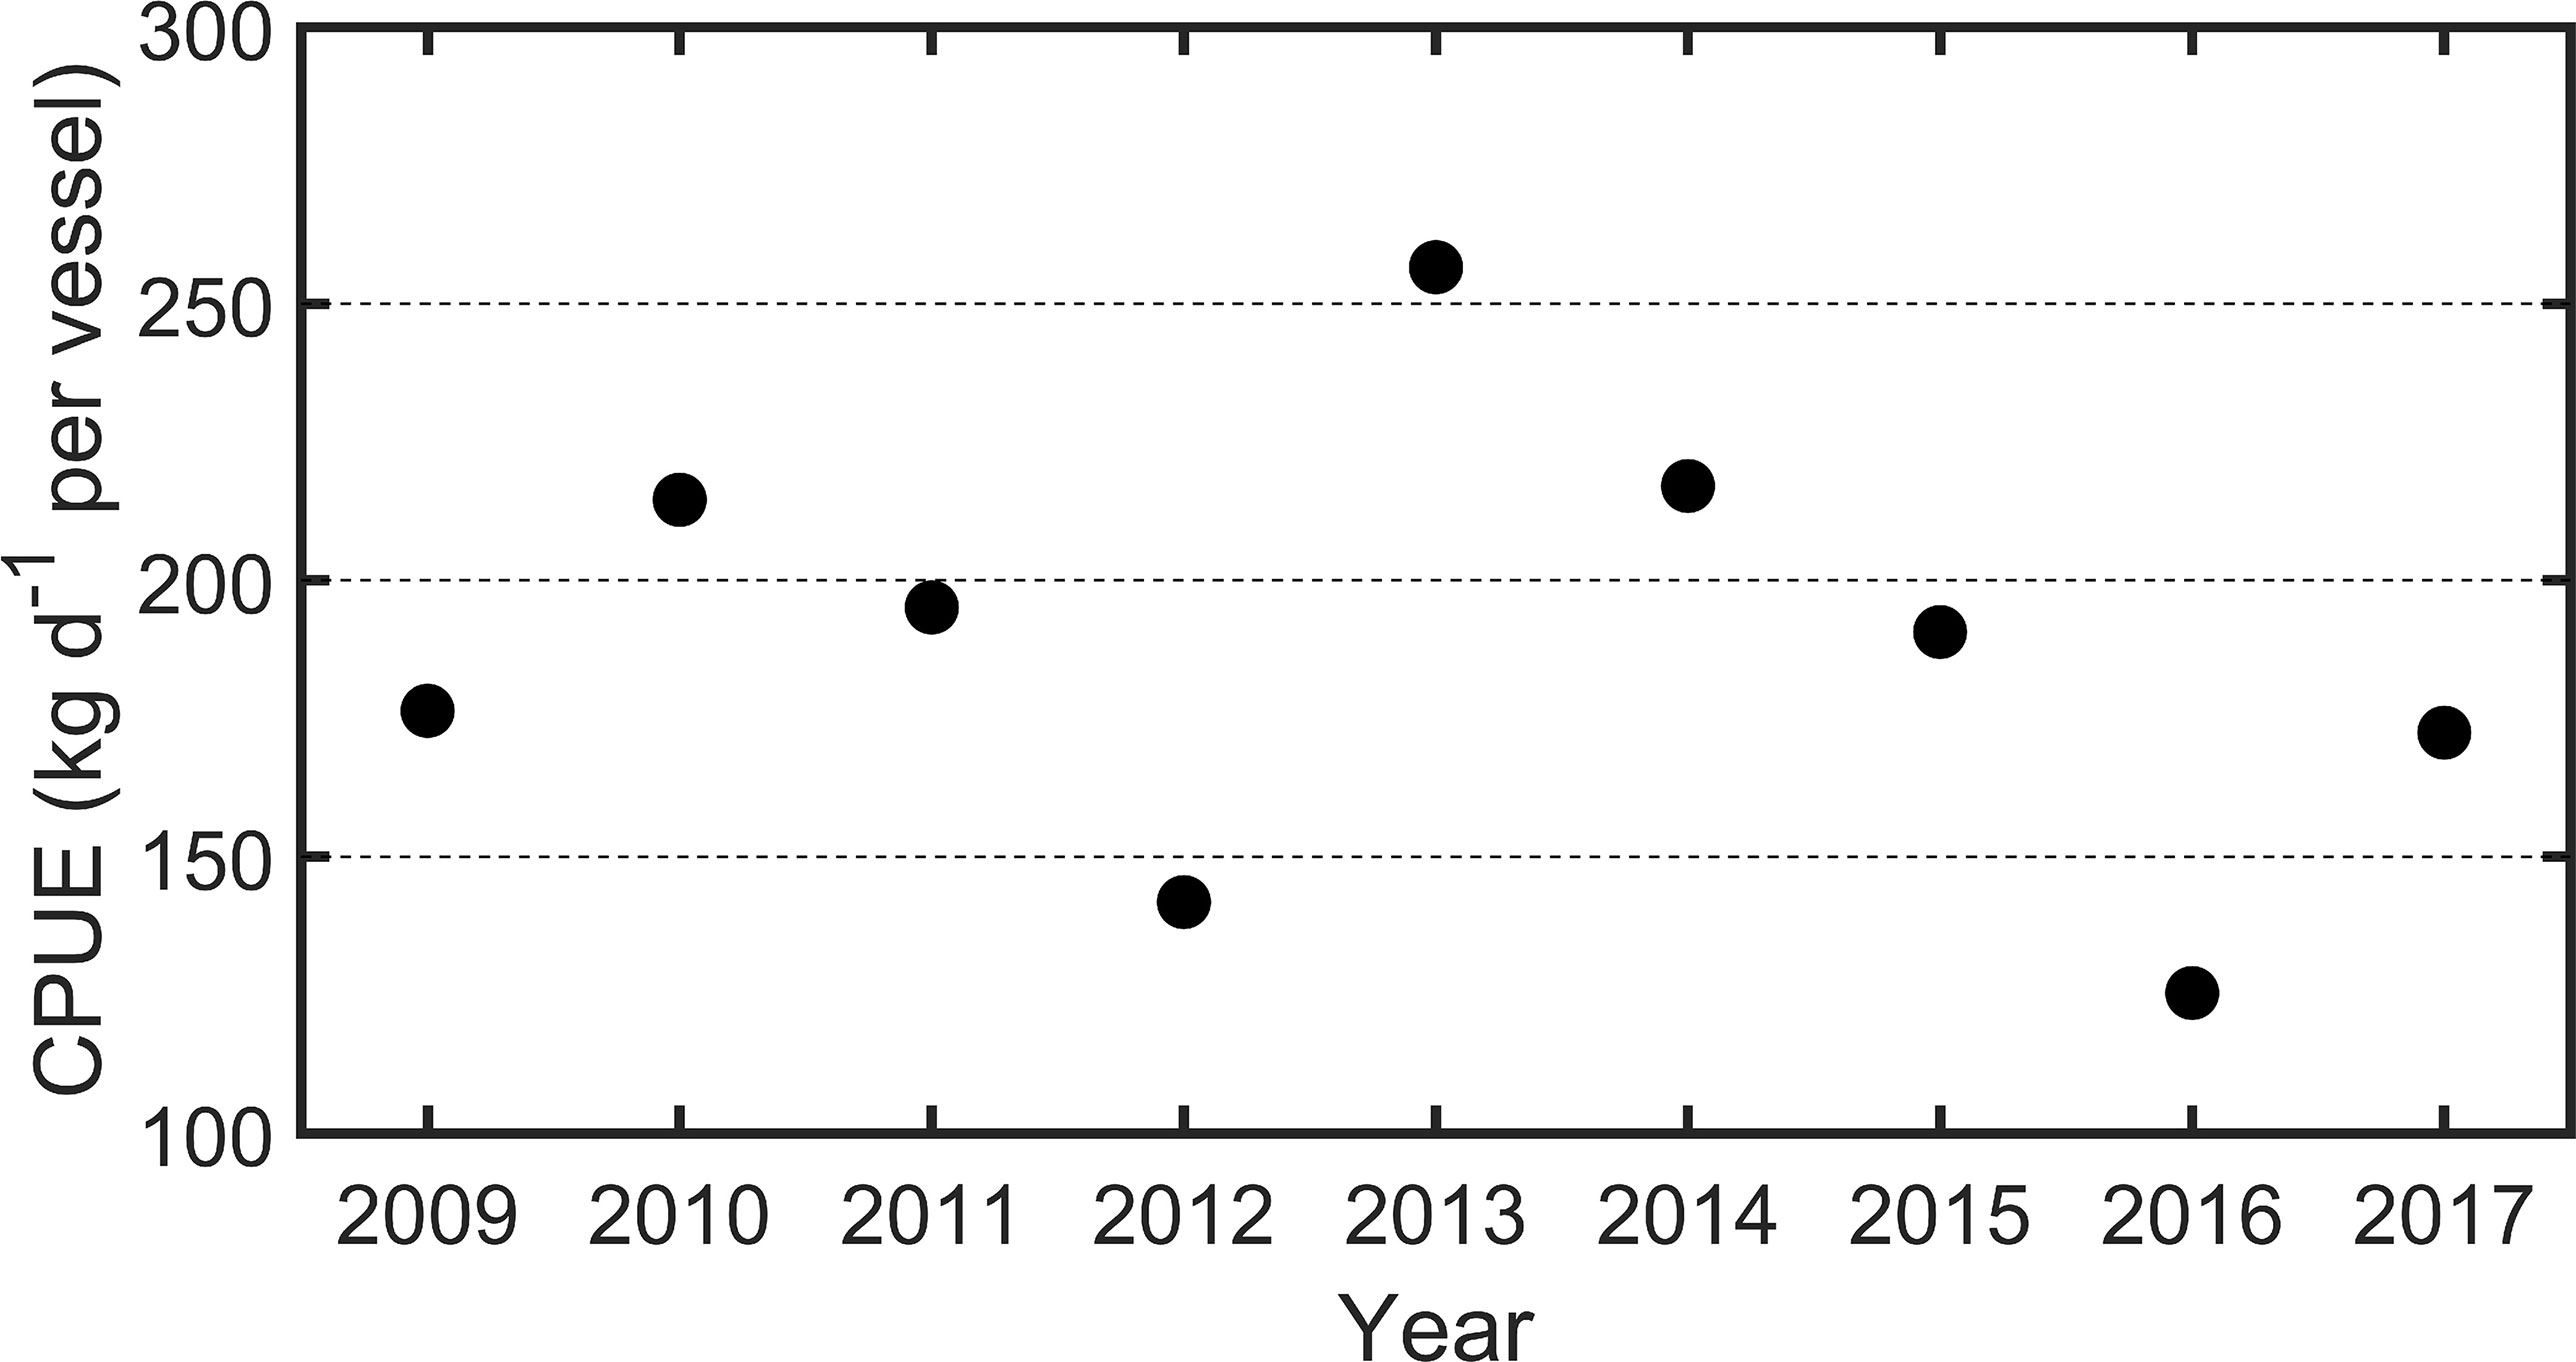
Figure 4 Annual CPUE of swordtip squid (Uroteuthis edulis) from 2009 to 2017.
Results from further correlation analysis show that the variation in the standardized annual CPUE is positively correlated with the monthly mean temperature at Peng-jia-yu isle in the two main spawning seasons, i.e., October in the previous year (Figure 5A) and April in the year (Figure 5B). Generally, a higher temperature favors an increase in the growth rate of swordtip squid larvae during the spawning and incubation periods but could decrease their size and life during the adult stage. For the correlation between satellite chlorophyll-a concentrations in the cold dome and the standardized annual CPUE, the correlation coefficients were, however, mostly negative and not significant (data not shown), as discussed and concluded in Chang K.-Y. et al. (2018). Even so, notably, a satellite chlorophyll-a concentration peak was appeared in April in the cold dome with its value reaching over 0.55 mg Chl-a m−3 using mean daily values over 2008–2018 (Supplementary Figure 2).
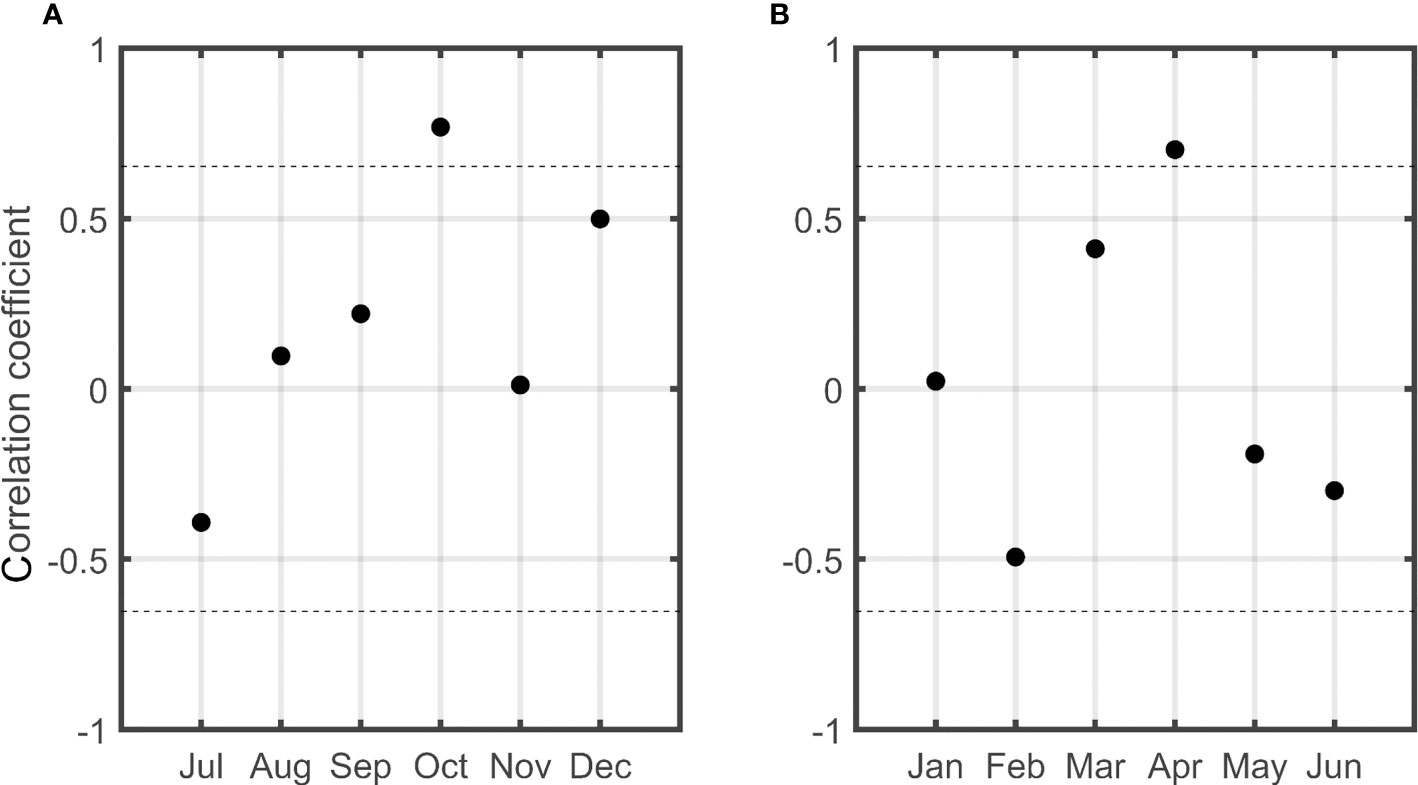
Figure 5 Correlation coefficients of the standardized annual CPUE of swordtip squid over 2009–2017 and monthly mean seawater temperature at Peng-jia-yu isle for (A) July–December in the previous year over 2008–2016 and (B) January–June in the year over 2009–2017. The dashed lines mark the 95% confidence level.
Kuroshio Intrusions During Spawning Periods
Using the temperature and velocity criteria described in Data and Methods and considering only the 20 spawning periods from 2008 to 2017, 10 Kuroshio intrusion events were identified. The duration and ΔTmax of each intrusion event are summarized in Table 1. The intrusion of the upper-layer Kuroshio frequently occurs off the northeastern coast of Taiwan, which is indeed a normal flow pattern that occurs when a stratified geostrophic current encounters a topographic rise. Considering the temporal evolution of impinging eddies east of Taiwan, satellite geostrophic currents in and around the cold dome, shoreward Ekman transport calculated by Eq. (1), and sea surface cooling due to winter atmospheric cold surges in association with spawning periods, the potential dynamics of the intrusions are attributed to three categories: 1) the joint influence of impinging eddies and shoreward Ekman transport for events 1, 4, and 8; 2) shoreward Ekman transport for events 2, 5, 6, 9, and 10; and 3) strong cold surge-induced shelf water cooling for events 3 and 7 (Table 1). The shortest period of intrusion was 42 days, and the longest was 84 days over 2008–2017. The typical flow field and temperature anomaly in the cold dome of the three dynamic regimes are discussed later.
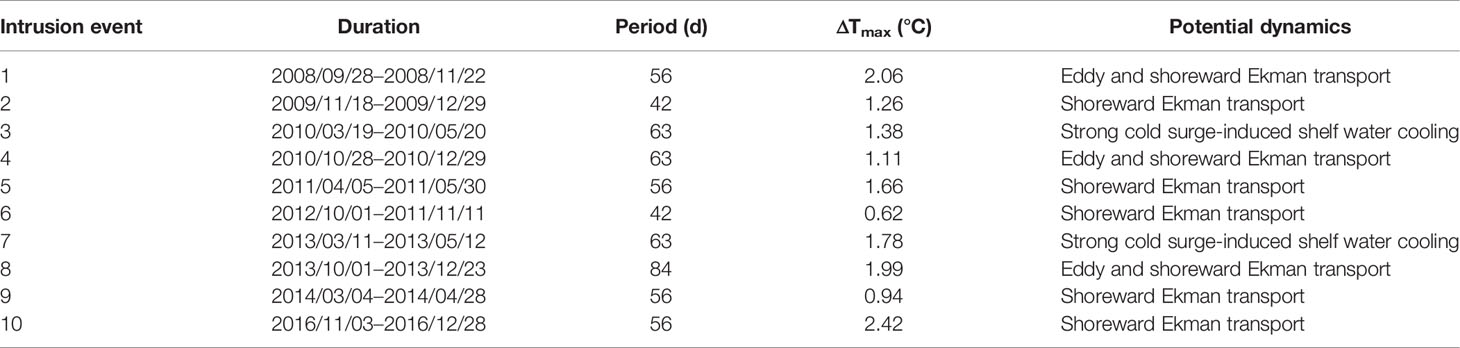
Table 1 Duration, period in days, maximum increase of low-pass-filtered temperature anomaly at the Peng-jia-yu isle (ΔTmax), and possible dynamics of Kuroshio intrusions during swordtip squid spawning periods over 2009–2017.
Discussion
Kuroshio Intrusion as a Normal Flow Pattern off Northeastern Taiwan
The warm surface water carried by the Kuroshio intrusion to the southern ECS benefits the spawning and incubation of the swordtip squid. The surface flow of the Kuroshio should intrude onto the southern shelf of the ECS if there is no blocking of excess flows from the ECS in winter or from the Taiwan Strait to the cold dome. The intrusion could be enhanced by onshore Ekman transport induced by northeasterly winds during the winter monsoon season (Chao, 1991), subsidence of surface water due to the atmospheric cooling of the winter cold surge (Chuang and Liang, 1994), winter cooling-caused JEBAR on the shelf break northeast of Taiwan (Oey et al., 2010), the topographic β spiral (Yang et al., 2018a), and the impingement of cyclonic eddies on the Kuroshio (Vélez-Belchí et al., 2013). Indeed, the Kuroshio intrusion should be a normal situation as this ~800-m-thick baroclinic geostrophic flow encounters the topographic rise northeast of Taiwan (Figure 1).
To verify this concept, the non-dimensional Burger number (Bu) is used to analyze the response when the Kuroshio encounters abrupt topography. Bu is defined as (Cushman-Roisin, 1994)
where is the buoyancy frequency in the stratified current (g = 9.8 m s−2 is the gravitational acceleration, ρ is density, and ρ0 = 1025 kg m−3 is a reference density), H is the vertical scale of the topographic rise, f is the Coriolis parameter, and L is a geometrical horizontal length scale of the topography. As Bu ~1, the density stratification is as important as the Earth’s rotation on the momentum balance of a stratified current (Cushman-Roisin, 1994), influencing the velocity field in the vertical direction. The vertical rigidity resulted from the rotating effect as the Rossby number Ro << 1 is weakened, and the flow directions of a stratified current tend to be decoupled in the vertical direction (Cushman-Roisin, 1994). The lighter surface current can flow directly over the topography, whereas the heavier current in the lower layer would be blocked by the topography and diverted following the isobath of the topography (Merkine, 1975; Merkine and Eugenia, 1976), similar to the situation in which a northward current encounters a zonal topographic rise in the central eastern Taiwan Strait (Jan et al., 1994). To estimate Bu in front of the steep shelf break off northeastern Taiwan, we set H ~200 m and f = 6.03 × 10⁻⁵ s−1 at 24.5°N. The baroclinic radius of deformation, calculated by (g' H)1/2/f (g' is reduced gravity calculated by gΔρ/ρo), is adopted as the horizontal length scale L. The historical CTD data obtained from the Ocean Data Bank of Taiwan are used to calculate the mean density (σt) profiles across the Kuroshio at 24.5°N during the two spawning periods. According to the mean density profile at the section before the Kuroshio encounters the southern part of the ECS shelf (Figure 6), the density difference is ~2 kg m−3 over the upper 200 m in March–May (Figure 6A) and is even larger than this value in October–December (Figure 6B). The Rossby radius and buoyancy frequency N are ~36 km and ~0.98 × 10⁻² s−1, respectively. Bu is therefore ~1.16, suggesting that the surface intrusion of the Kuroshio is a normal situation off northeastern Taiwan. The strengthening of the northeastward outflow from the Taiwan Strait in summer and the southward-flowing China Coastal Water in winter and spring could impede the surface intrusion of the Kuroshio.
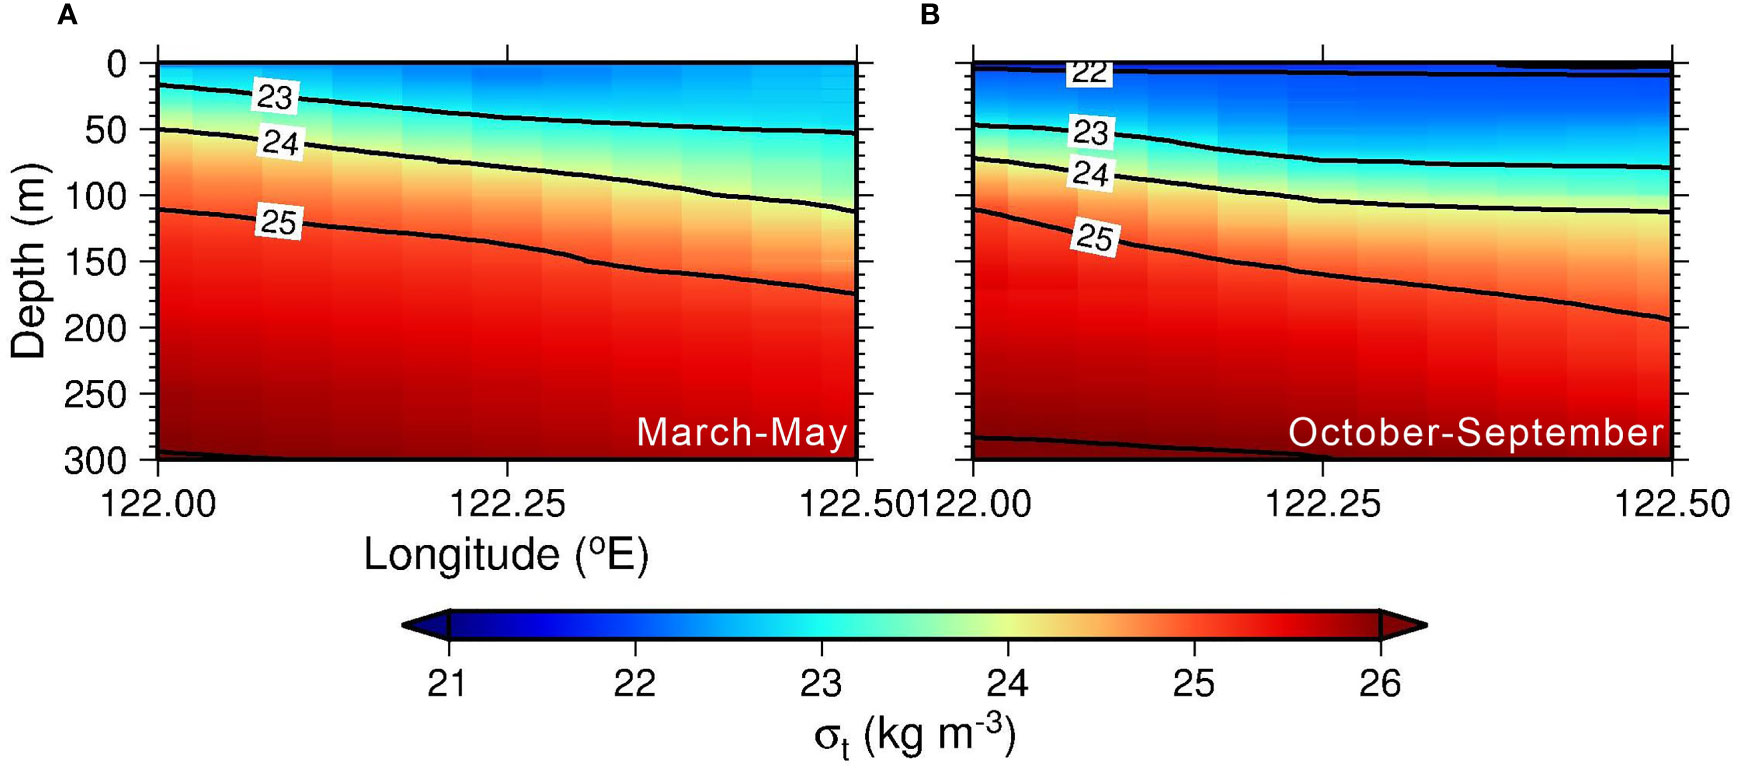
Figure 6 Seasonal mean density (σt in kg m−3) at a zonal section across the Kuroshio (24.5°N), which is immediately south of the ECS shelf. (A) March–May and (B) October–December.
Kuroshio Intrusion Patterns
The three categories of dynamics underlying the Kuroshio intrusion (Table 1) are examined using satellite SSTa data, geostrophic currents, wind-induced Ekman transport, and daily mean temperature anomalies at the Peng-jia-yu isle. Taking event 4 in Table 1 as an example, Figure 7 illustrates typical flow patterns before and during the Kuroshio intrusion enhanced by both an impinging cyclonic eddy and winter northeasterly monsoon-induced shoreward Ekman transport across the E1–E2 section in Figure 1. Prior to this intrusion, the shoreward Ekman transport increased to ~2.5 ×10⁶ m3 s−1 from early October 2010 (blue line in Figure 7C), and the daily mean temperature anomaly increased from mid-October 2010 (red line in Figure 7C). Meanwhile, a cyclonic eddy centered at ~124.5°E and 22.75°N was impinging on the offshore flank of the Kuroshio east of Taiwan (Figure 7A). The water mass carried by the westward-propagating cyclonic eddy gradually merged into the Kuroshio, and the satellite SSTa increased as time proceeded (Figure 7B). The intrusion flow, as indicated by current speeds larger than 0.2 m s−1, reached 121.5°E to the west and 27°N to the north (black arrows in Figure 7B) and formed an anticyclonic loop over the southern shelf of the ECS. The daily mean temperature anomaly reached 2°C during the intrusion (red line in Figure 7C). The geostrophic velocity field in the southern ECS returned to the original pattern (not shown), and the temperature anomaly decreased (Figure 7C) after the intrusion event.
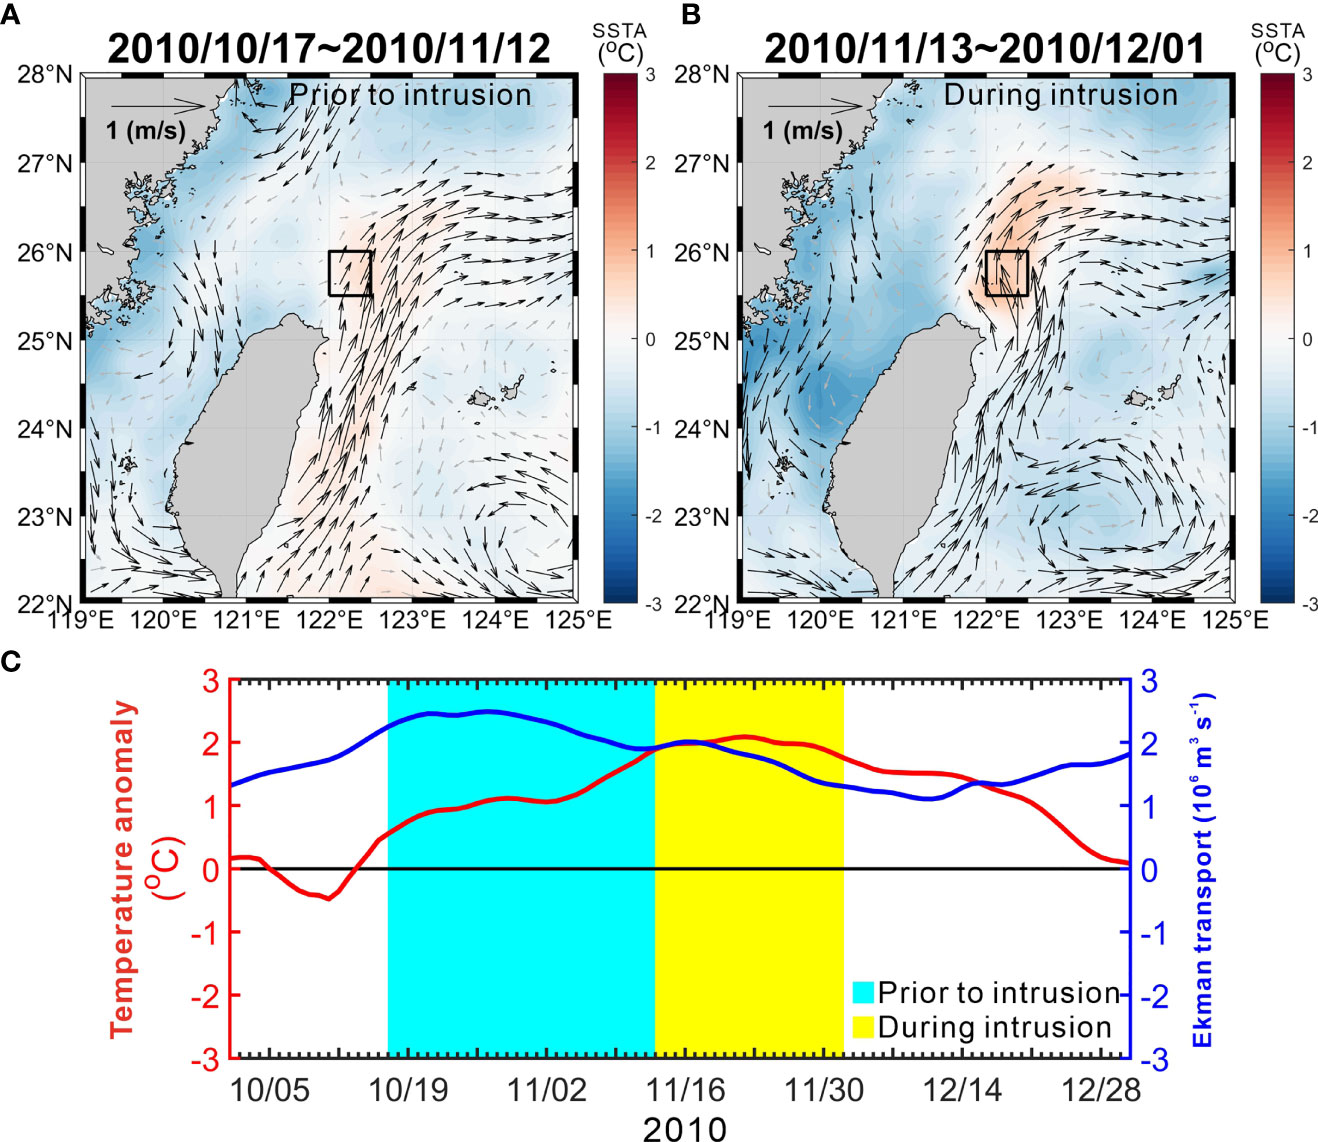
Figure 7 The intrusion event dynamically contributed from the impinging eddy east of Taiwan and the northeasterly monsoon-induced northwestward (shoreward) Ekman transport. Satellite SSTa and SSH-derived geostrophic current (A) prior to the intrusion and (B) during the intrusion. Black arrows represent current speed ≥0.2 m s−1, and gray arrows represent speed <0.2 m s−1. (C) Twenty-day low-pass-filtered daily temperature anomaly at the Peng-jia-yu isle (red line) and the shoreward Ekman transport (blue line) across the E1–E2 transect as shown in Figure 1. The black box indicates a representative location for the cold dome.
The typical geostrophic flow patterns, satellite SSTa, and daily mean temperature anomaly before and during the shoreward Ekman transport enhanced Kuroshio intrusion (event 2 in Table 1) are shown in Figure 8. The shoreward Ekman transport and associated daily mean temperature anomaly at the Peng-jia-yu isle increased from approximately early November 2009 (Figure 8C), and the satellite SSTa also increased during the intrusion (Figure 8B). The influence of an anticyclonic eddy centered at ~125°E and 23.25°N on the Kuroshio was likely inhibited by the Ryukyu Islands (Figure 1) during this event, and its influence on the flow pattern around the cold dome during the intrusion was not as clear as that in event 4 (Figures 8A, B).
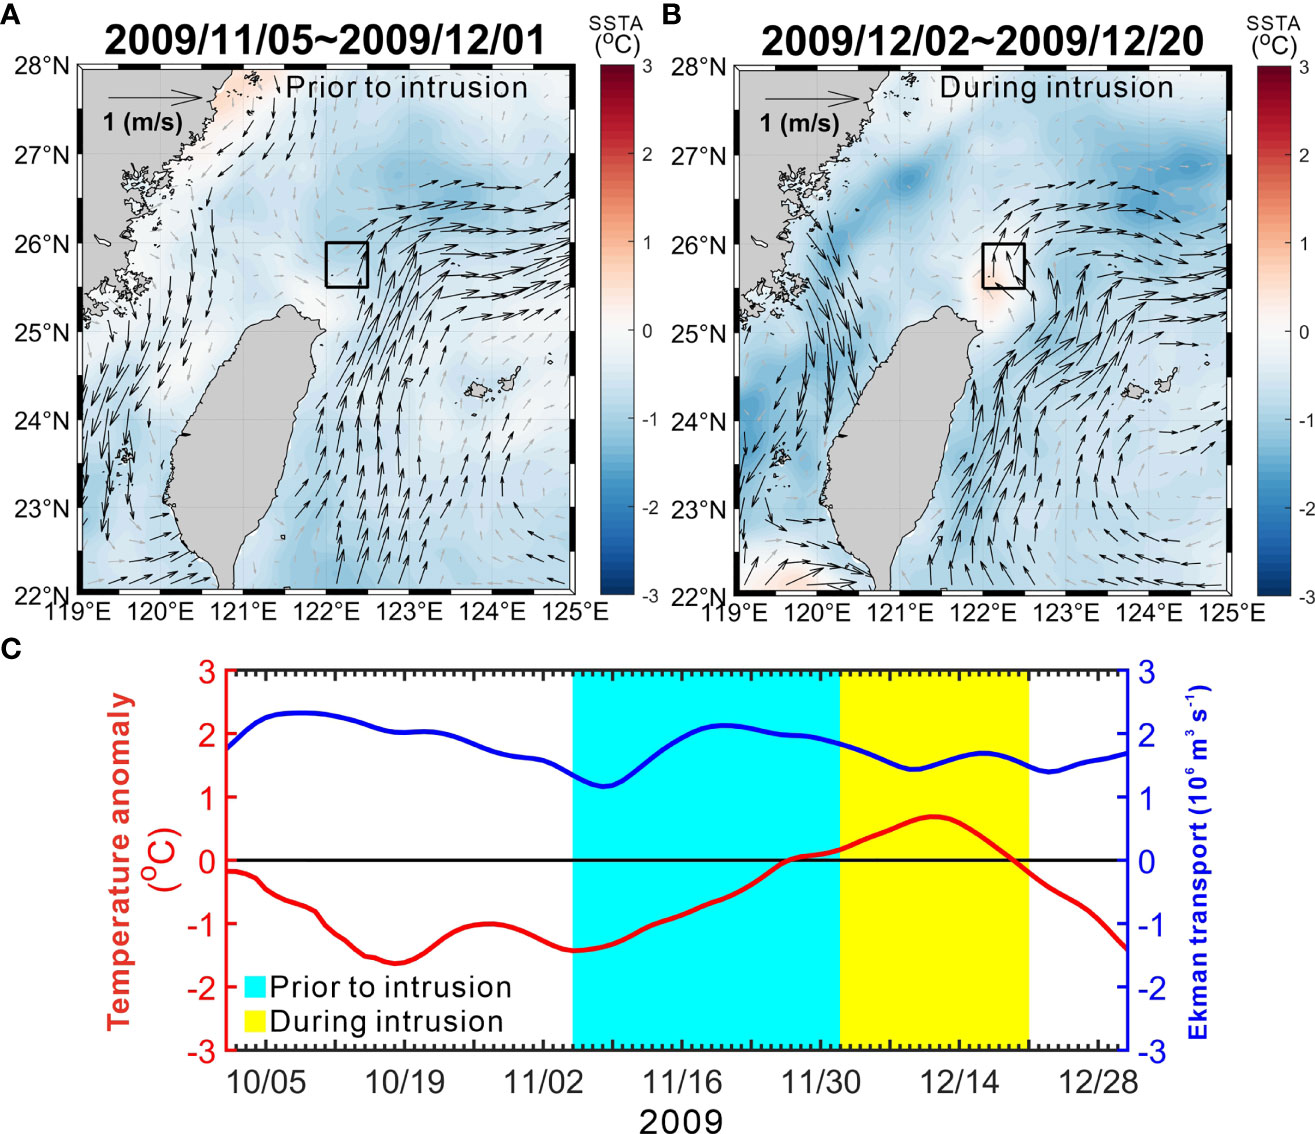
Figure 8 The intrusion event dynamically contributed from the shoreward Ekman transport. Satellite SSTa and SSH-derived geostrophic current (A) prior to the intrusion and (B) during the intrusion. Black arrows represent current speed =0.2 m s-1, and gray arrows represent speed.
The typical flow patterns and associated temperature anomaly shown in Figure 9 represent the Kuroshio intrusion enhanced by unusually strong atmospheric cold surge-induced shelf water cooling during March–April 2013 (Event 7 in Table 1). There was no clear mesoscale eddy feature east of Taiwan (Figures 9A, B), and the wind-induced Ekman transport was relatively small across the E1–E2 transect (Figure 9C). The most likely cause for this event was cold surge-induced sea surface cooling, which created a zonal sea surface temperature gradient in the southern ECS before the intrusion (Figure 9A). Conceivably, the sinking of the cold dense surface water on the shelf could cause the warm surface water on the offshore side to extend westward, as shown by the satellite SSTa in Figure 9B. The associated dynamics were discussed in, e.g., Chuang and Liang (1994). The Kuroshio intrusion of this event caused a 1.78°C increase (from 0.83°C to 2.60°C) in the daily mean temperature anomaly at the Peng-jia-yu isle (Table 1, Figure 9C).
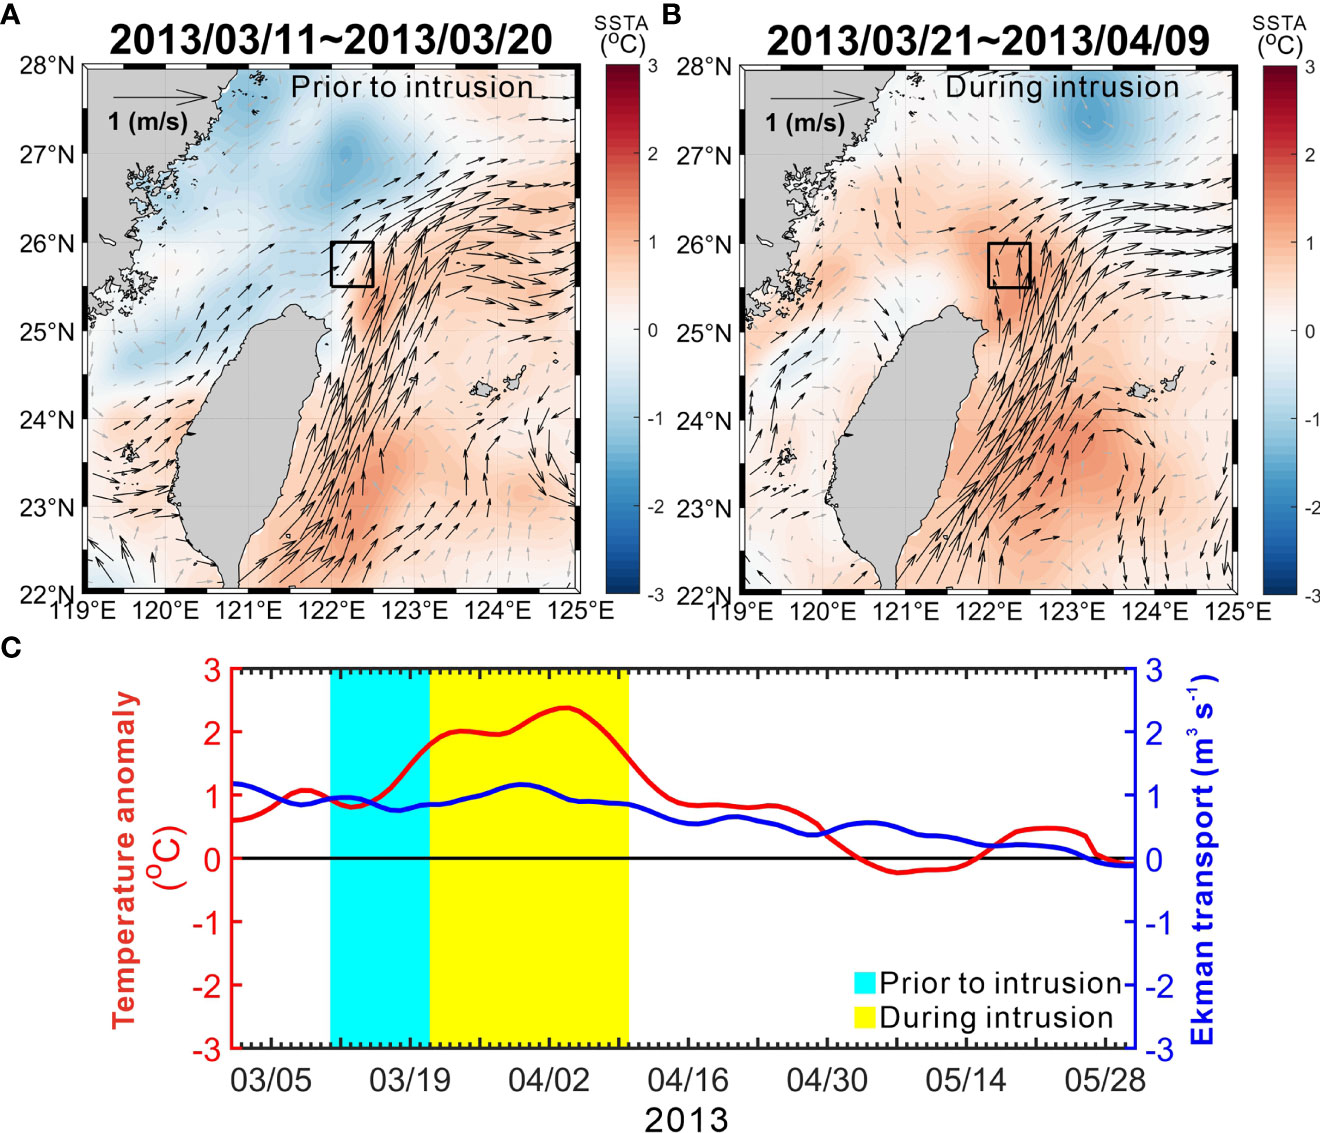
Figure 9 The intrusion event dynamically contributed from strong winter cold surge-induced shelf water cooling. Satellite SSTa and SSH-derived geostrophic current (A) prior to the intrusion and (B) during the intrusion. Black arrows represent current speed =0.2 m s-1, and gray arrows represent speed.
To summarize the aforementioned flow patterns of the Kuroshio northeast of Taiwan, the mean primary stream of the Kuroshio over 2008–2018, blocking (or cold shelf water intrusion), and intrusion into the cold dome (or warm intrusion) of the Kuroshio are as schematically shown in Figures 10A–C, respectively. The relative locations of the typical cold dome area, the maximum velocity axis, and the onshore flank of the Kuroshio are clearly seen from Figure 10. It should be noted that the topographic β spiral (Yang et al., 2018a; Yang et al., 2018b) plays a certain role in all of the Kuroshio intrusion. As the Kuroshio bumps onto the shelf break, the upslope flow creates upwelling and leads to the vortex compression over the continental shelf. This dynamic mechanism could drive the intruding Kuroshio to turn shoreward, making an anticyclonic loop on the southern shelf of the ECS.
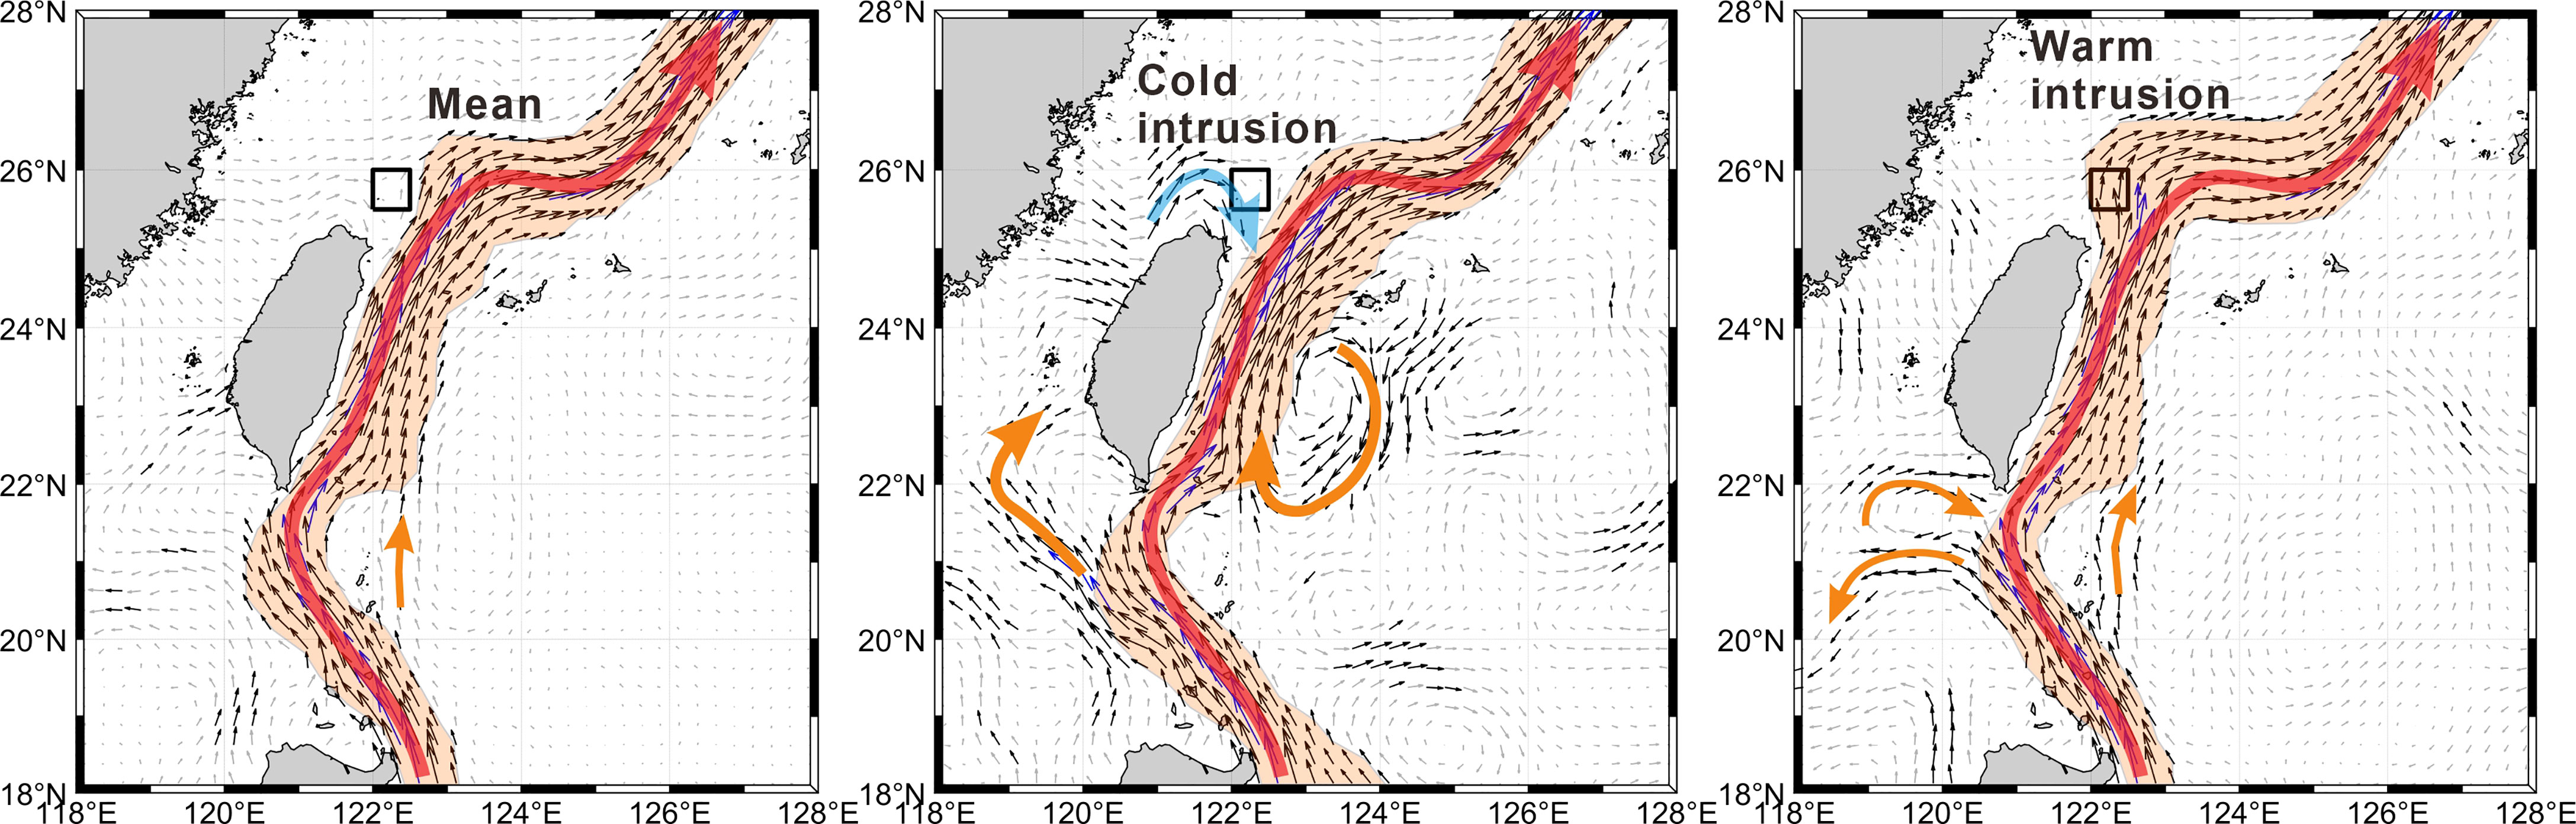
Figure 10 A schematic showing (A) the mean primary stream over 2008–2018, (B) an example of blocking path, and (C) an example of intrusion path of the Kuroshio off the northeast coast of Taiwan. The black box represents the mean location of the cold dome as that in Figure 7. The red curve indicates the mean maximum velocity position of the Kuroshio. The absolute geostrophic velocity in the transparent orange shading region is ≥0.2 m s−1.
Occupation Intensity Index for the Kuroshio and Shelf Water Intrusion
Considering the Kuroshio intrusion and with the primary purpose of this study in mind, we further find a dynamically related index rather than only velocity or temperature indicators for predicting the catch of swordtip squid around the shelf break of the southern ECS. The standardized annual CPUE was verified to be positively correlated with the SST anomaly in the cold dome during the spawning periods (Chang, K.-Y. et al., 2018; this study), and the SSTa in the cold dome is closely related to the vicinity shelf and shelf break processes. We therefore take the difference in area average velocity in the red and blue boxes in Figure 1 as an indicator of occupation intensity for Kuroshio or shelf water. The daily mean temperature anomaly at the Peng-jia-yu isle is taken as an indicator of the strength of the temperature variability. The spawning and subsequent catch, particularly for abnormally low catches, could be expected by the two indicators. The dominance of the Kuroshio intrusion in and around the cold dome is determined by the area average geostrophic velocity, calculated (u2 + v2)1/2 as v > 0 in the red box (121.875–122.625°E and 25.375–26.125°N) in Figure 1. Similarly, the dominance of the China Coastal Current and associated cold coastal water is determined by the area average geostrophic velocity as u > 0 in the blue box (120.625–121.375°E and 25.375–26.625°N) in Figure 1. The two boxes were selected by considering the swordtip squid spawning area reported in Chang et al. (2018) and the hydrographic characteristic of the southern ECS described in Chern and Wang (1989). The area average velocity was subsequently 20-day low-pass-filtered. Figure 11A shows the tendency of the Kuroshio (red line) and shelf water (blue line) intrusions during 2008–2017. The intensity of the shelf water intrusion (blue line in Figure 11A) is normally stronger than that of the Kuroshio intrusion (red line in Figure 1) in summer, which is mostly attributed to the occupation of strengthened northeastward throughflow in the Taiwan Strait in the cold dome area. Except for this seasonality, the dominance of the two parameters is mixed during the spawning periods indicated by the transparent pink shading in Figure 11A, which could be one of the causes of interannual variability in the standardized annual CPUE of swordtip squid.
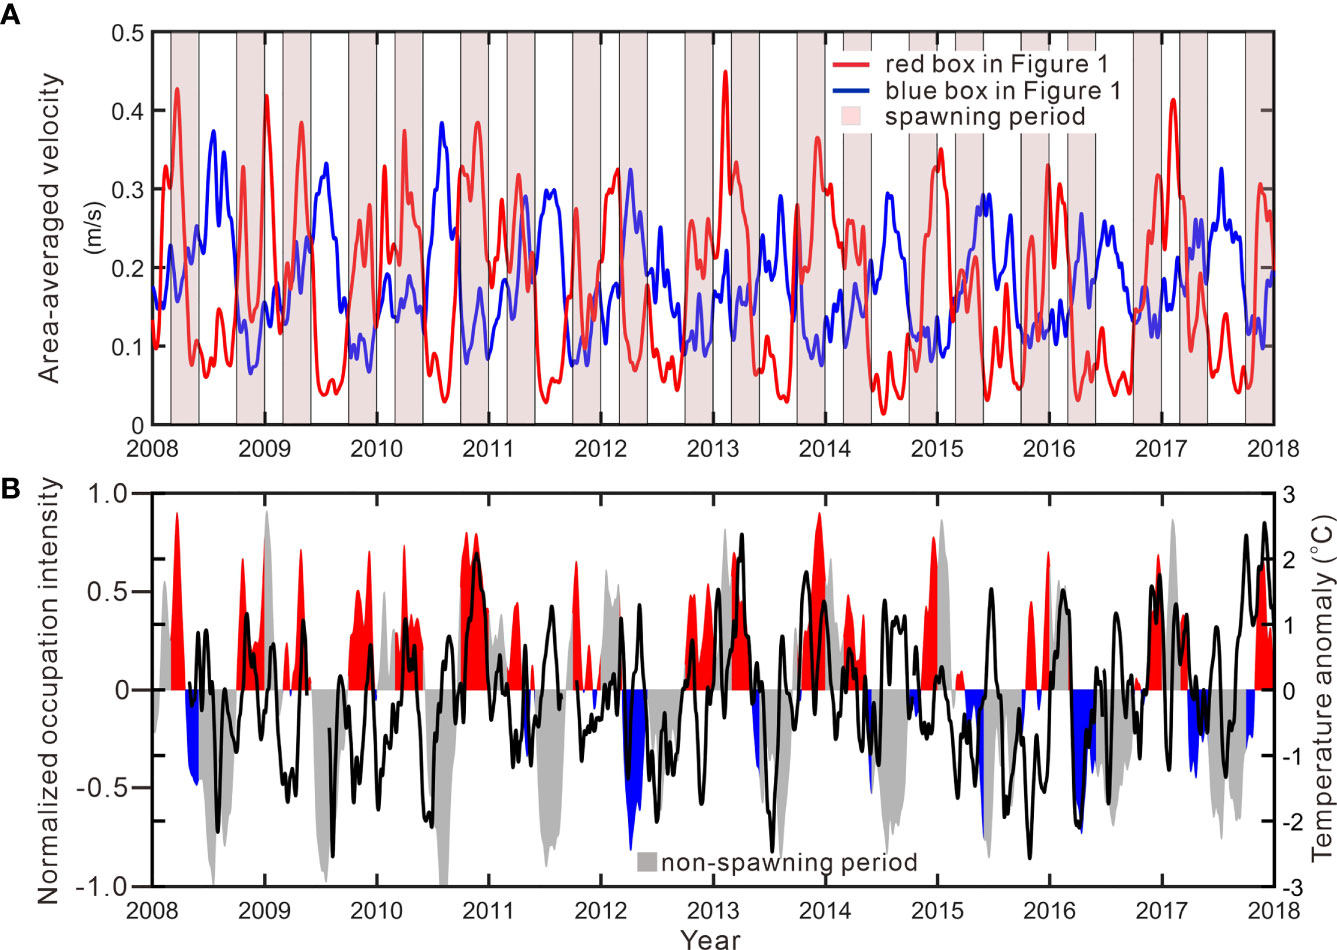
Figure 11 (A) Twenty-day low-pass-filtered area average geostrophic velocity as v > 0 (red line) and u > 0 (blue line) in red and blue boxes, respectively, in Figure 1. Transparent pink shading represent spawning periods of the swordtip squid during 2008–2018. (B) Normalized occupation intensity of warm Kuroshio surface water (filled by red during spawning periods) and ECS shelf or Taiwan Strait water (filled by blue during spawning periods). The normalized occupation intensity is defined as the difference between the red and blue lines in (A) divided by the maximum absolute value of the difference. The difference during non-spawning periods is shown in gray.
We focus on the variability in the prevailing water mass in the cold dome during the spawning periods. The difference in the area average velocity in the red and blue boxes in Figure 10A normalized by the maximum absolute difference is defined as the occupation intensity of the Kuroshio and shelf water in the cold dome. The results are illustrated in Figure 11B. A positive normalized occupation intensity in Figure 11B indicates that the hydrography is dominated by warm Kuroshio surface water (red filled areas) rather than cold shelf water (blue filled areas) and vice versa for a negative value in and around the cold dome region. The highest standardized CPUE in 2013 seemingly corresponds to the dominance of the Kuroshio intrusion and a higher daily mean temperature anomaly during spring spawning in 2013. The two low standardized CPUEs in 2012 and 2016 correspond to unusual dominances of cold shelf water in the cold dome during the spring spawning of the 2 years (blue filled areas in Figure 11B).
Concluding Remarks
This study examined possible connections of the standardized annual CPUE of swordtip squid (Uroteuthis edulis) over 2009–2017 and the physical processes on the southern shelf of the ECS. Previous studies suggested that swordtip squid typically migrate to the cold dome off northern Taiwan for spawning during March–May and October–December each year, and higher seawater temperatures during the spawning and incubation periods are helpful for the growth rate and hence the recruitment and catch of swordtip squid. The standardized annual CPUE was positively correlated with the monthly mean temperature at the Peng-jia-yu isle in October in the previous year and April in the year over the 9 years. Through the analysis of satellite SSTa data, geostrophic velocity, and daily mean temperature anomalies at the Peng-jia-yu isle, we identified that the Kuroshio intrusion to the cold dome region caused 50% of the warm temperature anomaly during the spawning periods. Since the Kuroshio intrusion to the southern shelf of the ECS is a normal situation, as this stratified geostrophic current with Bu at O(1) encounters the steep shelf break northeast of Taiwan, the annual CPUE should also be maintained above a certain value. A higher daily mean temperature anomaly resulted in a higher standardized CPUE in 2013 over the 9 years. Conversely, the blocking of the Kuroshio intrusion due to the cold coastal water in winter is regarded as an abnormal situation in this study. The dominance of the cold and less salty China Coastal Water atop the cold dome in the spring spawning season impeded the warm Kuroshio surface water intrusion to the cold dome and conceivably caused the two anomalously low standardized CPUEs in 2012 and 2016.
Importantly, we introduced a normalized occupation intensity for evaluating the dominance of warm Kuroshio surface water and cold ECS shelf water as a proxy to predict standardized annual CPUE of the swordtip squid. The difference in area average geostrophic velocity in a representative area of the cold dome and a shelf region near the coast of China together with the daily mean temperature anomaly at Peng-jia-yu isle is used to indicate the dynamics dominating the temperature variability in the cold dome during the spawning periods. When the hydrography is dominated by the colder shelf water more than the Kuroshio water during the spawning period, we could expect a lower standardized annual CPUE for the year. The results of this study are hopefully useful for managing swordtip squid catches on the southern shelf of the ECS.
Data Availability Statement
The temperature and sea level records at the Peng-jia-yu isle and the standardized annual CPUE of the swordtip squid used in this study are available at Mendeley Data http://dx.doi.org/10.17632/x5hf63kww4.1 and Mendeley Data http://dx.doi.org/10.17632/2z8t6c9brd.1, respectively. The daily meteorological data at the Peng-jia-ju weather station can be downloaded from Taiwan’s Central Weather Bureau at https://e-service.cwb.gov.tw/HistoryDataQuery/index.jsp. The satellite SST, SSH, SLA, SSC, and geostrophic velocity data can be downloaded from the Copernicus Marine Environment Monitoring Service at http://marine.copernicus.eu/.
Author Contributions
SJ provided the ideal and guided the data analysis of this study. Y-CC analyzed the correlation of the annual CPUE and the environmental data. SJ, Y-CC, and C-CC organized the manuscript. SJ and C-CC wrote the first version of the manuscript. All authors contributed to the article and approved the submitted version.
Funding
This study was partially supported by the Ministry of Science and Technology (MOST) of Taiwan under grant MOST 105-2119-M-002-042.
Conflict of Interest
The authors declare that the research was conducted in the absence of any commercial or financial relationships that could be construed as a potential conflict of interest.
Publisher’s Note
All claims expressed in this article are solely those of the authors and do not necessarily represent those of their affiliated organizations, or those of the publisher, the editors and the reviewers. Any product that may be evaluated in this article, or claim that may be made by its manufacturer, is not guaranteed or endorsed by the publisher.
Acknowledgments
Dr. K.-Y. Chang kindly provided the annual CPUE data of swordtip squid to this study. Two reviewers provided constructive comments which clarified and strengthened the interpretation of this article. The daily meteorological dataset at Peng-jia-ju was downloaded from Taiwan’s Central Weather Bureau at https://e-service.cwb.gov.tw/HistoryDataQuery/index.jsp. The satellite SST, SSH, SLA, SSC, and geostrophic velocity were downloaded from the Copernicus Marine Environment Monitoring Service at http://marine.copernicus.eu/.
Supplementary Material
The Supplementary Material for this article can be found online at: https://www.frontiersin.org/articles/10.3389/fmars.2022.900299/full#supplementary-material
References
Andres M., Mensah V., Jan S., Chang M.-H., Yang Y. J., Lee C. M., et al. (2017). Downstream Evolution of the Kuroshio’s Time-Varying Transport and Velocity Structure. J. Geophys. Res. Oceans 122 5, 3519–3542. doi: 10.1002/2016JC012519
Chang K.-Y., Chen C.-S., Wang H.-Y., Kuo C.-L., Chiu T.-S. (2015b). The Antarctic Oscillation Index as an Environmental Parameter for Predicting Catches of the Argentine Shortfin Squid (Illex Argentinus) Cephalopoda: Ommastrephidae) in Southwest Atlantic Waters. Fish. Bull. 113, 202–212. doi: 10.7755/FB.113.2.8
Chang M.-H., Jan S., Mensah V., Andres M., Rainville L., Yang Y. J., et al. (2018). Zonal Migration and Transport Variations of the Kuroshio East of Taiwan Induced by Eddy Impingements. Deep-Sea Res. I 131, 1–15. doi: 10.1016/j.dsr.2017.11.006
Chang Y., Liao H.-T., Lee M.-A., Chan J.-W., Shieh W.-J., Lee K.-T., et al. (2008). Multisatellite Observation on Upwelling After the Passage of Typhoon Hai-Tang in the Southern East China Sea. Geophys. Res. Lett. 35, L03612. doi: 10.1029/2007GL032858
Chang K.-Y., Wang K.-Y., Liao C.-H. (2018). Analyzing the Abundance Trend of Uroteuthis Edulis in Northern Taiwan Waters Using Generalized Linear Models. J. Taiwan Fish. Res. 26 (1), 1–12.
Chang K.-Y., Wang K.-Y., Liao C.-H., Wu C.-L. (2015a). The Study on the Catch Per Unit Effort Standardization of Uroteuthis Edulis in the Northern Waters of Taiwan. J. Taiwan Fish. Res. 23 (2), 1–14.
Chao S.-Y. (1991). Circulation of the East China Sea: A Numerical Study. J. Oceanogr. Soc Japan 46, 273–295. doi: 10.1007/BF02123503
Chen C.-C., Hsu S.-C., Jan S., Gong G.-C. (2015). Episodic Events Imposed on the Seasonal Nutrient Dynamics of an Upwelling System Off Northeastern Taiwan. J. Mar. Syst. 141, 128–135. doi: 10.1016/j.jmarsys.2014.07.021
Chen C.-C., Jan S., Kuo T.-S., Li S.-Y. (2017). Nutrient Flux and Transport by the Kuroshio East of Taiwan. J. Mar. Syst. 167, 43–54. doi: 10.1016/j.jmarsys.2016.11.004
Chen C.-C., Lu C.-Y., Jan S., Hsieh C.-H., Chung C.-C. (2022). Effects of the Coastal Uplift on the Kuroshio Ecosystem, Eastern Taiwan, the Western Boundary Current of the North Pacific Ocean. Front. Mar. Sci. 9, 796187. doi: 10.3389/fmars.2022.796187
Chen C.-C., Shiah F.-K., Gong G.-C., Chen T.-Y. (2021). Impact of Upwelling on Phytoplankton Blooms and Hypoxia Along the Chinese Coast in the East China Sea. Mar. Poll. Bull. 167, 112288. doi: 10.1016/j.marpolbul.2021.112288
Chern C.-S., Wang J. (1989). On the Water Masses at Northern Offshore Area of Taiwan. Acta Oceanogr. Taiwanica 22, 14–32.
Chern C.-S., Wang J. (1990). On the Mixing of Waters at a Northern Offshore Area of Taiwan. Terr. Atmos. Ocean. Sci. 1 (3), 297–306. doi: 10.3319/TAO.1990.1.3.297(O)
Chern C.-S., Wang J. (1992). The Influence of Taiwan Strait Waters on the Circulation of the Southern East China Sea. La mer 30, 223–228.
Chern C.-S., Wang J. (1994). Influence of the Seasonal Thermocline on the Intrusion of Kuroshio Across the Continental Shelf Northeast of Taiwan. J. Oceanogr. 50, 691–711. doi: 10.1007/BF02270500
Chern C.-S., Wang J., Wang D.-P. (1990). The Exchange of Kuroshio and East China Sea Shelf Water. J. Geophys. Res. 95 (C9), 16017–16023. doi: 10.1029/JC095iC09p16017
Chuang W.-S., Liang W.-D. (1994). Seasonal Variability of Intrusion of the Kuroshio Water Across the Continental Shelf Northeast of Taiwan. J. Oceanogr. 50, 531–542. doi: 10.1007/BF02235422
Chyn S. S., Lee K. T., Liao C. H. (1998). Aggregative Behavior of the Swordtip Squid (Loligo Edulis) Under Fishing Lights in the Coastal Waters of Northern Taiwan. J. Fish. Soc Taiwan 25, 1–15.
Fisheries Agency. (2016). Annual Report of 2016 (Kaohsiung, Taiwan: Fisheries Agency, Council of Agriculture, Executive Yuan), 188.
Hsueh Y., Wang J., Chern C.-S. (1992). The Intrusion of the Kuroshio Across the Continental Shelf Northeast of Taiwan. J. Geophys. Res. Oceans 97 (C9), 14323–14330. doi: 10.1029/92JC01401
Hu C.-K., Chiu C.-T., Chen S.-H., Kuo J.-Y., Jan S., Tseng Y.-H. (2010). Numerical Simulation of Barotropic Tides Around Taiwan, Terr. Atmos. Ocean. Sci. 21 (1), 71–84. doi: 10.3319/TAO.2009.05.25.02
Jan S., Chen C.-C., Tsai Y.-L, Yang Y. J., Wang J., Chern C.-S., et al (1994). Mean Structure and Variability of the Cold Dome Northeast of Taiwan. Oceanography 24 (4), 100–109. doi: 10.5670/oceanog.2011.98
Jan S., Chern C.-S., Wang J. (1994). A Numerical Study on Currents in the Taiwan Strait During Summertime. La mer 32, 225–234.
Jan S., Mensah V., Andres M., Chang M.-H., Yang Y. J. (2017). Eddy-Kuroshio Interactions: Local and Remote Effects. J. Geophys. Res. Oceans 122, 9744–9764. doi: 10.1002/2017JC013476
Jan S., Sheu D. D., Kuo H. M. (2006). Water Mass and Throughflow Transport Variability in the Taiwan Strait. J. Geophys. Res. Oceans 111, C12012. doi: 10.1029/2006JC003656
Jan S., Wang J., Chern C.-S., Chao S.-Y., et al. (2002). Seasonal Variation of the Circulation in the Taiwan Strait. J. Mar. Syst. 35 (3-4), 249–268. doi: 10.1016/S0924-7963(02)00130-6
Jan S., Yang Y. J., Wang J., Mensah V., Kuo T.-H., Chiou M.-D., et al. (2015). Large Variability of the Kuroshio at 23.75°N East of Taiwan. J. Geophys. Res. Oceans 120, 1825–1840. doi: 10.1002/2014JC010614
Johns W. E., Lee T. N., Zhang D., Zantopp R., Liu C.-T., Yang Y. (2001). The Kuroshio East of Taiwan: Moored Transport Observations From the WOCE PCM-1 Array. J. Phys. Oceanogr. 31, 1031–1053. doi: 10.1175/1520-0485(2001)031<1031:TKEOTM>2.0.CO;2
Liao C.-H., Lan K.-W., Ho H.-Y., Wang K.-Y., Wu Y.-L. (2018). Variation in the Catch Rate and Distribution of Swordtip Squid Uroteuthis Edulis Associated With Factors of the Oceanic Environment in the Southern East China Sea. Mar. Coast. Fish. 10 (4), 452–464. doi: 10.1002/mcf2.10039
Liao C.-H., Lee M.-A., Lan Y.-C., Lee K.-T. (2006). The Temporal and Spatial Change in Position of Squid Fishing Ground in Relation to Oceanic Features in the Northeastern Waters of Taiwan. J. Fish. Soc Taiwan 33, 99–113. doi: 10.29822/JFST.200606.0002
Lien R.-C., Sanford T. B., Jan S., Yang S., Chang M.-H., Ma B. B., et al. (2013). Internal Tides on the East China Sea Continental Slope. J. Mar. Res. 71 (1-2), 151–185. doi: 10.1357/002224013807343461
Liu K. K., Gong G.-C., Lin S., Yang C. Y., Wei C. L., Pai S.-C., et al. (1992). The Year-Round Upwelling at the Shelf Break Near the Northern Tip of Taiwan as Evidenced by Chemical Hydrography. Terr. Atmos. Ocean. Sci. 3, 243–275. doi: 10.3319/TAO.1992.3.3.243(KEEP)
Liu S., Liu Y., Fu C., Yan L., Xu Y., Wan R., et al. (2019). Using Novel Spawning Ground Indices to Analyze the Effects of Climate Change on Pacific Saury Abundance. J. Mar. Syst. 191, 13–23. doi: 10.1016/j.jmarsys.2018.12.007
Mensah V., Jan S., Andres M., Chang M.-H. (2020). Response of the Kuroshio East of Taiwan to Mesoscale Eddies and Upstream Variations. J. Oceanogr 76, 271–288. doi: 10.1007/s10872-020-00544-8
Merkine L.-O. (1975). Steady Finite-Amplitude Baroclinic Flow Over Long Topography in a Rotating Stratified Atmosphere. J. Atmos. Sci. 32 (10), 1881–1893. doi: 10.1175/1520-0469(1975)032<1881:SFABFO>2.0.CO;2
Merkine L.-O., Eugenia K. R. (1976). Rotating Stratified Flow Over Finite Isolated Topography. J. Atmos. Sci. 33 (6), 908–922. doi: 10.1175/1520-0469(1976)033<0908:RSFOFI>2.0.CO;2
Morimoto A., Kojima S., Jan S., Takahashi D. (2009). Movement of the Kuroshio Axis to the Northeast Shelf of Taiwan During Typhoon Events. Estuar. Coast. Shelf Sci. 82, 547–552. doi: 10.1016/j.ecss.2009.02.022
Oey L.-Y., Hsin Y.-C., Wu C.-R. (2010). Why Does the Kuroshio Northeast of Taiwan Shift Shelfward in Winter? Ocean Dyn. 60, 413–426. doi: 10.1007/s10236-009-0259-5
Shen M.-L., Tseng Y.-H., Jan S. (2011). The Formation and Dynamics of the Cold-Dome Off Northeastern Taiwan. J. Mar. Sys. 86, 1–2. doi: 10.1016/j.jmarsys.2011.01.002
Song H., Ding T., Xu K. (2008). The Quantity Distribution and Growth Characteristics of Loligo Edulis in the East China Sea. J. Zhejiang Ocean Univ. (Natural Science) 27, 115–118.
Tang T.-Y., Hsueh Y., Yang Y. J., Ma J.-C. (1999). Continental Slope Flow Northeast of Taiwan. J. Phys. Oceanogr. 29, 1353–1362. doi: 10.1175/1520-0485(1999)029<1353:CSFNOT>2.0.CO;2
Tang T.-Y., Tai J.-H., Yang Y. J. (2000). The Flow Pattern North of Taiwan and the Migration of the Kuroshio. Cont. Shelf Res. 20, 349–371. doi: 10.1016/S0278-4343(99)00076-X
Tsai C.-J., Andres M., Jan S., Mensah V., Sanford T. B., Lien R.-C., et al. (2015). Eddy-Kuroshio Interaction Processes Revealed by Mooring Observations Off Taiwan and Luzon. Geophys. Res. Lett. 42, 8098–8105. doi: 10.1002/2015GL065814
Tsai Y., Chern C.-S., Wang J. (2008). Typhoon Induced Upper Ocean Cooling Off Northeastern Taiwan. Geophys. Res. Lett. 35, L14605. doi: 10.1029/2008GL034368
Vélez-Belchí P., Centurioni L. R., Lee D.-K., Jan S., Niiler P. P. (2013). Eddy Induced Kuroshio Intrusions Onto the Continental Shelf of the East China Sea. J. Mar. Res. 71 (1–2), 83–108. doi: 10.1357/002224013807343470
Waluda C. M., Trathan P. N., Rodhouse P. G. (1999). Influence of Oceanographic Variability on Recruitment in the Illex Argentinus (Cephalopoda: Ommastrephidae) Fishery in the South Atlantic. Mar. Ecol. Prog. Ser. 183, 159–167. doi: 10.3354/meps183159
Wang K. Y., Chang K. Y., Liao C. H., Lee M. A., Lee K. T. (2013). Growth Strategies of the Swordtip Squid, Uroteuthis Edulis, in Response to Environmental Changes in the Southern East China Sea–a Cohort Analysis. Bull. Mar. Sci. 89, 677–698. doi: 10.5343/bms.2012.1044
Wang K.-Y., Lee K.-T., Liao C.-H. (2010). Age, Growth and Maturation of Swordtip Squid (Photololigo Edulis) in the Southern East China Sea. J. Mar. Sci. Tech. 18 (1), 99–105. doi: 10.51400/2709-6998.1870
Wang K.-Y., Liao C.-H., Lee K.-T. (2008). Population and Maturation Dynamics of the Swordtip Squid (Photololigo Edulis) in the Southern East China Sea. Fish. Res. 90 (1–3), 178–186. doi: 10.1016/j.fishres2007.10.015
Wu C.-R., Hsin Y.-C., Chiang T.-L., Lin Y.-F., Tsui I.-F. (2014). Seasonal and Interannual Changes of the Kuroshio Intrusion Onto the East China Sea Shelf. J. Geophys. Res. Oceans 119, 5039–5051. doi: 10.1002/2013JC009748
Wu C.-R., Lu H.-F., Chao S.-Y. (2008). A Numerical Study on the Formation of Upwelling Off Northeast Taiwan. J. Geophys. Res. Oceans 113, C08025. doi: 10.1029/2007JC004697
Yamaguchi T., Kawakami Y., Matsuyama M. (2015). Migratory Routes of the Swordtip Squid Uroteuthis Edulis Inferred From Statolith Analysis. Aquat. Biol. 24, 53–60. doi: 10.3354/ab00635
Yang D., Huang R. X., Yin B., Feng X., Chen H., Qi J., et al. (2018a). Topographic Beta Spiral and Onshore Intrusion of the Kuroshio Current. Geophys. Res. Lett. 45, 287–296. doi: 10.1002/2017GL076614
Yang Y. J., Jan S., Chang M. H., Wang J., Mensah V., Kuo T. H., et al. (2015). Mean Structure and Fluctuations of the Kuroshio East of Taiwan From in Situ and Remote Observations. Oceanogr 28 (4), 74–83. doi: 10.5670/oceanog.2015.83
Yang Y., Liu C.-T., Hu J.-H., Koga M. (1999). Taiwan Current (Kuroshio) and Impinging Eddies. J. Oceanogr. 55, 609–617. doi: 10.1023/A:1007892819134
Yang D., Yin B., Chai F., Feng X., Xue H., Gao G., et al. (2018b). The Onshore Intrusion of Kuroshio Subsurface Water From February to July and a Mechanism for the Intrusion Variation. Prog. Oceanogr. 167, 97–115. doi: 10.1016/j.pocean.2018.08.004
Yu W., Zhang Y., Chen X., Yi Q., Qian W. (2018). Response of Winter Cohort Abundance of Japanese Common Squid Todarodes Pacificus to the ENSO Events. Acta Oceanol. Sin. 37, 61–71. doi: 10.1007/s13131-018-1186-4
Keywords: Kuroshio intrusion, cold dome, East China Sea Shelf, occupation intensity, swordtip squid resource, catch per unit effort (CPUE)
Citation: Cheng Y-C, Jan S and Chen C-C (2022) Kuroshio Intrusion and Its Impact on Swordtip Squid (Uroteuthis edulis) Abundance in the Southern East China Sea. Front. Mar. Sci. 9:900299. doi: 10.3389/fmars.2022.900299
Received: 20 March 2022; Accepted: 28 April 2022;
Published: 30 May 2022.
Edited by:
Kuoping Chiang, National Taiwan Ocean University, TaiwanReviewed by:
Meng-Hsien Chen, National Sun Yat-sen University, TaiwanZhixuan Feng, East China Normal University, China
Copyright © 2022 Cheng, Jan and Chen. This is an open-access article distributed under the terms of the Creative Commons Attribution License (CC BY). The use, distribution or reproduction in other forums is permitted, provided the original author(s) and the copyright owner(s) are credited and that the original publication in this journal is cited, in accordance with accepted academic practice. No use, distribution or reproduction is permitted which does not comply with these terms.
*Correspondence: Sen Jan, c2VuamFuQG50dS5lZHUudHc=