- 1Sorbonne Université (CNRS-IRD-MNHN), Laboratoire LOCEAN-IPSL, Paris Cedex, France
- 2Nansen Environmental and Remote Sensing Center, Bergen, Norway
- 3CEA (CNRS-UVSQ), Laboratoire LSCE-IPSL, Université Paris-Saclay, Gif-sur-Yvette, France
- 4IRD (Sorbonne Université/UPMC-CNRS-MNHN), Laboratoire LOCEAN-IPSL, Paris Cedex, France
- 5Parc National Marin de Mayotte, Aéroport de Dzaoudzi, Petite Terre, Mayotte, France
Coral reefs are increasingly in jeopardy due to global changes affecting both reef accretion and bioerosion processes. Bioerosion processes dynamics in dead reef carbonates under various environmental conditions are relatively well understood but only over a short-term limiting projections of coral reef evolution by 2100. It is thus essential to monitor and understand bioerosion processes over the long term. Here we studied the assemblage of traces of microborers in a coral core of a massive Diploastrea sp. from Mayotte, allowing us to explore the variability of its specific composition, distribution, and abundance between 1964 and 2018. Observations of microborer traces were realized under a scanning electron microscope (SEM). The area of coral skeleton sections colonized by microborers (a proxy of their abundance) was estimated based on an innovative machine learning approach. This new method with 93% accuracy allowed analyzing rapidly more than a thousand SEM images. Our results showed an important shift in the trace assemblage composition that occurred in 1985, and a loss of 90% of microborer traces over the last five decades. Our data also showed a strong positive correlation between microborer trace abundance and the coral bulk density, this latter being particularly affected by the interannual variation of temperature and cumulative insolation. Although various combined environmental factors certainly had direct and/or indirect effects on microboring species before and after the breakpoint in 1985, we suggest that rising sea surface temperature, rainfall, and the loss of light over time were the main factors driving the observed trace assemblage change and decline in microborer abundance. In addition, the interannual variability of sea surface temperature and instantaneous maximum wind speed appeared to influence greatly the occurrence of green bands. We thus stress the importance to study more coral cores to confirm the decadal trends observed in the Diploastrea sp. from Mayotte and to better identify the main factors influencing microboring communities, as the decrease of their abundance in living massive stress tolerant corals may have important consequences on their resilience.
1. Introduction
In recent years there has been a rising interest in better understanding the diversity and the functional roles of bioeroding microflora (cyanobacteria, algae, fungi) in reef carbonate budget and scleractinian corals health (Marcelino and Verbruggen, 2016; Del Campo et al., 2017; Schönberg et al., 2017; Tribollet et al., 2019; Ricci et al., 2019). This became particularly an emerging topic since the frequency of periods of thermal stress and marine heat waves has increased, affecting dramatically coral reefs worldwide (Hughes et al., 2018; Wernberg et al., 2021). The last IPCC report (2019) estimated that up to 99% of corals and reefs may disappear with +2°C of global warming before the end of the century if nothing is done to both reduce considerably CO2 emissions into the atmosphere and local disturbances (see also Perry et al., 2014; Schönberg et al., 2017; Eyre et al., 2018; Tribollet et al., 2019). Nevertheless, to better predict the fate of coral reefs there is still a crucial need to understand the long-term dynamics of reef bioerosion processes, especially that of biogenic dissolution of carbonates by microboring flora as it is one of the main processes of reef dissolution (Schönberg et al., 2017; Tribollet et al., 2019) and the ability of corals to adapt and to be resilient to changes owing to their microbiome (Hughes et al., 2003; Ainsworth et al., 2017; McManus et al., 2021). To date, only a few bioerosion studies focused on the effects of hypersedimentation, eutrophication and ocean acidification and warming on microboring communities colonizing dead carbonate substrates (mostly dead corals) over short periods, i.e. over a few months or years (Carreiro-Silva et al., 2005; Tribollet, 2008a; Tribollet et al., 2009; Reyes-Nivia et al., 2013; Grange et al., 2015; Enochs et al., 2016; Tribollet et al., 2019). Those studies showed that ocean acidification, warming and eutrophication stimulate the growth of phototrophic microborers and therefore increase rates of biogenic dissolution of dead carbonates in short-term (Carreiro-Silva et al., 2005; Carreiro-Silva et al., 2009; Tribollet et al., 2009; Reyes-Nivia et al., 2013; Enochs et al., 2016; Tribollet et al., 2019) while hypersedimentation limits greatly microboring community development due to light limitation (Tribollet, 2008b). As long-term in situ experiments are difficult to conduct, an interesting alternative to study the effects of environmental changes on microboring communities over decades is to study those communities in slow-growing corals. Those latter are indeed known to be good bio-archives recording environmental changes over decades and centuries (Zinke et al., 2008; Montagna et al., 2014; Zinke et al., 2015; Wu et al., 2018; Cuny-Guirriec et al., 2019). While microborer communities have been known to be part of the coral holobiont microbiome since the early 20th century and to be potentially an important ecto-symbiont (e.g. Odum and Odum, 1955), they have only recently attracted considerable attention (see review by Ricci et al., 2019). Within the past few years, several studies have thus investigated the genetic diversity of the endolithic microbiome, and especially that of the dominant euendolith, the chlorophyte Ostreobium sp. (Marcelino and Verbruggen, 2016; Sauvage et al., 2016; Yang et al., 2016; Del Campo et al., 2017; Massé et al., 2020) and its possible implications in coral growth, physiology and photoprotection (Sangsawang et al., 2017; Massé et al., 2018; Galindo-Martínez et al., 2022). Conversely, the species composition, distribution and abundance of microboring communities in living corals remain poorly known and most studies focused only on communities located within the first few centimeters below coral tissues of adult colonies (Odum and Odum, 1955; Lukas, 1973; Kühl and Polerecky, 2008; Fordyce et al., 2021; Galindo-Martínez et al., 2022). Massé et al. (2018) were the first to show that microborers colonize branching corals from the substrate of fixation as soon as the primary polyp forms its carbonate basal plate (within 7 days after metamorphosis). Then, microborers which are mainly phototrophic microorganisms dominated by Ostreobium sp., keep following the growth of their coral host to maintain their access to light and thus their metabolic activity (Le Campion-Alsumard et al., 1995a; Magnusson et al., 2007; Massé et al., 2018). In branching corals, microboring communities dominated by Ostreobium sp. do not form green bands as the host growth is too fast and ‘dilute’ filaments (Godinot et al., 2012; Massé et al., 2018). In contrast, a more or less intense green band is usually seen just below the coral host tissue layer in slow-growing massive corals (Le Campion-Alsumard et al., 1995a; see for instance Figure 1 in Verbruggen and Tribollet, 2011). Sometimes alternating white and colored bands can be observed in massive corals indicating the past presence of boring microflora (Le Campion-Alsumard et al., 1995a; Le Campion-Alsumard et al., 1995b; Priess et al., 2000; Carilli et al., 2010). But very little is known about microborers’ abundance variability over the life course of their coral host, especially in massive long-lived corals. To the best of our knowledge, only Lukas (1973), Le Campion-Alsumard et al. (1995a) and Priess et al. (2000) truly quantified the abundance of microborers in white versus green or black bands in living corals and showed a greater abundance of traces, and chlorophyll b characteristic of Ostreobium sp., in colored bands than in white ones. Priess et al. (2000) suggested that most colored bands observed in massive Porites from the Indo-Pacific could be due to a limited coral growth rate occurring at the end of the rainy (summer) season. Carilli et al. (2010) who studied the pattern of alternating white and green bands without quantifying microborers in several massive corals like Montastrea faveolata over the last century, suggested that the presence of green bands may be due to microboring phototrophs’ blooms during coral paling episodes as they did not find any correlation with coral growth. They also suggested that local-scale forcing factors are likely at play but found no significant relationship between physical parameters such as sea surface temperature and the presence of green bands. Therefore, the origin of the variability of microborers abundance in massive corals remain to be understood. Here, we studied a very well preserved coral core of a slow-growing colony of Diploastrea sp. from Mayotte (Western Indian Ocean) presenting several green bands and covering the last 54 years to: (i) identify the main types of microborers and if shifts in their trace assemblage composition could be observed over time, (ii) better understand the relationship between the abundance of microborers and the presence of green bands, (iii) determine microborers abundance variability over the last five decades, and (iv) identify the main abiotic and/or biotic factors that could influence such variability. To reach those goals, we developed an innovative approach based on machine learning, allowing the identification of the different main types of microborings (microborer traces), the estimation of their relative abundance, and a precise, continuous, and rapid quantification of the area of the coral skeleton they colonized along the core (proxy of their abundance). To determine the possible abiotic and biotic factors influencing the variability of microborers abundance over the last decades, we also measured the main coral skeleton parameters (vertical extension and bulk density) along the core and collected the following environmental data from available databases: Sea Surface Temperature (SST), Sea Surface Temperature Anomalies (SSTA), precipitations, instantaneous maximum wind speed (instant max wind speed), and the cumulative insolation duration over the last 54 years.
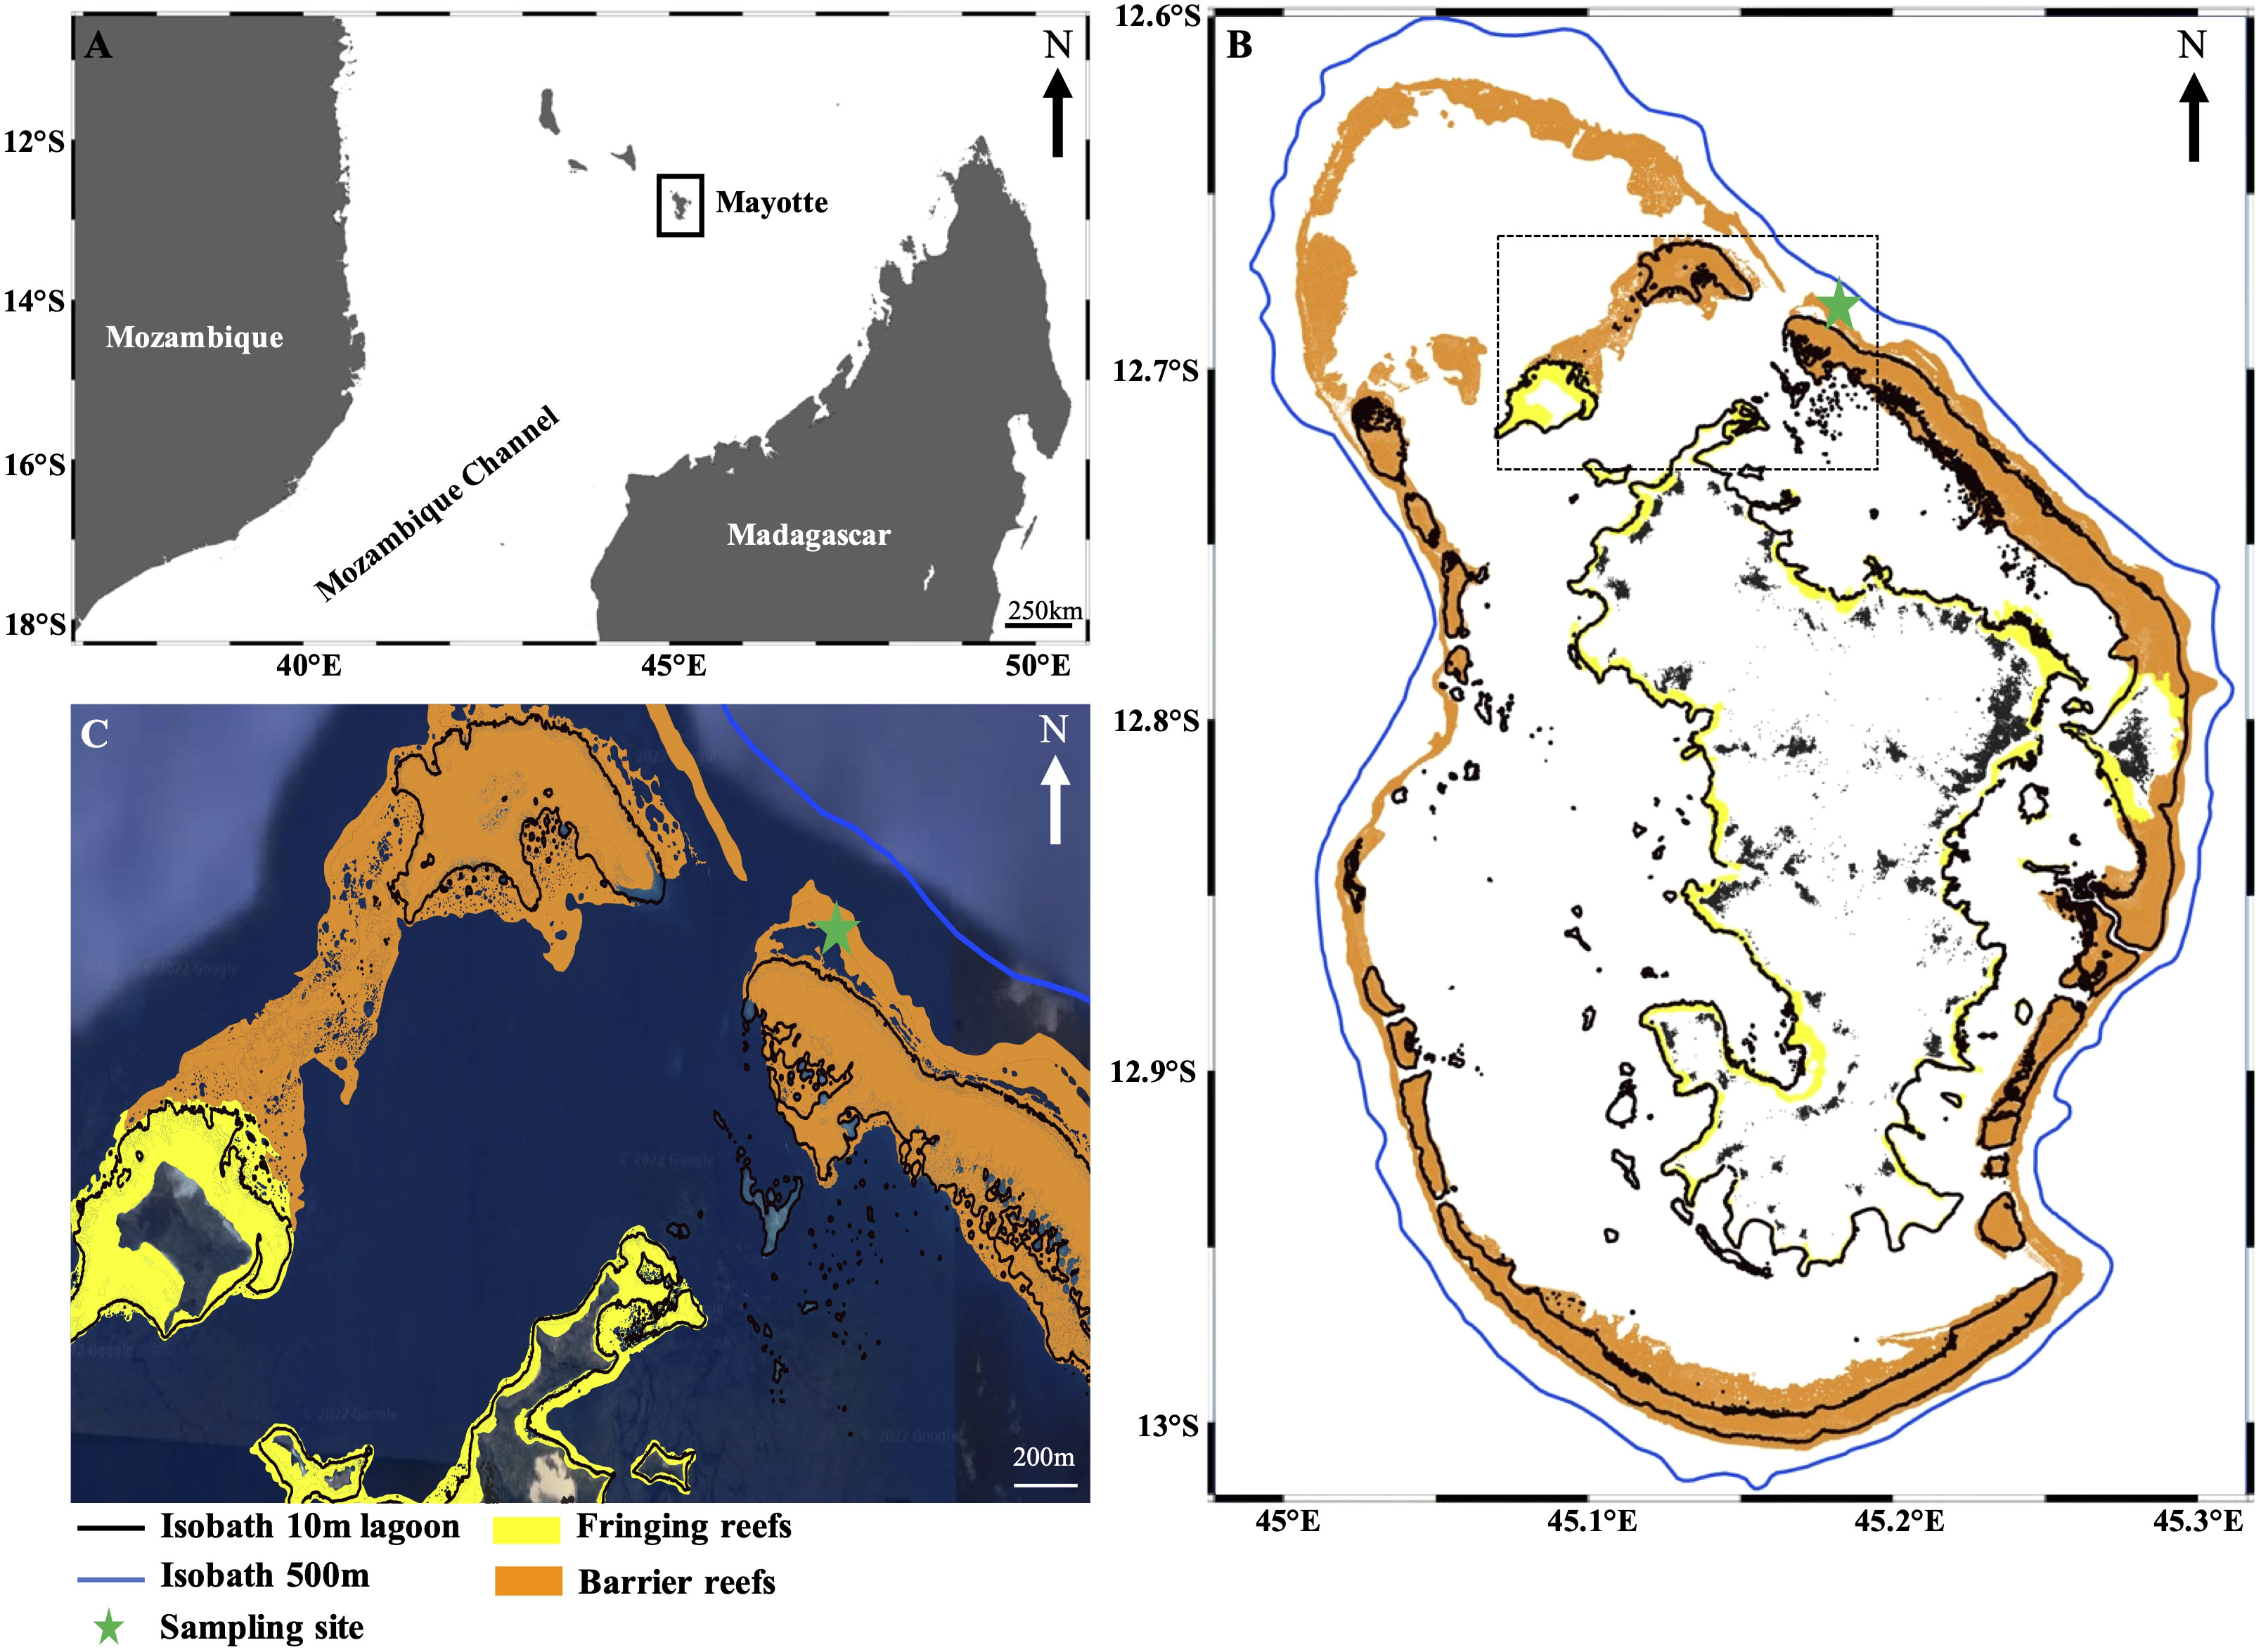
Figure 1 Location of the sample site. (A) Mayotte in the Western Indian Ocean (WIO). (B) Reef ecosystems around Mayotte. The blue line and black lines represent the different isobaths around the island. The green star indicates the sampling location in the northeastern part of the lagoon (C) Details of the northeastern part of the lagoon showing the barrier reef near the M’Tsamboro pass and the sampling location on the outer slope (green star).
2. Material and methods
2.1. Study site
Mayotte, a french tropical island located in the northern part of the Mozambique Channel (Western Indian Ocean, Figure 1), is dominated by a monsoonal wind system although two seasons can be distinguished: a hot windy and rainy monsoon season from November to April, and a dry season from May to October (Zinke et al., 2008; Jeanson et al., 2014; Vinayachandran et al., 2021). Vinayachandran et al. (2021) showed that Mayotte experiences hot and humid winds stress predominantly from the north to northeast during the austral summer and cool, dry winds from south to southeast winds during the austral winter. Mayotte is also located at the northern part of the vortex zone generated in the Mozambique Channel (Chevalier et al., 2017), and on the northwest extension of the South Equatorial Current (SEC) that branch out northward into the East African Coastal Current (EACC) and southward into the Northeast Madagascar Current (NMC, Schott and McCreary, 2001; Vinayachandran et al., 2021). Historically, Mayotte island is subject to temperatures around 26.4 to 27.6°C in winter and 27.5 to 29°C in summer (Zinke et al., 2008). To determine the possible main abiotic drivers that could influence microborers abundance in the studied coral core, the following environmental parameters were collected: Monthly SST (in °C), SSTA (in °C), precipitation rate (in mm), the maximum instantaneous wind speed (in km*h-1) and the cumulative insolation (in hours; see Table 1). Monthly SST were extracted from the National Oceanic and Atmospheric Administration (NOAA) database from the “Extended Reconstructed Sea Surface Temperature” v5 (ERSST) (https://www.ncei.noaa.gov/products/extended-reconstructed-sst), and then averaged to get yearly dataset at a spatial resolution of 2.0° x 2.0°. SSTAs were reconstructed from SST measured in situ by buoys and ships, and Argo observations (https://argo.ucsd.edu/) also at a resolution of 2° x 2° (Table 1, Huang et al., 2015; Huang et al., 2017). The other environmental data were collected via Météo France, at two different stations: one located at the meteorological station of M’Tsamboro for the period 1993-2018 (northern part of Mayotte near the study site) and one located at the meteorological station of Pamandzi for the period 1964-1992 as it was the only station which recorded environmental data for the considered period in the northeastern part of Mayotte (https://publitheque.meteo.fr/okapi/accueil/okapiWebPubli/index.jsp).
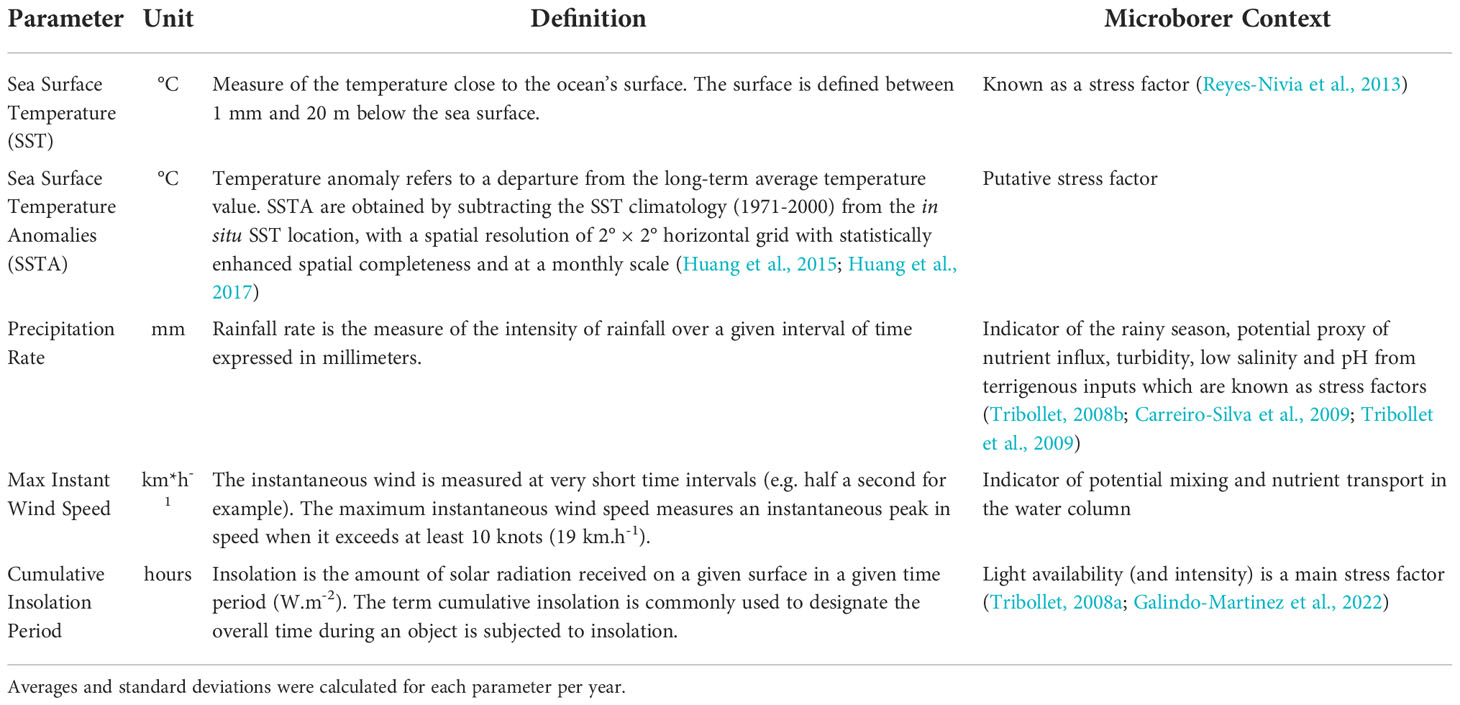
Table 1 Considered environmental parameters that could potentially influence microborers abundance over the last five decades (1964-2018) in the living coral Diploastrea sp. (Mayotte).
2.2. Coral sampling
The studied coral core was collected from a massive slow-growing coral of the genus Diploastrea (Figure 2A) on the outer slope of the barrier reef at 15 m depth near the M’Tsamboro pass (northeastern part of the lagoon of Mayotte Lat. 12°37’19.4”S - Long. 45°06’42.7”E; Figure 1) in October 2018. We selected this site to focus on the influence of oceanic conditions on microboring assemblages in living corals instead of local disturbances, although these cannot be discarded. The coral core was collected with an 8 cm compressed air driller and measured 19.5 cm in length. It presented 10 green bands visible by the naked eye (Figure 2B). Quickly after cutting the coral core, the position and the thickness of each green band along the core were recorded with a Vernier caliper under a dissecting microscope (NIKON Eclipse LV100, Bondy, France)
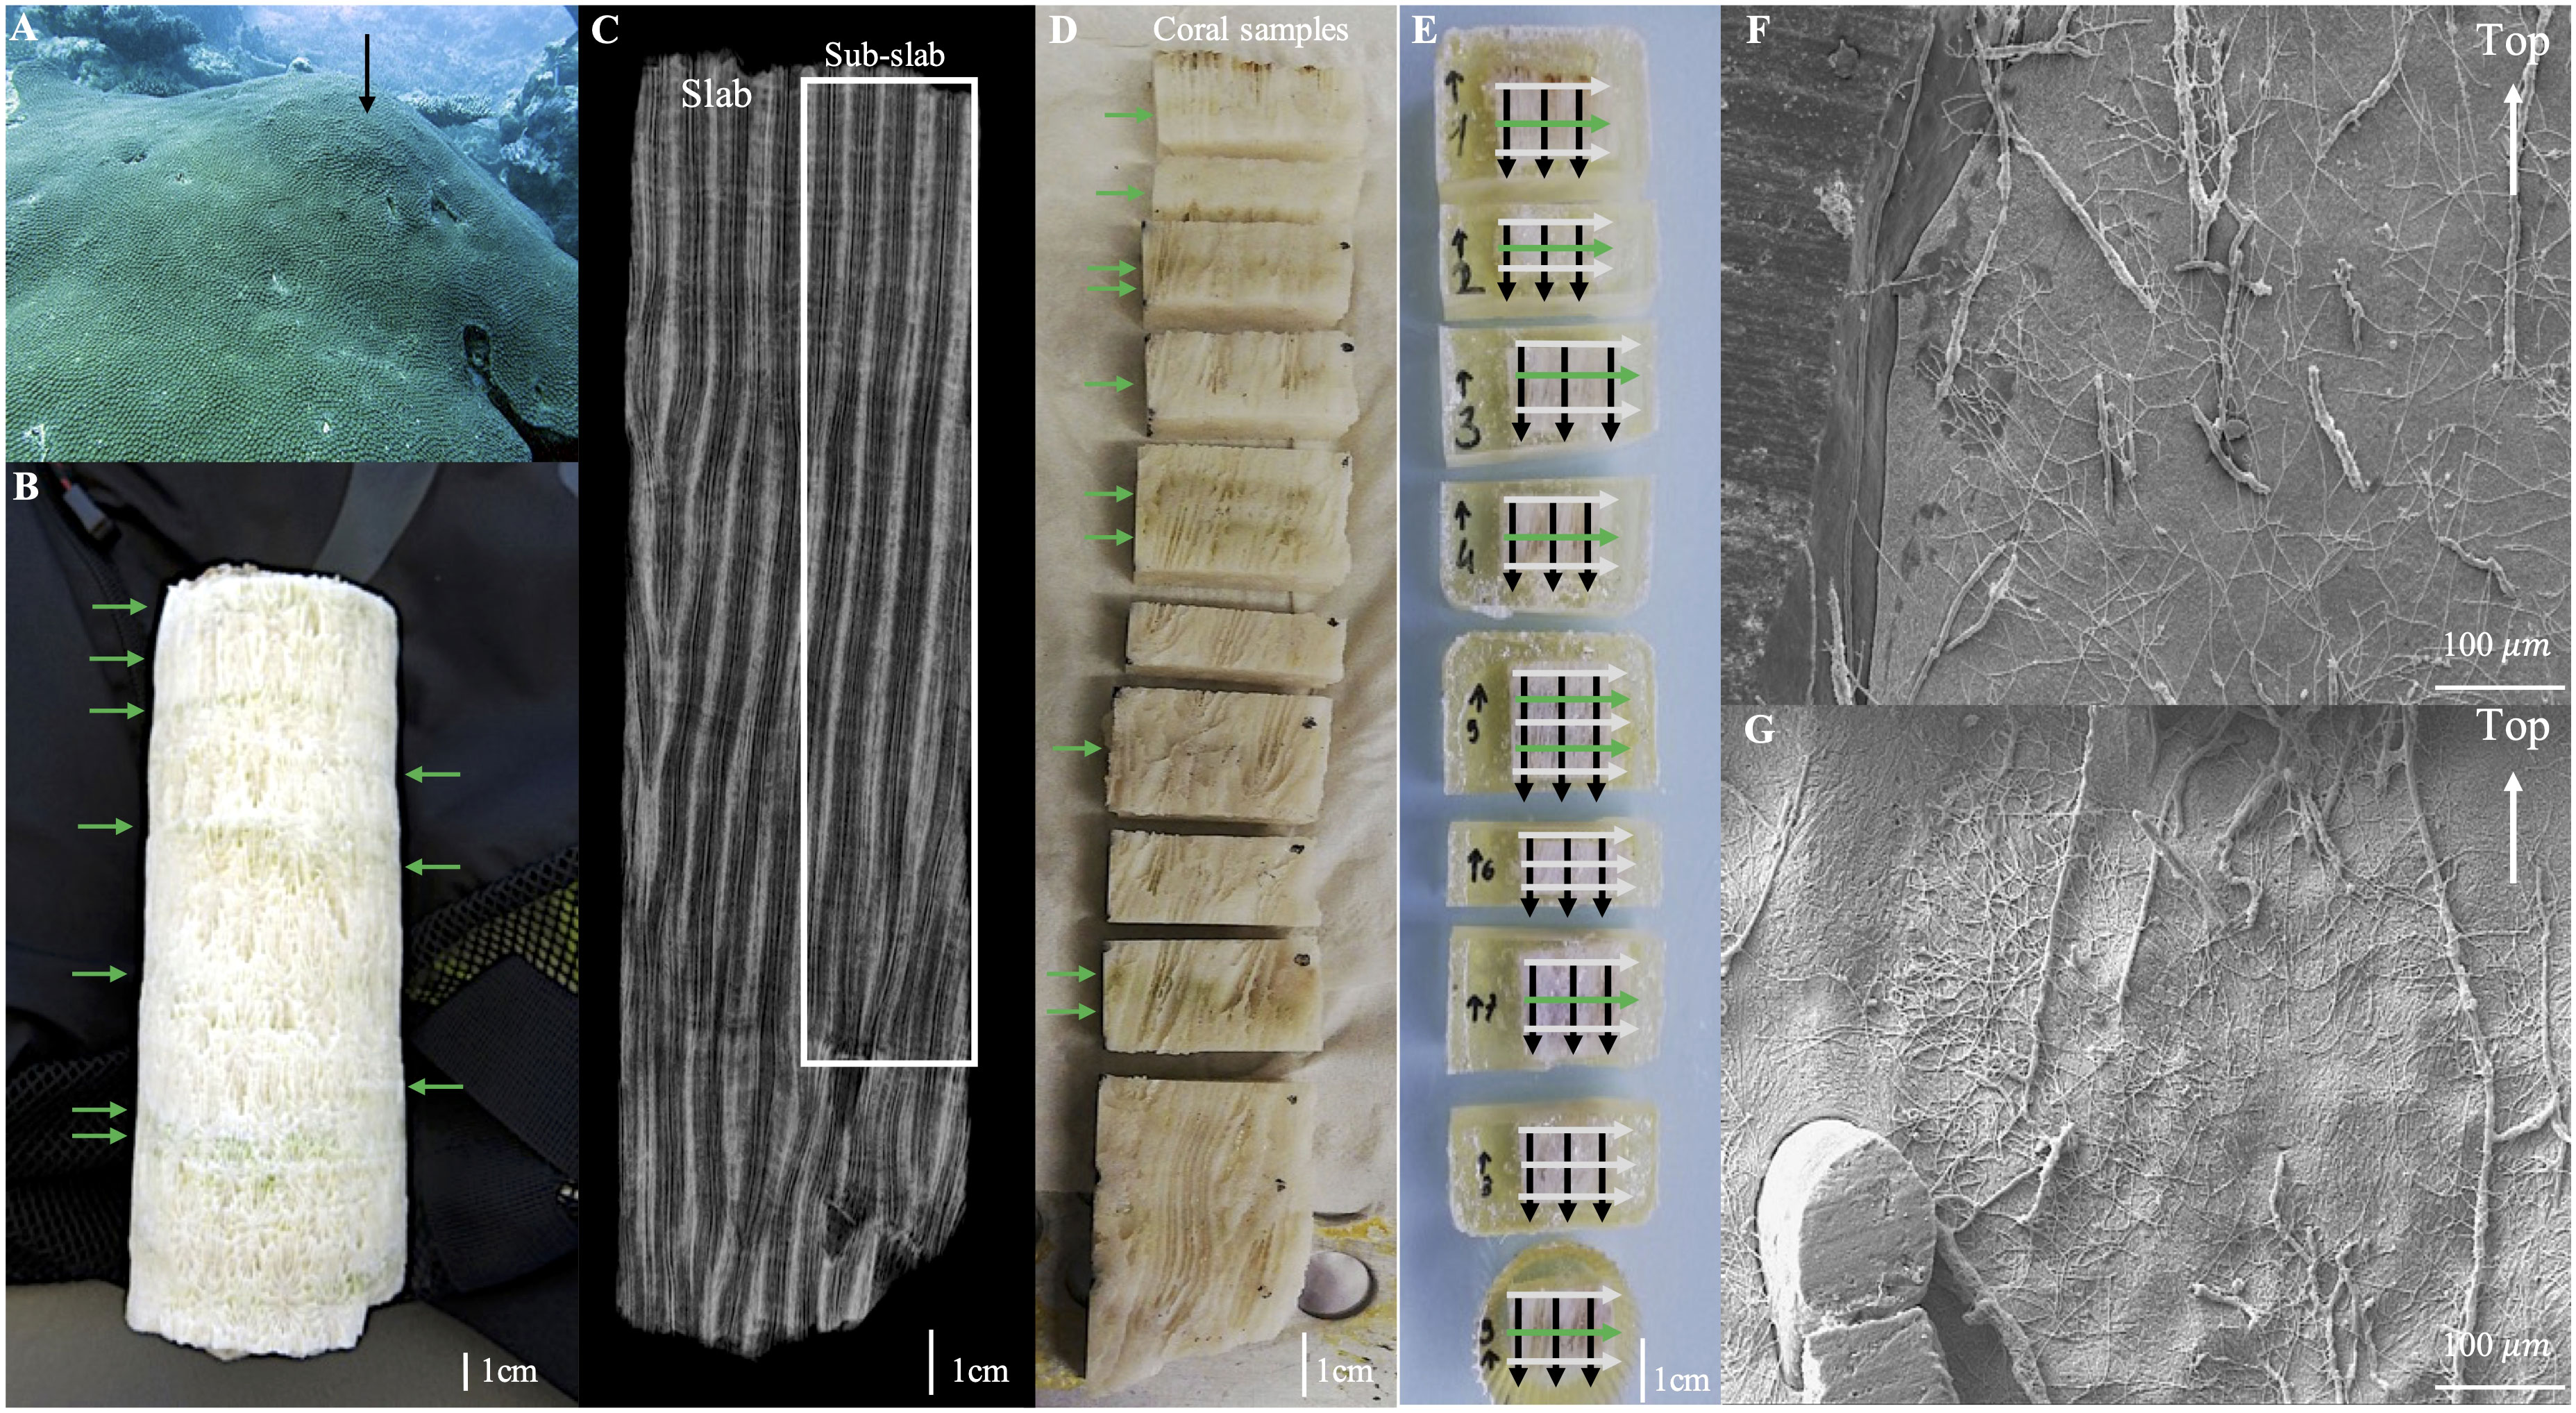
Figure 2 Studied Diploastrea coral colony at Mayotte. (A) Diploastrea colony at 15 m depth. The black arrow indicates where the colony was sampled. (B) Diploastrea core with visible green bands (green arrows). (C) X-ray radiograph of one middle slab cut out of the Diploastrea core measuring 19.5 cm long showing the annual density banding pattern. The studied area is indicated by the white rectangle. (D) Ten samples were cut from the radiographed slab of Diploastrea core. Only the first nine samples from the top were analyzed to estimate the microborer traces’ abundance. Green arrows indicate green bands. (E) Resin impregnation of the 9 samples. Horizontal white and green arrows represent the horizontal transects where measurements of microborings abundance were realized (i.e. within white vs green bands). The black arrows represent the vertical transects studied in each sub-sample. (F, G) Different resin casts of microborings observed under scanning electron microscope after resin impregnation of coral samples and partial decalcification.
2.3. Coral growth variables
Two coral variables were measured along the coral core: the vertical linear extension (mm*y-1) and the skeletal bulk density (g*cm-3). Prior to measurements, the Diploastrea core was sliced along the main vertical growth axis into four different slabs (the middle slabs being ~ 1 cm thick). All slabs were well preserved as no diagenetic nor macrobioerosion traces were observed either by eye or under Scanning Electron Microscopy (SEM), except in one area in the bottom part of the core (i.e. the last 4.5 cm of the core). We thus avoided this area and studied only the first 15 cm of the core (see Figure 2C). The 4 slabs were scanned together on a Discovery CT750 HD CT scanner (GE Healthcare) set at 120 kV at the DOSEO ‘Radiography and Imaging Technology Platform R and D center’ (CEA-Saclay, Paris) with three coral standards to obtain a 3D image of the coral core (reconstructed from hundreds of 2D images). The 3D image revealed the pattern of the coral skeleton structure and its density variation over time. Three coral standards cut from massive colonies of Porites sp. (n = 2) and Diploastrea sp. (n = 1) were prepared manually with a band saw to produce coral geometric blocks (cubes and cylinders) of different sizes. The bulk density of those coral standards was measured with both the buoyant weight technique (Bucher et al., 1998) and a recently developed method applying a Gaussian Mixture Model (Coulibaly, 2021). The GMM model allowed distinguishing the different voxels of the 3D image of the coral standards. Voxels corresponded to either one of the following categories: ‘coral’, ‘air’ (entrapped in coral pores for instance), or ‘table’ (on which the core was placed in the CT scanner). Coral standards were thus used for calibration to obtain Gaussian distributions of the different categories in Hounsfield units (HU). By comparing coral bulk densities of standards measured by buoyant weight vs the GMM, the following linear regression was obtained: Density = 0.00084 ∗ H U + 0.51 where HU is the Gaussian distribution of voxels corresponding to the ‘coral’ in Hounsfield units (r = 0.99, p-value< 0.001). The uncertainty of the bulk density measurement with this method was less than 1%. This is only true when the GMM is applied to samples of massive Porites sp. or Diploastrea sp. with skeletal densities comprised between 1.0 and 1.7 g*cm-3 (Coulibaly, 2021). We thus applied the GMM every 0.625 mm on the 3D image of our Diploastrea coral core, and then applied the linear regression to determine its annual bulk density. To estimate the vertical extension rate along the main growth axis of the coral core, a 2D image of one of the two middle slabs (image obtained by CT scan) was analyzed. We assumed that an eye visible low-density band together with a high-density band corresponded to one year of growth (Figure 2C, Knutson et al., 1972; Buddemier, 1974). The estimated vertical extension rate was then confirmed by the analysis of a 2D X-radiograph of the same middle slab obtained with a scanner VERITON-CT at the Jean-Verdier hospital (Bondy, France). Finally, the annual coral calcification rate (g*cm-2*y-1) was calculated by multiplying the estimated annual bulk density by the annual vertical extension rate (see Taylor and Jones, 1993 and DeCarlo and Cohen, 2017).
2.4. Observation and estimation of the abundance of microborer traces
A sub-slab of 1.5 cm width (Figure 2C; white rectangle) was cut along the middle slab of the coral core and then cut into 10 coral samples (Figure 2D). The first 9 coral samples were observed under an SEM operating at 15kv (Zeiss EVO LS15) on the platform ALYSES (Bondy, France), to study the diversity and abundance of microborer traces as well as their distribution within the coral skeleton. Before SEM observations, each coral sample was bleached using concentrated sodium hypochlorite (8%) for 3 days to remove all traces of organic matter, rinsed with Milli-Q water for 3 days, and then dried at 50°C for an additional 48h. Dried coral samples were then embedded in the Specifix-40 epoxy resin from Struers Inc. (Cleveland, United States, 2 parts of resin: 1 part of curing agent, Figure 2E) to allow the observation of resin casts of microborings (traces) under SEM (Figures 2F, G). To perform good resin impregnation, samples were placed in a Cytovac vacuum chamber (Struers) for several minutes prior to polymerization (Wisshak, 2012; Golubic et al., 2019). Resin polymerization took place at 40°C in an oven for at least 24h. Embedded coral samples were then sectioned (sections of about 1 cm thick) along the vertical growth axis of the coral with a diamond saw (Isomet1000 from Buehler) and sonicated to remove potential sediments from sectioning for a few seconds. The surface of each thin section (n=9 i.e. one per coral section) was then etched with a 10% hydrochloric acid solution for 15 seconds to remove tens of micrometers of coral carbonate, then rinse in Milli-Q water for a few seconds and dried at 40°C in the oven prior gold metallization for the observation of resin casts of microborings under SEM (Figures 2F, G). The different types of microborings were determined based on their diameter, their morphology and their distribution within the coral skeleton. Along the coral core, 4 SEM images were randomly selected per coral section (n=36 images per sample) within the pool of SEM images taken for the analysis of microborings abundance, to measure the diameter of the different types of microborings using the ImageJ software (https://imagej.nih.gov, v1.53) and to observe their distribution within the coral skeleton. Ten measurements of diameter (µm) were performed per type of trace and per SEM image. This analysis allowed us to distinguish a total of three types of microborings based on their diameter for the application of our machine learning approach to estimate the percentage of coral skeleton colonized by microborers (proxy of their abundance): those with a diameter comprised between 1 and 2 µm, those with a diameter comprised between 2 and 5 µm, and those with a diameter higher than 5 µm.
2.5. Innovative approach to study microboring assemblages in living corals
2.5.1. Data collection design
To study the variability of the relative abundance of the different types of microborings composing the assemblage and the percentage of coral skeleton they colonized (ratio between the surface area of microborer traces in a given coral skeleton section and the total surface area of the coral skeleton section x 100; a proxy of microborer abundance) over the last decades, two complementary approaches were applied to the studied thin sections collected along the coral core: a ‘vertical approach’ comprising the study of SEM images taken continuously along 3 vertical transects parallel to the main coral growth axis (Figure 2E, black arrows), and a ‘horizontal approach’ (perpendicular to the main coral growth axis) comprising the study of SEM images taken continuously within 8 out of 10 visible green bands and 10 white bands selected along the coral core (Figure 2E, white and green arrows). Green bands on coral samples 3 and 9 were too close to each other to separate them so we considered one green band in each of these samples. Per vertical transect, 16 to 55 SEM images were taken depending on the height of the coral section while on each horizontal transect, about 30 SEM images were taken. At several periods along the coral core, the vertical transects crossed the horizontal transects (intersections shown in Figure 2E) allowing a comparison of the estimated average percentages of coral skeleton colonized by microborers obtained by the two approaches. This comparison was important as the estimated average percentages of the coral skeleton colonized by microborers via the vertical approach were based on the analysis of 3 SEM images per period (corresponding to the 3 vertical transects) while that obtained via the horizontal approach was based on the analysis of 30 SEM images. More importantly, as the main goal of the vertical approach was to highlight possible assemblage shifts, the variability in microborers abundance over the last decades, and the possible influence of abiotic and/or biotic factors, it was crucial to show that trends obtained based on the vertical approach were reliable and accurate. In addition to validating the vertical approach, the horizontal approach aimed at determining the possible link between the presence of green bands and certain microborers and their abundance. To highlight the possible influence of abiotic and/or biotic factors, the average percentages of coral skeleton colonized by microborers were calculated along the vertical growth axis per year as the physical studied factors and coral parameters were calculated per year. This involved first estimating the rate of the vertical extension of the coral colony over the past decades and adjusting the number of SEM images collected along the vertical transects to match each year of coral growth.
2.5.2. Machine learning
To determine the relative abundance of the different types of microborings and the area of the coral skeleton they colonized per period of time (based on hundreds of SEM images taken along our coral core), we modified the Convolutional Neural Network (CNN) model called U-NET, which allows the recognition of various cellular structures in biomedical images (Ronneberger et al., 2015). This type of neural network belongs to the family of deep learning methods producing systems with interconnected nodes that can recognize patterns and correlations in datasets and can classify them. It is commonly applied to two-dimensional images (Krizhevsky et al., 2017). Here, our modified CNN model comprised 10 convolutional layers with each layer representing a linear operation involving the product of a set of parameters with a 2D input feature map (see Supplementary Figure 1 and Supplementary Material). The various parameters involved in our CNN model were optimized to improve the identification of the four defined categories: ‘resin’, ‘coral skeleton’, ‘thin microborings’, ‘wide microborings’ (Figure 3). Here only two types of microborings were considered due to the difficulty to distinguish some galleries by the CNN model (see Supplementary Material). This approach led to the highest probability of the neural network correctly attributing a pixel to its right class (=accuracy, 93%). Providing all details of each component of the model would be out of the scope of this article, so we invite the reader to refer to Goodfellow et al. (2016) for a detailed explanation and to Supplementary material for the description of our CNN neural model structure and its three main steps (dataset constitution step, training step and model tuning and post-processing step, Supplementary Figure 2).
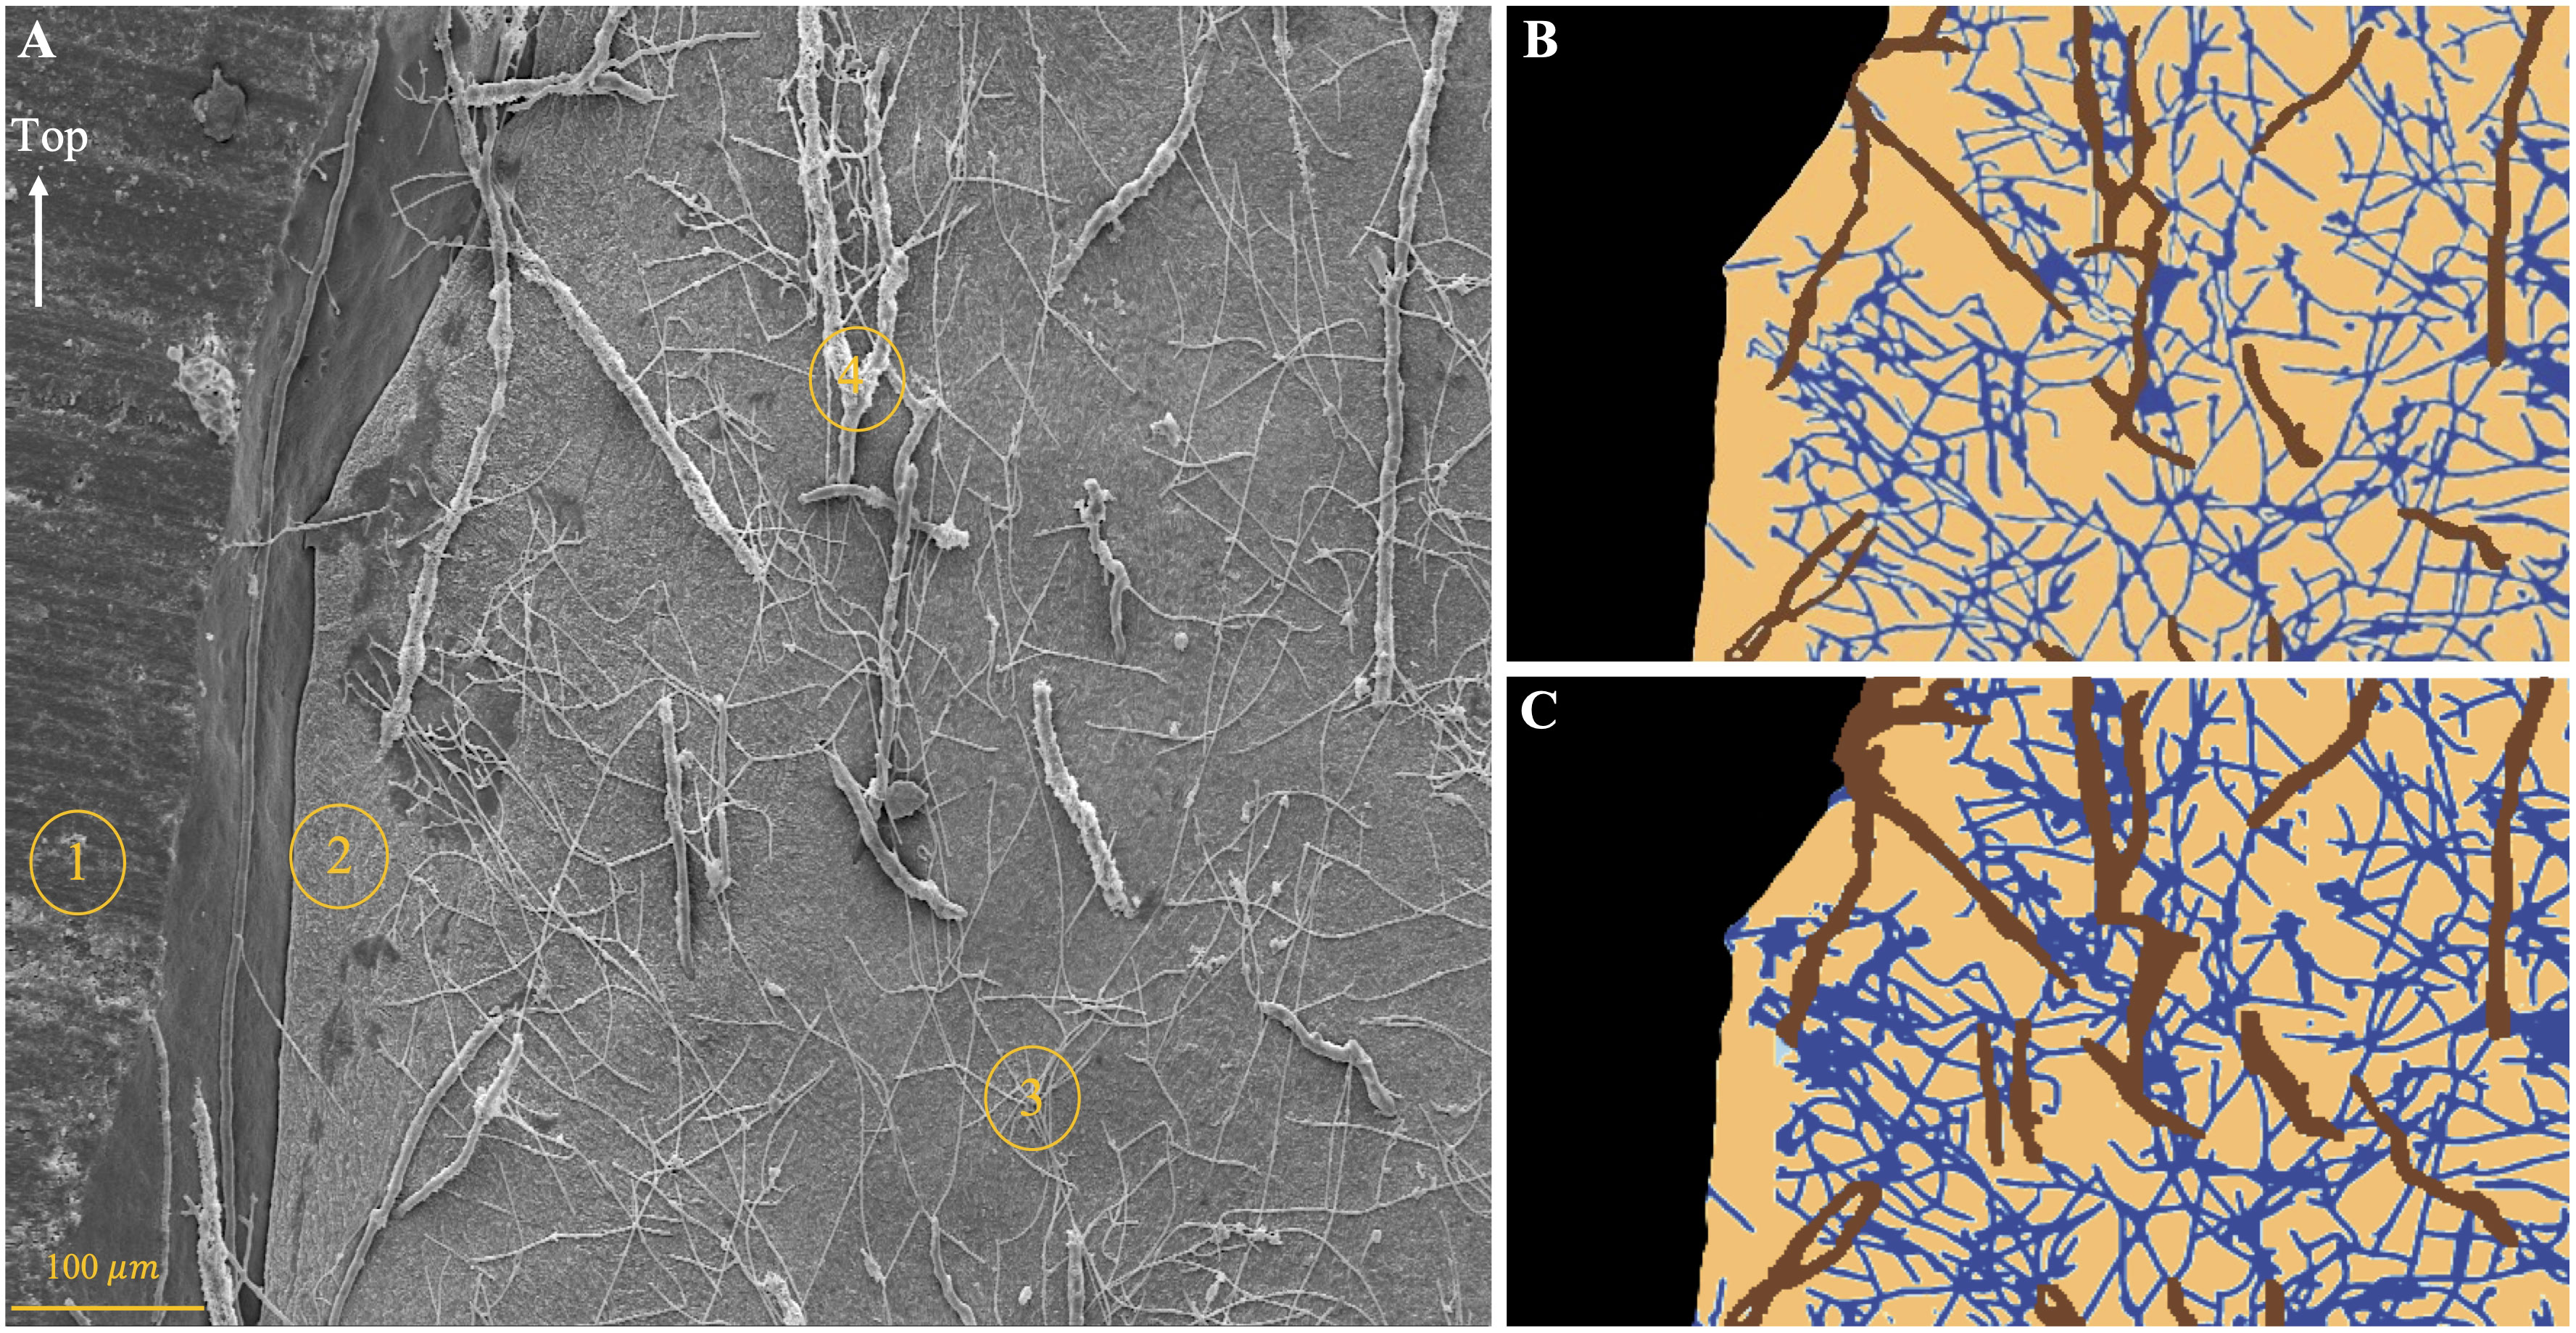
Figure 3 Illustration of the manual vs machine learning image analysis. (A) Original SEM image displaying the four classes of items that the Convolutional Neural Network model had to recognize: resin, coral skeleton, thin microborings, and wide microborings. (B) Result of the manual quantification of the area of coral skeleton colonized by thin (dark blue) and wide microborings (brown), uncolonized coral skeleton (orange), and resin (black). (C) Result of the machine learning approach.
2.6. Statistical analysis
The present machine learning approach was conducted using Python (v3.8) through JupyterLab (https://jupyter.org). The manual analysis of a set of SEM images (n=60) used for the training step was performed with the image manipulation software GIMP (v2.10.14; https://www.gimp.org) and ImageJ (v1.53a; https://imagej.nih.gov/ij/) to detour shapes and then measure the area of coral skeleton colonized by microborers per SEM image. Coral bulk densities over time were calculated through the GMM model on Python, then averaged to be consistent with the coral growth rate per year. Linear regressions on environmental data and coral variables were generated from the library ggpubr on RStudio (v1.4.17; https://www.rstudio.com). The Non-parametric Mann-Kendall test was then performed to assess if the observed trend on each time series was significant. The areas of coral skeleton colonized by microborers (thin + wide microborings) measured along the three vertical transects were compared using an ANCOVA. Although no significant differences were obtained between two pairs of two transects (p-values > 0.2) the third one showed a significant difference (p-value< 0.001). Despite such slight variability, and because the three transects showed the same trend over the studied period (i.e. 54 years), we chose to average values from the 3 vertical transects per period (year) to determine the possible main factors driving the overall temporal variability of microborers abundance. Pearson correlations were carried out to detect the potential effects of the environmental and/or coral variables studied on the traces’ abundance (i.e. the abundance of thin microborings, wide, or all microborings) obtained over the last five decades (vertical transects). These correlations were performed on detrended variables to focus on their possible interannual and decadal variability and to avoid spurious correlations due to linear trends. To estimate the possible differences between means of the area of the coral skeleton colonized by microborers (microborings’ abundance) obtained on vertical vs horizontal transects (at the intersections in Figure 2E), a student t-test was performed. A non-parametric Pettitt test was then applied to means to determine a potential breakpoint in the trend over the last 54 years. Finally, binary logistic regressions were generated using the library glm in RStudio (generalized linear models) to determine the possible factors influencing the presence or absence of green bands along the coral core. The selection of these factors was done using a so-called backward procedure: first, the binary logistic regressions were carried out using all studied variables over the period 1964-2018 (i.e. the area of coral skeleton colonized by all microborers or just thin or wide trace makers, coral growth variables and environmental data). When a nonsignificant link between the presence of green bands and any of our variables was observed, the variable presenting the highest p-value from the dataset was removed. This was done until all remaining variables were significant (i.e. presented a significant effect on the presence or absence of green bands).
3. Results
3.1. Mayotte’s environmental conditions over the last 54 years
The SST and SSTA which are dependent variables showed a similar and significant annual variability over the last five decades (p< 0.0001, Mann Kendall test, Table 1 in Suppl Material). SST varied between 25.2°C ± 0.7 and 26.7 ± 0.6 in winter and 28.1°C ± 0.2 and 29.7°C ± 0.4 in summer. Since the 60’s, Mayotte reefs experienced significant warming with an estimated SST increase of +0.11°C per decade (p< 0.0001, Mann Kendall test; Figure 4A and Supplementary Figure 3A). They also experienced increasingly positively SSTA over time, especially in the recent years (down to -0.84°C in winter 1964 towards up to +0.9°C in summer 2016, p< 0.0001; Figure 4B and Supplementary Figure 3B). Similarly, the max instant wind speed increased significantly since the 60’s by a factor of 0.3 per year (p< 0.0001, Mann Kendall test; Figure 4C and Supplementary Figure 3C). In contrast, precipitations did not change significantly over time (Figure 4D and Supplementary Figure 3D) and the duration of the insolation period significantly decreased by 6.4 hours per decade over the last 54 years (15% diminution over the considered period, p< 0.0001, Mann Kendall test; Figure 4E and Supplementary Figure 3E).
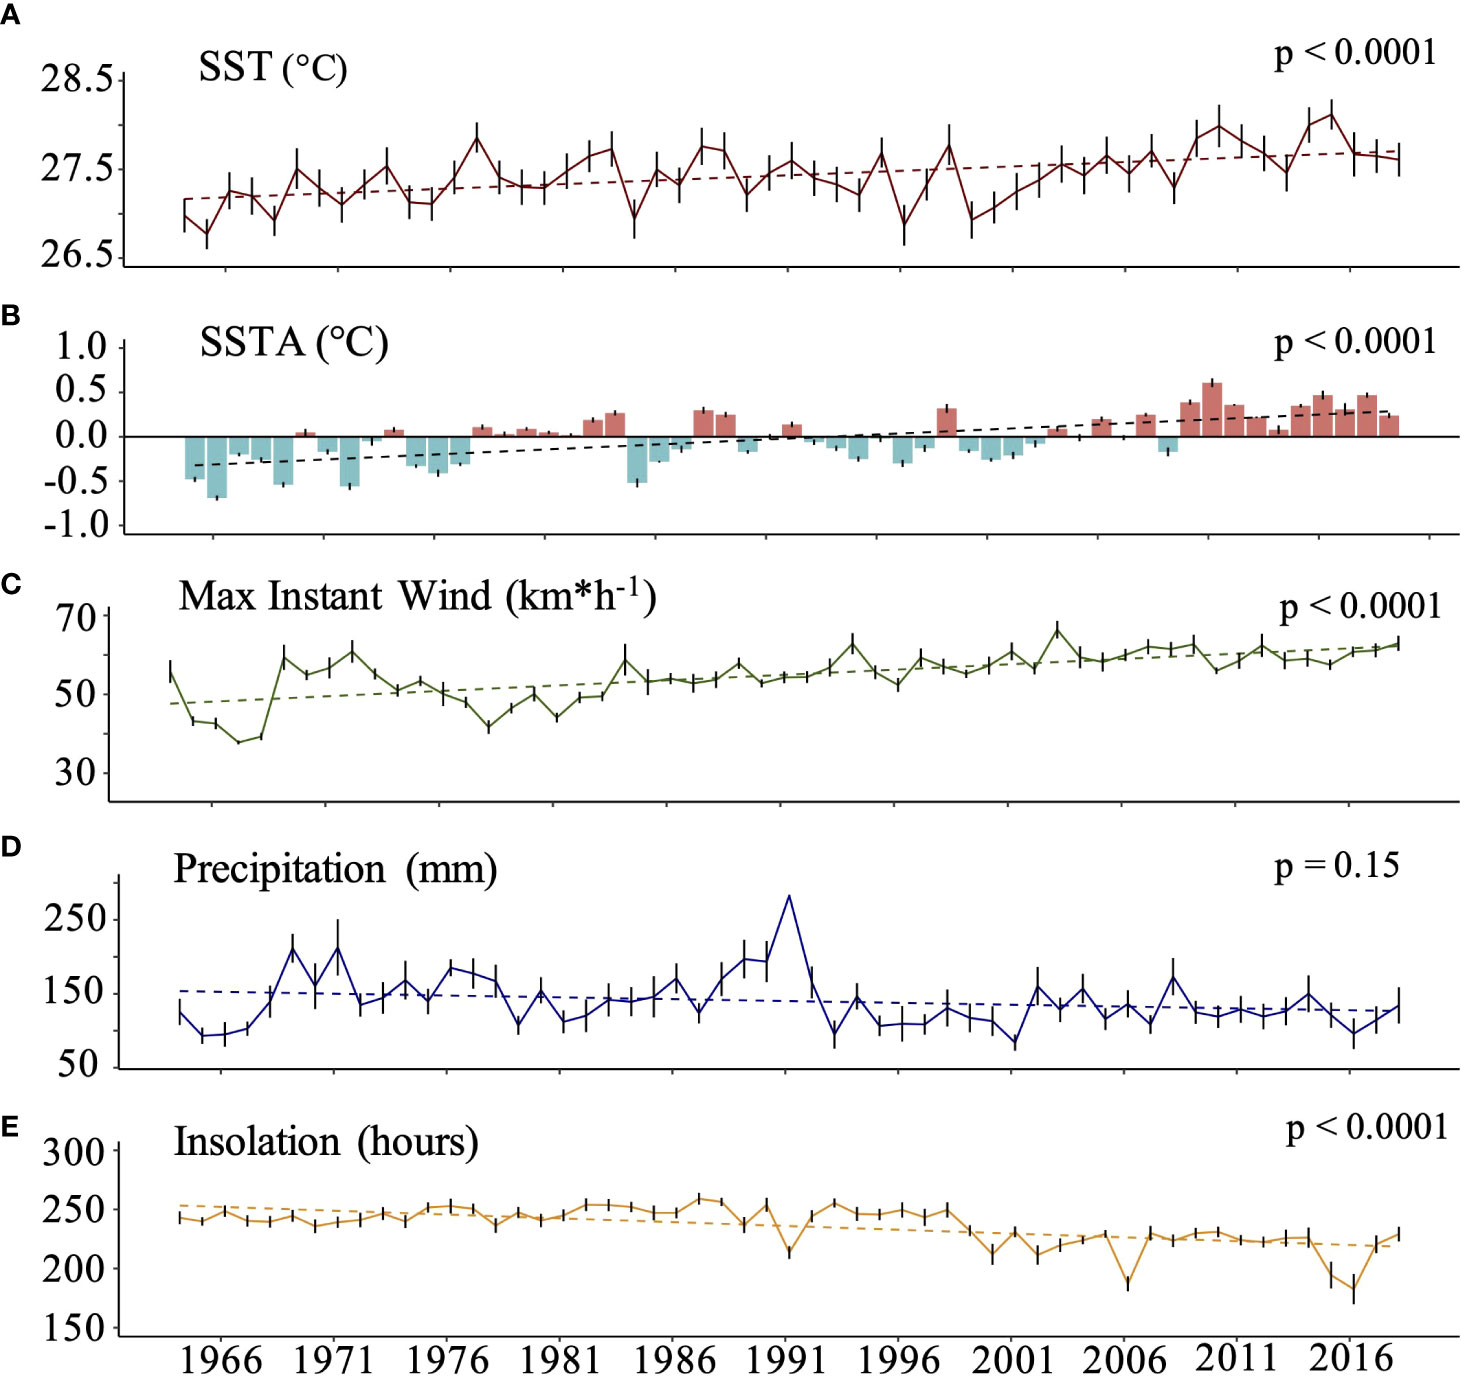
Figure 4 Interannual variability of the different environmental parameters at Mayotte between 1964 and 2018. (A). Sea Surface Temperature (SST in °C) (B) Sea surface temperature anomalies (SSTA in °C). (C) Maximum instantaneous wind speed (km*h-1). (D) Precipitation rate (mm). (E) Annual cumulative insolation period (hours). Errors bars (SE) for each variable were calculated after averaging monthly data.
3.2. Coral growth parameters
Based on the density bands of the Diploastrea coral core which allowed the reconstruction of the colony vertical linear extension rate, we estimated that our study covered a period of 54 years from 1964 to 2018 (Table 2 in Supplementary Material). The vertical extension rate did not vary significantly over time and was comprised between 2.1 (in 1997-1998) and 4.9 mm*yr-1 (in 2017), with an average of 2.6 mm*yr-1 ± 0.5 (Figure 5A). In contrast, the coral bulk density decreased significantly and nonlinearly since the 60’s (40% decrease, p< 0.001, Mann Kendall test; Figure 5B). The calcification rate also varied slightly significantly (p< 0.05, Mann Kendall test) and was comprised between 0.25 ± 0.002 in 2009 and 0.55 ± 0.023 in 2017 g*cm-2*yr-1 (Figure 5C). A strong negative correlation was found between the detrended data of bulk density and the cumulative insolation period whatever the considered period (p< 0.01 with a Pearson correlation coefficient r = -0.39 for the whole studied period) and to a lesser extent to SSTA (p< 0.05, r = - 0.39, Table 2). When considering the raw data sets (both coral and environmental parameters), SSTA was again negatively correlated to the bulk density, especially after the breakpoint (Table 3 in Supplementary Material). Precipitations were the only other environmental factor with a significant correlation with both the vertical coral extension (before the breakpoint) and calcification rates (after the breakpoint) whether we considered raw or detrended data sets (Tables 2, 3 in Supplementary Material).
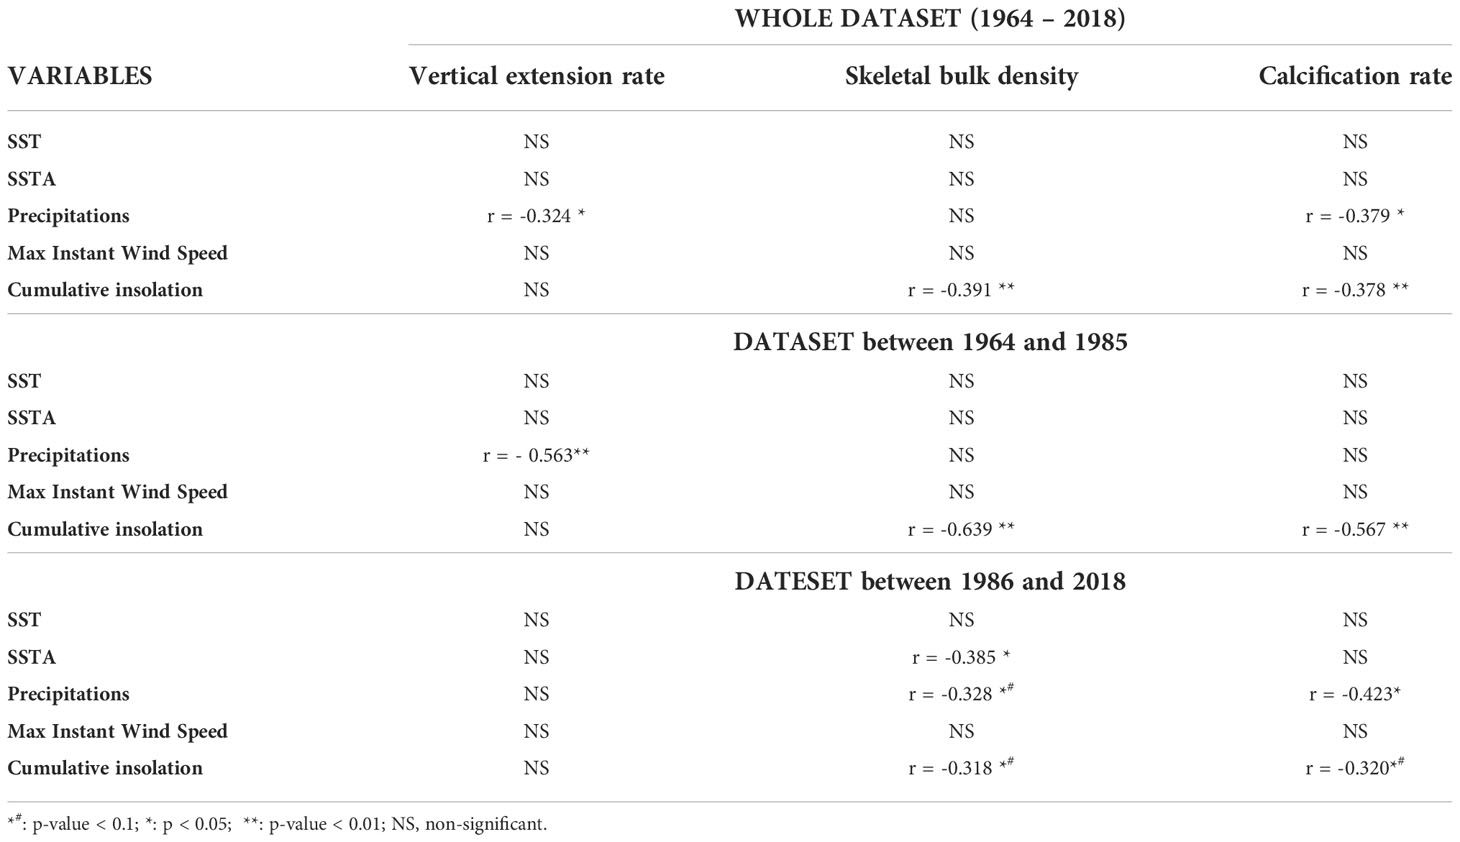
Table 2 Pearson’s correlations between the detrended coral growth variables and detrended environmental variables over the last 50 years and per period before or after the breakpoint.
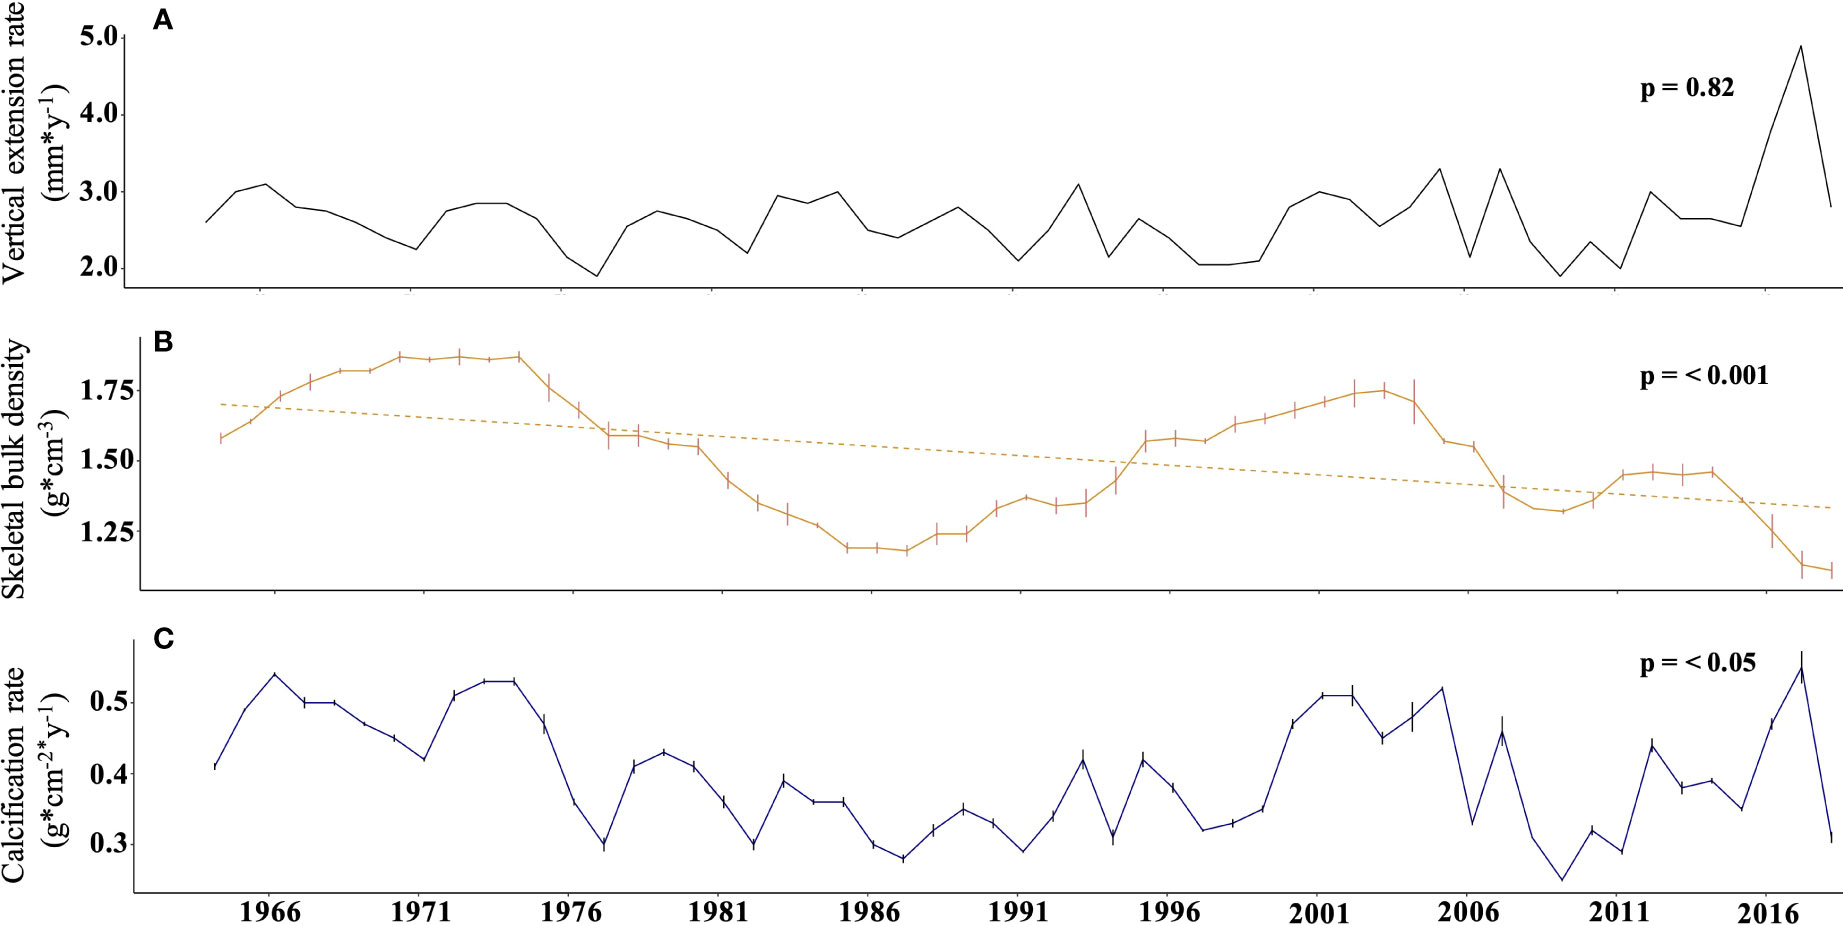
Figure 5 Evolution of the different coral growth parameters of the studied Diploastrea colony over the last 54 years. (A). Annual linear vertical extension rate (mm). (B) Annual bulk density of the coral skeleton (g*cm-3). (C). Calculated annual coral calcification rate (g*cm-2*y-1).
3.3. Diversity of microborings
Based on morphological criteria including the diameter of microborer traces, and their distribution within the coral skeleton, we were able to identify three different types of microborings. Most microborings with a diameter comprised between 1 and 2µm, with branches perpendicular to the main traces and with a random distribution within the coral skeleton were indicative of fungi. However, within those thin traces, some appeared to follow the main coral growth axis and therefore could be attributed to other trace makers such as the cyanobacterium Plectonema (Figure 6A) or exploratory filaments of the chlorophyte Ostreobium sp. (Wisshak et al., 2011). Microborings with a diameter between 5 and 10 µm were either in the form of a zigzag pattern typical of Ostreobium quekettii (chlorophyte; Figure 6B), or in the form of vertical tubules parallel to the main growth axis of the coral with specific branching, a few bulges and club-shaped apices indicating the presence of other chlorophytes such as Epicladia testarum or Gomontia sp. (Figures 6B, C; Bornet and Flahault, 1888; see Figure 5I in Wisshak et al., 2011). Finally, very large traces with bulges, cross-wall constrictions and branches were observed with sometimes a diameter higher than 30 µm, indicating the presence of another microboring chlorophyte. They were mainly distributed along the main coral growth axis (Figure 6D). The analysis of a few SEM images randomly chosen along the coral core revealed that microborings with the largest diameters were more often observed in the bottom part of the coral core, i.e. between the 60’s and the early 80’s, than near the coral tissues where microborings with the smallest diameter dominated (Figure 7). The composition change in the trace assemblage lasted about ten years (Figure 7). In the most recent years (2014-2018), trace makers of thin microborings clearly dominated the assemblage.
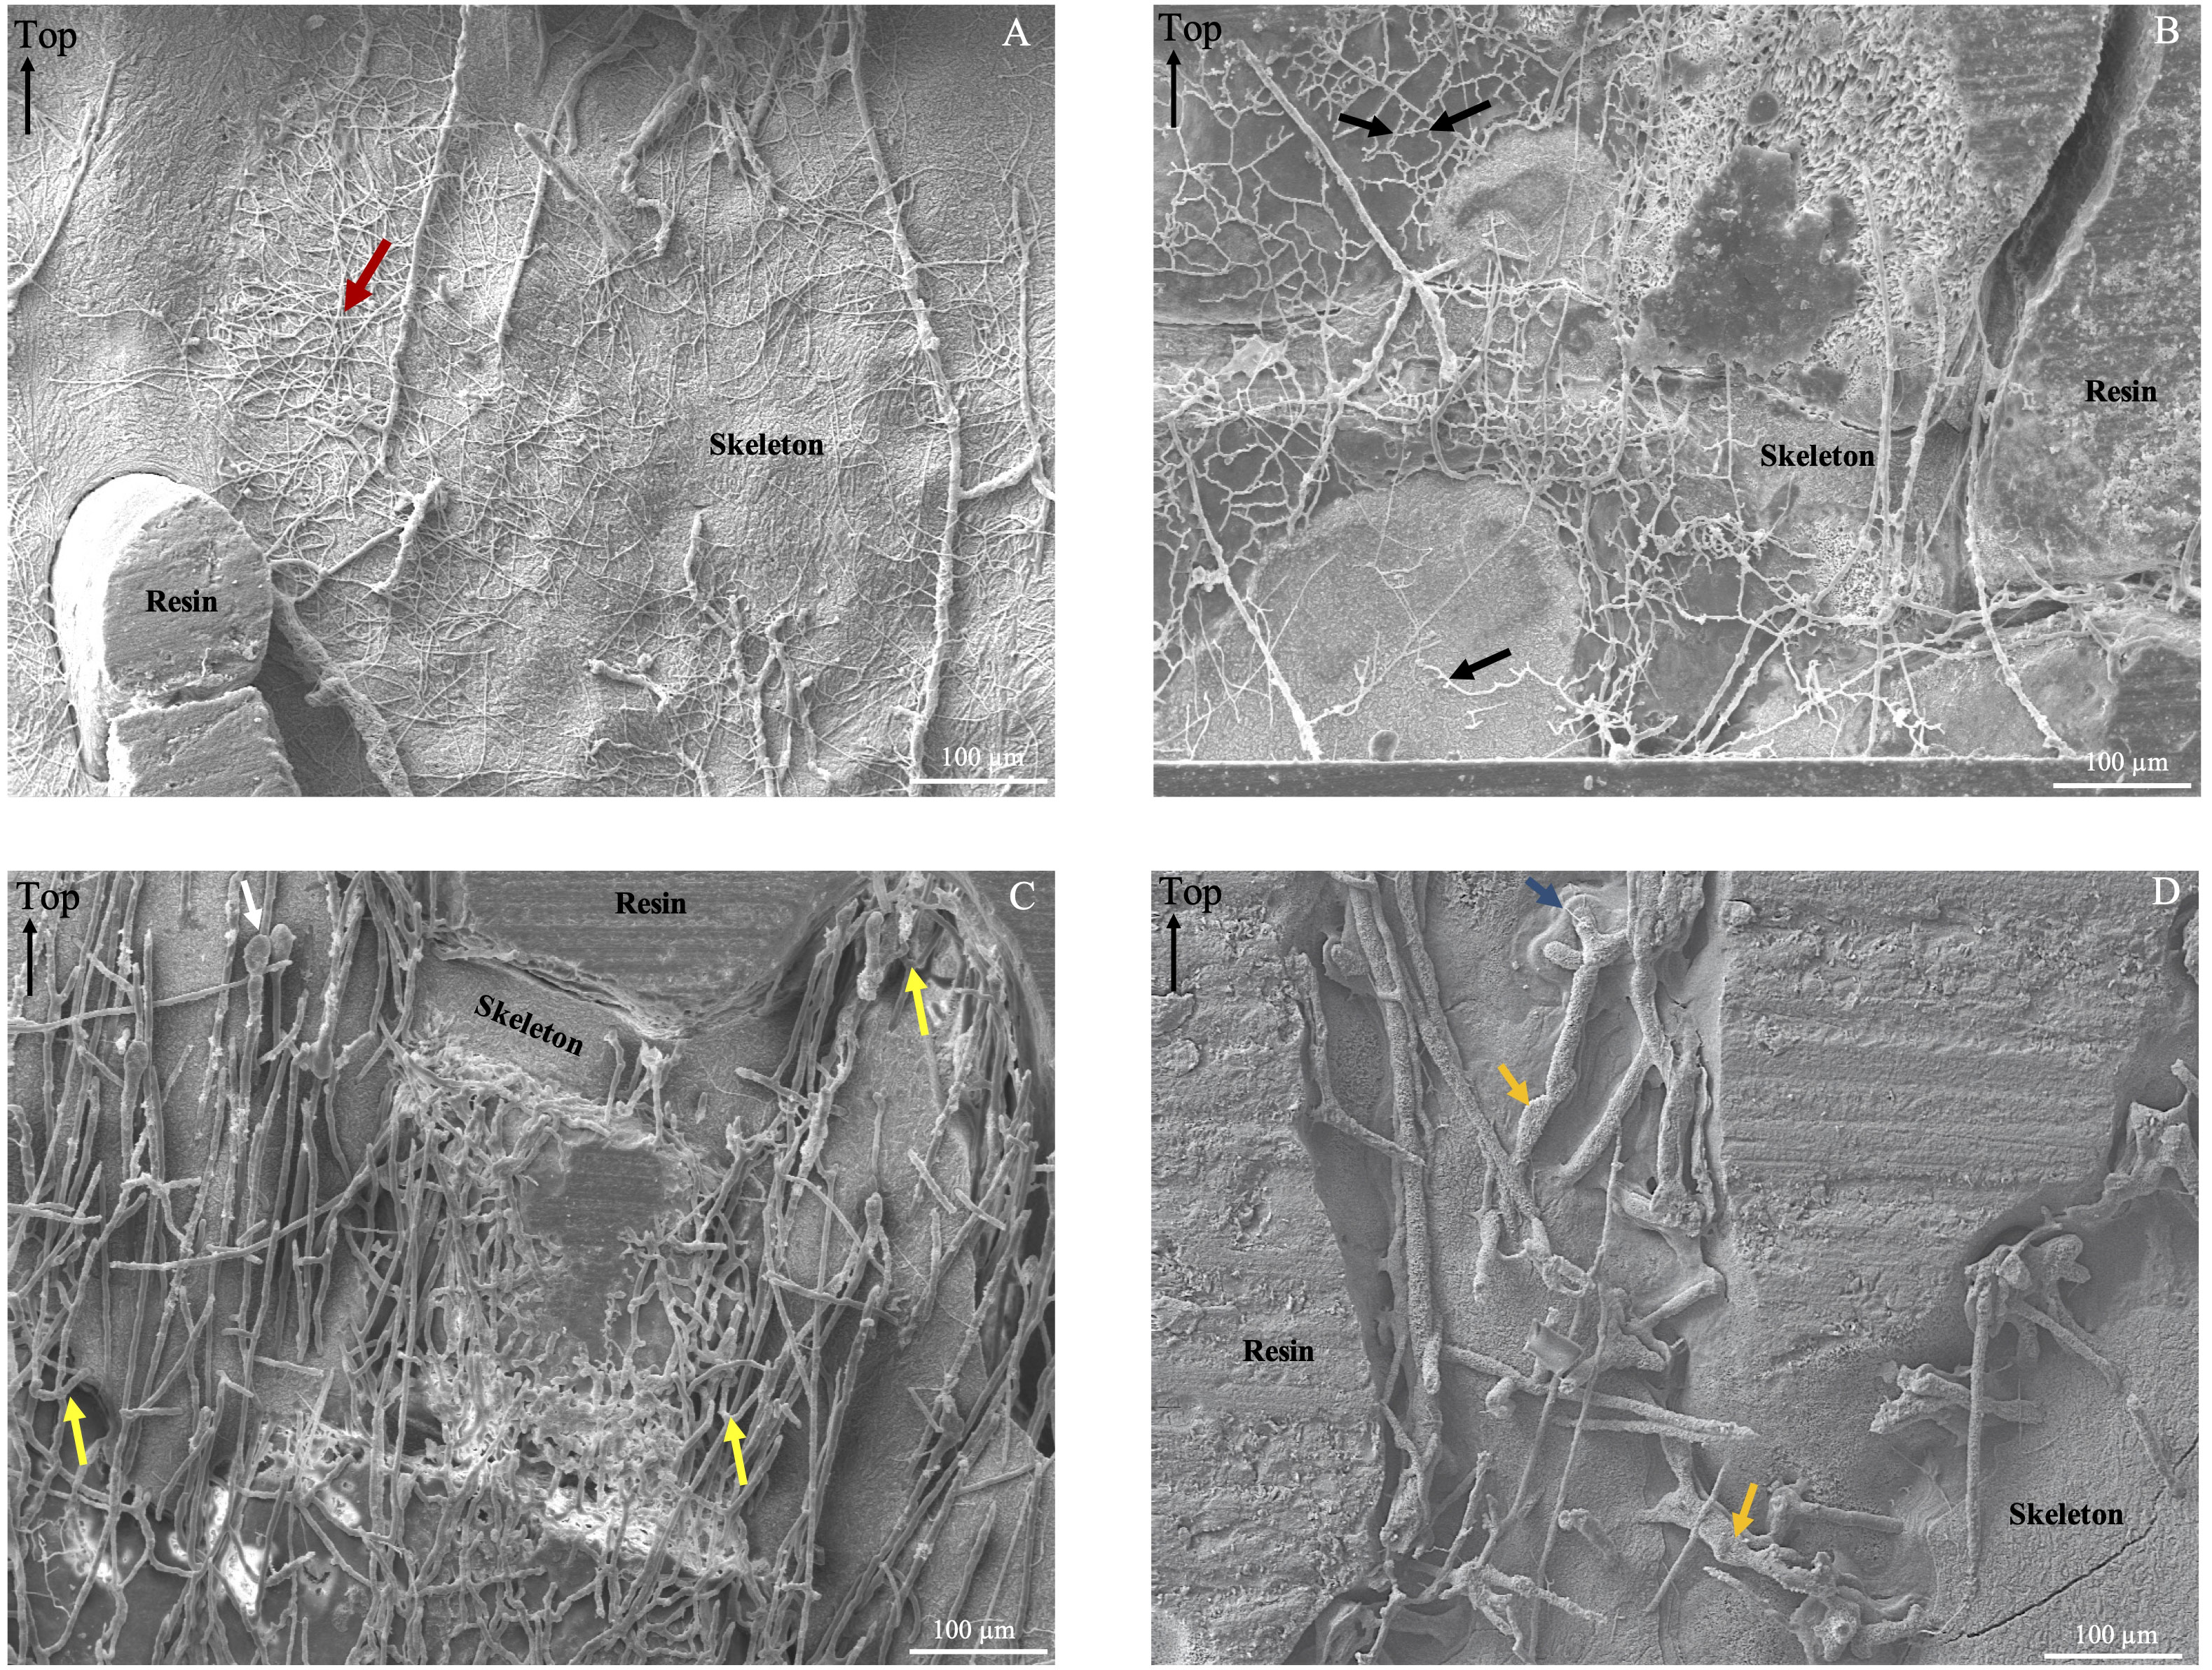
Figure 6 SEM pictures presenting the diversity of traces (microborings) observed along the coral core. (A) SEM image from the top of the core showing traces of Scolecia filosa (produced by the cyanobacterium Plectonema sp.; red arrow). (B) Picture from the bottom of the core showing a great abundance of the typical Ichnoreticulina elegans trace (work of the chlorophyte Ostreobium sp.quekettii.; black arrows). (C) Picture from the bottom of the core showing wide microborings oriented towards the coral tissue layer. Tubules presenting branches (yellow arrow) and club shape apexes (white arrow) indicative of microboring algae. In the center of the picture, traces of Ichnoreticulina elegans can be observed. (D) Picture from the middle of the core showing very wide microborings (> 20 µm) oriented towards the coral tissue layer. Those traces are cylindrical tubules, sometimes with bulges and visible cross-wall constrictions (yellow arrows), as well as branches (blue arrow).
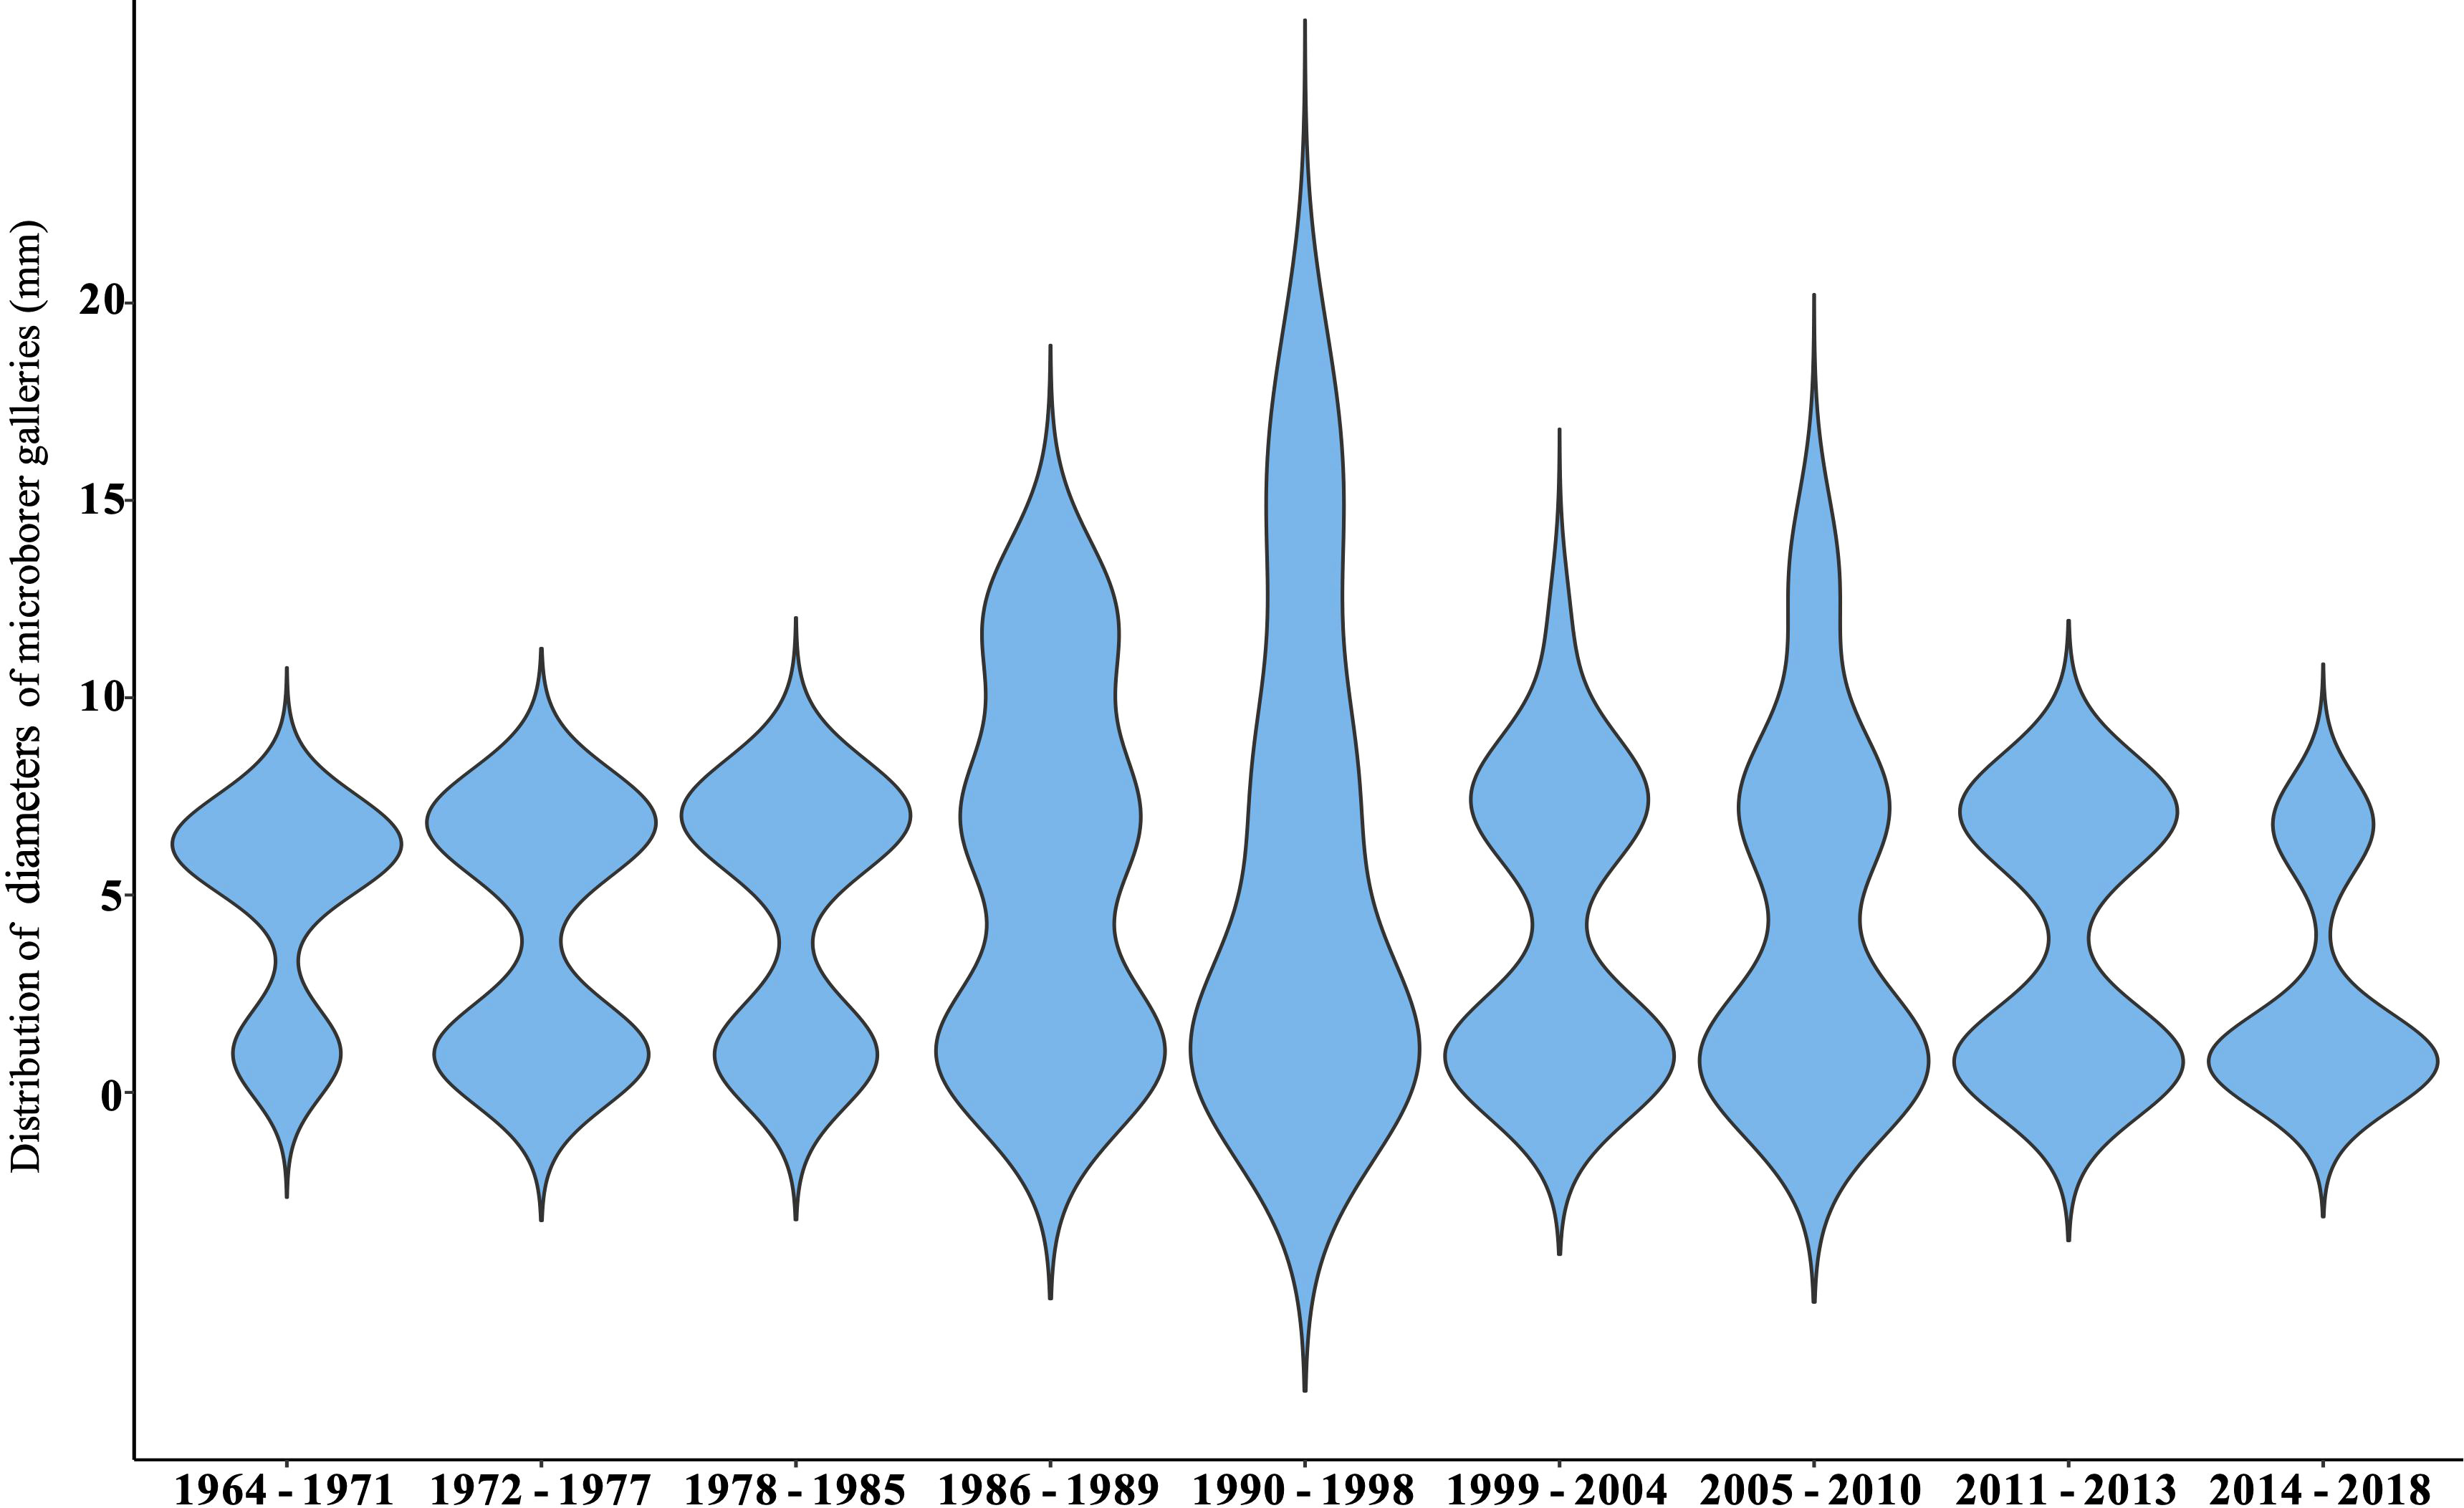
Figure 7 Violin plot showing the temporal variability in microborer traces’ diversity identified based on their diameter.
3.4. Variability of microborings abundance over the last 54 years
3.4.1. Representativeness of data obtained along the main vertical coral growth axis
Comparison of means of the percentage of coral skeleton colonized by microborings, a proxy of microborers abundance, at the intersections between vertical and horizontal transects along the coral core revealed no significant differences (paired Student test, p > 0.05; Figure 8). Both approaches highlighted a significant decrease of microborings abundance over the last 50 years (p< 0.001, Mann Kendall test). Although the variance on vertical transects was higher than that of means obtained on horizontal transects due to the difference in the number of measurements per approach (3 versus 30, respectively), our results showed that means of microborings abundance calculated from 3 measurements along the vertical coral growth axis were well representative of those obtained on a horizontal band of about 1.5 cm width of the coral sub-slab (Figure 2C). To study the interannual variability of microborings abundance and to identify the main factors that may influence it, we thus chose to focus on data obtained continuously along the vertical coral growth axis.
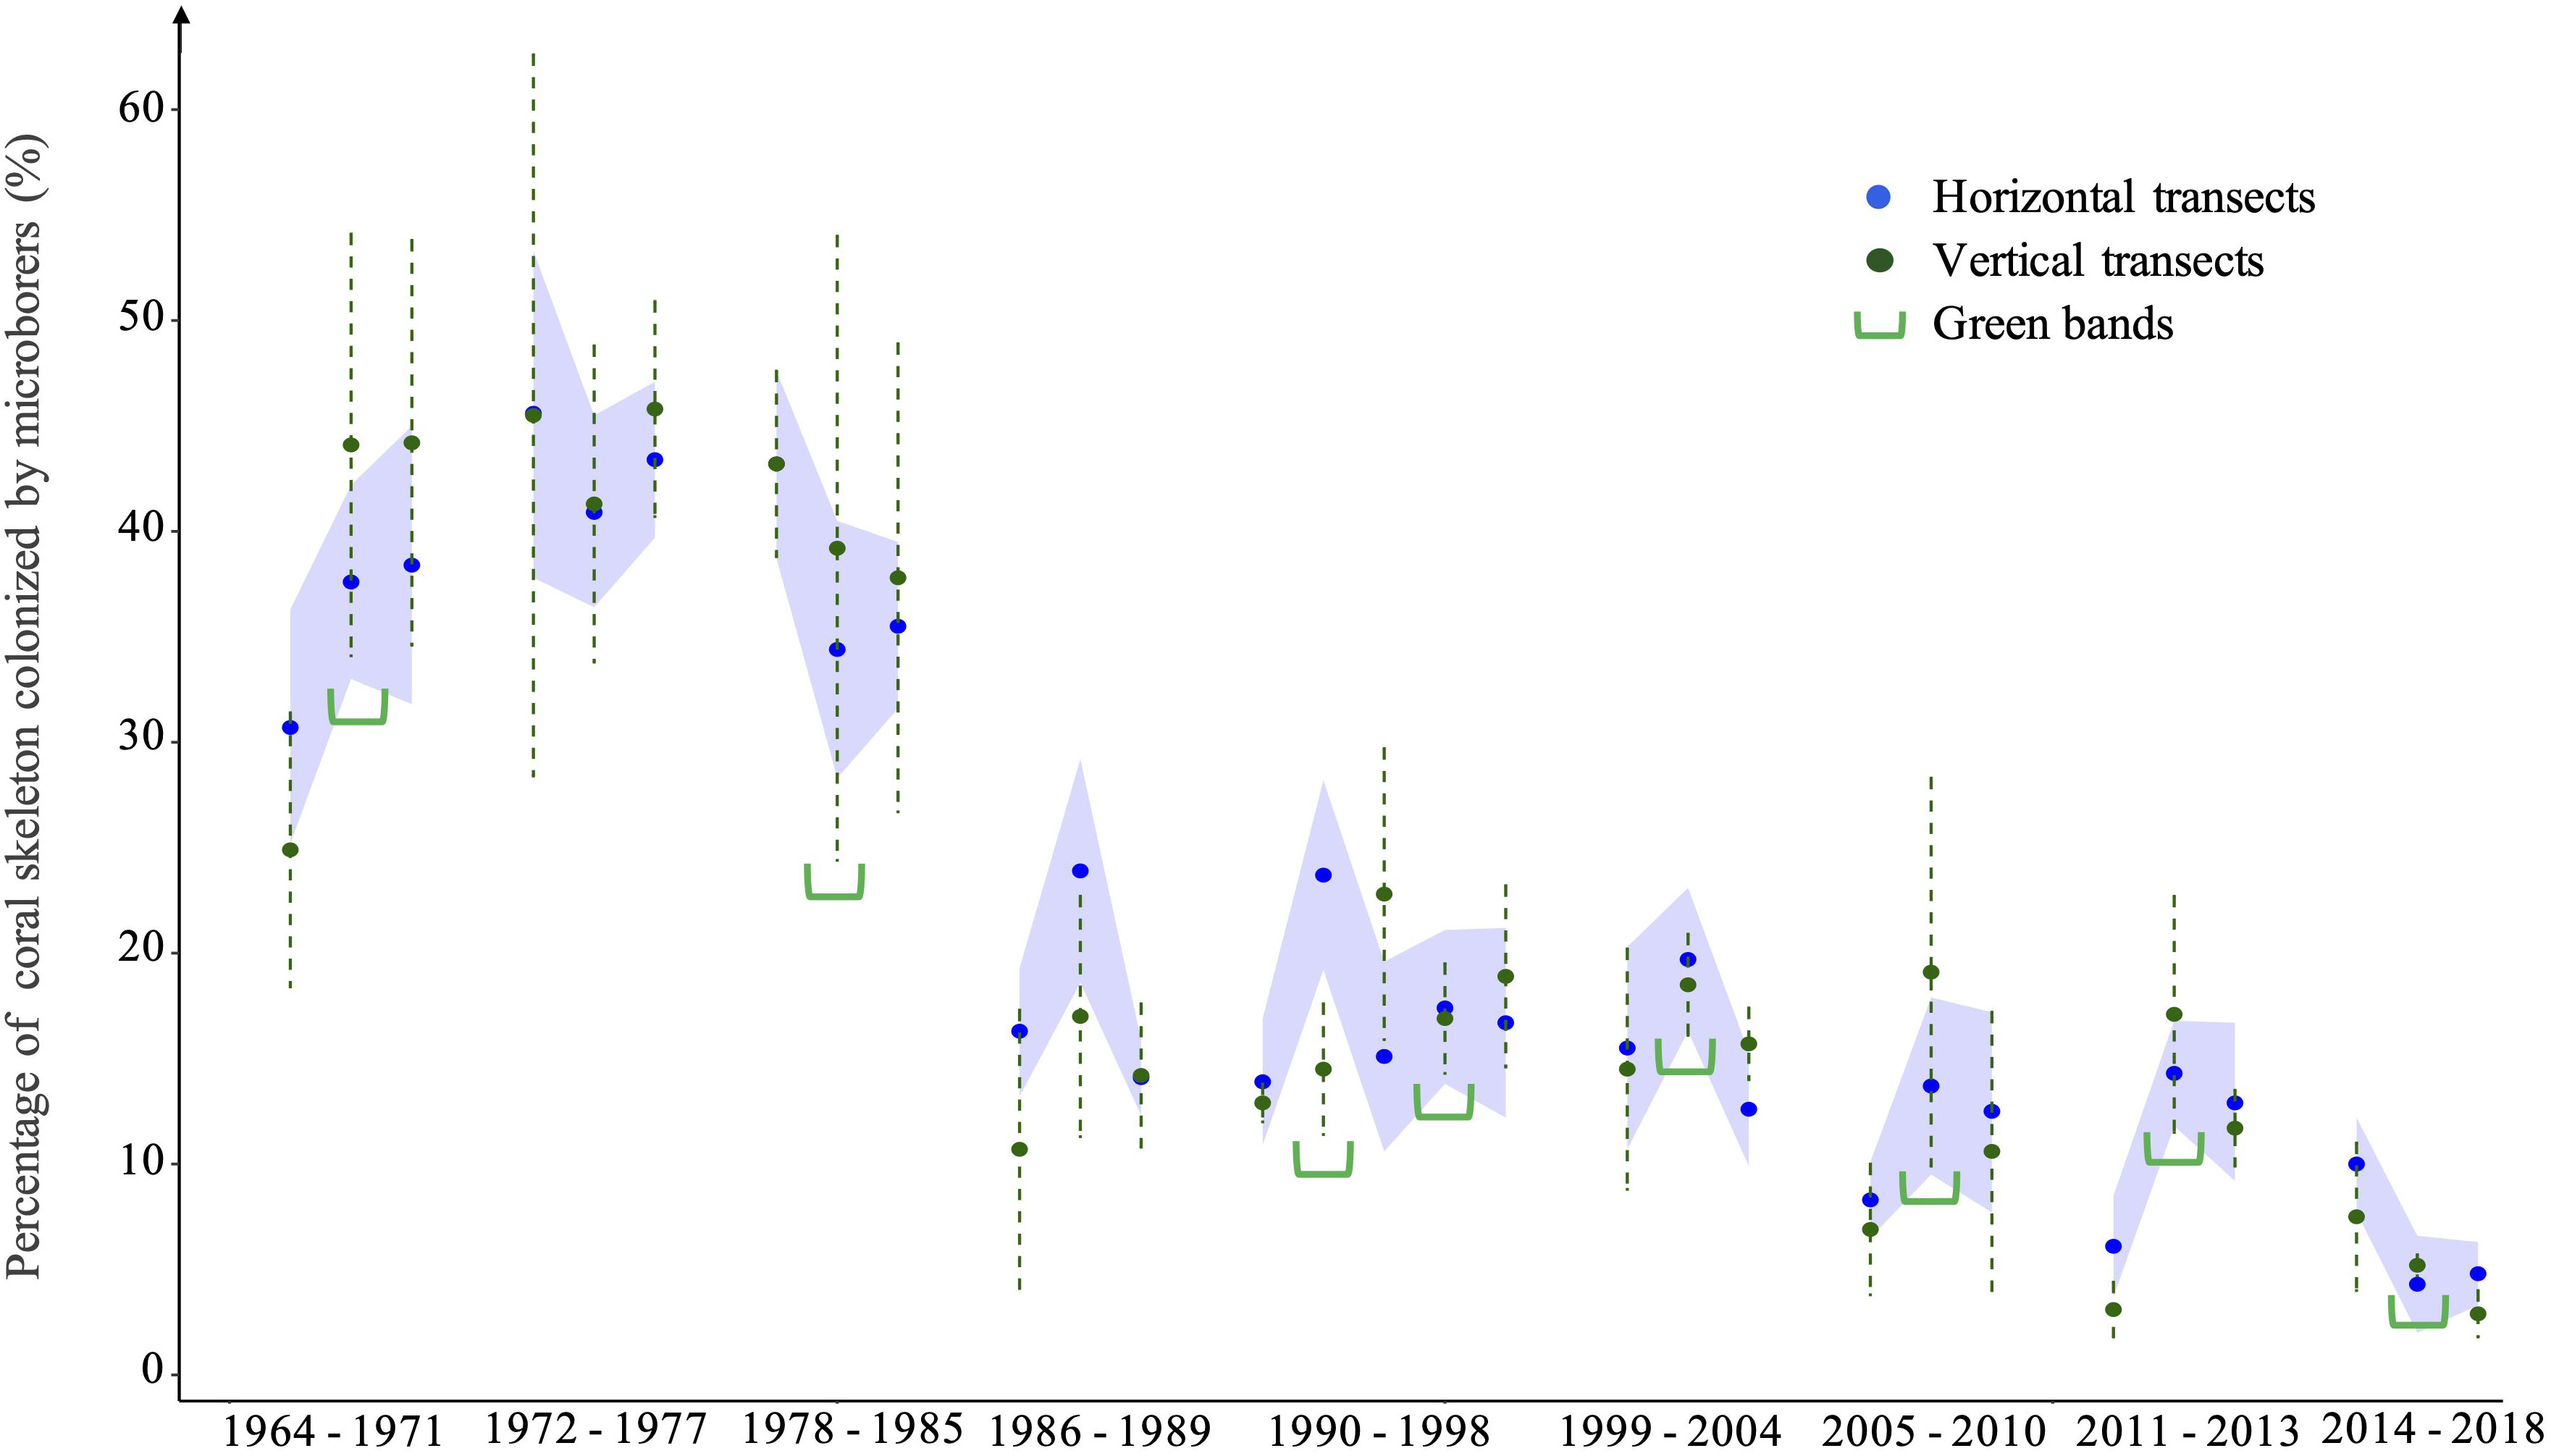
Figure 8 Variability of the percentage of coral skeleton colonized by microborer traces (microborings) obtained at the intersections between the studied vertical and horizontal transects along the coral core. Means obtained on horizontal transects are shown by blue dots, with their confidence interval (95%; indicated by the blue area). Means obtained on vertical transects are shown by green dots, together with their SE (dotted green line). Green parentheses indicate the presence of the studied visible green bands within the coral core.
3.4.2. Variability of microborings abundance and assemblage shift
Based on data obtained along the main vertical coral growth axis, we estimated that the decrease in microborings abundance was 91% over the last 54 years. The highest abundance of microborings (thin + wide) was observed in the mid 70’s (51% ± 3.9% of the coral skeleton was colonized by microborers), while the lowest was found in the very recent years 2017-2018 (1.3% ± 1.2%; Table 4 in Supplementary Material). This trend was confirmed by the horizontal approach although this latter did not cover the whole coral core, with the highest abundance estimated in 1972-1973 (45.6% ± 3.5%) and the lowest abundance in 2015-2016 (4.3% ± 1.2%; Table 5 in Supplementary Material). We also noticed a major step in the 80’s. This breakpoint was identified between 1985 and 1986 (Pettit test, p< 0.001). Comparing separately the two periods, 1964-1985 and 1986-2018, our results showed that not only the abundance of microborings drastically decreased after the breakpoint, but a shift in the assemblage composition was also observed. Before 1985-86, the trace assemblage was dominated by borers making wide traces and to a lesser extent thin traces, while in recent years it was clearly dominated by microborers making thin traces (Figures 7, 9). Interestingly during the shift which lasted a few years, the diversity of microborings increased as shown by the more important diversity of measured trace diameters (Figure 7).
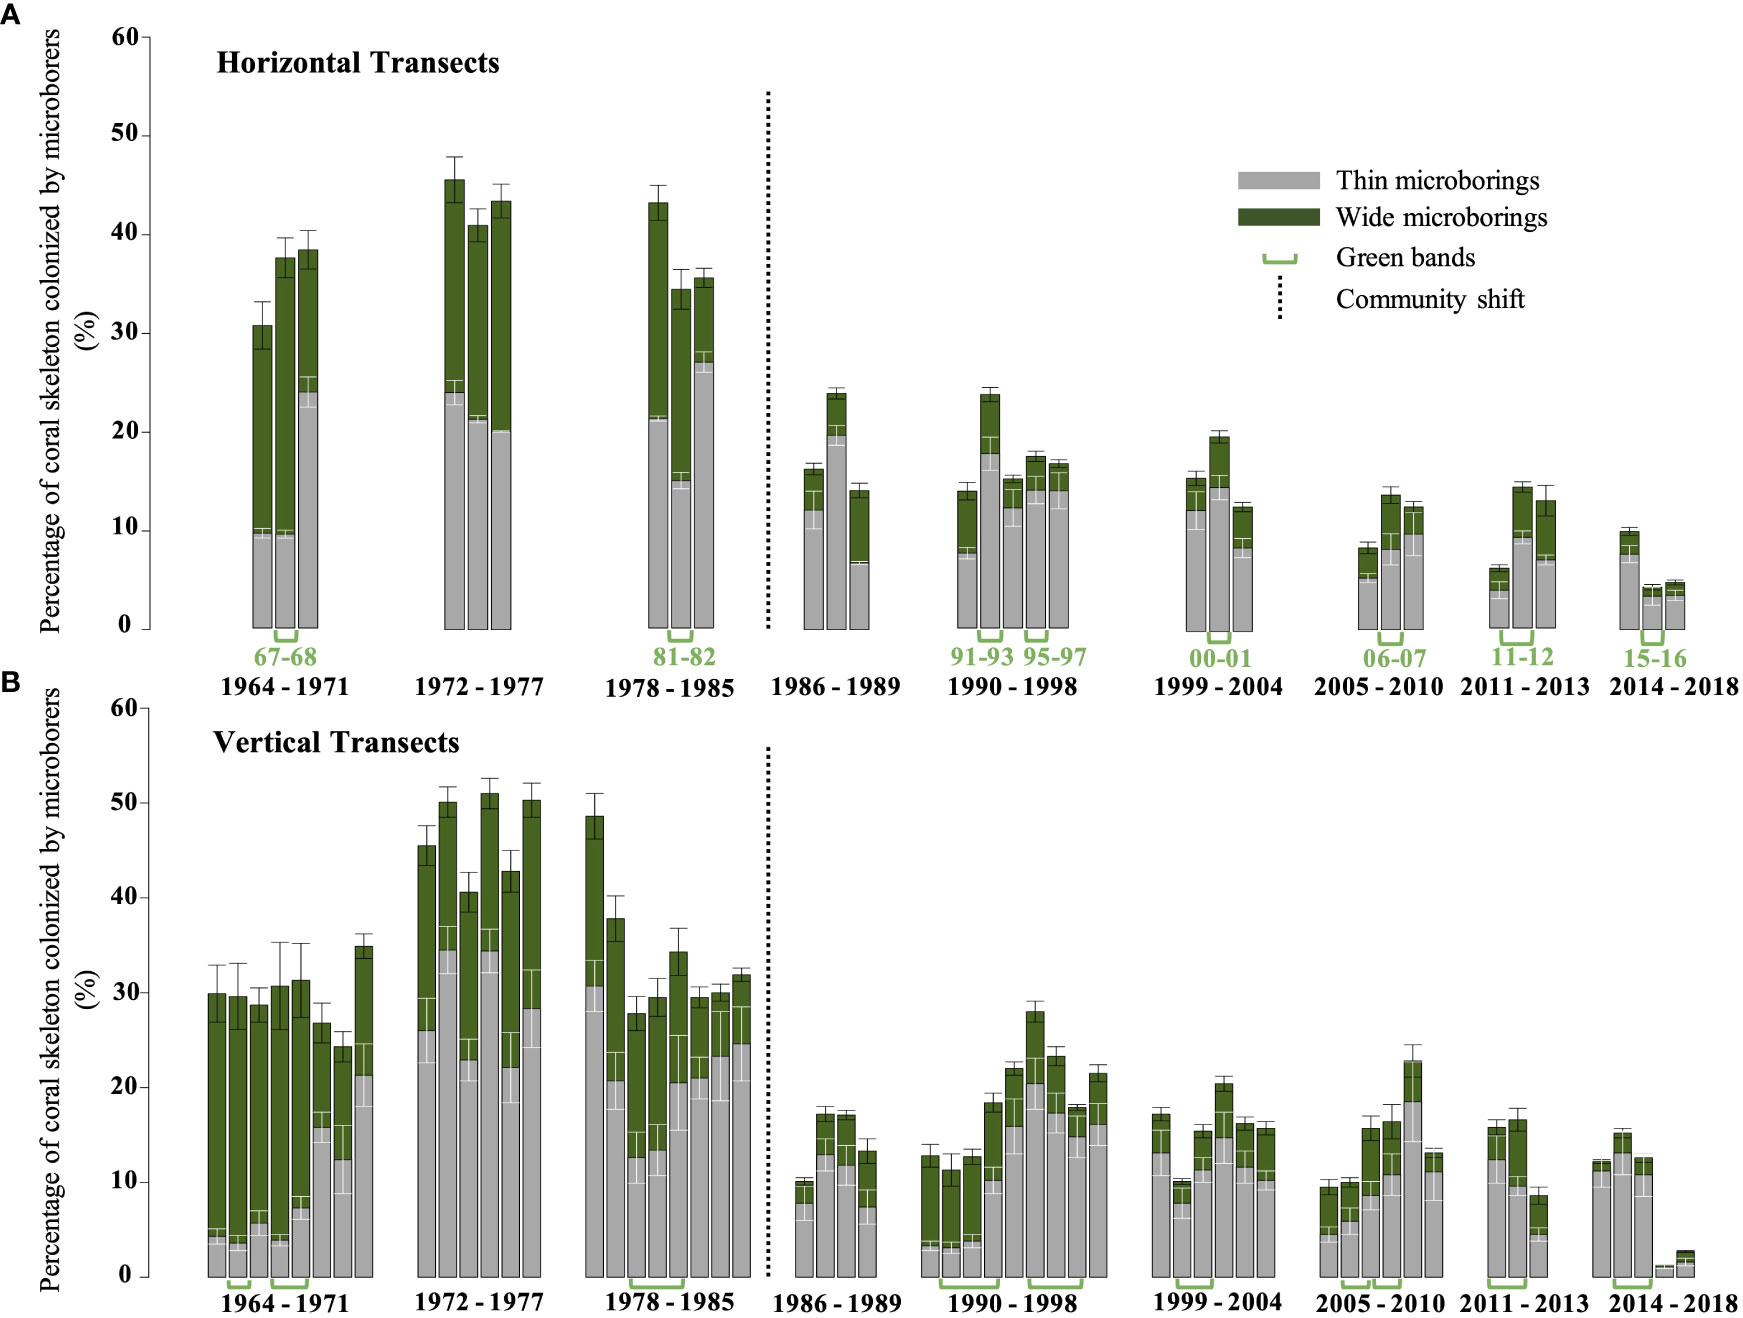
Figure 9 Variability of the percentage of coral skeleton colonized by microborings (thin and large traces) over the last 54 years. (A) Histogram reporting the variability obtained along horizontal transects (white vs green bands). (B) Histogram reporting the variability obtained on vertical transects (each bar represents a year and it is the mean of the 3 vertical transects for each year). Standard errors are indicated by bars at the top of each box. Green arrows specify the position of the visible green bands within the coral core. The black dotted line indicates the breakpoint or traces assemblage shift.
3.4.3. Main factors influencing microborings abundance over time
Considering raw data sets, our results showed that the decrease of microborings abundance (total abundance as well as the abundance of both thin and wide microborings; see Table 3) was positively correlated to the decrease of both the coral bulk density and the cumulative insolation. In contrast, microborings abundance was negatively correlated to SST, SSTA and the max instant wind speed (Table 3). When focusing on the period before the breakpoint, we could observe that the abundance of thin trace makers was for instance positively correlated to SST and precipitations (p< 0.05), while the abundance of wide trace makers was negatively correlated to the max instant wind speed (p< 0.05; Table 3). After the breakpoint (1986-2018), thin trace makers were surprisingly negatively correlated to precipitations and to the vertical coral growth extension rate (p< 0.05). In contrast, the wide trace makers were positively correlated to precipitations and the cumulative insolation but negatively correlated to SSTA (p< 0.05; Table 3). A similar analysis was conducted but on detrended data sets to reveal the main biotic and abiotic factors that could affect the interannual variability of the microboring assemblage. This analysis confirmed that the coral bulk density was significantly correlated to microborings' abundance (total, wide, and thin microborings’ abundance, Table 4). It also confirmed the positive correlation between the decreasing cumulative insolation and the abundance of the thin trace makers (p< 0.05, Table 4). SST had also a relatively positive effect on the abundance of the thin trace makers (p< 0.1). Interestingly, after the breakpoint, precipitations had the opposite influence. The analysis of detrended data also confirmed the negative correlation between the abundance of the wide trace makers and precipitations, especially before the breakpoint as well as the strong influence of the max instant wind speed (Table 4).
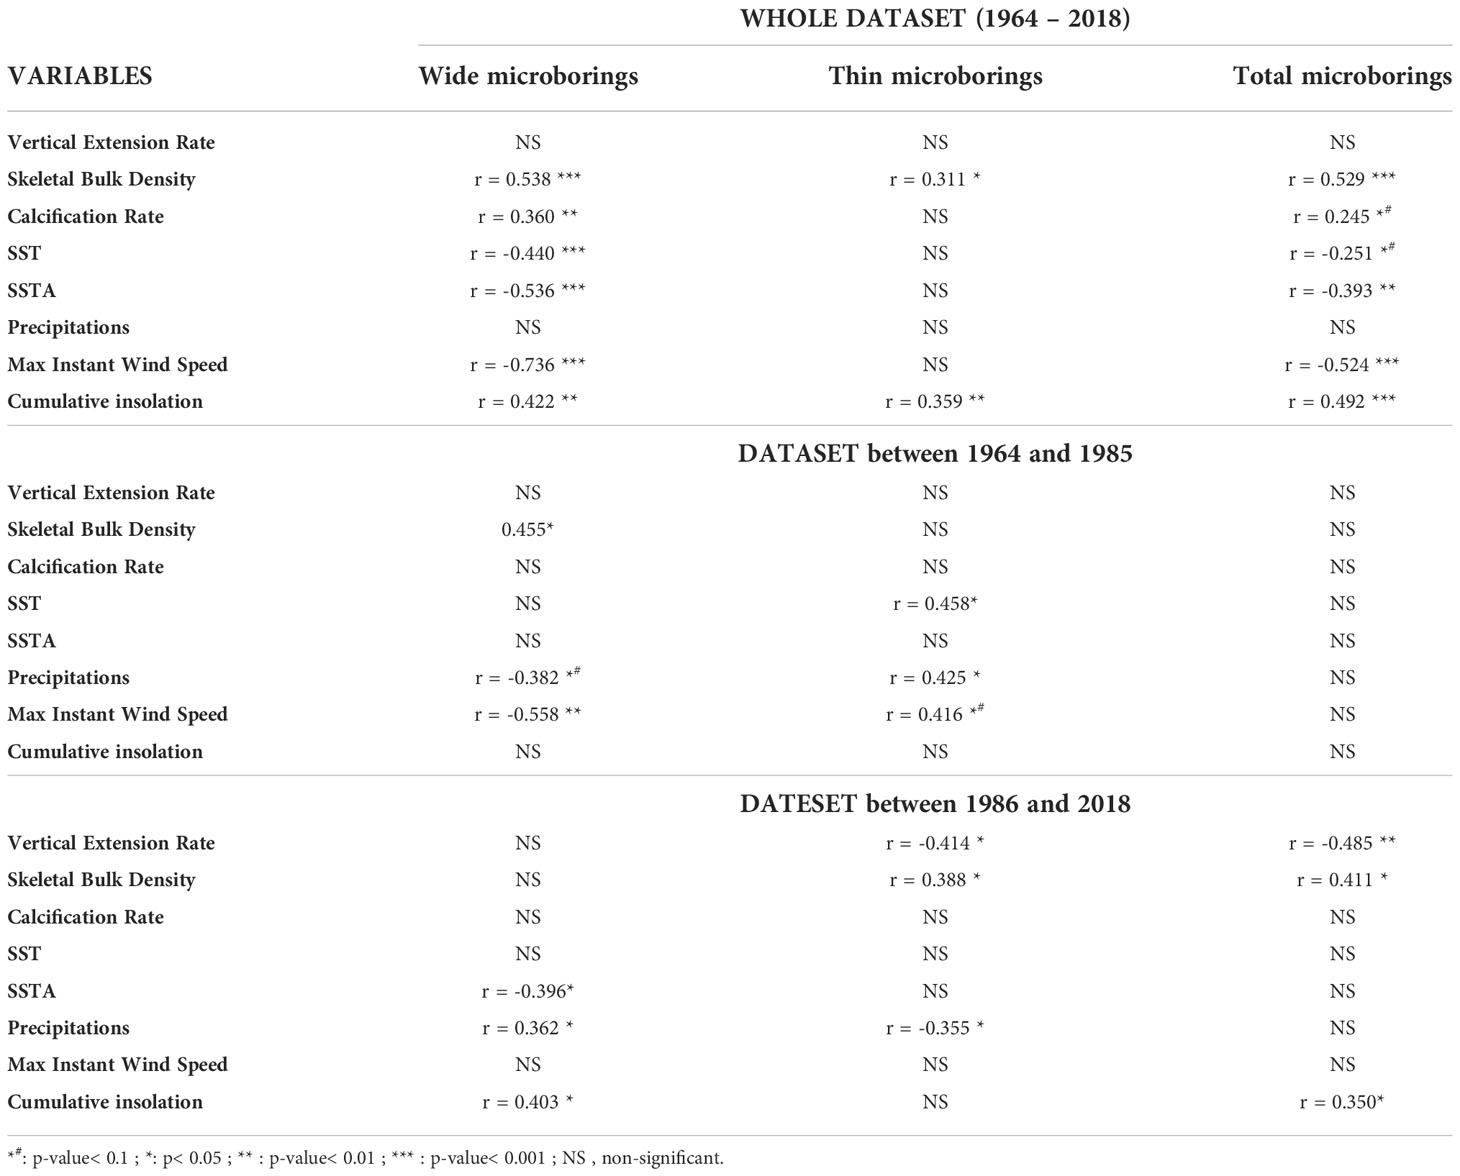
Table 3 Pearson’s correlations between the raw abundance of microborers (wide, thin or total) and raw environmental or coral growth variables over the last 50 years and per period before or after the breakpoint.
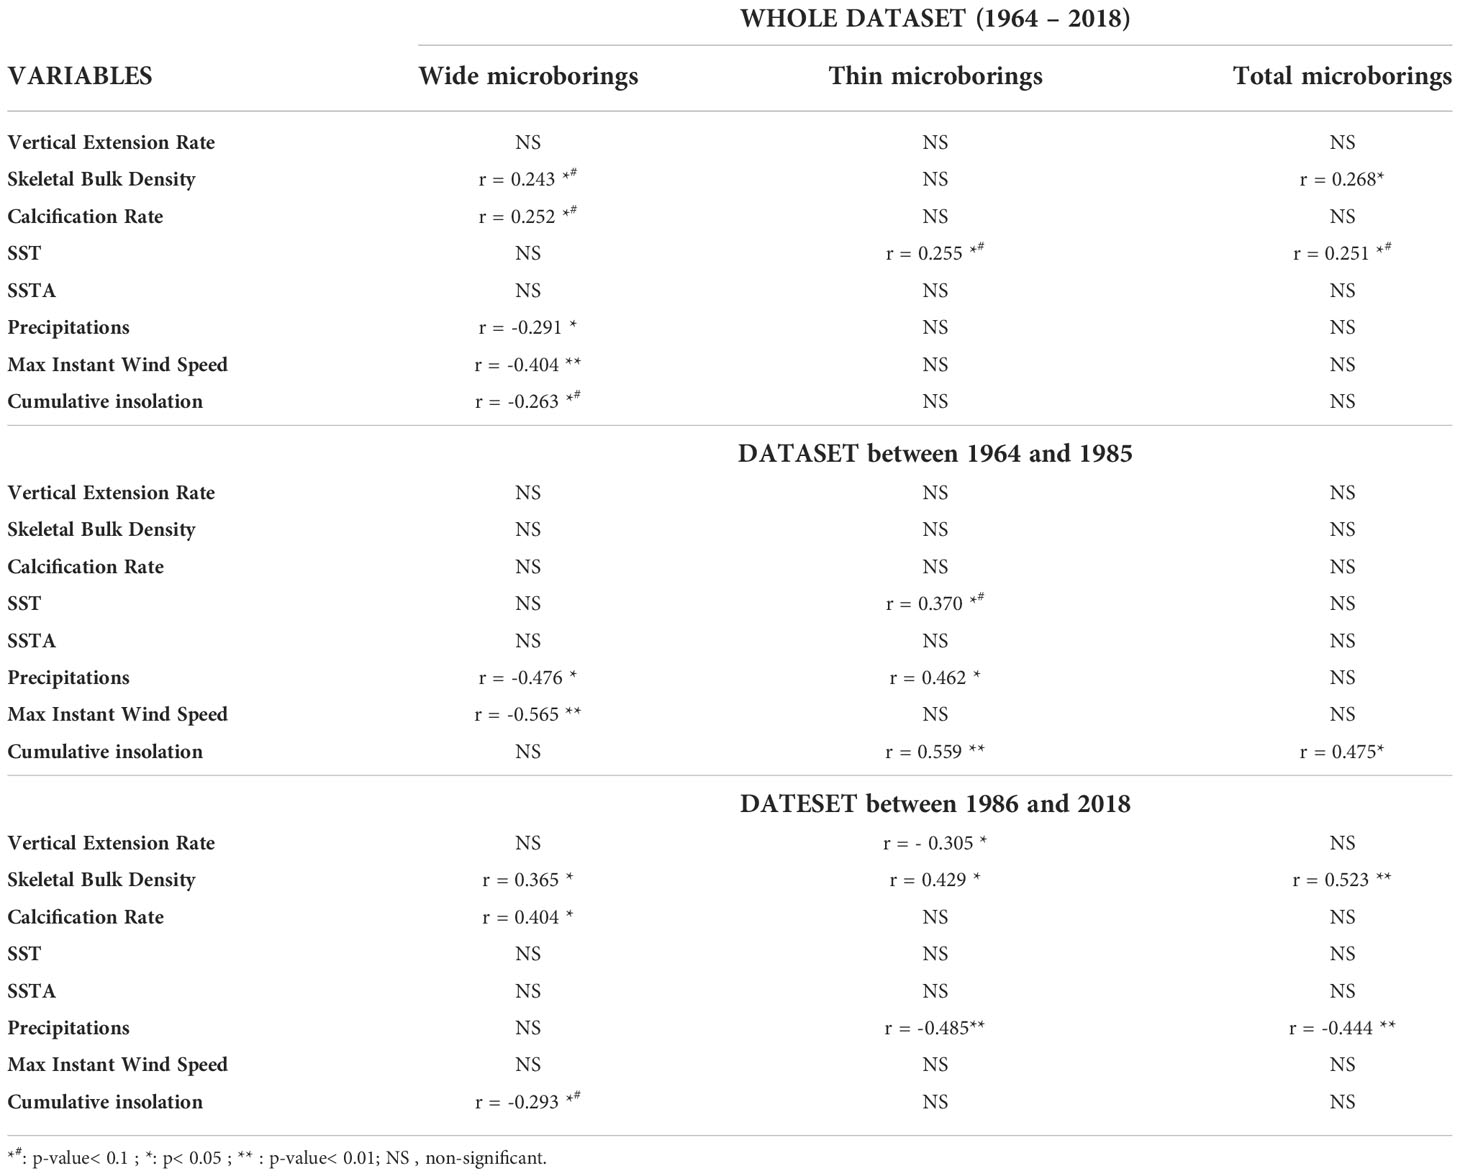
Table 4 Pearson’s correlations between the detrended abundance of microborers (wide, thin or total) and detrended environmental or coral growth variables over the last 50 years and per period before or after the breakpoint.
3.5. Characteristics, drivers and occurrence of green bands
We distinguished a total of 10 green bands extending in parallel to the coral tissue within the upper 15 cm of the coral core. Their thickness varied between 3 and 5 mm (Figures 2B, D, and Table 5) covering on average a period of 1.5 years. The largest green bands were observed between 1991 and 1997. In general, green bands appeared during the winter season or at the end of the summer season. While only 3 green bands were observed between 1964 and the mid-80’s, 7 bands were observed between the mid-80’s and 2018 indicating an increase in the occurrence of these events by 233% after the breakpoint. The interval between two green bands over the studied period varied greatly with a remarkable long period of 8 years and 4 months without any green band between the early 80’s and early 90’s (Table 5). A binary logistic regression on the detrended data showed that the variability of SSTA and the max instant wind speed seemed to be the most significant parameters influencing the green bands’ presence (p = 0.028 and p = 0.021, respectively). This model presented an accuracy of 65% and was better at predicting the absence of green bands than their presence (Figure 10). The model confidence was also greater before the breakpoint (black dotted box) than after as it identified only 3 green bands out of 7 after 1985 (Figure 10).
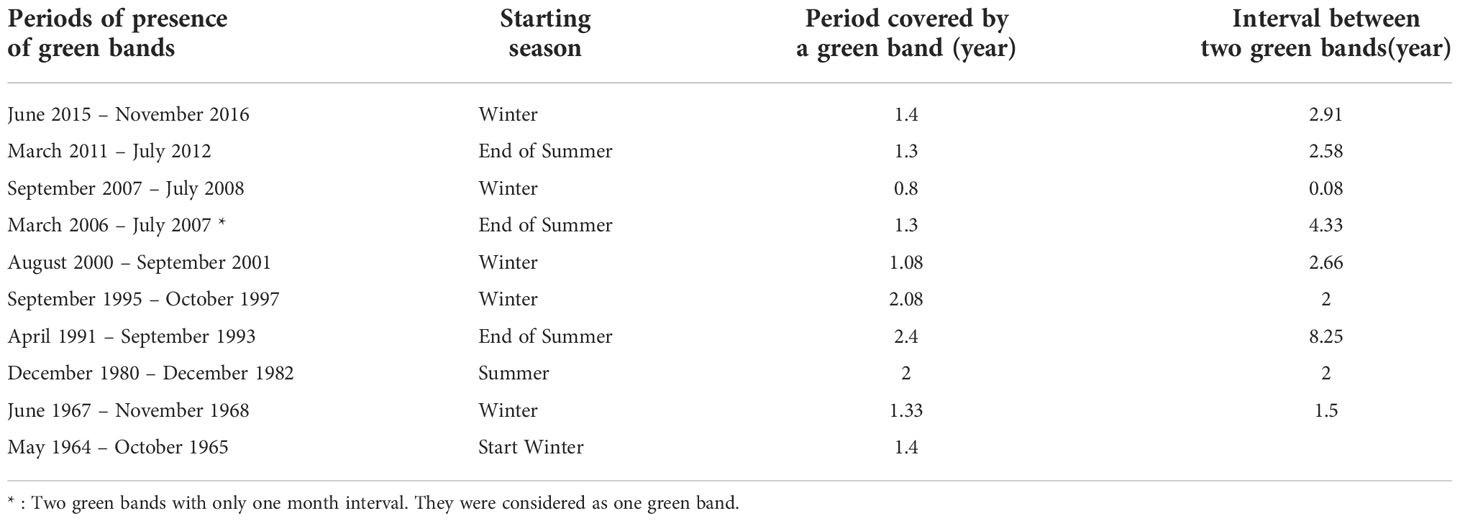
Table 5 Periods at which eye visible green bands were observed along the 15 cm coral core of Diploastrea sp. (Mayotte).
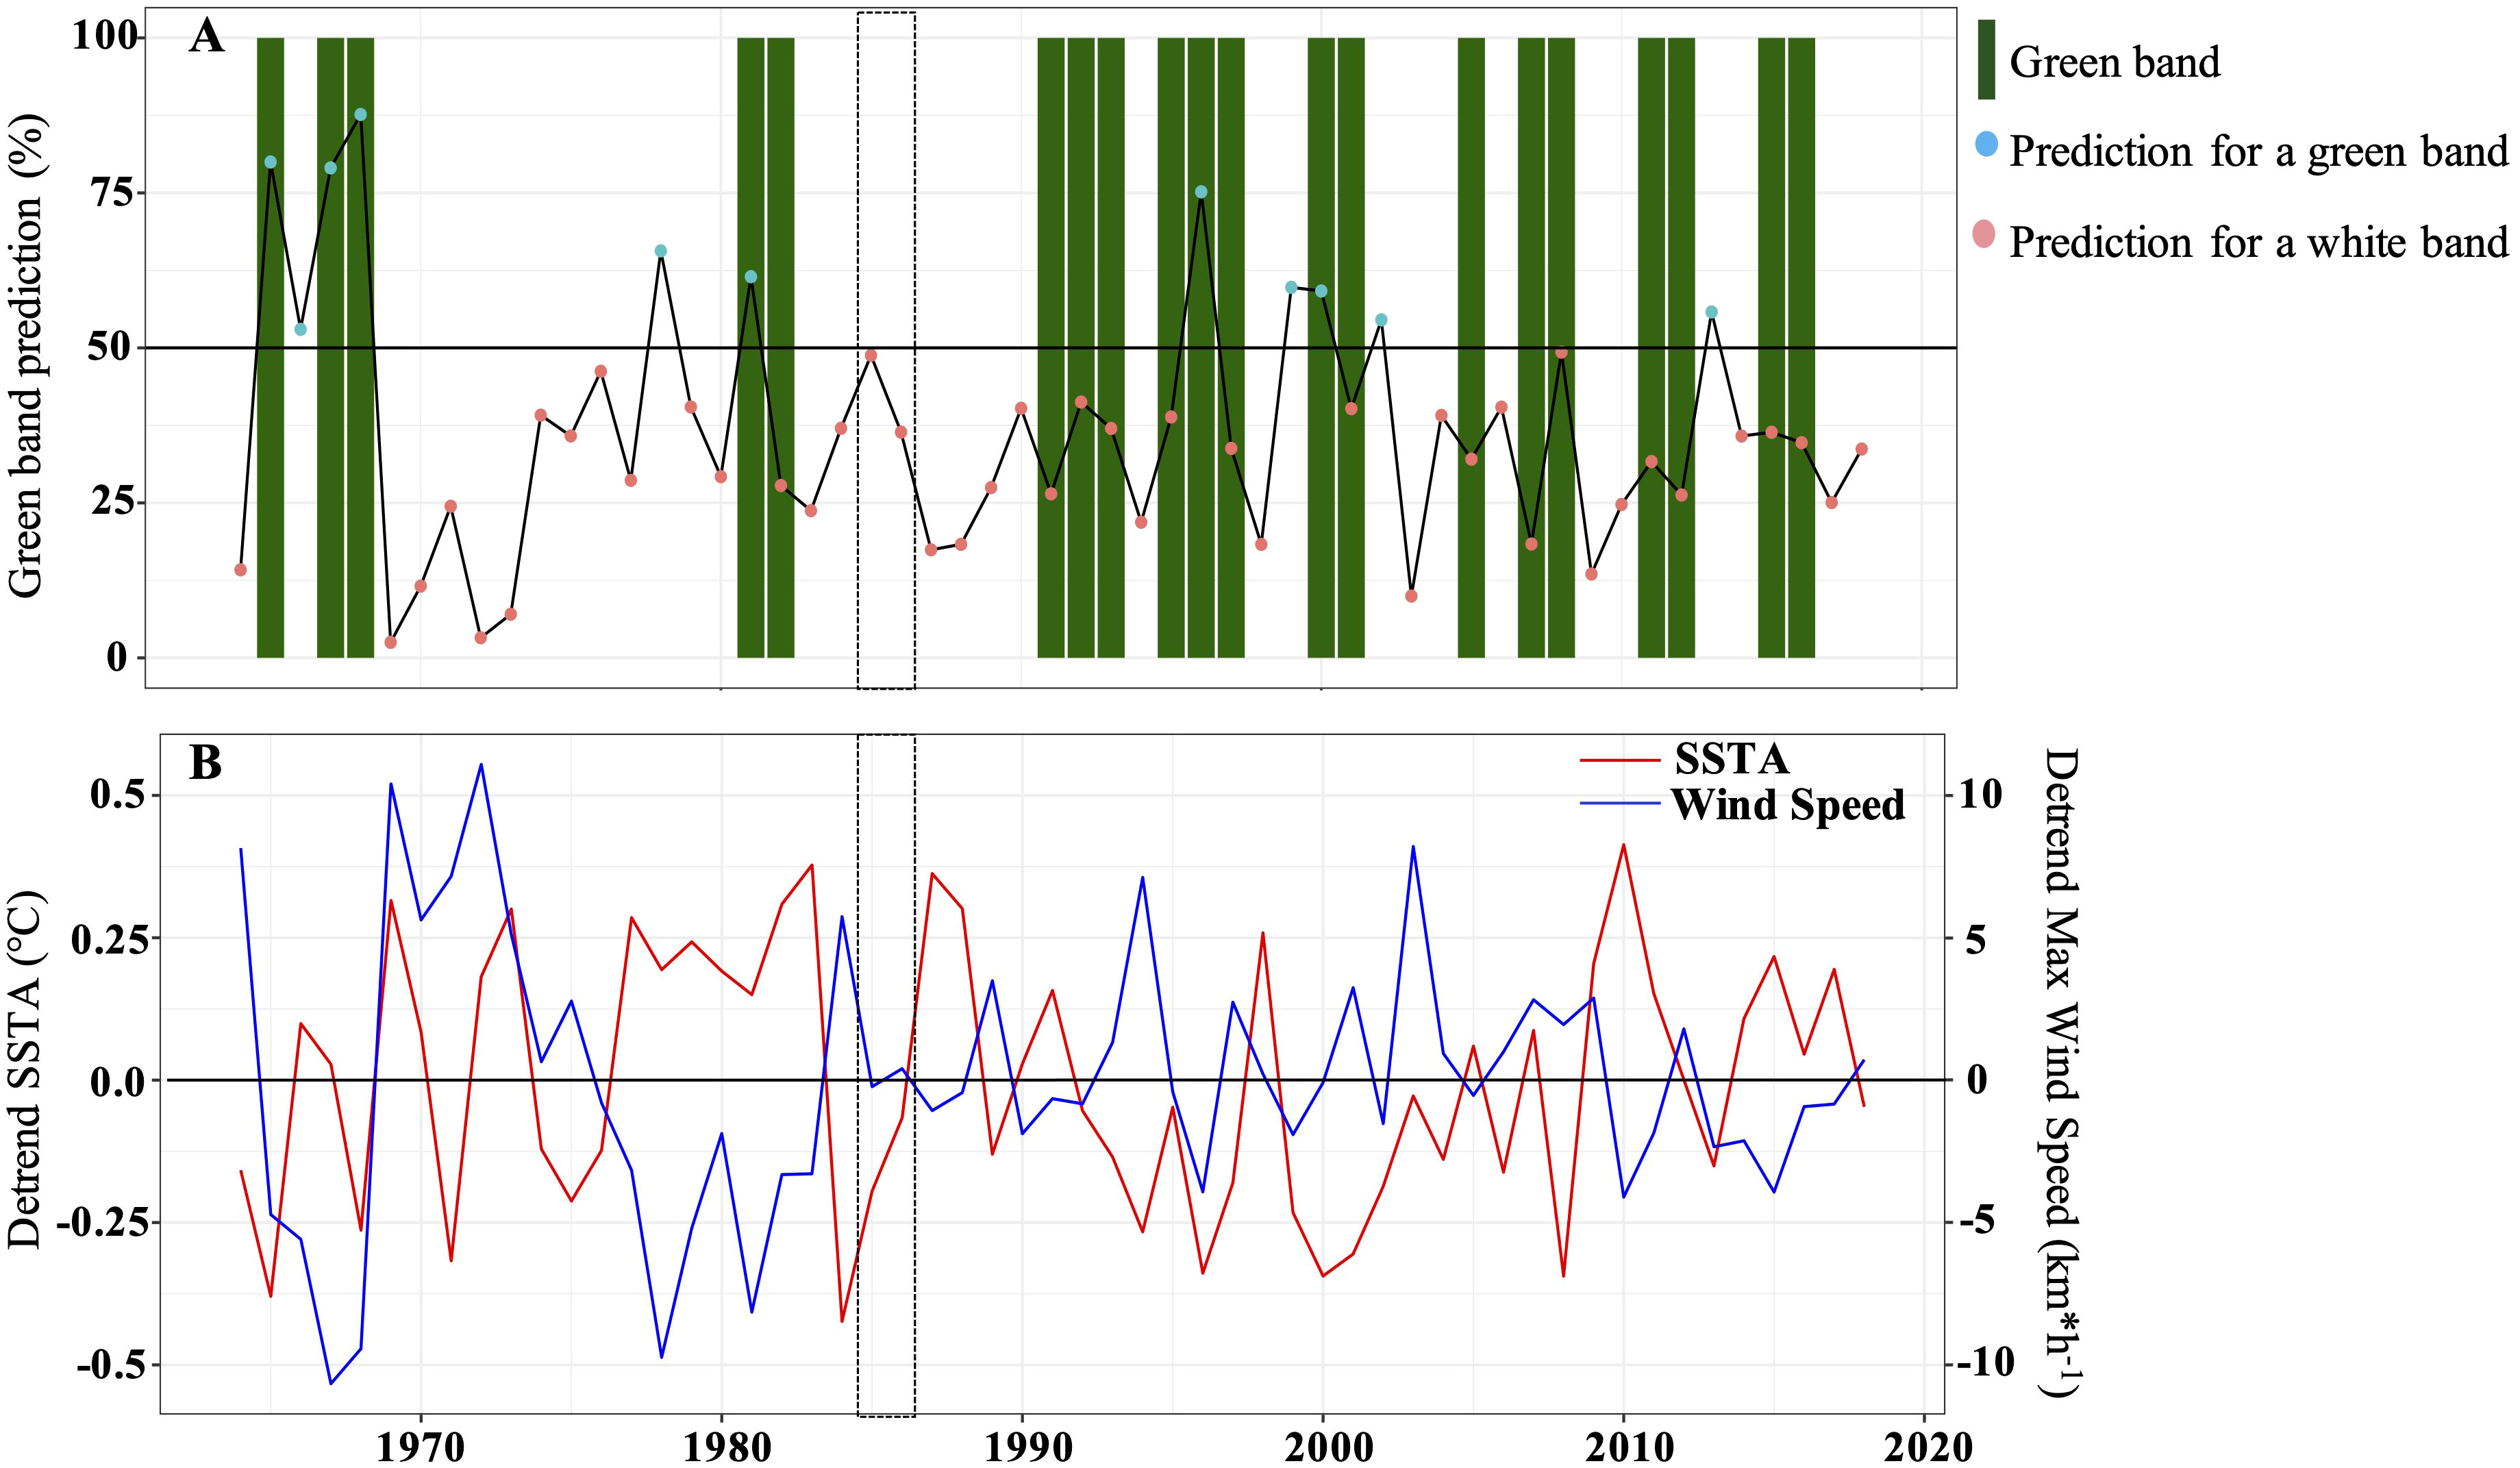
Figure 10 Logistic regression showing the most significant variables used in the prediction model for the presence of green bands. (A) Green band prediction model. Red dots suggest the absence of green bands while blue dots suggest the presence of green bands. Green boxes represent the different green bands observed along the coral core. The black dotted rectangle represents the breakpoint period. (B) Panel showing the most significant variables (detrended instantaneous maximum wind speed and SSTA) explaining the presence/absence of green bands. The black dotted on each panel represents the breakpoint period.
4. Discussion
4.1. Microboring assemblage of Diploastrea sp.: Study method and composition
The machine learning approach developed here to quantify the abundance of microborers in a living coral colony over the last 54 years allowed the study of thousands of SEM images in a few hours with an accuracy of 93%. This is noteworthy because other quantitative methodologies including the total decalcification of coral skeleton to estimate the ash-free dry weight of endoliths (Fordyce et al., 2021) or the number of microboring filaments (Lukas, 1973) implied several biases and/or were time-consuming. Measurements of endolith dry weight include the biomass of the organic matrix of the coral skeleton (about 1%; Cuif et al., 2004) and potentially that of other organisms such as boring sponges, mollusks and/or other endolithic microorganisms (Golubic et al., 1981; Cuif et al., 2004; Kobayashi and Samata, 2006; Tribollet and Golubic, 2011; Yang and Tang, 2019), conducting to an overestimation of microborers biomass. Moreover, such method do not allow microborers observation in their original spatial orientation. The estimation of microborer filaments (Lukas, 1973; Priess et al., 2000) or traces (Chazottes et al., 1995; Carreiro-Silva et al., 2005) depends also on the observer, thus limiting comparisons of results. In the light of the new techniques developed recently by Salamon et al. (2019) and Schätzle et al. (2021) which combine specific fluorescent dyes and SEM or Confocal Laser Scanning Microscopy (CLSM) we believe that our method could be improved to quantify the abundance of a larger variety of microboring traces as here only two types were studied with the machine learning approach. Our method was limited by the grayscale SEM images reducing the ability of the CNN model to distinguish properly the various types of traces. Other hyperparameters of the machine learning process, such as different loss functions, could furthermore improve the accuracy of the analysis but were not tested in the present study.
Although only three types of traces were determined based on their diameter and orientation along the main coral growth axis, we were able to identify the main common trace makers colonizing live coral skeletons, i.e. Ostreobium quekettii with its typical zigzag pattern, Plectonema sp. with its typical ‘spaghetti-like’ pattern and very narrow fungi (Lukas, 1973; Le Campion-Alsumard et al., 1995a; Massé et al., 2018). In addition to those ubiquitous microborers, we observed wide traces (10-30 µm) in abundance forming tubules with specific ramifications, bulges, and/or cross-wall constrictions and club shape apices, all of them mainly oriented towards coral tissues in the central and bottom part of the coral core (light; Figures 6B, D). The trace makers of those tubular microborings were most probably eukaryotic phototrophs due to their shapes and orientation (light-dependent organisms; see also Kolodziej et al., 2012). They could be attributed to other Ostreobium species (Lukas, 1974; Marcelino and Verbruggen, 2016) or other chlorophytes such as Ulvella sp., Gomontia sp., Phaeophila sp., or Epicladia testarum (Bornet and Flahault, 1888; Wisshak et al., 2011; Nielsen et al., 2013; Marcelino and Verbruggen, 2016). We do not believe that they were traces of the Conchocelis stage of bangialean red algae as the typical reddish color was not observed when the coral core was collected (Pica et al., 2016) and the large tubules lasted over decades. The Conchocelis stage is known to be a transient phenomenon in the life cycle of bangialean red macroalgae (Tribollet et al., 2017). Large tubular traces and filaments similar to ours were observed by Kolodziej et al. (2012) and Salamon and Kolodziej (2021) in fossil corals from Eastern Europe (from Paleogene to Jurassic) and were interpreted as those of Ostreobium sp., suggesting that such pattern was maintained over millions of years. We cannot exclude however that some of the observed large traces were made by fungi as they are well known in marine carbonates including coral skeletons (Le Campion-Alsumard et al., 1995b; Bentis et al., 2000; Priess et al., 2000; Wisshak et al., 2011) but based on our observations, the majority of tubules presented a typical shape and orientation of eukaryotic phototrophs.
4.2. Microboring assemblage shift and abundance decrease
For the first time here, we highlight a major shift in the microboring assemblage composition over the life span of a slow-growing massive coral in the Western Indian Ocean (Figures 7, 9). This shift occurred around 1985 and was coupled with a decrease of more than a half of the initial microborer’s abundance (Figure 9). Before the identified breakpoint in 1985-86, the microboring assemblage was dominated by wide tubular traces, and to a less extent by thin ones. After the breakpoint, the assemblage became more diversified over about 10 years and increasingly dominated by thin traces. We strongly suggest here that the decreasing cumulative insolation together with rainfall and rising SST over the studied period (Figure 4 and Table 4) selected thin trace makers at the expense of wide trace makers. Before 1985, wind stress and rainfall may have enhanced the general reduction of light reaching the wide trace makers within the coral skeleton by re-suspending sediments on the barrier reef (Vacelet et al., 1996) and/or increasing terrigenous inputs in the lagoon (Risk et al., 1995; Tribollet, 2008b) accelerating the assemblage shift. Moreover, terrigenous inputs enriched in nutrients in the northern lagoon of Mayotte (Vacelet et al., 1996) may have also enhanced the growth of the thin trace makers. Carreiro-Silva et al. (2009) showed indeed that inorganic nutrients stimulate Ostreobium’s growth as well as that of other bioeroding green algae and cyanobacteria. Although we did not study the genetic diversity of microborers in our coral core, we strongly suggest that the advantaged thin trace makers were dominated by the phototrophic Ostreobium sp. Those bioeroding algae are known to be sciaphile phototrophs, i.e. low-light extremophiles (Shashar and Stambler, 1992; Gektidis, 1999; Tribollet et al., 2006; Tribollet, 2008a), to form green bands in living corals (Odum and Odum, 1955; Lukas, 1973; Le Campion-Alsumard et al., 1995a; Fine and Loya, 2002; Carilli et al., 2010) and to be also stimulated by elevated SST in dead corals (Reyes-Nivia et al., 2013; Grange and Tribollet, unpubl.data). If thin fungi were stimulated instead of thin phototrophic microborers, black bands would have been eventually observed (Priess et al., 2000).
The positive correlation between bulk density and microborers abundance over decades, especially after 1985, appears counterintuitive as the active removal of calcium carbonate by microborers (dissolution process driven by photosynthesis; Garcia-Pichel et al., 2010; Tribollet et al., 2019) would normally conduct to a less dense coral skeleton. Here such an inverse relationship was not seen probably because the bulk density was studied instead of the microdensity. Fordyce et al. (2021) reported that corals with a low skeletal microdensity are more colonized by phototrophic microboring communities as they would benefit from greater and easier access to nutrients (organic matrix: see Massé et al., 2020; Iha et al., 2021) than corals with a high density. Interestingly and similarly to microborers abundance, the coral bulk density, calcification and linear extension rates in our study were strongly correlated to SSTA, rainfall and cumulative insolation (Table 2); factors reported previously by Lough and Barnes (1997) and Lough and Cantin (2014). Ocean acidification might have also been involved in the Diploastrea bulk density decrease (Mollica et al., 2018) but this factor was not studied here. Tribollet et al. (2009), Tribollet et al. (2019) and Reyes-Nivia et al. (2013) showed that Ostreobium sp. growth is stimulated by elevated pCO2 in dead corals, so we hypothesize that this factor might have also contributed to the selection of the thin trace makers (mainly Ostreobium sp.) over the last 54 years, especially over the last two decades as Lo Monaco et al. (2021) reported accelerated acidification in the Mozambique channel. The unclear relationship between the coral bulk density and microborers abundance needs further investigation as it may not be a direct causal and effect relationship or it could vary depending on the coral species, microboring assemblage, and environmental conditions. In the very recent years (2015-2017) when major consecutive positive SSTA occurred (Hughes et al., 2017), the accelerated decrease of microborers abundance probably resulted from the suddenly important vertical extension rate of Diploastrea sp. (4.9 mm*yr-1 ± 1.05). Lough and Barnes (1997) and Kleypas and Langdon (2006) showed that corals can invest more in their vertical extension rate than in their skeletal strength (bulk density) under thermal stress (see Figure 5). The average vertical extension rate for the studied Diploastrea sp. was 2.6 mm.y-1 over the last 54 years, which is similar to that measured on Diploastrea sp. from Palau (2.7 – 6.0 mm*yr-1; Canesi, 2022) and in New Caledonia (2.68 ± 0.64 mm*yr-1, Wu et al., 2018). But between 2015 and 2017 the coral growth extension of our Diploastrea sp. was twofold more important (4.9 mm*yr-1) while the bulk density was reduced by about 40% (1.13 g*cm-3 while in the 60’s it was above 1.6 g*cm-3). Godinot et al. (2012) showed that a rapid vertical coral growth can ‘dilute’ microborers as they cannot keep up with their host’s fast growth. The possible consequences of such a drastic decrease in microborers’ abundance in massive corals such as Diploastrea sp. may be important as several authors suggested that Ostreobium sp. may play a key role in coral health, especially during coral bleaching recovery, by both providing photoprotection (Galindo-Martinez et al., 2022) and photoassimilates (Schlichter et al., 1995; Schlichter et al., 1997; Sangsawang et al., 2017; Massé et al., 2020; Iha et al., 2021). More coral cores should thus be studied to confirm the observed trends in order to better understand the possible implications of an important decrease of microborers abundance in living corals especially the stress-tolerant ones such as Porites sp. (Schoepf et al., 2019; DeCarlo et al., 2019).
4.3. Possible explanatory factors for green bands
Interestingly, our logistic regression model highlighted that the absence of green bands was strongly correlated to an increase in max instant wind speed and positive SSTA (Figure 10). Due to the low number of green bands in our coral core, it was not possible to run our logistic regression model on detrended data before and after the breakpoint to reveal the possible role of different factors on green band formation. However, although no significant correlation was found between the abundance of microborers and the presence of green bands over the studied period (due to the continuous decrease of microborers abundance over the last 54 years), we suggest that wide trace makers before 1985 were a major component of green bands as their abundance was also strongly negatively correlated to the interannual variability of the max instant wind speed (Table 4). Lukas (1973) showed that green bands result from both a greater abundance of microborers, especially Ostreobium sp., and pigment content compared to white bands (see also Fine and Loya, 2002; Galindo-Martinez et al., 2022). Although we cannot exclude that green sulfur bacteria or other endolithic phototrophic microbes may have contributed to green band formation (Yang and Tang, 2019), our correlations computed on raw data tended to confirm the assumption of the influence of the temperature warming on the abundance of microborers, (Table 3). Nevertheless, this should be considered with caution, as the existence of a trend can induce significant correlations with no direct causal links. After 1985 the occurrence of green bands greatly increased, similarly to positive SSTA. The SSTA can either be the trigger for green bands, but with some delay as green bands seem to have formed generally during the winter season, or limit their expansion as most green bands have stopped when the summer season started. Anomalously warm temperatures are known to cause major coral bleaching events (Hughes et al., 2017). In the Western Indian Ocean, several bleaching events have been reported: in 1983, 1998, 2005, 2007, 2010, and 2016 (Obura et al., 2018). It is interesting to note here that no green band was recorded at those periods except in 2016 (Table 4). The hypothesis stating that more light reaching boring microflora in corals during bleaching periods would lead to a bloom of these microorganisms and thus the formation of green bands (Fine and Loya, 2002; Carilli et al., 2010), is not supported by our results. The time scale is also different since bleaching events occured over a few weeks while green bands lasted several months or years (Table 4). More coral cores from contrasted environments should be investigated to better understand the controlling factors of microborers abundance, their community composition, and the presence of green bands in living corals. Environmental factors such as seawater pH, DIC, and metal trace pollution could be good targets as these factors are known to affect microborer’s abundance in dead carbonates (Tribollet et al., 2009; Cherchi et al., 2011; Reyes-Nivia et al., 2013).
5. Conclusion
The study of a coral core of the very slow-growing massive coral Diploastrea sp. revealed an unprecedented decrease in microborers abundance and a major shift in community composition over the last decades. Possible explanatory factors are ocean warming (both SST and SSTA), wind stress, precipitations, and cumulative insolation more or less combined, as well as the bulk density of the coral host. The direct or indirect effects of those factors on microboring communities need to be explored, especially that of global warming. The main cause of the shift and major decrease in microborers abundance in 1985 needs also to be determined. Mayotte showed a rapid increase in its demography since the 80’s, especially since 2012 (+3.8%/year; INSEE), which may have greatly impacted the quality of the lagoon. Additionally, Gupta et al. (2020) reported an important marine heat wave in the Mozambique Channel around 1983. Other factors such as seawater pH and metal trace pollution which influence microborers abundance could also be involved. More coral cores of Diploastrea sp. and other massive species such as Porites from contrasted environments in the Western Indian Ocean should be studied to confirm the general trends observed here and to better understand their possible implications for coral health and resilience.
Data availability statement
The original data are presented here and in Supplementary Material. Any further inquiries should be sent to the correspondent authors.
Author contributions
AT designed, coordinated and funded the project. AT and CL collected the coral core in Mayotte. DA and JB developed the innovative machine learning approach. DA prepared samples from the coral core, and obtained and analyzed the SEM images. He also collected all the environmental data and managed the statistical analyses with the help of AT and JB. GC, ED and MC developed a new approach to measure the skeleton density of massive corals. MC also prepared and analyzed coral standards. DA and FC measured the coral growth rate on both the X-ray radiograph (acquired by DA) and CT scan. DA, AT and JB interpreted the results and wrote the manuscript with the help of all co-authors. All authors contributed to the article and approved the submitted version.
Funding
The presented work was made possible thanks to several funding agencies which supported the project: INSU-CNRS-EC2CO-LEFE (program CARBODISS 2018-2020), IRD support through the laboratory LOCEAN (2019-2021), The University of Sorbonne (UPMC, Paris 6), the Marine Park Authority of Mayotte (2019-2020), The Belmont Forum International program (project OA-ME) and France Relance through The Office Français de la Biodiversité for the program Future Maore Reefs (2021-2023).
Acknowledgments
We would like to thank the following people for their help and assistance: Michel Guillemard, head of the company TSMOI (Reunion Island) for helping us collecting the coral core in Mayotte in October 2018, Sandrine Caquineau (IRD-France Nord) for SEM training and collection, Thierry Pilorge (IRD-France Nord) for his help cutting the coral core and preparing samples for the observation of resin casts of microborings, Anne-Catherine Simon and Mathieu Agelou (CEA Gif-sur-Yvette) for the CT-scan of the coral core. Finally, we thank the Marine Park Authority of Mayotte and local authorities in Mayotte for making fieldwork possible, Antonella Pellecchia from the University of Bologna (Italy) for her contribution to the preparation of the first coral samples for SEM analysis, and François Guilhaumon for his suggestions regarding the statistical analyses.
Conflict of interest
The authors declare that the research was conducted in the absence of any commercial or financial relationships that could be construed as a potential conflict of interest.
Publisher’s note
All claims expressed in this article are solely those of the authors and do not necessarily represent those of their affiliated organizations, or those of the publisher, the editors and the reviewers. Any product that may be evaluated in this article, or claim that may be made by its manufacturer, is not guaranteed or endorsed by the publisher.
Supplementary material
The Supplementary Material for this article can be found online at: https://www.frontiersin.org/articles/10.3389/fmars.2022.899398/full#supplementary-material
References
Ainsworth T. D., Fordyce A. J., Camp E. F. (2017). The other microeukaryotes of the coral reef microbiome. Trends Microbiol. 25 (12), 980–991. doi: 10.1016/j.tim.2017.06.007
Bentis C. J., Kaufman L., Golubic S. (2000). Endolithic fungi in reef-building corals (order: Scleractinia) are common, cosmopolitan, and potentially pathogenic. Biol. Bull. 198 (2), 254–260. doi: 10.2307/1542528
Bornet E., Flahault C. (1888). Note sur deux nouveaux genres d’algues perforantes. J. Botanique Morot 2, 161–165.
Bucher D. J., Harriott V. J., Roberts L. G. (1998). Skeletal micro-density, porosity and bulk density of acroporid corals. J. Exp. Mar. Biol. Ecol. 228 (1), 117–136. doi: 10.1016/S0022-0981(98)00020-3
Buddemier R. W. (1974). Environmental controls over annual and lunar monthly cycles in hermatypic coral calcification. Proc. Second Int. Coral Reef Symposium 2, 259–267.
Canesi M. (2022). Impacts of global change on massive porites and diploastrea corals across the pacific ocean (Cambridge: University of Paris-Saclay), 212 pp.
Carilli J. E., Godfrey J., Norris R. D., Sandin S. A. (2010). Periodic endolithic algal blooms in Montastraea faveolata corals may represent periods of low-level stress. Bull. Mar. Sci. 86 (3), 709–718.
Carreiro-Silva M., McClanahan T. R., Kiene W. E. (2005). The role of inorganic nutrients and herbivory in controlling microbioerosion of carbonate substratum. Coral Reefs 24 (2), 214–221. doi: 10.1007/s00338-004-0445-3
Carreiro-Silva M., McClanahan T. R., Kiene W. E. (2009). Effects of inorganic nutrients and organic matter on microbial euendolithic community composition and microbioerosion rates. Mar. Ecol. Prog. Ser. 392, 1–15. doi: 10.3354/meps08251
Chazottes V., Le Campion-Alsumard T., Peyrot-Clausade M. (1995). Bioerosion rates on coral reefs: Interactions between macroborers, microborers and grazers (Moorea, French Polynesia). Palaeogeography Palaeoclimatology Palaeoecol. 113 (2–4), 189–198. doi: 10.1016/0031-0182(95)00043-L
Cherchi A., Alessandri A., Masina S., Navarra A. (2011). Effects of increased CO2 levels on monsoons. Climate Dynamics 37 (1–2), 83–101. doi: 10.1007/s00382-010-0801-7
Chevalier C., Devenon J. L., Pagano M., Rougier G., Blanchot J., Arfi R. (2017). The atypical hydrodynamics of the Mayotte lagoon (Indian ocean): Effects on water age and potential impact on plankton productivity. Estuarine Coast. Shelf Sci. 196 (September), 182–197. doi: 10.1016/j.ecss.2017.06.027
Coulibaly G. (2021). Développement de la mesure quantitative de la densité du squelette corallien par 3D-Tomographie à différentes résolution spatiales. Université de Paris. (Paris) 42pp.
Cuif J. P., Dauphin Y., Berthet P., Jegoudez J. (2004). Associated water and organic compounds in coral skeletons: Quantitative thermogravimetry coupled to infrared absorption spectrometry. Geochemistry Geophysics Geosystems 5 (11), GC000783. doi: 10.1029/2004GC000783
Cuny-Guirriec K., Douville E., Reynaud S., Allemand D., Bordier L., Canesi M., et al. (2019). Coral Li/Mg thermometry: Caveats and constraints. Chem. Geology 523 (September), 162–178. doi: 10.1016/j.chemgeo.2019.03.038
DeCarlo T. M., Cohen A. L. (2017). Dissepiments, density bands and signatures of thermal stress in Porites skeletons. Coral Reefs 36 (3), 749–761. doi: 10.1007/s00338-017-1566-9
DeCarlo T. M., Harrison H. B., Gajdzik L., Alaguarda D., Rodolfo-Metalpa R., D’Olivo J., et al. (2019). “Acclimatization of massive reef-building corals to consecutive heatwaves”. Proc. R. Soc. B: Biol. Sci. 286 (1898), 20190235. doi: 10.1098/rspb.2019.0235
Del Campo J., Pombert J. F., Šlapeta J., Larkum A., Keeling P. J. (2017). The ‘other’ coral symbiont: Ostreobium diversity and distribution. ISME J. 11 (1), 296–299. doi: 10.1038/ismej.2016.101
Enochs I. C., Manzello D. P., Kolodziej G., Noonan S. H. C., Valentino L., Fabricius K. E. (2016). Enhanced macroboring and depressed calcification drive net dissolution at high CO2 coral reefs. Proc. R. Soc. B: Biol. Sci. 283 (1842), 20161742. doi: 10.1098/rspb.2016.1742
Eyre B. D., Cyronak T., Drupp P., De Carlo E. H., Sachs J. P., Andersson A. J. (2018). Coral reefs will transition to net dissolving before end of century. Science 359 (6378), 908–911. doi: 10.1126/science.aao1118
Fine M., Fine E. F., Hoegh-Guldberg O. (2005). Tolerance of endolithic algae to elevated temperature and light in the coral Montipora monasteriata from the southern great barrier reef. J. Exp. Biol. 208 (1), 75–81. doi: 10.1242/jeb.01381
Fine M., Loya Y. (2002). Endolithic algae: An alternative source of photoassimilates during coral bleaching. Proc. R. Soc. B: Biol. Sci. 269 (1497), 1205–1210. doi: 10.1098/rspb.2002.1983
Fordyce A. J., Ainsworth T. D., Leggat W. (2021). Light capture, skeletal morphology, and the biomass of corals’ boring endoliths. MSphere 6 (1), e00060-21. doi: 10.1128/msphere.00060-21
Galindo-Martínez C. T., Weber M., Avila-Magaña V., Enríquez S., Kitano H., Medina M., et al. (2022). The role of the endolithic alga Ostreobium spp. during coral bleaching recovery. Sci. Rep. 12 (1), 2977. doi: 10.1038/s41598-022-07017-6
Garcia-Pichel F., Ramírez-Reinat E., Gao Q. (2010). Microbial excavation of solid carbonates powered by p-type ATPase-mediated transcellular Ca2+ transport. Proc. Natl. Acad. Sci. United States America 107 (50), 21749–21754. doi: 10.1073/pnas.1011884108
Gektidis M. (1999). Development of microbial euendolithic communities : The influence of might and time. Bull. Geological Soc. Denmark. 45, 147–150. doi: 10.37570/bgsd-1998-45-18
Godinot C., Tribollet A., Grover R., Ferrier-Pagès C. (2012). Bioerosion by euendoliths decreases in phosphate-enriched skeletons of living corals. Biogeosciences 9 (7), 2377–2384. doi: 10.5194/bg-9-2377-2012
Golubic S., Friedmann I. E., Schneider J. (1981). The lithobiontic ecological niche, with special reference to microorganisms. J. Sedimentary Res. 51 (2), 475–478. doi: 10.1306/212F7CB6-2B24-11D7-8648000102C1865D
Golubic S., Schneider J., Le Campion-Alsumard T., Campbell S. E., Hook J. E., Radtke G. (2019). Approaching microbial bioerosion. Facies 65 (3), 25. doi: 10.1007/s10347-019-0568-1
Grange J. S., Rybarczyk H., Tribollet A. (2015). The three steps of the carbonate biogenic dissolution process by microborers in coral reefs (New Caledonia). Environ. Sci. pollut. Res. 22 (18), 13625–13637. doi: 10.1007/s11356-014-4069-z
Gupta A. S., Thomsen M., Benthuysen J. A., Hobday A. J., Oliver E., Alexander L. V., et al. (2020). Drivers and impacts of the most extreme marine heatwave events. Sci. Rep. 10 (1), 19359. doi: 10.1038/s41598-020-75445-3
Huang B., Banzon V. F., Freeman E., Lawrimore J., Liu W., Peterson T. C., et al. (2015). Extended reconstructed Sea surface temperature version 4 (ERSST.v4). part I: Upgrades and intercomparisons. J. Climate 28 (3), 911–930. doi: 10.1175/JCLI-D-14-00006.1
Huang B., Thorne P. W., Banzon V. F., Boyer T., Chepurin G., Lawrimore J. H., et al. (2017). Extended reconstructed Sea surface temperature, version 5 (ERSSTv5): Upgrades, validations, and I-intercomparisons. J. Climate 30 (20), 8179–8205. doi: 10.1175/JCLI-D-16-0836.1
Hughes T. P., Anderson K. D., Connolly S. R., Heron S. F., Kerry J. T., Lough J. M., et al. (2018). Spatial and temporal patterns of mass bleaching of corals in the anthropocene. Science 359 (6371), 80–83. doi: 10.1126/science.aan8048
Hughes T. P., Baird A. H., Bellwood D. R., Card M., Connolly S. R., Folke C., et al. (2003). Climate change, human impacts, and the resilience of coral reefs. Science 301 (5635), 929–933. doi: 10.1126/science.1085046
Hughes T. P., Kerry J. T., Álvarez-Noriega M., Álvarez-Romero J. G., Anderson K. D., Baird A. H., et al. (2017). Global warming and recurrent mass bleaching of corals. Nature 543 (7645), 373–377. doi: 10.1038/nature21707
Iha C., Dougan K. E., Varela J. A., Avila V., Jackson C. J., Bogaert K. A., et al. (2021). Genomic adaptations to an endolithic lifestyle in the coral-associated alga Ostreobium. Curr. Biol. 31 (7), 1393–1402.e5. doi: 10.1016/j.cub.2021.01.018
IPCC (2019). Special report on the ocean and cryosphere in a changing climate (Intergovernmental Panel on Climate Change). Available at: https://www.ipcc.ch/srocc/chapter/summary-for-policymakers/.
Jeanson M., Anthony E. J., Dolique F., Cremades C. (2014). Mangrove evolution in Mayotte island, Indian ocean: A 60 year synopsis based on aerial photographs. Wetlands 34 (3), 459–468. doi: 10.1007/s13157-014-0512-7
Kleypas J. A., Langdon C. (2006). Coral reefs and changing seawater carbonate chemistry. (Washington: American Geophysical Union) 73–110. doi: 10.1029/61CE06
Knutson D. W., Buddemeier R. W., Smith S. V. (1972). Coral chronometers: Seasonal growth bands in reef corals. Science 177 (4045), 270–272. doi: 10.1126/science.177.4045.270
Kobayashi I., Samata T. (2006). Bivalve shell structure and organic matrix. Materials Sci. Engineering: C 26 (4), 692–698. doi: 10.1016/j.msec.2005.09.101
Kolodziej B., Golubic S., Bucur I. I., Radtke G., Tribollet A. (2012). Early cretaceous record of microboring organisms in skeletons of growing corals. Lethaia 45 (1), 34–45. doi: 10.1111/j.1502-3931.2011.00291.x
Krizhevsky A., Sutskever I., Hinton G. E. (2017). ImageNet classification with deep convolutional neural networks. Commun. ACM 60 (6), 84–90. doi: 10.1145/3065386
Kühl M., Polerecky L. (2008). Functional and structural imaging of phototrophic microbial communities and symbioses. Aquat. Microbial Ecol. 53 (September), 99–118. doi: 10.3354/ame01224
Le Campion-Alsumard T., Golubic S., Hutchings P. (1995a). Microbial endoliths in skeletons of live and dead corals: Porites lobata (Moorea, French Polynesia). Mar. Ecol. Prog. Ser. 117 (1–3), 149–158. doi: 10.3354/meps117149
Le Campion-Alsumard T., Golubic S., Priess K. (1995b). Fungi in corals: Symbiosis or disease? interaction between polyps and fungi causes pearl-like skeleton biomineralization. Mar. Ecol. Prog. Ser. 117, 137–147. doi: 10.3354/meps117137
Lo Monaco C., Metzl N., Fin J., Mignon C., Cuet P., Douville E., et al. (2021). Distribution and long-term change of the sea surface carbonate system in the Mozambique channel (1963–2019). Deep Sea Res. Part II: Topical Stud. Oceanography 186–188 (May), 104936. doi: 10.1016/j.dsr2.2021.104936
Lough J. M., Barnes D. J. (1997). Several centuries of variation in skeletal extension, density and calcification in massive Porites colonies from the great barrier reef: A proxy for seawater temperature and a background of variability against which to identify unnatural change. J. Exp. Mar. Biol. Ecol. 211 (1), 29–67. doi: 10.1016/S0022-0981(96)02710-4
Lough J. M., Cantin N. E. (2014). Perspectives on massive coral growth rates in a changing ocean. Biol. Bull. 226 (3), 187–202. doi: 10.1086/BBLv226n3p187
Lukas K. J. (1973). Taxonomy and ecology of the endolithic microflora of reef corals, with a review of the literature on endolithic microphytes (Rhode Island: University Rhode Island), 318 pp.
Lukas K. J. (1974). Two species of the chlorophyte genus Ostreobium from skeletons of atlantic caribbean reef corals. J. Phycology 10 (3), 331–335. doi: 10.1111/j.1529-8817.1974.tb02722.x
Magnusson S. H., Fine M., Kühl M. (2007). Light microclimate of endolithic phototrophs in the scleractinian corals Montipora monasteriata and Porites cylindrica. Mar. Ecol. Prog. Ser. 332 (March), 119–128. doi: 10.3354/meps332119
Marcelino V. R., Verbruggen H. (2016). Multi-marker metabarcoding of coral skeletons reveals a rich microbiome and diverse evolutionary origins of endolithic algae. Sci. Rep. 6 (1), 31508. doi: 10.1038/srep31508
Massé A., Domart-Coulon I., Golubic S., Duché D., Tribollet A. (2018). Early skeletal colonization of the coral holobiont by the microboring ulvophyceae Ostreobium sp. Sci. Rep. 8 (1), 1–11. doi: 10.1038/s41598-018-20196-5
Massé A., Tribollet A., Meziane T., Bourguet-Kondracki M., Yéprémian C., Sève C., et al. (2020). Functional diversity of microboring Ostreobium algae isolated from corals. Environ. Microbiol. 22 (11), 4825–4846. doi: 10.1111/1462-2920.15256
McManus L. C., Forrest D. L., Tekwa E. W., Schindler D. E., Colton M. A., Webster M. M., et al. (2021). Evolution and connectivity influence the persistence and recovery of coral reefs under climate change in the caribbean, southwest pacific, and coral triangle. Global Change Biol. 27 (18), 4307–4321. doi: 10.1111/gcb.15725
Mollica N. R., Cohen A. L., Alpert A. E., Barkley H. C., Brainard R. E., Carilli J. E., et al. (2018). Skeletal records of bleaching reveal different thermal thresholds of pacific coral reef assemblages. Coral Reefs 38 (6), 743–757. doi: 10.1007/s00338-019-01834-4
Montagna P., McCulloch M., Douville E., López Correa M., Trotter J., Rodolfo-Metalpa R., et al. (2014). Li/Mg systematics in scleractinian corals: calibration of the thermometer. Geochimica Cosmochimica Acta 132 (May), 288–310. doi: 10.1016/j.gca.2014.02.005
Nielsen R., Petersen G., Seberg O., Daugbjerg N., O’Kelly C. J., Wysor B. (2013). Revision of the genus Ulvella (Ulvellaceae, ulvophyceae) based on morphology and tufA gene sequences of species in culture, with Acrochaete and Pringsheimiella placed in synonymy. Phycologia 52 (1), 37–56. doi: 10.2216/11-067.1
Obura D. O., Bigot L., Benzoni F. (2018). Coral responses to a repeat bleaching event in Mayotte in 2010. PeerJ 6 (August), e5305. doi: 10.7717/peerj.5305
Odum H. T., Odum E. P. (1955). Trophic structure and productivity of a windward coral reef community on eniwetok atoll. Ecol. Monogr. 25 (3), 291–320. doi: 10.2307/1943285
Perry C. T., Steneck R. S., Murphy G. N., Kench P. S., Edinger E. N., Smithers S. G., et al. (2014). Regional-scale dominance of non-framework building corals on caribbean reefs affects carbonate production and future reef growth. Global Change Biol. 21 (3), 1153–1164. doi: 10.1111/gcb.12792
Pica D., Tribollet A., Golubic S., Bo M., Camillo C. G. D., Bavestrello G., et al. (2016). Microboring organisms in living stylasterid corals (Cnidaria, hydrozoa). Mar. Biol. Res. 12 (6), 573–825. doi: 10.1080/17451000.2016.1169298
Priess K., Le Campion-Alsumard T., Thomassin B. A., Golubic S., Gadel F. (2000). Fungi in corals: Black bands and density-banding of Porites lutea and Porites lobata skeleton. Mar. Biol. 136 (1), 19–27. doi: 10.1007/s002270050003
Reyes-Nivia C., Diaz-Pulido G., Kline D., Hoegh Guldberg O., Dove S. (2013). Ocean acidification and warming scenarios increase microbioerosion of coral skeletons. Global Change Biol. 19 (6), 1919–1929. doi: 10.1111/gcb.12158
Ricci F., Marcelino V. R., Blackall L. L., Kühl M., Medina M., Verbruggen H. (2019). Beneath the surface: Community assembly and functions of the coral skeleton microbiome. Microbiome 7 (1), 159. doi: 10.1186/s40168-019-0762-y
Risk M. J., Sammarco P. W., Edinger E. N. (1995). Bioerosion in Acropora across the continental shelf of the great barrier reef. Coral Reefs 14 (2), 79–86. doi: 10.1007/BF00303427
Ronneberger O., Fischer P., Brox T. (2015). “U-Net: Convolutional networks for biomedical image segmentation,” in Medical image computing and computer-assisted intervention (Cham: Springer), vol. 9351. , 234–241. doi: 10.1007/978-3-319-24574-4_28
Salamon K., Bogusław K. (2021). Unravelling the microbiome of fossil corals: A message from microborings. Historical Biol. 00 (00), 1–12. doi: 10.1080/08912963.2021.1971213
Salamon K., Bogusław K., Vadim L. S. (2019). Simple methods for detection of microborings produced by coral-associated microendoliths. Facies 65 (2), 1–13. doi: 10.1007/s10347-019-0560-9
Sangsawang L., Casareto B. E., Ohba H., Vu H. M., Meekaew A., Suzuki T., et al. (2017). 13C and 15N assimilation and organic matter translocation by the endolithic community in the massive coral Porites lutea. R. Soc. Open Sci. 4 (12), 171201. doi: 10.1098/rsos.171201
Sauvage T., Schmidt W. E., Suda S., Fredericq S. (2016). A metabarcoding framework for facilitated survey of endolithic phototrophs with tufA. BMC Ecol. 16 (1), 8. doi: 10.1186/s12898-016-0068-x
Schätzle P. K., Wisshak M., Bick A., Freiwald A., Kieneke A. (2021). Exploring confocal laser scanning microscopy (CLSM) and fluorescence staining as a tool for imaging and quantifying traces of marine microbioerosion and their trace-making microendoliths. J. Microscopy 284 (2), 118–131. doi: 10.1111/jmi.13046
Schlichter D., Kampmann H., Conrady S. (1997). Trophic potential and photoecology of endolithic algae living within coral skeletons. Mar. Ecol. 18 (4), 299–317. doi: 10.1111/j.1439-0485.1997.tb00444.x
Schlichter D., Zscharnack B., Krisch H. (1995). Transfer of photoassimilates from endolithic algae to coral tissue. Naturwissenschaften 82 (12), 561–564. doi: 10.1007/BF01140246
Schoepf V., Carrion S. A., Pfeifer S. M., Naugle M., Dugal L., Bruyn J., et al. (2019). Stress-resistant corals may not acclimatize to ocean warming but maintain heat tolerance under cooler temperatures. Nat. Commun. 10 (1), 1–10. doi: 10.1038/s41467-019-12065-0
Schönberg C. H. L., Fang J. K. H., Carreiro-Silva M., Tribollet A., Wisshak M. (2017). Bioerosion: the other ocean acidification problem. ICES J. Mar. Sci. 74 (4), 895–925. doi: 10.1093/icesjms/fsw254
Schott F. A., McCreary J. P. (2001). The monsoon circulation of the Indian ocean. Prog. Oceanography 51 (1), 1–123. doi: 10.1016/S0079-6611(01)00083-0
Shashar N., Stambler N. (1992). Endolithic algae within corals: Life in an extreme environment. J. Exp. Mar. Biol. Ecol. 163 (2), 277–286. doi: 10.1016/0022-0981(92)90055-F
Taylor P. D., Jones C. G. (1993). Skeletal ultrastructure in the cyclostome bryozoan Hornera. Acta Zoologica 74 (2), 135–143. doi: 10.1111/j.1463-6395.1993.tb01230.x
Tribollet A. (2008a). The boring microflora in modern coral reef ecosystems: A review of its roles. Curr. Developments Bioerosion 1974, 397–413. doi: 10.1007/978-3-540-77598-0
Tribollet A. (2008b). Dissolution of dead corals by euendolithic microorganisms across the northern great barrier reef (Australia). Microbial Ecol. 55 (4), 569–580. doi: 10.1007/s00248-007-9302-6
Tribollet A., Chauvin A., Cuet P. (2019). Carbonate dissolution by reef microbial borers: A biogeological process producing alkalinity under different pCO2 conditions. Facies 65 (2), 1–10. doi: 10.1007/s10347-018-0548-x
Tribollet A., Godinot C., Atkinson M., Langdon C. (2009). Effects of elevated pCO2 on dissolution of coral carbonates by microbial euendoliths. Global Biogeochemical Cycles 23 (3), n/a–n/a. doi: 10.1029/2008GB003286
Tribollet A., Golubic S. (2011). “Reef bioerosion: Agents and processes,” in Coral reefs: An ecosystem in transition, vol. 435–49. (Dordrecht: Springer Netherlands). doi: 10.1007/978-94-007-0114-4_25
Tribollet A., Langdon C., Golubic S., Atkinson M. (2006). Endolithic microflora are major primary producers in dead carbonate substrates of hawaiian coral reefs. J. Phycology 42 (2), 292–303. doi: 10.1111/j.1529-8817.2006.00198.x
Tribollet A., Pica D., Puce S., Radtke G., Campbell S. E., Golubic S. (2017). Euendolithic conchocelis stage (Bangiales, rhodophyta) in the skeletons of live stylasterid reef corals. Mar. Biodiversity 48 (4), 1855–1625. doi: 10.1007/s12526-017-0684-5
Vacelet E., Arnoux A., Thomassin B. (1996). Particulate material as an indicator of pearl-oyster excess in the takapoto lagoon (Tuamotu, French Polynesia). Aquaculture 144 (1–3), 133–148. doi: 10.1016/S0044-8486(96)01323-3
Verbruggen H., Tribollet A. (2011). Boring algae. Curr. Biol. 21 (21), R876–R877. doi: 10.1016/j.cub.2011.09.014
Vinayachandran P. N. M., Masumoto Y., Roberts M. J., Huggett J. A., Halo I., Chatterjee A., et al. (2021). Reviews and syntheses: Physical and biogeochemical processes associated with upwelling in the Indian ocean. Biogeosciences 18 (22), 5967–6029. doi: 10.5194/bg-18-5967-2021
Wernberg T., Smale D. A., Frolicher T. L., Smith A. J. P. (2021). Climate change increases marine heatwaves harming marine ecosystems. ScienceBrief Crit. Issues Climate Change Sci. doi: 10.5281/zenodo.5596820
Wisshak M. (2012). Microbioerosion. Developments Sedimentology 64, 213–243. doi: 10.1016/B978-0-444-53813-0.00008-3
Wisshak M., Tribollet A., Golubic S., Jakobsen J., Freiwald A. (2011). Temperate bioerosion: Ichnodiversity and biodiversity from intertidal to bathyal depths (Azores). Geobiology 9 (6), 492–520. doi: 10.1111/j.1472-4669.2011.00299.x
Wu H. C., Dissard D., Douville E., Blamart D., Bordier B., Tribollet A., et al. (2018). Surface ocean pH variations since 1689 CE and recent ocean acidification in the tropical south pacific. Nat. Commun. 9 (1), 1–13. doi: 10.1038/s41467-018-04922-1
Yang S. H., Lee S. T. M., Huang C. R., Tseng C. H., Chiang P. W., Chen C. P., et al. (2016). Prevalence of potential nitrogen-fixing, green sulfur bacteria in the skeleton of reef-building coral Isopora palifera. Limnology Oceanography 61 (3), 1078–1086. doi: 10.1002/lno.10277
Yang S. H., Tang S. L. (2019). Endolithic microbes in coral skeletons: Algae or bacteria? Symbiotic Microbiomes Coral Reefs Sponges Corals, 43–53. doi: 10.1007/978-94-024-1612-1_4
Zinke J., Hoell A., Lough J. M., Feng M., Kuret A. J., Clarke H., et al. (2015). Coral record of southeast indian ocean marine heatwaves with intensified western pacific temperature gradient. Nat. Commun. 6 (1), 8562. doi: 10.1038/ncomms9562
Keywords: coral growth, microborers abundance, euendolith traces, assemblage shift, green bands, Mayotte, machine learning, global change
Citation: Alaguarda D, Brajard J, Coulibaly G, Canesi M, Douville E, Le Cornec F, Lelabousse C and Tribollet A (2022) 54 years of microboring community history explored by machine learning in a massive coral from Mayotte (Indian Ocean). Front. Mar. Sci. 9:899398. doi: 10.3389/fmars.2022.899398
Received: 18 March 2022; Accepted: 08 November 2022;
Published: 22 December 2022.
Edited by:
Ana Santos, University of Oviedo, SpainReviewed by:
Max Wisshak, Senckenberg am Meer Wilhelmshaven, GermanyChristine Schoenberg, National Sun Yat-sen University, Taiwan
Copyright © 2022 Alaguarda, Brajard, Coulibaly, Canesi, Douville, Le Cornec, Lelabousse and Tribollet. This is an open-access article distributed under the terms of the Creative Commons Attribution License (CC BY). The use, distribution or reproduction in other forums is permitted, provided the original author(s) and the copyright owner(s) are credited and that the original publication in this journal is cited, in accordance with accepted academic practice. No use, distribution or reproduction is permitted which does not comply with these terms.
*Correspondence: D. Alaguarda, ZGllZ28uYWxhZ3VhcmRhQGxvY2Vhbi5pcHNsLmZy; A. Tribollet, YWxpbmUudHJpYm9sbGV0QGlyZC5mcg==
 D. Alaguarda
 J. Brajard2
 A. Tribollet