 Philippe-Olivier Dumais1
 Cindy Grant1
 Bodil A. Bluhm2
 Laure De Montety1Lisa Treau de Coeli1
 Jean-Éric Tremblay1
 Philippe Archambault1*
- 1ArcticNet, Québec Océan, Takuvik, Département de Biologie, Université Laval, Québec, QC, Canada
- 2Department of Arctic and Marine Biology, Universitetet i Tromsø (UiT) The Arctic University of Norway, Tromsø, Norway
In the Arctic, sea ice loss has already transformed the dominant sources and periodicity of primary production in some areas, raising concerns over climate change impacts on benthic communities. Considered to be excellent indicators of environmental changes, benthic invertebrates play important roles in nutrient cycling, sediment oxygenation and decomposition. However, this biological component of the Canadian Arctic Archipelago (CAA) is still somewhat poorly studied compared to other Arctic regions. To partly fill this need, this study aims to evaluate benthic community composition and its relationship to significant environmental drivers and to develop spatial predictive explanatory models of these communities to expand coverage between sampled stations across the Kitikmeot Sea region and Parry Channel. Results from previously collected samples suggest that biodiversity is higher in this region compared to the Beaufort and Baffin Seas, two adjacent regions to the West and East, respectively. This finding leads to the main hypothesis that (1) benthic communities are succeeding one another, forming an ecotone (transition area) between the Beaufort Sea and the Baffin Sea. Other hypotheses are that (2) Pacific Ocean water influence through the CAA can explain part of this gradient, and that (3) terrigenous inputs affect the distribution of species. Overall, results tend to confirm hypotheses. Generalized Linear Models (GLMs) (with R2 up to 0.80) clearly displayed a succession in community distribution from Queen-Maud Gulf (Southwest) to Lancaster Sound (Northeast). Such models can be useful in identifying potential biodiversity hotspots and as a baseline for marine spatial planning purposes. Further, Pacific origin water (traced with concentrations of nitrate relative to phosphate) and terrigenous inputs (traced with silicate concentrations) were related to species and community distribution. Given that these two inputs/factors are generally increasing in the Canadian Arctic, their influence on benthic communities may also be seen to increase in the upcoming years.
Introduction
Quantitatively, marine invertebrates are the most taxon rich group of the animal kingdom in the Arctic (Payer et al., 2013) and 90% of these are benthic species (Meltofte et al., 2013). Because of their high abundance, they play an important role in Arctic food webs and overall biodiversity, and are linked to higher trophic levels that feed on the seafloor (Bluhm and Gradinger, 2008; Darnis et al., 2012). Benthic species can often be used as indicators of environmental conditions and changes in an environment. Moreover, species’ distribution variability can inform of previous events/impacts in the marine environment and whether current ecological states tend to improve or decline (Borja et al., 2000; Niemi and McDonald, 2004).
Among several environmental factors shown to influence Arctic marine invertebrates in their abundance, distribution and assemblage characteristics, river inflow is of mention. In fact, the Arctic Ocean receives more than 10% of global river discharges (Opsahl et al., 1999), and river runoff contributes significantly to the freshwater budget (Carmack, 2000; Prowse et al., 2015) and has increased in the past decades (Déry et al., 2009; Holmes et al., 2012; AMAP, 2017). Freshwater inputs reduce salinity in the marine environment with negative impacts on benthic diversity (Cusson et al., 2007; Witman et al., 2008) and the benthic community structures (Pierrejean et al., 2020). River water flowing into the Arctic marine environment may also contain terrigenous components such as terrestrial organic matter, inorganic carbon, nutrients and ions such as silicate (McClelland et al., 2006). Because silicate concentrations are higher in Arctic rivers than the marine environment, this parameter can be used to trace terrigenous inputs (Ekwurzel et al., 2001). Freshwater river inputs are also associated to increases in CO2 concentrations, which decreases water pH (Cooper et al., 2008; Vallières et al., 2008). This can have an negative impact on benthos calcification abilities (Fabry et al., 2008).
The Canadian Arctic Archipelago (CAA) receives substantial volumes of Pacific Ocean origin water, which enters through Bering Strait and generally flows eastwards towards Baffin Bay (Carmack et al., 1997; Kliem and Greenberg, 2003). Compared to Atlantic Ocean water, Pacific Ocean water has a lower density because it is of lower salinity (more freshwater). The effects of a lower density in Pacific Water is that it migrates to the upper ocean layer while Atlantic Water is below (Granger et al., 2018). Pacific Ocean influence is so strong in the CAA that even in areas far from the inflow like Lancaster Sound (at the entry of Baffin Bay), most of the surface water is of Pacific origin (Jones et al., 2003). Because of its location at the entry of Baffin Bay, this area is, however, the most influenced by the Atlantic Ocean (McLaughlin et al., 2006). In addition to its low salinity, Pacific Water that enters the Canadian Arctic is nitrate depleted, resulting in lower nitrate:phosphate ratios than Atlantic Ocean water (Yamamoto-Kawai et al., 2006; McLaughlin et al., 2009). Because of climate-related increases in sea surface temperatures and closely related decrease in ice cover, Pacific water inputs are currently increasing in the Arctic through Bering Strait (Shimada et al., 2006; Woodgate et al., 2010) and are projected to substantially increase in the upcoming years (Woodgate, 2018). Furthermore, the Canadian Arctic is quite shallow in many of the areas of interest, e.g. Queen-Maud Gulf (QMG) is no deeper than 75 meters (Carmack and McLaughlin, 2011).
There is a particularily large knowledge gap for benthic biodiversity in the Canadian Arctic and especially the Kitikmeot Sea region (Wassmann et al., 2004; Archambault et al., 2010; Piepenburg et al., 2011; Roy et al., 2015a). In general, the number of species found increases with the number of sampled stations (Jones et al., 2007; Bluhm et al., 2011; Piepenburg et al., 2011; Roy et al., 2014) but this can be difficult when describing such a large region. To efficiently fill spatial gaps, species/community distributions must be predicted. One way of predicting distributions is through species distribution modelling (SDM), based on identified relevant environmental drivers (Moritz et al., 2013). Since some of these drivers (e.g. temperature, salinity, ice cover) can be observed by satellite imagery, it is possible to model community assemblages on large spatial scales and for difficult to access locations. SDM is widely used in ecology and can somewhat compensate the lack of data in a changing environment (Brown et al., 2016; Brodie et al., 2020). Since regional ( ≥1 km2) community variability is mostly influenced by environmental gradients (Levin et al., 2001), understanding how abiotic drivers influence species distributions may be useful for filling spatial gaps of biodiversity hotspots and valuable habitats (McArthur et al., 2010; McHenry et al., 2017; Saeedi et al., 2017; Pierrejean et al., 2020). Results from these SDMs can be used for conservation purposes and hopefully contribute to efforts in reducing biodiversity loss.
Few research projects have been conducted on the subtidal benthic communities of the Kitikmeot Region and Parry Channel, CAA, but some information is available. Foremost, Roy et al. (2015a) and Balsom et al. (2003) found that epifauna collected in the southwestern portion of the Archipelago (essentially matching the Kitikmeot Region) have a higher Shannon-Wiener diversity index compared to neighboring areas. Another study [Roy et al. (2015a)] shows that benthic biomass is higher in the deeper Eastern Archipelago, from Barrow strait to Lancaster Sound in the Parry Channel segment, than in the shallower Kitikmeot Western Archipelago study area.
The main objective of this study is to increase knowledge of the macrobenthic infauna and epifauna composition and predict their distribution across much of the Kitikmeot sea region and Parry Channel. Specifically, we first evaluated benthic composition and its relationship to relevant environmental factors. Second, we created models to predict spatially different benthic communities across the studied area. The prediction tested is that benthic fauna spatial distribution and benthic communities are succeeding one another in the CAA, forming a transitional area (ecotone) between Baffin Bay and Beaufort Sea, where diversity is higher. The second prediction is that the decreasing Pacific Ocean water influence through the CAA can explain part of this succession. The third prediction is that terrigenous inputs transported into the region by numerous rivers also play an important role in the Kitikmeot Region’s benthic community composition.
Methods
Study Area
The study area can be divided into two main parts. The first, Parry Channel, is situated in the middle of the CAA and the considered portion extends from Lancaster Sound to Viscount Melville Sound (Figure 1). The second is the Kitikmeot marine region, located in the Northern part of Nunavut and in the southern part of the CAA. Compared to Kitikmeot, Parry Channel is quite deep, extending from 500 m to 700 m, except around Barrow Strait which is closer to 200 m to 400 m in depth. The Kitikmeot region includes the Queen-Maud Gulf southward, M’Clintock Channel and Peel Sound northward, Coronation Gulf to the west and Chantry Inlet to the east. Our area of interest for this study is especially Queen-Maud Gulf (where most of our samples were taken), which is 20-75 meters deep, but also Victoria Strait and M’Clintock Channel. Queen-Maud Gulf is connected to Coronation Gulf by the shallow Dease Strait (~40 meters deep) (Carmack and McLaughlin, 2011) and many rivers are discharging into it. Queen-Maud Gulf receives inflows from the Simpson, Perry and Pitok rivers and a few others (Brown et al., 2020).
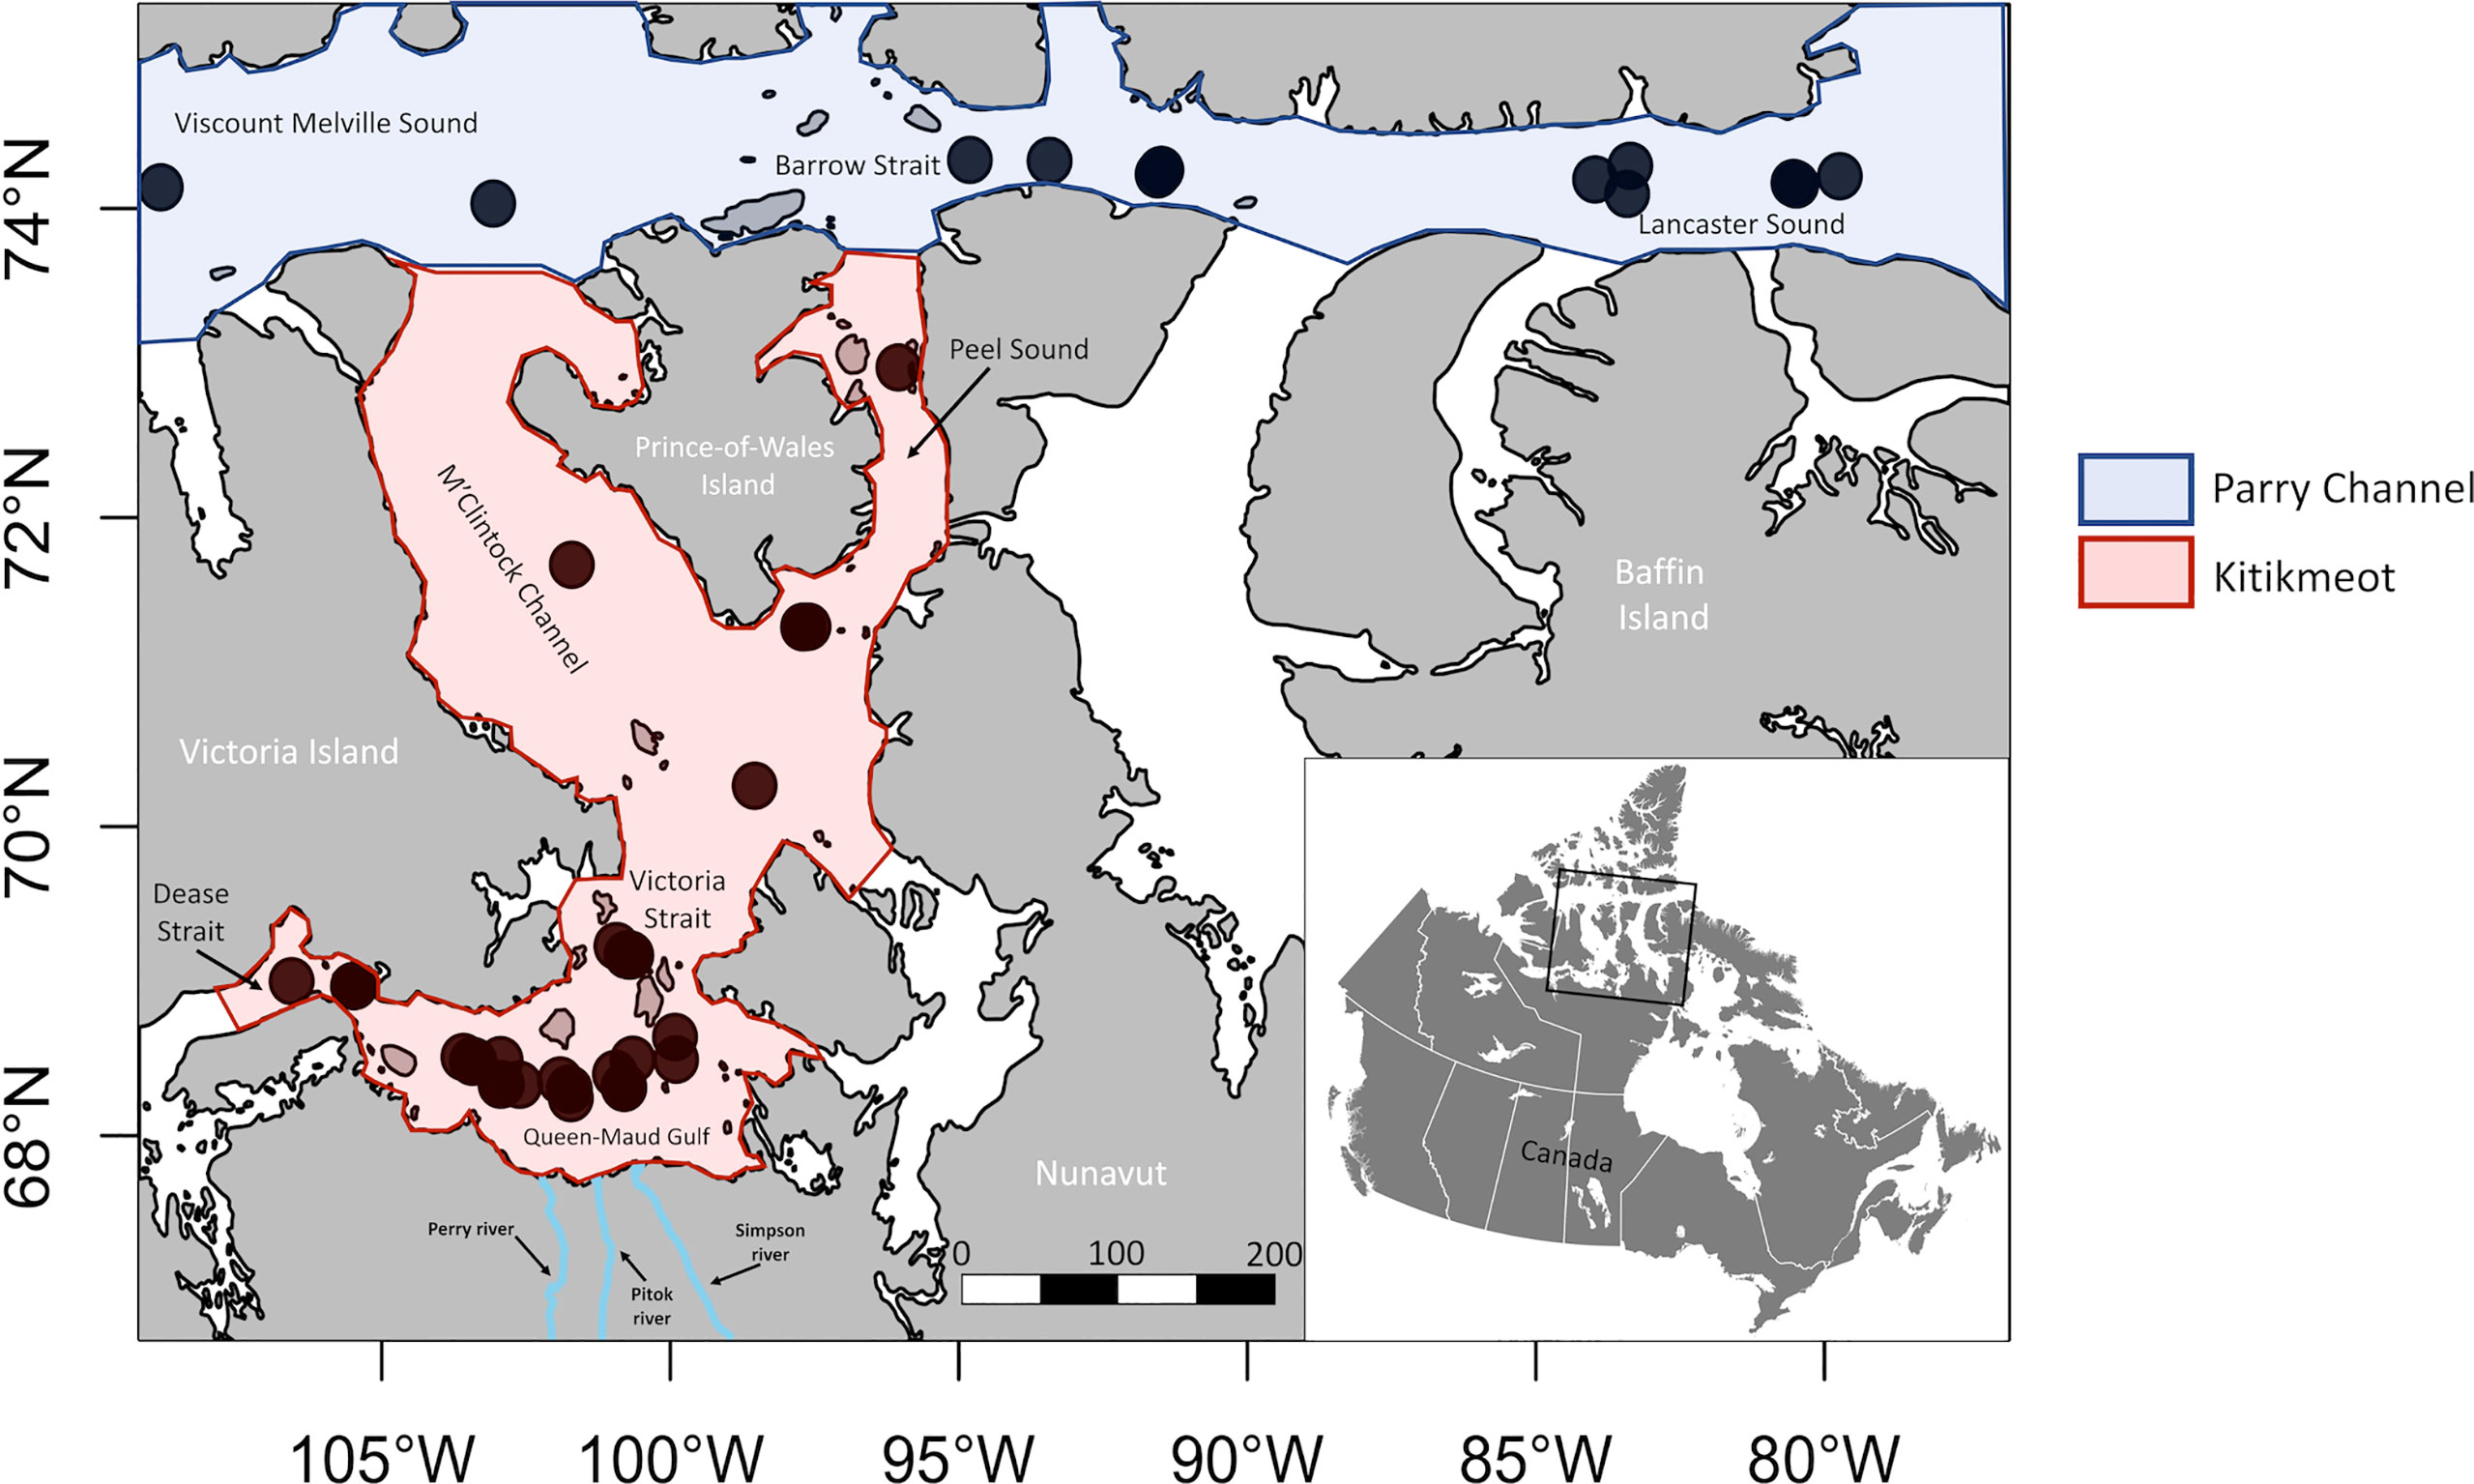
Figure 1 Locations of epifauna, infauna and environmental variable sampling stations from Parry Channel and the Kitikmeot sea region. Note that the Kitikmeot Region also contains areas west (Coronation Gulf) and east (Chantry Inlet) of the marked area, but those were not studied.
In total, 55 different locations were sampled across this area (Figure 1). Generally, infauna and epifauna were both sampled at the same location but a few stations have either only infauna or epifauna. For each station, benthic organisms and environmental data (detailed in section 2.3) were sampled/measured.
Sampling Procedures
Throughout this work, infauna and epifauna samples are treated separately. Samples were collected between August and September, from 2009 to 2018, onboard the Canadian research ice breaker CCGS Amundsen (ArcticNet, 2009; ArcticNet, 2010; ArcticNet, 2011; ArcticNet, 2013; ArcticNet, 2014; ArcticNet, 2015; ArcticNet, 2017; ArcticNet, 2020). Moreover, this study focuses only on subtidal macrobenthic (> 500μm) invertebrate communities living deeper than 30 meters.
Infauna was sampled with a Reineck box corer (50 cm x 50 cm), where sediments from half of the box surface (25 cm x 50 cm) and contained within the upper 10 cm were considered. Sediments were sieved on a 0.5 cm mesh size to sample organisms greater size than 0.5 x 0.5 cm. These sieved sediments containing organisms were preserved in a seawater and formaldehyde solution (4%), buffered with sodium tetraethylborate.
Epifauna was sampled using a single haul of an Agassiz trawl per station, the unit measuring 1.5 m in width, with a 1.5 cm net mesh size and 5 mm cod end. After having reached the sea bottom, the trawl was dragged for 3 minutes at an approximate forward speed of 1.5 knots. Since this trawl method is semi-quantitative (Eleftheriou and McIntyre, 2005), taxa count may contain minor biases. Trawl contents were thereafter sieved on a 2 mm mesh size and then sorted to taxon. In samples where trawl content was considerably higher than average, the contents were subsampled if the estimated sorting time was considered excessive. The subsampled fraction depended on the size of the catch and was noted to adjust abundance and biomass measures. Larger specimens were identified, counted and weighted on the ship and the others preserved as for the infauna.
Preserved infauna and epifauna samples were washed of the formaldehyde solution before sorting. After, infauna samples were sieved on a 500 μm sieve while epifauna samples were sieved on a 2 mm sieve in the lab. Washed and sieved organisms were then sorted under a dissecting microscope. Specimens were identified and counted to the lowest possible taxonomic level based on morphological criteria. Experienced taxonomists validated the identifications of less common specimens. However, nematodes were kept at phylum level, and foraminifera were not considered. Afterwards, specimen biomass was measured on a ± 0.0001g precision scale. Taxonomic identification names were verified on the World Register of Marine Species (WORMS) database.
A total of 19 environmental parameters were used in the analyses (Table 1). Bottom-water temperature, salinity and oxygen were obtained with a Seabird Scientific CTD profiler (SBE911 Plus). Water for nutrient analysis was taken simultaneously with a Niskin bottle attached to the Rosette sampler and filtered through GF/F filters. The concentrations of nitrite , nitrate+nitrite , phosphate and silicate (Si(OH)4) were determined on board with a Bran+Luebbe autoanalyzer 3, following the methods of Grasshoff (2009). Analytical detection limits for these were 0.02, 0.03, 0.03 and 0.05 μM, respectively. Nitrate concentrations were obtained by difference of “nitrate+nitrite” – “nitrite”. Silicate concentrations was used to trace terrigenous inputs. The N/P ratio used to trace back Pacific origin water that is nitrate depleted (Yamamoto-Kawai et al., 2006; Tremblay et al., 2015) is the ratio of nitrate concentration to phosphate concentration. As samples were collected during the summer and since nitrate concentrations are often very low or null after the spring bloom, the N* index was also used in parallel. The latter was calculated based on Gruber and Sarmiento (1997) and Deutsch et al. (2001) as:
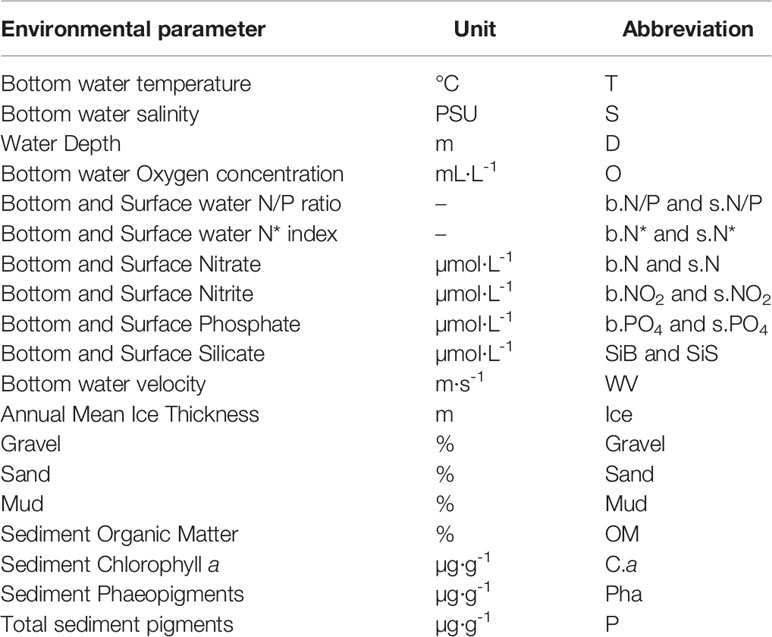
Table 1 Environmental parameters considered for the statistical analysis.
where [DIN] is the sum of nitrite and nitrate concentrations.
The bottom water current velocity was obtained using the updated version of Ocean-Navigator (Hernandez, 2007) and annual mean sea ice thickness was extracted from Bio-Oracle and estimated from 2000 to 2016 (Tyberghein et al., 2012; Assis et al., 2018). For the last 7 parameters in Table 1, the box core-collected sediments were analyzed in the laboratory. The grain size proportions were determined by laser diffraction (Horiba LA-960 particle size analyzer), and grain dimensions classified using the Gradistat classification (Blott and Pye, 2001). We burned the sediment at 450°C to obtain the dry mass proportion of organic content (Byers et al., 1978). Pigment concentrations in sediments were obtained using acetone extraction followed by fluorometric analysis (Riaux-Gobin and Klein, 1993).
Statistical Analysis
Statistical analyses presented below were performed separately on infaunal and epifaunal data, using R Software, version 3.6. (R Core Team, 2020). Except for functions from the base package, most of the statistical functions used are from the Vegan package (Oksanen et al., 2018).
A cluster tree analysis based on a Bray-Curtis dissimilarity matrix was performed on biomass data which was initially transformed using the Hellinger method (Legendre and Gallagher, 2001). Afterwards, the most representative species in each community were identified using the indicator value index (IndVal) (Dufrêne and Legendre, 1997). Values of IndVal range between from 0 to 100%. A value of 100% for a particular species would indicate that it is encountered exclusively in a given group and at every station.
Subsequently, a redundancy analysis (RDA) was done to determine which environmental parameters are related to the differences between communities. Again, Hellinger transformed faunal biomass data was used and environmental data was transformed with the standardize method of the vegan package (Oksanen et al., 2018). Such transformations are used to reduce the effect of outlier values in analyses. In the first iteration, a best fit selection of variables was performed to obtain an RDA with the highest adjusted-R2. Then, to answer the second and third hypotheses, selection of environmental variables that are significantly related to the biomass was performed via a two-step process with forward selection. The alpha value was set at 0.05. Only significantly influential variables were used to build a graphical representation (i.e. x-y graph), where the distance between each community represents the Euclidian distance and each influential driver is represented by an arrow, for which communities are influenced and positioned in relation to each other by these drivers. The length of the arrow is related to the strength of influence. The p-value of the model was obtained with a permutation test for RDA under a reduced model and 9999 permutations.
Generalized linear models (GLMs) were used to predict spatial community likelihood of occurrence (on a scale from 0 to 1). The family type of the GLMs in this case is binomial because the presence of communities was expressed by either 1 (presence) or 0 (absence). To obtain the highest R2 possible, we used a best fit approach, where every combination of environmental variables possible was tested in a GLM. The combination with the highest R2 and lowest Bayesian Information Criterion (BIC) was selected. The McFadden pseudo-R2 (McFadden, 1973) was used along with the GLMs statistics. Using GIS rasters of chosen environmental data and the GLM, we predicted the probability of occurrence of the community for every cell in the study area. Rasters for every parameter used were extracted from Bio-Oracle (Assis et al., 2018), for which resolution is 0.083° of latitude by 0.083° of longitude, and cells are approximately 3 km of longitude by 9.3 km of latitude in our study area, hence every cell has an area of 27.9 km2. It is important to note that some areas were blanked due to the lack of data, which was useful in preventing false identification of unexplored benthic regions. Because sediment content of pigments (phaeopigments and chlorophyll a) is not available on Bio-Oracle as raster, this variable was replaced by bottom water chlorophyll concentration (mg·m-3) for the GLMs only. Upon analysis, field data was found to be quite similar to GIS data. In the stations that differed, slightly different values could be observed at times, and some outliers were also observed but mean values were very similar. Nevertheless we used extracted environmental data from the rasters to perform GLMs. Due to the unavailability of Bio-Oracle data relating to sediment types (sand, mud and gravel), these were not considered in the process of modelling communities.
Taxonomic richness was the chosen unit to measure diversity (Supplemental 5, 6, 7 and 8). We applied the same method as for the community models except using the Poisson family type of GLMs because the number of taxa is discrete, and predictor environmental variables are continuous.
Epifauna community distribution models were partly validated using seafloor images from Lancaster Sound by Bouchard Marmen et al. (2017). This was done to validate if indicator species of the communities were in fact present or not at a predicted location. These images are from a North-South transect photographed in Lancaster Sound around 83° W of longitude with a Digital Benthic Camera, but acquired in different sites than the ones in this study. The photos cover an average of 0.692 m2 (0.675 m x 1.025 m).
Results
Infauna
A total of 40 stations were sampled and 407 taxa were identified in the infauna. The most dominant taxon was Annelida (38%), followed by Arthropoda (25%). Most of the Annelida found were polychaetes (99,8%) and Arthropoda were mainly composed of Amphipoda (42%) and Cumacea (27%). Based on the Bray-Curtis dissimilarity, stations clearly clustered into 4 spatially contiguous station groups (Figure 2 , Figure 3). Which are used in all subsequent species assemblage related analyses.
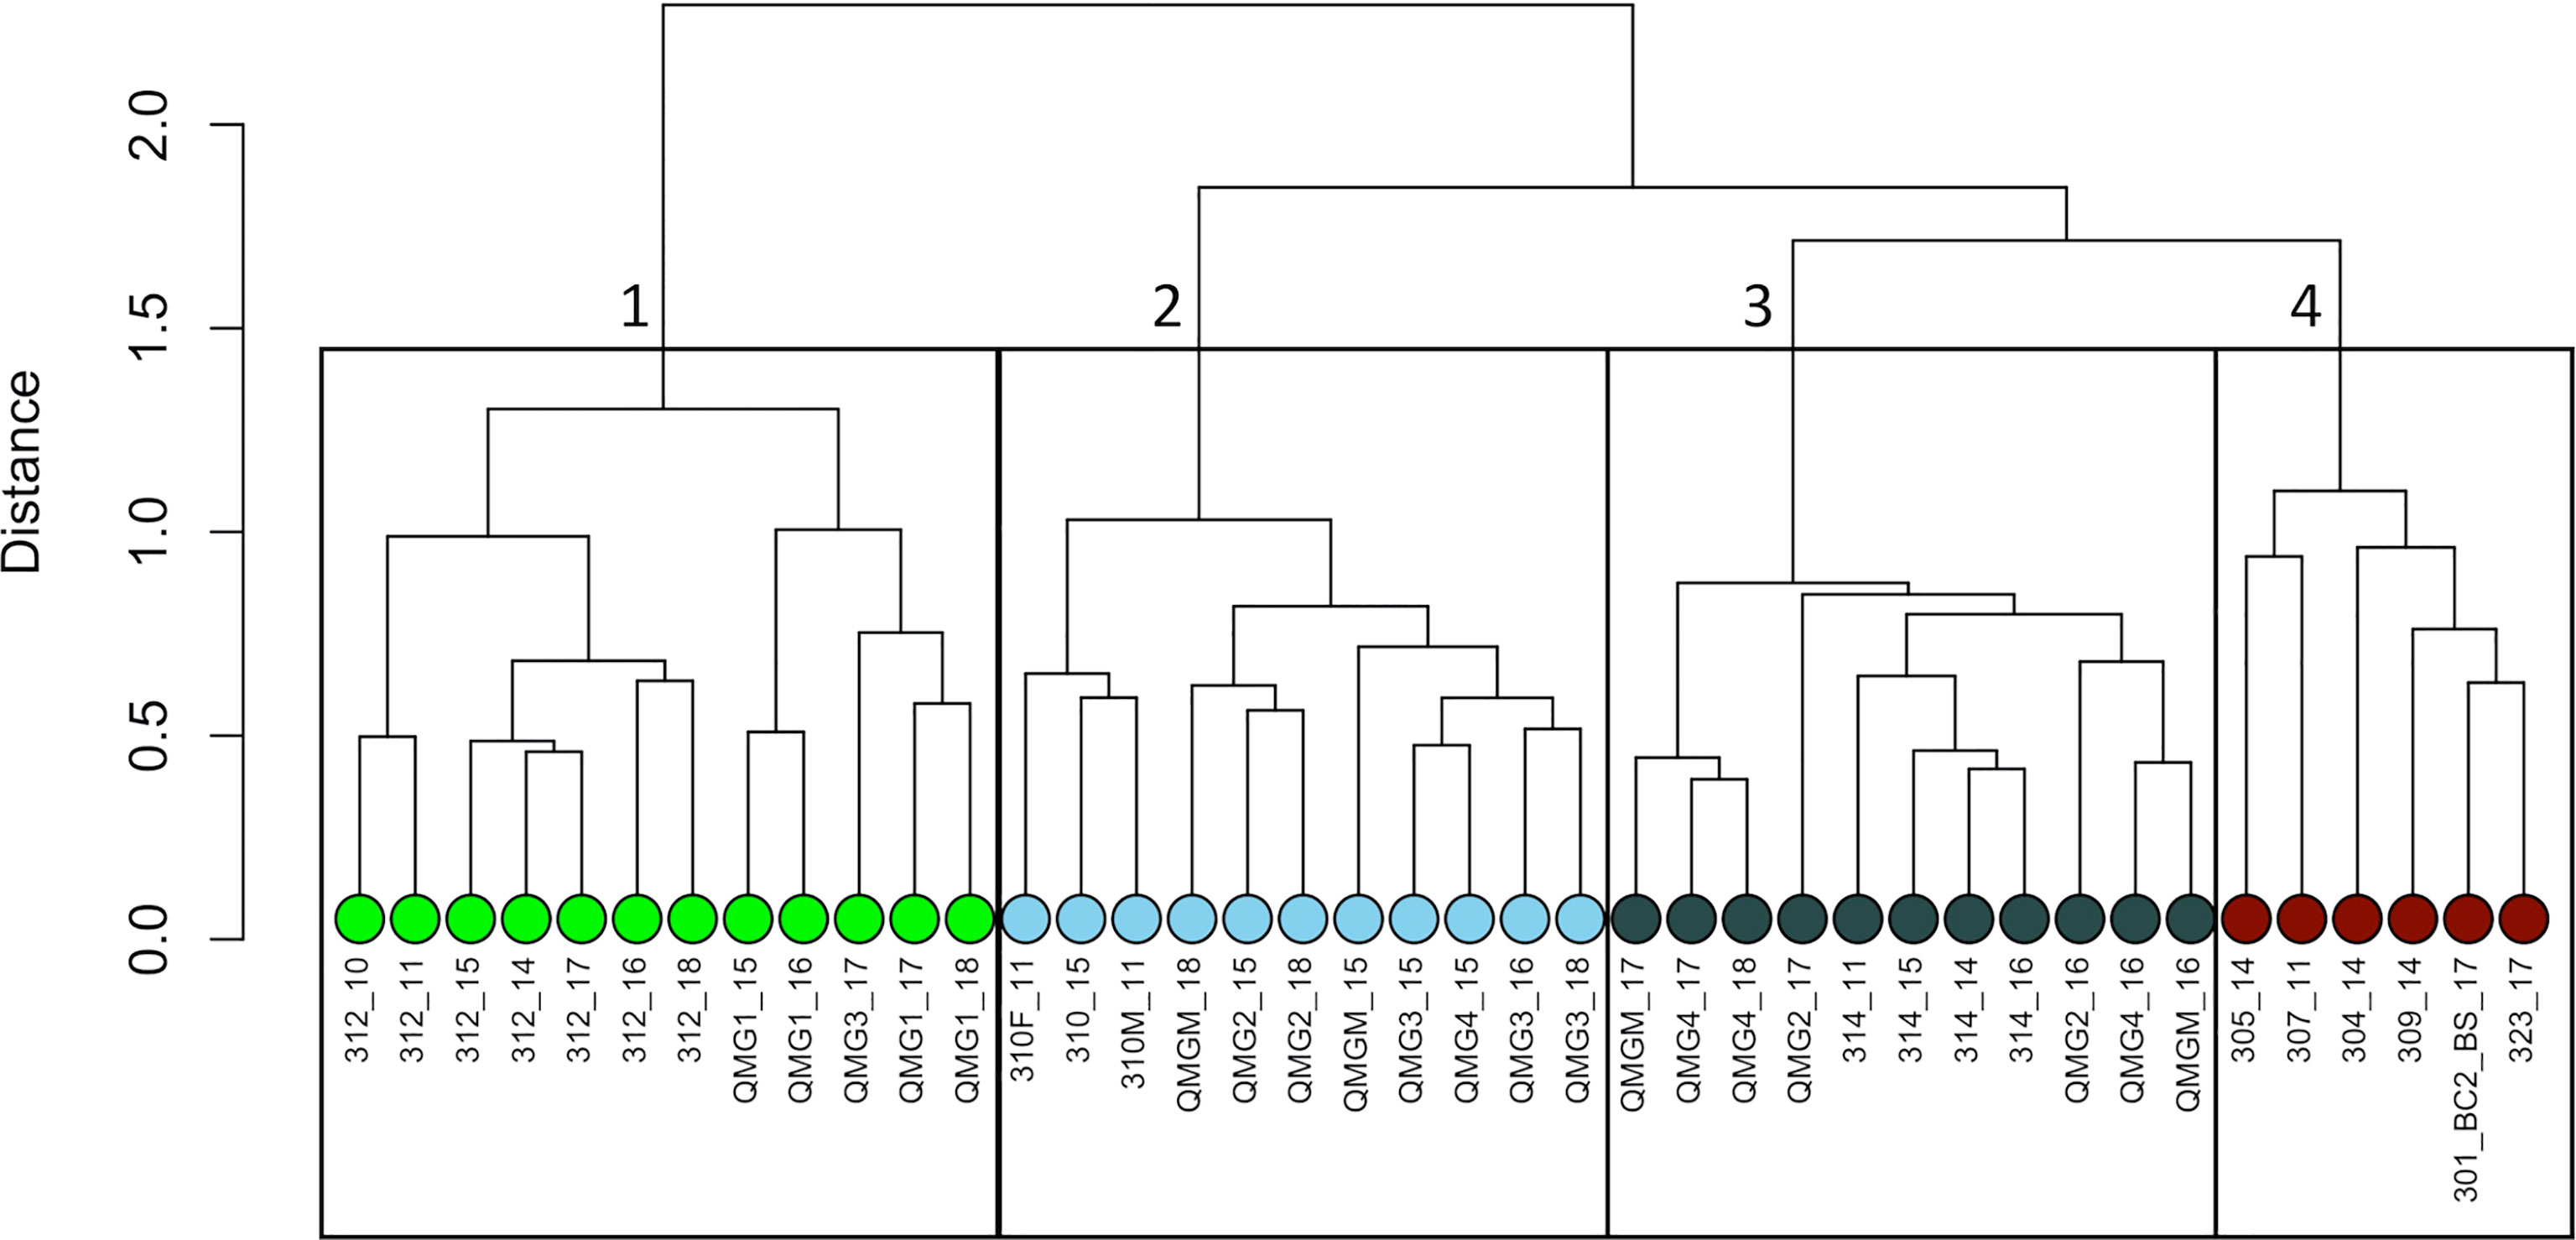
Figure 2 Infauna cluster tree (Bray-Curtis Distance) based on Bray-Curtis dissimilarity matrix with transformed species biomass data. Green dots are the stations from the first community, pale blue dots are community 2, dark gray dots are community 3 and red dots are community 4.
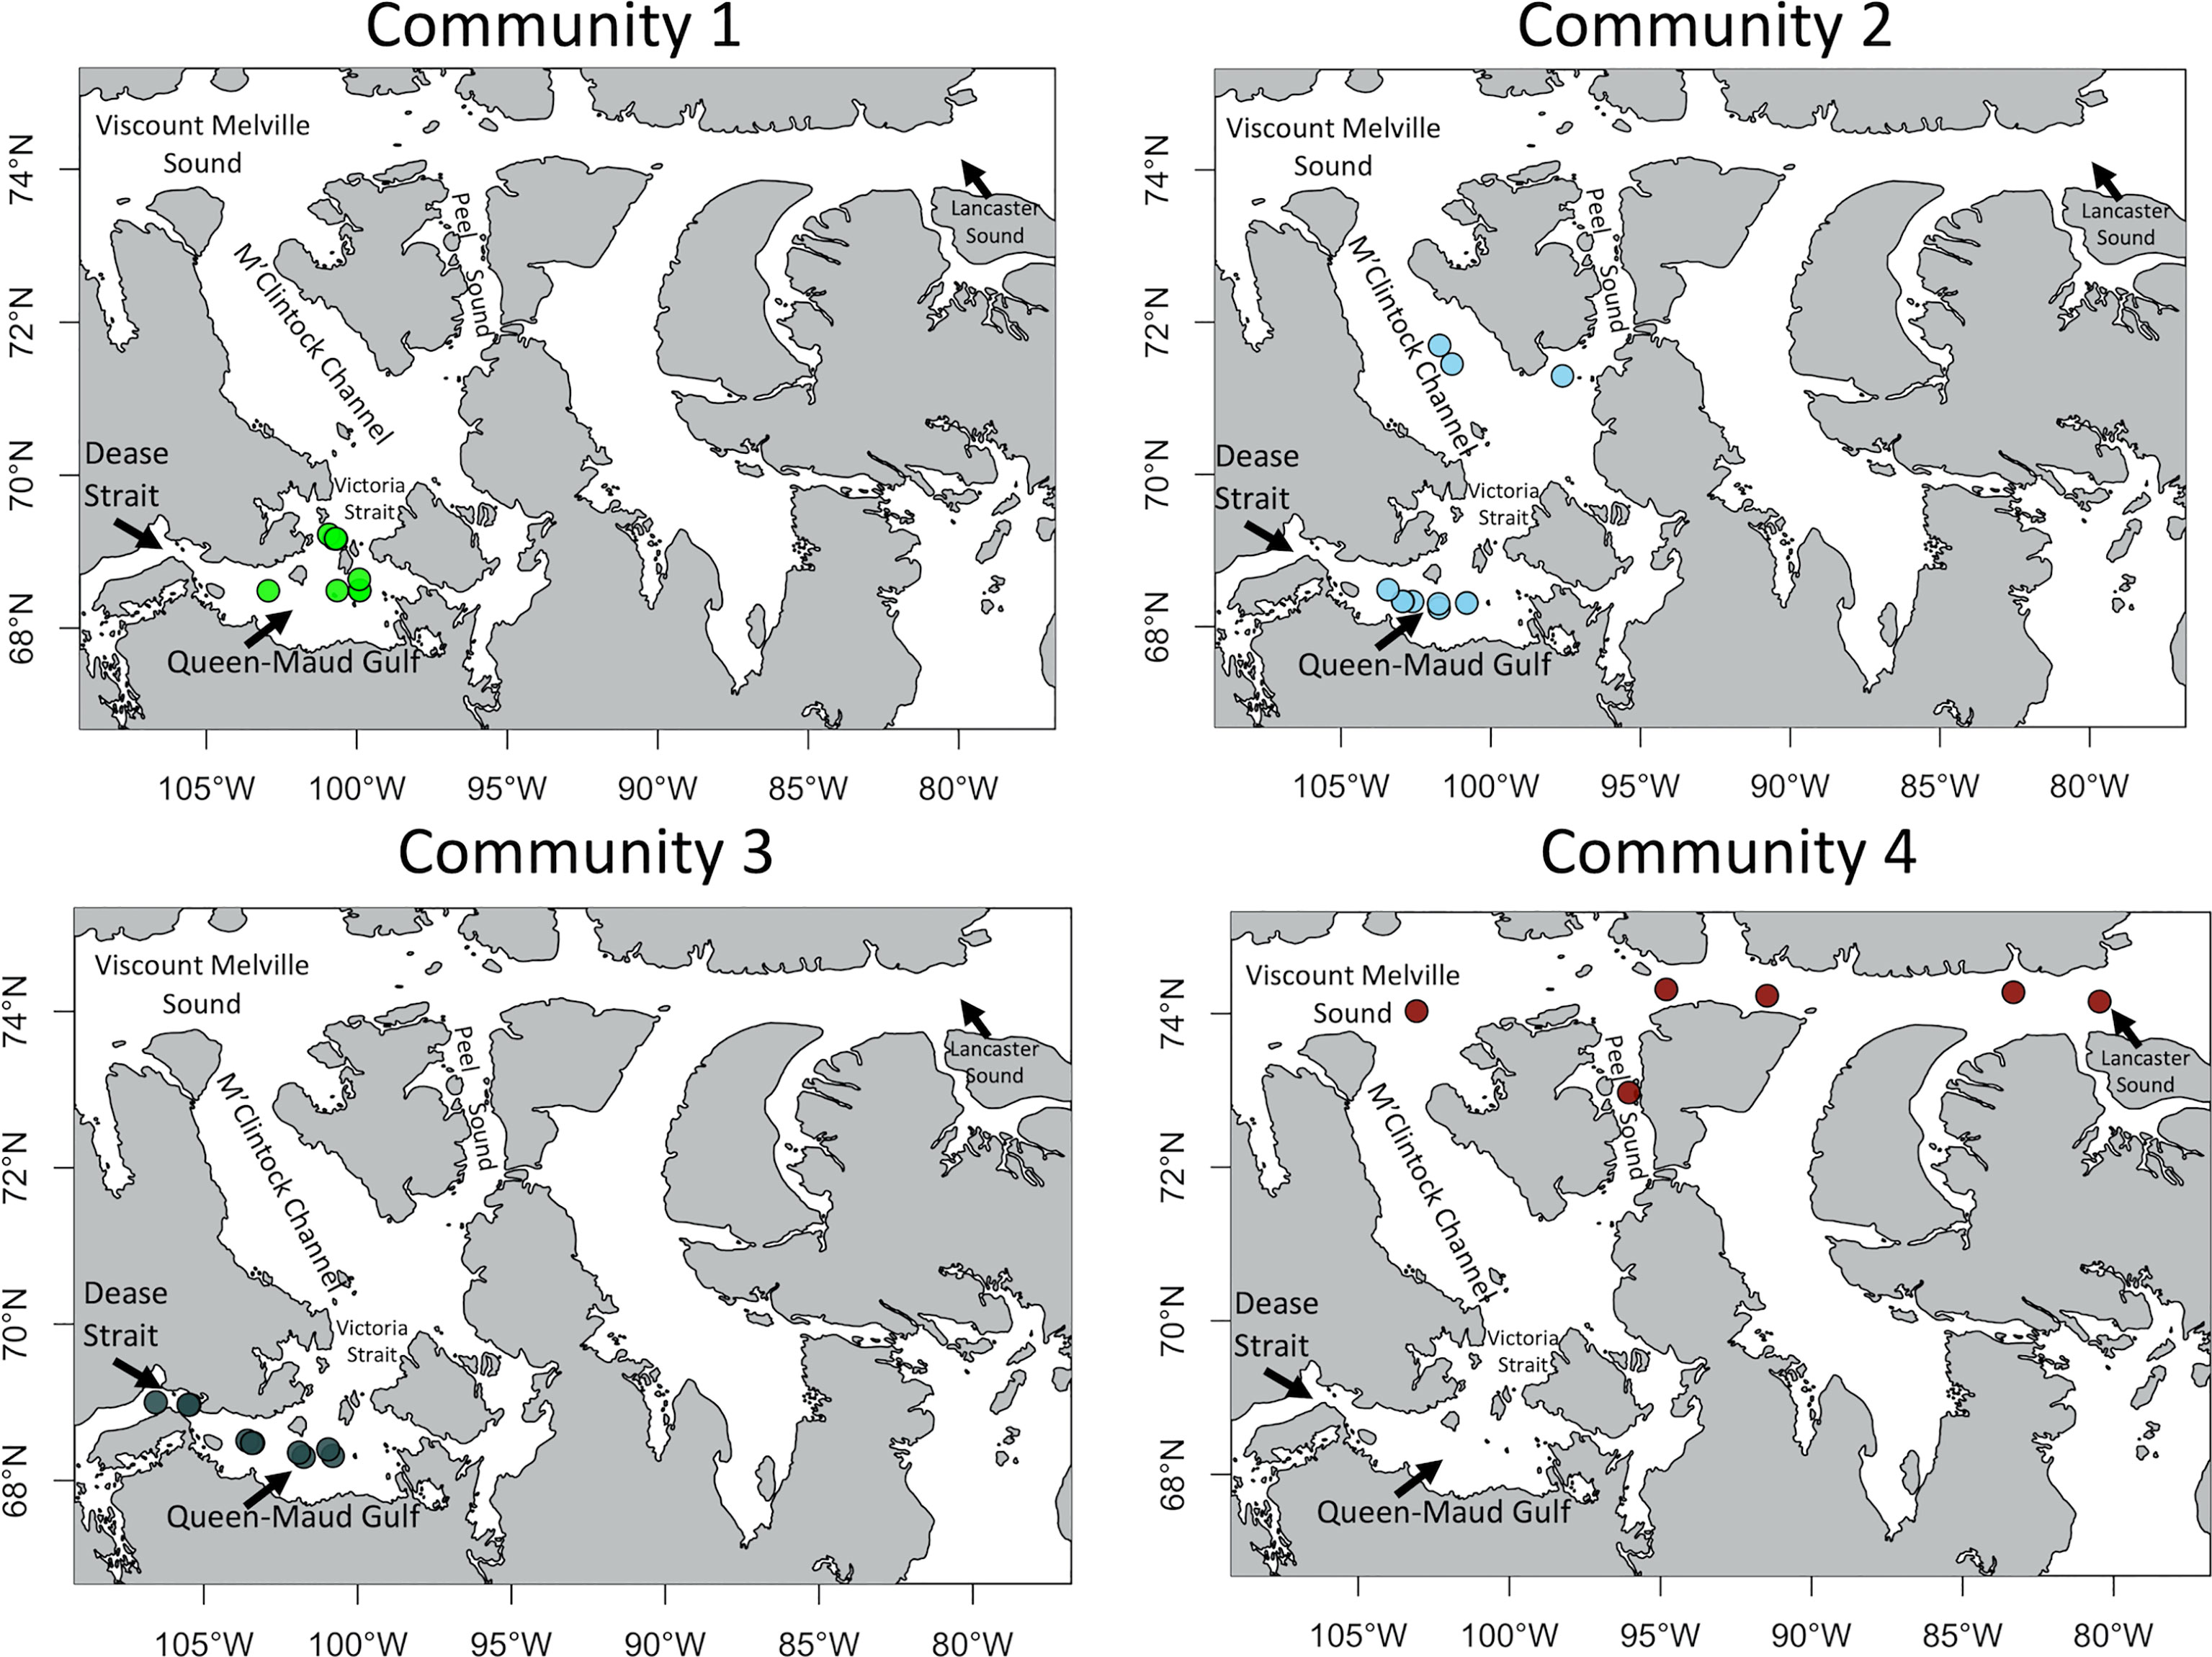
Figure 3 Location of the 4 infaunal communities across the Kitikmeot Sea region and Parry Channel. Colors represent the communities assigned in Figure 2.
The first community of the cluster analysis (Figure 2) is composed of the shallowest stations, located around Victoria Strait and in the northern portion of Queen-Maud Gulf. They also display the lowest salinity values and the highest sediment chlorophyll a concentration (Figure 4). The second community encompasses some northern stations of Kitikmeot, in the M’Clintock Channel and at the entry of Peel Sound in Franklin Strait. According to the RDA, this is the community with the highest bottom N/P ratio and bottom nitrate concentration (Figure 4). Moreover, two locations within this community show the lowest concentrations of chlorophyll a in the sediment and mean sediment organic matter content between all communities. This second community also has some stations which are overlapping with some of the third community, although the average depth (100 meters) a little deeper than for the third community (85 meters). The main indicator species in this second community is the bivalve Astarte crenata/montagui (Table 2).
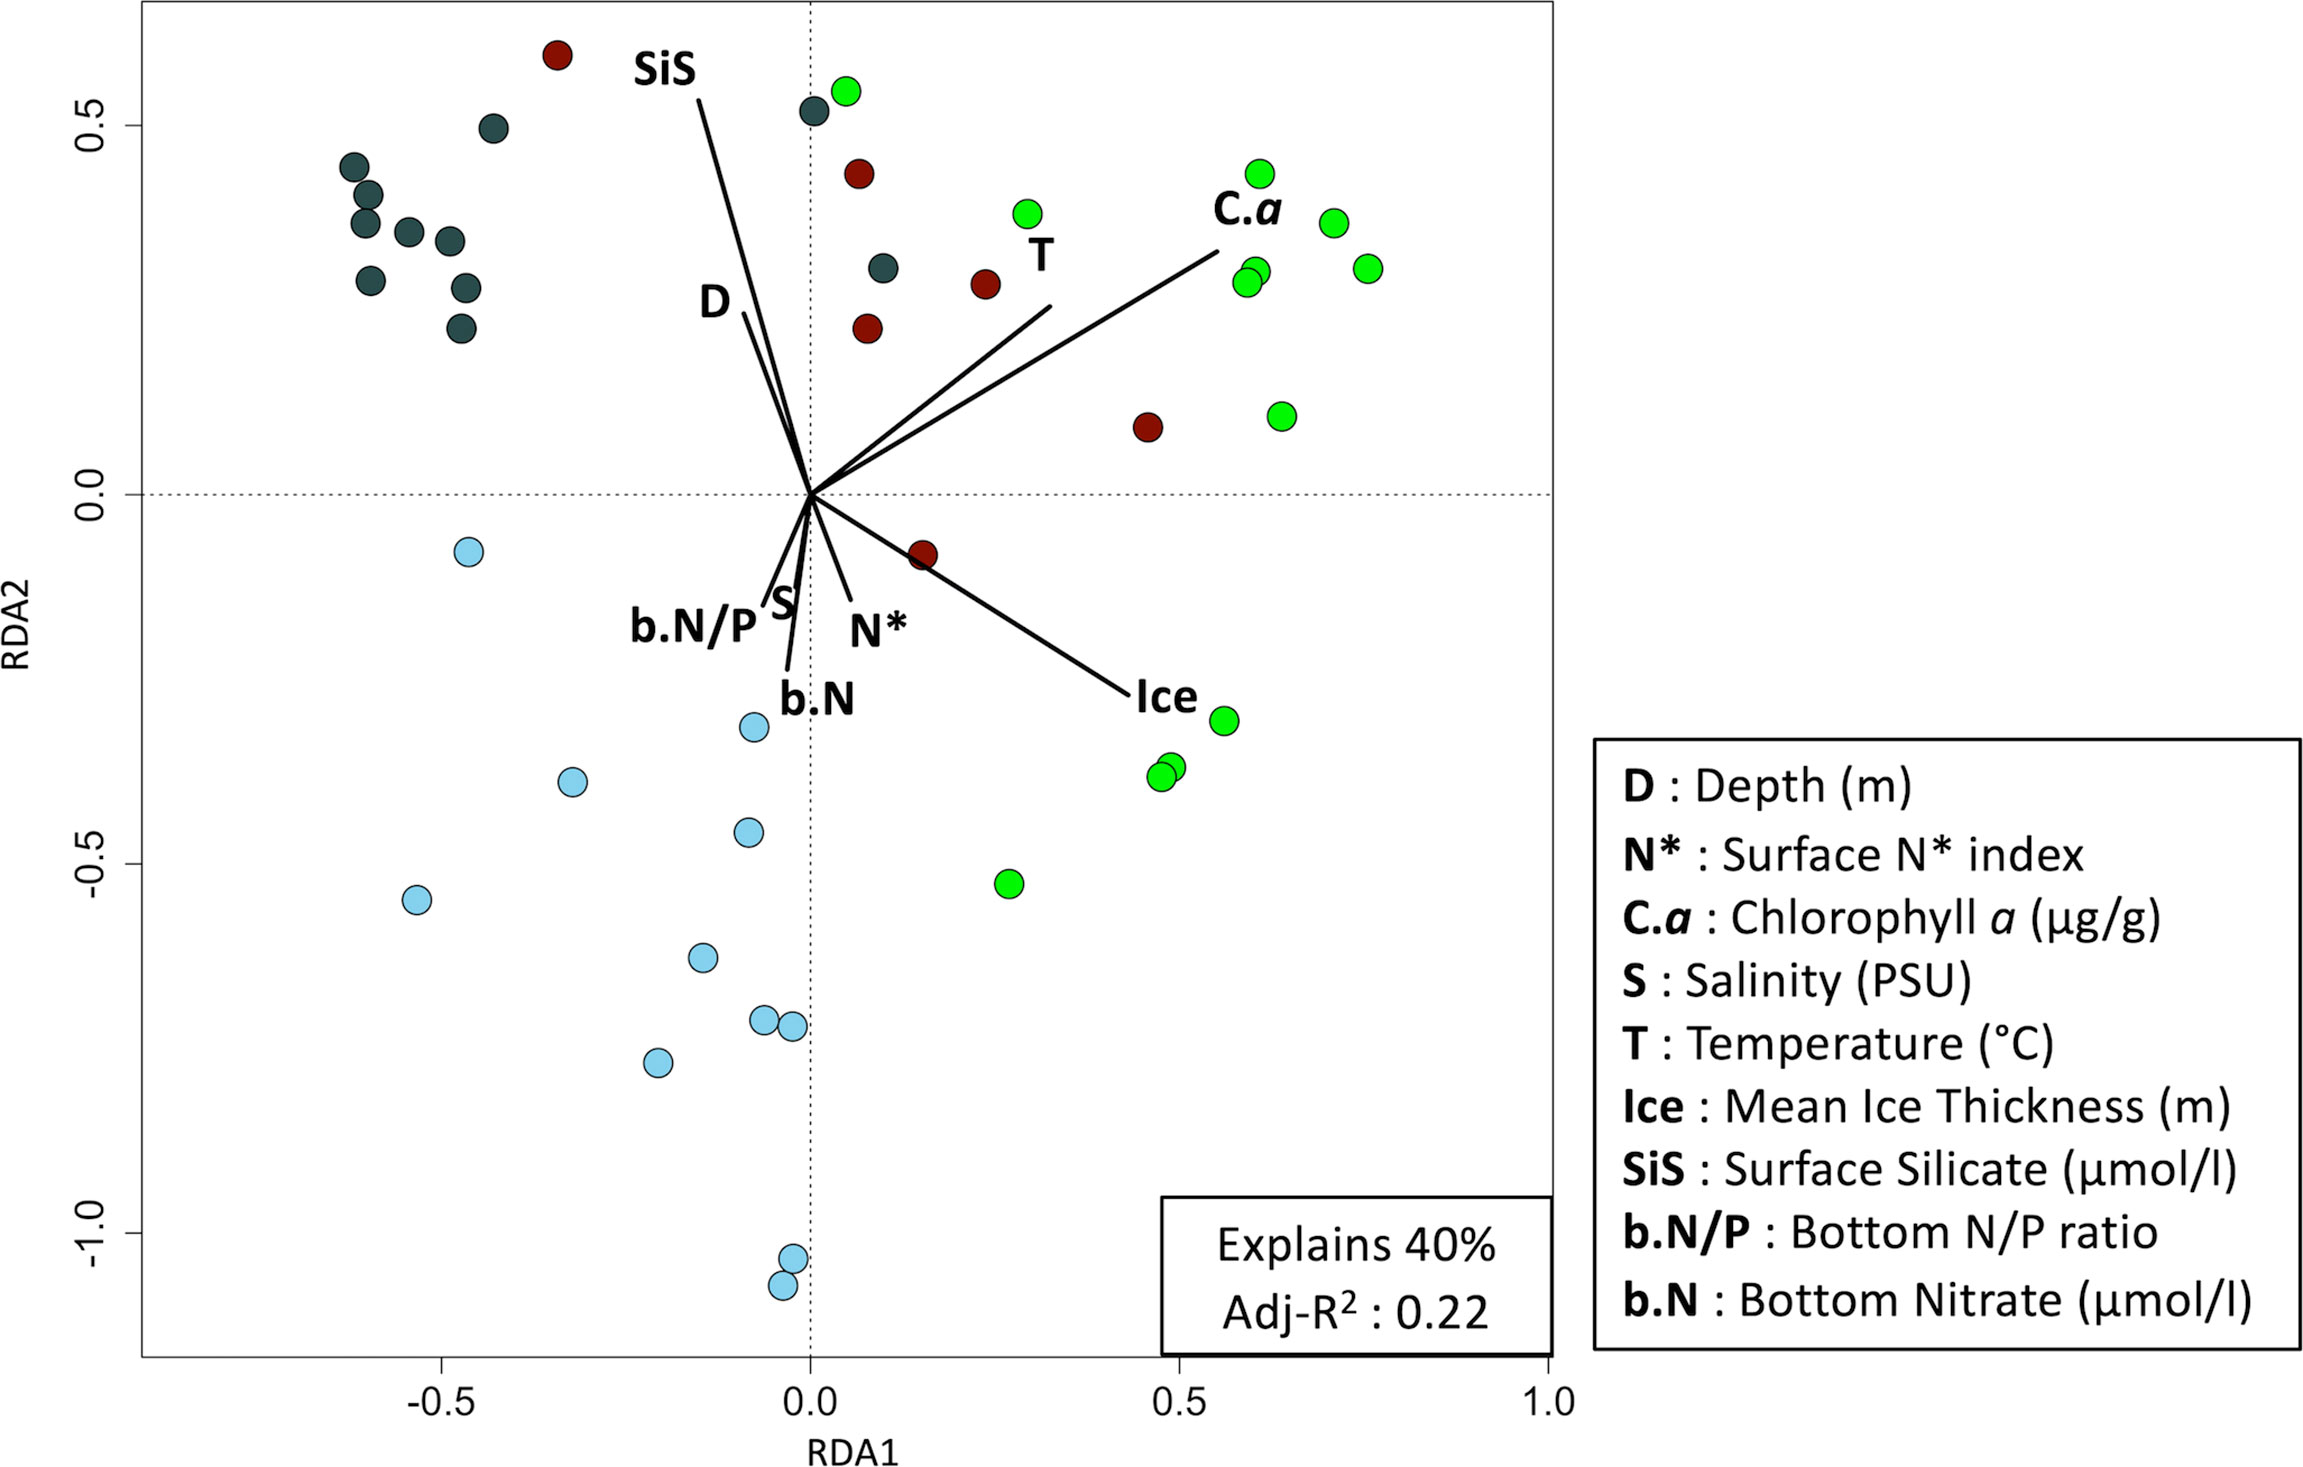
Figure 4 Redundancy analysis plot of the biomass Hellinger transformed 40 infaunal stations sampled between 2010 and 2018 (p-value = 0.0001). Significant environmental variables were obtained using a two-step forward selection. Colors represent the community determined with a Bray-Curtis distance-based cluster analysis. Green dots are the stations from the first community, pale blues are community 2, dark grays are community 3 and reds are community 4.
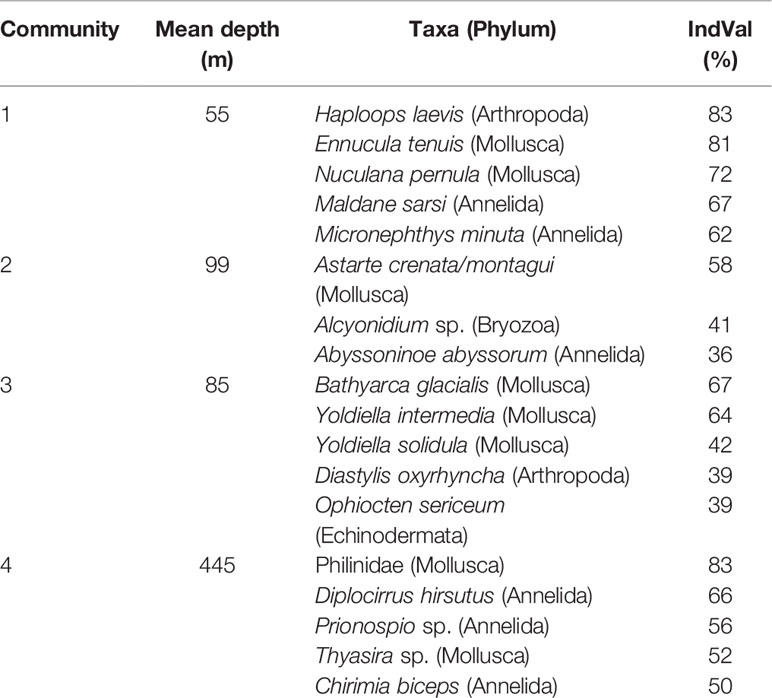
Table 2 Indicator species (5 most important species are presented) of each benthic infaunal community in the Kitikmeot sea region and Parry Channel based on the IndVal Index.
The third community has some stations in Queen-Maud Gulf. This community is different from the second by, 1) the absence of stations in the Northern Kitikmeot, 2) the presence of stations in Dease Strait (Figure 3), and 3) the lowest mean surface N* value, according to the RDA (Figure 4). Indicator species are represented by bivalvles in 3 out of 5 total species and are characterized by very low mobility. Along with the brittle star Ophiocten sericeum (IndVal of 39%), 4 of the 5 indicator taxa are calcified organisms. The genus Yoldiella is strongly representative of the community with the two species, Y. intermedia and Y. solidula, as main indicators. The fourth community is composed of stations located almost exclusively within the Parry Channel region, and is the closest of four to the Atlantic Ocean and also furthest from the Pacific Ocean (Figure 3). Stations here are characterized by the lowest ocean depth measurements as well as highest mean bottom water temperatures (Supplemental 2). As observed on the RDA (Figure 4), these stations share some similarities with the first and third communities. The taxon that best distinguishes this community is the gastropod family Philinidae (Indval of 83%) (Table 2).
In a best-fit RDA with the selected environmental variables, 19 parameters (D, s.N*, P, b.N/P, S, WV, SiS, Sand, T, Pha, s.PO4, Mud, SiB, Gravel, s.N/P, b.N, b.N*, Ice and C.a) explained 63% of the variation among stations (adj-R2 = 0.28) (Supplemental 1). Nine of these were statistically significant and explained 40% of the variation among stations (adj-R2 = 0.22) (Figure 4). Sediment chlorophyll a concentration, annual mean ice thickness and surface silicate had the strongest influence on the species composition. Additionnally, an interesting observation among studied regions was that annual mean ice thickness and surface silicate were inversely correlated. Chlorophyll a concentration is also inversely correlated with depth and salinity. However, depth and salinity generally tend to be vary proportionally (Figure 4).
The main observation from the infauna GLMs models is the succession of habitat suitability between the communities (Figure 5). Starting from the Southwest, habitat suitability in Dease Strait and towards Coronation Gulf was highest for the third community. Environmental conditions also appeared favorable for this same community in the middle of Queen-Maud Gulf and in Northern Peel Sound, albeit the species’ group characteristic of this community were not found within these two locations. This could mean that more sampling may have revealed this community or perhaps a similar one, given that the environmental conditions were favorable.
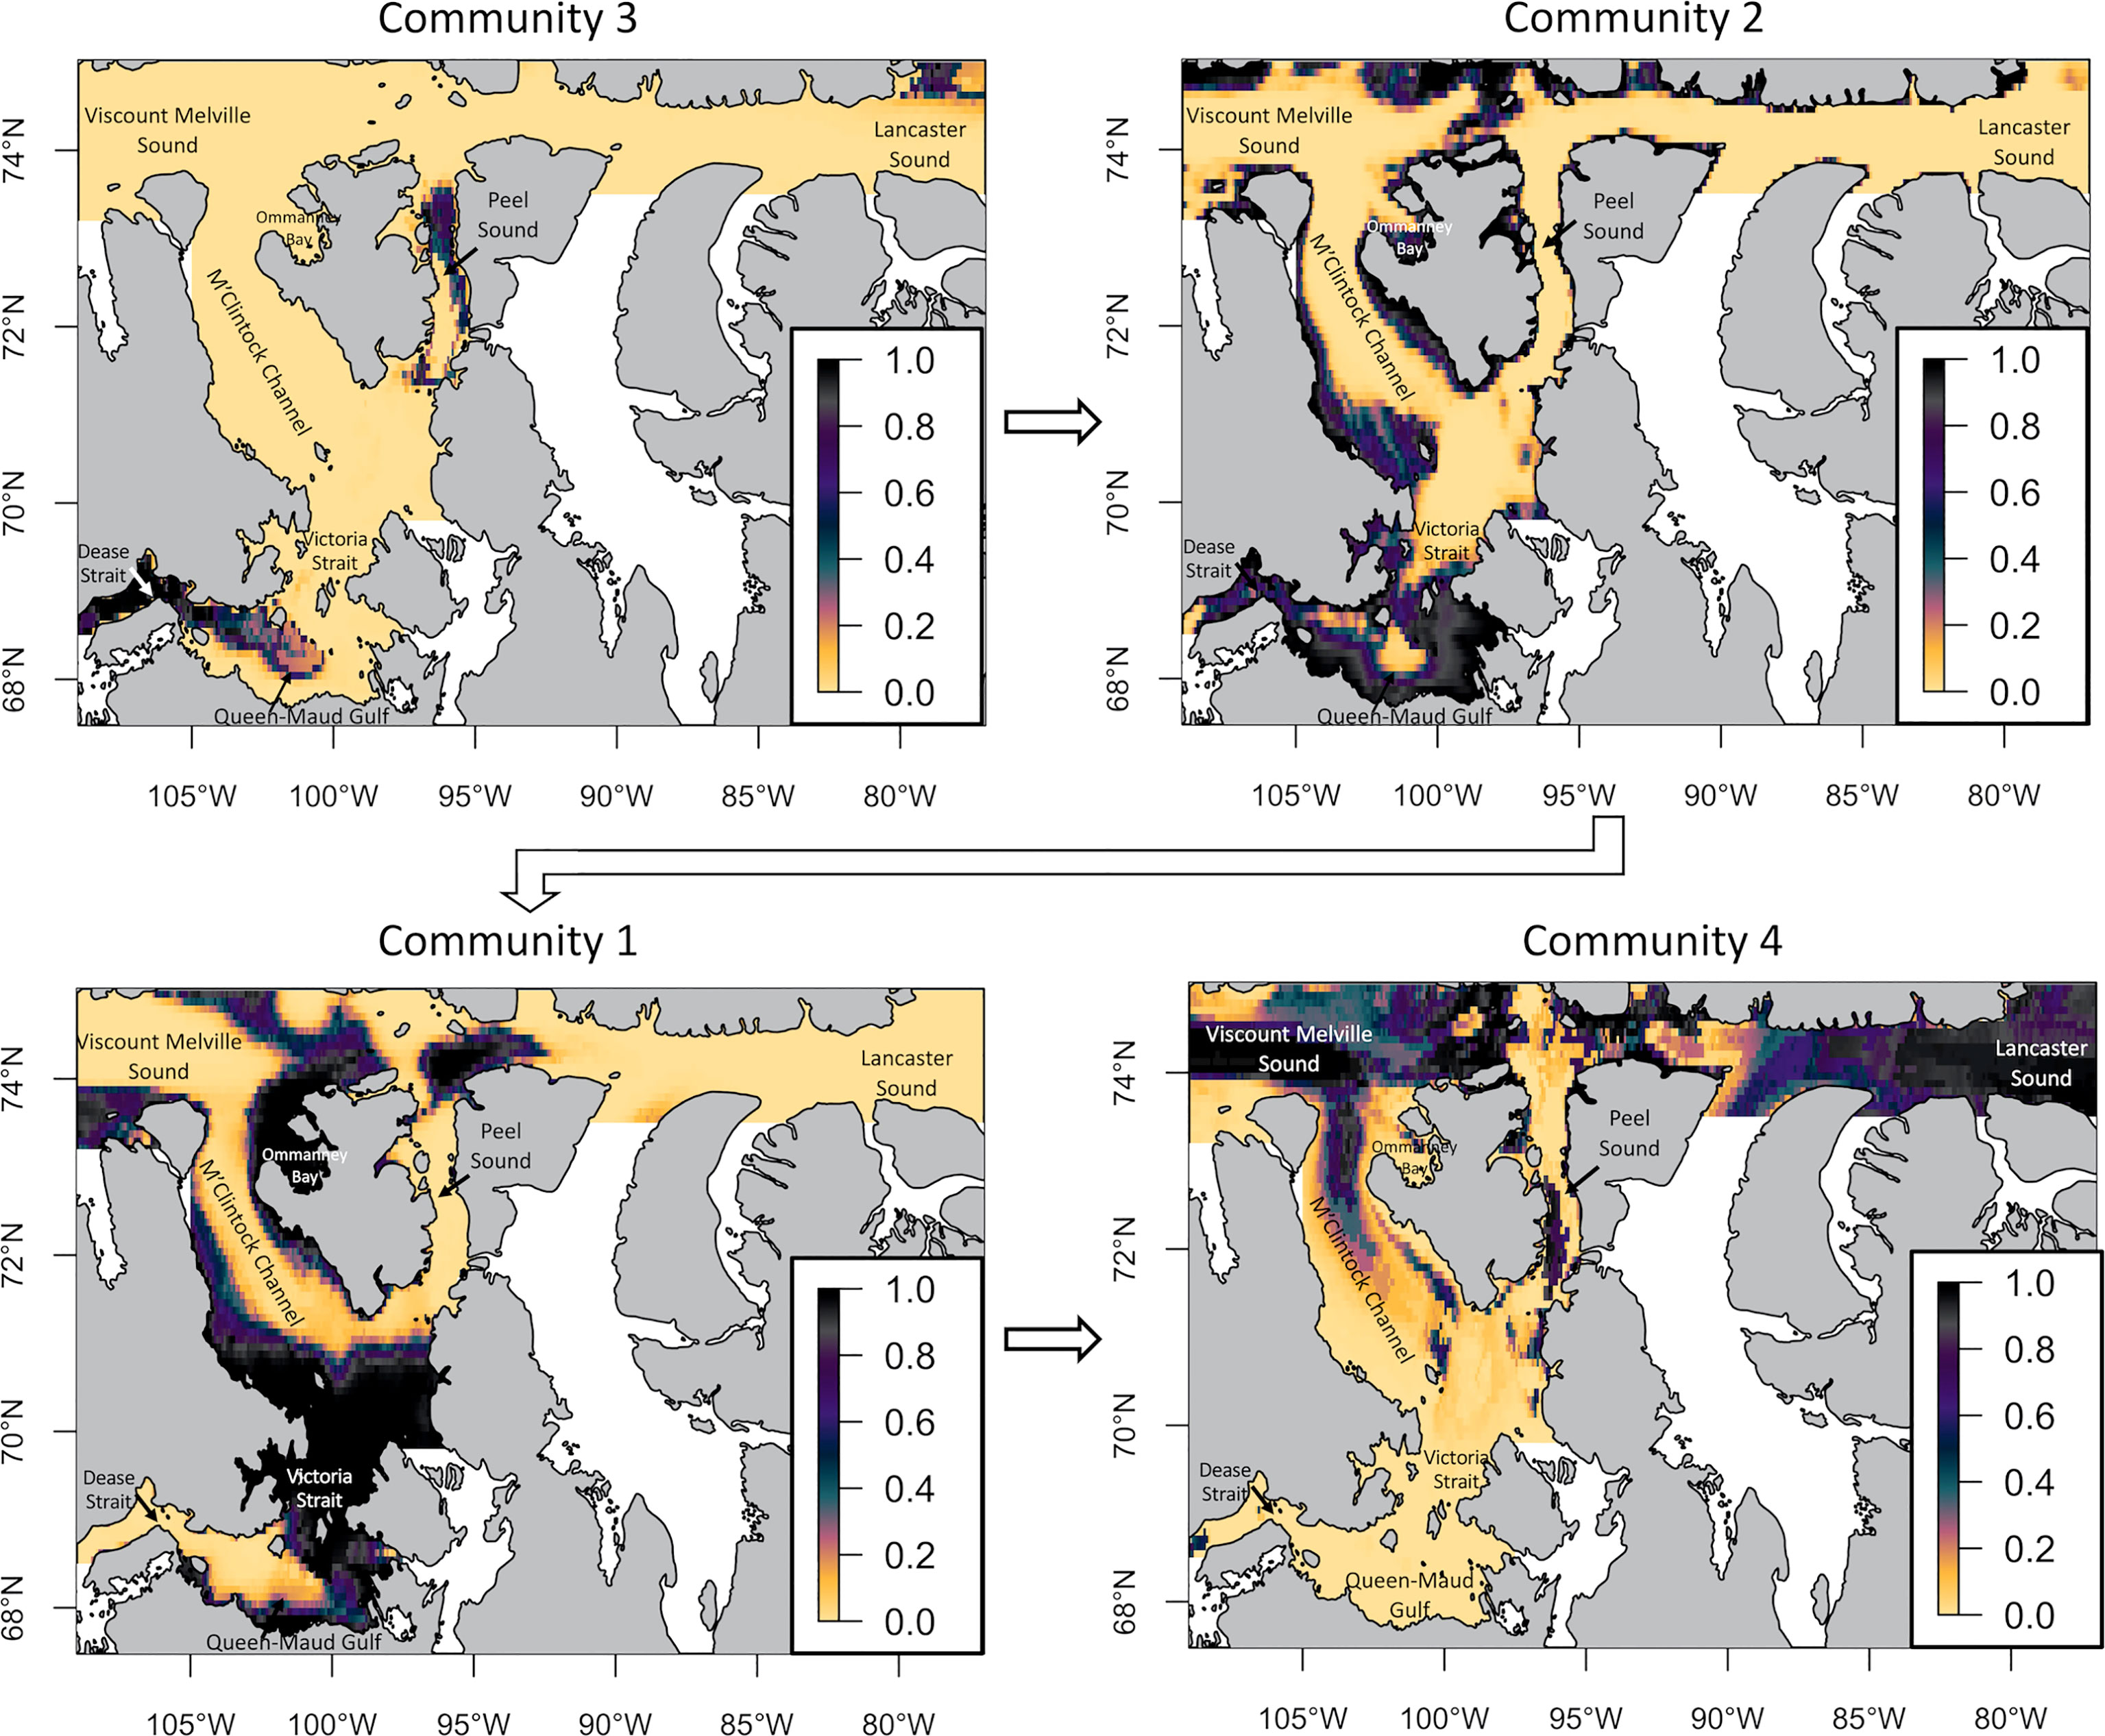
Figure 5 Habitat suitability of 4 infaunal groups in the Kitikmeot sea region and Parry Channel regions obtained with GLMs. The scale from 0 to 1 represents the probability of occurrence of each community. The arrows show the gradient of species community distribution from Dease Strait to Lancaster Sound.
The second community was predicted to be present in suitable habitat within coastal areas and especially in Queen-Maud Gulf, surrounding the third community. Suitable habitat for the first community was predicted to occur a little northward of the second community. Habitat suitability for the first community was higher around Victoria Strait and inside Ommanney Bay near Prince-Of-Wales Island, with a patch around Barrow Strait which is a shallower portion of Parry Channel. Completing the niche succession northeastwards, the fourth community found high predicted habitat suitability for Viscount Melville Sound and Lancaster Sound. In summary, communities 3, 2, 1 and 4 seem to be largely succeeding one another from the Southwest, near Beaufort Sea, to the Northeast and nearer to Baffin Bay.
When considering the environmental variables retained for creating the GLM models (Supplemental 2), silicate concentration is present in all four models. Also, annual mean ice thickness explains the presence/absence of 3 out of 4 communities. The first community seems to thrive where explaining variable values are intermediate. Furthermore, shallow depths, low annual mean ice thickness and high surface silicate concentration explaining the second community is consistent with its nearshore location inside Queen-Maud Gulf. The third community is explained by the lowest annual mean ice thickness, low bottom nitrate and moderate bottom silicate concentration. The fourth community is not explained by depth, but its distribution pattern clearly fits the deepest regions of the studied area. The variable with the strongest influence on this community is the bottom current velocity, which is clearly higher compared to the other groups even though it is in deeper water.
Epifauna
A total 50 stations were considered and 436 taxa were identified. The most dominant phylum was Arthropoda (28%), which was dominated by the order Amphipoda (48%), followed by Annelida (13%) (mostly Polychaeta at 99%) and by Bivalvia (12%).
Based on a Bray-Curtis dissimilarity matrix, epifauna stations clustered into 3 different groups (Figure 6). Almost half of all stations represent the first community which occurs at the highest mean depth, mostly in Parry Channel (Figure 7) and with a few stations in Queen-Maud Gulf. The latter stations from 2018 are more similar to deeper area communities in Parry Channel than to stations sampled in previous years a few kilometers away. The first community has the highest N* index values, is furthest from Pacific Ocean sources and has the low mean surface silicate concentrations. Two indicator species of that group are echinoderms of the class ophiuroids (brittle stars) (Table 3). The second and third share few similarities in taxonomic composition (Table 3), though both are found mainly in Queen-Maud Gulf, Victoria Strait and Dease Strait (Figure 7). However, locations in which the second community is present have lower salinity and higher surface silicate values, which are indicative of terrigenous water inputs. The five indicator species of this group are quite taxonomically diverse (Table 3). Most of third community stations were in Kitikmeot area, although, some are in Barrow Strait where the sea is shallower compared to the rest of Parry Channel. Overall, Community 3 stations are found deeper than the ones from the second community. In terms of silicate concentrations and salinity, this group is between the first and second community. The N* index value is the lowest, therefore indicative of strong Pacific Ocean water influence.
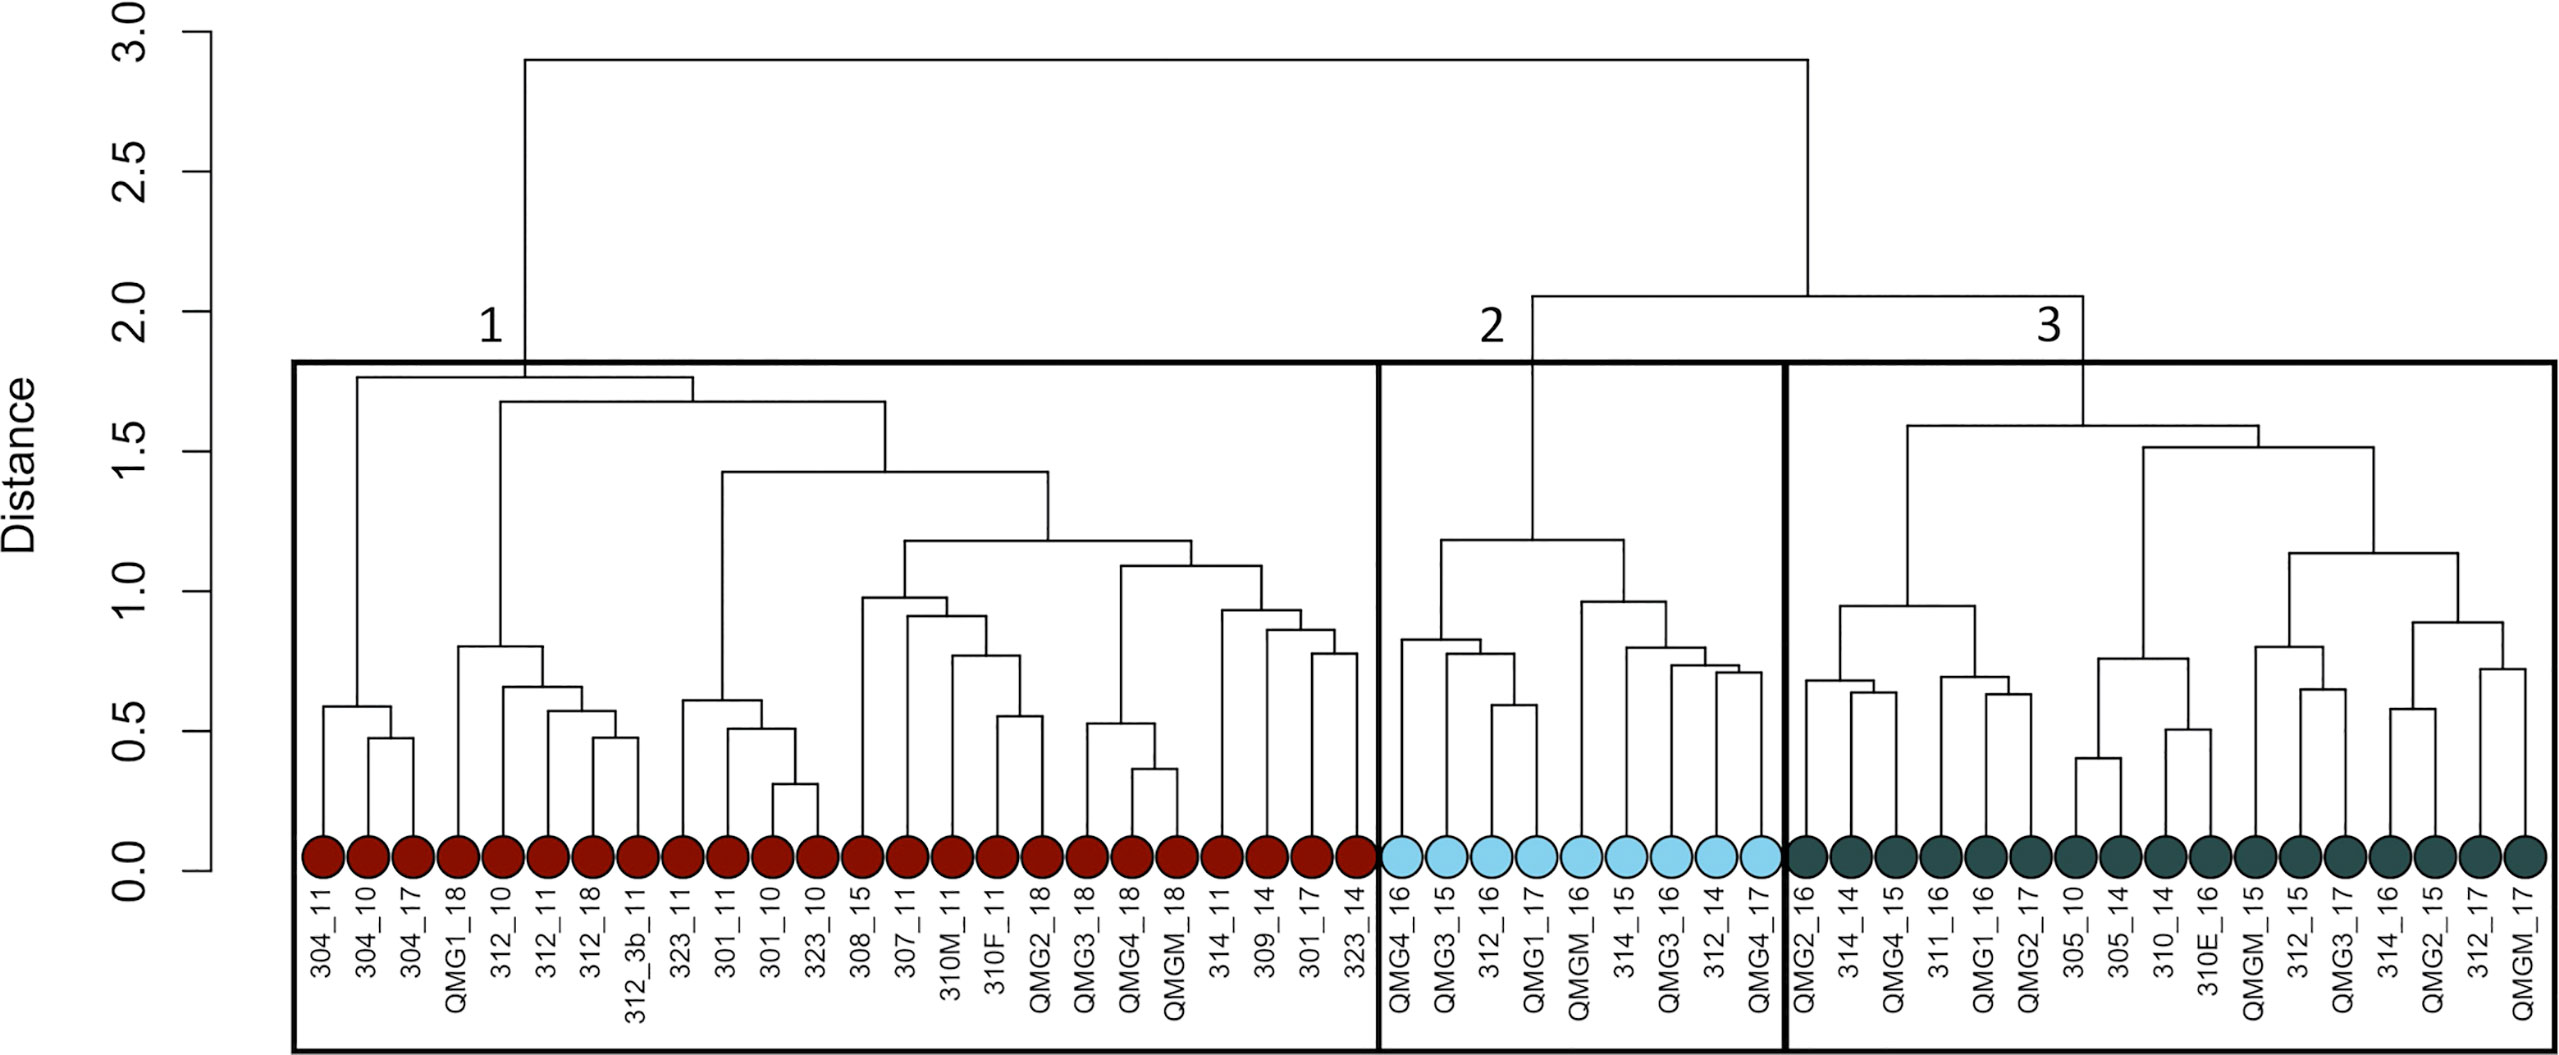
Figure 6 Epifauna cluster tree based on Bray-Curtis dissimilarity matrix with Hellinger transformed species biomass data. Red dots are the stations from group 1, pale blue dots are group 2 and dark grey dots are group 3.
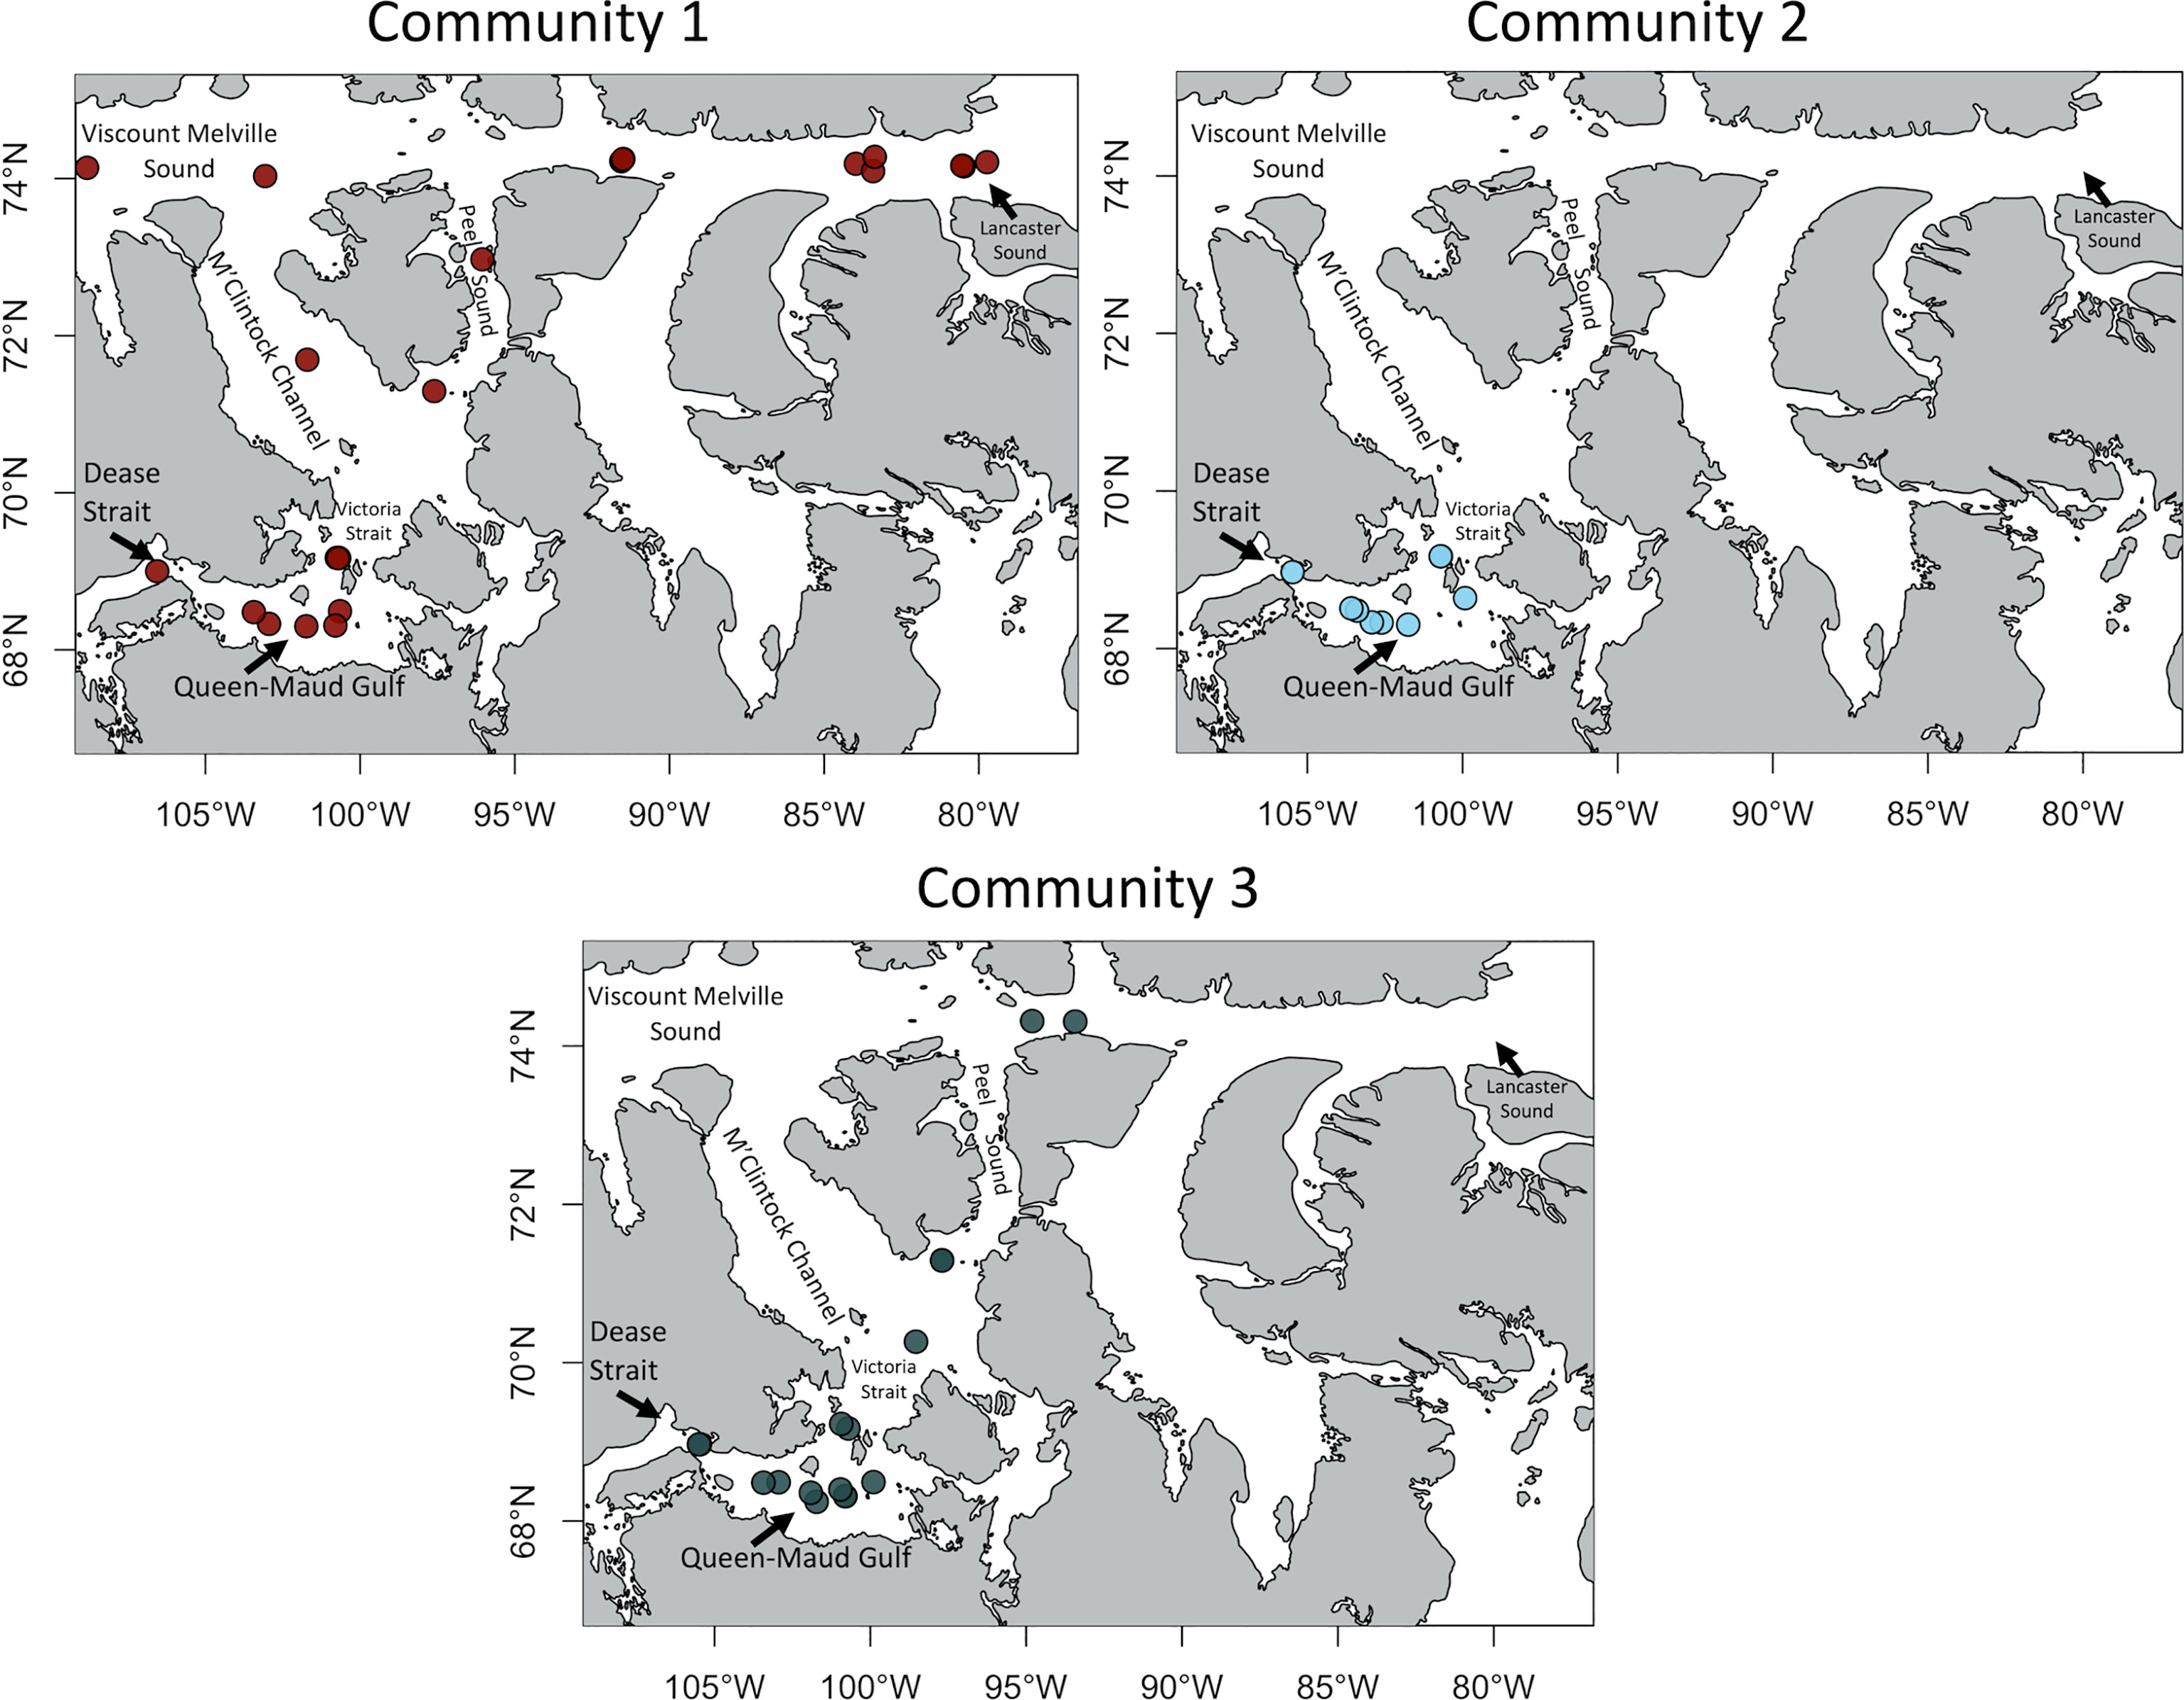
Figure 7 Location of the 3 epifaunal communities across the Kitikmeot sea region and Parry Channel. Colors represent the communities determined at Figure 6.
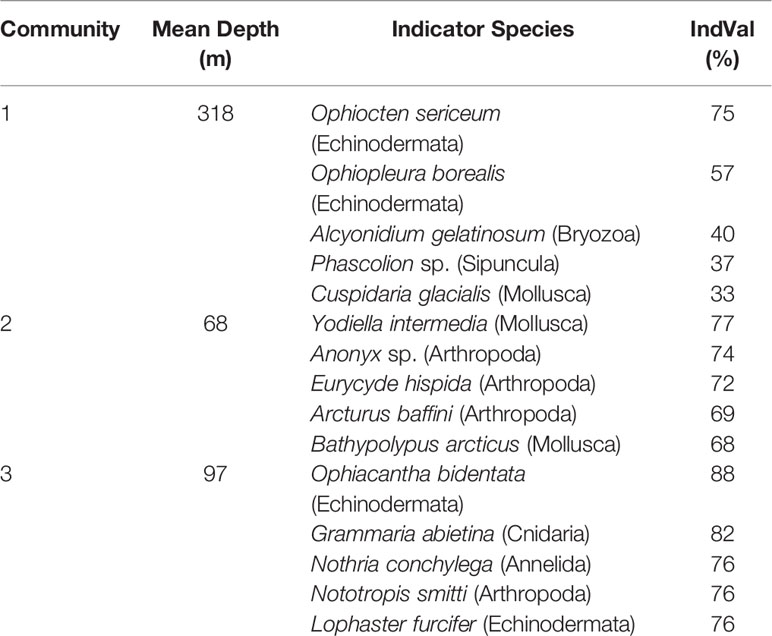
Table 3 Indicator species (5 first if available) of each benthic epifauna community in the Kitikmeot sea region and Parry Channel based on the IndVal Index.
In a best-fit RDA, 11 parameters (S, D, b.N*, O, b.N/P, SiS, WV, Sand, OM, C.a and P) explain 32% of the variation among stations (adj-R2 = 0.13) (Supplemental 3). The forward selection indicate that 6 environmental parameters are significantly influencial (depth, N* index, pigment, salinity, organic matter, and surface silicate) and when combined, explain 22% of the differences between the 50 stations (adj-R2 = 0.12) (Figure 8). Overall, high surface silicate and organic matter concentrations are inversely proportional to high salinity concentration, N* index (used to trace Pacific Ocean water), and depth values. High values of the latter five parameters are mainly associated to stations of the first community (Figure 8, displayed in red). High concentrations of surface silicate and organic matter are associated with stations from the second and third community.
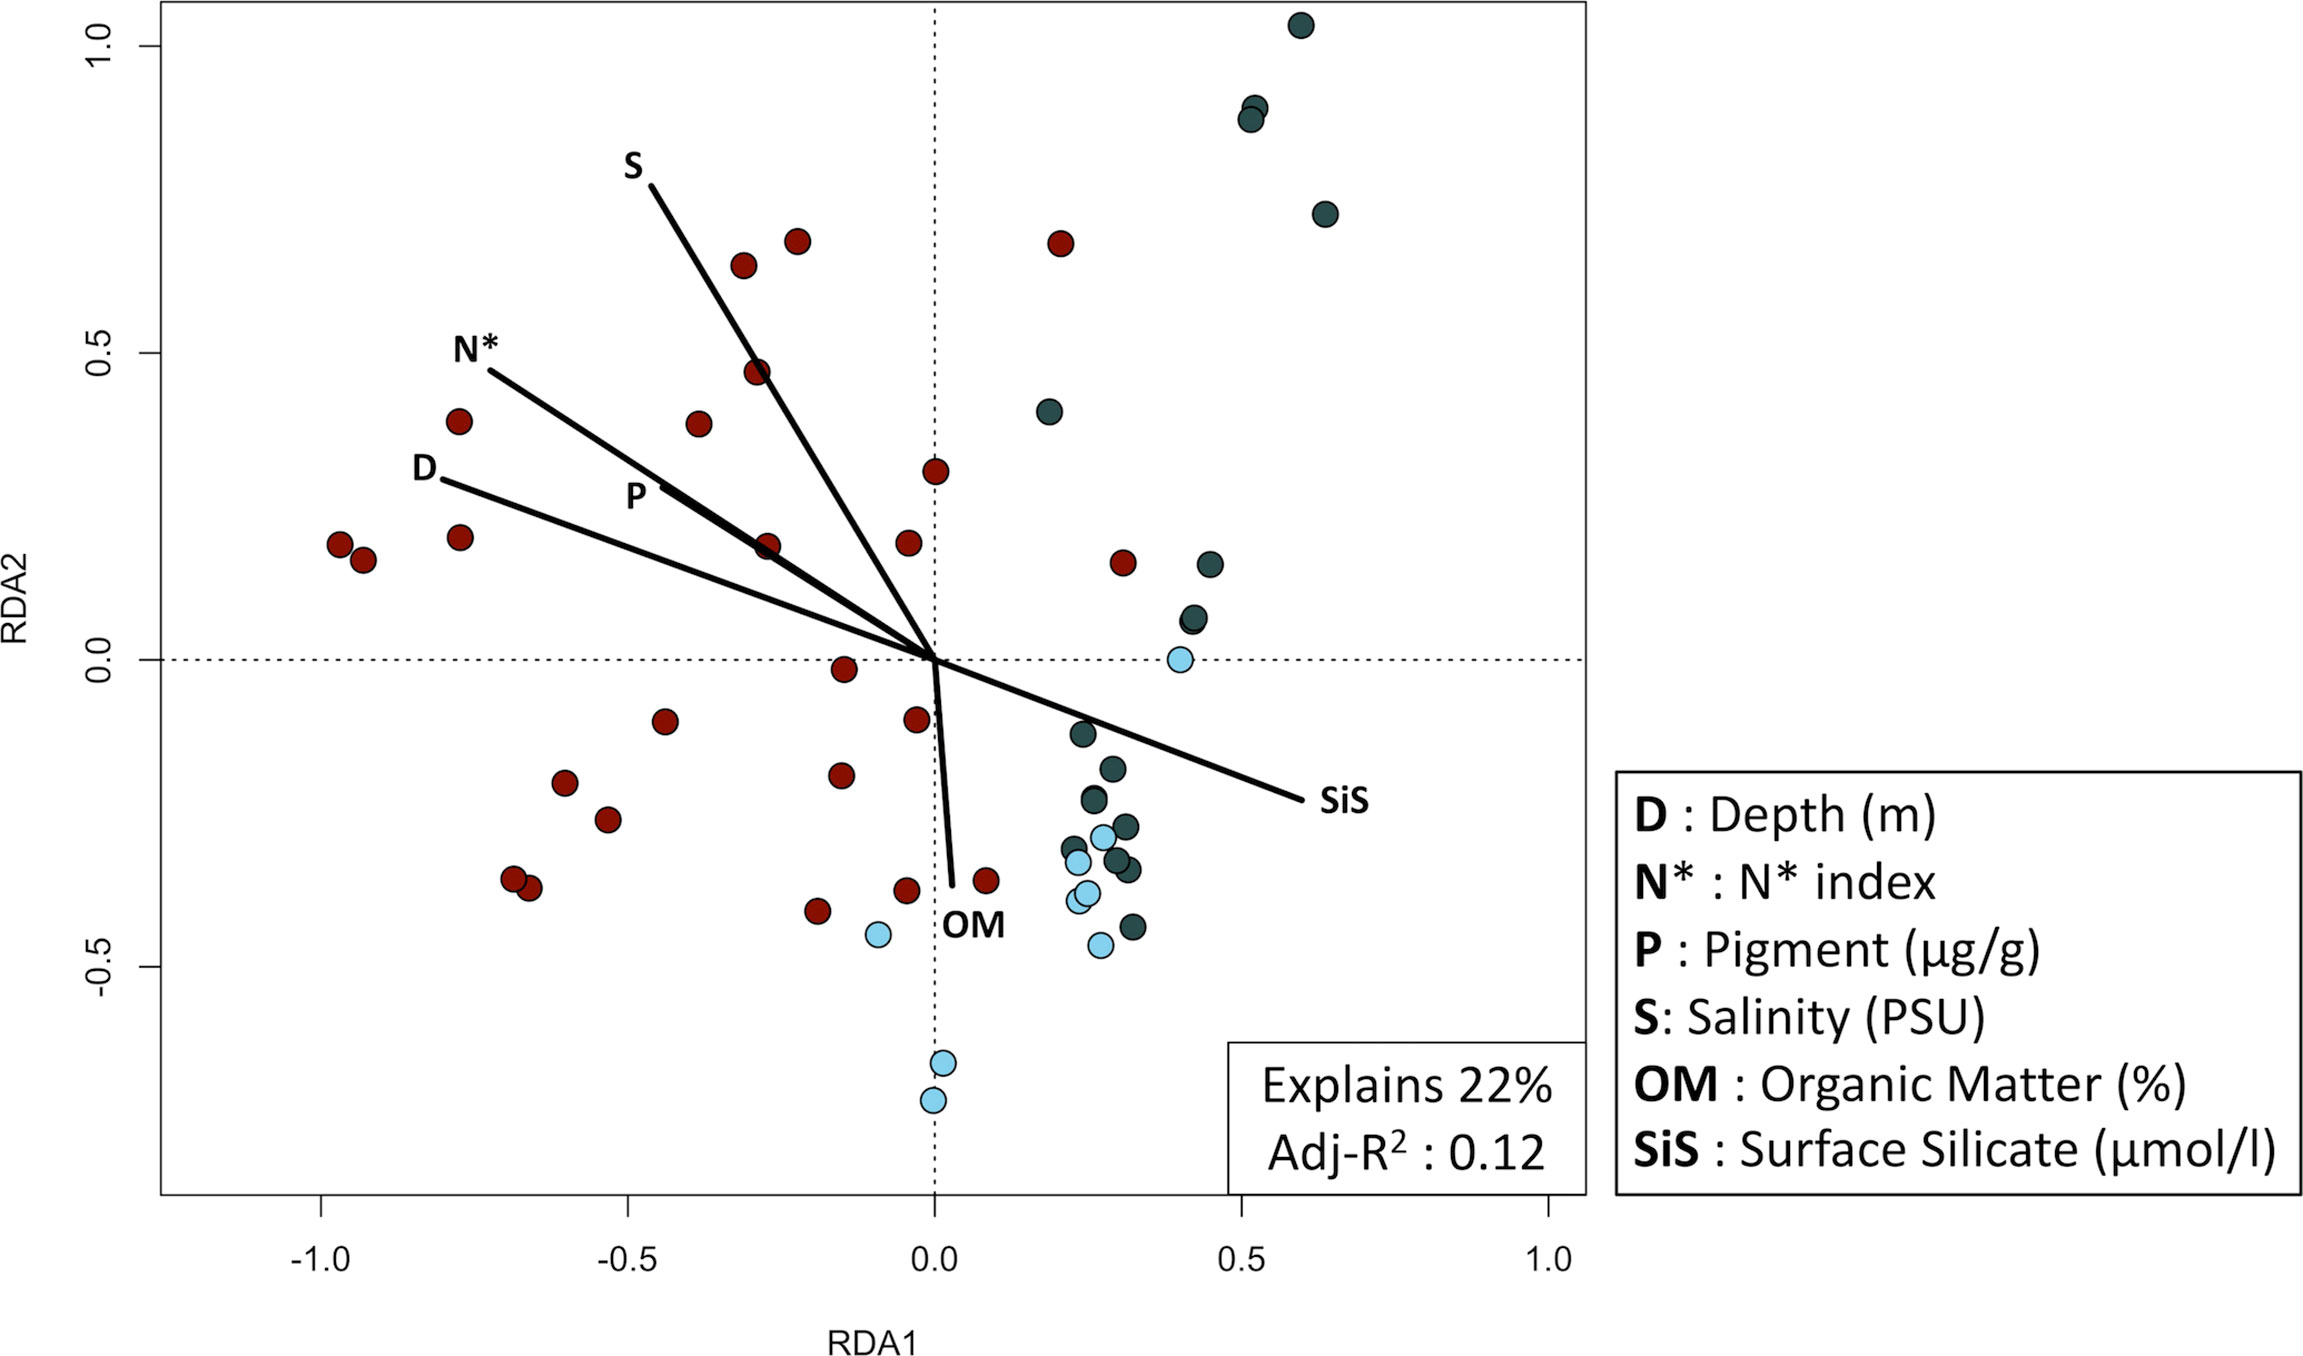
Figure 8 Redundancy analysis plot of the biomass Hellinger transformed 50 epifaunal stations sampled between 2010 and 2018 (p-value = 0.0001). Significant environmental variables were obtained using a two-step forward selection. Colors represent the community determined with a Bray-Curtis distance-based cluster analysis. Red dots are the stations from community 1, pale blues are community 2 and dark grays are community 3.
In the GLMs models, habitat suitability for the three communities shows a somewhat obvious spatial succession from Southwest to Northeast, albeit not as clear as with the infauna (Figure 9). The second community is mostly present in southern Kitikmeot. The third community has high habitat suitability inside most of Kitikmeot sea region and is located just beyond coastal areas. There are also high habitat suitability values North of Prince-of-Wales Island and Barrow Strait. Hence, this can be interpreted as an intermediate community between the communities of Lancaster Sound (1) and Queen-Maud Gulf (2). Finally, community 1 has high habitat suitability values in North M’Clintock, Viscount Melville Sound, Peel Sound and especially Lancaster Sound with a tendency to expand East towards Baffin Bay. Overall, the 3 epifaunal communities are succeeding one another inside the study area. For Community 1, the coefficient with the highest value is associated with depth (Supplemental 4). Indeed, high habitat suitability values for this community are found mostly for deeper areas such as Parry Channel while the community has ‘near zero’ habitat suitability values in shallow regions like Queen-Maud Gulf. Regarding the second community, the highest absolute value of coefficients is associated with high bottom current velocities, which are mainly observed within channels. Moreover, this community has higher suitability values when dissolved oxygen increases. Finally, the third community is present in areas with the highest mean current velocities, whereas the first community is found mainly in areas of medium mean current and the second community, the lowest mean current velocities.
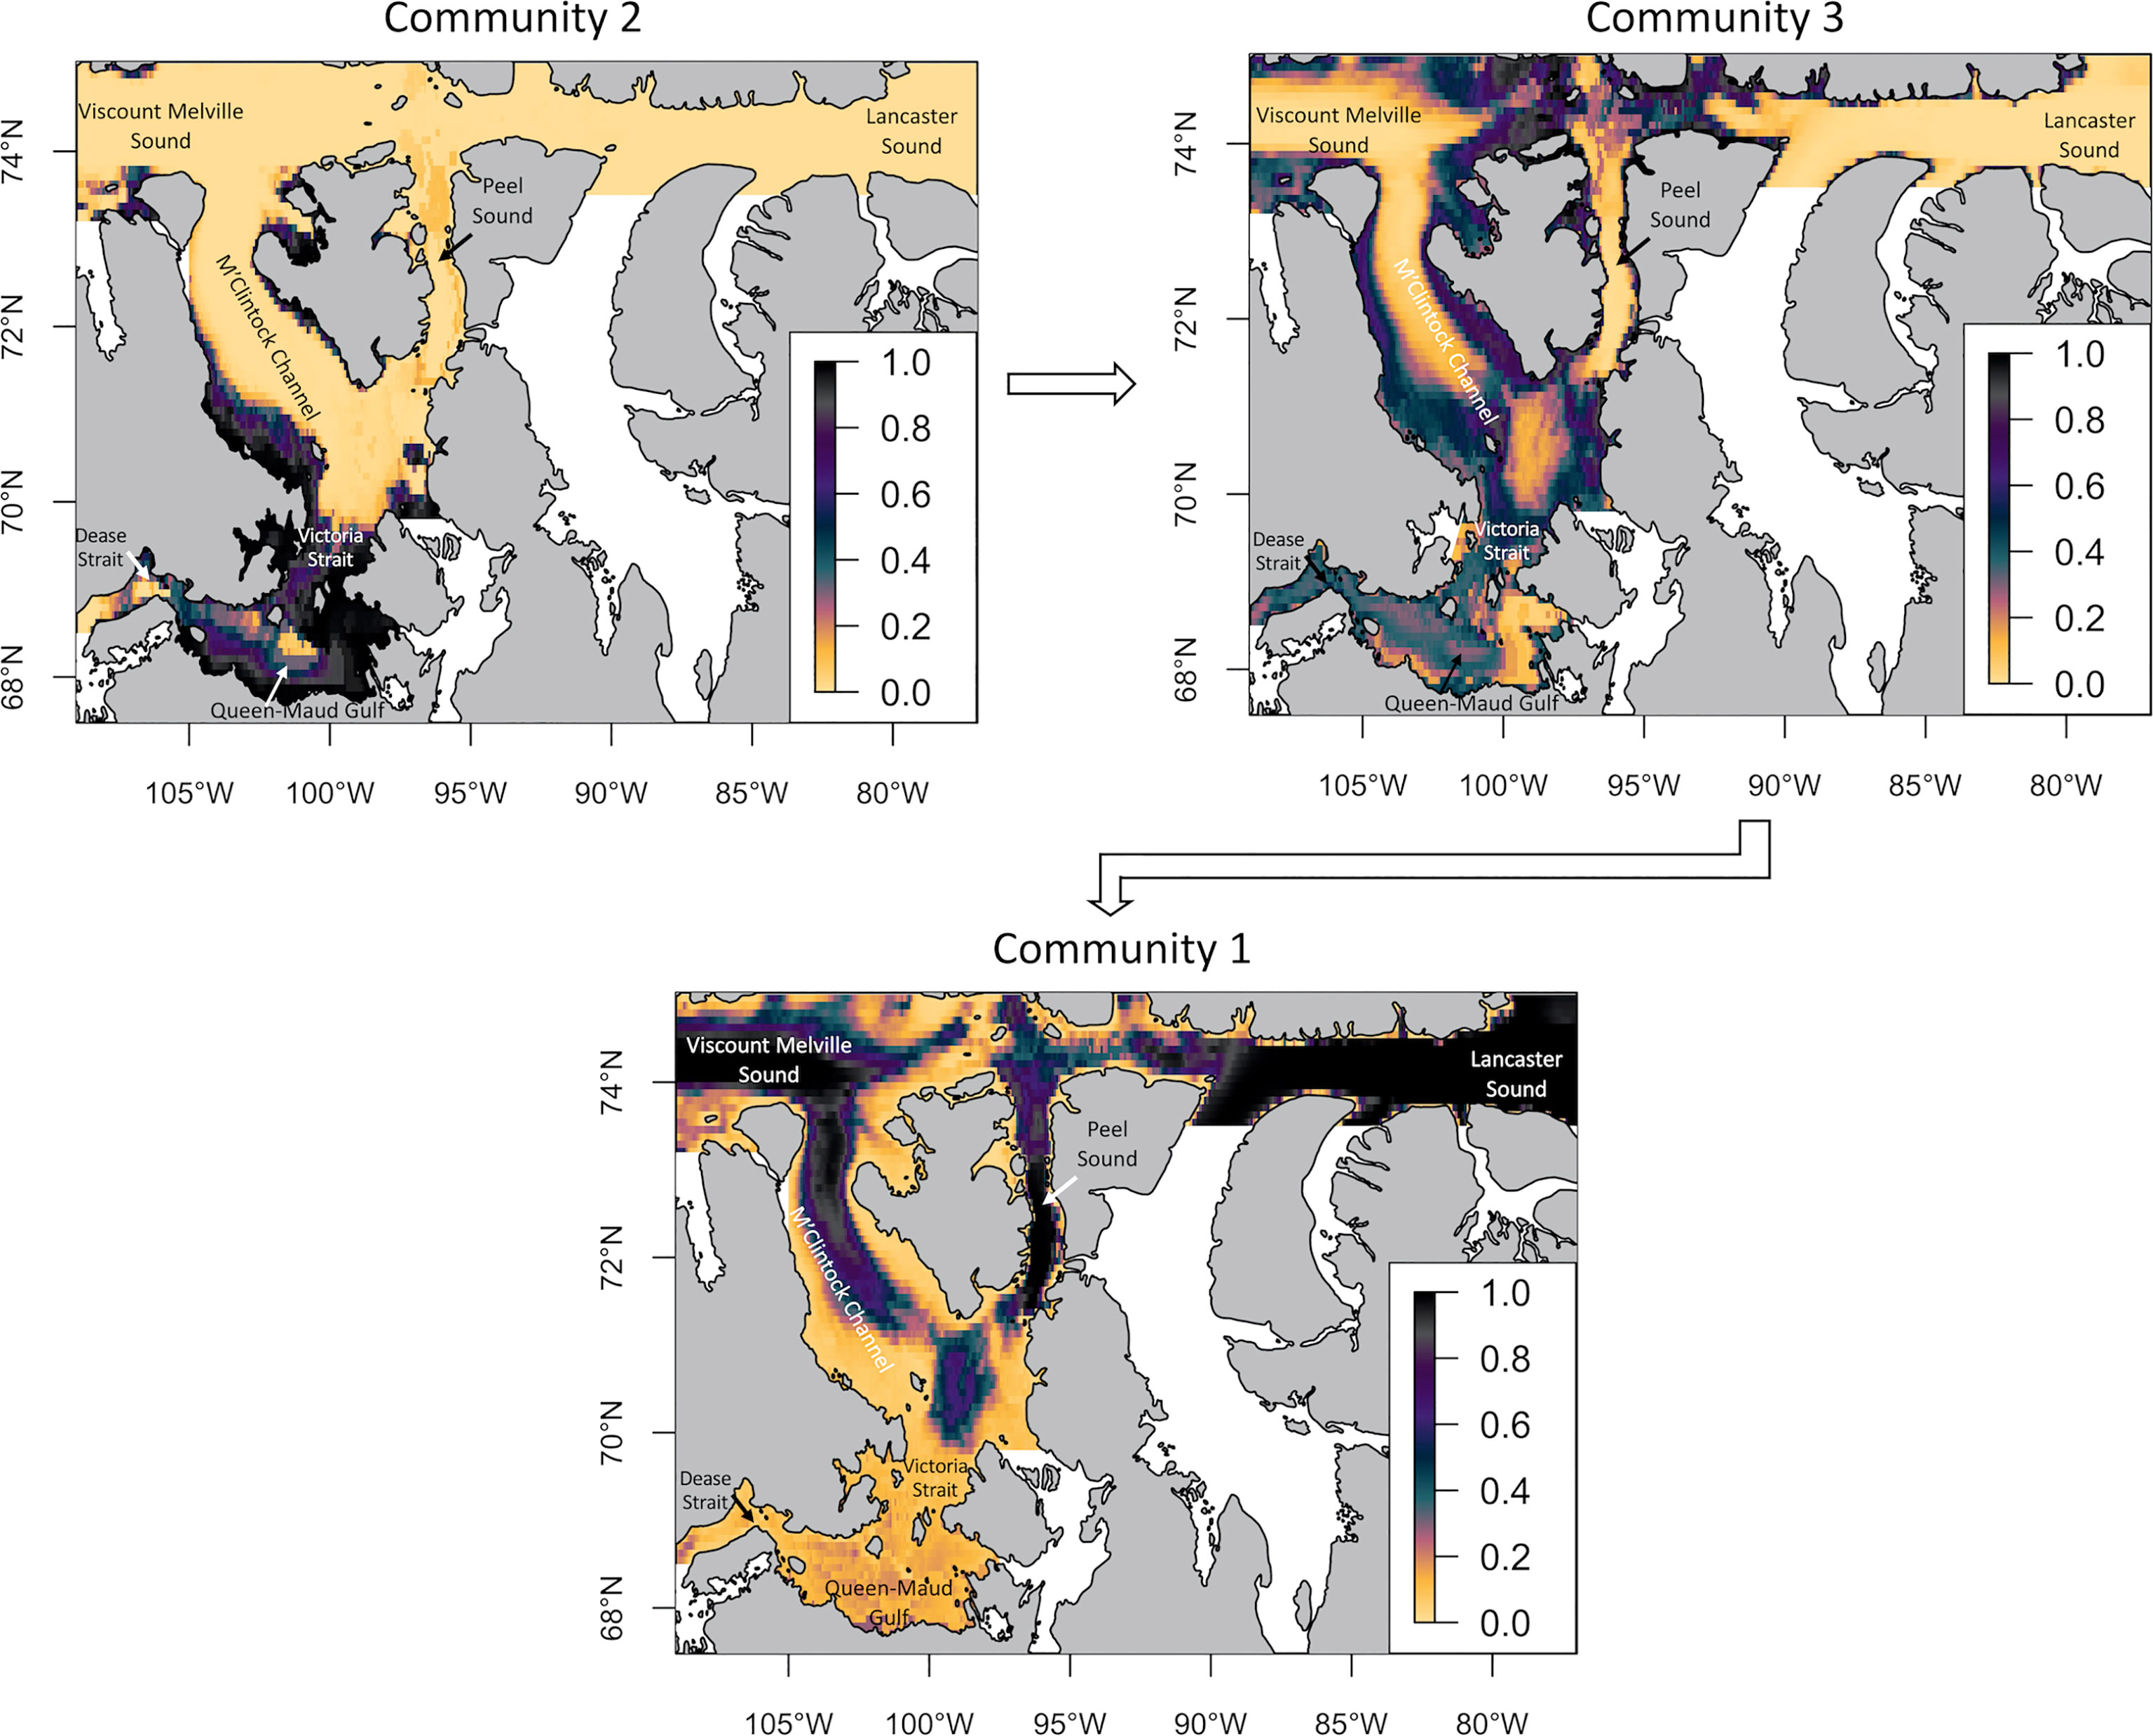
Figure 9 Habitat suitability of the 3 epifauna groups in the Kitikmeot sea region and Parry Channel obtained with GLMs. The scale from 0 to 1 represents the probability of occurrence of the community. The arrows show the proposed gradient of species assemblage from Dease Strait to Lancaster Sound.
Discussion
This study demonstrates that benthic communities in the southern and central CAA are succeeding one another from Southwest to Northeast, with 4 infaunal and 3 epifaunal communities that are mostly contiguous and partly overlapping. Pacific Ocean water flowing through the CAA, from Bering Strait to Baffin Bay, is an influential environmental parameter for the community composition. Moreover, we observed that benthic assemblages are potentially influenced by terrigenous inputs in the marine environment. This is the first time that benthic communities and diversity are modelled in the Kitikmeot sea region.
Indicator Taxa
All characteristic species are well known from Arctic shelf areas. In the epifauna, indicator species of 2 out of 4 communities are both ophiuroids, or brittle stars, which are often observed in the Arctic. A potential explanation suggested by Piepenburg (2003) for their omnipresence in Arctic regions is that they are exposed to very low predation pressure. In Community 1, Ophiocten sericeum is the most indicative species most likely because of its large depth range (Piepenburg, 2003). The best indicators of Community 2 are the bivalve Yoldiella intermedia, the amphipod Anonyx sp. and the pycnogonid Eurycyde hispida, all of which have been observed in shallow and low salinity areas such as in fjords (Arnaud and Bamber, 1988; Shea and Percy, 1990; Różycki, 1992; Bryazgin, 1997). The exception among indicator species for that community would be Bathypolypus arcticus, a cosmopolitan deep-water octopus, though its variable distribution may include shallow areas (Wood, 2000; Gardiner and Dick, 2010). For Community 3, the first indicator species is Ophiacantha bidentata, a shallow water brittle star species (Martynov and Litvinova, 2008). The second indicator species, Grammaria abietina, is a sessile hydroid while the third is the shallow water polychaete Nothria conchylega. These two latter species are present despite a mostly fine sediment structure, although they do need coarser sediment for attachment and to build a dwelling, respectively (La Porta et al., 2011).
For infauna, Bivalvia and Polychaeta were the main indicator taxa, which are often dominant within the sediment in the Arctic and globally (Dale et al., 1989; Olsen et al., 2007; Schonberg et al., 2014). The main indicator for Community 1 is a common shallow water amphipod, Haploops laevis (Bryazgin, 1997). In Community 2, the most important species is Astarte crenata/montagui, which is also omnipresent in the Arctic, followed by the bryozoan genus Alcyonidium. The latter species can be an indicator of the presence of at least sparse, coarse substratum enabling attachment of these organisms. The third indicator species of this community is the Polychaeta Abyssoninoe abyssorum. Unlike its name may suggest, it can be found in shallow water (Bakken et al., 2010). In addition, the burrowing bivalve genus (Kokarev et al., 2017) Yoldiella is common in the community, also found worldwide and often in the Arctic (Bernard, 1979). Finally, Philinidae is the main indicator species of Community 4, being a family of small carnivorous gastropods that mainly feed on foraminifera (Ohnheiser and Malaquias, 2013). Except for this family, the other indicator taxa are all deposit feeders, which suggests low predation from other species in that environment. Among these, the bivalve genus Thyasira may tolerate hypoxia conditions due to chemoautotrophic abilities (Dando and Spiro, 1993).
Environmental Influence on Assemblages
The most notable results are that N* index and surface silicate concentrations significantly explain the differences between benthic assemblages within stations. This means that Pacific Ocean origin water and terrigenous input have an influence on benthic communities in the CAA. Pacific waters that enter by the Bering Strait are nitrate depleted (Yamamoto-Kawai et al., 2006) and fresher than the Atlantic water. In the Arctic, nitrogen in the form of nitrate is a limiting element for marine primary productivity (Gray and Elliott, 2009). Because of its lower density, water of Pacific origin is mostly found within the upper 200 meters (Woodgate, 2013). More than 3 stations out of 4 were sampled no deeper than 200 meters. This means that most of our stations are literally in the depth zone of these lesser dense waters. Moreover, other depth zones may also be influenced by it, for instance by receiving organic matter from the euphotic zone. Not only is the influence of the Pacific observable in the study area, but as mentioned before, Pacific water input is currently increasing in the Arctic (Woodgate, 2018).
The modelling of the distributions of epifauna and infauna communities suggests that they largely succeed one another across the study area. The distribution of habitat suitability values for every community suggests that every community occupies a distinct niche and geographic area. However it is possible to observe that communities occupy succeeding geographic locations. This succession is mainly from South to North with a slight tendency of West to East. This West-East tendency is more obvious for the infauna where the first community of the succession (Community 3) has very high suitability values in the West in Dease Strait and the last community (Community 4) has very high habitat suitability values in Lancaster Sound at the entrance of Baffin Bay.
The community turnover occurs along the same gradient as the strength of influence of Pacific Ocean origin water (a significantly influential parameter) (Yamamoto-Kawai et al., 2006) that flows through the CAA. Moreover, an increasing volume of higher temperature seawater (Woodgate, 2018) may promote Pacific Ocean water inflow in the Arctic and hence allow for the northward movement of sub-polar species via Bering Strait (Waga et al., 2020). Based on these insights, we suggest that the community succession observed in the models could potentially move North and/or Eastwards towards Baffin Bay in the future, depending on the original location of the community. Furthermore, this could also include exotic species in the near as suggested by the change in future conditions (Goldsmit et al., 2018; Goldsmit et al., 2020).
Another significant observation is that surface silicate and salinity are correlated. This is especially the case where rivers are present because silicate concentrations are higher in Arctic rivers than in the Pacific Ocean (Ekwurzel et al., 2001). This is the case here as there are a significant number of terrestrial sources in the studied area (in particular QMG). When looking at redundancy analysis and group averages for each environmental variable, Kitikmeot stations have higher surface silicate concentrations, which was used to trace terrigenous inputs. However this will need to be explored further. For instance, δ13C could be a better tool to evaluate organic matter origin and its impact on benthic communities (Naidu et al., 1993; Bell et al., 2016). Moreover, δ18O can be used to trace more precicely the presence and movement of freshwater masses and indicate if water is from marine sources, such as sea ice melting or of terrigenous origin (Yamamoto‐Kawai et al., 2008; Lansard et al., 2012).
Land inputs contribute meaningfully to the Arctic Ocean’s organic carbon budget (Grebmeier and Barry, 1991; Wheeler et al., 1996) and freshwater budget, where the Arctic receives over 10% of global fluvial imports (Opsahl et al., 1999). All this freshwater entering marine ecosystems contains allochthonous organic matter, hence food for benthic invertebrates. Although it has a lower nutritional quality for benthos (Schell, 1983), this organic matter can be consumed by benthic organisms after microbial reworking and contributes in reducing the pelagic-benthic coupling (Bell et al., 2016). In some Arctic areas, it has been observed that autochthonous organic matter might not be enough for pelagic and benthic organisms. Hence, allochthonous sources are of importance for the carbon budget (Schmid et al., 2006). This connection is supported by our epifauna data, where the concentration of organic matter was correlated with the concentration of surface silicate. River discharge is expected to increase in the upcoming years, and this is especially the case around Queen-Maud Gulf, where predictions suggest the greatest increase along the Canadian Arctic coastline (Bring et al., 2017). Furthermore, Brown et al. (2020) demonstrated that smaller rivers may have a greater inorganic import potential in the future than previously anticipated. River discharge also favors species that are more tolerant than others to salinity variations (Remane and Schlieper, 1971). Precipitations in the Arctic tend to increase and will continue to do so in the future (Bintanja and Selten, 2014), adding to the direct effect of river discharge and thus freshwater inputs in the marine environment (Peterson et al., 2002; Zhang et al., 2013).
In both infauna and epifauna, depth is a significant environmental driver, although depth per se does not necessarily have an influence on living organisms (Gage and Tyler, 1991; Gibson et al., 2005). Depth is especially linked to food availability by negatively affecting the benthic-pelagic coupling (Smith et al., 2008; Soltwedel et al., 2009; Roy et al., 2015b) and food quality (Grebmeier and Barry, 1991; Forest et al., 2011). This explains why depth and chlorophyll a are inversely correlated. In addition, the CAA has different and more heterogenous environmental conditions than Baffin Bay and the Beaufort Sea, located on either side. Additionally, to the Southwest-Northeast succession, the inter-regional heterogeneity could also explain why there is such a large-scale difference in species assemblages. This heterogeneity of habitat could be partly linked to depth fluctuations in the CAA where multiple sills are present (McLaughlin et al., 2006). For instance, Queen-Maud Gulf (shallower environment; maximum depth of 115 meters) communities are quite different from the ones in Lancaster Sound (deeper environment; maximum depth of 786 meters).
A prominent oceanographic phenomenon in the CAA, especially in the Kitikmeot sea region, is the local presence of strong tidal currents (Rotermund et al., 2021). These currents are fastest in narrow straits and contribute to reducing the ice cover during winter and are thought to increase pelagic-benthic coupling during summer (Williams et al., 2019). Even though current velocity is not an explanatory variable in the RDA, it was selected in GLMs of the three epifauna communities, suggesting it is a non-negligible factor for community distribution. In fact, Fredriksen et al. (2018) demonstrated that epifauna communities in areas with high current are dominated by suspension feeders, in agreement with Community 3, while lower current regions were dominated by deposit feeders.
As some environmental parameters are significantly influential, there is no key variable that can alone explain benthic communitiy distribution. It is more reasonable to assume that interactions between every variable influence the species assemblages, where some interactions can be antagonistic while others synergistic and very few variables act in isolation (Carrier-Belleau et al., 2021).
As observed on community location maps, stations that are geographically closer to each other tend to have similar community composition. There is one notable exception to this observation, and it is Community 1 of the epifauna. Indeed, Queen-Maud Gulf stations of 2018 are much more like those of Parry Channel than they are from stations of the same location from different years. However, Queen-Maud Gulf stations are in shallower depths and Parry Channel stations are within the deepest locations of our sampling effort. QMG stations of 2018 had less organic matter, less surface silicate (less terrigenous inputs), lower chlorophyll a concentration and less bottom oxygen concentration (which proposes a greater column water stratification) than observed in that region during other sampling periods. In 2018, there was a higher sea ice extent, lower temperatures and slightly lower precipitations (Smoliansky et al., 2018) than other years. All of which could have impacts on primary productivity and hence benthic communities (Gradinger, 1995; Arrigo et al., 2008; Wassmann and Reigstad, 2011; Link et al., 2013; Kędra et al., 2015). Another potential explanation of this unique result would be a greater increase in the nitrate depleted Pacific Ocean water inputs in the Arctic for that year. However, those stations do not exhibit different N* index value for that year. A sudden shift in benthic communities’ composition driven by changes in the environmental conditions over only one year seems quite unlikely. Normally, shifts in benthic communities occur over more than a year given that many species are long-lived and slow growing (Grebmeier, 2012; Kortsch et al., 2012).
Modelling diversity is even more complex than doing so for presence/absence of communities, judging from the overall low R2 values (Supplemental 5, 6, 7, 8). In the case of our data, the highest pseudo R2 for these latter models was 0.28. For communities, they were at least higher than 0.30 and go up to 0.80. Despite some low R2 values, diversity models are based on species level identifications, which brings more model strength since the species level is usually most impacted by the environment (Bertrand et al., 2006). Additionally, more parameters are selected to predict diversity and it is normally a combination of many parameters that affect diversity in marine ecosystems (Rosenzweig, 1995; McArthur et al., 2010). Many environmental variables are found to be significantly influential on the number of taxa for both epifauna and infauna. This is especially the case for surface silicate, salinity, bottom N/P and annual mean ice thickness.
Model Validity
The only possible validation of our model by external data was achieved with Lancaster Sound bottom pictures from Bouchard-Marmen et al. (2017), the latter having been taken exclusively in the area mostly occupied by epifauna of community 1 (Lancaster Sound). Our model shows that the two main indicator species for this community were Ophiocten sericeum and Ophiopleura borealis, which can be confirmed/validated by photographs showing their high abundance in that area. Comparatively, oher indicator species were not often observed in these pictures, probably due to the difficulty in detecting them by their smaller size. Therefore, a more detailed validation of these models would be warranted in the near future. Additionnaly, sampling effort should be increased in the whole area to have a maximal validation resolution. This was suggested by Wei et al. (2020), where future research activities must fill these knowledge gaps to improve the accuracy and resolution of pattern predictions. Furthermore, we must be careful with predictions of habitat suitability for communities around coastal areas, since we do not actually have any infauna or epifauna data shallower than 34 meters. Hence, models are not built to predict community presence or characteristics in such complex environments. Finally, models that were built are considered to be large-scale, where every cell measures 27 km2. Consequently, community gradients may not be observable everywhere since, on a local scale, it is interspecific relationships that impact community composition (Levin et al., 2001). This model does not consider these types of relationships.
Summary and Conclusion
Our research suggests that epifaunal and infaunal benthic communities are succeeding one another from Dease Strait, in the West of the CAA, to Lancaster Sound in the East, near Baffin Bay. This finding reinforces the hypothesis that the CAA is an ecotone, a transitional area, between the Beaufort Sea and Baffin Bay. Results also suggest that Pacific Ocean origin waters have significant influence on benthic communities in the CAA, further explaining the observed succession. A biogeographic analysis looking at gradients in Pacific affinity species could later support this finding. Unrelated to the transitional status, our results also suggess that river inputs have an important impact on benthic assemblages, particularly in Kitikmeot where many rivers are discharging in Queen-Maud Gulf. Many significantly influential parameters on benthic organism presence and community composition have already changed and will be subject to more important changes in the upcoming years (Polyakov et al., 2020). This is notably the case for the terrigenous imports, the Pacific Ocean water influence, the sea ice cover, sea temperature and the primary production (Stroeve and Notz, 2018; Woodgate, 2018; Brown et al., 2020; Lewis et al., 2020). Our study is also the first modelling of Kitikmeot and Parry Channel benthic communities. Moreover, such models could be useful for spatial planning applications or even for marine conservation purposes. However, further validations from external data sources are needed, especially in the Kitikmeot sea region. In the context of climate change, this region is a key area for the transition of Pacific Ocean water to the Baffin Bay areas, which will also experience an increase in human activities such as maritime transport.
Data Availability Statement
The raw data supporting the conclusions of this article will be made available by the authors, without undue reservation.
Ethics Statement
Ethical review and approval was not required for the animal study because The few cephalopods caught on our bottom trawl were only identified and then released alive.
Author Contributions
P-OD: Wrote most of this study. Performed every statistical analysis. Benthos taxonomy. CG: Provided benthic data and helped on statistical analysis. BB: Co-Principal Investigator. Supervised and commented during the whole process. LM: Benthos identification. LT: Benthos identification. J-ET: Provided Nitrate, Nitrite, Silicate and Phosphate data. PA: Principal investigator. Provided funding, laboratory space and feedback during the whole process. All authors contributed to the article and approved the submitted version.
Funding
Canadian Foundation for Innovation provides funding for Amundsen Sciences (2014-2017: 33108; 2017-2023: 35560). Amundsen Science support this research by mobilizing a Canadian Coast Guard ship (CCGS Amundsen) to access and sample each of our stations in the Canadian Arctic. We received funding from Québec Océan which is funded by Fond de Recherche du Québec – Nature et Technologie (FRQNT) (186795). Québec Ocean contributed financially to cover expenses in conference where this project was presented and provides funding for laboratory analysis. FRQNT also provided a scholarship to the first author for the whole duration of this project (121670). Takuvik provided funding and support especially for the environmental parameters analysis in the laboratory. Takuvik is funded by Sentinelle Nord which is funded by Canada First Research Excellence Fund (SIRUL 113079). Natural Sciences and Engineering Research Council of Canada (NSERCC) (RGPIN-2018-04982) provides funding to the Principal-Investigator and his laboratory. The funding was used to purchase material and cover field and laboratory expenses. ArcticNet through the funding of the Networks of Centres of Excellence in Canada (533380/2018) was used to purchase material, cover field and laboratory expenses and cover expenses in conference where this project was presented. The W. Garfield Weston Foundation (FO518384) funding was used to purchase material as well as cover field and laboratory expenses. This work was financially supported by the Natural Sciences and Engineering Research Council of Canada, Québec-Océan, Fonds de Recherche Nature et Technologies du Québec, ArcticNet, The W. Garfield Weston Foundation, Takuvik and Amundsen Science.
Conflict of Interest
The authors declare that the research was conducted in the absence of any commercial or financial relationships that could be construed as a potential conflict of interest.
Publisher’s Note
All claims expressed in this article are solely those of the authors and do not necessarily represent those of their affiliated organizations, or those of the publisher, the editors and the reviewers. Any product that may be evaluated in this article, or claim that may be made by its manufacturer, is not guaranteed or endorsed by the publisher.
Acknowledgments
This work is a contribution to ArcticNet, a Network of Centres of Excellence Canada. Special thanks to the crew members of the CCGS Amundsen for the help on the field. Many thanks to Marie-Hélène Picard help in the laboratory and to Mariève Bouchard Marmen for providing bottom pictures for model validation.
Supplementary Material
The Supplementary Material for this article can be found online at: https://www.frontiersin.org/articles/10.3389/fmars.2022.898852/full#supplementary-material
References
AMAP (2017). Snow, Water, Ice and Permafrost in the Arctic (SWIPA): Climate Change and the Cryosphere (Oslo, Norway: Arctic Monitoring Assessment Programme (AMAP), 269 pp, ISBN: ISBN 978-282-7971-7101-7978.
Archambault P., Snelgrove P. V., Fisher J. A., Gagnon J.-M., Garbary D. J., Harvey M., et al. (2010). From Sea to Sea: Canada's Three Oceans of Biodiversity. PLos One 5, e12182. doi: 10.1371/journal.pone.0012182
Arnaud F., Bamber R. (1988). The Biology of Pycnogonida. Adv. Mar. Biol. 24, 1–96. doi: 10.1016/S0065-2881(08)60073-5
Arrigo K. R., van Dijken G., Pabi S. (2008). Impact of a Shrinking Arctic Ice Cover on Marine Primary Production. Geophys. Res. Lett. 35:L19603. doi: 10.1029/2008GL035028
Assis J., Tyberghein L., Bosch S., Verbruggen H., Serrão E. A., De Clerck O. (2018). Bio-ORACLE V2. 0: Extending Marine Data Layers for Bioclimatic Modelling. Global Ecol. Biogeo. 27, 277–284. doi: 10.1111/geb.12693
Bakken T., Kongsrud J. A., Oug E., Cochrane S. K., Moen T. L., Solbakken B. E. (2010). Polychaetes From Jan Mayen (Annelida, Polychaeta). Pol. Res. 29, 1–21. doi: 10.1111/j.1751-8369.2009.00132.x
Balsom A. L. (2003). Macroinfaunal Community Composition and Biomass, and Bacterial and Viral Abundances From the Gulf of Alaska to the Canadian Archipelago: A Biodiversity Study (University of Tennessee: Knoxville, Tennessee).
Bell L. E., Bluhm B. A., Iken K. (2016). Influence of Terrestrial Organic Matter in Marine Food Webs of the Beaufort Sea Shelf and Slope. Mar. Ecol. Prog. Ser. 550, 1–24. doi: 10.3354/meps11725
Bernard F. R. (1979). Bivalve Mollusks Of The Western Beaufort Sea (Los Angeles, CA, United States: Natural History Museum of Los Angeles County).
Bertrand Y., Pleijel F., Rouse G. W. (2006). Taxonomic Surrogacy in Biodiversity Assessments, and the Meaning of Linnaean Ranks. Systemat. Biodiv. 4, 149–159. doi: 10.1017/S1477200005001908
Bintanja R., Selten F. (2014). Future Increases in Arctic Precipitation Linked to Local Evaporation and Sea-Ice Retreat. Nature 509, 479–482. doi: 10.1038/nature13259
Blott S. J., Pye K. (2001). GRADISTAT: A Grain Size Distribution and Statistics Package for the Analysis of Unconsolidated Sediments. Earth Surf. Proc. Landform. 26, 1237–1248. doi: 10.1002/esp.261
Bluhm B., Ambrose W. G., Bergmann M., Clough L. M., Gebruk A. V., Hasemann C., et al. (2011). Diversity of the Arctic Deep-Sea Benthos. Mar. Biodiv. 41, 87–107. doi: 10.1007/s12526-010-0078-4
Bluhm B. A., Gradinger R. J. E. A. (2008). Regional Variability in Food Availability for Arctic Marine Mammals. Ecol App 18, S77–S96. doi: 10.1890/06-0562.1
Borja A., Franco J., Pérez V. (2000). A Marine Biotic Index to Establish the Ecological Quality of Soft-Bottom Benthos Within European Estuarine and Coastal Environments. Mar. pollut. Bull. 40, 1100–1114. doi: 10.1016/S0025-326X(00)00061-8
Bouchard Marmen M. (2016). Influence De La Présence Des Colonies D'oiseaux Migrateurs (Fulmarus Glacialis Et Uria Lomvia) Sur Les Assemblages Benthiques De La Région Du Détroit De Lancaster, Canada (Rimouski, Qc, Canada: Université du Québec à Rimouski).
Bouchard Marmen M., Kenchington E., Ardyna M., Archambault P. (2017). Influence of Seabird Colonies and Other Environmental Variables on Benthic Community Structure, Lancaster Sound Region, Canadian Arctic. J. Mar. Syst. 167, 105–117. doi: 10.1016/j.jmarsys.2016.11.021
Bring A., Shiklomanov A., Lammers R. B. (2017). Pan-Arctic River Discharge: Prioritizing Monitoring of Future Climate Change Hot Spots. Earth's. Future 5, 72–92. doi: 10.1002/2016EF000434
Brodie S. J., Thorson J. T., Carroll G., Hazen E. L., Bograd S., Haltuch M. A., et al. (2020). Trade-Offs in Covariate Selection for Species Distribution Models: A Methodological Comparison. Ecography 43, 11–24. doi: 10.1111/ecog.04707
Brown C. J., O'Connor M. I., Poloczanska E. S., Schoeman D. S., Buckley L. B., Burrows M. T., et al. (2016). Ecological and Methodological Drivers of Species’ Distribution and Phenology Responses to Climate Change. Global Change Biol. 22, 1548–1560. doi: 10.1111/gcb.13184
Brown K. A., Williams W. J., Carmack E. C., Fiske G., François R., McLennan D., et al. (2020). Geochemistry of Small Canadian Arctic Rivers With Diverse Geological and Hydrological Settings. J. Geophys. Res.: Biogeosci. 125, e2019JG005414. doi: 10.1111/gcb.13184
Bryazgin V. (1997). Diversity, Distribution and Ecology of Benthic Amphipods (Amphipoda, Gammaridea) in the Barents Sea Sublittoral. Pol. Pol. Res. 18, 89–106.
Byers S. C., Mills E. L., Stewart P. L. (1978). A Comparison of Methods of Determining Organic Carbon in Marine Sediments, With Suggestions for a Standard Method. Hydrobiologia 58, 43–47. doi: 10.1007/BF00018894
Carmack E. C. (2000). “The Arctic Ocean’s Freshwater Budget: Sources, Storage and Export,” in The Freshwater Budget of the Arctic Ocean (Dordrecht, Netherlands:Springer), 91–126.
Carmack E. C., Aagaard K., Swift J. H., MacDonald R. W., McLaughlin F. A., Jones E. P., et al. (1997). Changes in Temperature and Tracer Distributions Within the Arctic Ocean. Deep. Sea. Res. Part II.: Top. Stud. Oceanog. 44, 1487–1502. doi: 10.1016/S0967-0645(97)00056-8
Carmack E., McLaughlin F. (2011). Towards Recognition of Physical and Geochemical Change in Subarctic and Arctic Seas. Prog. Oceanog. 90, 90–104. doi: 10.1016/j.pocean.2011.02.007
Carrier-Belleau C., Drolet D., McKindsey C. W., Archambault P. (2021). Environmental Stressors, Complex Interactions and Marine Benthic Communities’ Responses. Sci. Rep. 11, 1–14. doi: 10.1038/s41598-021-83533-1
Chao A., Lee S.-M. (1992). Estimating the Number of Classes via Sample Coverage. J. Am. Stat. Assoc. 87, 210–217. doi: 10.1080/01621459.1992.10475194
Clarke A. (1990). “Temperature and Evolution: Southern Ocean Cooling and the Antarctic Marine Fauna,” in Antarctic Ecosystems: Ecological Change and Conservation. Eds. Kerry K. R., Hempel G. (Berlin, Heidelberg: Springer Berlin Heidelberg), 9–22.
Cooper L., McClelland J., Holmes R., Raymond P., Gibson J., Guay C., et al. (2008). Flow-Weighted Values of Runoff Tracers (δ18o, DOC, Ba, Alkalinity) From the Six Largest Arctic Rivers. Geophys. Res. Lett. 35, L18606. doi: 10.1029/2008GL035007
Cusson M., Archambault P., Aitken A. (2007). Biodiversity of Benthic Assemblages on the Arctic Continental Shelf: Historical Data From Canada. Mar. Ecol. Prog. Ser. 331, 291–304. doi: 10.3354/meps331291
Dale J. E., Aitken A. E., Gilbert R., Risk M. J. (1989). Macrofauna of Canadian Arctic Fjords. Mar. Geol. 85, 331–358. doi: 10.1016/0025-3227(89)90159-X
Dando P., Spiro B. (1993). Varying Nutritional Dependence of the Thyasirid Bivalves Thyasira Sarsi and T. Equalis on Chemoautotrophic Symbiotic Bacteria, Demonstrated by Isotope Ratios of Tissue Carbon and Shell Carbonate. Mar. Ecology-Prog. Ser. 92, 151–151. doi: 10.3354/meps092151
Darnis G., Robert D., Pomerleau C., Link H., Archambault P., Nelson R. J., et al. (2012). Current State and Trends in Canadian Arctic Marine Ecosystems: II. Heterotrophic Food Web, Pelagic-Benthic Coupling, and Biodiversity. Climat. Change 115, 179–205. doi: 10.1007/s10584-012-0483-8
Déry S. J., Hernández-Henríquez M. A., Burford J. E., Wood E. F. (2009). Observational Evidence of an Intensifying Hydrological Cycle in Northern Canada. Geophys. Res. Lett. 36, L13402. doi: 10.1029/2009GL038852
Deutsch C., Gruber N., Key R. M., Sarmiento J. L., Ganachaud A. (2001). Denitrification and N2 Fixation in the Pacific Ocean. Global Biogeochem. Cycle. 15, 483–506. doi: 10.1029/2000GB001291
Dufrêne M., Legendre P. (1997). Species Assemblages and Indicator Species: The Need for a Flexible Asymmetrical Approach. Ecol. Monogr. 67, 345–366. doi: 10.2307/2963459
Ekwurzel B., Schlosser P., Mortlock R. A., Fairbanks R. G., Swift J. H. (2001). River Runoff, Sea Ice Meltwater, and Pacific Water Distribution and Mean Residence Times in the Arctic Ocean. J. Geophys. Res.: Ocean. 106, 9075–9092. doi: 10.1029/1999JC000024
Eleftheriou A., McIntyre A. (2005). Methods for the Study of Marine Benthos. 3rd ed. (Oxford, UK: Blackwell Publishing).
Fabry V. J., Seibel B. A., Feely R. A., Orr J. C. (2008). Impacts of Ocean Acidification on Marine Fauna and Ecosystem Processes. ICES. J. Mar. Sci. 65, 414–432. doi: 10.1093/icesjms/fsn048
Forest A., Tremblay J.-É., Gratton Y., Martin J., Gagnon J., Darnis G., et al. (2011). Biogenic Carbon Flows Through the Planktonic Food Web of the Amundsen Gulf (Arctic Ocean): A Synthesis of Field Measurements and Inverse Modeling Analyses. Prog. Oceanog. 91, 410–436. doi: 10.1016/j.pocean.2011.05.002
Fredriksen R. (2018). Epibenthic Community Structure in Northeast Greenland and the Kitikmeot Sea in the Canadian Arctic Archipelago (Tromsø, Norway:UiT Norges arktiske universitet).
Gage J. D., Tyler P. A. (1991). Deep-Sea Biology: A Natural History of Organisms at the Deep-Sea Floor (Cambridge, UK:Cambridge University Press).
Gardiner K., Dick T. A. (2010). Arctic Cephalopod Distributions and Their Associated Predators. Pol. Res. 29, 209–227. doi: 10.1111/j.1751-8369.2010.00146.x
Gibson R., Atkinson R., Gordon J. (2005). Zonation of Deep Biota on Continental Margins. Oceanog. Mar. Biol.: An. Annu. Rev. 43, 211–278. doi: 10.1201/9781420037449-8
Goldsmit J., Archambault P., Chust G., Villarino E., Liu G., Lukovich J. V., et al. (2018). Projecting Present and Future Habitat Suitability of Ship-Mediated Aquatic Invasive Species in the Canadian Arctic. Biol. Invas. 20, 501–517. doi: 10.1007/s10530-017-1553-7
Goldsmit J., McKindsey C. W., Schlegel R. W., Stewart D. B., Archambault P., Howland K. L. (2020). What and Where? Predicting Invasion Hotspots in the Arctic Marine Realm. Global Change Biol. 26, 4752–4771. doi: 10.1111/gcb.15159
Gradinger R. (1995). Climate Change and Biological Oceanography of the Arctic Ocean. Philos. Trans. R. Soc. London. 352, 277–286. Series A: Physical and Engineering Sciences. doi: 10.1098/rsta.1995.0070
Granger J., Sigman D. M., Gagnon J., Tremblay J. E., Mucci A. (2018). On the Properties of the Arctic Halocline and Deep Water Masses of the Canada Basin From Nitrate Isotope Ratios. J. Geophys. Res.: Ocean. 123, 5443–5458. doi: 10.1029/2018JC014110
Gray J. S., Elliott M. (2009). Ecology of Marine Sediments: From Science to Management (Oxford, UK:Oxford University Press).
Grebmeier J. M. (2012). Shifting Patterns of Life in the Pacific Arctic and Sub-Arctic Seas. Annu. Rev. Mar. Sci. 4, 63–78. doi: 10.1146/annurev-marine-120710-100926
Grebmeier J. M., Barry J. P. (1991). The Influence of Oceanographic Processes on Pelagic-Benthic Coupling in Polar Regions: A Benthic Perspective. J. Mar. Syst. 2, 495–518. doi: 10.1016/0924-7963(91)90049-Z
Gruber N., Sarmiento J. L. (1997). Global Patterns of Marine Nitrogen Fixation and Denitrification. Global Biogeochem. Cycle. 11, 235–266. doi: 10.1029/97GB00077
Hernandez F. (2007). List of internal metrics for the MERSEA-GODAE Global Ocean: Specification for implementation. MERSEA IP report MERSEA-WP05-MERCA STR-0015-01C. doc.
Holmes R. M., Coe M. T., Fiske G. J., Gurtovaya T., McClelland J. W., Shiklomanov A. I., et al. (2012), 1–26. J. C. c., g. w. o. i. w. impacts, m. f. ecosystems, and societies.
Jones D. O., Bett B. J., Tyler P. A. (2007). Depth-Related Changes in the Arctic Epibenthic Megafaunal Assemblages of Kangerdlugssuaq, East Greenland. Mar. Biol. Res. 3, 191–204. doi: 10.1080/17451000701455287
Jones E., Swift J., Anderson L., Lipizer M., Civitarese G., Falkner K., et al. (2003). Tracing Pacific Water in the North Atlantic Ocean. J. Geophys. Res.: Ocean. 108, 13–10. doi: 10.1029/2001JC001141
Kędra M., Moritz C., Choy E. S., David C., Degen R., Duerksen S., et al. (2015). Status and Trends in the Structure of Arctic Benthic Food Webs. Pol. Res. 34, 23775. doi: 10.3402/polar.v34.23775
Kliem N., Greenberg D. A. (2003). Diagnostic Simulations of the Summer Circulation in the Canadian Arctic Archipelago. Atmosphere-ocean 41, 273–289. doi: 10.3137/ao.410402
Kokarev V., Vedenin A., Basin A., Azovsky A. (2017). Taxonomic and Functional Patterns of Macrobenthic Communities on a High-Arctic Shelf: A Case Study From the Laptev Sea. J. Sea. Res. 129, 61–69. doi: 10.1016/j.seares.2017.08.011
Kortsch S., Primicerio R., Beuchel F., Renaud P. E., Rodrigues J., Lønne O. J., et al. (2012). Climate-Driven Regime Shifts in Arctic Marine Benthos. Proc. Natl. Acad. Sci. 109, 14052–14057. doi: 10.1073/pnas.1207509109
Lansard B., Mucci A., Miller L. A., Macdonald R. W., Gratton Y. (2012). Seasonal Variability of Water Mass Distribution in the Southeastern Beaufort Sea Determined by Total Alkalinity and δ18o. J. Geophys. Res.: Ocean. 117, C03003. doi: 10.1029/2011JC007299
La Porta B., Tomassetti P., Lomiri S., Marzialetti S., Vani D., Penna M., et al. (2011). Ecology and Spatial Distribution of Selected Polychaete Species From the Italian Continental Shelf. Ital. J. Zool. 78, 290–303. doi: 10.1080/11250003.2011.588443
Legendre P., Gallagher E. (2001). Ecologically Meaningful Transformations for Ordination of Species Data. Oecologia 129, 271–280. doi: 10.1007/s004420100716
Levin L. A., Etter R. J., Rex M. A., Gooday A. J., Smith C. R., Pineda J., et al. (2001). Environmental Influences on Regional Deep-Sea Species Diversity 1. Annu. Rev. Ecol. Systemat. 32, 51–93. doi: 10.1146/annurev.ecolsys.32.081501.114002
Lewis K., Van Dijken G., Arrigo K. (2020). Changes in Phytoplankton Concentration Now Drive Increased Arctic Ocean Primary Production. Science 369, 198–202. doi: 10.1126/science.aay8380
Link H., Piepenburg D., Archambault P. (2013). Are Hotspots Always Hotspots? The Relationship Between Diversity, Resource and Ecosystem Functions in the Arctic. PLos One 8, e74077. doi: 10.1371/journal.pone.0074077
Mäkelä A., Witte U., Archambault P. (2017). Ice Algae Versus Phytoplankton: Resource Utilization by Arctic Deep Sea Macroinfauna Revealed Through Isotope Labelling Experiments. Mar. Ecol. Prog. Ser. 572, 1–18. doi: 10.3354/meps12157
Martynov A. V., Litvinova N. M. (2008). Deep-Water Ophiuroidea of the Northern Atlantic With Descriptions of Three New Species and Taxonomic Remarks on Certain Genera and Species. Mar. Biol. Res. 4, 76–111. doi: 10.1080/17451000701840066
McArthur M. A., Brooke B. P., Przeslawski R., Ryan D. A., Lucieer V. L., Nichol S., et al. (2010). On the Use of Abiotic Surrogates to Describe Marine Benthic Biodiversity. Estuar. Coast. Shelf. Sci. 88, 21–32. doi: 10.1016/j.ecss.2010.03.003
McClelland J. W., Déry S. J., Peterson B. J., Holmes R. M., Wood E. F. (2006). A Pan-Arctic Evaluation of Changes in River Discharge During the Latter Half of the 20th Century. Geophys. Res. Lett. 33, L06715. doi: 10.1029/2006GL025753
McFadden D. (1973). “Conditional Logit Analysis of Qualitative Choice Behavior,” in Frontiers in Econometrics. Ed. Zarembka P. (New York: Academic Press).
McHenry J., Steneck R. S., Brady D. C. (2017). Abiotic Proxies for Predictive Mapping of Nearshore Benthic Assemblages: Implications for Marine Spatial Planning. Ecol App 27, 603–618. doi: 10.1002/eap.1469
McLaughlin F., Carmack E., Ingram R., Williams W., Michel C. (2006). Oceanography of the Northwest Passage, Chapter 31. The Sea Vol 14: The Global Coastal Ocean, Interdisciplinary Regional Studies and Syntheses Robinson AR, Brink KH. (eds.), Harvard University Press, 1213–44.
McLaughlin F. A., Carmack E., O’Brien M., Arfeuille G., Barwell-Clarke J., Sutherland N., et al. (2009). Physical and Chemical Data From the Canadian Arctic Archipelago, August 23 to September. Can data report of Hydro Ocean sci 179, 1–140.
Meltofte H., Barry T., Berteaux D., Bültmann H., Christiansen J. S., Cook J. A., et al. (2013). Arctic Biodiversity Assesment. Synthesis (Akureyri, Iceland:Conservation of Arctic Flora and Fauna (CAFF).
Moritz C., Lévesque M., Gravel D., Vaz S., Archambault D., Archambault P. (2013). Modelling Spatial Distribution of Epibenthic Communities in the Gulf of St. Lawrence (Canada)J. Sea Res 78, 75–84. doi: 10.1016/j.seares.2012.10.009
Naidu A., Scalan R., Feder H., Goering J., Hameedi M., Parker P., et al. (1993). Stable Organic Carbon Isotopes in Sediments of the North Bering-South Chukchi Seas, Alaskan-Soviet Arctic Shelf. Cont Shelf Res 13, 669–691. doi: 10.1016/0278-4343(93)90099-J
Niemi G. J., McDonald M. E. (2004). Application of Ecological Indicators. Annu. Rev. Ecol. Evol. Systemat. 35, 89–111. doi: 10.1146/annurev.ecolsys.35.112202.130132
Ohnheiser L. T., Malaquias M. (2013). Systematic Revision of the Gastropod Family Philinidae (Mollusca: Cephalaspidea) in the North-East Atlantic Ocean With Emphasis on the Scandinavian Peninsula. Zool. J. Linn. Soc. 167, 273–326. doi: 10.1111/zoj.12000
Oksanen J., Blanchet F. G., Kindt R., Legendre P., Minchin P. R., O’hara R., et al. (2018). Package ‘vegan’. Community ecology package, version 2.
Olivier F., Gaillard B., Thébault J., Meziane T., Tremblay R., Dumont D., et al. (2020). Shells of the Bivalve Astarte Moerchi Give New Evidence of a Strong Pelagic-Benthic Coupling Shift Occurring Since the Late 1970s in the North Water Polynya. Philos. Trans. R. Soc. A. 378, 20190353. doi: 10.1098/rsta.2019.0353
Olsen G. H., Carroll M. L., Renaud P. E., Ambrose W. G., Olssøn R., Carroll J. (2007). Benthic Community Response to Petroleum-Associated Components in Arctic Versus Temperate Marine Sediments. Mar. Biol. 151, 2167–2176. doi: 10.1007/s00227-007-0650-z
Opsahl S., Benner R., Amon R. M. (1999). Major Flux of Terrigenous Dissolved Organic Matter Through the Arctic Ocean. Limnol. Oceanog. 44, 2017–2023. doi: 10.4319/lo.1999.44.8.2017
Payer D. C., Josefson A. B., Fjeldså J. (2013). “Species Diversity in the Arctic,” in Arctic Biodiversity Assessment (Akureyri, Iceland:CAFF International Secretariat).
Peterson B. J., Holmes R. M., McClelland J. W., Vörösmarty C. J., Lammers R. B., Shiklomanov A. I., et al. (2002). Increasing River Discharge to the Arctic Ocean. science 298, 2171–2173. doi: 10.1126/science.1077445
Piepenburg D. (2000). Arctic Brittle Stars (Echinodermata: Ophiuroidea). Oceanography Marine Biology Annual Review 38, 189–256.Gibson R. N., Barnes M. (Taylor ∧ Francis:New York, NY, United States)
Piepenburg D., Ambrose W. G. Jr., Brandt A., Renaud P. E., Ahrens M. J., Jensen P. (1997). Benthic Ccommunity Patterns Reflect Water Column Processes in the Northeast Water Polynya| (Greenland). J. Mar. Syst. 10, 467–482. doi: 10.1016/S0924-7963(96)00050-4
Piepenburg D., Archambault P., Ambrose W. G., Blanchard A. L., Bluhm B. A., Carroll M. L., et al. (2011). Towards a Pan-Arctic Inventory of the Species Diversity of the Macro-and Megabenthic Fauna of the Arctic Shelf Seas. Mar. Biodiv. 41, 51–70. doi: 10.1007/s12526-010-0059-7
Pierrejean M., Babb D. G., Maps F., Nozais C., Archambault P. (2020). Spatial Distribution of Epifaunal Communities in the Hudson Bay System : Patterns and Drivers. Elem Sci Anth 8. doi: 10.1525/elementa.00044
Polyakov I. V., Alkire M. B., Bluhm B. A., Brown K. A., Carmack E. C., Chierici M., et al. (2020). Borealization of the Arctic Ocean in Response to Anomalous Advection From Sub-Arctic Seas. Front. Mar. Sci 7. doi: 10.3389/fmars.2020.00491
Prowse T., Bring A., Mård J., Carmack E. (2015). Arctic Freshwater Synthesis: Introduction. J. Geophys. Res.: Biogeosci. 120, 2121–2131. doi: 10.1002/2015JG003127
R Core Team (2020). R: A Language and Environment for Statistical Computing. (The R Foundation for Statistical Computing:Vienna, Austria)
Riaux-Gobin C., Klein B. (1993). “Microphytobenthic Biomass Measurement Using HPLC and Conventional Pigment Analysis,” in Handbook of Methods in Aquatic Microbial Ecology, 369–376. CRC Press (Taylor ∧ Francis Group):Boca Raton, Florida, United-States.
Różycki O. (1992). Occurrence of Gastropoda and Bivalvia in Hornsund Fiord (West Spitsbergen, Svalbard). Pol. Pol. Res. 13, 41–52.
Rosenzweig M. L. (1995). Species Diversity in Space and Time (Cambridge, UK:Cambridge University Press).
Rotermund L. M., Williams W. J., Klymak J. M., Wu Y., Scharien R. K., Haas C. (2021). The Effect of Sea Ice on Tidal Propagation in the Kitikmeot Sea, Canadian Arctic Archipelago. J. Geophys. Res.: Ocean. 126, e2020JC016786. doi: 10.1029/2020JC016786
Roy V., Iken K., Archambault P. (2014). Environmental Drivers of the Canadian Arctic Megabenthic Communities. PLos One 9, e100900. doi: 10.1371/journal.pone.0100900
Roy V., Iken K., Archambault P. (2015a). Regional Variability of Megabenthic Community Structure Across the Canadian Arctic. Arctic 68, 180–192. doi: 10.14430/arctic4486
Roy V., Iken K., Gosselin M., Tremblay J., Bélanger S., Archambault P. (2015b). Benthic Food-Web Responses to Marine Biological Productivity and Depth Across the Canadian Arctic. Deep-Sea. Res. Part I. 102, 55–71. doi: 10.1016/j.dsr.2015.04.009
Saeedi H., Basher Z., Costello M. J. (2017). Modelling Present and Future Global Distributions of Razor Clams (Bivalvia: Solenidae). Helgol Mar Res 70, 23. doi: 10.1186/s10152-016-0477-4
Schell D. (1983). Carbon-13 and Carbon-14 Abundances in Alaskan Aquatic Organisms: Delayed Production From Peat in Arctic Food Webs. Science 219, 1068–1071. doi: 10.1126/science.219.4588.1068
Schmid M. K., Piepenburg D., Golikov A. A., Von Juterzenka K., Petryashov V. V., Spindler M. (2006). Trophic Pathways and Carbon Flux Patterns in the Laptev Sea. Prog. Oceanog. 71, 314–330. doi: 10.1016/j.pocean.2006.09.002
Schonberg S. V., Clarke J. T., Dunton K. H. (2014). Distribution, Abundance, Biomass and Diversity of Benthic Infauna in the Northeast Chukchi Sea, Alaska: Relation to Environmental Variables and Marine Mammals. Deep. Sea. Res. Part II.: Top. Stud. Oceanog. 102, 144–163. doi: 10.1016/j.dsr2.2013.11.004
Shea J. R., Percy J. A. (1990). Salinity Tolerance and Osmoregulation of the Arctic Marine Amphipods Onisimus Litoralis (Kroyer) and Anonyx Nugax (Phipps). Pol. Biol. 10, 275–281. doi: 10.1007/BF00238426
Shimada K., Kamoshida T., Itoh M., Nishino S., Carmack E., McLaughlin F., et al. (2006). Pacific Ocean Inflow: Influence on Catastrophic Reduction of Sea Ice Cover in the Arctic Ocean. Geophys. Res. Lett. 33, L08605. doi: 10.1029/2005GL025624
Smith C. R., De Leo F. C., Bernardino A. F., Sweetman A. K., Arbizu P. M. (2008). Abyssal Food Limitation, Ecosystem Structure and Climate Change. Trends Ecol. Evol. 23, 518–528. doi: 10.1016/j.tree.2008.05.002
Smoliansky V., Thoman R., Gascon G. (2018). “May 2018 - September 2018 Arctic Summer Seasonal Review,” in PARCOF-2 Consensus (Geneva, Switzerland:World Meteorological Organization).
Soltwedel T., Jaeckisch N., Ritter N., Hasemann C., Bergmann M., Klages M. (2009). Bathymetric Patterns of Megafaunal Assemblages From the Arctic Deep-Sea Observatory HAUSGARTEN. Deep. Sea. Res. Part I.: Oceanog. Res. Pap. 56, 1856–1872. doi: 10.1016/j.dsr.2009.05.012
Stroeve J., Notz D. (2018). Changing State of Arctic Sea Ice Across All Seasons. Environ. Res. Lett. 13, 103001. doi: 10.1088/1748-9326/aade56
Tremblay J.-É., Anderson L. G., Matrai P., Coupel P., Bélanger S., Michel C., et al. (2015). Global and Regional Drivers of Nutrient Supply, Primary Production and CO2 Drawdown in the Changing Arctic Ocean. Prog. Oceanog. 139, 171–196. doi: 10.1016/j.pocean.2015.08.009
Tyberghein L., Verbruggen H., Pauly K., Troupin C., Mineur F., De Clerck O. (2012). Bio-ORACLE: A Global Environmental Dataset for Marine Species Distribution Modelling. Global Ecol. Biogeog. 21, 272–281. doi: 10.1111/j.1466-8238.2011.00656.x
Vallières C., Retamal L., Ramlal P., Osburn C. L., Vincent W. F. (2008). Bacterial Production and Microbial Food Web Structure in a Large Arctic River and the Coastal Arctic Ocean. J. Mar. Syst. 74, 756–773. doi: 10.1016/j.jmarsys.2007.12.002
Verling E., Blyth-Skyrme V. (2007). Integration of Infaunal and Epifaunal Data in Habitat. (MESH report:Peterborough, UK).
Waga H., Hirawake T., Grebmeier J. M. (2020). Recent Change in Benthic Macrofaunal Community Composition in Relation to Physical Forcing in the Pacific Arctic. Pol. Biol. 43, 285–294. doi: 10.1007/s00300-020-02632-3
Wassmann P., Bauerfeind E., Fortier M., Fukuchi M., Hargrave B., Honjo S., et al. (2004). “Particulate Organic Carbon Flux to the Sea Floor,” in The Organic Carbon Cycle in the Arctic Ocean (New York: Springer-Verlag), 101–138.
Wassmann P., Reigstad M. (2011). Future Arctic Ocean Seasonal Ice Zones and Implications for Pelagic-Benthic Coupling. Oceanog. 24, 220–231. doi: 10.5670/oceanog.2011.74
Wei C. L., Cusson M., Archambault P., Belley R., Brown T., Burd B. J., et al. (2020). Seafloor biodiversity of Canada's three oceans: Patterns, hotspots and potential drivers. Divers. Distrib 26 (2), 226–41. doi: 10.1111/ddi.13013
Wheeler P. A., Gosselin M., Sherr E., Thibaultc D., Kirchman D. L., Benner R., et al. (1996). Active Cycling of Organic Carbon in the Central Arctic Ocean. Nature 380, 697. doi: 10.1038/380697a0
Williams W., Brown K., Bluhm B., Carmack E., Dalman L., Danielson S., et al. (2019). Stratification in the Canadian Arctic Archipelago’s Kitikmeot Sea: Biological and Geochemical Consequences. Pol. Knowledge.: Aqhaliat. Rep. 1, 46–52. doi: 10.35298/pkc.2018.06
Witman J. D., Cusson M., Archambault P., Pershing A. J., Mieszkowska N. (2008). The Relation Between Productivity and Species Diversity in Temperate-Arctic Marine Ecosystems. Ecology 89, 66–80. doi: 10.1890/07-1201.1
Wood J. B. (2000). The Natural History of Bathypolypus Arcticus (Prosch), a Deep-Sea Octopus.(Dalhousie University, Halifax, Nova Scotia, Canada)
Woodgate R. (2013). Arctic Ocean Circulation: Going Around at the Top of the World. Nat. Educ. Knowledge. 4, 8.
Woodgate R. A. (2018). Increases in the Pacific Inflow to the Arctic From 1990 to 2015, and Insights Into Seasonal Trends and Driving Mechanisms From Year-Round Bering Strait Mooring Data. Prog. Oceanog. 160, 124–154. doi: 10.1016/j.pocean.2017.12.007
Woodgate R. A., Weingartner T., Lindsay R. (2010). The 2007 Bering Strait Oceanic Heat Flux and Anomalous Arctic Sea-Ice Retreat. Geophys. Res. Lett. 37, L01602. doi: 10.1029/2009GL041621
Yamamoto-Kawai M., Carmack E., McLaughlin F. (2006). Nitrogen Balance and Arctic Throughflow. Nature 443, 43. doi: 10.1038/443043a
Yamamoto-Kawai M., McLaughlin F., Carmack E., Nishino S., Shimada K. (2008). Freshwater Budget of the Canada Basin, Arctic Ocean, From Salinity, δ18o, and Nutrients. J. Geophys. Res.: Ocean. 113, C01007. doi: 10.1029/2006JC003858
Keywords: benthos, modelling, Canadian archipelago, environmental drivers, epifauna, infauna
Citation: Dumais P-O, Grant C, Bluhm BA, De Montety L, de Coeli LT, Tremblay J-É and Archambault P (2022) Description and Spatial Modelling of Benthic Communities Distribution in the Canadian Arctic Archipelago. Front. Mar. Sci. 9:898852. doi: 10.3389/fmars.2022.898852
Received: 17 March 2022; Accepted: 27 May 2022;
Published: 29 June 2022.
Edited by:
Bernardo Antonio Perez Da Gama, Fluminense Federal University, BrazilReviewed by:
Samuel Georgian, Marine Conservation Institute, United StatesOwen Anderson, National Institute of Water and Atmospheric Research (NIWA), New Zealand
Copyright © 2022 Dumais, Grant, Bluhm, De Montety, de Coeli, Tremblay and Archambault. This is an open-access article distributed under the terms of the Creative Commons Attribution License (CC BY). The use, distribution or reproduction in other forums is permitted, provided the original author(s) and the copyright owner(s) are credited and that the original publication in this journal is cited, in accordance with accepted academic practice. No use, distribution or reproduction is permitted which does not comply with these terms.
*Correspondence: Philippe Archambault, cGhpbGlwcGUuYXJjaGFtYmF1bHRAYmlvLnVsYXZhbC5jYQ==