 Xiao Ma1,2
 Anqi Liu1,3
 Qiang Zhao1,4
 Bin Wang1,5
 Di Tian1,2
 Qicheng Meng1,2Dingyong Zeng1,2Jia Li1,2
 Daji Huang1,6
 Feng Zhou1,2,3,7*
- 1State Key Laboratory of Satellite Ocean Environment Dynamics, Second Institute of Oceanography, Ministry of Natural Resources, Hangzhou, China
- 2Observation and Research Station of Yangtze River Delta Marine Ecosystems, Ministry of Natural Resources, Zhoushan, China
- 3College of Oceanography, Hohai University, Nanjing, China
- 4Ningbo Marine Environment Monitoring Center Station, Ministry of Natural Resources, Ningbo, China
- 5Key Laboratory of Marine Ecosystem Dynamics, Second Institute of Oceanography, Ministry of Natural Resources, Hangzhou, China
- 6Fourth Institute of Oceanography, Ministry of Natural Resources, Beihai, China
- 7School of Oceanography, Shanghai Jiao Tong University, Shanghai, China
Temporal variation of summer hypoxia, along a repeated hydrographic section from the Changjiang River mouth to Cheju Island, is investigated using cruise data during 1997–2014. The climatological mean of dissolved oxygen (DO) presents a “dual-core structure” below the oxycline, associated with two hypoxic centers near the river mouth and offshore of the Changjiang Bank, respectively. The DO value is highly variable from year to year, with dramatic interannual variation but an insignificant linear trend during 1997–2014. Composite analysis indicates that the interannual variation of DO and associated hypoxia events are strongly affected by the El Niño–Southern Oscillation (ENSO) cycle. In the El Niño decaying summer, large river discharge and relatively strong stratification, combined with calm climatic and hydrographic conditions, enhance DO depletion off the Changjiang Estuary. It is likely that El Niño is not a prerequisite for hypoxia occurrences. However, El Niño did enhance bottom hypoxia probability off the Changjiang Estuary during 1997–2014.
1 Introduction
Seasonal bottom hypoxia is a common occurrence in many types of coastal areas (fjords, basins, and shelf regions) worldwide (e.g., Diaz, 2001; Middelburg and Levin, 2009), and can greatly damage marine life and aquatic ecosystems (Diaz and Rosenberg, 2008; Ning et al., 2011). Bottom hypoxic conditions may reduce marine benthic biodiversity (Diaz and Rosenberg, 1995), render coastal ecosystems less resilient (Baird et al., 2004), alter nutrient biogeochemical cycles (Testa and Kemp, 2012; Wright et al., 2012), and enhance coastal acidification (Cai et al., 2011). There is a rapid increase in the frequency, extent, intensity, and duration of coastal hypoxia around the world. A recent survey revealed that the number of coastal sites reporting hypoxia has increased by 5.5% per year during the 1970s (Vaquer-Sunyer and Duarte, 2008). Until 2019, coastal hypoxia sites were estimated at around 700 worldwide (Diaz et al., 2019), which is usually attributed to anthropogenic nutrient loading and ocean warming (Diaz and Rosenberg, 2008; Breitburg et al., 2018; Fennel and Testa, 2019).
The Changjiang Estuary, along with the adjacent East China Sea (ECS), is one of the most significant seasonal hypoxic zones in the world. Hypoxia in this area was first reported in the late 1950s (Office of Integrated Oceanographic Survey of China, 1961); and it has received increased attention due to its extended spatial coverage and related ecological disasters in the past two decades (Li et al., 2002; Chen et al., 2007; Wei et al., 2007). Previous studies showed that hypoxia often forms in late-spring, intensifies during mid-summer or early-autumn, and decays in mid-autumn; and it is mostly centered around (123°E, 31°N) (Wang, 2009; Zhou et al., 2010; Wang et al., 2012). In the meantime, it was found that the hypoxic zone off the Changjiang Estuary shows large spatial–temporal variation and is thought to be modulated by complex physical–biogeochemical processes (Zhou et al., 2009; 2020; Zhu et al., 2011). The physical factors associated with hypoxia include bottom water residence time (Rabouille et al., 2008), bottom topography (Wang, 2009), stratification (Zhou et al., 2010; Zhu et al., 2016), typhoon activity (Ni et al., 2016), and coastal upwelling (Wei et al., 2017). Besides, anthropogenic-driven eutrophication (Zhu et al., 2011; Wang et al., 2016) and Kuroshio-intruded low dissolved oxygen (DO) water (Qian et al., 2017; Tian et al., 2022) should not be ignored.
Based on the cruise observations during 1998–2015, summer hypoxia events frequently happened off the Changjiang Estuary, with 12 hypoxia events over the 18 years (Figure 1 and Table S1). Despite area differences in cruise plans, statistical results indicate that the coastal hypoxia center is situated near (122.5°E, 31.5°N), which agrees with previous work, such as Wang (2009). The hypoxia area is highly affected by coastal topography and seasonal currents off the Changjiang Estuary. As shown in Figure 1, the western edge of the coastal hypoxic area is along the surface-suspended sediment front near the Changjiang River mouth (Li et al., 2021, and the eastern edge is along the 40-m isobath in the Changjiang Bank.
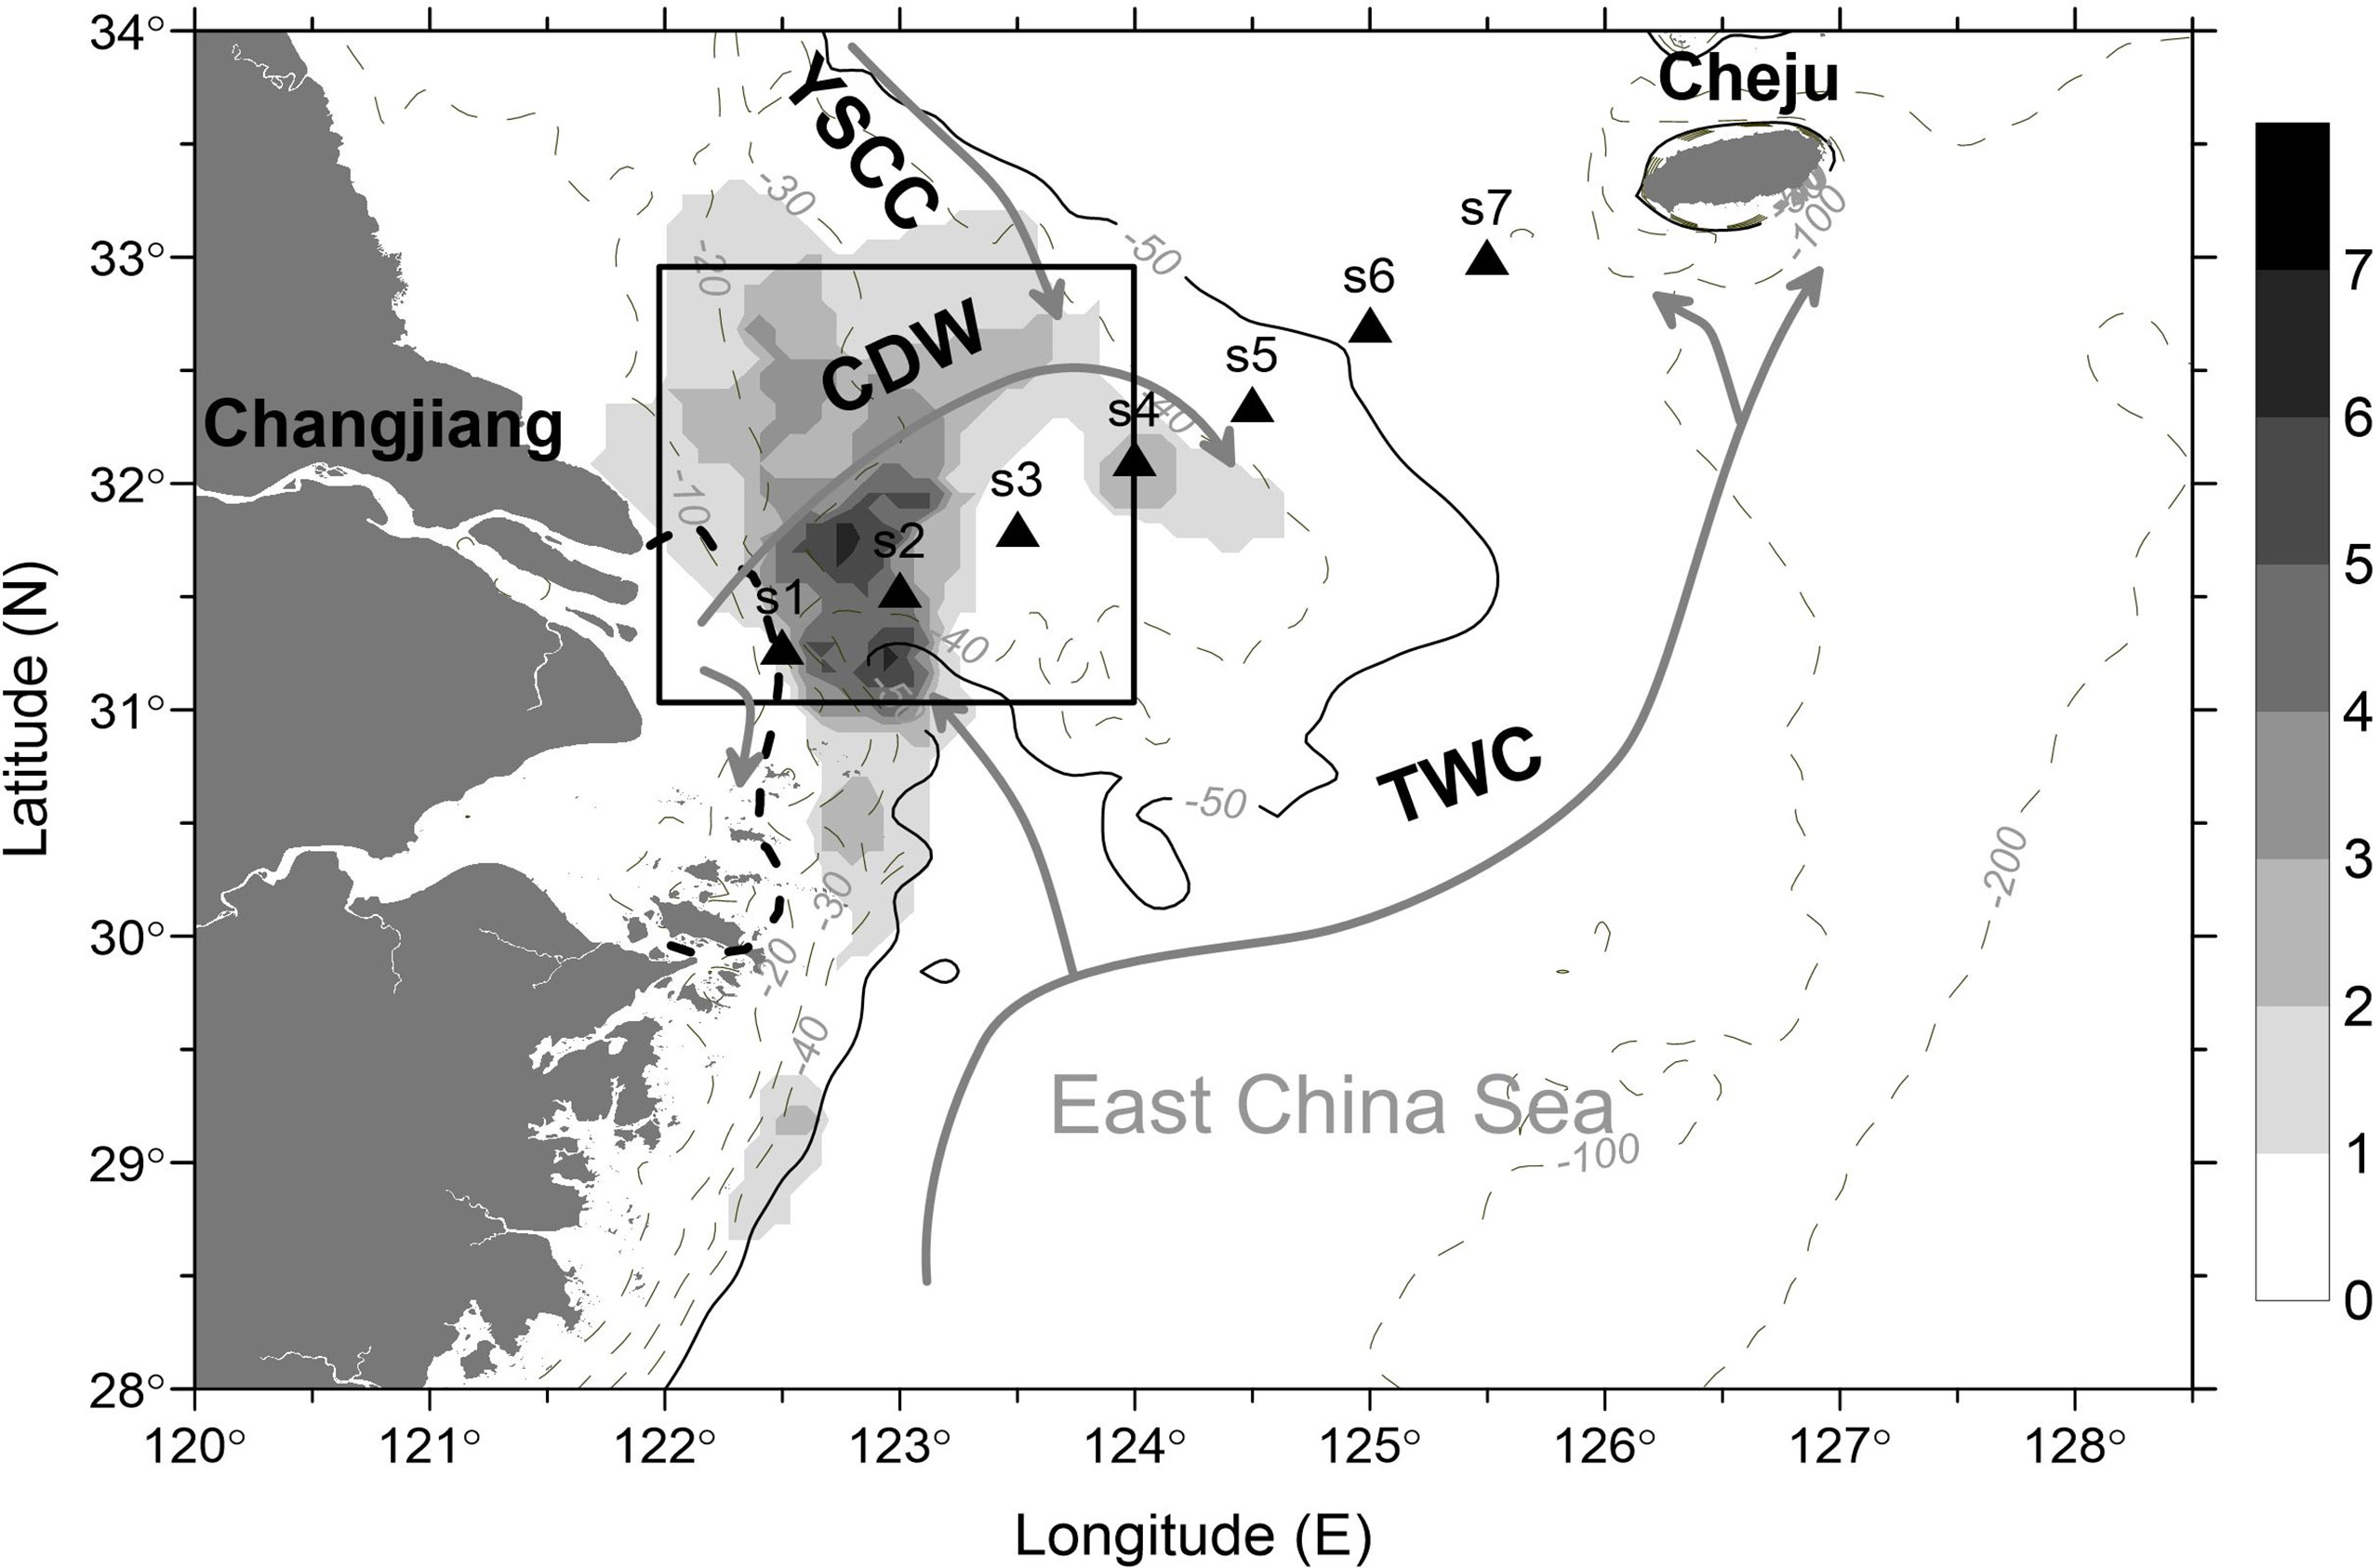
Figure 1 Topography (thin contour), reported hypoxia areas (1998–2015; shading, see details in Table S1), and schematic of the summer circulation (thick solid lines) off the Changjiang Estuary. The black triangles indicate sampling stations along Section C-C during 1997–2014. The dashed black curve indicates the surface suspended sediment front near the Changjiang River mouth (redrawn according to Li et al., 2021). The solid black box indicates the area used for the domain average for the climatic and hydrographic factors listed in Table 2. The arrows indicate the CDW, Changjiang Diluted Water; YSCC, Yellow Sea Coastal Current; TWC, Taiwan Warm Current.
There are two consensus on the summer hypoxia off the Changjiang Estuary. First, large-scale hypoxia occurred frequently during the last two decades due to enhanced input of organic matter from the surface phytoplankton blooms (Chen et al., 2020; Wang et al., 2021). Second, seasonal hypoxia is sporadic and patchy with large interannual variations in extent, severity, and duration under distinct climatic and hydrographic conditions (Zhou et al., 2010; Zhang et al., 2018; Zhang et al., 2020). Compared with other well-known hypoxia areas worldwide, such as the Gulf of Mexico (Turner and Rabalais, 1994), the Chesapeake Bay (Hagy et al., 2004), the Baltic Sea (Carstensen et al., 2014), and the northern Adriatic Sea (Alvisi and Cozzi, 2016), studies on interannual DO variation associated with bottom hypoxia off the Changjiang Estuary are limited (Chen et al., 2020; Zhang et al., 2020; Wang et al., 2021). Some reports showed the deoxygenation process happened in typical transects after the 1950s off the Changjiang Estuary (such as 32°E; Ning et al., 2011). However, based on historical extensive observations, the hypoxia extent and DO minimum value are highly dynamic and episodic, with no significant trends after 1998 (Chen et al., 2020). A systematic study about the interannual variation of hypoxia off the Changjiang Estuary has not been possible due to a lack of continuous and repeated observations.
The El Niño–Southern Oscillation (ENSO), the strongest interannual air–sea signal in low latitudes, can impact hydrographical conditions in the ECS through modification of monsoon and precipitation (Zhou and Yu, 2005), sea surface temperature (SST) (Park et al., 2011), Changjiang Diluted Water (CDW) dispersion (Siswanto et al., 2018), and chlorophyll-a distribution (He et al., 2013; Park et al., 2015). As a result, ENSO is likely to have an indirect effect on the hypoxia in the ECS. Until now, several studies have discussed the response of hypoxic conditions to the ENSO cycle (Chen et al., 2017; Wang et al., 2021). Chen et al. (2017) suggested that ECS coastal Chlorophyll-a and the occurrence of hypoxic conditions in August co-vary weakly with ENSO. Wang et al. (2021) highlighted that the warm phase of ENSO (El Niño) can provide favorable hydrographic conditions for coastal hypoxia off the Changjiang Estuary. However, these studies lacked specific and direct analysis between hypoxia intensity and the ENSO cycle.
This study examines the hydrographic data along a repeated section from the Changjiang Estuary to Cheju Island (hereinafter Section C-C) and focuses on the interannual variations of DO and associated coastal hypoxia. Section C-C is unique for monitoring coastal hypoxia because it crosses the statistical hypoxia center in the literature and spans the hypoxia extent from the river mouth to the offshore region (Figure 1). We mainly discuss two questions in this paper. First, based on repeated hydrographic observations, we evaluate whether the coastal hypoxia has become quite severe off the Changjiang Estuary. Second, we investigate the interannual variations of DO and discuss the ENSO effect on climatic and hydrographic features and the occurrence of summer hypoxia.
2 Data and Methods
2.1 Cruise Data
Section C-C is located in the northeast of the Changjiang Estuary. As shown in Figure 1, the summer hydrographic features on the western side of the section are strongly influenced by the northeastward extension of the CDW and northward intrusion of the TWC (Zou et al., 2001; Wei et al., 2015). The central shore is the main exchange area of the YSCC from the Yellow Sea to the ECS (Liu et al., 2021). The east side of the section is at the southern edge of the Yellow Sea Cold Water and near the ECS cold eddy (Hu, 1994; Wei et al., 2013). The bottom topography of the study region includes the shallow Changjiang Estuary (station S1), the wide-range Changjiang Bank (stations S2–S5), and the sharp ECS continental slope (stations S6–S7).
The repeated hydrographic data along Section C-C are observed by the Ningbo Marine Environment Monitoring Center, Ministry of Natural Resources (MNR) (Figure 1). The hydrographic data, namely, temperature, salinity, and DO, were collected semi-annually before 2009 and seasonally after 2010. The stations span an area from 122.5°E to 125.5°E with an interval of ~55 km. The temperature and salinity are measured using a Sea Bird model 911 conductivity–temperature depth (CTD) recorder, and DO is measured on board the vessels immediately after collection using a conventional Winkler titration method (Grasshoff et al., 1999). Water samples are collected at the surface; at depths of 5, 10, 15, 20, 25, 30, 50, and 75 m; and at the bottom (3 m above the sediment) using Niskin bottles. Summer hydrographic data collected from 1997 to 2014 were used in this study. Additionally, apparent oxygen usage (AOU = [O2]eq − [O2], where [O2]eq is the DO solubility at equilibrium with the atmosphere, and [O2] is the in situ DO concentration) is obtained. According to the DO threshold definition in most previous studies, hypoxia status occurs when the DO value is less than 2 mg/L and low-DO status occurs when the DO value is less than 3 mg/L (Diaz, 2001; Zhu et al., 2011).
The repeated hydrographic data along Section C-C used in this study is part of the sectional hydrographic monitoring project in the Chinese marginal seas. Details about the cruise information can be found in Table S2. The data were quality controlled by the Ningbo Marine Environment Monitoring Center and are widely used in the ECS data assimilation (Zhao et al., 2015).
2.2 Climatic Data
To quantitatively describe the climatic and hydrographic conditions for hypoxia occurrence off the Changjiang Estuary, we use an ensemble of remote sensing and in-situ observed products, namely, SST, sea-surface wind, and land-based precipitation.
The NOAA 1/4° daily Optimum Interpolation Sea Surface Temperature (or daily OISST) is an analysis constructed by combining observations from different platforms (satellites, ships, and buoys) on a regular global grid (Huang et al., 2021). The monthly mean land-based precipitation is from the Climatic Research Unit (CRU) TS data (version 4). The spatial resolution is 0.5° by 0.5°, and the temporal range is from 1997 to 2014 (Harris et al., 2020). The cross-calibrated multiplatform (CCMP) wind product that covers the global ocean at 1/4° resolution from 1997 to 2014 (Atlas et al., 2011) is used here to illustrate the wind variation. The dataset combines all available satellite surface wind observations with conventional ship and buoy data via an enhanced variational analysis method.
These three climatic data have been widely applied to the ECS to detect seasonal and interannual signals such as marine hot waves (Yan et al., 2020), total rainfall accumulation (Zhou et al., 2008), and the summer monsoon (Sun and Yan, 2012).
2.3 ENSO Index
The Oceanic Niño Index (ONI), which is the de-facto standard for identifying El Niño and La Niña events in the tropical Pacific, is used in this paper. It is the 3-month running mean SST anomaly for the Niño 3.4 region (i.e., 120°–170°W, 5°N–5°S). Events are defined as consecutive overlapping 3-month periods at or above the +0.5°C anomaly for warm (El Niño) events and at or below the −0.5°C anomaly for cold (La Niña) events. During the period of 1997–2014, there were five El Niño events (97/98, 02/03, 04/05, 06/07, and 09/10) and eight La Niña events (98/99, 99/00, 00/01, 05/06, 07/08, 08/09, 10/11, and 11/12).
2.4 Statistical Methods
The correlation analysis is used to evaluate the ENSO effect on coastal hypoxia and related hydrographic and climatic conditions off the Changjiang Estuary. The correlation is significant at a 95% confidence level if not specified.
The linear trend of hydrographic and chemical parameters (such as temperature, salinity, and DO) during the period is calculated based on the least squares formula (Wilks, 1995). A linear trend is significant when it passes the Student’s t-test at a 95% confidence level.
3 Results
3.1 Hydrographic Features Along Section C-C
The climatological mean fields of temperature (T), salinity (S), and seawater density are shown in Figures 2A–C. The warm and low-salinity CDW (S <30, Su et al., 1996) is extended eastward from the river mouth to 125.5°E, with a mean water mass thickness of 10 m. The CDW breaks off at station S3 in association with the northeastward-southeastward diversion of the CDW offshore spreading. The thermocline beneath the CDW slopes downward to the east from 10 to 20 m along Section C-C. Two key water masses, the TWC and ECS cold eddy, occupy the bottom layer. The downwelling process can be detected near 123.5°E, which sinks the cold and DO-rich surface water into the subsurface layer. The pattern of density distribution is similar to that of salinity distribution, indicating the important role of salinity in the density pattern off the Changjiang Estuary (Zhu et al., 2016).
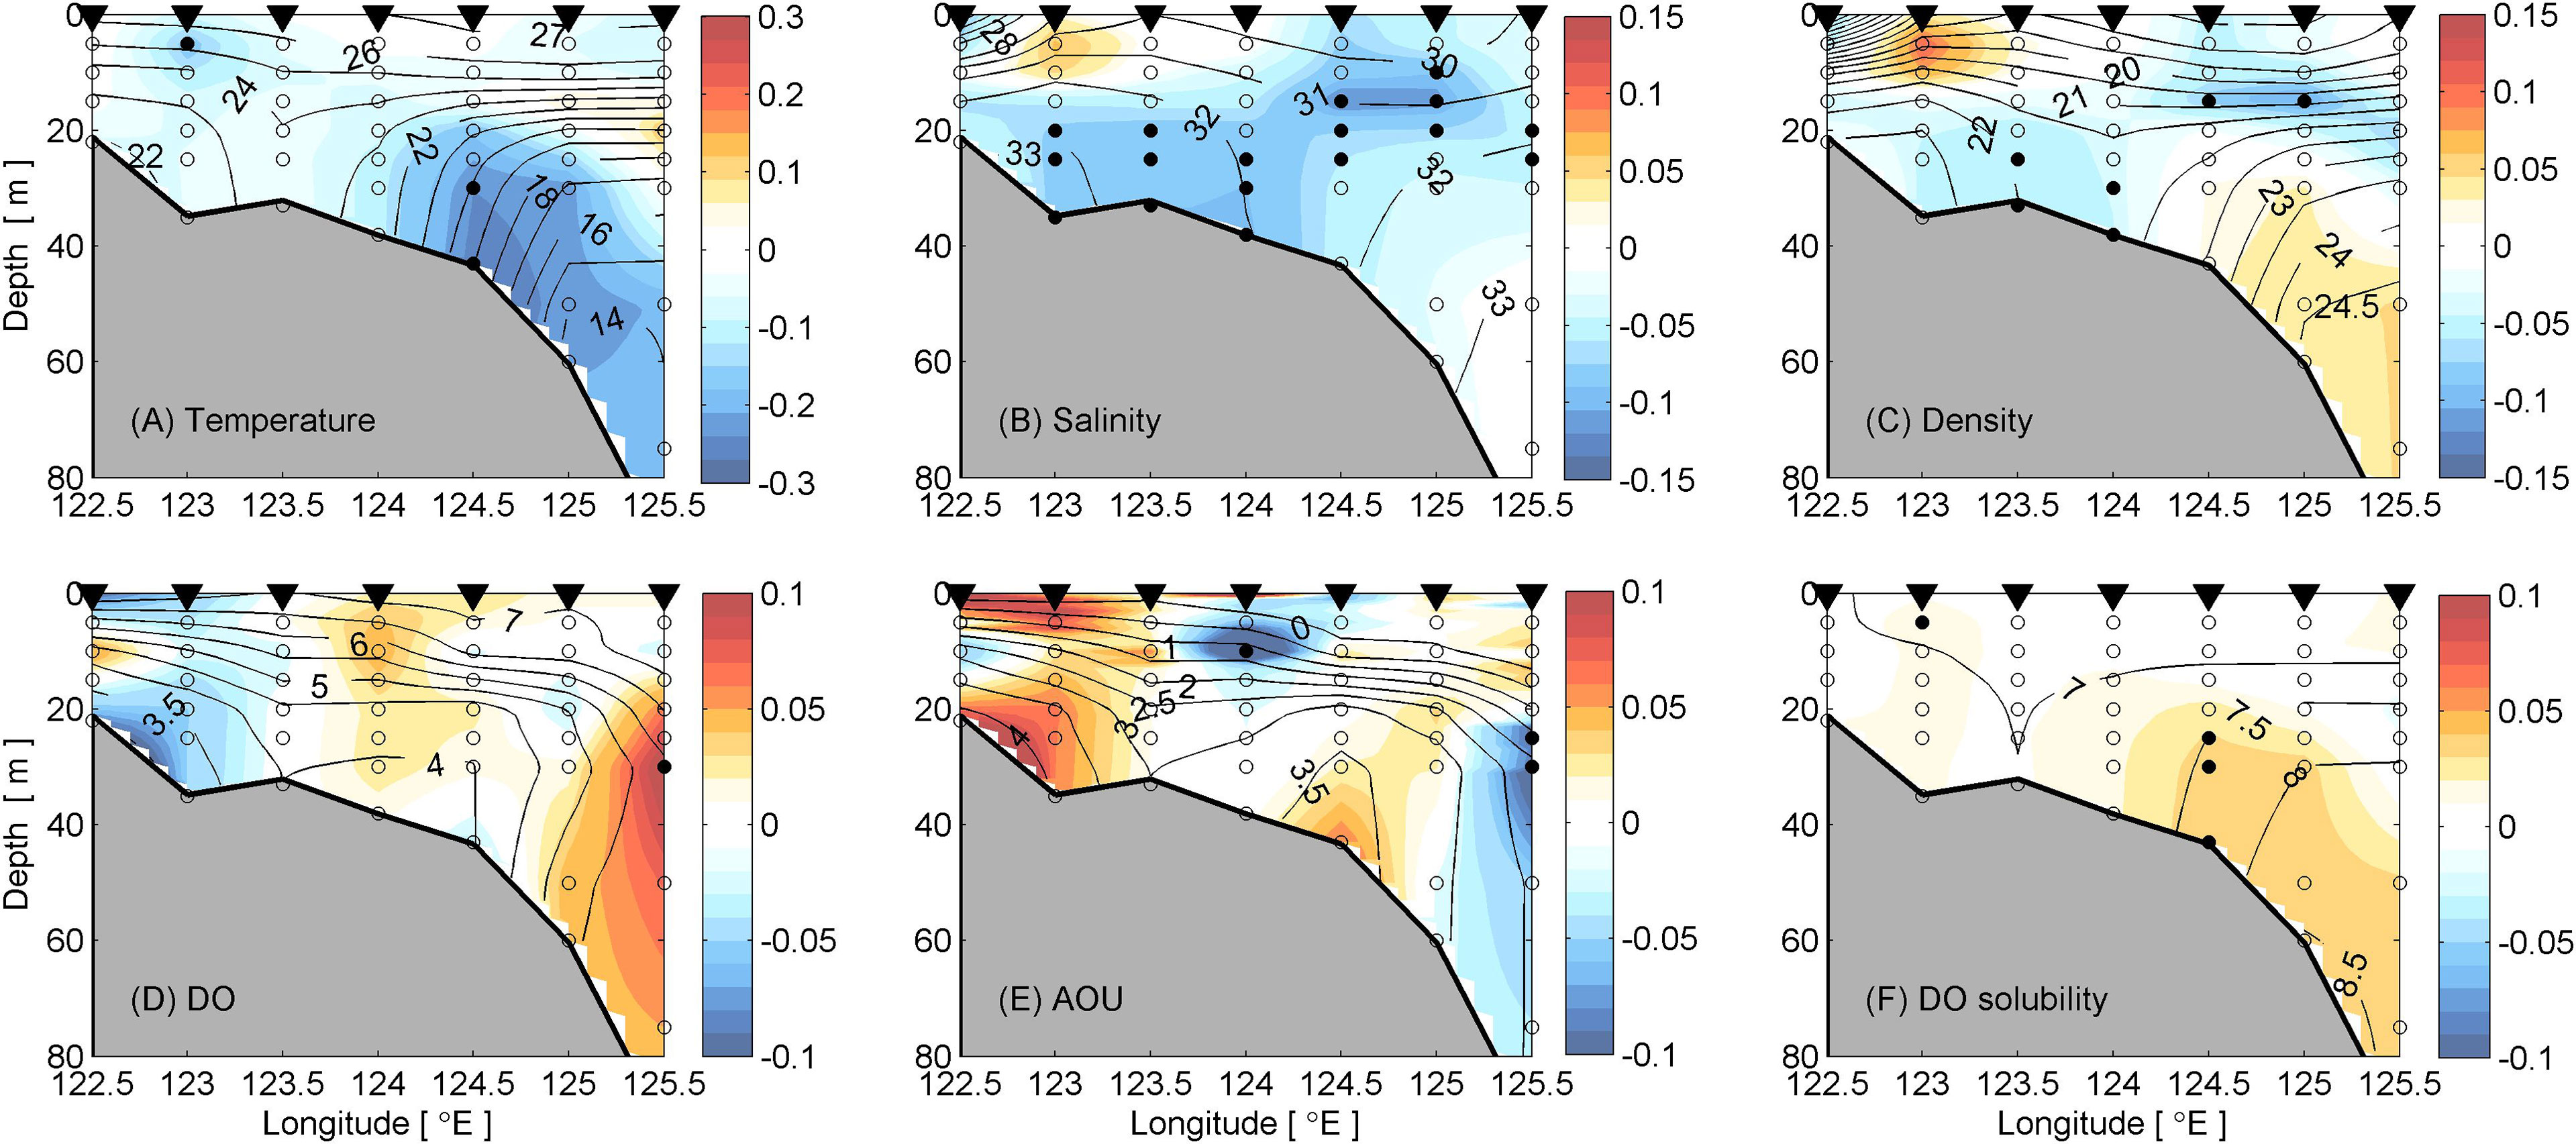
Figure 2 Climatology mean and linear trend of hydrological parameters along Section C-C in summer. The dots indicate significant trend at 95% level, triangles mark the sampling stations, and open circles indicate insignificant trend. (A) Temperature with units °C and °C/year. (B) Salinity. (C) Density with units kg/m3 and kg/m3/year. (D) DO with units mg/L and mg/L/year. (E) AOU with units mg/L and mg/L/year. (F) DO solubility with units mg/L and mg/L/year.
Figures 2D–F show the climatological mean and linear trend of DO, AOU, and DO solubility along Section C-C. The distributions of DO and AOU are extremely similar. DO concentrations are relatively high in the upper ocean, forming a relatively strong oxycline over the benthic low-DO zone. The most notable characteristic is the presence of two low-DO zones (<4 mg/L), at 122.5°–123°E and 124°–124.5°E, respectively. Generally speaking, AOU is relatively high (>3.5 mg/L) in these two low-DO zones. A notable sinking of high-DO waters associated with the downwelling process is observed near 123.5°E in the central shoal of the section, which separates the bottom low-DO water into two components: the inner area nearshore and the outer area in the offshore Changjiang Bank region. In contrast to DO and AOU, the DO solubility presents a similar pattern as that of seawater density, with an amplitude range of 6.7–8.5 mg/L.
The presence of dual-core low-DO zones is related to two hypoxia zones that frequently happen off the Changjiang Estuary. Statistically, there were three typical patterns of the hypoxic zones during 1997–2014. The nearshore core pattern, offshore core pattern, and dual-core pattern account for 33, 23, and 44%, respectively (see Table S3). These nearshore and offshore hypoxia zones can also be found in the statistical results of other studies (Wang, 2009; Wei et al., 2017). There are two possible dynamic mechanisms for the dual-core pattern of low-DO benthic water: First, the regional current system contains a large anticyclonic circulation and several cyclonic eddies across the Changjiang Bank. So, fresh water and nutrients are carried northeast first and southeast afterward, along with the CDW extension (Xuan et al., 2012). The terrestrial nutrient supply is less at station S3, compared with nearby stations. Second, the regional anticyclonic circulation and downwelling processes, can weaken local stratification (Zou et al., 2001; Wei et al., 2013) and are unfavorable for bottom hypoxia.
3.2 Temporal Variations of DO and Summer Hypoxia
Figure 3 shows the time series of DO at two low-oxygen cores. Generally speaking, the DO is highly dynamic with an insignificant linear trend for the whole water column. Compared with the offshore region, the nearshore DO presents a larger interannual variation, indicating the influence of complex coastal processes such as terrestrial nutrient loading and tidal modulation (Zhu et al., 2017). For the bottom layer, the DO time series between nearshore and offshore cores is similar to the correlation coefficient of 0.70 (p <0.01). Five hypoxia events are found in the nearshore region, which happened in August of 1998, 2003, 2007, 2010, and 2014, respectively. One hypoxia happened offshore in August 1998.
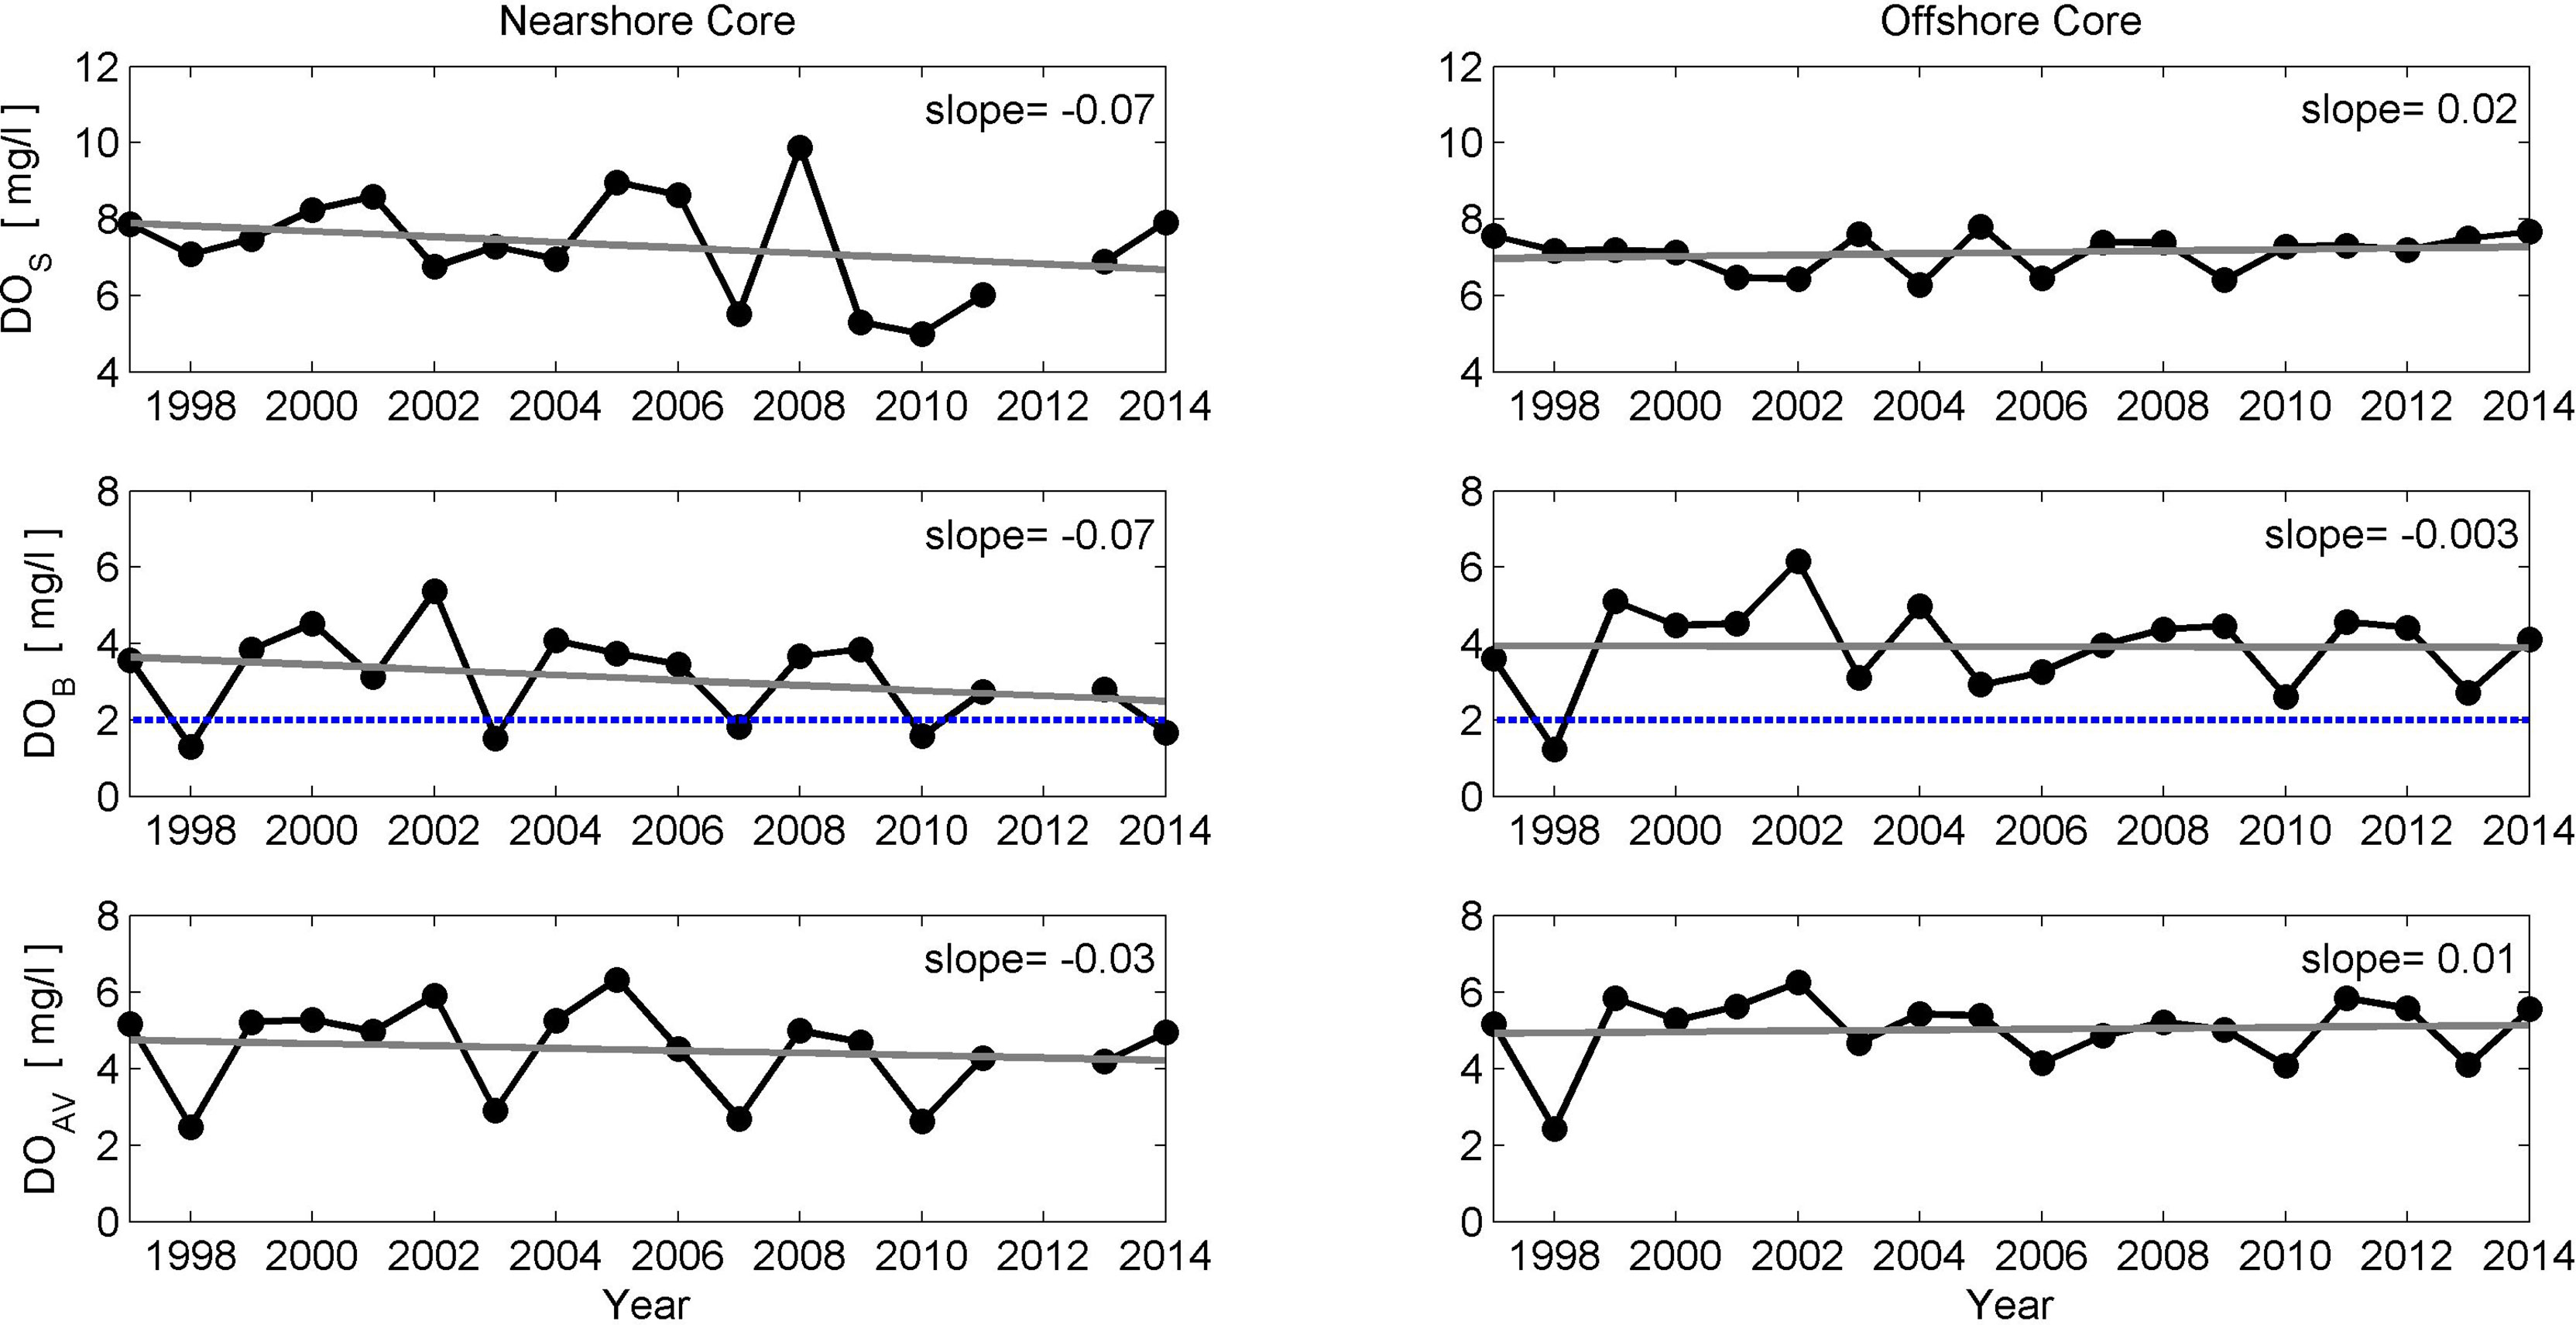
Figure 3 Time series (black curve with dots) and linear trend (gray line) of surface (DOS), bottom (DOB), and water column averaged (DOAV) DO values for “dual-structure” low-oxygen areas. The blue dashed line indicates the hypoxia threshold (DO = 2 mg/L). Left panels are averaged values at stations S1 and S2, and right panels are, at stations S3, S4, and S5. Corresponding data of DOS, DOB, and DOAV are listed in Table S4.
The linear trends of bottom DO present different patterns for dual low-DO cores, with a slightly decreasing trend for nearshore cores and an insignificant trend for offshore cores (Figures 2, 3). Despite the insignificant increasing trend of the offshore surface DO, our results are in good agreement with that which occurred along the 32°N section presented by Ning et al. (2011). It means that the hypoxia events off the Changjiang Estuary do indeed became quite severe. For the nearshore core (122.5°–123.5°E), the stratification (simply represented by Δσ, bottom density minus surface density) decreased during 1997–2014 and was unfavorable for hypoxia occurrence. Meanwhile, the DO saturation increased slightly for bottom water because of bottom cooling for coastal water during 1997–2014. So, the decreasing trend of bottom DO during 1997–2014 was due to larger AOU rather than to DO saturation or stratification variation.
Figure 4 illustrates the low-oxygen and hypoxia extents observed at Section C-C based on several indices: DO minimum and longitude range of low-oxygen/hypoxia extent. Results show that DO minimum is anti-correlated with the low-oxygen/hypoxia area, with correlation coefficients of −0.64 (n = 12) and −0.67 (n = 6), respectively. Similar to DO value, these indices present no significant trends during 1997–2014. Ning et al. (2011) reported that the hypoxia area along 32°N had an eastward spreading trend during 1975–1995. We also calculate the linear trend of the eastern boundary longitude of the hypoxic area along Section C-C, but no significant trend was observed during 1997–2014 (figure not shown).
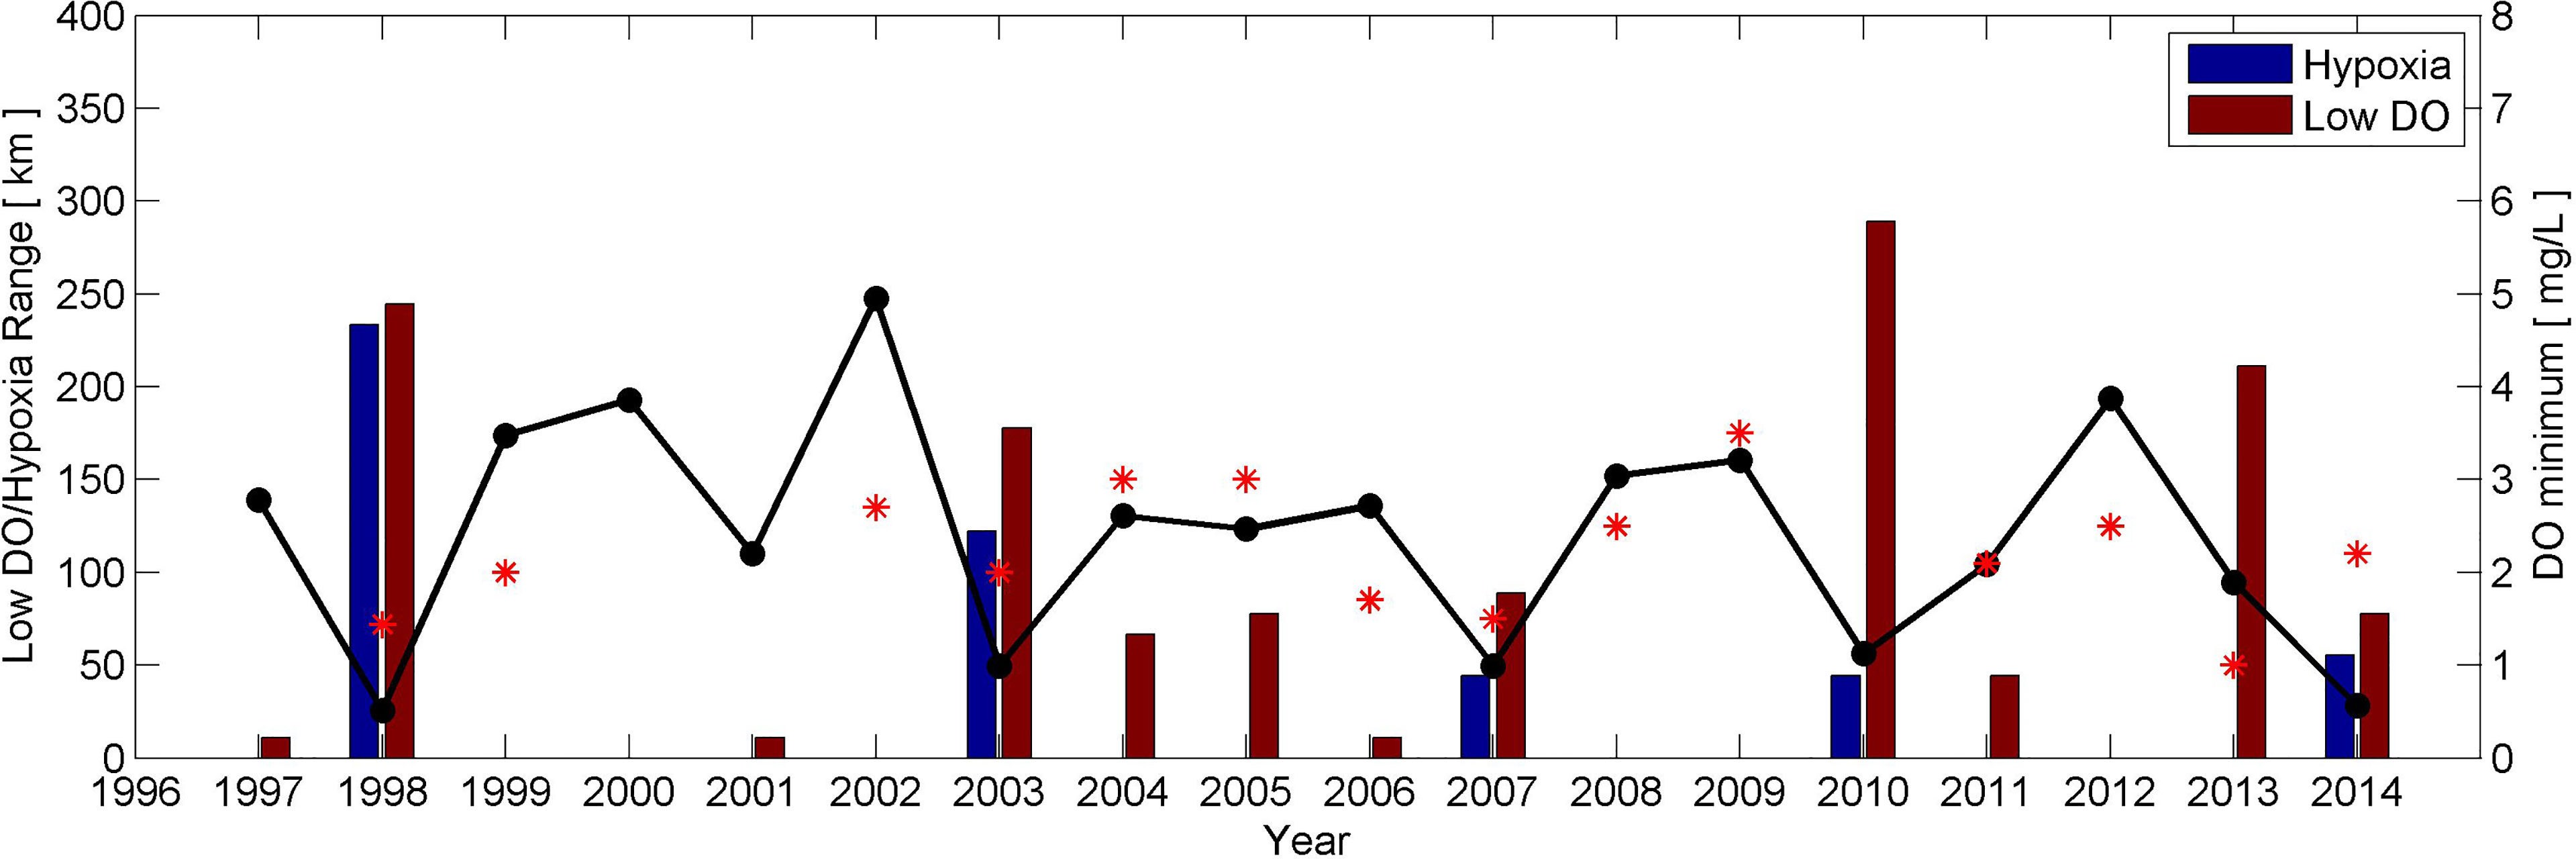
Figure 4 The width of low-oxygen and hypoxia areas (units: km) and DO minimum (units: mg/L; in black) along Section C-C during 1997–2014. Red star denotes the DO minimum digitized by the previous observations in literatures (see Table S1 for details).
3.3 ENSO Effect on DO Interannual Variation
To describe the ENSO effect on DO variation, we categorize the bottom DO status by using different ENSO phases. As shown in Table 1, the bottom hypoxia occurred in six years during 1997–2014, four of which happened in El Niño decaying summers and none happened in La Niña decaying summers. For the whole 18-year record, the low-oxygen and hypoxia probabilities are 33 and 56%, respectively. These probabilities increase to 80 and 100% for El Niño decaying summers, and decrease to 0 and 25% for La Niña decaying summers.
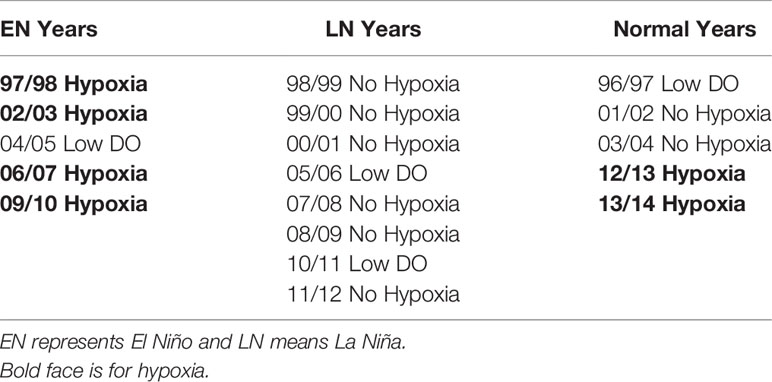
Table 1 DO status (hypoxia, low DO, or no hypoxia) along Section C-C in association with ENSO events during 1997–2014.
Figure 5 shows the correlation coefficient between DO and ONI along Section C-C. Results show that the subsurface DO value within the longitude range of 122.5°E to 124.5°E is negatively correlated with the ONI value, which is significant at a 95% confidence level. The correlation coefficient presents two local maxima (<−0.6) in deep water, which generally matches the “dual-cores” structure of low-DO areas along Section C-C.
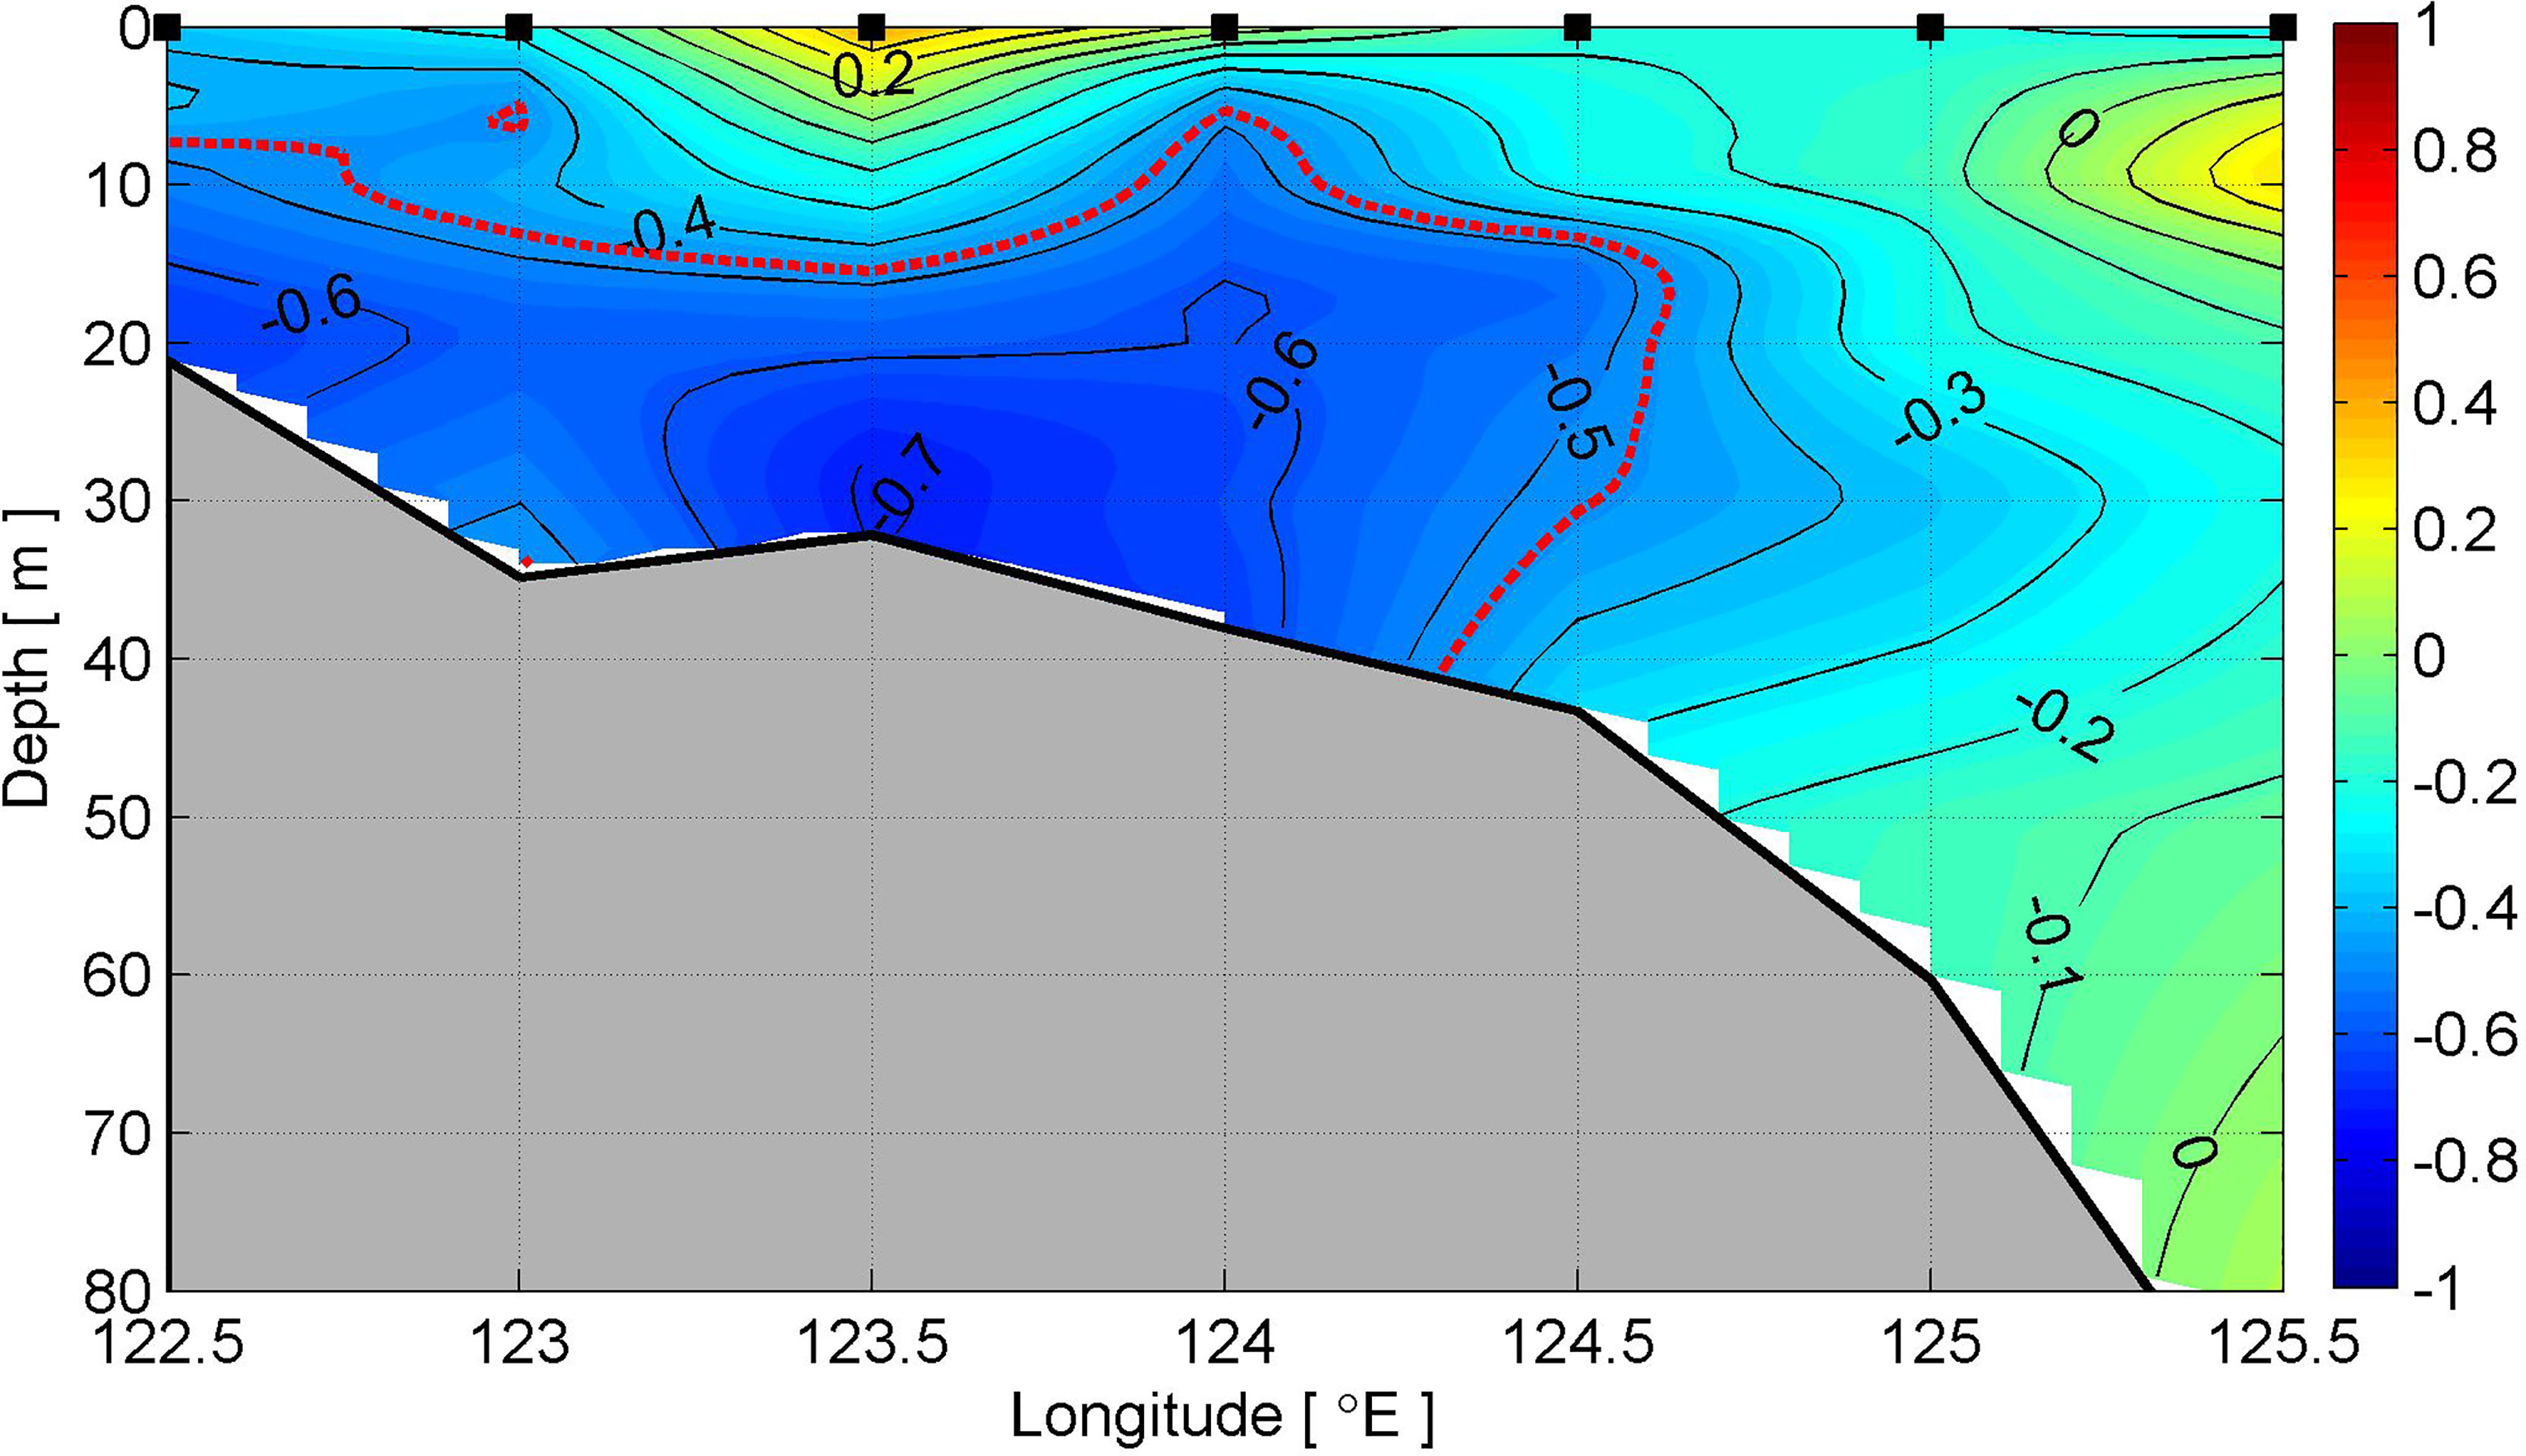
Figure 5 Correlation between DO value along Section C-C in August and ONI in January during 1997–2014. Red dashed line indicates the 95% confidence level.
Figure 6 shows the composite distributions of anomalies (differences to the climatological mean) of hypoxia-associated hydrographic parameters (DO, temperature, and salinity) along Section C-C during different ENSO phases. In El Niño decaying summers, a negative DO anomaly is present in the subsurface layer at stations S1-S5, with a minimum of −1.6 mg/L in the bottom layer of station S3. The DO anomaly is relatively smaller at stations S6 and S7, indicating a weaker ENSO influence in the open seas near Cheju Island. The contrary is seen in the La Niña years. A positive DO anomaly occurs in the bottom layer at stations S1–S4, meaning lower coastal hypoxia probability for La Niña years.
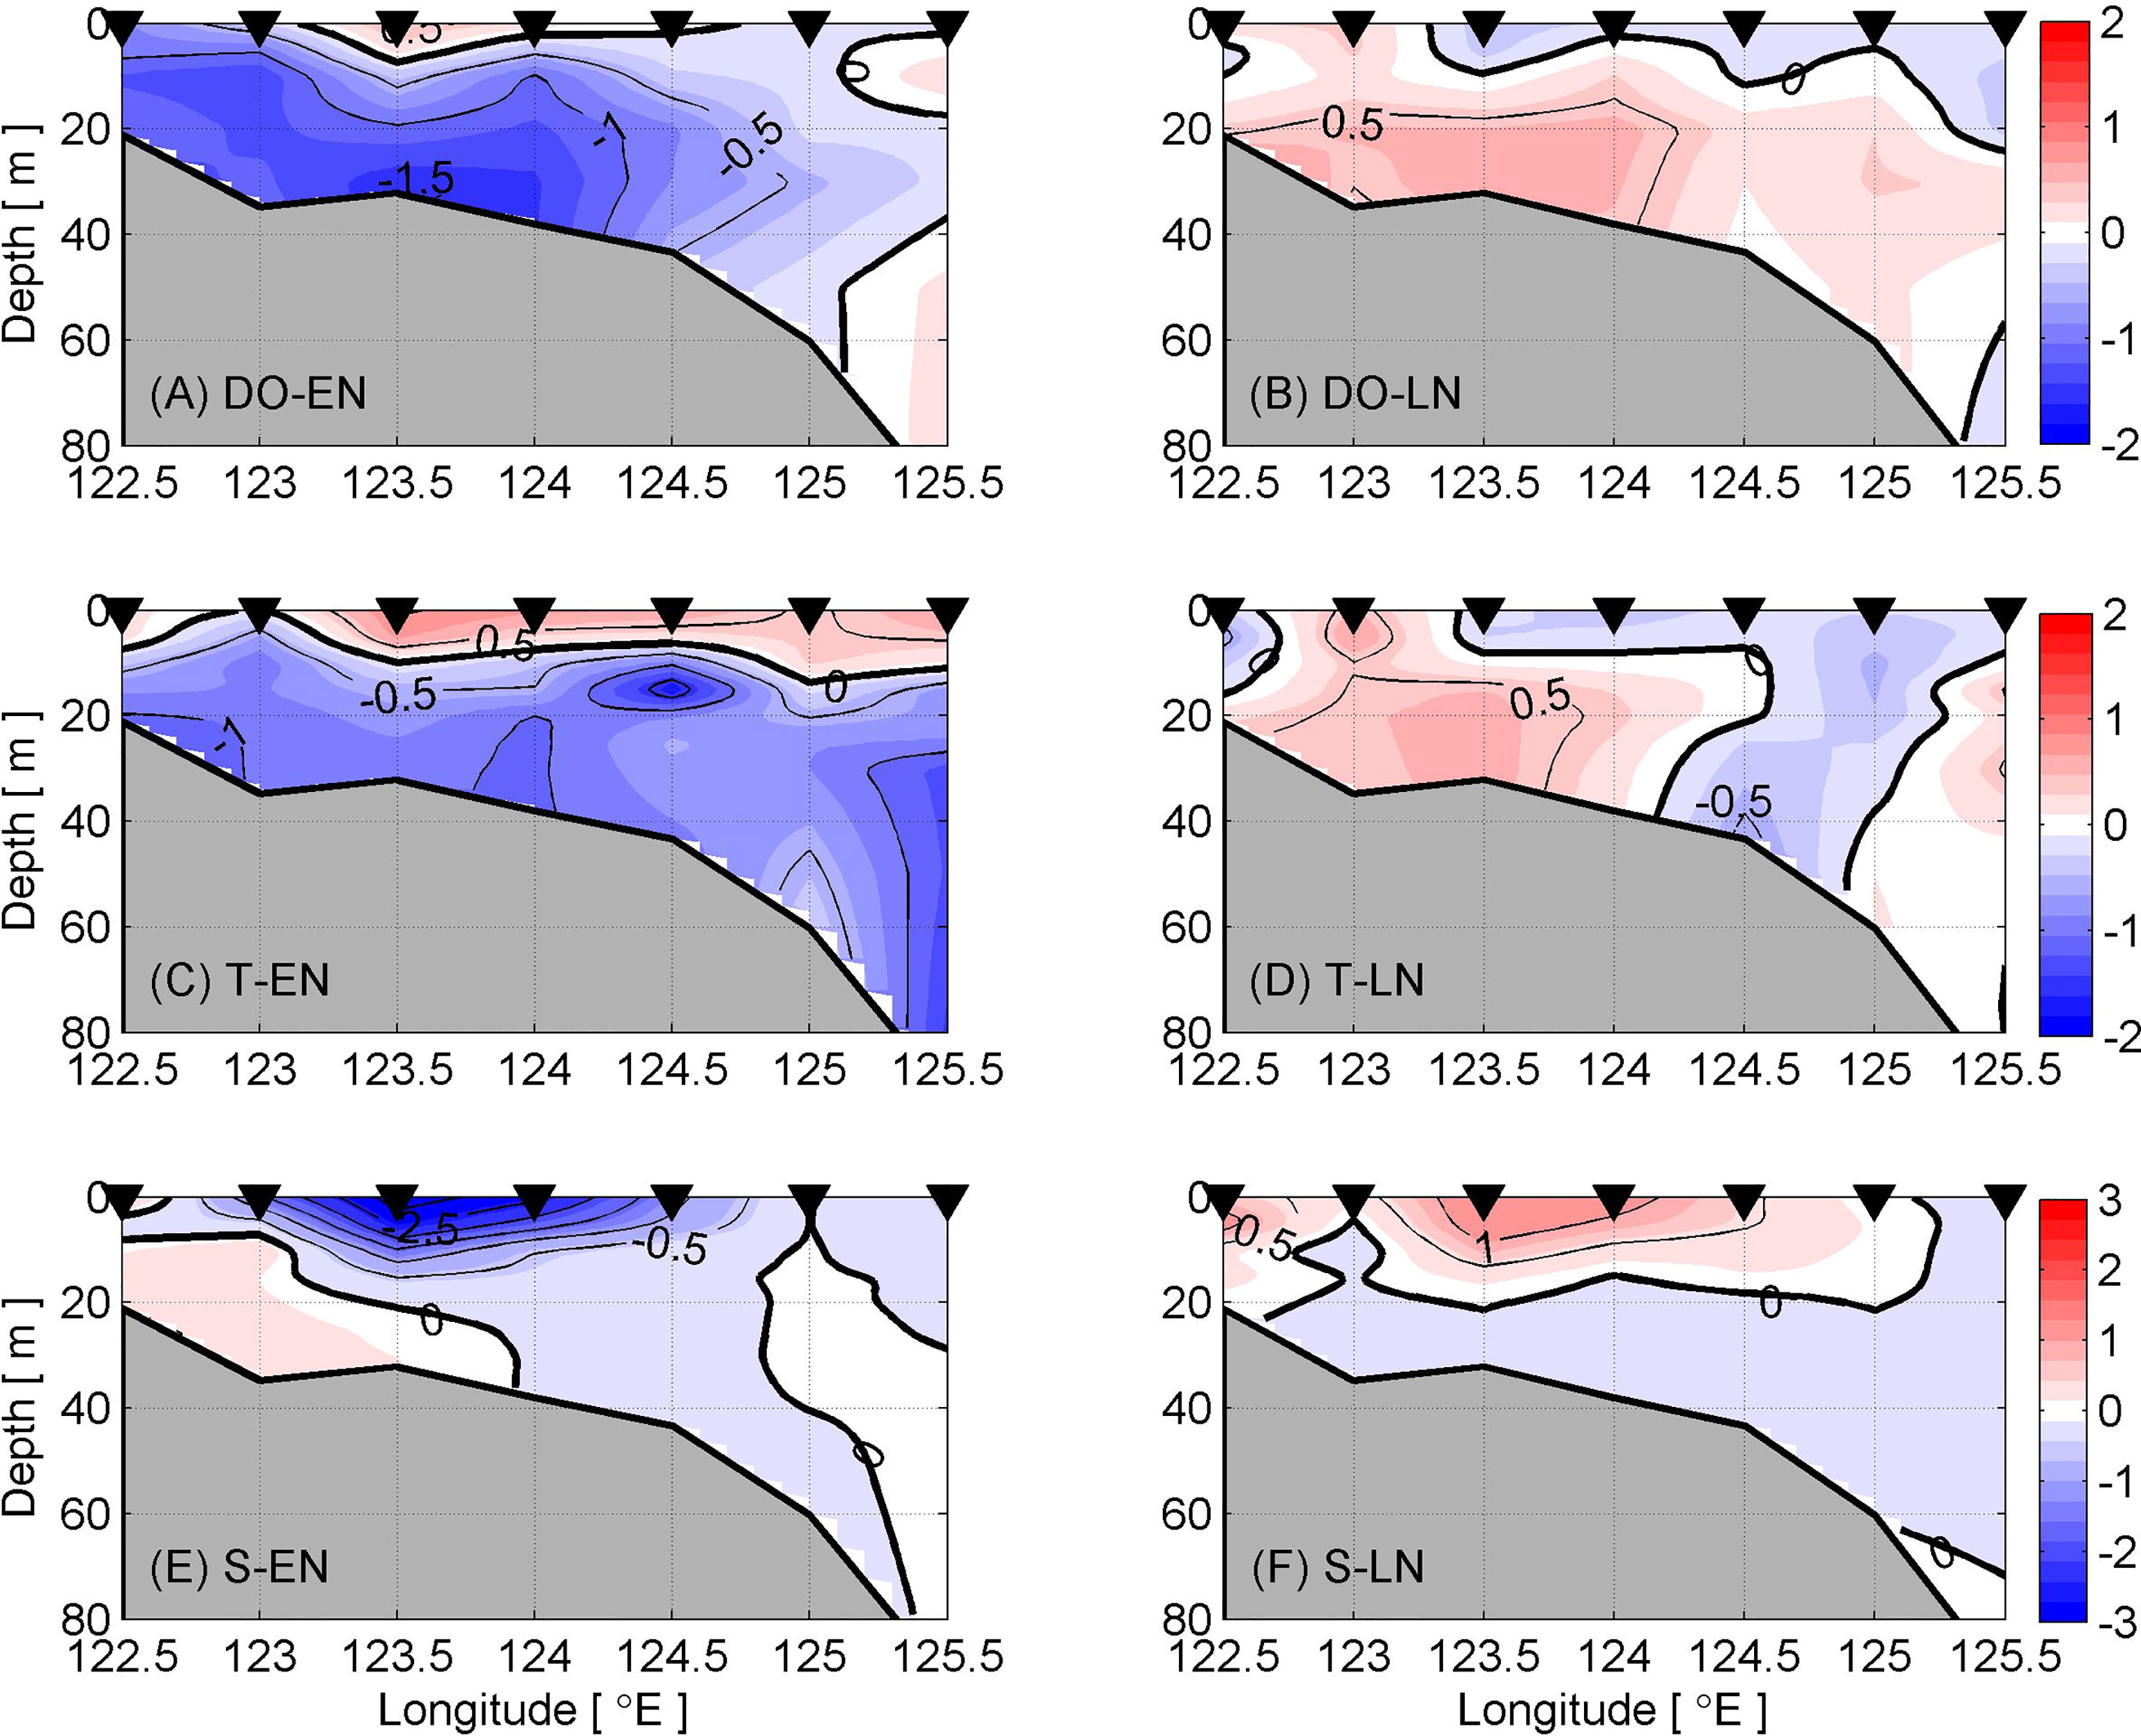
Figure 6 Composite analysis of (A, B) DO, (C, D) temperature, and (E, F) salinity along Section C-C. Left and right panels indicate the El Niño and La Niña events, respectively. Triangles mark the sampling stations.
The temperature and salinity anomaly fields present similar patterns to those of the DO anomaly field. In El Niño decaying summers, fresher and warmer CDW water and saline and cooler subsurface TWC water are combined to produce much stronger vertical stratification, which is favorable for bottom hypoxia development. The situation in the La Niña years is the opposite. However, the anomalies for all three parameters are relatively smaller compared to those in El Niño years.
For the following summer of El Niño years, anomalously anticyclonic circulation occurs to the east of the Philippine Islands due to changes in the strength and location of the western North Pacific subtropical high. It has been found to be a key factor in generating variability in precipitation in southern China (Zhou and Yu, 2005; Xie et al., 2009). The difference in the composited wind field between the El Niño years and La Niña years confirms that the anticyclonic anomaly of moisture transport is enhanced in the El Niño decaying summer, indicating that the southwesterly moisture transport from the South China Sea increases precipitation in southern China (Figure 7). As described in Park et al. (2015), the July inland precipitation in China is a primary contributor to freshening in the Yellow Sea and ECS through increasing Changjiang River discharge during El Niño decaying August. Meanwhile, the surface wind anomaly is northward-northeastward over the ECS continental shelf during July–August (Figures 7, 8) and promotes the Kuroshio intrusion across the ECS shelf via the Ekman effect (Tan and Cai, 2018), which also contributes to the enhanced oceanic nutrient and hypoxia development off the Changjiang Estuary. The contrary appears in the La Niña years.
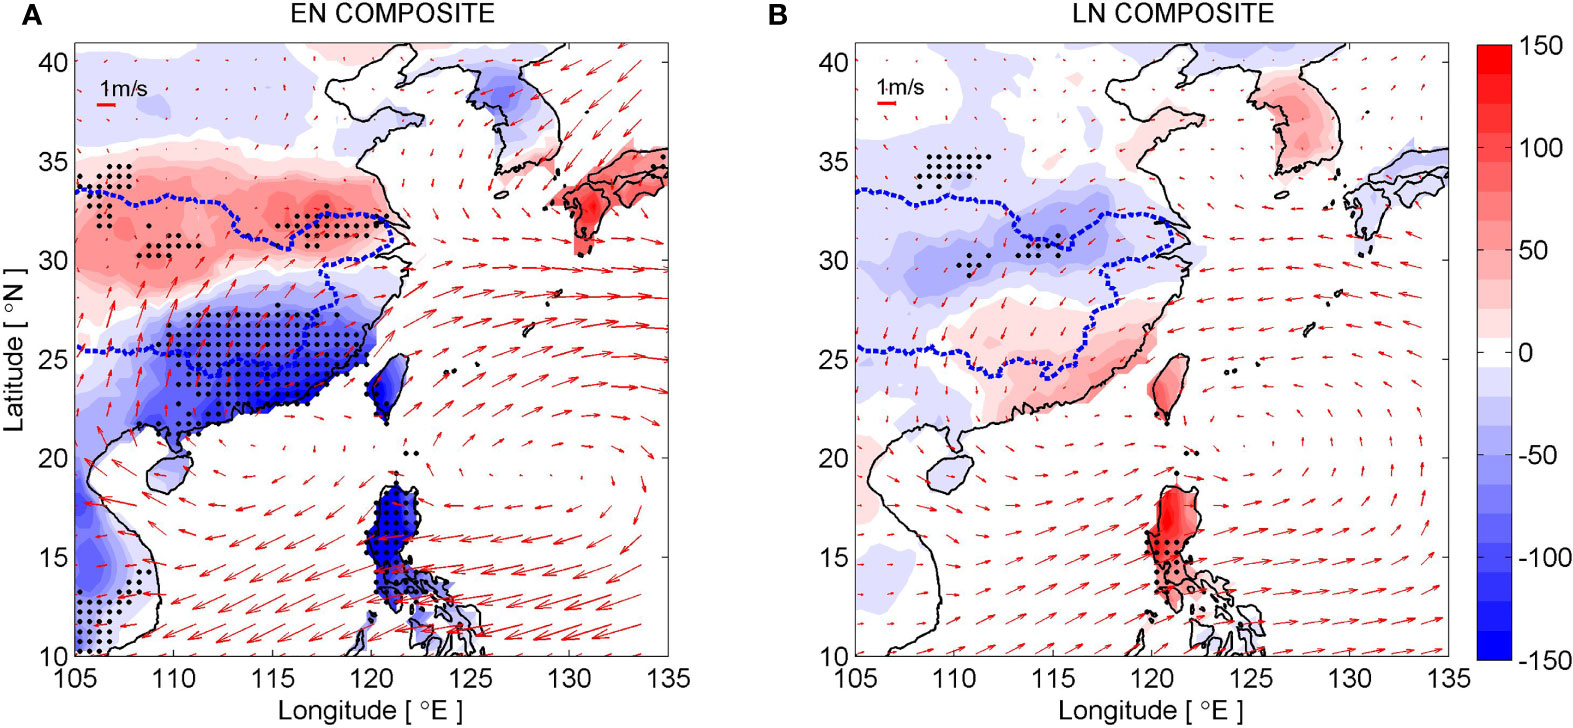
Figure 7 (A) Composite difference of land-based precipitation (color) in July for five El Niño years (1998, 2003, 2005, 2007, and 2010) and the climatology mean. Red arrows denote composite difference of surface wind between El Niño years and climatology mean. Stippling indicates that the differences are statistically significant at the 95% level. The region bounded by a thick blue dashed line denotes the Changjiang river catchment. (B) is the same as (A), but for eight La Niña years (1999, 2000, 2001, 2006, 2008, 2009, 2011, and 2012).
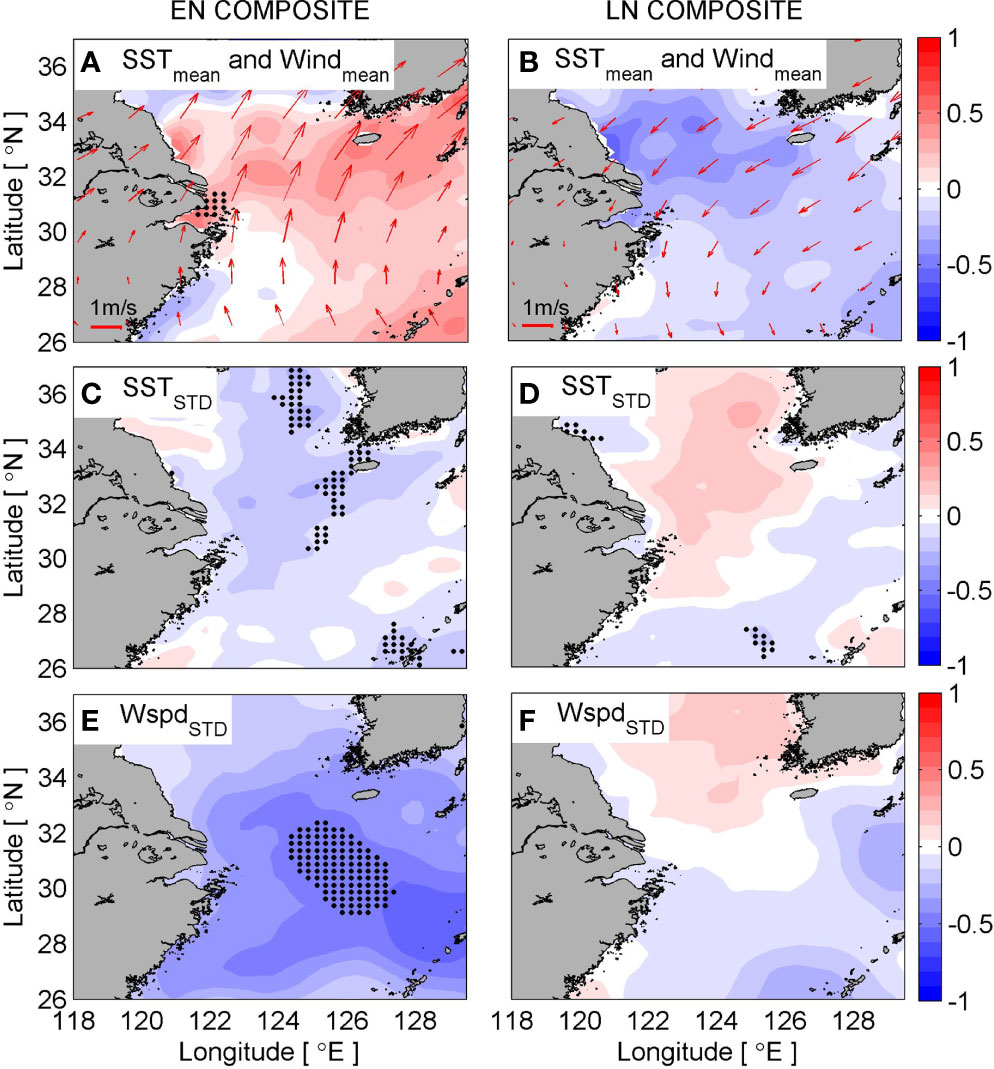
Figure 8 Composite differences of (A) SST (color) and surface wind (vector), (C) SST standard deviation, and (E) wind speed (Wspd) standard deviation in August for five El Niño years (1998, 2003, 2005, 2007, and 2010) and climatology mean. Stippling indicates that the differences are statistically significant at the 95% level. (B, D, F) are the same as (A, C, E), but for eight La Niña years (1999, 2000, 2001, 2006, 2008, 2009, 2011, and 2012).
Figure 8 shows the composite differences between the mean and standard deviation of the SST and wind fields between El Niño and La Niña decaying August. The atmospheric and hydrographic conditions are rather calmer during El Niño decaying August. The standard deviations of both SST and wind speed present negative anomalies in hypoxia areas, providing favorable conditions for maintaining the stratification and sustaining oxygen decomposition. Besides, the differences in mean of SST and wind between El Niño and La Niña decaying August is relatively small, with the mean value of 0.6°C and 0.1 m/s for hypoxia area (Table 2), indicating the standard deviations for both SST and wind speed, rather than their mean values, contribute to coastal hypoxia off the Changjiang Estuary during El Niño decaying August.
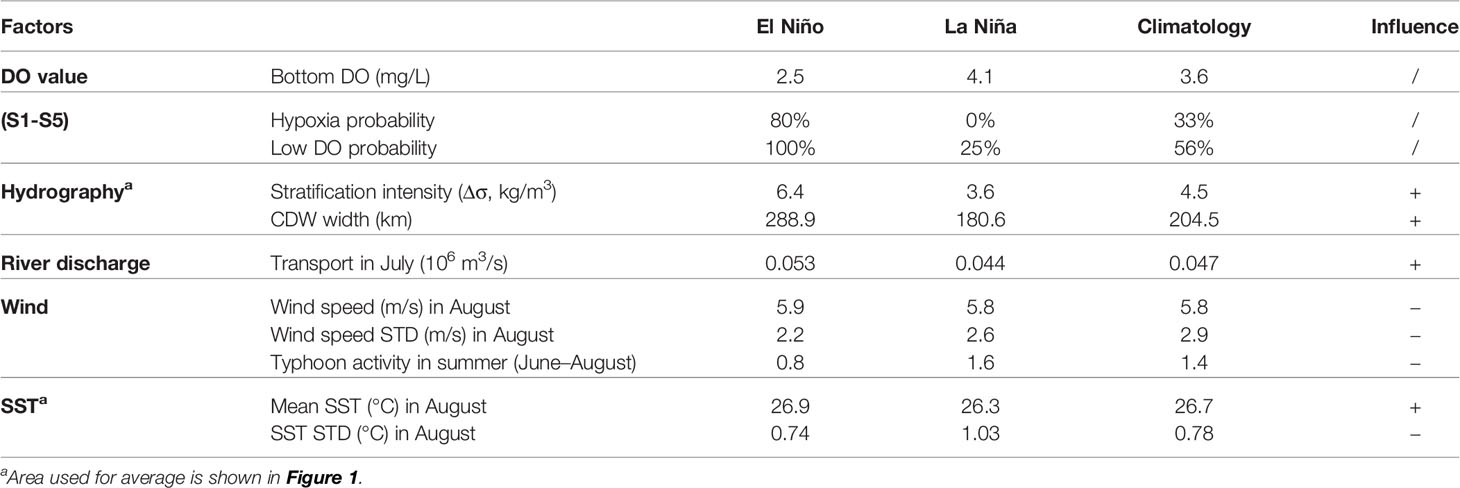
Table 2 Indices for summer hypoxia and its associated multiple climate and oceanic factors along Section C-C during 1997–2014.
In the ECS, the stratification is often disrupted by strong winds, such as during a typhoon (Chen et al., 2014; Ni et al., 2016). The modeling study confirmed that typhoon activities temporarily broke down pycnocline, and eventually terminated the hypoxia in 2006 (Zhou et al., 2017). However, according to the western Pacific typhoon records from the Joint Typhoon Warning Center (JTWC), little typhoon activity occurred in the whole ECS during El Niño decaying summers (Figure 9). Li and Zhou (2012) showed that during the transition period from El Niño to La Niña, typhoon activity across the marginal seas of China is less frequently associated with changes in the relative vorticity of air and vertical wind shear. Our findings corroborate their findings. The typhoon-absent climatic condition in El Niño decaying summers helps provide the negative standard deviation (STD) anomalies of SST and wind fields in the ECS (Figures 8C, E), which benefit stratification maintenance and sustain oxygen decomposition.
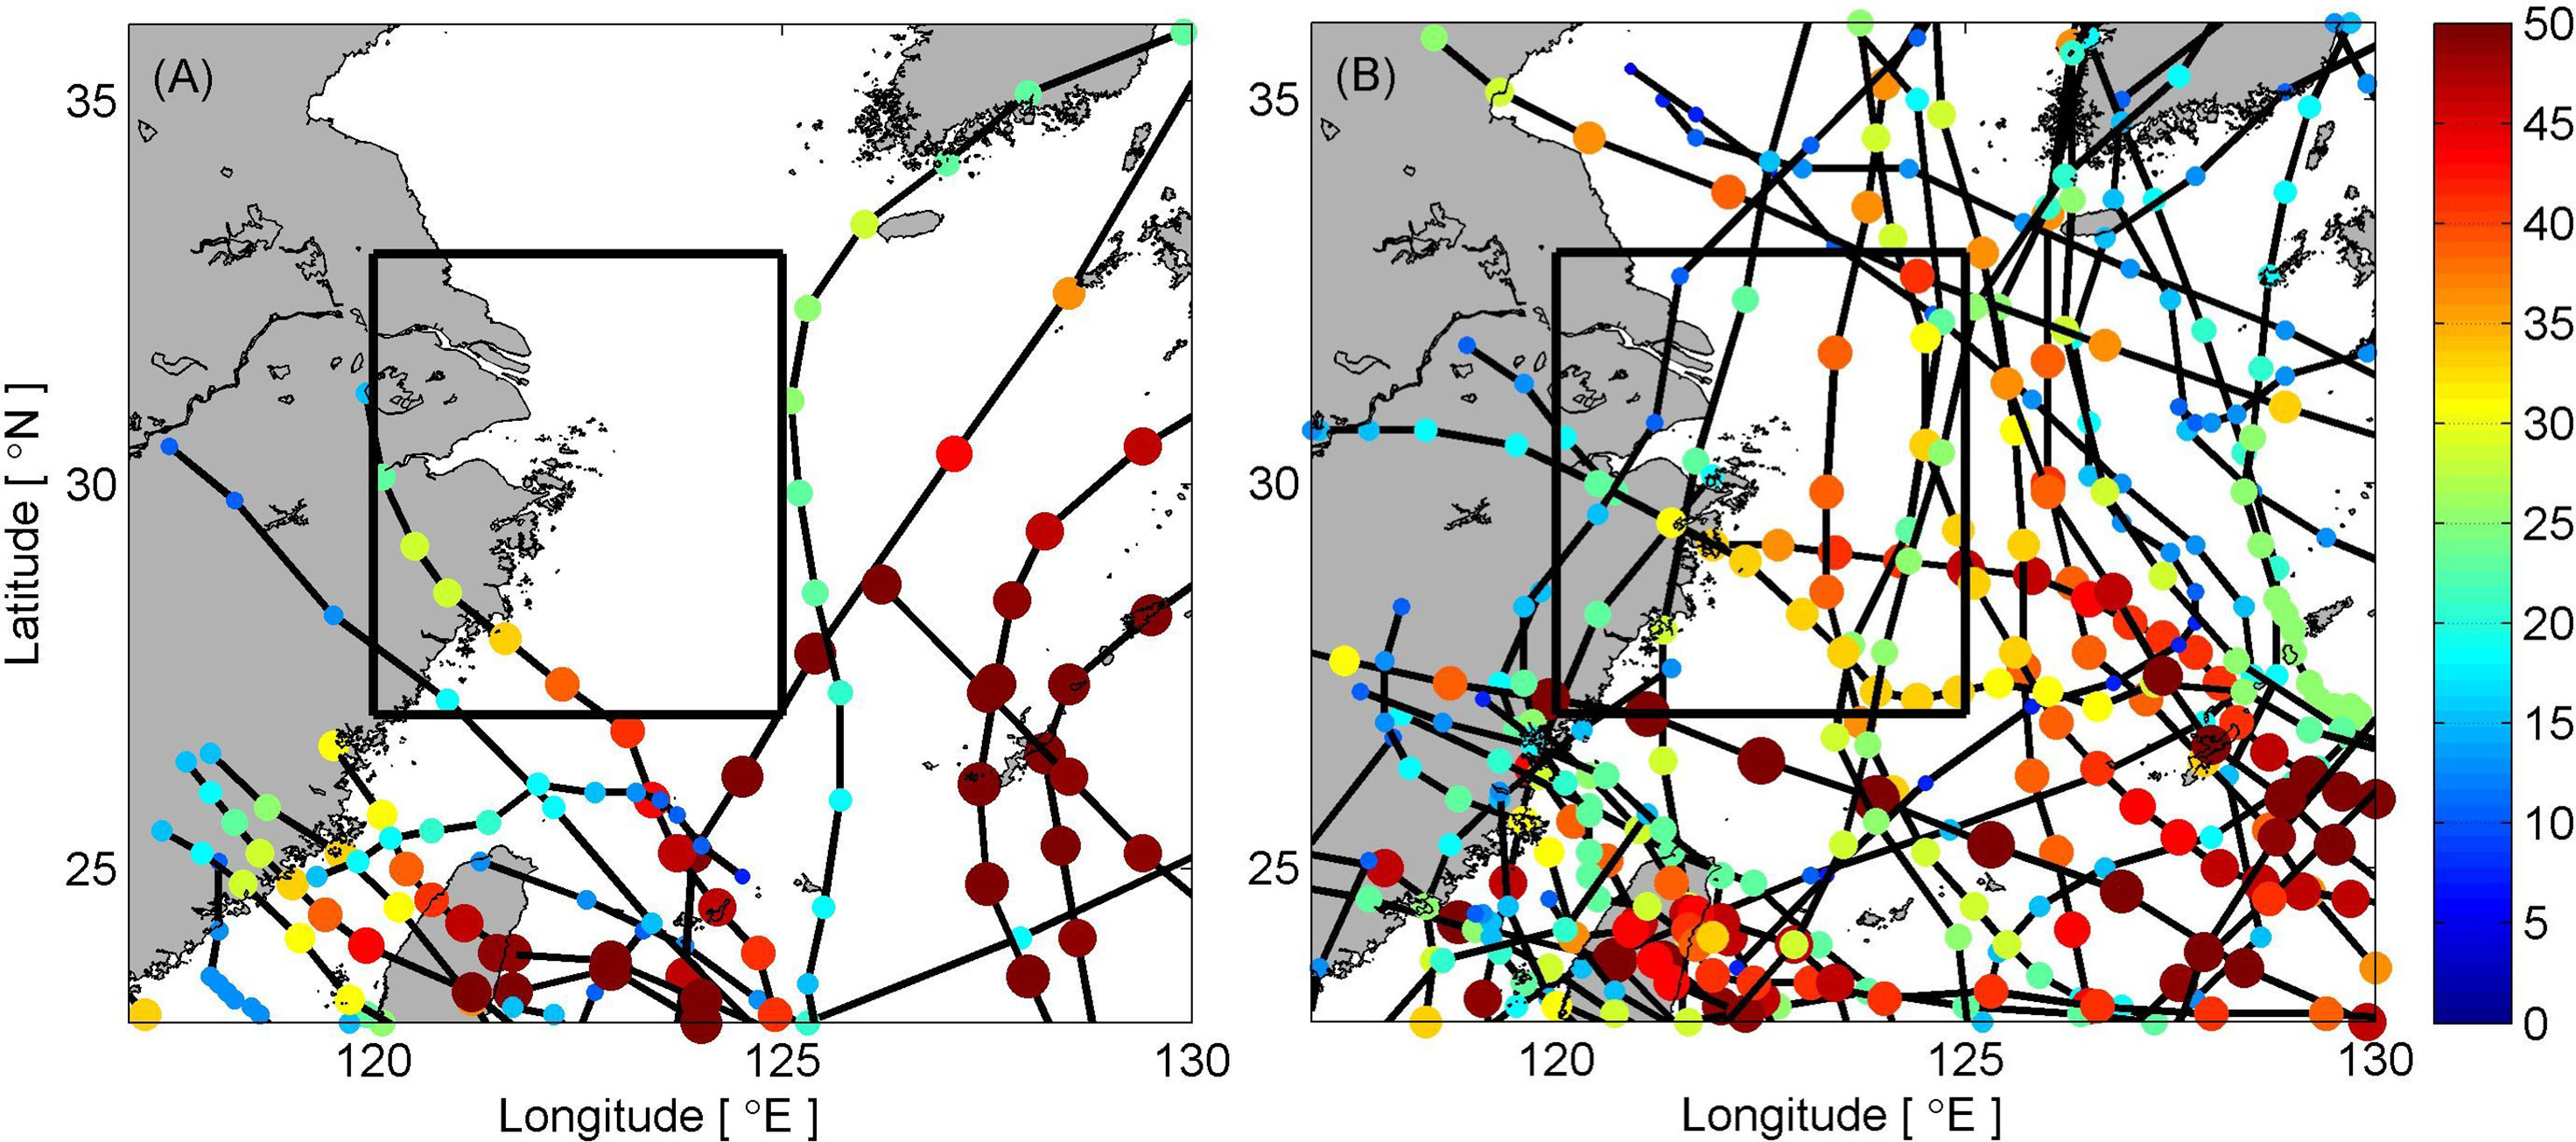
Figure 9 Composite typhoon tracks and center wind speeds (m/s) during (A) El Niño decaying summers (June–August) and (B) La Niña decaying summers (June–August). Black box approximately indicates the influence area of typhoons on hypoxia events.
4. Discussion
4.1 Comparison With Previous Hypoxia Observations
It is difficult to directly compare the areal extent and severity of hypoxia events between previous studies and our observations due to different sampling stations and cruise periods used. The following comparison of DO minimum and hypoxia probability is based on statistics.
(a) Oxygen minimum
The time evolution of DO minimum shows consistency between our observations and previous studies to a certain extent, with the root-mean-square (RMS) residual of 1.09 mg/L (Figure 4). Relatively large differences mainly occur in the following years: 1999, 2003, 2006, 2008, 2010, and 2014.
(1) No hypoxia was detected along Section C-C; however, it was reported in previous studies regarding 1999, 2006, and 2008. A possible reason is that our sampling stations and cruise period are not appropriate for the hypoxia, meaning the inter-seasonal variation of DO is also important and significant.
(2) Hypoxia was detected along Section C-C; however, no hypoxia was reported in previous studies regarding 2003, 2010, and 2014. In 2003, the sampling area focused on the outer ECS shelf but did not cover the Section C-C. In 2010, the sampling period of Liu et al. (2012) was September when hypoxia had probably weakened. In 2014, the sample stations were too sparse (Zhou et al., 2020).
(b) Hypoxia probability
The hypoxia occurrence probability is more than 67% in the literature (Table S1). However, the probability is only 33% along Section C-C. Note that oceanographers usually conduct their field investigations for hypoxia detection, so the hypoxia status is probably overestimated in the literature. For example, there were no hypoxia reported in the summers of 2000 and 2001. Maybe there were field investigations but no hypoxia was found in those years, just as our results show in Table 1. Another reason for the lower hypoxia occurrence in our study is that the hypoxia does not always extend northward enough to be detected along Section C-C. In this sense, the hypoxia/low-DO probability is probably underestimated in this study.
4.2 ENSO Effect on Coastal Hypoxia off the Changjiang Estuary
From the global perspective, the influence of ENSO on coastal ecological systems is significant in two different types of hydrodynamic systems: wind-induced upwelling areas (such as the eastern Indian Ocean in Gregg, 2001, and the California coast in Nam et al., 2011) and river-dominating estuarine areas (such as the Congo River and Amazon River; Signorini et al., 1999). The hypoxia area off the Changjiang Estuary belongs to the latter. As mentioned above, during most of El Niño decaying summers, the anomalous atmospheric circulation in the western Pacific transports moisture southwesterly and enhances the inland precipitation in southern China (Zhou and Yu, 2005). Park et al. (2015) reported that the Changjiang River discharge in El Niño decaying July is ~0.006 Sv greater than that for La Niña. Our result also confirms the Changjiang River discharge difference is ~0.01 Sv between different ENSO phases (Table 2). The greater amount of fresh water supply in July is responsible for the greater extent of CDW spread in August. Compared with the climatological mean, the CDW range extends eastward ~90 km in El Niño decaying August and shrinks westward ~20 km in La Niña decaying August. Considering costal hypoxia is sensitive to the CDW inter-seasonal variation (Zhang et al., 2018), the larger CDW range can help sustain the vertical stratification and oxygen depletion off the Changjiang Estuary. Besides the terrestrial fresh water supply, another important ENSO effect on coastal hypoxia is providing calmer climatic and hydrographic conditions. Statistical results indicate the typhoon frequency decreases by 50% during El Niño decaying summer, and the standard deviations for wind and SST decrease by 15 and 28%, respectively (Table 2). The calm wind and SST fields also help provide favorable conditions for hypoxia development.
In the past three decades, there have been two very strong El Niño events, which happened in 1997/98 and 2015/16, respectively. It is not coincidental that two severe coastal hypoxic events occurred in the summers of 1998 and 2016. Although the hypoxia in the summer of 1998 was not significant in the literature, with a smaller extent (600 km) and a relatively higher DO minimum (~1.44 mg/L) (Wang and Wang, 2007). The hypoxic event was quite severe as observed along Section C-C. Actually, hypoxia is the severest event in the repeated sectional observations during 1997–2014 (Figure 3). The hypoxia water ranged from the river mouth to 124.5°E, and the DO minimum was ~0.51 mg/L. Besides, severe hypoxia (close to anoxia) occurred in summer 2016 off the Changjiang Estuary (Chen et al., 2020; Wang et al., 2021). According to the hypoxic area and DO minimum, the hypoxia is rather severer in summer 2016 than in summer 1998, although its peak ONI is smaller than that of 1998. There were two possible reasons. First, the interannual variation of coastal hypoxia is largely influenced by its inter-seasonal variation (Zhang et al., 2020). The hypoxic area calculated from DO at discrete locations often contains possible errors because hypoxia has short-term variation (Zhang et al., 2018). So the comparison between two severe hypoxia has uncertainties. Second, after the construction of the Three Gorges Dam, the coastal sediment has decreased and the light availability has increased off the Changjiang Estuary. So the current hydrographic condition is much favorable for phytoplankton bloom and subsequent benthic hypoxia. Although the river discharge in summer 1998 was much larger than that in summer 2016, both riverine nitrate and phosphate concentrations in summer 1998 were 30–40% lower than the current levels (see Figure 2 in Wang et al., 2018).
Although the composite differences of DO and associated hydrographic and climatic features are significant between El Niño and La Niña years, the linear regression between the hypoxia severity index and ONI is not strong, especially for non-El Niño years. As shown in Figure 10, the low-oxygen/hypoxia areas tend to be much wider and the DO value tends to be much lower in El Niño decaying August. For normal and La Niña years, the scatter points are distributed rather discretely. These asymmetric ENSO effects on coastal hypoxia off the Changjiang Estuary are also reflected in the magnitude of composite anomalies of hydrographic factors along Section C-C (such as temperature and salinity; Figure 6).
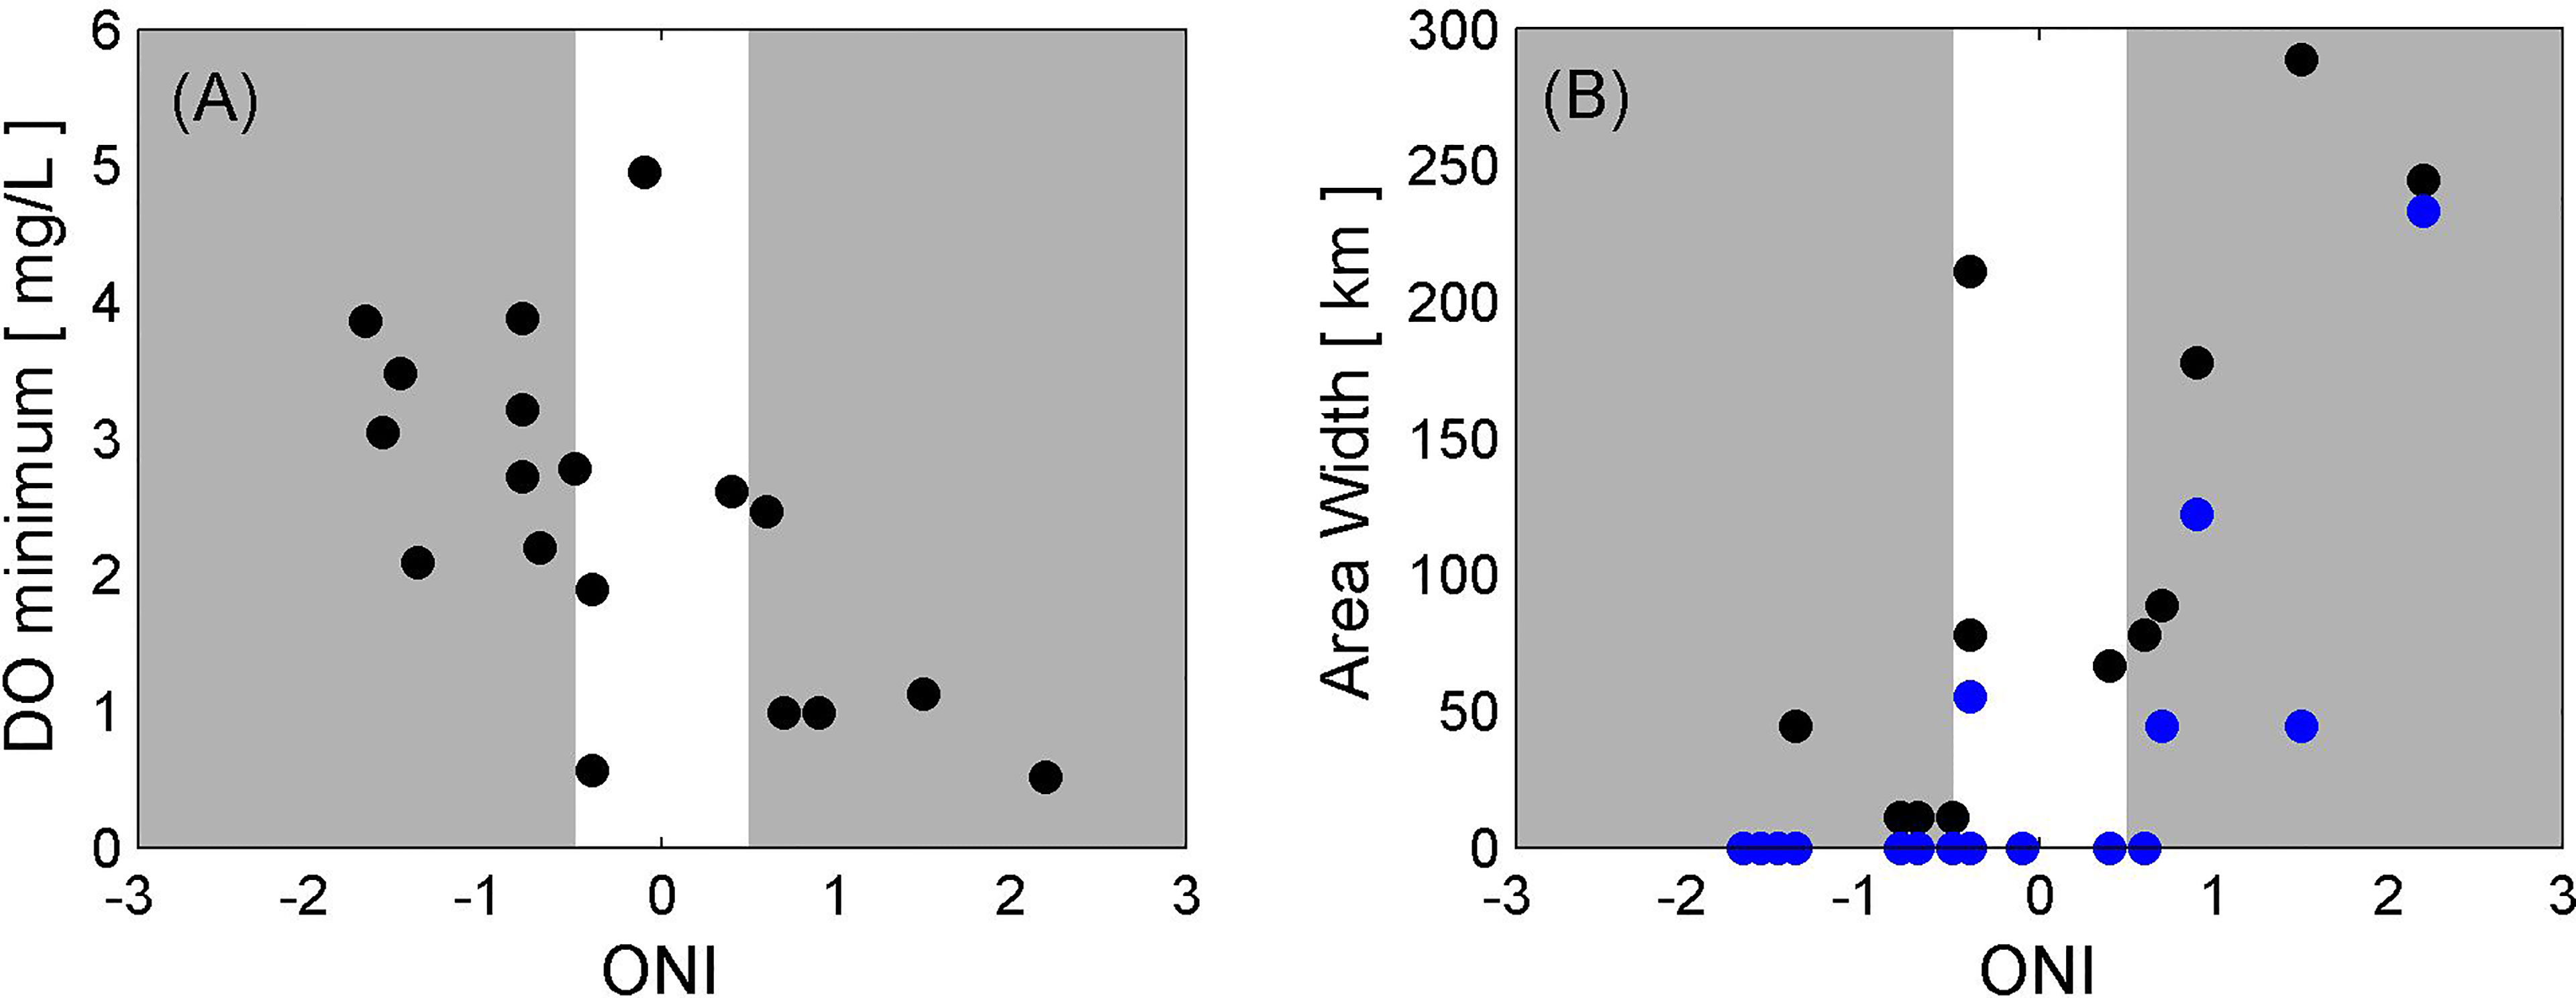
Figure 10 (A) Scatter plot of DO minimum along Section C-C during 1997–2014 and associated ONI in January. (B) Same as (A), but for the width of low-oxygen area (black dots) and hypoxia area (blue dots).
In summary, the ENSO signal is not the prerequisite for the coastal hypoxia off the Changjiang Estuary. However, the physical and chemical parameters associated with El Niño provide favorable conditions for hypoxia occurrence and indeed increased the hypoxia probability during the past two decades. In particular, the two severe hypoxia events, with large hypoxic zones and an unprecedentedly low DO value, occurred during very strong El Niño events (1997/98 and 2015/16). It is notable that the hypoxia was controlled by regional multiple factors from anthropogenic activities and natural processes. The ENSO, the remote low-latitude impact factor, provides important regional impact for the ECS coastal ecosystem.
4.3 Global Warming Impact on Summer Hypoxia off the Changjiang Estuary
Regional warming along with large riverine inflow is likely to prolong stratification, reduce vertical mixing, and eventually exacerbate bottom hypoxia in many estuaries, such as the Chesapeake Bay (Boesch, 2008), the Baltic Sea (Bendtsen and Hansen, 2013), and the Gulf of Mexico (Justic et al., 2005). However, at most stations and depths, the seawater temperature in August decreased slightly along Section C-C during 1997–2014 (Figure 2A). This result is in agreement with previous satellite observations (Kim et al., 2018). As a result of the cooling trend, the DO saturation has increased, especially for the waters at depth.
Although the ECS warming trend has not been significant during the past two decades, synoptic extreme SST events (marine heat waves) occur frequently and strongly impact the ECS hydrology (Park et al., 2015; Cai et al., 2017). Based on satellite records, Yan et al. (2020) reported three marine heat waves occurred in the summers of 2004, 2006, and 2016. However, no hypoxia event occurred in 2004 and the hypoxia event was not severe in 2006 along Section C-C (Figure 4), indicating large uncertainties in the relationship between coastal hypoxia and extreme ECS warming. The relationship between marine hot waves and 2016 hypoxia will be discussed in a separate paper.
Figure 11 shows the monthly mean and standard deviation of SST in the hypoxia area in August. The monthly mean SST was warmer in 2004, 2006, 2007, 2008, 2010, and 2013, and much cooler in 2009, 2011, and 2014. The SST interannual variation does not coincide with the occurrence of coastal hypoxia along Section C-C. However, the year-to-year variation of the standard deviation of SST is much more similar to the occurrence of hypoxia events. As mentioned in the ENSO Effect on DO Interannual Variation section, a low standard deviation value means that the SST field is relatively calm, providing a favorable condition for bottom hypoxia development. The correlation between SST standard derivation and ONI is −0.55 and significant at the 95% level.
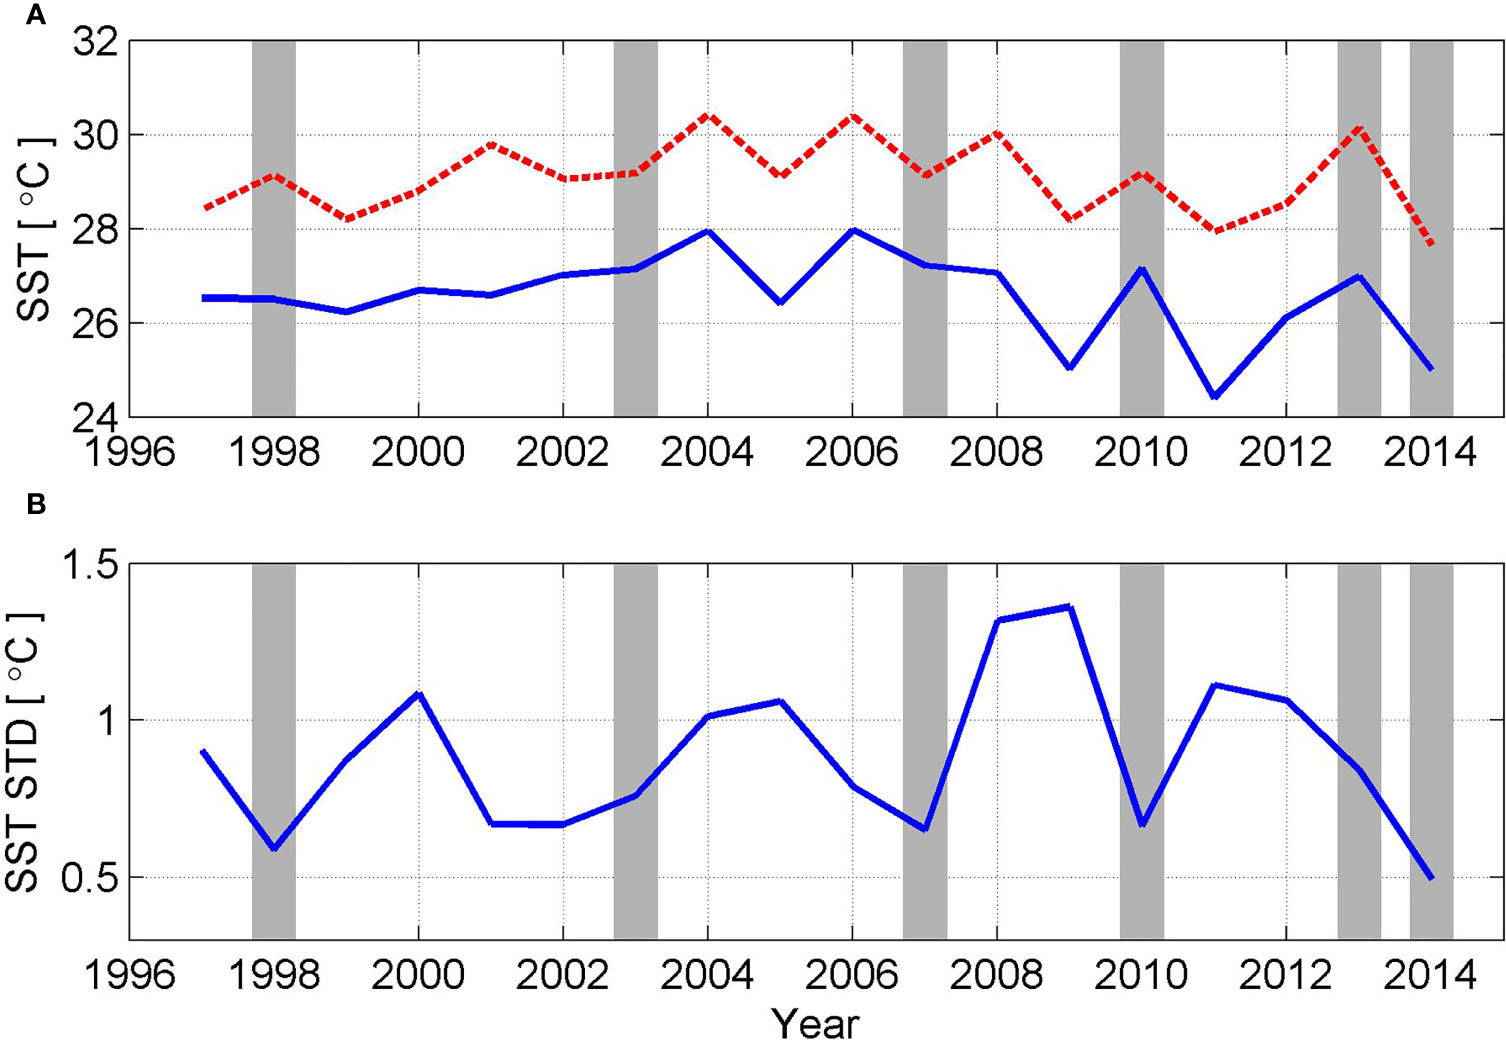
Figure 11 (A) Mean and maximum of SST for the hypoxia area (122°–124°E, 31°–33°N) from 1997 to 2014, with units of °C. Gray shaded areas indicate hypoxia events. (B) Same as (A), but for the standard deviation of SST.
5 Conclusions
The Changjiang Estuary and its adjacent ECS are sensitive to climate change. Based on repeated in situ observations over an 18-year period, we investigated the temporal variation of DO concentration and associated hypoxia/low-DO events off the Changjiang Estuary. The bottom DO presents a “dual-core” structure, which is associated with two hypoxic areas near the Changjiang river mouth and Changjiang Bank, respectively. During 1997–2014, the DO was highly variable year to year, and did not present significant trend at 95% confidence level. Only slightly decreasing trend was found in the nearshore region, which was associated with increasing AOU instead of the variation of DO solubility or stratification.
Although El Niño is not a prerequisite for hypoxia events (e.g., the hypoxia of 2013 and 2014 occurred in normal years), El Niño did enhance the dissolved oxygen depletion and bottom hypoxia probability off the Changjiang Estuary during 1997–2014. The El Niño events had a significant impact on physical processes in the ECS, which were conducive to hypoxia occurrence. Specifically, a large river runoff strengthened stratification and calmed climatic and hydrographic conditions. In the following summer of most El Niño events, storm-driven inputs of fresh water from elevated river discharge, the ensuing high ocean temperature in the upper layer, and wind-driven subsurface saline water intrusion jointly produced strong stratification and reduced ventilation. These factors were physically responsible for the formation of the hypoxia at the bottom. Additionally, the calm wind and SST also played important roles for the maintenance of stratification and the accumulation of DO deficit.
In this study, we demonstrated that natural processes can also cause and contribute to severe hypoxia in the ECS coastal waters, in addition to anthropogenic activities that have been well studied. More buoys should be deployed to monitor the inter-seasonal variability of bottom hypoxia under different environmental factors. Moreover, other important physical–biochemical processes, such as residual current speed and oceanic nutrient supply in the hypoxic area, should also be considered in further studies.
Data Availability Statement
The raw data supporting the conclusions of this article will be made available by the authors, without undue reservation.
Author Contributions
FZ and DH conceived the scientific questions. QZ supported the intensive cruise data. XM and AL analyzed the field data and wrote the original draft. BW, DT, QM, DZ, and JL provided suggestions about ENSO effect on coastal hypoxia. All authors listed have made a substantial, direct, and intellectual contribution to the work and approved it for publication.
Funding
This study is supported by the National Programme on Global Change and Air–Sea Interaction (Phase II, Grant No. GASI-01-CJK), the Scientific Research Fund of the Second Institute of Oceanography, MNR (Grant Nos. JG1618 and JG2008), the Key R&D Program of Zhejiang Province (Contract No. 2022C03044), the Project of State Key Laboratory of Satellite Ocean Environment Dynamics (Grant No. SOEDZZ2105), the National Natural Science Foundation of China (Grant Nos. 41606013, 41506030, and 41876026), the Zhejiang Provincial Natural Science Foundation (Grant No. LR16D060001), and the Zhejiang Provincial Ten Thousand Talents Plan (Grant No. 2020R52038).
Conflict of Interest
The authors declare that the research was conducted in the absence of any commercial or financial relationships that could be construed as a potential conflict of interest.
Publisher’s Note
All claims expressed in this article are solely those of the authors and do not necessarily represent those of their affiliated organizations, or those of the publisher, the editors and the reviewers. Any product that may be evaluated in this article, or claim that may be made by its manufacturer, is not guaranteed or endorsed by the publisher.
Acknowledgments
We thank the NOAA for providing SST data, PO.DAAC for providing CCMP wind data, Climate Research Unit in UK for providing land precipitation data, and the JTWC for providing western Pacific typhoon records.
Supplementary Material
The Supplementary Material for this article can be found online at: https://www.frontiersin.org/articles/10.3389/fmars.2022.897063/full#supplementary-material
References
Alvisi F., Cozzi S. (2016). Seasonal Dynamics and Long-Term Trend of Hypoxia in the Coastal Zone of Emilia Romagna (NW Adriatic Sea, Italy). Sci. Total. Environ. 541, 1448–1462. doi: 10.1016/j.scitotenv.2015.10.011
Atlas R., Hoffman R., Ardizzone J., Leidner S., Jusem J., Smith D., et al. (2011). A Cross-Calibrated, Multiplatform Ocean Surface Wind Velocity Product for Meteorological and Oceanographic Applications. Bull. Amer. Meteor. Soc 92, 157–174. doi: 10.1175/2010BAMS2946.1
Baird D., Christian R., Peterson C., Johnson G. (2004). Consequences of Hypoxia on Estuarine Ecosystem Function: Energy Diversion From Consumers to Microbes. Ecol. Appl. 14, 805–822. doi: 10.1890/02-5094
Bendtsen J., Hansen J. (2013). Effects of Global Warming on Hypoxia in the Baltic Sea–North Sea Transition Zone. Ecol. Model. 264, 17–26. doi: 10.1016/j.ecolmodel.2012.06.018
Breitburg D., Levin L., Oschlies A., Grégoire M., Chavez F., Conley D., et al. (2018). Declining Oxygen in the Global Ocean and Coastal Waters. Science 359, eaam7240. doi: 10.1126/science.aam7240
Cai W., Hu X., Huang W., Murrell M., Lehrter J., Lohrenz S., et al. (2011). Acidification of Subsurface Coastal Waters Enhanced by Eutrophication. Nat. Geosci. 4, 766–770. doi: 10.1038/NGEO1297
Cai R., Tan H., Kontoyiannis H. (2017). Robust Surface Warming in Off Shore China Seas and its Relationship to the East Asian Monsoon Wind Field and Ocean Forcing on Interdecadal Time Scales. J. Climate 30 (22), 8987–9005. doi: 10.1175/JCLI-D-16-0016.1
Carstensen J., Andersen J., Gustafsson B., Conley D. (2014). Deoxygenation of the Baltic Sea During the Last Century. Proc. Natl. Acad. Sci. Uni. States America 111 (15), 5628. doi: 10.1073/pnas.1323156111
Chen C., Gong G., Shiah F. (2007). Hypoxia in the East China Sea: One of the Largest Coastal Low-Oxygen Areas in the World. Mar. Environ. Res. 64 (4), 399–408. doi: 10.1016/j.marenvres.2007.01.007
Chen J., Li D., Jin H., Jiang Z., Wang B., Wu B., et al. (2020). “Changing Nutrients, Oxygen and Phytoplankton in the East China Sea,” in Changing Asia-Pacific Marginal Seas, Atmosphere, Earth, Ocean and Space. Springer Nature Singapore Pte Ltd: Singapore. doi: 10.1007/978-981-15-4886-4_10
Chen J., Ni X., Liu M., Chen J., Mao Z., Jin H., et al. (2014). Monitoring Occurrences of Seasonal Low-Oxygen Events in East China Sea From Integration of Remote Sensing, Buoy Observations, and Model. J. Geophys. Res. 119 (8), 5311–5322. doi: 10.1002/2014JC010333
Chen J., Pan D., Liu M., Mao Z., Zhu Q., Chen N., et al. (2017). Relationships Between Long-Term Trend of Satellite-Derived Chlorophyll-A and Hypoxia Off the Changjiang Estuary. Estuaries Coasts 40 (4), 1055–1065. doi: 10.1007/s12237-016-0203-0
Diaz R. J. (2001). Overview of Hypoxia Around the World. J. Environ. Qual. 30, 275–281. doi: 10.2134/jeq2001.302275x
Diaz R., Rosenberg R. (1995). Marine Benthic Hypoxia: A Review of its Ecological Effects and the Behavioural Responses of Benthic Macrofauna. Oceanogr. Mar. Biol. – Annu. Rev. 33, 245–303.
Diaz R., Rosenberg R. (2008). Spreading Dead Zones and Consequences for Marine Ecosystems. Sciences 321, 926–929. doi: 10.1126/science.1156401
Diaz R., Rosenberg R., Sturdivant K. (2019). “Hypoxia in Estuaries and Semi-Enclosed Seas,” in Ocean Deoxygenation–Everyone’s Problem: Causes, Impacts, Consequences and Solutions. Eds. D L., J. M B. (Gland, Switzerland: IUCN).
Fennel K., Testa J. (2019). Biogeochemical Controls on Coastal Hypoxia. Annu. Rev. Mar. Sci. 11, 105–130. doi: 10.1146/annurev-marine-010318-095138
Gregg W. (2001). Tracking the SeaWiFS Record With a Coupled Physical/Biogeochemical/Radiative Model of the Global Oceans. Deep Sea Res. 49, 81–105. doi: 10.1016/S0967-0645(01)00095-9
Hagy J., Boyton W., Keefe C., Wood K. (2004). Hypoxia in Chesapeake Bay 1950-2001: Long-Term Changes in Relation to Nutrient Loading and River Flow. Estuaries 27, 634–658. doi: 10.1007/BF02907650
Harris I., Osborn T., Jones P., Lister D. (2020). Version 4 of the CRU TS Monthly High-Resolution Gridded Multivariate Climate Dataset. Sci. Data 7, 109. doi: 10.1038/s41597-020-0453-3
He X., Bai Y., Pan D., Chen C., Cheng Q., Wang D., et al. (2013). Satellite Views of Seasonal and Inter-Annual Variability of Phytoplankton Blooms in the Eastern China Seas Over the Past 14 Yr, (1998–2011). Biogeosciences 10 (7), 4721–4739. doi: 10.5194/bg-10-4721-2013
Hu D. (1994). “Some Striking Features of Circulation in Huanghai Sea and East China Sea,” in Oceanology of China Seas. Eds. Zhou D., Liang Y. B., Zeng C. K. (Kluwer Academic Publishers, Springer, Dordrecht), 27–38.
Huang B., Liu C., Banzon V., Freeman E., Graham G., Smith T., Zhang H. (2021). Improvements of the Daily Optimum Interpolation Sea Surface Temperature (DOISST) Version 2.1. J. Climate 34, 7421–7441. doi: 10.1175/JCLI-D-20-0166.1
Justic D., Rabalais N., Turner R. (2005). Coupling Between Climate Variability and Coastal Eutrophication: Evidence and Outlook for the Northern Gulf of Mexico. J. Sea Res. 54, 25–35. doi: 10.1016/j.seares.2005.02.008
Kim Y., Jang C., Yeh S. (2018). Recent Surface Cooling in the Yellow and East China Seas and the Associated North Pacific Climate Regime Shift. Continent. Shelf Res. 156, 43–54. doi: 10.1016/j.csr.2018.01.009
Li W., Ge J., Ding P., Ma J., Glibert P., Liu D. (2021). Effects of Dual Fronts on the Spatial Pattern of Chlorophyll-A Concentrations in and Off the Changjiang River Estuary. Estuaries Coasts 44 (5), 1408–1418. doi: 10.1007/s12237-020-00893-z
Li D., Zhang J., Huang D., Wu Y., Liang J. (2002). Oxygen Depletion Off the Changjiang (Yangtze River) Estuary. Science in China Series D: Earth Sciences, 45(12), 1137–1146
Li R., Zhou W. (2012). Changes in Western Pacific Tropical Cyclones Associated With the El Niño-Southern Oscillation Cycle. J. Climate 25 (17), 5864–5878. doi: 10.1175/JCLI-D-11-00430.1
Liu Z., Gan J., Hu J., Wu H., Cai Z., Deng Y. (2021). Progress on Circulation Dynamics in the East China Sea and Southern Yellow Sea: Origination, Pathways, and Destinations of Shelf Currents. Prog. Oceanogr. 193, 102553. doi: 10.1016/j.pocean.2021.102553
Liu Z., Xu R., Liu C., Qin Y., Cai P. (2012). Characters of Hypoxia Area Off the Yangtze River Estuary and its Influence (in Chinese). Mar. Sci. Bull. 2012 (5), 588–593.
Middelburg J., Levin L. (2009). Coastal Hypoxia and Sediment Biogeochemistry. Biogeosciences 6, 1273–1293. doi: 10.5194/bg-6-1273-2009
Nam S., Kim H., Send U. (2011). Amplification of Hypoxic and Acidic Events by La Niña Conditions on the Continental Shelf Off California. Geophys. Res. Lett. 38, L22602. doi: 10.1029/2011GL049549
Ni X., Huang D., Zeng D., Zhang T., Li H., Chen J. (2016). The Impact of Wind Mixing on the Variation of Bottom Dissolved Oxygen Off the Changjiang Estuary During Summer. J. Mar. Syst. 154, 122–130. doi: 10.1016/j.jmarsys.2014.11.010
Ning X., Lin C., Su J., Liu C., Hao Q., Le F. (2011). Long-Term Changes of Dissolved Oxygen, Hypoxia, and the Responses of the Ecosystems in the East China Sea From 1975 to 1995. J. Oceanogr. 67 (1), 59–75. doi: 10.1007/s10872-011-0006-7
Office of Integrated Oceanographic Survey of China (1961). “Dataset of the National Integrated Oceanographic Survey, Vol. 1,” in Survey Data of Hydrometeorological and Chemical Elements in the Bohai, Huanghai and East China Seas(Beijing), 811.
Park T., Jang C., Jungclaus J., Haak H., Park W. (2011). Effects of the Changjiang River Discharge on Sea Surface Warming in the Yellow and East China Seas in Summer. Continent. Shelf Res. 31, 15–22. doi: 10.1016/j.csr.2010.10.012
Park T., Jang C., Kwon M., Na H., Kim K. (2015). An Effect of ENSO on Summer Surface Salinity in the Yellow and East China Seas. J. Mar. Syst. 141, 122–127. doi: 10.1016/j.jmarsys.2014.03.017
Qian W., Dai M., Xu M., Kao S., Du C., Liu J., et al. (2017). Non-Local Drivers of the Summer Hypoxia in the East China Sea Off the Changjiang Estuary. Estuarine Coastal Shelf Sci. 198, 393–399. doi: 10.1016/j.ecss.2016.08.032
Rabouille C., Conley D., Dai M., Cai W., Chen C., Lansard B., et al. (2008). Comparison of Hypoxia Among Four River-Dominated Ocean Margins: The Changjiang (Yangtze), Mississippi, Pearl, and Rhone Rivers. Continent. Shelf Res. 28, 1527–1537. doi: 10.1016/j.csr.2008.01.020
Signorini S., Murtugudde R., McClain C., Christian J., Picaut J., Busalacchi A. (1999). Biological and Physical Signatures in the Tropical and Subtropical Atlantic. J. Geophys. Res. 104, 18367 –18,382. doi: 10.1029/1999JC900134
Siswanto E., Xu Y., Ishizaka J. (2018). A Rare Dispersion of Low-Salinity, High-Gelbstoff, High-Primary Production Water in the East China Sea During the Summer of 2010: Possible Influence of the ENSO. J. Geophys. Res. 123 (4), 2757–2767. doi: 10.1002/2017JC013319
Su Y., Li F., Wang F. (1996). Water Type Distribution and Water Regime Division in the Bohai, Yellow and East China Seas. Acta Oceanol. Sin. (in Chin. Engl. Abstract). 18, 1–7.
Sun C., Yan X. (2012). Interannual Variations of Surface Winds Over China Marginal Seas. Chin. J. Oceanol. Limnol. 30 (6), 908–921. doi: 10.1007/s00343-012-2156-x
Tan H., Cai R. (2018). What Caused the Record-Breaking Warming in East China Seas During August 2016? Atmospher. Sci. Lett. 19 (10), e853. doi: 10.1002/asl.853
Testa J., Kemp W. (2012). Hypoxia-Induced Shifts in Nitrogen and Phosphorus Cycling in Chesapeake Bay. Limnol. Oceanogr. 57, 835–850. doi: 10.4319/lo.2012.57.3.0835
Tian D., Zhou F., Zhang W., Zhang H., Ma X., Guo X., et al. (2022). Effects of Dissolved Oxygen and Nutrients From the Kuroshio Current on Hypoxia Off the Changjiang Estuary. J. Oceanol. Limnol. 40, 515–529. doi: 10.1007/s00343-021-0440-3
Turner R., Rabalais N. (1994). Coastal Eutrophication Near the Mississippi River Delta. Nature 368, 619–621 6472. doi: 10.1038/368619a0
Vaquer-Sunyer R., Duarte C. (2008). Thresholds of Hypoxia for Marine Biodiversity. Proc. Natl. Acad. Sci. U.S.A. 105, 15452–15457. doi: 10.1073/pnas.0803833105
Wang B. (2009). Hydromorphological Mechanisms Leading to Hypoxia Off the Changjiang Estuary. Mar. Environ. Res. 67, 53–58. doi: 10.1016/j.marenvres.2008.11.001
Wang K., Cai W., Chen J., Kirchman D., Wang B., Fan W., et al. (2021). Climate and Human-Driven Variability of Summer Hypoxia on a Large River-Dominated Shelf as Revealed by a Hypoxia Index. Front. Mar. Sci. 8. doi: 10.3389/fmars.2021.634184
Wang H., Dai M., Liu J., Kao S., Zhang C., Cai W., et al. (2016). Eutrophication-Driven Hypoxia in the East China Sea Off the Changjiang Estuary. Environ. Sci. Technol. 50 (5), 2255–2263. doi: 10.1021/acs.est.5b06211
Wang B., Wang X. (2007). Chemical Hydrography of Coastal Upwelling in the East China Sea. Chin. J. Oceanol. Limnol. 25 (1), 16–26. doi: 10.1007/s00343-007-0016-x
Wang B., Wei Q., Chen J., Xie L. (2012). Annual Cycle of Hypoxia Off the Changjiang (Yangtze River) Estuary. Mar. Environ. Res. 77, 1–5. doi: 10.1016/j.marenvres.2011.12.007
Wang B., Xin M., Wei Q., Xie L. (2018). A Historical Overview of Coastal Eutrophication in the China Seas. Mar. Pollut. Bull. 136, 394–400. doi: 10.1016/j.marpolbul.2018.09.044
Wei H., He Y., Li Q., Liu Z., Wang H. (2007). Summer Hypoxia Adjacent to the Changjiang Estuary. J. Mar. Syst. 69, 292–303. doi: 10.1016/j.jmarsys.2006.04.014
Wei H., Luo X., Zhao Y., Zhao L. (2015). Intraseasonal Variation in the Salinity of the Yellow and East China Seas in the Summers of 2011, 2012, and 2013. Hydrobiologia 754, 13–28. doi: 10.1007/s10750-014-2133-9
Wei Q., Wang H., Ge R., Xie L. (2013). Chemical Hydrography and Seasonal Succession in the Border Between Yellow Sea and East China Sea. Oceanol. Limnol. Sin. (in Chin. Engl. Abstract) 44 (005), 1170–1181.
Wei Q., Wang B., Yu Z., Chen J., Xue L. (2017). Mechanisms Leading to the Frequent Occurrences of Hypoxia and a Preliminary Analysis of the Associated Acidification Off the Changjiang Estuary in Summer. Sci. China Earth Sci. 60, 360–381. doi: 10.1007/s11430-015-5542-8
Wright J., Konwar K., Hallam S. (2012). Microbial Ecology of Expanding Oxygen Minimum Zones. Nat. Rev. Microbiol. 10, 381–394. doi: 10.1038/nrmicro2778
Xie S., Hu K., Hafner J., Tokinaga H., Du Y., Huang G., et al. (2009). Indian Ocean Capacitor Effect on Indo–western Pacific Climate During the Summer Following El Niño. J. Climate 22, 730–747. doi: 10.1175/2008JCLI2544.1
Xuan J., Huang D., Zhou F., Zhu X., Fan X. (2012). The Role of Wind on the Detachment of Low Salinity Water in the Changjiang Estuary in Summer. J. Geophys. Res. 117, C10004. doi: 10.1029/2012JC008121
Yan Y., Chai F., Xue H., Wang G. (2020). Record-Breaking Sea Surface Temperatures in the Yellow and East China Seas. J. Geophys. Res. 125, e2019JC015883. doi: 10.1029/2019JC015883
Zhang H., Fennel K., Laurent A., Bian C. (2020). A Numerical Model Study of the Main Factors Contributing to Hypoxia and its Interannual and Short-Term Variability in the East China Sea. Biogeosciences 17, 5745–5761. doi: 10.5194/bg-17-5745-2020
Zhang W., Wu H., Zhu Z. (2018). Transient Hypoxia Extent Off Changjiang River Estuary Due to Mobile Changjiang River Plume. J. Geophys. Res. 123 (12), 9196–9211. doi: 10.1029/2018JC014596
Zhao Q., Cai Y., He S., He Q. (2015). Optimal Interpolation Assimilation Experiments Based on the Data From Section Investigation in the East China Sea. Mar. Sci. Bull. (in Chin. Engl. abstract) 34 (3), 275–282.
Zhou F., Chai F., Huang D., Xue H., Chen J., Xiu P., et al. (2017). Investigation of Hypoxia Off the Changjiang Estuary Using a Coupled Model of ROMS-CoSiNE. Prog. Oceanogr. 159, 237–254. doi: 10.1016/j.pocean.2017.10.008
Zhou F., Chai F., Huang D., Wells M., Ma X., Meng Q., et al. (2020). Coupling and Decoupling of High Biomass Phytoplankton Production and Hypoxia in a Highly Dynamic Coastal System: The Changjiang (Yangtze River) Estuary. Front. Mar. Sci. 7. doi: 10.3389/fmars.2020.00259
Zhou F., Xuan J., Ni X., Huang D. (2009). A Preliminary Study on Variations of the Changjiang Diluted Water Between August 1999 and 2006. Acta Oceanol Sin. 28 (6), 1–11. doi: 10.3969/j.issn.0253-505X.2009.06.001
Zhou F., Zhang J., Huang D., Ni X., Xuan J., Zhu K. (2010). Hydrographic Analysis on the Multi-Time Scale Variability of Hypoxia Adjacent to the Changjiang River Estuary. . Acta Ecol. Sin. (in Chin. Engl. abstract) 30 (17), 4728–4740.
Zhou T., Yu R. (2005). Atmospheric Water Vapor Transport Associated With Typical Anomalous Summer Rainfall Patterns in China. J. Geophys. Res. 110, D08104. doi: 10.1029/2004JD005413
Zhou T., Zhang L., Li H. (2008). Changes in Global Land Monsoon Area and Total Rainfall Accumulation Over the Last Half Century. Geophys. Res. Lett. 35 (16), 134–143. doi: 10.1029/2008GL034881
Zhu Z., Wu H., Liu S., Wu Y., Huang D., Zhang J., et al. (2017). Hypoxia Off the Changjiang (Yangtze River) Estuary and in the Adjacent East China Sea: Quantitative Approaches to Estimating the Tidal Impact and Nutrient Regeneration. Mar. Pollution Bull. 125, 103–114. doi: 10.1016/j.marpolbul.2017.07.029
Zhu Z., Zhang J., Wu Y., Zhang Y., Lin J., Liu S. (2011). Hypoxia Off the Changjiang (Yangtze River) Estuary: Oxygen Depletion and Organic Matter Decomposition. Mar. Chem. 125 (1–4), 108–116. doi: 10.1016/j.marchem.2011.03.005
Zhu J., Zhu Z., Lin J., Wu H., Zhang J. (2016). Distribution of Hypoxia and Pycnocline Off the Changjiang Estuary, China. J. Mar. Syst. 154, 28–40. doi: 10.1016/j.jmarsys.2015.05.002
Keywords: Hypoxia, Changjiang Estuary, East China Sea, repeated hydrographic section, ENSO
Citation: Ma X, Liu A, Zhao Q, Wang B, Tian D, Meng Q, Zeng D, Li J, Huang D and Zhou F (2022) Temporal Variation of Summer Hypoxia off Changjiang Estuary During 1997–2014 and Its Association With ENSO. Front. Mar. Sci. 9:897063. doi: 10.3389/fmars.2022.897063
Received: 15 March 2022; Accepted: 03 May 2022;
Published: 09 June 2022.
Edited by:
Jie Xu, University of Macau, ChinaReviewed by:
Jing Zhang, University of Toyama, JapanTianqi Xiong, Chinese Academy of Sciences (CAS), China
Copyright © 2022 Ma, Liu, Zhao, Wang, Tian, Meng, Zeng, Li, Huang and Zhou. This is an open-access article distributed under the terms of the Creative Commons Attribution License (CC BY). The use, distribution or reproduction in other forums is permitted, provided the original author(s) and the copyright owner(s) are credited and that the original publication in this journal is cited, in accordance with accepted academic practice. No use, distribution or reproduction is permitted which does not comply with these terms.
*Correspondence: Feng Zhou, emhvdWZlbmdAc2lvLm9yZy5jbg==