
94% of researchers rate our articles as excellent or good
Learn more about the work of our research integrity team to safeguard the quality of each article we publish.
Find out more
ORIGINAL RESEARCH article
Front. Mar. Sci., 10 October 2022
Sec. Marine Biogeochemistry
Volume 9 - 2022 | https://doi.org/10.3389/fmars.2022.895995
This article is part of the Research TopicBiogeochemistry and Genomics of Silicification and Silicifiers, volume IIView all 11 articles
 Natalia Llopis Monferrer1,2*
 Tristan Biard3
 Miguel M. Sandin2,4
 Fabien Lombard5,6Marc Picheral5Amanda Elineau5
 Lionel Guidi5
 Aude Leynaert1
 Paul J. Tréguer1
 Fabrice Not2
Siliceous Rhizaria (polycystine radiolarians and phaeodarians) are significant contributors to carbon and silicon biogeochemical cycles. Considering their broad taxonomic diversity and their wide size range (from a few micrometres up to several millimetres), a comprehensive evaluation of the entire community to carbon and silicon cycles is challenging. Here, we assess the diversity and contribution of silicified Rhizaria to the global biogenic silica stocks in the upper 500 m of the oligotrophic North-Western Mediterranean Sea using both imaging (FlowCAM, Zooscan and Underwater Vision Profiler) and molecular tools and data. While imaging data (cells m-3) revealed that the most abundant organisms were the smallest, molecular results (number of reads) showed that the largest Rhizaria had the highest relative abundances. While this seems contradictory, relative abundance data obtained with molecular methods appear to be closer to the total biovolume data than to the total abundance data of the organisms. This result reflects a potential link between gene copies number and the volume of a given cell allowing reconciling molecular and imaging data. Using abundance data from imaging methods we estimate that siliceous Rhizaria accounted for up to 6% of the total biogenic silica biomass of the siliceous planktonic community in the upper 500m of the water column.
Marine environments represent the largest ecosystem on Earth, housing a broad variety of planktonic organisms, from viruses and bacteria to unicellular and small multicellular eukaryotes. These organisms, which span more than six orders of magnitude in size, form complex ecological networks that sustain major biogeochemical cycles (Edwards et al., 2013). While phytoplankton forms the base of marine food webs, zooplankton occupy numerous trophic levels and can contribute to carbon export through mechanisms such as vertical migration and production of fecal pellets (Stukel et al., 2013; Toullec et al., 2019). To date, studies of phytoplankton assemblages have focused mostly on diatoms, dinoflagellates, and cyanobacteria (Alves-de-Souza et al., 2008), while the role of zooplankton in the ocean has been assessed through the study of copepods and euphausiids (e.g., Buitenhuis et al., 2006), mainly because of their high abundances and good preservation in formaline. These are however very specific compartments, only representing limited aspects of the functional diversity of plankton (Le Queré et al., 2005), omitting the potential role of other organisms when developing biogeochemical models.
In recent years, automated sampling devices, image analysis technologies, and machine learning algorithms have been developed to quantify abundances of marine organisms (Gorsky et al., 2010; Picheral et al., 2010; Irisson et al., 2022) and to accelerate the analysis of planktonic samples which are generally time-consuming (Benfield et al., 2007). These methods have been fundamental in revealing the occurrence and potential impact of previously neglected organisms in biogeochemical cycles (Biard et al., 2016). In addition to imaging systems, DNA-metabarcoding, allowing an extensive taxonomic coverage, has become a powerful alternative to morphological observation, being largely used in high-throughput exploration of the diversity of microbial communities (de Vargas et al., 2015; Faure et al., 2019).
Despite the benefits of either method, these come with inherent uncertainties. Imaging tools do not cover all the size spectra of plankton (Lombard et al., 2019), and several tools/instruments need to be used simultaneously to study all components of the marine ecosystem. On the other end, molecular approaches produce relative-abundance and compositional data. Abundances of specific groups are inherently influenced by the abundances of other groups, thus biasing conclusions (Gloor et al., 2017).
In the modern ocean, Rhizaria, a group of unicellular eukaryotic organisms that span a wide range of sizes, from tens to hundreds of micrometres, are known to play important roles in food webs and biogeochemical cycles (Biard, 2022). In the last decade, this group has been highlighted as a critical source of carbon export (Lampitt et al., 2009; Guidi et al., 2016; Gutierrez-Rodriguez et al., 2018), silica cycling (Biard et al., 2018; Llopis Monferrer et al., 2020), and a significant component of ocean biomass (Biard et al., 2016). While some rhizarians build their skeletons of calcium carbonate (Foraminifera) or strontium sulfate (Acantharia), numerous marine rhizarians form siliceous skeletons (Nassellaria, Spumellaria, Collodaria and Phaeodaria) (Takahashi et al., 1983). Considering their large taxonomic diversity, broad size spectrum and extended range of vertical niches (Biard and Ohman, 2020) as well as various trophic modes (Suzuki and Not, 2015), Rhizaria lack a characterisation of their full size range and quantification of their contribution to biogeochemical cycles.
Historically, living Rhizaria, have been collected using plankton nets and Niskin bottles (Boltovskoy et al., 1993; Boltovskoy, 2003; Ishitani and Takahashi, 2007). These conventional sampling methods collect more efficiently smaller specimens, which are also numerically more abundant (e.g., Boltovskoy et al., 2010). So far, large individuals have seldom been taken into account, mainly due to the fragility of their skeletons and only fragments are generally found in the nets. The development of in-situ imaging techniques has enabled the first characterizations and estimates of these organisms in the pelagic realm (Biard et al., 2016; Biard and Ohman, 2020). Despite their recent confirmed relevance to current marine biogeochemical cycles (e.g., Biard et al., 2016; Guidi et al., 2016; Llopis Monferrer et al., 2020), knowledge about the distribution and abundances of living Rhizaria is still highly fragmented due to the scarcity of the data and heterogeneity between collection methods and sample analyses. These protists have been patchily sampled and their distribution and role in the biogeochemical cycles, especially in the silicon cycle, are not yet fully understood.
In September 2017, we participated in the Mediterranean Ocean Observing System for the Environment – Grande Echelle (MOOSE-GE) cruise. During this cruise, three imaging technologies, FlowCAM, ZooScan and Underwater Vision Profiler, were employed in combination along with DNA metabarcoding sampled at the same locations. We used this integrative approach to describe the broad size spectrum of Rhizaria, their abundance and diversity. Using the data obtained with the imaging instruments and the existing allometry between silica content and rhizarians’ biovolume (Llopis Monferrer et al., 2020), we assess the contribution of rhizarian biogenic silica standing stock and potential taxa specific contribution to the silicon cycle on a regional scale.
Sampling was conducted at 16 sites during the MOOSE‐GE 2017 expedition (30/08/2017-24/09/2017) on board R/V Atalante in the North-Western basin of the Mediterranean Sea (Figure 1). This area is characterized by oligotrophic conditions with patchy productivity regions (Mayot et al., 2017). The Gulf of Lion is an important area of deep water formation (Donoso et al., 2017), with intense mesoscale activity along with the coastal current and mid-sea eddies present along the basin (Robinson et al., 2001).
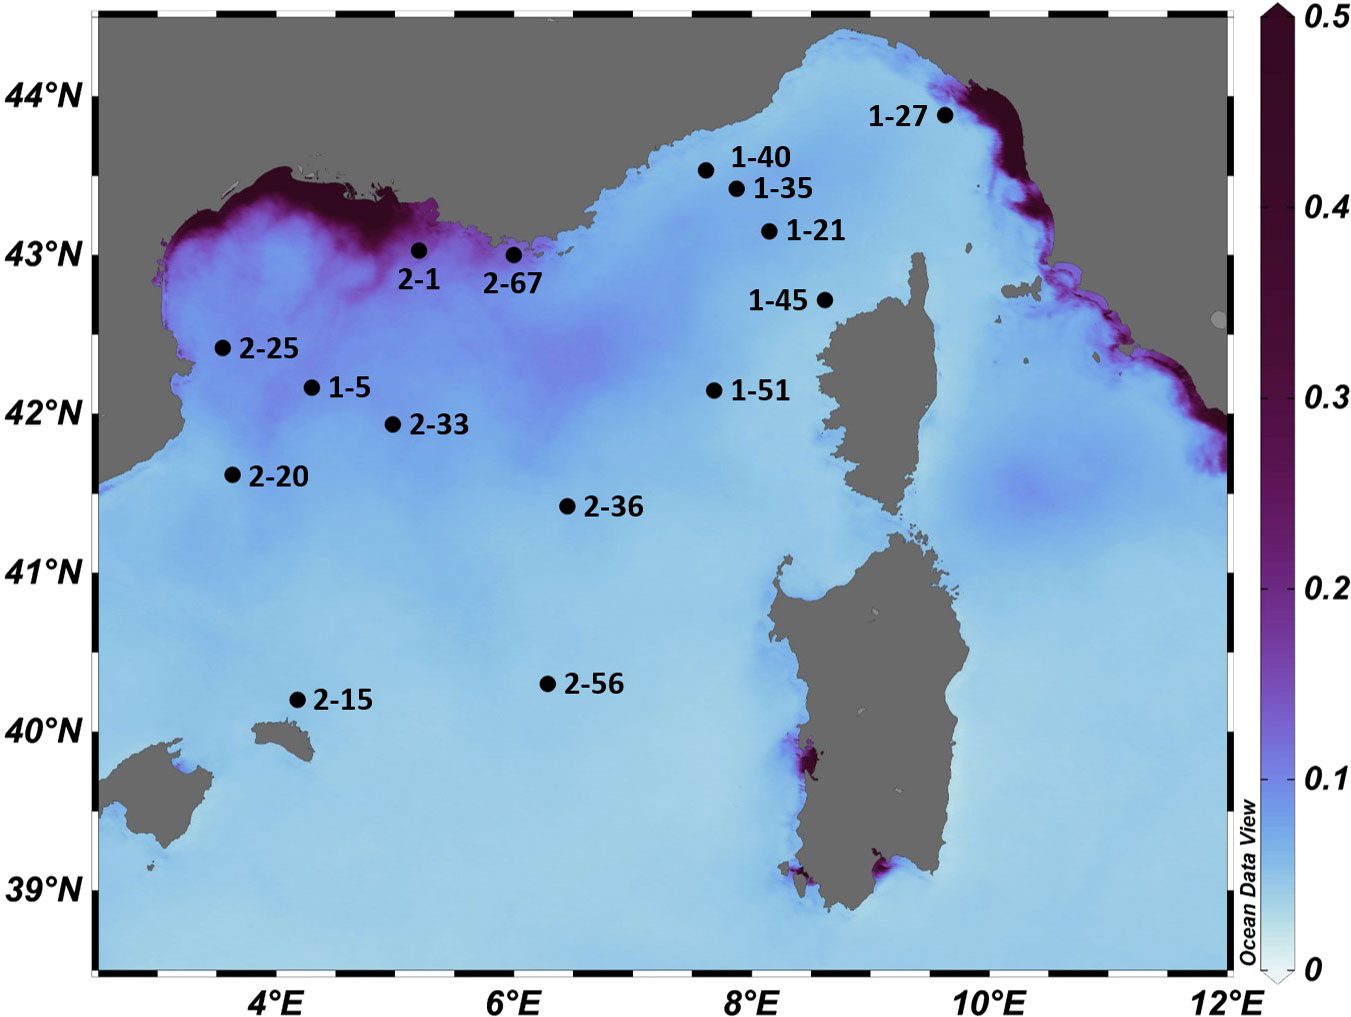
Figure 1 Map of the study area (North-Western Mediterranean basin) of the MOOSE-GE expedition with positions of the sampling stations (LEG-Station) that were analysed in this study. Axis colour represents average chlorophyll values in mg m-3 during September 2017, the study period. Data was collected using E.U. Copernicus Marine Service Information (https://doi.org/10.48670/moi-00114).
At each station, a rosette carrying 12 Niskin bottles (12 L) and equipped with a CTD (Seabird Electronics) to measure temperature and salinity was deployed. Samples were taken according to the requirements of biogeochemical parameters. Chlorophyll-a concentration was estimated from bottle water samples using HPLC (Uitz et al., 2009). To measure biogenic silica concentrations, 1 L of seawater sampled at 3 depths distributed between the surface and the deep chlorophyll maximum (DCM), which was calculated according to maximum values of fluorescence, was filtered onto 0.6 µm, 47 mm isopore polycarbonate filters (GE Healthcare Whatman). After filtration, filters were kept in petri dishes and stored at room temperature. Analyses were performed using the double digestion method according to Brzezinski and Nelson (1989).
A triple net, with 64, 200, and 500 µm mesh sizes was deployed in a vertical haul mode at the constant speed of 0.8 m s-1 in the upper 500 m. A flowmeter was attached to the mouth of each net to quantify the amount of water passing through the net. Once the net was on board the ship, samples concentrated in each cod-end were diluted in 4 L of 0.2-µm filtered seawater and divided into several subsamples.
For the 64 µm cod-end, a subsample of 1.5 L was concentrated on a 50 µm mesh sieve. The concentrated sample was carefully removed from the sieve using a squeeze bottle and preserved with acidic Lugol’s solution (2% final concentration) in a 250 mL dark plastic bottle to avoid light and stored at 4°C for later analysis with the FlowCAM (Fluid Imaging Inc.) (Sieracki et al., 1998).
For the 200 µm cod-end, a subsample of 1.5 L was concentrated using a 180 µm sieve. The content of the sieve was poured into a 250-mL plastic bottle with 25 – 30 mL tetraborax buffered formaldehyde (4%v/v) and stored at room temperature for later analysis with the Zooscan imaging system (Hydroptic; Gorsky et al., 2010).
For genetic analyses, 1 L of each cod-end (64, 200 and 500 µm), was filtered through a 10 µm polycarbonate filter. Filters from the different size fractions were flash-frozen in liquid nitrogen and stored independently at -80°C until DNA extraction.
The FlowCAM is an imaging system for measuring and classifying organisms and particles (size from 3 to 5000 µm, depending on the objective chosen) present in a liquid medium. Samples from the 64 µm cod-end and fixed with Lugol’s solution were analysed using a FlowCAM at the Villefranche Platform for Quantitative imaging (PIQv). Before the analysis, samples were filtered through a 200 µm sieve to remove large particles and avoid clogging of the FlowCAM chamber. Plankton organisms were counted using the “auto-trigger mode” of the FlowCAM. Samples were examined under a 4x objective lens and pumped through a 3mm x 0.3mm chamber for 45 minutes or until reaching 30 000 images (volume varied 0.6883 ml to 8.88707 ml). Raw images were saved to analyse them using the Zooprocess software (Gorsky et al., 2010).
The Zooscan is a plankton scanner that takes high-resolution images of planktonic samples (Gorsky et al., 2010). Samples in tetraborax-formaldehyde 4%v/v were digitized at 4800 dpi using the Zooscan at the PIQv. Each of the samples collected were first divided into two size fractions using 1000 μm sieves: d1 for the organisms larger than 1 mm and d2, for the organisms smaller than 1 mm. Each of the two size fractions (d1, d2) was subsampled using a Motoda splitter to reach aliquots containing nearly 500 to 1000 objects and imaged with the Zooscan (Gorsky et al., 2010).
The Underwater Vision Profiler (UVP5; Hydroptic) was integrated on the CTD-rosette. The UVP5 allows the acquisition of particles and zooplankton images larger than >700 µm and to quantify them in a known volume of water. The UVP operates a 4 MPix camera imaging a field of view of approximately 180 x 180 mm2 about 200mm in front of the camera. Vertical profiles exceeded 500 m except Station 27 (Leg1), but only data from the upper 500 m of the water column was used in this study in order to compare with results from the plankton nets.
DNA was extracted using the MasterPure Complete DNA and RNA Purification Kit (Epicentre) following the manufacturer’s instructions. This particular extraction method was used because it has been proven to be appropriate for cells with robust skeletons, such as Rhizaria (Pernice et al., 2016). Polymerase chain reaction (PCR) amplification was performed with the general eukaryotic primer pair TAReuk454FWD1 (5’-CCAGCASCYGCGGTAATTCC-3’) and TAReukREV3 (5’-ACTTTCGTTCTTGATYRA-3’) targeting the V4 hypervariable region of the 18S rDNA (Stoeck et al., 2010). Sequencing was performed using the Illumina MiSeq platform (2x250 bp) for over 50000 reads per sample.
All raw images generated by FlowCAM, Zooscan, and UVP were analysed and processed using the Zooprocess software (Gorsky et al., 2010). Extracted images were uploaded to Ecotaxa, an online collaborative software dedicated to the visual exploration and taxonomic annotation of planktonic images (Picheral et al., 2017). The Random Forest algorithm (Breiman, 2001) was used to classify all objects into major plankton categories. The automatic classification was visually inspected to ensure the quality of the sorting. Only images corresponding to siliceous Rhizaria were picked out for subsequent analyses. For each instrument, abundances (ind. m-3) of each rhizarian category were calculated at every station and morphological measurements associated with each vignette, such as body length and width, were used to obtain biovolumes (Supplementary Tables 1–3).
Raw reads obtained from sequencing were processed and clustered following DADA2 (Callahan et al., 2016). The resulting amplicons sequence variants (ASVs) were taxonomically assigned using global search implemented in Vsearch (Rognes et al., 2016) against PR2 v4.14.0 database (Guillou et al., 2012) updated with Radiolaria sequences from (Méndez-Sandín, 2019). ASVs were considered for further analyses as long as they were present in at least 2 of the 48 samples examined and had more than 10 total reads in those samples and assigned to Phaeodaria and polycystine radiolarians (Spumellaria and Nassellaria, excluding Collodaria). Different size fractions were pooled together. The final dataset was composed of a total of 48 ASVs, normalized by sample to relative abundance.
Area of the imaged specimen were computed according to Picheral et al. (2017). From the area, we calculated the equivalent spherical diameter (ESD; Equation1) to prevent overestimation of the individual’s biovolume, since in some cases, the skeleton can have complex shapes, including long and irregular spines.
where ESD (in µm) is the equivalent spherical diameter and Area is the pixel area of the imaged organism.
Then, we calculated the biovolume (µm3) using the following equation:
where ESD is the spherical diameter calculated with equation 1.
After calculating the biovolume (equation 2), we calculated the individual silica content of Rhizaria by using the log-linear relationship established by Llopis Monferrer et al. (2020), which relates silica content to biovolume (R2 = 0.86):
where QbSi is the biogenic silica content of the specimen (µg-Si cell-1).
Surface temperature during the cruise ranged from 16.0°C to 22.2°C. Integrated Chlorophyll a (Chl a) values over the 0-150 m layer, varied between 2 and 45 mg m-2. The depth of deep chlorophyll maximum (DCM) varied from 42 to 95 m. Biogenic silica concentrations, integrated over the surface to DCM layer ranged from 1.7 to 6.8 mmol-Si m-2 (Table 1).
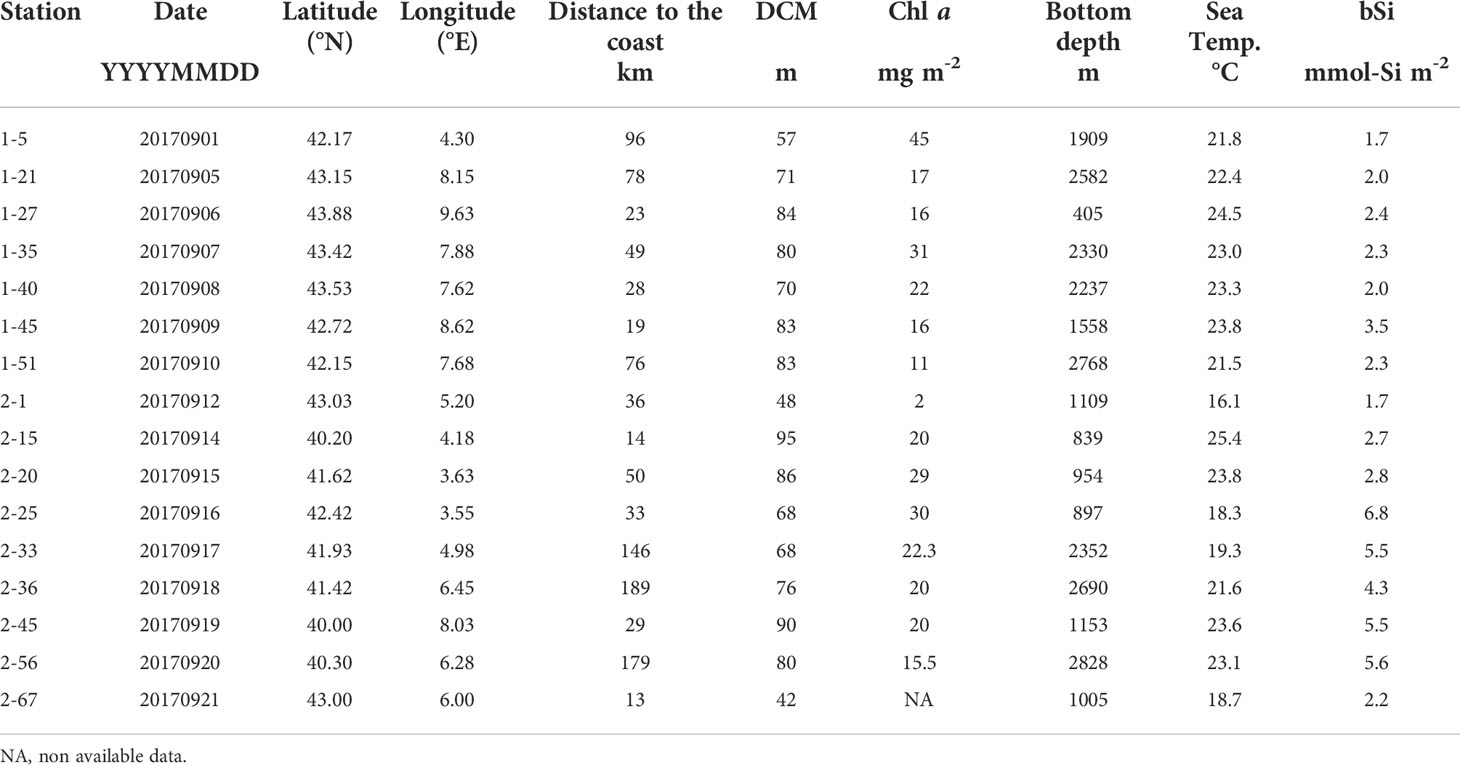
Table 1 Study sites location and collection date. Chlorophyll a (Chl a) and biogenic silica (bSi) values were integrated over the 0-DCM layer.
A total of 753 rhizarians specimens were imaged using different imaging devices: either the FlowCAM (195 vignettes; 64-200 µm), the Zooscan (341, 200-1000 µm), or the UVP (217; >1000 µm). The overall size of the analysed organisms ranges from 45 to 3663 µm in equivalent spherical diameter (ESD; Figure 2). In the present study, the FlowCAM recorded the smallest individuals, with an ESD ranging from 45 to 176 µm (mean ± standard deviation; 103 ± 26 µm). Among the three instruments, the FlowCAM was the only one able to capture some of the polycystine radiolarians (i.e., Spumellaria and Nassellaria) and phaeodarians of the genus Challengeria. The Zooscan captured individuals with ESD ranging from 365 to 1244 µm (799 ± 146 µm), which all belonged to the family Aulacanthidae (Phaeodaria). The UVP imaged the largest individuals, starting with an ESD of 945 µm up to 3662 µm (1279 ± 429 µm), with the smallest individuals belonging to the Aulacanthidae family and the largest cells to the Coelodendridae family (Phaeodaria).
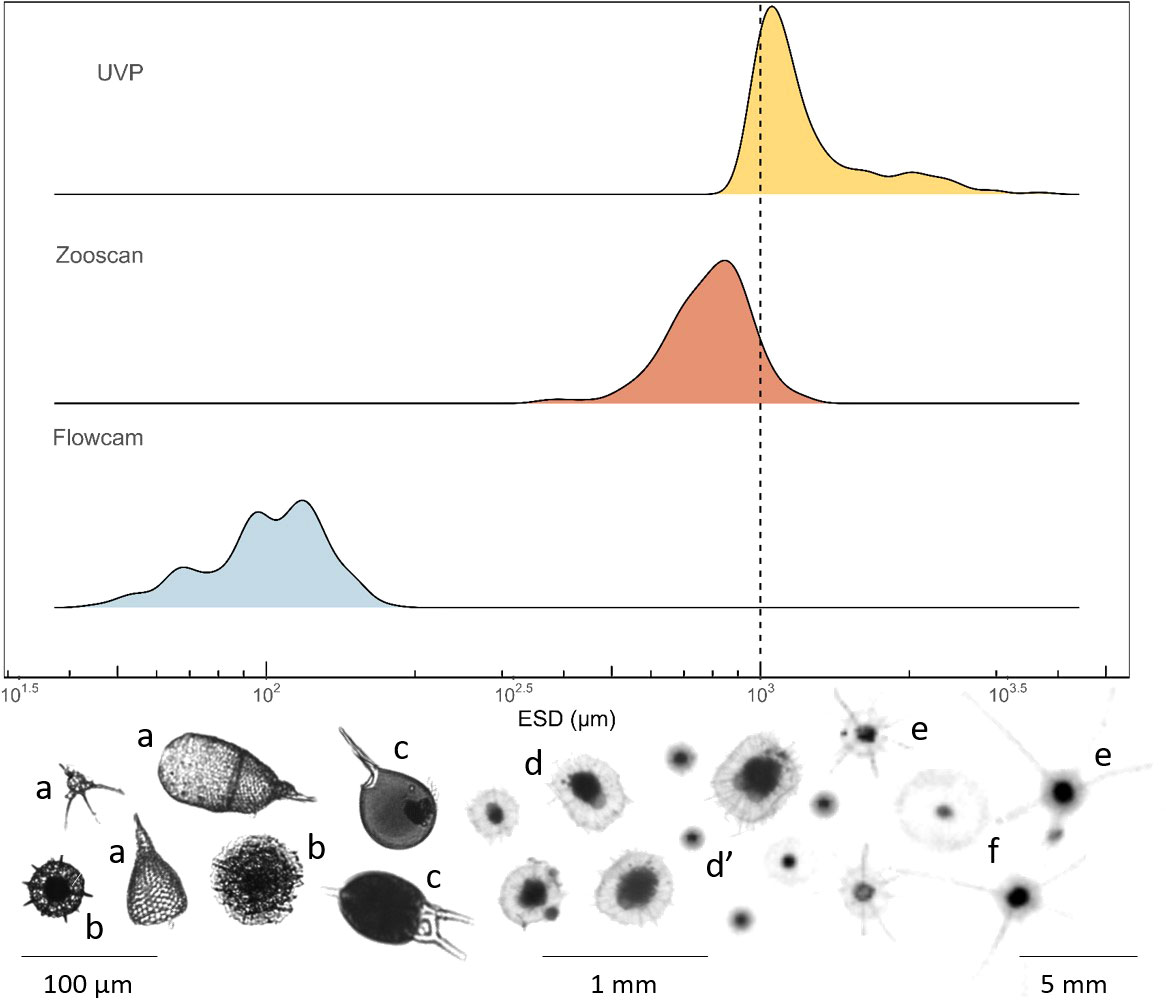
Figure 2 Density plot comparing the total size range of Rhizaria (in equivalent spherical diameter; ESD) captured by the three imaging tools used in this study (FlowCAM, Zooscan and UVP). The area under the curve represents the probability of getting an x value between a range of x values. The dashed line represents the upper limit of the Zooscan data considered and the lower limit of the UVP data, which was established to avoid overlap between these two instruments. (A) FlowCam images of Nassellaria, (B) Spumellaria, (C) FlowCam images of phaeodarians of the family Challengeridae, (D, D’) Zooscan and UVP images of phaeodarians of the family Aulacanthidae respectively, (E) UVP images of phaeodarians of the family Coelodendridae and, (F) UVP images of phaeodarians of the family Aulosphaeridae.
We observed a discontinuity between the size class captured by the FlowCAM and the Zooscan. No specimen was observed between 176 µm (largest individual imaged by the FlowCAM) and 365 µm (i.e., the smallest individual collected by the 200 µm mesh-size and imaged by the Zooscan). However, there was a size (ESD) overlap for organisms of about 1000 µm (essentially Aulacanthidae individuals) that were captured by both, the Zooscan and the UVP. In order to avoid overestimation of the Rhizaria abundances (i.e., counting twice the same size fraction), we excluded the specimens with an ESD larger than 1000 µm from the Zooscan data, and specimens with an ESD equal or smaller than 1000 µm from the UVP data.
The abundances of specimen (i.e., cells m-3) were established based on quantitative methods (imaging tools) (Supplementary Tables 1–3). The smallest size range investigated in this study (Nassellaria, Spumellaria and Phaeodaria of the genus Challengeria), the 64-200 µm (FlowCAM) showed the highest abundance values at all stations, ranging from 5.0 to 61.1 cell m-3 (Table 2). The small size fraction was mainly dominated by nassellarians in all stations. Phaeodaria of the genus Challengeria were observed in lower proportions (in 12 of the 16 stations studied; Table 3). Regarding the 200-1000 µm size fraction, which corresponded to data obtained with the Zooscan, abundances of specimens identified as Aulacanthidae, the only category imaged with this instrument, had a maximum of 3.4 cells m-3. Rhizarian abundances in the largest size fraction (>1000 µm), imaged by the UVP were generally slightly lower than those found for the 200-1000 µm size fraction (from 0.3 to 1.9 cells m-3), except some stations (Table 2). The Phaeodaria groups found during this cruise belong to the families Aulacanthidae, Castanellidae, Coelodendridae, Aulosphaeridae and Cannosphaeridae (Figure 3).
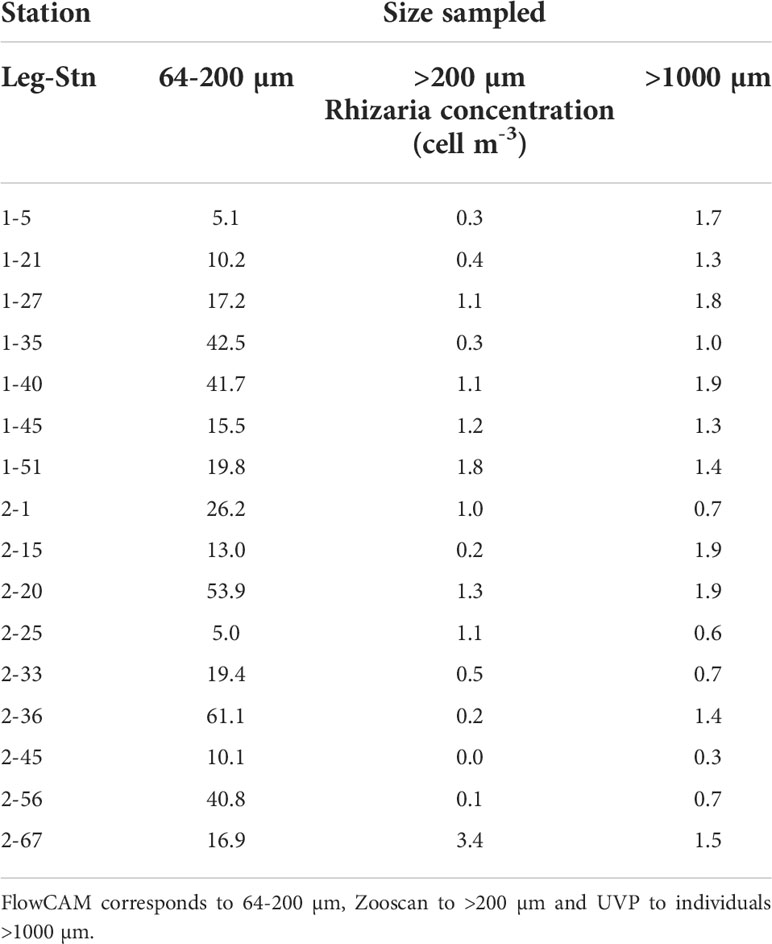
Table 2 The abundance of siliceous Rhizaria collected using three different devices corresponding a different size ranges.
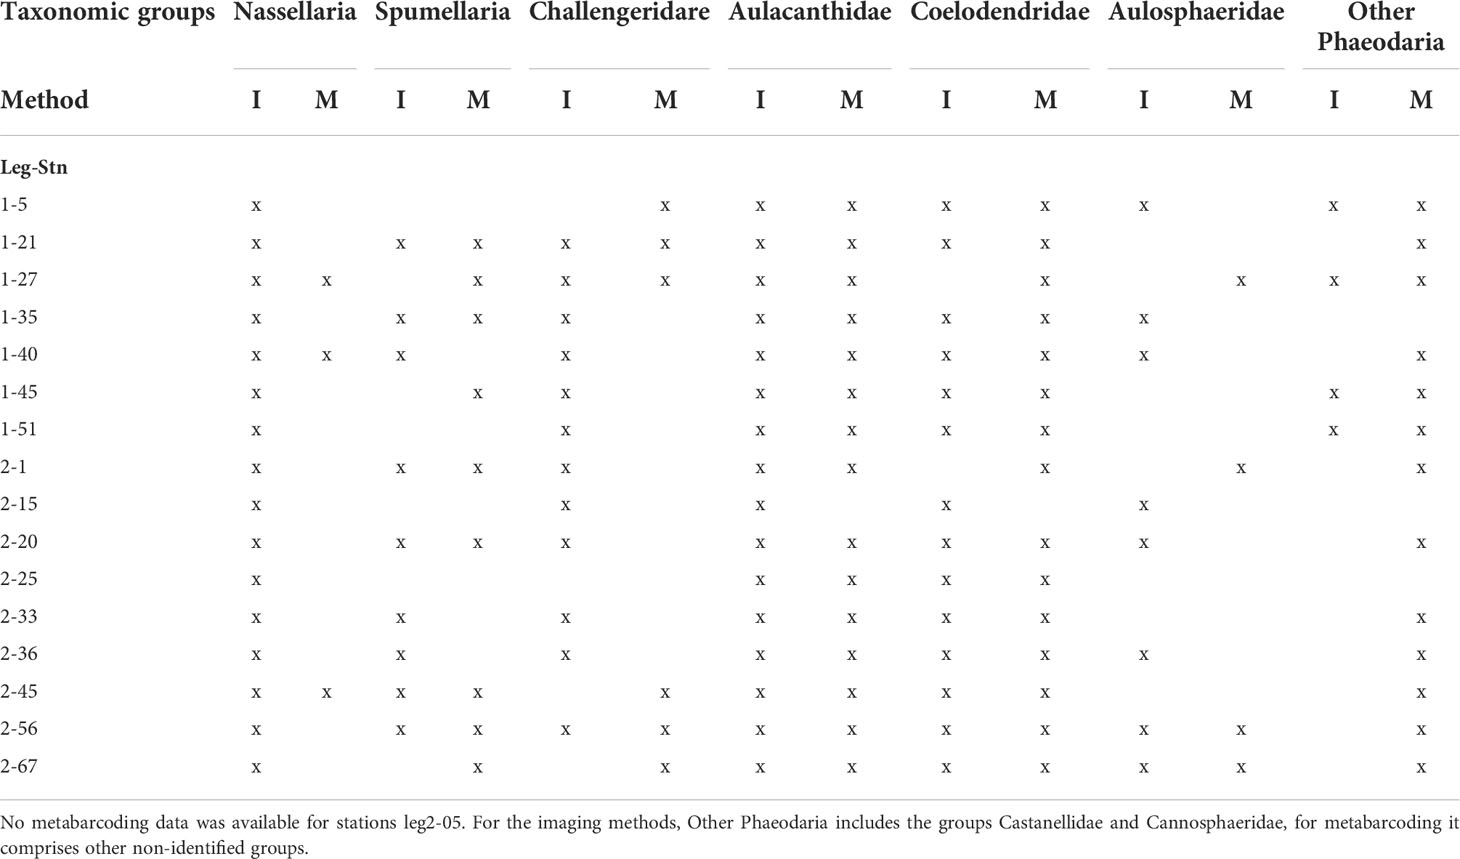
Table 3 The presence and absence of the different taxonomic groups for the entire size spectra studied using imaging (I) and metabarcoding (M) methods.
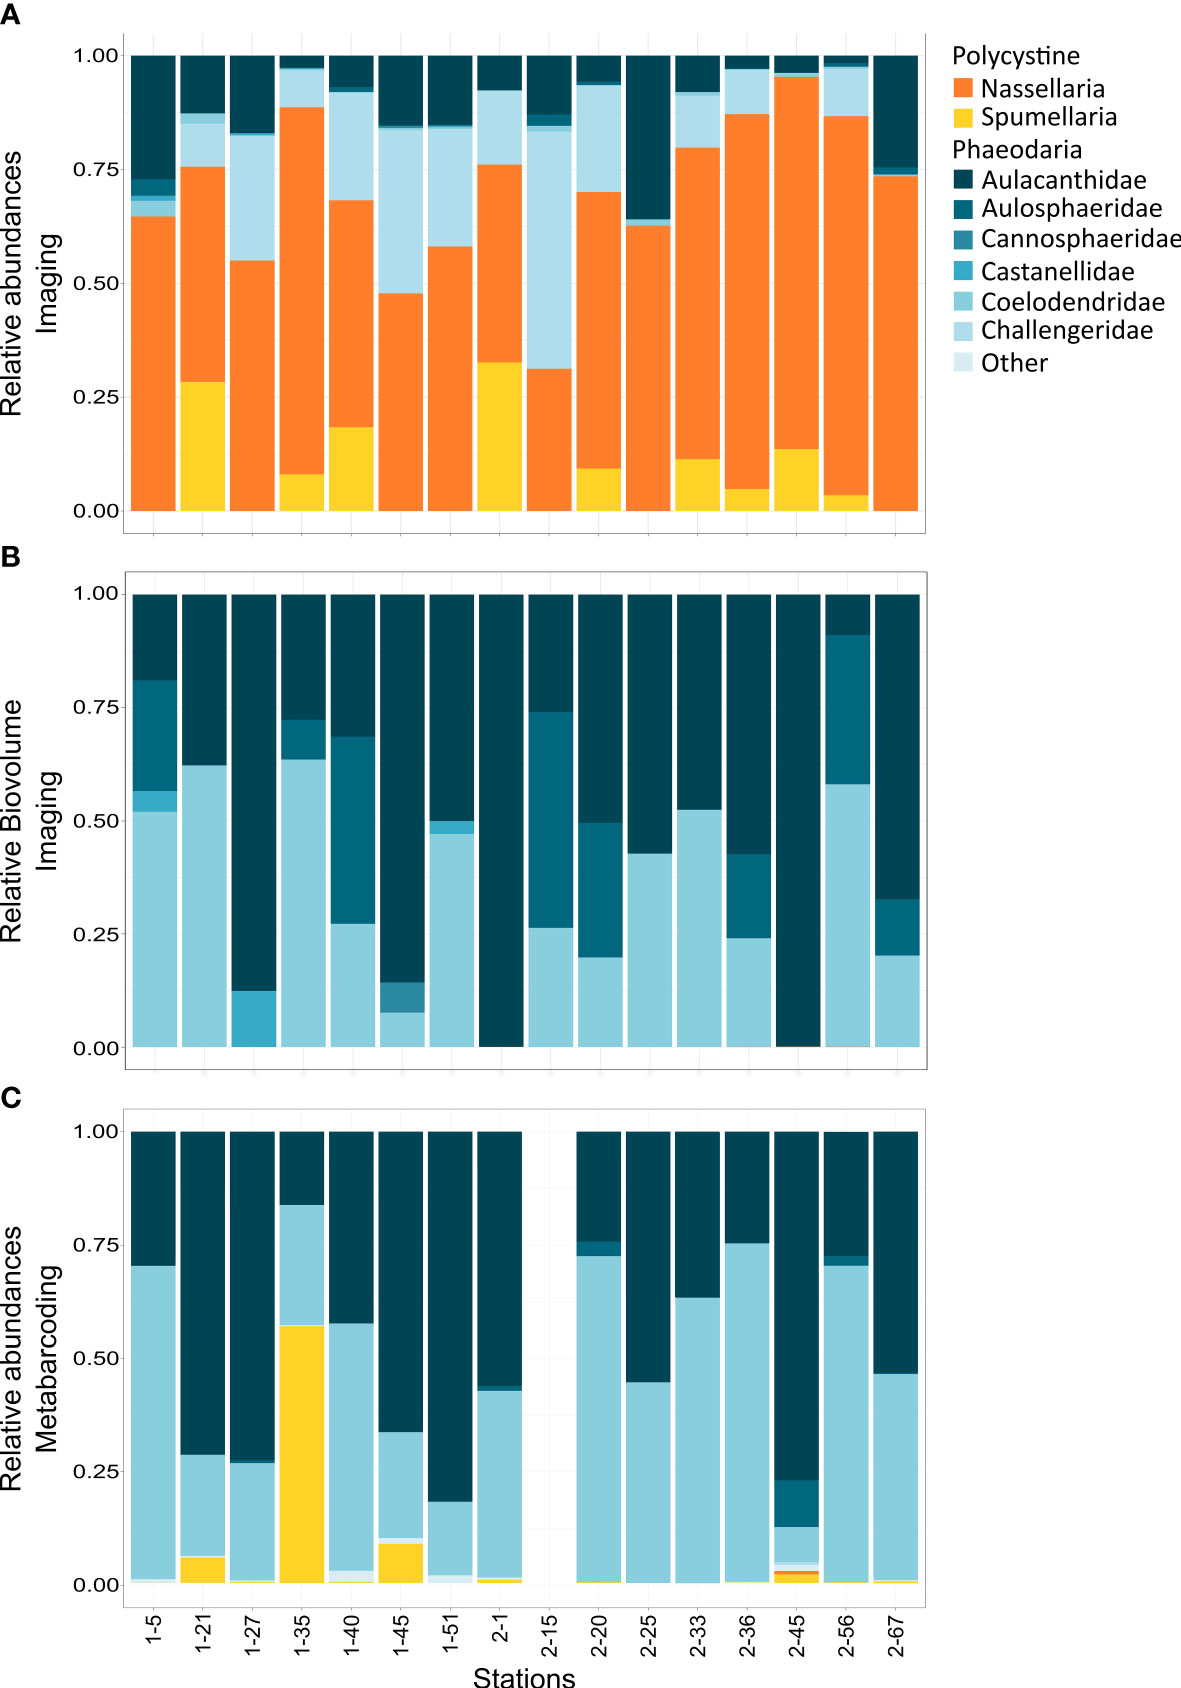
Figure 3 (A) Imaging technologies data. Relative abundances of the main rhizarians taxonomic groups cumulated from the different size fractions (> 64-200, 200-1000, > 1000 µm), from data obtained using the FlowCAM, Zooscan and UVP. (B) Imaging technologies data. Relative biovolume of the main rhizarians taxonomic groups cumulated from the different size fractions (> 64-200, 200-1000, > 1000 µm), from data obtained using the FlowCAM, Zooscan and UVP. (C) Molecular metabarcoding data. Relative abundance reads of the main rhizarian taxonomic groups in the different size fractions cumulated (> 64, > 200, > 500µm) of the V4 rDNA from vertical tow nets. No metabarcoding data was available for stations leg2-05.
When we examine the biovolume, we encounter an opposite trend to abundance (Figure 3B). The biovolume values of the individuals captured by Zooscan or UVP (> 200 µm) are higher than the ones obtained for individuals imaged by the FlowCAM and bring composition closer to metabarcoding than abundance values.
In the metabarcoding data, organisms belonging to the largest families (i.e., Coelodendridae and Aulacanthidae) contributed the most to the relative sequence abundance (Figure 3C). When analysing the contribution of the various groups of organisms in terms of biovolume, we find that Aulacanthidae and Coelodendridae are the most represented taxa in each site while organisms belonging to smaller taxonomic groups are scarcely represented (Figure 3B).
From molecular techniques, we estimated that Rhizaria belonging to the >64 µm size class represented a total of 4.53% (± 3.49) of the eukaryotic community reads, while the fraction > 200 represented 11.3% (± 7.80), and the largest fraction, > 500 µm represented the highest percentage, 15.8% (± 13.90) in all samples. When comparing the relative abundances obtained by both methods (imaging and molecular), on the same size fraction sampled, we observed that the taxonomic groups determined by each method were not the same. Consequently, the computed relative abundances differed for the two methods (Table 3; Figure 3). A difference between the different taxonomic groups is observed when calculating the corresponding percentage of occurrence, ranging from 0.1% (Aulosphaeridae) and 0.9% (Aulacanthidae). However, when comparing relative abundances obtained through molecular tools and relative biovolume from imaging techniques, the results are closer at most of the stations investigated (Figure 3).
We examined the contribution of the different size ranges to the total silica biomass of Rhizaria. When converted to biomass using the allometric relationship (Equation 3), we found that the largest individuals (>1000 µm) contributed the most to the total Si stock in the water column, from 5.2 to 70.3 µmol-Si m-2. Overall, the small and medium-sized individuals (>64 – 1000 µm) contributed equally to the largest individuals at all stations, except at offshore stations leg2-36, leg2-56, where small-sized individuals dominated. These stations presented the deepest bottom depths (Figure 4). Small Rhizaria (<200 µm) contributed to the biogenic silica standing stock from 2 to 50% depending on the sampling stations, contributing from 1.1 to 39.9 µmol-Si m-2 (Table 4).
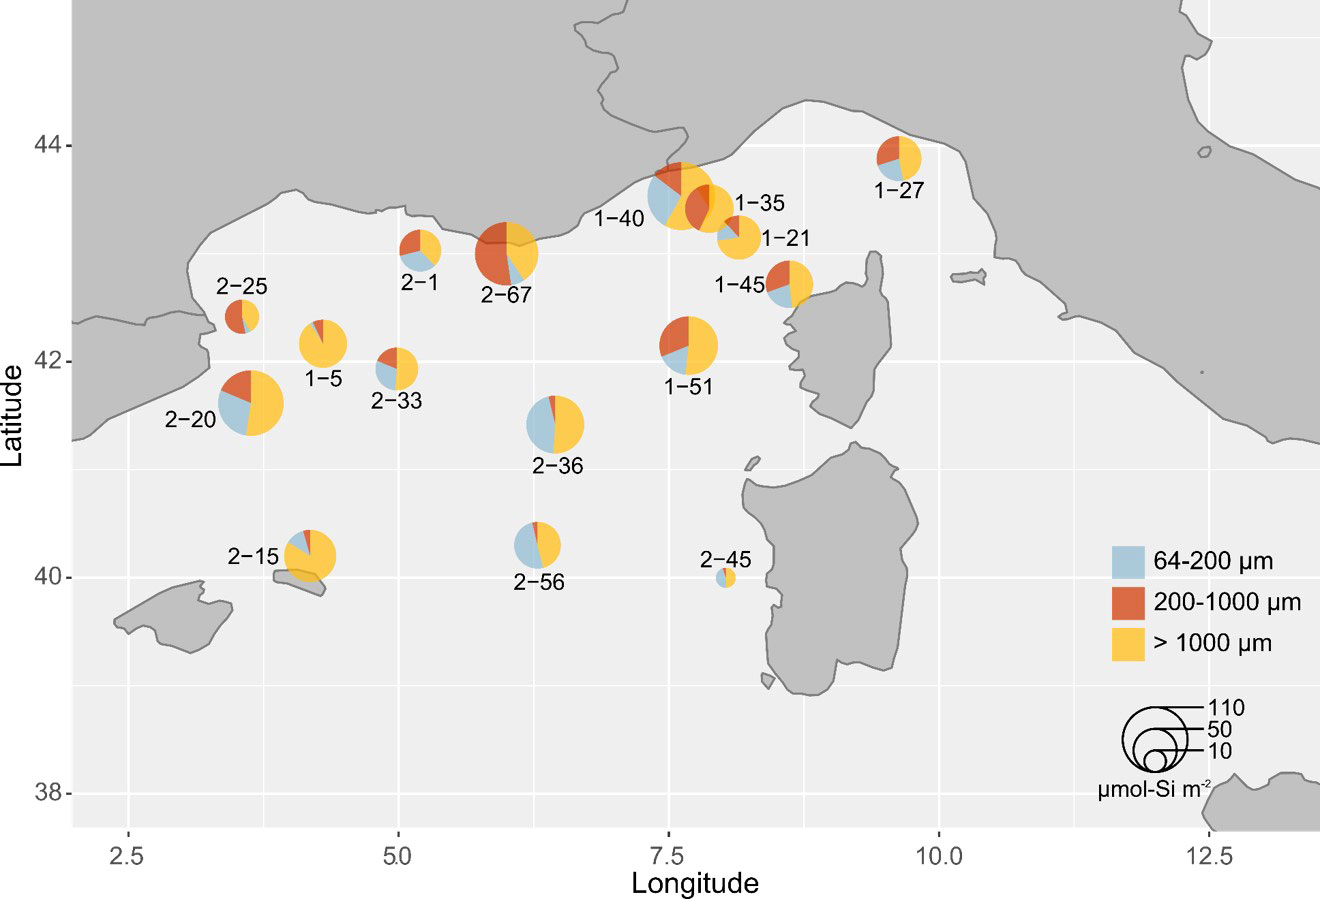
Figure 4 Overview of the bSi biomass of Rhizaria integrated into the upper 500 m of the water column (µmol-Si m-2) in the Mediterranean Sea. Piecharts indicate relative contributions of the three size classes studied to the total bSi at each station and their size is proportional to their Si contribution.
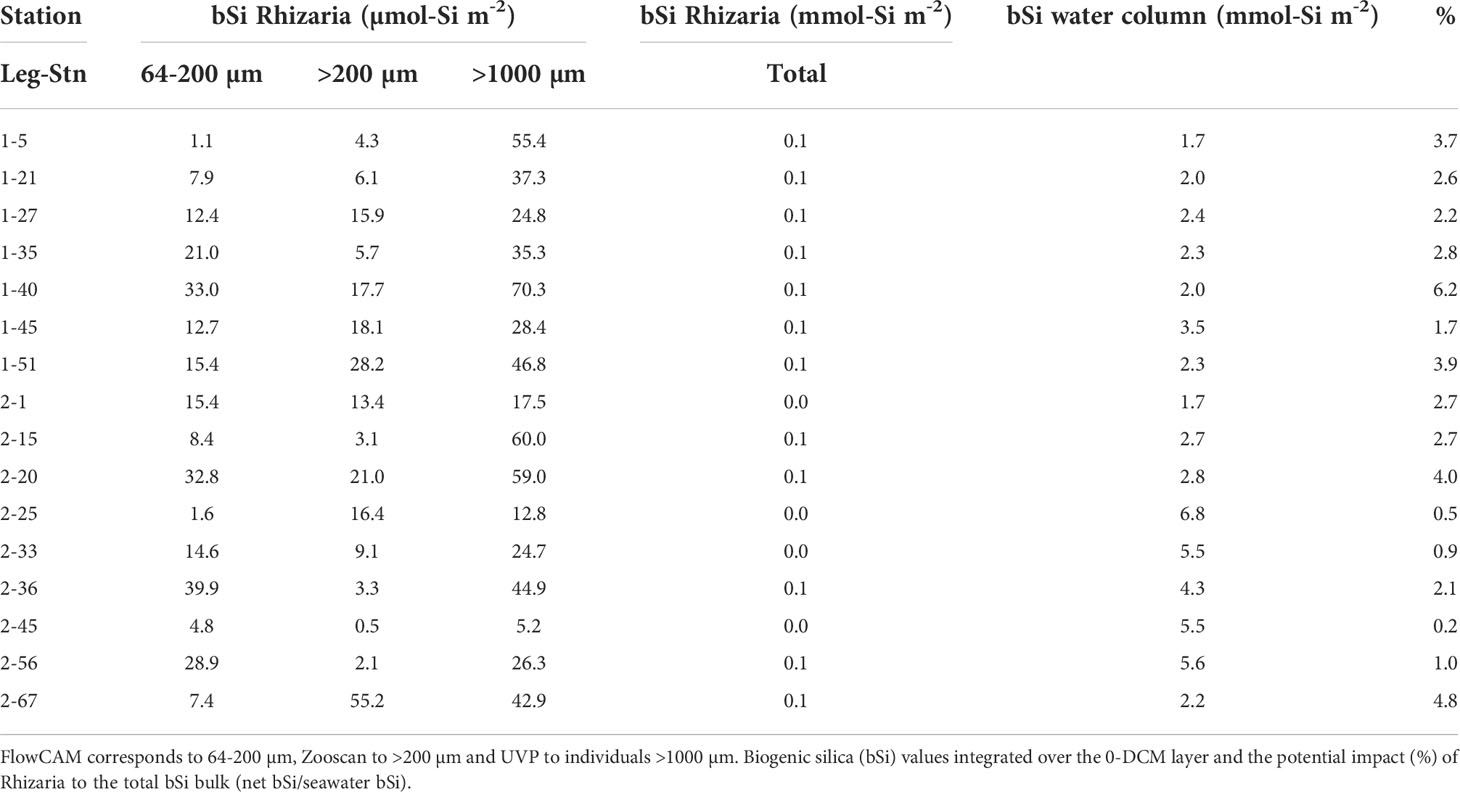
Table 4 Biogenic silica integrated over the 0 – 500 m layer for Rhizaria collected using three different devices corresponding to different size ranges.
This study is one of the few that simultaneously analyses a planktonic compartment covering a wide size spectrum using a wide array of instruments and methods. We used three imaging methods and genetic analyses to investigate a broad section of the Rhizaria size range. We found that these organisms are present at every station. In the North-Western basin of the Mediterranean Sea, Rhizaria abundances reached 61.1 cells m-3 in 0-500 m water depth, with small cells being largely dominant (from 5.0 to 61.1 cells m-3) over larger ones (up to 3.4 cells m-3). These abundances are consistent with the size distribution of organisms reported in previous studies where small rhizarians are generally more abundant than larger ones in the upper water column of the ocean (Boltovskoy et al., 1993; Llopis Monferrer et al., 2020). Yet, abundances observed here fall in the lower range of estimates from a worldwide compilation from microscopic observations of net samples deployed the 0-200 m water layer of the tropical and subtropical waters (40°N/S), which stated that small Rhizaria cell abundances ranged from 79 to 892 cells m-3 for polycystine radiolarians and from 5 to 20 cells m-3 for larger phaeodarians (Llopis Monferrer et al., 2020). Low cell densities observed in this study could be due to the integration of abundance values to 500 m instead of 200 m. Also, the different techniques used to obtain abundance values (microscopy versus FlowCAM) as well as the seasonality patterns in rhizarians communities. Analysis of plankton time series on the Northern coast of the Mediterranean Sea shows the highest biovolume of Rhizaria (including the non-silicified) in August, and quite low numbers the rest of the year (Romagnan et al., 2015).
Low cell densities could also be explained by the caveats associated with the use of imaging instruments. Although the combined use of the three instruments covered a broad size spectrum, we observed a size gap between the FlowCAM and Zooscan. From 176 µm to 365 µm no specimens were observed (Figure 2), which corresponds to the size class in which we may find many specimens of polycystines and phaeodarians (e.g., genus Challengeria; Llopis Monferrer et al., 2020). Their absence in the results could be explained by the handling of FlowCAM samples before the analysis, since these are sieved onto a 200 µm mesh size to prevent instrument clogging. To avoid the underestimation of larger cells, samples could be divided into different size fractions and analysed using smaller or larger flow cells. Moreover, many siliceous Rhizaria specimens can exhibit a size smaller than 64 µm which was the smallest plankton mesh used (e.g., small size species, juvenile forms), leading to an underestimation of total siliceous Rhizaria abundances. Finally, fixatives used classically (e.g., Lugol’s iodine or formaldehyde) are known to affect organisms leading to potentially underestimated cell counts (Choi and Stoecker, 1989; Beers and Stewart, 1970).
Regarding the Zooscan (200–1000 µm), its operational size range starts at 240 µm. This instrument may limit the enumeration of small individuals whose sizes are close to the detection limit. Although all observations reported in this study lie within the range in which reliable quantitative results can be obtained, not all the operational size range is efficient to obtain quantitative results. The Zooscan captured the smallest individuals of the family Aulacanthidae and therefore it was necessary to avoid an even higher gap between different instruments (e.g., between the FlowCAM and the UVP).
The UVP has the advantage of determining in situ abundances of organisms in in the water column without damaging the organisms, along with their size distribution. However, despite this instrument has been designed to study large (>100 µm) particles, it is impossible to reliably identify Rhizaria groups when the size of the specimen is below 700 µm. Furthermore, the largest organisms are the least abundant and taxa with few representatives are likely to be overlooked.
Molecular methods provide insights into the relative abundances and diversity of organisms but results are not quantitative. Molecular data can attempt to be compared to quantitative imaging technologies. In this study, the results of the imaging and metabarcoding comparisons do not match, neither in terms of relative abundances nor in terms of taxonomic diversity. However, when we analyse the biovolume obtained using imaging techniques, results are comparable and closer to metabarcoding data.
Molecular results show that siliceous Rhizaria were present in every sample among the different stations and size fractions and that the largest individuals had the highest relative abundances when comparing to data obtained through imaging approaches. It is well known that genes copies vary among protists and correlation exists between size and number of rDNA copies (Zhu et al., 2005; Godhe et al., 2008, Biard et al., 2017) which might bias their representativeness in an ecosystem leading to an overrepresentation of large specimens in metabarcoding data compared to morphologically cell counting. If we examine the biovolume results, they support the hypothesis that larger individuals usually present higher genome size and more gene copies, being more proportional to biomass than quantitative abundances (i.e., number of cells). In the present study, larger organisms, despite being less abundant in the water column, may have an important impact on the total biomass because of their large size.
On the other hand, in terms of diversity, Nassellaria, which is the dominant group in abundance with imaging techniques, rarely appear in metabarcoding data. Nassellaria possess robust skeletons (Takahashi et al., 1983) and cell breakage may affect DNA extraction and amplification (Not et al., 2007; Méndez-Sandín, 2019). In addition, metabarcoding analyses rely on the reference database. Since sequences obtained from the environment will be compared to the closest related sequence, taxa not yet included in the database may lead to an underestimation of the relative abundances found in the metabarcoding data.
Although a correlation between rDNA copy number per cell and cell length was established across eukaryotic marine Collodaria (Biard et al., 2017), the comparison of relative abundances and diversity measured by imaging methods and molecular tools (Supplementary Figure S1) is complex and must be made cautiously. In this study, we excluded Collodaria specimen because they can include colonies composed by tens to thousands of cells, number which is complicated to determine with imagine methods and therefore, biogenic silica estimations cannot be conducted. Also, Collodaria can be naked (e.g., Collozoum sp.) or provided with siliceous spines (e.g., Sphaerozoum sp.), feature that cannot always be confirmed with imaging methods.
Imaging and metabarcoding methods have great potential and allow a rapid analysis and processing of samples. All these approaches for plankton enumeration have, however, uncertainties when estimating the actual composition and abundance of the community, and a thorough interpretation of the results requires assessment of the limits of each method.
To provide reliable comparisons between imaging and molecular methods, sampling protocols must be homogeneous (e.g., sample the same size class, analysing the same water sample using both methods). Single-cell sequencing may help to avoid the mismatch between the taxonomic groups as it will enrich the database.
Rhizaria are important contributors to biogenic silica production in the global ocean (Takahashi et al., 1983; Biard et al., 2018; Llopis Monferrer et al., 2020). They span a wide size range and occupy a variety of ecosystems which makes it difficult to achieve an integrated perspective on their specific contribution to biogeochemical cycles (Suzuki and Not, 2015; Biard and Ohman, 2020).
The North-Western Mediterranean basin is characterised by oligotrophic conditions. During Fall (September-early November), surface waters are nutrient-depleted, and microphytoplankton is generally dominated by non-siliceous organisms (Leblanc et al., 2003). Leblanc et al. (2003) reported biogenic silica integrated stocks from 3.1 to 21.5 mmol-Si m-2 in the first 150 m of the water column at a station located in the North-Western Mediterranean basin with the lowest values of diatom biogenic silica corresponding to autumn. Values of diatom biogenic silica are close to 0 below 150 m throughout the year (Leblanc et al., 2003). During MOOSE-GE 17 cruise, biogenic silica values integrated over the 0-DCM layer ranged between 1.7 and 6.8 mmol-Si m-2, which are concordant to those found by Leblanc et al. (2003) at a similar period of the year.
Using data obtained from the imaging tools along with the allometric relationship previously established (Llopis Monferrer et al., 2020), we provide the first attempt to determine the contribution of siliceous Rhizaria, across a broad size spectrum, to the biogenic silica standing stock in the Mediterranean Sea. Assuming that phytoplankton biogenic silica under the DCM was null (Leblanc et al., 2003), we compared Rhizaria biogenic silica values from the first 500 m of the water column to biogenic silica values of the water column. Therefore, we found that siliceous Rhizaria contributed up to 6% (2.6 ± 1.6) of the total biogenic silica in the water column (Table 4),
The contribution of Rhizaria to the biogenic silica biomass can be highly variable. For example, in productive areas of the World Ocean, where Rhizaria are less abundant and diatoms concentrations are much higher, the impact of these protists on the biogenic silica biomass in surface waters is much lower, as in the case of the Ross Sea in Antarctica, where Rhizaria account for only 0.1% at most of the total biogenic silica (Llopis Monferrer et al., 2021).
In this study, the smallest size class was collected with a plankton net over the first 500 m. With this sampling method, there is no detailed information on the vertical distribution of small Rhizaria, and it is difficult to know if they mainly thrive in the euphotic layer, where phytoplankton grow. We investigated metabarcoding from the Niskin bottles (Supplementary Figure S2), where the small phytoplankton community was represented. We observed that Rhizaria were relatively more abundant than diatoms in most of the stations, most likely due to the fact that larger organisms present more gene copies. For larger individuals, imaged in-situ with the UVP, the highest abundances were found at approximately 100 m depth (Supplementary Figure S3), below the maximum of diatom biogenic silica found in this area (Leblanc et al., 2003). There is evidence that the vertical distribution of some groups of Rhizaria can be associated with hydrographic features, such as the DCM (Kling and Boltovskoy, 1995; Dennett, 2002). A wider depth coverage, including the depth preferences of each taxonomic group, would be needed to study in detail the effect of these features on the rhizarians community.
Different Rhizaria species have different depth preferences (Boltovskoy et al., 2017; Biard and Ohman, 2020). According to this information, Rhizaria living in deeper layers, have been omitted in our estimates. This uneven distribution of organisms would affect the contribution of Rhizaria to the global biogenic silica standing stocks, especially in the waters below the euphotic layer, where they can be very abundant contributing to the biogenic silica fluxes to the deep ocean (Nakamura et al., 2013).
According to Llopis Monferrer et al. (2020), in tropical and subtropical waters (0-40°N/S) the contribution of Rhizaria to the standing stock of silicifiers in the 0-200 m water layer is of the same order of magnitude as their contribution estimated for the 200-1000 m layer. The impact of deeper-living organisms on the silica cycle has not been considered here, as we only analysed rhizarians found in the 0-500 m layer, but it could significantly increase their contribution to the total biomass.
Our results highlight that the study of the entire size spectrum and vertical distribution of Rhizaria is essential to fully understand the role of these protists in the biogeochemical cycle of silicon. Despite the possible underestimation of cell concentrations due to the sample manipulation (in FLowCAM and Zooscan protocols), small specimen accounted for up to 50% of the biogenic silica standing stock at some stations, showing that the small size class cannot be ignored. The biogenic silica content was certainly influenced by the taxonomic groups present at each station and their different cell sizes. Small Rhizaria, represented by polycystine (Nassellaria and Spumellaria) possess solid skeletons and are generally denser (up to 530 µg-Si mm-3) than large phaeodarians (10 µg-Si mm-3) (Llopis Monferrer et al., 2020), whose skeletons are instead porous (Nakamura et al., 2018).
Despite the uncertainties associated with each method employed, results showed that both, small and large Rhizaria are non-negligible contributors to the biogenic silica biomass in this oligotrophic region. To better understand the global significance of these organisms and to be able to include them in the biogeochemical models, the full extent of siliceous rhizarians must be considered.
Silicified Rhizaria vary widely in size, and studying them simultaneously is a challenging task. Furthermore, collecting enough individuals to get a fair representation of its abundance and diversity is a difficult task (Cortese, 2004). To sample both, large and small organisms concurrently, bongo nets can be used, as is the case of the present study. Sampling Rhizaria specimens can be also done by filtering water (Boltovskoy et al., 1993). For example, the entire content of a Niskin bottle could be analysed by imaging and/or molecular tools. By sampling with Niskin bottles, small collected Rhizaria could be associated with a given depth and physicochemical parameters, providing valuable information on the ecology of each specimen. Larger plankton could be sampled by traditional closing nets (e.g., Multinet) to take into account different water layers. Alternatively, the Bottle-Net could be used as an alternative to the traditional plankton net. The Bottle-Net is an oceanographic device designed specifically for the Malaspina 2010 Circumnavigation (Agustí et al., 2020) to improve the collection of microplankton and particles (Leblanc et al., 2021). This instrument is designed to be mounted on a standard rosette and it consists of an external PVC and stainless-steel frame, with a 20 µm mesh size inside it. One of the major assets of this device is that it can sample a delimited water layer and it does not concentrate as many organisms as the plankton net, avoiding damage to the organisms.
To investigate large Rhizaria, the UVP appears as the most adequate instrument. This in-situ device is attached to the CTD, no extra time is needed for its deployment and environmental parameters can be associated with the organisms imaged. With this information, their ecological preferences and vertical niches can be characterized (Biard and Ohman, 2020). Its depth range is 6000 m, therefore, it can study the vertical distribution of Rhizaria up to zones where other tools cannot reach. The size of the resulting dataset is vast, resulting in a complex and time-consuming task to manually classify all the images.
Molecular tools, in turn, are a promising alternative to morphological observation for diversity determination but still many concepts are yet to be understood, such as cellular architecture and cellular size, copy number and intragenomic variability (Sandin et al., 2021). Another limitation of molecular methods is that DNA is capable of remaining available even when cells are dead (environmental DNA). This makes it difficult to know whether organisms found at a certain depth inhabit that same depth or are simply organisms sedimented from surface waters, making it impossible to know whether the DNA comes from a metabolically active cell, a dead cell, or the remnant of a cell (Brisbin et al., 2020).
The combination of imaging and molecular tools may lead to a better understanding of Rhizaria biology and ecology as it offers extensive coverage of the size spectrum.
The datasets presented in this study can be found in online repositories. The names of the repository/repositories and accession number(s) can be found below: https://doi.org/10.6084/m9.figshare.19362374.v1.
NL, FL, MP, AE, LG, AL, PT, and FN participated to the conceptualisation of the manuscript. NL, TB, and FL worked on the quantitative data. MS provided and worked on the metabarcoding data. All authors have reviewed and provided input on the manuscript.
This work was supported by the ROSI project from the French National program LEFE (Les Enveloppes Fluides et l’Environnement) and ANR RadiCal (ANR-18-CE01-0011).
The authors are grateful to the MOOSE observation national network (funded by CNRS‐INSU and Research Infrastructure ILICO), which supports the annual ship-based hydrographic sections in the northwestern Mediterranean Sea (MOOSE‐GE). We also thank the science team and crew of the RV Atalante and Pierre Testor (CNRS, LOCEAN) as head of the MOOSE GE-2017 mission cruise. We thank the EMBRC platform PIQv for image analysis and the CCPv for access to samples. This work was supported by EMBRC-France, whose French state funds are managed by the ANR within the Investments of the Future program under reference ANR-10-INBS-02. This work was supported by the ROSI project from the French National program LEFE (Les Enveloppes Fluides et l’Environnement) and ANR RadiCal (ANR-18-CE01-0011). We are grateful to C. Dambrine and H. Whitby for their comments and help. We also thank the reviewers of this manuscript for their valuable comments.
The authors declare that the research was conducted in the absence of any commercial or financial relationships that could be construed as a potential conflict of interest.
All claims expressed in this article are solely those of the authors and do not necessarily represent those of their affiliated organizations, or those of the publisher, the editors and the reviewers. Any product that may be evaluated in this article, or claim that may be made by its manufacturer, is not guaranteed or endorsed by the publisher.
The Supplementary Material for this article can be found online at: https://www.frontiersin.org/articles/10.3389/fmars.2022.895995/full#supplementary-material
Agustí S., Krause J. W., Marquez I. A., Wassmann P., Kristiansen S., Duarte C. M. (2020). Arctic (Svalbard islands) active and exported diatom stocks and cell health status. Biogeosciences 17, 35–45. doi: 10.5194/bg-17-35-2020
Alves-de-Souza C., Gonzalez M. T., Iriarte J. L. (2008). Functional groups in marine phytoplankton assemblages dominated by diatoms in fjords of southern Chile. J. Plankton Res. 30, 1233–1243. doi: 10.1093/plankt/fbn079
Beers J. R., Stewart G. L. (1970). Numerical abundance and estimated biomass of microzooplankton. Bulletin of the Scripps Institute of Oceanography 17, 67–87.
Benfield M., Grosjean P., Culverhouse P., Irigolen X., Sieracki M., Lopez-Urrutia A., et al. (2007). RAPID: Research on automated plankton identification. Oceanog. 20, 172–187. doi: 10.5670/oceanog.2007.63
Biard T. (2022) Rhizaria. eLs. Available at: https://doi.org/in.press.
Biard T., Bigeard E., Audic S., Poulain J., Gutierrez-Rodriguez A., Pesant S., et al. (2017). Biogeography and diversity of collodaria (Radiolaria) in the global ocean. ISME J. 11, 1331–1344. doi: 10.1038/ismej.2017.12
Biard T., Krause J. W., Stukel M. R., Ohman M. D. (2018). The significance of giant phaeodarians (Rhizaria) to biogenic silica export in the California current ecosystem. Global Biogeochem. Cycles 32, 987–1004. doi: 10.1029/2018GB005877
Biard T., Ohman M. D. (2020). Vertical niche definition of test-bearing protists (Rhizaria) into the twilight zone revealed by in situ imaging. Limnol. Oceanogr. lno. 11472, 2583–2602. doi: 10.1002/lno.11472
Biard T., Stemmann L., Picheral M., Mayot N., Vandromme P., Hauss H., et al. (2016). In situ imaging reveals the biomass of giant protists in the global ocean. Nature 532, 504–507. doi: 10.1038/nature17652
Boltovskoy (2003). First record of a brackish radiolarian (Polycystina): Lophophaena rioplatensis n. sp. in the Rio de la plata estuary. J. Plankton Res. 25, 1551–1559. doi: 10.1093/plankt/fbg107
Boltovskoy D., Alder V. A., Abelmann A. (1993). Annual flux of radiolaria and other shelled plankters in the eastern equatorial atlantic at 853 m: Seasonal variations and polycystine species-specific responses. Deep Sea Res. Part I: Oceanogr. Res. Pap. 40, 1863–1895. doi: 10.1016/0967-0637(93)90036-3
Boltovskoy D., Anderson O. R., Correa N. (2017). Handbook of the protists, springer. Eds. Archibald J. M., Simpson A. G. B., Slamovits C. H. (Cham, Switzerland: Springer).
Boltovskoy D., Kling S. A., Takahashi K., Bjørklund K. (2010). World atlas of distribution of recent polycystina (Radiolaria). Palaeontologia Electronica 13 (3).
Brisbin M. M., Brunner O. D., Grossmann M. M., Mitarai S. (2020). Paired high-throughput, in-situ imaging and high-throughput sequencing illuminate acantharian abundance and vertical distribution (preprint). Limnol. Oceanogr. 65 (12), 2953–2965. doi: 10.1101/2020.02.27.967349
Brzezinski M. A., Nelson D. M. (1989). Seasonal changes in the silicon cycle within a gulf stream warm-core ring. Deep Sea Res. Part A. Oceanogr. Res. Pap. 36, 1009–1030. doi: 10.1016/0198-0149(89)90075-7
Buitenhuis E., Le Quéré C., Aumont O., Beaugrand G., Bunker A., Hirst A., et al. (2006). Biogeochemical fluxes through mesozooplankton: Biogiochemical fluxes through mesozooplankton. Global Biogeochem. Cycles 20. doi: 10.1029/2005GB002511
Callahan B. J., McMurdie P. J., Rosen M. J., Han A. W., Johnson A. J. A., Holmes S. P. (2016). DADA2: High-resolution sample inference from illumina amplicon data. Nat. Methods 13, 581–583. doi: 10.1038/nmeth.3869
Choi J. W., Stoecker D. K. (1989). Effects of fixation on cell volume of marine planktonic pro- tozoa. Appl. Environ. Microbial. 55, 1761–65.
Cortese G. (2004). The 300 specimens problem. Radiolaria: Newsletter of the international association of radiolarian paleontologists. 22, 13–18.
Dennett M. R. (2002). Video plankton recorder reveals high abundances of colonial radiolaria in surface waters of the central north pacific. J. Plankton Res. 24, 797–805. doi: 10.1093/plankt/24.8.797
de Vargas C., Audic S., Henry N., Decelle J., Mahe F., Logares R., et al. (2015). Eukaryotic plankton diversity in the sunlit ocean. Science 348, 1261605–1261605. doi: 10.1126/science.1261605
Donoso K., Carlotti F., Pagano M., Hunt B. P. V., Escribano R., Berline L. (2017). Zooplankton community response to the winter 2013 deep convection process in the NWMediterranean Sea: Zooplankton and winter deep convection. J. Geophys. Res. Ocean. 122, 2319–2338. doi: 10.1002/2016JC012176
Edwards M., Beaugrand G., Helaouët P., Alheit J., Coombs S. (2013). Marine ecosystem response to the Atlantic multidecadal oscillation. PloS One 8, e57212. doi: 10.1371/journal.pone.0057212
Faure E., Not F., Benoiston A.-S., Labadie K., Bittner L., Ayata S.-D. (2019). Mixotrophic protists display contrasted biogeographies in the global ocean. ISME J. 13, 1072–1083. doi: 10.1038/s41396-018-0340-5
Gloor G. B., Macklaim J. M., Pawlowsky-Glahn V., Egozcue J. J. (2017). Microbiome datasets are compositional: And this is not optional. Front. Microbiol. 8. doi: 10.3389/fmicb.2017.02224
Godhe A., Asplund M. E., Härnström K., Saravanan V., Tyagi A., Karunasagar I. (2008). Quantification of diatom and dinoflagellate biomasses in coastal marine seawater samples by real-time PCR. Appl. Environ. Microbiol. 74, 7174–7182.
Gorsky G., Ohman M. D., Picheral M., Gasparini S., Stemmann L., Romagnan J.-B., et al. (2010). Digital zooplankton image analysis using the ZooScan integrated system. J. Plankton Res. 32, 285–303. doi: 10.1093/plankt/fbp124
Guidi L., Chaffron S., Bittner L., Eveillard D., Larhlimi A., Roux S., et al. (2016). Plankton networks driving carbon export in the oligotrophic ocean. Nature 532, 465–470. doi: 10.1038/nature16942
Guillou L., Bachar D., Audic S., Bass D., Berney C., Bittner L., et al. (2012). The protist ribosomal reference database (PR2): A catalog of unicellular eukaryote small Sub-unit rRNA sequences with curated taxonomy. Nucleic Acids Res. 41, D597–D604. doi: 10.1093/nar/gks1160
Gutierrez-Rodriguez A., Stukel M. R., Lopes dos Santos A., Biard T., Scharek R., Vaulot D., et al. (2018). High contribution of rhizaria (Radiolaria) to vertical export in the California current ecosystem revealed by DNA metabarcoding. ISME J. 13, 964–976. doi: 10.1038/s41396-018-0322-7
Irisson J.-O., Ayata S.-D., Lindsay D. J., Karp-Boss L., Stemmann L. (2022). Machine learning for the study of plankton and marine snow from images. Annu. Rev. Mar. Sci. 14, 277–301. doi: 10.1146/annurev-marine-041921-013023
Ishitani Y., Takahashi K. (2007). The vertical distribution of radiolaria in the waters surrounding Japan. Mar. Micropaleontol. 65, 113–136. doi: 10.1016/j.marmicro.2007.06.002
Kling S. A., Boltovskoy D. (1995). Radiolarian vertical distribution patterns across the southern California current. Deep Sea Res. Part I: Oceanogr. Res. Pap. 42, 191–231. doi: 10.1016/0967-0637(94)00038-T
Lampitt R. S., Salter I., Johns D. (2009). Radiolaria: Major exporters of organic carbon to the deep ocean: Radiolaria export carbon to the deep ocean. Global Biogeochem. Cycles 23. doi: 10.1029/2008GB003221. n/a-n/a.
Leblanc K., Lafond A., Cornet V., Legras J., Marie B., Quéguiner B. (2021). Deep particle stocks following the summer bloom around the kerguelen islands: Insights into diatoms physiological state, community structure and mortality modes. J. Mar. Syst. 222, 103609. doi: 10.1016/j.jmarsys.2021.103609
Leblanc K., Quéguiner B., Garcia N., Rimmelin P., Raimbault P. (2003). Silicon cycle in the NW Mediterranean Sea: Seasonal study of a coastal oligotrophic site. Oceanol. Acta 26, 339–355. doi: 10.1016/S0399-1784(03)00035-5
Le Queré C., Harrison S. P., Colin Prentice I., Buitenhuis E. T., Aumont O., Bopp L., et al. (2005). Ecosystem dynamics based on plankton functional types for global ocean biogeochemistry models. Global Change Biol. 11 (1), 2016–2040. doi: 10.1111/j.1365-2486.2005.1004.x
Llopis Monferrer N., Boltovskoy D., Tréguer P., Sandin M. M., Not F., Leynaert A. (2020). Estimating biogenic silica production of rhizaria in the global ocean. Global Biogeochem. Cycles 34. doi: 10.1029/2019GB006286
Llopis Monferrer N., Leynaert A., Tréguer P., Gutiérrez-Rodríguez A., Moriceau B., Gallinari M., et al. (2021). Role of small rhizaria and diatoms in the pelagic silica production of the southern ocean. Limnol. Oceanogr. 66 (6), 2187–2202. doi: 10.1002/lno.11743
Lombard F., Boss E., Waite A. M., Vogt M., Uitz J., Stemmann L., et al. (2019). Globally consistent quantitative observations of planktonic ecosystems. Front. Mar. Sci. 6. doi: 10.3389/fmars.2019.00196
Mayot N., D’Ortenzio F., Taillandier V., Prieur L., de Fommervault O. P., Claustre H., et al. (2017). Physical and biogeochemical controls of the phytoplankton blooms in north Western Mediterranean Sea: A multiplatform approach over a complete annual cycle, (2012–2013 DEWEX experiment). J. Geophys. Res. Ocean. 122, 9999–10019. doi: 10.1002/2016JC012052
Méndez-Sandín M. (2019). Diversité et évolution des nassellaires et spumellaires (radiolaires). Station Biol. Roscoff. Available at: https://hal.archives-ouvertes.fr/tel-03137926v1
Nakamura Y., Imai I., Yamaguchi A., Tuji A., Suzuki N. (2013). Aulographis japonica sp. nov. (Phaeodaria, aulacanthida, aulacanthidae), an abundant zooplankton in the deep sea of the Sea of Japan. Plankton Benthos Res. 8, 107–115. doi: 10.3800/pbr.8.107
Nakamura Y., Iwata I., Hori R. S., Uchiyama N., Tuji A., Fujita M. J., et al. (2018). Elemental composition and ultrafine structure of the skeleton in shell-bearing protists–a case study of phaeodarians and radiolarians. J. Struct. Biol. 204, 45–51. doi: 10.1016/j.jsb.2018.06.008
Not F., Gausling R., Azam F., Heidelberg J. F., Worden A. Z. (2007). Vertical distribution of picoeukaryotic diversity in the Sargasso Sea. Environ. Microbiol. 9, 1233–1252. doi: 10.1111/j.1462-2920.2007.01247.x
Pernice M. C., Giner C. R., Logares R., Perera-Bel J., Acinas S. G., Duarte C. M., et al. (2016). Large Variability of bathypelagic microbial eukaryotic communities across the world’s oceans. ISME J. 10, 945–958. doi: 10.1038/ismej.2015.170
Picheral M., Colin S., Irisson J.-O. (2017) EcoTaxa [WWW document]. Available at: http://ecotaxa.obs-vlfr.fr/ (Accessed 6.29.20).
Picheral M., Guidi L., Stemmann L., Karl D. M., Iddaoud G., Gorsky G. (2010). The underwater vision profiler 5: An advanced instrument for high spatial resolution studies of particle size spectra and zooplankton: Underwater vision profiler. Limnol. Oceanogr. Methods 8, 462–473. doi: 10.4319/lom.2010.8.462
Robinson A. R., Leslie W. G., Theocharis A., Lascaratos A. (2001). Mediterranean Sea Circulation, in: Encyclopedia of ocean sciences. Elsevier, 1689–1705. doi: 10.1006/rwos.2001.0376
Rognes T., Flouri T., Nichols B., Quince C., Mahé F. (2016). VSEARCH: A versatile open source tool for metagenomics. PeerJ 4, e2584. doi: 10.7717/peerj.2584
Romagnan J.-B., Legendre L., Guidi L., Jamet J.-L., Jamet D., Mousseau L., et al. (2015). Comprehensive model of annual plankton succession based on the whole-plankton time series approach. PloS One 10, e0119219. doi: 10.1371/journal.pone.0119219
Sandin M. M., Romac S., Not F. (2021). Intra-genomic rDNA gene variability of nassellaria and spumellaria (Rhizaria, radiolaria) assessed by Sanger, MinION and illumina sequencing. Environ. Microbio. 24 (7), 2979–2293. doi: 10.1101/2021.10.05.463214
Sieracki C., Sieracki M., Yentsch C. (1998). An imaging-in-flow system for automated analysis of marine microplankton. Mar. Ecol. Prog. Ser. 168, 285–296. doi: 10.3354/meps168285
Stoeck T., Bass D., Nebel M., Christen R., Jones M. D. M., Breiner H.-W., et al. (2010). Multiple marker parallel tag environmental DNA sequencing reveals a highly complex eukaryotic community in marine anoxic water. Mol. Ecol. 19, 21–31. doi: 10.1111/j.1365-294X.2009.04480.x
Stukel M., Ohman M., Benitez-Nelson C., Landry M. (2013). Contributions of mesozooplankton to vertical carbon export in a coastal upwelling system. Mar. Ecol. Prog. Ser. 491, 47–65. doi: 10.3354/meps10453
Suzuki N., Not F. (2015). “Biology and ecology of radiolaria,” in Marine protists: Diversity and dynamics (New York: Springer, Tokyo), 179–222.
Takahashi K., Hurd D. C., Honjo S. (1983). Phaeodarian skeletons: Their role in silica transport to the deep Sea. Science 222, 616–618. doi: 10.1126/science.222.4624.616
Toullec J., Vincent D., Frohn L., Miner P., Le Goff M., Devesa J., et al. (2019). Copepod grazing influences diatom aggregation and particle dynamics. Front. Mar. Sci. 6. doi: 10.3389/fmars.2019.00751
Uitz J., Claustre H., Griffiths F. B., Ras J., Garcia N., Sandroni V. (2009). A phytoplankton class-specific primary production model applied to the kerguelen islands region (Southern ocean). Deep Sea Res. Part I: Oceanogr. Res. Pap. 56, 541–560. doi: 10.1016/j.dsr.2008.11.006
Keywords: Rhizaria, Phaeodaria, polycystine, imaging technologies, metabarcoding, silicon cycle
Citation: Llopis Monferrer N, Biard T, Sandin MM, Lombard F, Picheral M, Elineau A, Guidi L, Leynaert A, Tréguer PJ and Not F (2022) Siliceous Rhizaria abundances and diversity in the Mediterranean Sea assessed by combined imaging and metabarcoding approaches. Front. Mar. Sci. 9:895995. doi: 10.3389/fmars.2022.895995
Received: 14 March 2022; Accepted: 16 September 2022;
Published: 10 October 2022.
Edited by:
Alex J. Poulton, Heriot-Watt University, United KingdomReviewed by:
Akira Kuwata, Tohoku National Fisheries Research Institute, JapanCopyright © 2022 Llopis Monferrer, Biard, Sandin, Lombard, Picheral, Elineau, Guidi, Leynaert, Tréguer and Not. This is an open-access article distributed under the terms of the Creative Commons Attribution License (CC BY). The use, distribution or reproduction in other forums is permitted, provided the original author(s) and the copyright owner(s) are credited and that the original publication in this journal is cited, in accordance with accepted academic practice. No use, distribution or reproduction is permitted which does not comply with these terms.
*Correspondence: Natalia Llopis Monferrer, bmF0YWxpYWxsb3BpczkwQGdtYWlsLmNvbQ==
Disclaimer: All claims expressed in this article are solely those of the authors and do not necessarily represent those of their affiliated organizations, or those of the publisher, the editors and the reviewers. Any product that may be evaluated in this article or claim that may be made by its manufacturer is not guaranteed or endorsed by the publisher.
Research integrity at Frontiers
Learn more about the work of our research integrity team to safeguard the quality of each article we publish.