 Mara Sutorius1*
 Corinna Mori1*
 Janek Greskowiak2
 Lea Boettcher1
 Carina Bunse1†
 Thorsten Dittmar1,3
 Leon Dlugosch1
 Nils Hendrik Hintz1
 Meinhard Simon1,3
 Maren Striebel1
 Katharina Pahnke1
- 1Institute for Chemistry and Biology of the Marine Environment (ICBM), University of Oldenburg, Oldenburg, Germany
- 2Institute of Biology and Environmental Sciences (IBU), University of Oldenburg, Oldenburg, Germany
- 3Helmholtz Institute for Functional Marine Biodiversity at the University of Oldenburg (HIFMB), Oldenburg, Germany
Rare earth elements (REEs) are used as powerful proxies for a variety of oceanic processes. The understanding of their biogeochemical behaviour in the marine environment is therefore essential. While the influence of OM-cycling on REE patterns in seawater is considered as insignificant, it has been shown that algae and bacteria provide good sorption surfaces for REEs and that components of the dissolved OM pool are able to complex REEs, thus potentially altering their behaviour. To investigate the impact of bio-associated processes on REEs in the bio-productive marine environment, we conducted an indoor mesocosm experiment that mimicked a phytoplankton spring bloom in the neritic coastal North Sea. The incubation period of 38 days covered two distinct phytoplankton bloom phases (diatoms followed by Phaeocystis sp.) and an interjacent bacterioplankton maximum. All dissolved REEs (dREEs) except samarium showed similar temporal concentration patterns, which were closely connected to the bloom succession. The concentration patterns were shaped by the ‘phytoplankton-shuttle’, which summarizes adsorption processes on phytoplankton-derived particulate OM (POM) and resulted in decreasing dREE concentrations alongside chlorophyll-a and POM maxima. The ‘heterotrophic-shuttle’ resulted in increasing dREE concentrations likely linked to heterotrophically mediated regeneration of POM and associated desorption processes. The effect of these processes on dREEs resulted in enhanced fractionation of light REEs (LREEs) relative to heavy REEs (HREEs) during adsorption processes and decreased fractionation as a result of desorption. At times of high dissolved organic carbon (DOC) concentrations, we observed a stabilization of especially dHREEs likely in organic complexes. To test the potential influence of DOC on dREEs, we used a PHREEQC model approach that revealed dREE complexation with components of the DOC pool and an increase in complexation with atomic mass of the REEs. That is, at high DOC concentrations OM-dREE complexation leads to an effective and preferential buffering of dHREE against adsorption. Our findings reveal that OM-cycling influences concentration patterns of dREEs via ad- and desorption processes as well as organic complexation with parts of the OM pool, suggesting these processes can have a significant impact on dREE concentrations in the natural marine environment under high OM conditions.
1 Introduction
Rare earth elements (REEs) are used as proxies to identify and understand a variety of processes in the ocean, including scavenging, the influence of terrestrial input, and provenance of particles or water masses in the present and past. Considering the wide field of applications for REE distributions and patterns in marine science, detailed knowledge of their behaviour in the marine environments is critical.
The group of REEs comprise the lanthanide elements from lanthanum (La) to lutetium (Lu). Based on their atomic mass, REEs can be classified in three different groups: (1) Light REEs (LREEs), including the elements from La to samarium (Sm), (2) middle REEs (MREEs), with the elements from europium (Eu) to holmium (Ho) and (3) heavy REEs (HREEs), with the elements from erbium (Er) to Lu. In general, REEs build a very coherent group in terms of chemical and physical properties. All REEs have a common oxidation state of +III, as electrons only fill the strongly shielded 4f-orbitals. Exceptions include cerium (Ce) with an additional oxidation state of +IV, that leads to characteristic negative Ce anomalies in oxygenated seawater, and europium (Eu), which also occurs in the oxidation state +II. However, there are gradual changes in chemical behaviour resulting from increasing electron count and atomic mass, leading to decreasing ionic radii known as the lanthanide contraction. This affects the solution and surface chemistry and leads to process specific fractionation patterns within the REE series (Henderson, 1984; Alibo and Nozaki, 1999; Nozaki, 2001).
In seawater, the fractionation across the REEs is shown via normalization to a standard such as the Post Archean Australian Shale (PAAS) (Taylor and McLennan, 1985; Rudnick and Gao, 2003) representing average crustal concentrations. Resulting dissolved REE (dREE) patterns in seawater typically show an enrichment of HREEs relative to LREEs. The high stability of HREEs in the dissolved pool is the result of higher stability constants compared to LREEs for carbonate complexes, leading to a higher particle association of LREE compared to HREE (Turner et al., 1981; Byrne, 2002; Luo and Byrne, 2004).
Vertical concentration profiles of trivalent dREEs in the open ocean follow a nutrient-type profile with low concentrations in surface waters and increasing concentrations with depth (Elderfield, 1988; Alibo and Nozaki, 1999; Nozaki, 2001). These profiles have been related to biological productivity in surface waters leading to REE adsorption coupled to microbial regeneration and associated dREE release in deeper waters (Elderfield, 1988). Biological influences on dREEs in seawater are discussed in recent studies, including dREE release by microbial regeneration of particles within the open water column (Stichel et al., 2015; Lagarde et al., 2020) and at the sediment-water interface (Abbott et al., 2015), as well as a “bio-reactive pool” of REEs in seawater (Haley et al., 2014). Detailed information on the corresponding biological processes is, however, still missing. It has been shown that organically coated particles and phytoplankton have higher binding constants for REEs than inorganic surfaces, with both showing higher affinities for LREEs relative to HREEs (Byrne and Kim, 1990; Sholkovitz et al., 1994). Living macroalgae can remove substantial amounts of dREEs via sorption processes, with removal rates and fractionation patterns differing depending on biological species (Ramasamy et al., 2019; Costa et al., 2020; Pinto et al., 2020). Some studies suggest an uptake of REEs into algal cells (Minoda et al., 2015), with diatoms preferentially incorporating HREEs over LREEs into their opal frustules (Akagi et al., 2011; Akagi, 2013). Binding on bacterial cell walls shows a preferential adsorption of HREEs relative to LREEs, opposite to most phytoplankton-associated affinities (Takahashi et al., 2005; Tsuruta, 2006; Takahashi et al., 2007; Moriwaki et al., 2013; Moriwaki and Yamamoto, 2013). The potential complexing sites, likely carboxylates and phosphates, seem to differ between phytoplankton and bacterial surfaces (Strady et al., 2015). The main inorganic scavengers of REEs are metal oxides, such as iron- (Fe) and manganese- (Mn) (oxy) hydroxides. Despite the assumption of biological inertness of REEs, recent studies showed that some bacteria carry lanthanide-dependent proteins (Cotruvo, 2019 and references therein). The LREEs are even essential for some bacteria growing on simple carbon (C1) compounds, as they are needed as cofactors in the enzymes alcoholdehydrogenase (Shiller et al., 2017; Daumann, 2019; Huang et al., 2019; Glass et al., 2020). The absorption of LREEs likely occurs via lanthanophores that are, similar to siderophores for iron, excreted by the methanotrophs for the sole reason to bind the LREEs and transport them into the cells (Shiller et al., 2017; Cotruvo, 2019; Daumann, 2019).
The current understanding of the chemical speciation of dREEs in seawater is challenged by recognizing the importance of organic complexation (Schijf and Byrne, 2021 and references therein). Model simulations paired with field studies in terrestrial waters revealed that humic acids are able to complex dREEs. These organic REE complexes can occur in large quantities and in even higher abundances than inorganic carbonate complexes (Tang and Johannesson, 2003; Sonke and Salters, 2006; Pourret et al., 2007; Marsac et al., 2011; Marsac et al., 2021). However, terrestrial waters have lower carbonate concentrations than seawater, so that these findings of competition between carbonate and OM as dissolved ligands cannot be transferred directly to seawater. Studies on natural groundwaters observed a correlation between dissolved organic carbon (DOC) and REEs that increases with atomic number, suggesting that the process of organic complexation is most relevant for HREEs (Johannesson et al., 2004). Due to the different structures and therefore possible binding sites of terrestrial humic acids and bacterially produced dissolved OM (DOM) in the ocean (Catrouillet et al., 2020), their effects on REE complexation can be expected to differ. Experiments conducted to determine the stability constants of organic REE complexes and to model their relevance in the marine environment showed that bacterially produced DOM is able to strongly complex REEs (Christenson and Schijf, 2011). Specific REE complexers, the lanthanophores, mainly bind LREEs (Shiller et al., 2017; Cotruvo, 2019; Daumann, 2019). The siderophore desferrioxamine B (DFOB), which is produced by bacteria to specifically bind Fe and promote its transfer into their cells (Boukhalfa and Crumbliss, 2002), has been identified to complex REEs with high affinity for HREEs and only small effects on LREEs in marine environments (Christenson and Schijf, 2011; Schijf et al., 2015). Furthermore, DFOB seems to enhance the transfer of REEs from volcanic ashes to waters by formation of dissolved REE-DFOB complexes, resulting in depletion of LREEs relative to MREEs and selective enrichment of Ce in the water (Bau et al., 2013). Organic REE complexes are up to eight-fold more stable than carbonate complexes and can therefore significantly alter REE abundances and patterns (Christenson and Schijf, 2011; Schijf et al., 2015). It was shown that typically present Ce-anomalies in seawater are much smaller in open ocean waters with high organic content, which is likely caused by organic complexes of Ce with DOM (Censi et al., 2010). However, systematic studies evaluating the effect of organic REE complexation on dREE patterns in the marine environment have not been conducted.
Phytoplankton dynamics in the North Sea have a characteristic succession, in which phases of high phytoplankton biomass alternate with phases of low phytoplankton biomass, which are dominated by heterotrophic and in particular bacterial activity (Lunau et al., 2006; Meier, 2014; Teeling et al., 2016). The typical North Sea spring bloom starts with a first phytoplankton bloom phase that is dominated by diatoms. Their growth leads to a general scarcity of nutrients that finally become insufficient for diatom growth. It follows a second phytoplankton bloom phase, which is dominated by Phaeocystis sp. (Lancelot and Mathot, 1987; Alderkamp et al., 2006; Degerlund and Eilertsen, 2010). A distinctive feature of Phaeocystis sp. is its occurrence in colonies, typically composed of a mucilaginous matrix (Lancelot and Mathot, 1987; Lancelot, 1995; Schoemann et al., 2005). This matrix builds an ideal adsorption surface for trace metals and is capable of significantly altering their cycling; a phenomenon observed for Fe and Mn (Schoemann et al., 2005; Alderkamp et al., 2007). Because of the high OM production, a phytoplankton bloom is accompanied by high activities and biomass of heterotrophic bacterioplankton and associated recycling of particulate organic matter (POM) and DOM. Over the course of the spring bloom, the amount, composition and diversity of OM (dissolved and particulate) varies, depending on the biological activity (autotrophic and heterotrophic) of the bloom-associated organisms (Buchan et al., 2014; Osterholz et al., 2016; Teeling et al., 2016).
Knowledge of the effects of biological productivity and associated OM cycling on dREEs is important to fully understand REE behaviour in seawater. Possible processes and resulting implications for abundances and fractionation patterns of dREEs in seawater are often overlooked in current studies. The main motivation of the present study therefore is to gain a better understanding of bio-associated processes of REEs in the marine environment. Based on the previous findings stated above, we hypothesize that in the course of the phytoplankton bloom in our mesocosm study (1) REEs adsorb onto POM, with higher relevance for LREEs relative to HREEs causing a high fractionation of HREE over LREE in the dissolved pool, and (2) DOM complexes REEs, with higher relevance for HREEs relative to LREEs causing an enlarged fractionation (HREE over LREE) within the dissolved pool.
These hypotheses were tested by coupling a mesocosm experiment with model simulations. Using an experimental mesocosm approach, we studied dREE concentrations during an artificially induced spring bloom in an enclosed water body that mimicked a neritic North Sea water mass. This approach allows us to control the physical processes, suppress the influence of lithogenic and refractory OM background on the dREE pattern, and focus on the effect of bloom-associated processes on the dREE abundances and patterns in highly productive seawater. The abundances of organic REE complexes were simulated using PHREEQC, a geochemical computer program for aquatic systems.
2 Mesocosms approach: ‘The EcoMol Planktotron experiment’
The investigation of the dREEs was carried out in the framework of the so called ‘EcoMol Planktotron Experiment’, where an artificially induced phytoplankton spring bloom was studied. This particular mesocosm approach aimed to investigate a natural North Sea plankton community during an artificially induced spring bloom by monitoring a variety of parameters, identify intercorrelations by directly linking causes and impacts, and assess effects of and on an annual spring bloom. The details of the mesocosm approach including experimental set-up, sampling and sample preparation, as well as the analytical approaches applied for the characterization of the basic environmental conditions are described by Mori et al. (2021). Parameters discussed by these authors include bacterial abundances, POM, phytoplankton community composition, DOC, macronutrients (dissolved silica (dSi) and ammonia (NH4+)) as well as dissolved Fe (dFe) and dissolved Mn (dMn). An overview of the mesocosm setup as well as the most essential findings from Mori et al. (2021), which are important in the context of the present study, are described below.
The EcoMol Planktotron Experiment was carried out in structurally identical indoor mesocosms (so called ‘Planktotrons’) – 600L water containers made of stainless steel and fully controllable in terms of light, temperature and water mixing (Gall et al., 2017). Three (P2-P4) of a total of 8 biological replicates and two additional biota-free controls (C1, C2) were investigated regarding the REE cycling. The described set-up, sampling and results refer only to the above listed replicates (P2-P4 as well as C1 and C2).
All mesocosms were filled with 600 L artificial seawater, which was prepared by dissolving pre-blended salt (Pro-Reef Sea Salt, Tropic Marine, Switzerland) in de-ionized water for each Planktotron. The preparation of the artificial seawater was done at room temperature (~17°C). Adjustment to ambient North Sea temperatures (~7.5°C) prior to inoculation led to the precipitation of inorganic particles, presumably Fe- and Mn-oxides (Mori et al., 2021). A final salinity of ~33 was maintained to match the salinity of the inoculum. A natural plankton community prefiltered through 200 µm was retrieved in March 2018 from the southern North Sea on board R/V Heincke (Knust et al., 2017) and served as inoculum for the biological replicates. While all trace metals were contained in the salt itself, macronutrients (NO3-, DIP and dSi) and vitamins (B1, B2, B5, B7 and B12) were added prior to the inoculation. Incubations were carried out under a natural day-night cycle (including dusk and dawn) of 14:10 h, which was simulated by two controllable LED light units per Planktotron. The mean incubation temperature was increased by 0.2°C daily (starting at 7.5°C) until a maximum temperature of 10°C was reached and held constant at this level afterwards. In order to implement a convection within the water column and to prevent sinking losses, the bottom temperature was adjusted to 1°C above and the surface temperature 1°C below the mean incubation temperature. Hourly mixing for 10 min by built-in mixing paddles further ensured the homogenization of the water column. The final macronutrient concentrations, light as well as temperature conditions were adapted to the 90% percentile of the Helgoland Roads data from April 1962-2008 (Wiltshire et al., 2010).
The mesocosm experiment covered a total incubation time of 38 days. The sampling for the parameters pH, in vivo chlorophyll-a (Chl-a), bacterial abundance, POM, and phytoplankton community composition was performed daily, directly after the hourly mixing cycle. Sampling for DOC, macronutrients, total alkalinity (TA), and trace metals was conducted at 1-5 day intervals.
During the mesocosm experiment, a phytoplankton spring bloom developed, which was comparable to typical coastal North Sea blooms in terms of development and community composition (Figure 1A) (Lancelot and Mathot, 1987; Alderkamp et al., 2006; Degerlund and Eilertsen, 2010). While the first phytoplankton bloom phase (days 1-11), dominated by diatoms, was of similar intensity (based on Chl-a concentrations) in all three replicates, the second Phaeocystis sp. dominated phytoplankton bloom phase (days 20-38) was significantly different in the replicates. Bloom intensity increased from P3<P2<P4. Highest numbers of free-living bacteria were observed in the transition phase between phytoplankton blooms (days 11-20; shift from diatoms to Phaeocystis sp.), with highest numbers in P2, followed by P3 and P4 (Figure 1A). The POM concentrations (particulate organic carbon + particulate organic nitrogen) generally reflected the temporal development of the phytoplankton bloom itself. The DOC concentrations remained low during the diatom bloom (29 ± 5 µmol L-1). A significant DOC increase occurred with increasing bacterioplankton abundances, with a mean of +10 µmol L-1/day and a maximum daily increase of +70 µmol L-1, and continued during the exponential growth phase of the secondarily occurring Phaeocystis sp. bloom. DOC concentrations levelled off or slightly decreased afterwards. At the end of the incubation (day 38), highest DOC concentrations ranged from 176 µmol L-1 in P3 to 347 µmol L-1in P2 (Figure 1B).
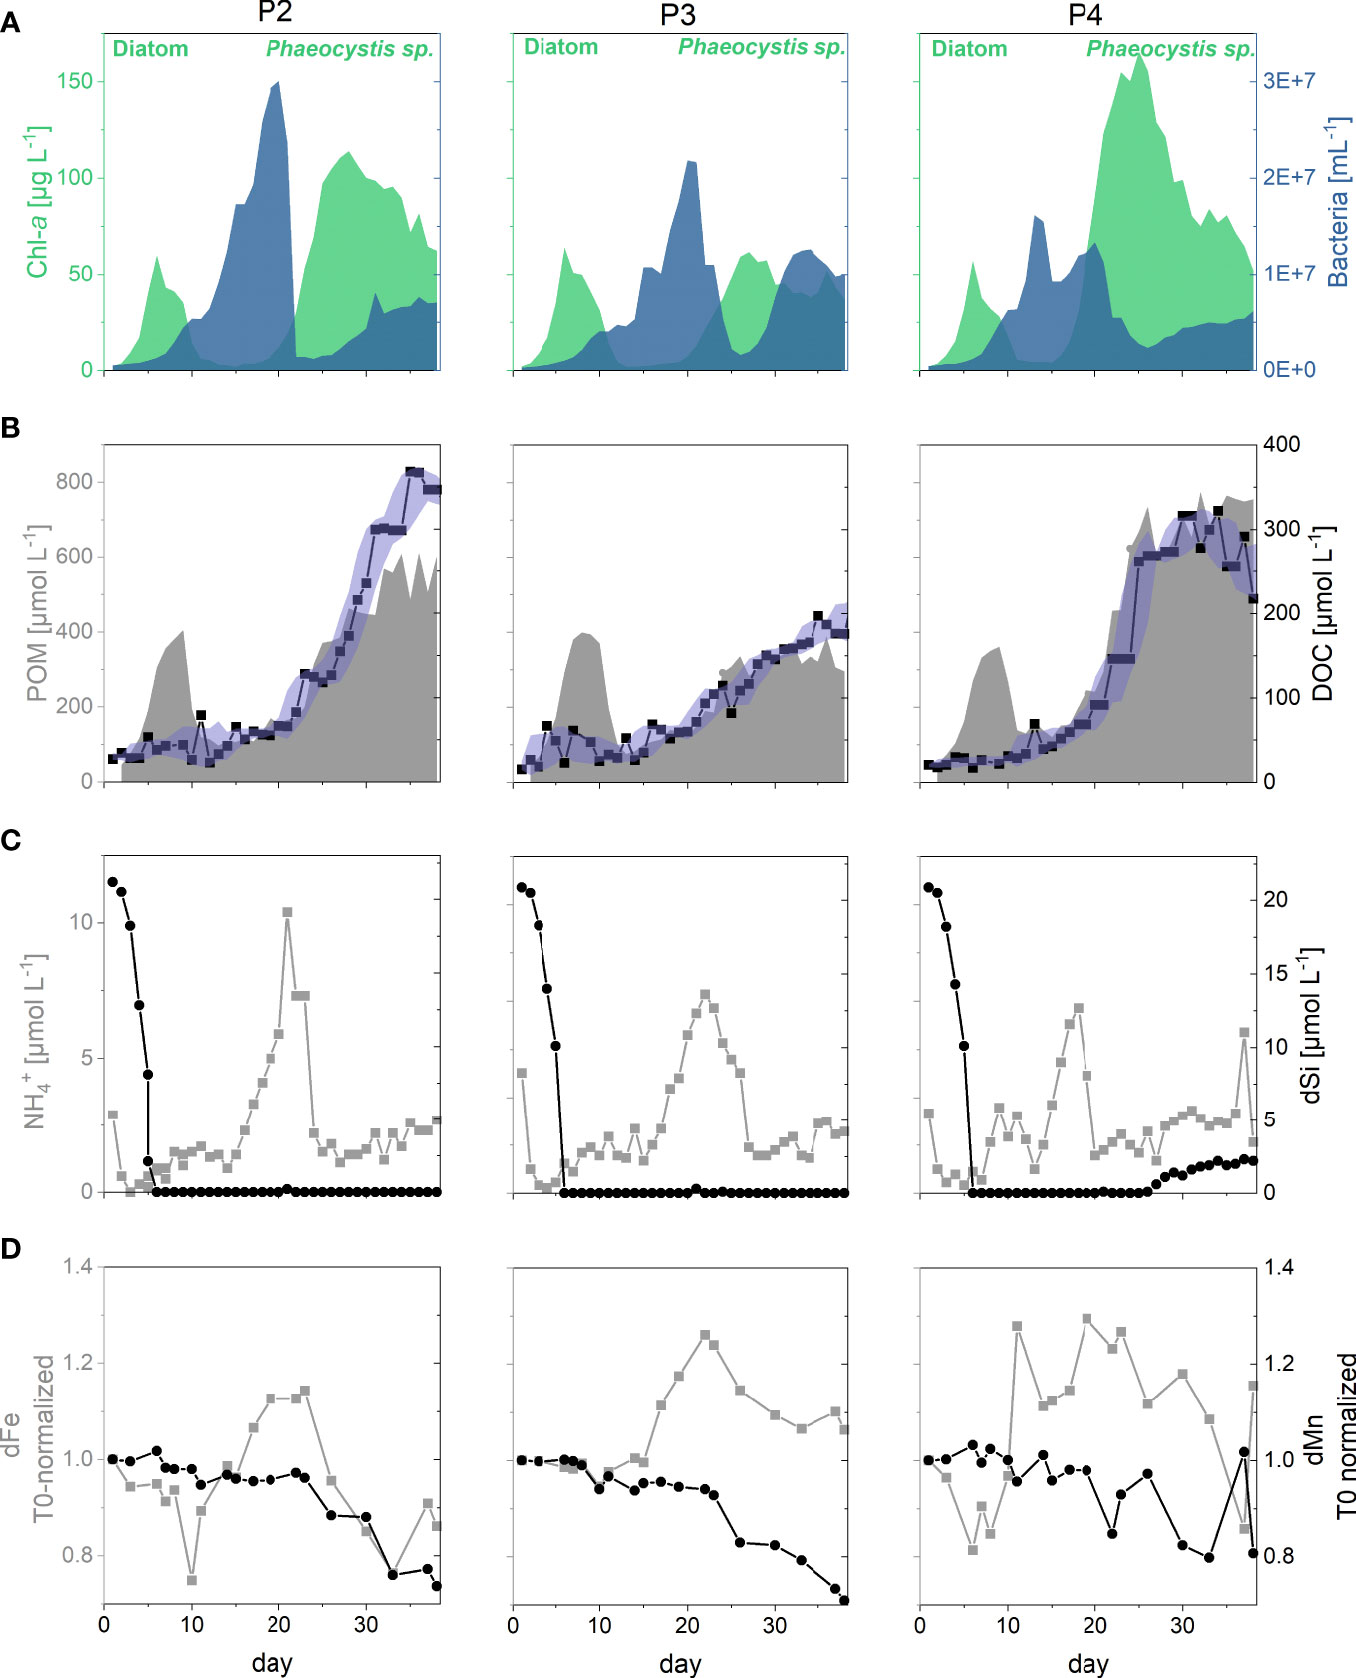
Figure 1 Ecological framework within the three biological replicates (P2-P4) covering the incubation time of 38 days. (A) Temporal development of the two consecutive phytoplankton blooms (diatoms followed by Phaeocystis sp.) represented by Chlorophyll-a (Chl-a) concentrations in green, and the bacterioplankton maximum represented by cell numbers of free-living bacteria in blue. (B) Temporal course of the concentrations of particulate organic matter (POM) concentrations represented by the grey area, and of dissolved organic carbon (DOC) represented by black squares/line. The purple area indicates the moving average of DOC (averaged by five points). (C) Temporal course of ammonium (NH4+) and dissolved silicon (dSi) concentrations represented by the grey squares/line and black dots/line, respectively. (D) Temporal course of dissolved iron (dFe) and manganese (dMn) concentrations normalized to initial (T0) concentrations represented by the grey squares/line and black dots/line, respectively. Note that all data shown in this figures have previously been published by Mori et al. (2021).
The pH values fluctuated between 8.1 and 10.5 over the course of the incubation in all replicates with values in the biological replicates increasing with the phytoplankton bloom phases (Supplementary Figure 1A). The initially added dSi decreased with the onset of the diatom bloom, reaching concentrations around and below the detection limit of 0.3 µmol L-1 at day 6 and remained constant until the end of the incubation, except for a minor increase in P4. Concentrations of ammonium (NH4+) reflected the course of the bacterial activity, with high concentrations during the transition phase between the phytoplankton blooms (Figure 1C).
Although Mn and Fe are both known to be redox-sensitive and bio-associated elements (Bruland et al., 2014), their behaviour differed over the course of the incubation and for dFe additionally between the biological replicates and the biota-free controls. While dMn concentrations remained constant in the biota-free controls (1297 ± 30 nmol L-1), dFe showed a steady decrease (mean of -13 nmol L-1/day) over the course of the incubation, which was most likely associated with adsorption on the mesocosm walls. This dFe trend was not observed in the biological replicates, where small changes with overall increasing concentrations occurred. This indicates a possible shielding from precipitation as Fe-oxides as a result of complexation with various organic matter pools (Mori et al., 2021). Slight dFe increases throughout the incubation time in the biological replicates (Figure 1D) were attributed to the release of dFe from the mesocosm walls or from the particulate matter precipitated prior to the incubation (see above). In contrast, the almost constant dMn concentrations during the first occurring diatom bloom followed by a shift to decreasing concentrations with the onset of the Phaeocystis sp. bloom (Figure 1D), were suggested to reflect a mixed signal of active Mn-accumulation and passive adsorption by the mucilaginous matrix of Phaeocystis sp. as well as Mn-oxide precipitation (Mori et al., 2021).
3 Material and methods
3.1 Total alkalinity
Total alkalinity (TA) was determined on the same samples as dissolved nutrients (Mori et al., 2021). The respective samples were taken daily after the hourly mixing via ultrapure water (purified on the Milli-Q system Millipore, 18.2 MΩ x cm) and sample rinsed syringes attached to low density polyethylene (LDPE) tubing. Samples were filtered directly through 0.45 µm pore size Surfactant-Free Cellulose Acetate (SFCA) membrane filters, collected into pre-cleaned 5mL Eppendorf tubes and toxified with HgCl2 to a final concentration of 0.01 vol%. Until further analysis, samples were stored in the cool and dark. For TA analysis we used a multiscan GO microplate spectrophotometer (Thermo Scientific) and followed a modified method by Sarazin et al. (1999).
3.2 Dissolved REEs
Samples for dREE analyses were taken in three replicates (P2 to P4) at intervals of 1-5 days after the hourly mixing from a depth of about 30-40 cm below surface. Sampling was performed using LDPE tubes and syringes (25 mL), pre-rinsed with ultrapure water and sample. Samples were filtered directly through 0.45 µm pore size SFCA membrane filters, collected into acid pre-cleaned LDPE bottles and acidified with ultra-clean concentrated HNO3 to 2 vol. % and a final pH of ≤2.
For the analysis of dREEs, we diluted 3 mL of each sample with 8 mL ultrapure water, which was acidified to pH 2 by adding ultraclean HNO3. The diluted sample was then further adjusted to pH 2, if necessary, using ultraclean HNO3 and/or NH4OH The sample handling was carried out in a clean lab. Nitric acid was purified by single sub-boiling distillation and NH4OH was purified by evaporation and absorption into ultrapure water under ultraclean conditions. Preconcentration, analysis and quantification of dREEs followed the method described in Behrens et al. (2016). In brief, all samples were spiked with a multi-element REE isotope spike (DKM, prepared by Gilbert N. Handson of SUNY Stony Brook). After an equilibration time of at least 48 hrs, the samples were purified and preconcentrated using the seaFast-pico™.system (Elemental Scientific) in offline mode. Elemental analyses were carried out via inductively coupled plasma mass spectrometry (ICP-MS, Thermo Finnigan Element II). We introduced the samples into the ICP-MS using an autosampler (CETAC ASX-100) and a desolvation introduction system (CETAC Aridus II) to enhance sensitivity and lower oxide formation rates (<0.05% for Ce). We therefore did not apply any correction for oxide formation to the measured values. Concentrations of dREEs were quantified via isotope dilution and additional measurements of external standards (Coral Sea Standard in concentrations of 40, 55, 65, 80 and 100 ppt). Seawater standard SAFe 3,000 m (North Pacific) was purified and analysed regularly (about 2-3 times) in each seaFAST and ICP-MS session. Procedural blanks were prepared and analysed in the same manner as samples using 11 mL of ultrapure water at pH 2.
External reproducibility, that we determined by repeated preconcentration and analysis of seawater samples from North Pacific station SAFe 3,000 m, was <3% for all elements except Gd (3.5%) and Ce (8.1%). Apart from La, all REEs were within the confidence interval of the long-term laboratory mean of SAFe 3,000 m measurements published by Behrens et al. (2016), even though our values for Ce were much lower than previously reported (Table 1). Procedural blanks accounted for <0.5% of sample concentrations (Table 1), sample concentrations were therefore not blank-corrected.
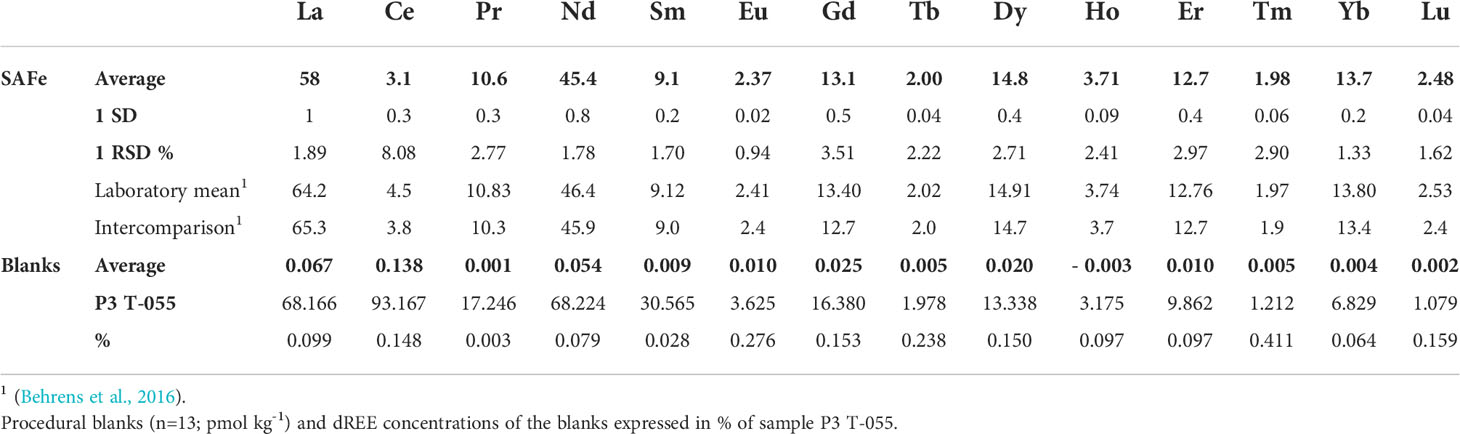
Table 1 Dissolved REE concentrations (pmol kg-1) of SAFe 3000 m (n=7), and long-term laboratory mean and intercomparison value from Behrens et al. (2016).
3.3 Data processing
The group of REEs was subdivided into three individual subgroups: LREEs (La, Ce, Pr, Nd), MREEs (Eu, Gd, Tb, Dy, Ho) and HREEs (Er, Tm, Yb, Lu). This is possible without losing valuable information, since the behaviour of individual REEs within the subgroups is quite similar, which was confirmed within this study. The element Sm was excluded from all calculations and discussions since its concentration over time was significantly different compared to the other REEs (see also results below). In this study, we want to emphasise the common observations for REEs and focus on more general processes between REEs and OM.
In order to illustrate changes throughout the incubation period, we normalized the dREE concentrations of each time point to its initial concentration (T0) in the respective replicate. Fractionation was calculated via the ratio of HREE/LREE = (Lu+Yb+Tm)/(La+Pr+Nd) using values normalized to PAAS (Rudnick and Gao, 2003). The uncertainties for HREE/LREE, as calculated from the SAFe 3,000m replicates, was on average 0.06
Losses and gains of dREEs were calculated by dividing the minimal (maximal) concentration by the maximum (minimum) of each phase. A phase is defined as a period within the total incubation time, where the dREE concentration trend is consistent, i.e., no shift from decreasing (increasing) concentrations to the opposite occurred (see section 4.2).
3.4 Statistical approach
The intercorrelations of the various biogeochemical parameters presented in the context of this study were determined by a three-step approach combining a Spearman correlation analysis with a cluster and a non-metric multidimensional scaling (NMDS). All statistical analyses were carried out using R version 4.1.0 (R Core Team, 2016) and performed on a combined dataset for all three biological replicates (P2-P4).
In a first step, we performed a correlation analysis, where we correlated each biogeochemical parameter (n) with each other, creating a n x n similarity matrix, based on Spearman’s rho (rho), using the rcorr function of the Hmisc Rpackage (Harrel and Dupont, 2019). The corresponding correlation matrix was visualized using the corrplot function by corrplot R-Package (Wei and Simko, 2007). The parameter rho indicates correlation based on ranks, where +1 indicates a strong positive and -1 indicates a strong negative correlation (Spearman, 1904). As significant, we considered correlations with a p value of <0.1.
In a second step we combined a hierarchical clustering analysis with a NMDS using the complete linkage algorithm. Clusters are classically shown as dendrograms a NMDS, however, is able to visualize intercorrelations of parameters in a two-dimensional space. We used a 1-|rho| distance matrix, so that parameters with strong positive and negative correlations plot close to each other. To determine the optimal number of clusters (koptimal), we used the maximal average silhouette value (Kaufman and Rousseeuw, 2005; Borcard et al., 2018). Setting a maximum of kmax=9 clusters, the optimal number of clusters for the present dataset was koptimal=4 (Supplementary Figure 2 and 3). We visualized the resulting dendrogram using the dendextend package (Galili, 2015). The NDMS was calculated using the metaMDS function of the vegan package (Oksanen et al., 2019).
3.5 PHREEQC model: Organic complexation
The interplay between dREEs and dissolved ligands, with special emphasis on organic complexation, was determined based on a model approach using the aqueous geochemical modelling program PHREEQC version 3 (Parkhurst, 1995). This program can simulate aqueous species of a specified solution composition by using equilibrium chemistry. The needed thermodynamic data is defined in an associated database. Since no predefined database contained all the stability constants needed for the modelling of chemical speciation of dREEs under differing elemental concentrations, we constructed a new database following Schijf et al. (2015), including desferrioxamine B (DFOB) as the representative of a strong organic ligand. A detailed description of the database as well as the applied model script is outlined in the supplementary material B. Many studies have modelled the organic complexation of dREEs with terrestrial humic and fulvic acids (HFAs) (Tang and Johannesson, 2003; Sonke and Salters, 2006; Pourret et al., 2007). Catrouillet et al. (2020) showed that microbiologically produced HFAs, in contrast to those of terrestrial origin, preferentially complex HREEs and thus show different complexation patterns with dREEs. Since the existence of terrestrial HFAs can be excluded in our mesocosm approach and the DOC pool in general is probably less complex than in natural coastal waters due to the absence of large algae and a refractory DOC pool, we decided to use only one well described microbially produced organic ligand, DFOB, in our model. This one molecule is not able to reproduce the complexity of DOC, but Schijf et al. (2015) mention that its REE complexation pattern is likely to be typical for various organic ligands. Therefore, the model is expected to be able to show general trends in the complexation of REEs with microbially produced DOC.
The initial modelling step is to characterize the artificial seawater, based on concentrations of the main seawater ions, as well as TA and pH. Each dREE data point is considered in the model as a separate reaction step and the measured dREE concentrations with it entered. The parameters TA and pH are re-defined for each individual reaction step due to their high importance in chemical REE speciation (Byrne, 2002; Liu and Millero, 2002; Luo and Byrne, 2004). In order to focus on the complexation of dREEs, precipitation of particulate phases as well as gas exchange and interfering elements (i.e., Fe and Mn) were not considered in this approach. With entry of the measured dREE concentrations via the individual reaction steps, inorganic REE-complexes with the seawater components and free dREE ions were calculated. To account for and calculate additional REE-DOC complexes, we entered DOC-concentrations to the model by equating parts of the DOC pool with the strong organic ligand DFOB. The final output of a model simulation run were concentrations of inorganic and organic complexes, and free ions, as well as the total concentration for each respective dREE for each reaction step and thereby each data point.
Since the specific fraction of the complex DOC pool, which contains strong organic ligands for REEs and therefore equals DFOB, is not known, we used two different assumptions following Schijf et al. (2015). Thereafter, the definition of the ‘High-DOC’ and ‘Low-DOC’ approach follows maximal simulated REE-DOC proportions to the dREE pool. The ‘High-DOC’ approach results in a maximum of 40% Lu-DOC of total dLu by assuming that strong organic ligands occur with a concentration of c = 10-6 * cm (cm = measured DOC concentration at specific sampling point, that is reaction step). The ‘Low-DOC’ approach results in a maximum of 10% Lu-DOC by assuming concentrations of c = 2*10-7 * cm for strong organic ligands. These assumptions and associated calculation of concentrations were not changed throughout the incubation period, assuming that the parts of the DOC pool acting as strong REE ligands were stable over the entire incubation period.
4 Results
4.1 Total alkalinity
Values for TA fluctuated between 2.6 and 2.9 mmol L-1 with a peak around day 8 to 15 in all biological replicates (Supplementary Figure 1B).
4.2 Dissolved REE concentrations
In comparison to spring conditions in the coastal North Sea (Paffrath et al., 2020), the mesocosm matrix was up to 4-times higher in dLREE concentrations, while dHREEs were half the natural concentrations. Overall, however, the dREE concentrations in the mesocosms were in line with natural relative abundances with enrichment of PAAS-normalized dHREEs relative to dLREEs (Supplementary Figure 4).
In general, the concentrations of dLREEs, dMREEs and dHREEs showed a similar time course, with the largest changes over time with respect to T0 for dLREEs and smallest for dHREEs. The temporal concentration course of dSm differed distinctly from the other dREEs, with concentrations increasing constantly from around day 20 onwards (Supplementary Figure 5). In previous studies dissolved Sm anomalies have been attributed to contamination either during analysis (Möller et al., 2003; Zhu et al., 2006; Lawrence and Kamber, 2007; Takata et al., 2009) or to anthropogenic sources (Kulaksız and Bau, 2013). In the present study, external anthropogenic contamination is, based on the closed incubation set-up, unlikely. Contamination from the set-up itself and the analytical procedures can be excluded since neither the control experiments nor the REE standards show positive Sm anomalies. Thus based on the available dataset, any statement regarding the reason for high or rather increasing Sm concentrations in the biological replicates are highly speculative and are thus not further discussed within the framework of this study. The focus of the present study, is solely on the common REE trends and the drivers responsible for those. Thus, as mentioned above, Sm was not included in the LREE subgroup and will not be discussed further in the context of this study. The general pattern for dREEs can be described as decreasing concentrations during the diatom bloom followed by increasing concentrations during the subsequent bacterioplankton maximum. Concentrations decreased again during the Phaeocystis sp. bloom. During its stationary phase, dREE concentrations increased again in P2 and P4, while concentrations continued to decrease in P3 (Figure 3A).
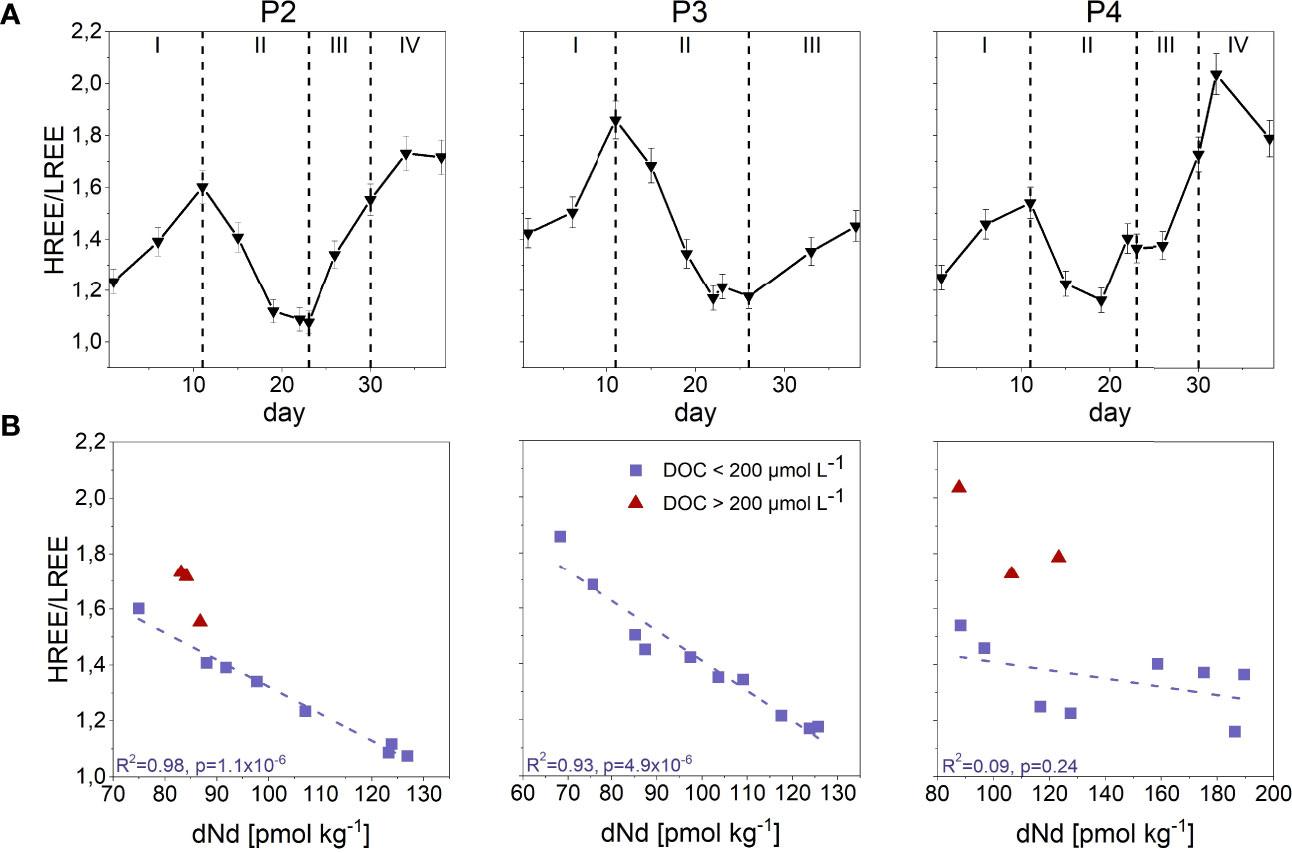
Figure 3 (A) HREE/LREE ratios (black triangles/line) throughout the incubation time of 38 days for the three biological replicates (P2-P4). Dotted black vertical lines show phases with characteristic REE behaviour (phase I-IV). Error bars denote 1SD. (B) HREE/LREE ratios in relation to dissolved neodymium (dNd) (normalized to Post Archean Australian Shale (PAAS) (Rudnick and Gao, 2003), which represents LREEs, for each measuring point over the course of the incubation in the three biological replicates (P2-P4). Each data point is categorized based on the present dissolved organic carbon (DOC) concentration with red triangles representing DOC concentrations > 200 µmol L-1 and violet squares representing DOC concentrations < 200 µmol L-1. The dashed line displays a linear regression between HREE/LREE ratios and dNd for the data points with DOC < 200 µmol L-1.
Within the biota-free controls (C1 and C2), dREE concentrations were slightly higher compared to the biological replicates at T0. At the end of the incubation in the controls, we observed a 40% and 21% loss of dLREEs and dHREEs, respectively (Supplementary Figure 5).
Based on the overall course of dREE concentrations in P2-P4, the incubation time is subdivided into four characteristic phases (Figure 2A):
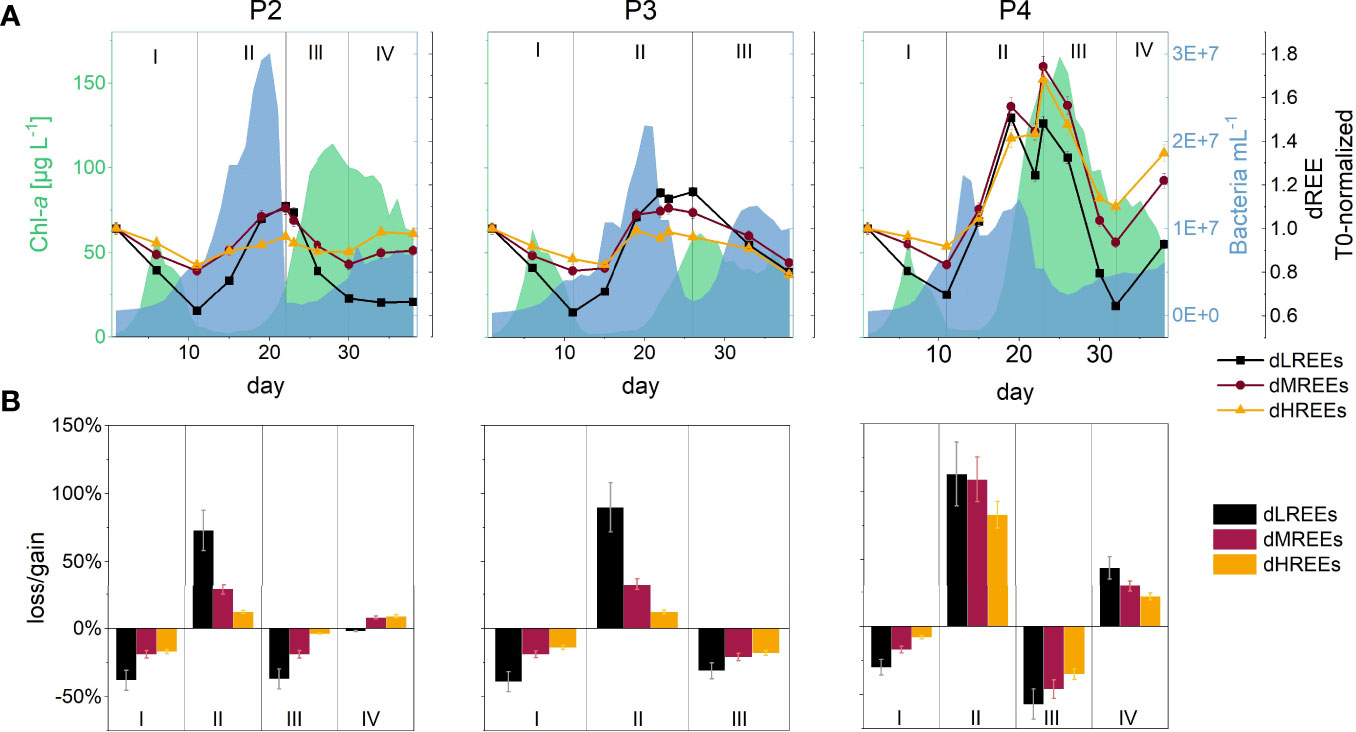
Figure 2 (A) Temporal pattern of dREE concentrations normalized to initial concentrations (T0) for the three REE-subgroups (dLREEs, dMREEs, dHREEs) indicated by black squares/line, red circles/line, yellow triangles/line, respectively, in the three biological replicates (P2-P4). Error bars denote 1SD and are mostly smaller than the symbols. Phytoplankton and bacterioplankton successions covered by the incubation time are represented by the Chlorophyll-a (Chl-a) and free-living bacteria cell numbers and are shown by the green and blue area, respectively. The four individual phases characterized by dREE behaviour, that occur over the course of the incubation, are indicated by the black vertical lines and by the roman numbers I-IV. (B) Losses and gains of dLREE, dMREE and dHREE concentrations, which were calculated by dividing final by initial concentrations in each phase, are shown by the black, red and yellow bars, respectively within the individual REE-characteristic phases. Error bars denote 1SD. Note that samarium is left out of the subgroup of dLREEs due to its anomalously high concentrations and unique temporal pattern.
Phase I: dREE concentrations decrease in P2, P3, P4; day 1-11
Phase II: dREE concentrations increase in P2, P3, P4; day 11-23 (P2, P4), day 11-26 (P3)
Phase III: dREE concentrations decrease in P2, P3, P4; day 23-30(P2, P4); day 26-38 (P3)
Phase IV: dREE concentrations increase in P2 and P4; day 30-38
A normalization to T0 displays enrichments (gains) and depletions (losses) over the total incubation time relative to the starting point, with values of under 1 showing a general loss of dREEs during the experiment. Values of above 1 show a gain of dREEs and were observed for dLREEs and dMREEs from phase II onwards in all biological replicates (Figure 2A). The losses and gains of dREEs within each phase throughout the incubation time show differences within and between replicates. One notable observation is the variations in dHREE behaviour in P2. During phase III (Phaeocystis sp. bloom), the loss of dHREEs in P2 was distinctly lower (-4%) than during phase I (-17%), while the loss of dLREEs (~ -37%) was similar in both phases. In contrast, in phase IV (stationary Phaeocystis sp. bloom) dHREEs increased strongly (+9%), while dLREEs were roughly stagnant (-2%) (Figure 2B).
The HREE/LREE ratios mirrored the overall temporal dREE concentrations, with increasing HREE/LREE ratios for increasing dREE concentrations and vice versa (Figure 3A). Comparison of HREE/LREE ratios with dNd concentrations, as the representative for the LREEs, revealed a linear relationship for the data points with DOC concentrations <200 µmol L-1 (R2 = 0.98, p=1.1x10⁻⁶ (P2); R2 = 0.93, p= 4.9x10⁻⁶ (P3); R2 = 0.09, p= 0.24 (P4)). At times with DOC concentrations >200 µmol L-1, reached during the end of phase III and during phase IV in P2 and P4, the HREE/LREE ratios were above the linear regression line (Figure 3B).
4.3 Statistical correlation
The correlation analysis based on Spearman’s rho (Figure 4) revealed weak positive correlations (0.1<rho <0.4) between the dREEs (especially dHREEs) and directly spring bloom-associated parameters, like POM, DOC and Chl-a. Additionally, positive correlations (rho > 0.4) of the dREE pools with the dFe pool were identified. The combinatorial statistical approach of cluster and NMDS analyses showed an intercorrelation between the three individual dREE subgroups and the dFe pool, that are grouped in one cluster and plotted close to each other and far from other parameters in the NMDS (Figure 5).
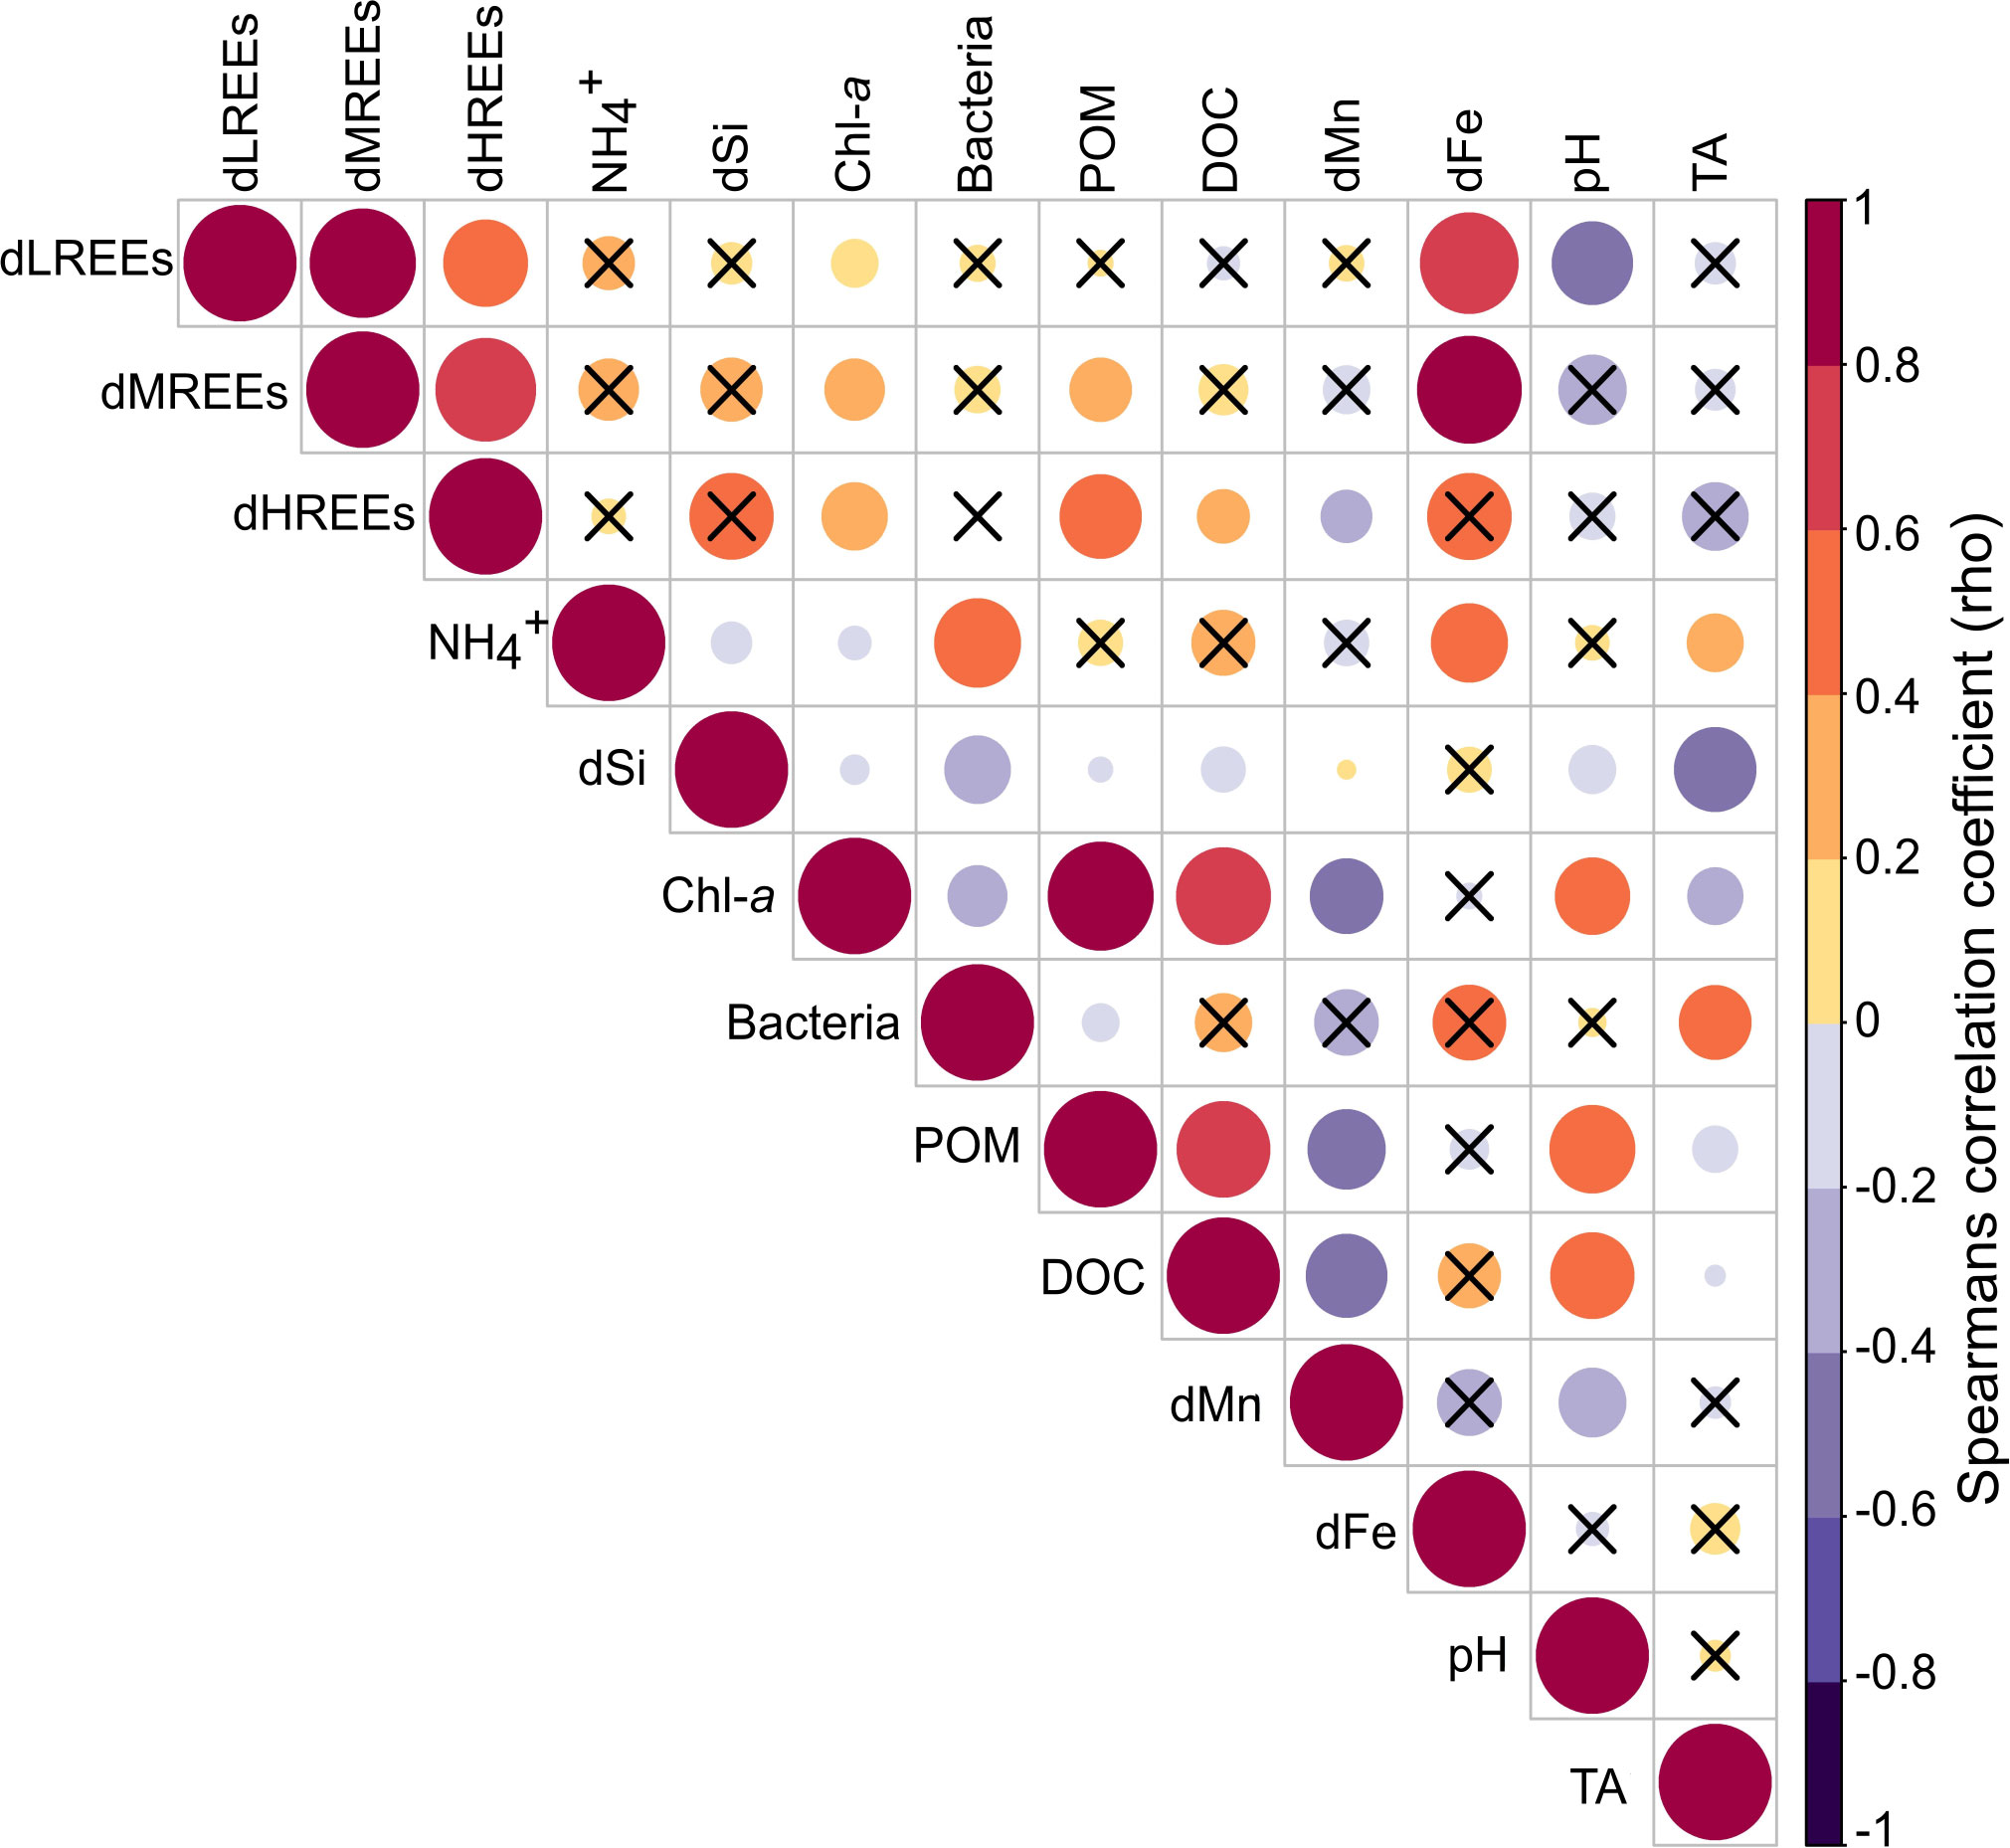
Figure 4 Correlogram based on a Spearman correlation matrix of studied parameters in the three biological replicates (P2-P4). The colour and size of the circles indicate the strength of correlation between two individual parameters. Big red circles indicate a strong positive correlation, while big purple circles indicate strong negative correlation. Correlations identified to be non-significant (p>0.1) are indicated by a black cross in the respective square.
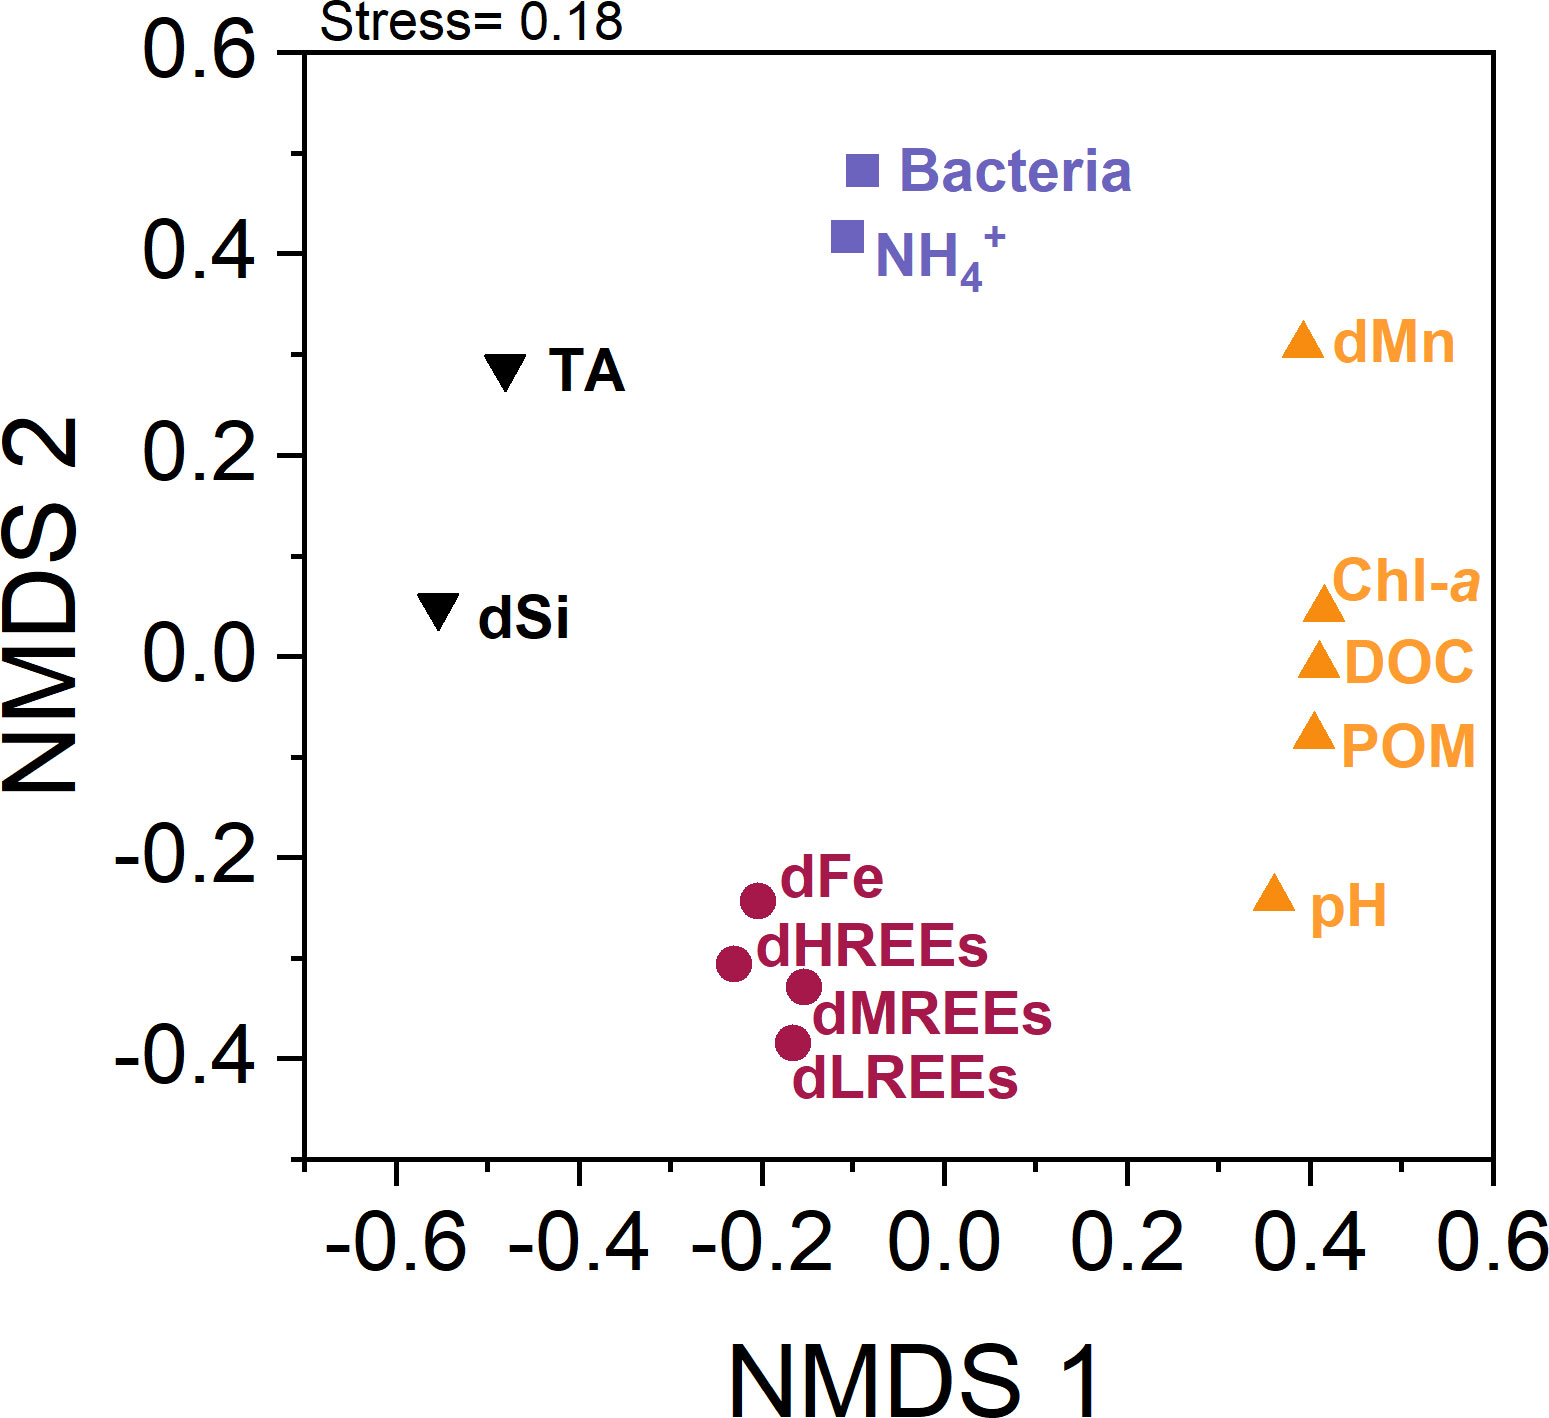
Figure 5 Non-metric multidimensional scaling (NMDS) plot based on 1-|rho| distance matrix of all studied parameters in the three biological replicates (P2-P4). The NMDS ordination yields a stress value of 0.18 indicating a good representation of the data set (Legendre and Legendre, 2012). As a rule of thumb, NMDS with a stress value <0.1 is considered fair, while values >0.3 indicate that the allocation is arbitrary (Zuur et al., 2007). A hierarchical cluster analysis and the associated average silhouette values resulted in an optimal assignment in four clusters (koptimal = 4, Supplementary Figure 2 and 3). The association of parameters to one of the four identified clusters is indicated by the colours black, purple, red and yellow for k1, k2, k3 and k4, respectively.
4.4 PHREEQC: Organic complexation with DOC
The simulations of the applied PHREEQC model showed variations in the proportions of organic complexes (DOC as ligand, REE-DOC complexes) to the dREE pool, that seem to be driven by DOC concentrations and the atomic mass of REEs (Figure 6). In general, the proportions of REE-DOC complexes increased with the onset of the Phaeocystis sp. bloom, in line with increasing DOC concentrations. Depending on the DOC concentration, the proportions of the REE-DOC complexes differed among the three individual biological replicates and over the temporal course. Highest proportions were simulated for the incubation end in P2, which showed highest DOC concentration. While the proportion of REE-DOC were of minor importance for the dLREE pool, it increased for the dMREEs and dHREEs, with highest proportions simulated for ytterbium, the second heaviest element. The ‘Low-DOC’ (Figure 6B) and ‘High-DOC’ approaches (Figure 6A) showed the same temporal and element-specific variations in organic complexation, only differing in the overall proportion of REE-DOC complexes to the total dREE pool. Organic complexes displaced carbonate complexes, which were identified to be the dominant inorganic species.
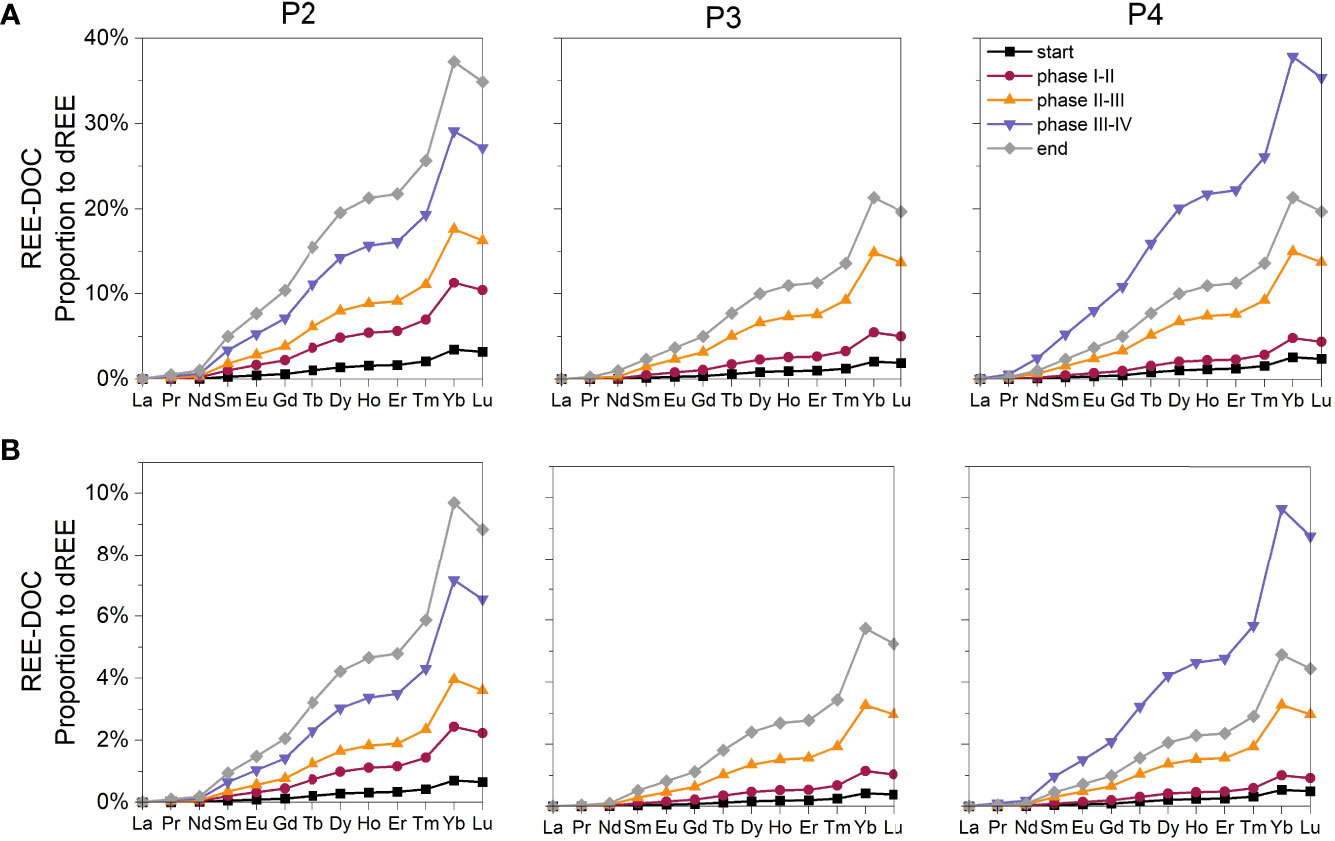
Figure 6 PHREEQC-derived proportions of organic complexes (REE-DOC) relative to the total dREE pool. Data are shown for each element in the three biological replicates (P2-P4) at five different time points marking the start (black squares/line) and end (grey rhombus/line) point of the incubation, as well as the transition points between REE-characteristic phases distinguished by the red points/line, yellow triangles/line and violet triangles/lines, respectively. (A) Simulations using the ‘High-DOC’ approach characterized by reaching a maximal REE-DOC proportion of ~40%. (B) Simulations using the ‘Low-DOC’ approach characterized by reaching a maximal REE-DOC proportion of ~10%.
5 Discussion
The mesocosm approach applied in the present study mimics one enclosed water body located in the neritic environment of the North Sea. External input or output of REEs into or from the mesocosms is not possible and exchange with other adjacent compartments, such as a sediment reservoir or different water masses, is also excluded. The changes in dREE concentrations and fractionation patterns are solely driven by internal processes and caused by the transfer between the dissolved and particulate pools present in the enclosed water mass. This transfer between the different organic and inorganic matter pools can result from a variety of possible organic and/or inorganic processes, and can be associated with different ‘transfer-shuttles’. The identification of the respective shuttles over the course of a phytoplankton spring bloom, as well as their relative impact for the overall dREE concentrations and patterns, will contribute to the understanding of REE cycling/behaviour in marine systems.
As possible processes that might mediate the transfer of REEs between the dissolved and particulate matter pools, the following six major mechanisms will be considered and discussed in the context of this study: (1) the adsorption of REEs onto particle surfaces of organic or lithogenic origin (Elderfield, 1988; Byrne and Kim, 1990; Sholkovitz et al., 1994; Nozaki and Alibo, 2003; Takahashi et al., 2005; Strady et al., 2015; Costa et al., 2020), (2) the co-precipitation of REEs with authigenic minerals (Sholkovitz et al., 1994; Pearce et al., 2013), (3) the incorporation of REEs into particles of biogenic origin (De Baar et al., 1985; Akagi et al., 2011; Minoda et al., 2015), (4) the desorption of REEs from organic and inorganic particles (Elderfield, 1988; Sholkovitz et al., 1994; Nozaki and Alibo, 2003; Hara et al., 2009; Costa et al., 2020), (5) the disaggregation of inorganic particles and associated release of previously bound REEs (Elderfield, 1988; Byrne and Kim, 1990; Sholkovitz et al., 1994; Nozaki and Alibo, 2003), and (6) the regeneration of OM by heterotrophic microbial activity and associated release of REEs (Hara et al., 2009). The major advantage of the mesocosm approach, compared to a classical field approach, is the enclosed nature of the mesocosm that excludes exchange with lithogenic particles and sediments and external in- and outputs from the system, facilitating a focus on the influence of the spring bloom and associated OM cycling on the REE concentrations and patterns.
5.1 Abiotic shuttles
The chemical speciation of trace metals, including REEs, has a strong influence on their behaviour in aquatic systems. The speciation itself is highly dependent on temperature and pH as well as salinity and TA, as they influence the stability constants of solution complexes as well as the availability of ligands in the respective water mass (Henderson, 1984; Byrne, 2002; Liu and Millero, 2002; Luo and Byrne, 2004; Quinn et al., 2006; Quinn et al., 2007). For the speciation of dREEs, TA is particularly important, as it determines the availability of carbonate complexes, the dominating inorganic dREE complexes. In the present study, the initial salinity (at T0) as well as the temporal course of pH and TA showed small temporal changes that were similar in all biological replicates (Supplementary Figure 1). Our simulations of the chemical speciation of dREEs using the PHREEQC model showed, that the small changes of the measured TA of ±0.3 mmol L-1 did not influence the existence of REE-carbonate complexes. A model approach with the measured TA entered and fixed for each individual sampling point/reaction step simulated the exact same results as one using a constant mean TA throughout the simulations. The pH values increased from <8.5 up to 9.5 throughout the biological experiment. For dREEs, studies show that the sorption ability on iron hydroxides, one of the main inorganic scavengers for REEs in seawater, increases with higher pH (Quinn et al., 2006). Solubility of iron oxides appear to stay constant at the pH range observed in our experiments (Liu and Millero, 2002). Moreover, contrary to an expected rise in dREE with decreasing pH, we observe a concentration increase in dREE with increasing pH (phase III in P2 and P4). These observations therefore argue against a major role of pH in dREE behaviour in this study. (Supplementary Figure 1), even though we do not rule out any influence of pH variability.
The main inorganic scavengers for REEs in seawater are Fe and Mn oxides (Elderfield and Greaves, 1982; Nozaki, 2001) due to their large surface area. They can adsorb REEs, acting as a transfer shuttle between the dissolved and particulate REE pool. To investigate the transfer processes associated exclusively with the “abiotic shuttles” and their effects on the dREE pool, in addition to the biotic incubations, two biota-free controls were studied in parallel. The absence of OM in the mesocosms makes it possible to study the influence of abiotic drivers on dREE behaviour. The controls further served to identify possible contamination processes of the stainless steel tanks regarding trace elements. No contaminating input of dREEs or dFe was observed. Iron as well as the dLREEs decreased over the control experiment by 40%, while dHREEs decreased by 20%. Dissolved Mn, on the other hand, increased by 7%. For Fe it was suggested that the loss is driven by adsorption directly onto the mesocosm walls or by precipitation as oxides in the water column (Mori et al., 2021). Similar processes or co-precipitation might also influence the dREEs. The observed dREE fractionation is in line with the higher particle reactivity of LREEs compared to HREEs (e.g. Elderfield and Greaves, 1982; Nozaki, 2001). The biota-containing replicates, in contrast, did not show overall decreasing dREE concentrations, which would indicate adsorption processes on mesocosm walls or on oxides.
These metal oxides were likely formed prior to T0 (see section 2 above) and partly dissolved during phase II. Release of dFe during the same time frame was also attributed to oxide solution (Mori et al., 2021). The behaviour of dMn and dFe in the biological replicates do not support the production of significant amounts of oxides (Mori et al., 2021, see also section 2 above) and thereby limits the possibility of adsorption on inorganic particles as a main transfer-shuttle of the REEs within the mesocosms.
In summary, we conclude that the observed dREE concentration trends are only marginally influenced by abiotic processes/shuttles and that other processes must be more important for driving the overall dREE changes over the incubation period.
5.2 Bio-associated shuttles
Given the dominance of biological cycling and exclusion of other abiotic processes and external influences in the mesocosms, we have to consider bio- or rather bloom-associated processes/transfer shuttles to explain the behaviour of REEs. To determine the nature and effects of these bio-associated shuttles in the mesocosms, we discuss the biological processes which have a possible influence on REEs in the following. Since individual bloom-phases coincided with the identified phases of REE behaviour (phase I-IV), each phase is discussed separately.
5.2.1 Phase I – Diatom bloom
Phase I is characterized by decreasing dREE concentrations and coincides with the occurring diatom bloom and its collapse (Figure 2A). During this phase, there are two possible pathways which could transfer dREE from the dissolved to the particulate pool and cause a loss of dREEs concentrations: (1) the transport into phytoplankton cells and (2) the adsorption onto the phytoplankton cell surfaces. The highest losses were determined for dCe followed by the remaining dLREEs while the lowest losses were determined for dHREEs (Figure 2B), resulting in an increase in HREE/LREE (Figure 3A). Previous studies hypothesised, that diatoms may be able to incorporate REEs into their opal skeleton (Akagi, 2013). The finding of this study regarding dREE and dSi concentrations contradict this hypothesis. Concentrations of dSi decreased during the diatom bloom and were below the detection limit at day 6 until near the incubation end (Figure 1C). Yet, dREE concentrations increased after the diatom bloom in phase II, indicating that REEs are not incorporated into the opal frustules and that the opal skeleton is not recycled during the incubation period.
We therefore suggest that adsorption onto diatom bloom derived POM cause the initial decrease in dREEs and increase in the HREE/LREE ratio. Both living macroalgae (Ramasamy et al., 2019; Costa et al., 2020; Pinto et al., 2020) and phytoplankton (Akagi et al., 2011; Strady et al., 2015) are known as scavengers of REEs. The identified dREE losses in all three biological replicates were consistent with previously described higher affinities for LREEs relative to HREEs on phytoplankton surfaces (Strady et al., 2015) (Figure 3A). We define this transfer-shuttle for REEs, that shows a preference for LREEs, as the ‘phytoplankton-shuttle’ in this study.
5.2.2 Phase II- Bacterioplankton maximum
Phase II is characterized by increasing dREE concentrations and coincides with the high abundance of bacterioplankton between both phytoplankton blooms (Figure 2A). Hara et al. (2009) observed similar concentration trends during an Fe-induced phytoplankton bloom in the western subarctic Pacific. They showed that the decrease in dREE concentrations during the phytoplankton bloom in the Pacific (similar to phase I) was followed by a period of (re-)introduction of dREEs back to pre-bloom conditions (similar to phase II). The latter was explained by the release of REEs as a result of disaggregation of large OM particles, desorption from the particulate pool, and the regeneration of POM. During phase II of our incubation, we observed increasing NH4+ concentrations, which indicate the prevalence of heterotrophic activity (Figure 1C). This assumption is further supported by the co-occurrence of low Chl-a concentrations (as a proxy for photosynthesis) and high abundances of free-living bacteria (Figure 1A; Mori et al., 2021).
For Fe it has been shown that heterotrophic activity and the associated regeneration processes can release particle-associated Fe (Hutchins and Bruland, 1994; Schoemann et al., 1998). Regarding the dREEs in the present study, concentrations decreased further during the collapse of the diatom bloom. The switch to increasing concentrations did not occur until Chl-a concentrations reached near zero, suggesting a dominance of heterotrophic over autotropic activity. The release-mechanisms for REEs are likely the same as described for Fe: disaggregation and remineralisation of POM and release of adsorbed REEs (Hutchins and Bruland, 1994; Schoemann et al., 1998; Schoemann et al., 2001). The late timing of the dREE increase could be caused by the direct (re-)adsorption of REEs after their release, as long as sufficient particulate adsorptive sites are still available. The highest gains were observed for dLREEs, especially for Ce and lowest for dHREEs (Figure 2B), as also reflected in a decrease in HREE/LREE ratio (Figure 3A) The preferential adsorption of LREEs on particles is typically followed by higher releases of LREEs during recycling processes (Sholkovitz et al., 1994).
Adsorption of REE on bacterial surfaces and/or incorporation, as suggested by previous studies, would lead to a preferential dHREE loss (Takahashi et al., 2005; Takahashi et al., 2007; Moriwaki and Yamamoto, 2013). Since we did not observe a preferential dHREE depletion at the time of increasing bacterial abundances, we cannot confirm these previous findings. The (re-)dissolution of elements caused by heterotrophic activity seems to superimpose any effect of adsorption on bacterial surfaces. Another possible reaction between bacteria and REEs could be the sequestration of LREEs by lanthanide-dependent bacteria (see above; Daumann, 2019; Huang et al., 2019; Glass et al., 2020; Meyer et al., 2021), leading to LREE removal from seawater. Even though methane was not determined during the experiment, its production during this incubation phase is unlikely since the developing phytoplankton are not known to produce methane (Klintzsch et al., 2019). Diatoms, however, build macro aggregates which might include euxinic zones (Bianchi et al., 2018)in which methanotrophic bacteria could potentially be present. We however classify the overall importance of methanotrophic bacteria in the incubations to be minor as well as their influence on the dREE behaviour. We do not see losses in the dLREEs that would support their bacterial sequestration, but instead observed high gains.
The dLREEs and dMREEs during phase II reached concentrations which were elevated with respect to the initial (T0) concentrations (Figure 2A). Since external sources as well as contamination from the mesocosm-setup itself are unlikely, internally present (particulate) pools and therewith associated processes are probably mediating the gains in the dREE pool. As outlined above (section 2), we observed precipitation of particles, likely metal oxides, before T0. It is likely that the precipitation of these inorganic particles was accompanied by the co-precipitation of REEs, as also observed over the course of the experiment in the biota-free controls. The REEs associated with these particles were missing from the dissolved pool initially, but can be transferred back by particle transformation/dissolution during the incubation time. Since we only saw these dREE gains in the biological replicates but not in the biota-free controls, the dissolution/transformation of inorganic particles and associated REE releases to surrounding waters seems to be driven by bloom-associated processes likely by heterotrophically mediated particle transformations. This dREE gain from metal oxides accounts for up to 32% of the total dREE increase in P2 and P3 and 90% in P4. The remaining, associated with high gains of dLREEs, smaller gains of dHREEs and decreasing HREE/LREE ratios, can be attributed to disaggregation and remineralisation of POM driven by heterotrophic activity. This study therefore defines this process as the ‘heterotrophic-shuttle’.
5.2.3 Phase III- Phaeocystis sp. bloom peak
Phase III is characterized by decreasing dREE concentrations and coincides with the peak of the Phaeocystis sp. bloom (Figure 2A). Phaeocystis sp. blooms and their colonial life form embedded in mucilaginous matrices seem to provide exceptionally good adsorption surfaces, as previously shown for Fe and Mn (Schoemann et al., 2001). Accordingly, the dREE losses, which are higher for dLREEs than dHREEs leading to increasing HREE/LREE fractionation (Figure 3A), are likely associated with adsorption processes onto phytoplankton bloom derived POM, the ‘phytoplankton-shuttle’, similar to phase I.
The losses in each respective mesocosm, as well as the changes in HREE/LREE ratios, seem to be dependent on the intensities of the Phaeocystis sp. bloom, which is in the present study evaluated based on the Chl-a and POM concentrations. Highest loss and steepest rise in fractionation were observed in P4 that shows the most intense bloom, followed by P2 and P3. Yet, despite the high binding affinity of the Phaeocystis sp. mucilaginous matrix for metals and high POM content, minimum dREE concentrations reached at the end of phase III are comparable to those in phase I. A mechanism other than REE removal through adsorption must be in place, that keeps REEs in solution despite high potential for scavenging. This could be related to the increasing DOC concentrations (max. +64 µmol L-1/day in P2) and the associated increasing potential for organic complexation, similar to what has been suggested for Fe (Mori et al., 2021). The existence of this potential additional mechanism influencing dREEs becomes even more evident in the final phase of the incubation and can be supported by our model approach that simulates organic dREE complexation (see discussion below).
5.2.4 Phase IV - Stationary Phaeocystis sp. bloom
Only P2 and P4 emerged into phase IV, that is characterized by increasing concentrations (Figure 2A) and coincides with the stationary Phaeocystis sp. bloom stage, characterized by already decreasing Chl-a but high POM concentrations (Figures 1A, B). In P3, dREE concentrations did not increase with the onset of the Phaeocystis sp. collapse, and in P2 only dMREE and dHREE concentrations increased. Since Chl-a concentrations and bacterial numbers reached a similar state at the end of the mesocosm study in all replicates (decreasing Chl-a, high bacterial abundances), it is possible, that we missed the dREE minimum in P3 due to a too low sampling resolution, in which case the last data point could already represent a dREE concentration increase. On the other hand, the incubation was terminated before the full collapse of the Phaeocystis bloom. During the collapse of the diatom bloom, increasing dREE concentrations were only observed with full collapse, indicated by Chl-a concentrations reaching pre-bloom conditions, and a clear dominance of heterotrophic over autotrophic activity. This behaviour of the REEs could be explained by (re-)adsorption of released REEs on particles as long as particulate adsorptive sites are still available in adequate numbers. This mechanism can explain the continuing decrease in dREE concentrations in phase III in P3, since POM stayed at high levels despite increasing bacterial numbers.
In P2 and P4 (phase IV), the situation towards the incubation end was similar to that in P3 (end of phase III) with increasing bacterial numbers but stagnating POM concentrations. However, despite high POM concentrations, we observed increasing dREE concentrations that indicate that the release of REEs dominated over possible (re-)adsorption processes. This could be explained on the one hand by the high intensity of the previous Phaeocystis sp. blooms (based on Chl-a and POM concentrations) and associated strong dREE removal in phase III, especially in P4 (Figure 1A). In phase IV, recycling of the Phaeocystis mucilaginous matrix could therefore release large amounts of previously adsorbed REEs as previously described for Mn and Fe (Schoemann et al., 1998; Schoemann et al., 2001), only a portion of which can possibly be (re-)adsorbed. This would lead to higher dLREE gains compared to dHREE and decreasing HREE/LREE ratios, as we observed in P4, typical for the ‘heterotrophic-shuttle’ as described in phase II. The difference between the senescent bloom phase of the Phaeocystis sp. and the diatom bloom and their respective influence on REE cycling argue, however, for an additional mechanism buffering dREE from (re-)adsorption in phase III and IV. This becomes particularly evident in P2, where highest gains were observed for dHREEs, whereas dLREEs stagnated resulting in increasing HREE/LREE ratios that cannot be explained by pure release of adsorbed REEs. Similarly, HREE/LREE ratios in P4 reached much higher values than in phase II, potentially indicating that dHREEs are shielded from adsorption in addition to preferential scavenging of dLREEs.
The striking feature of phase III and IV in P2 and P4 are high DOC concentrations (> 200 µmol L-1). Organic complexation and the associated buffering from precipitation was described for Fe in the biological replicates (Mori et al., 2021). In natural marine environments, dFe is likely dominated by organic complexes, so that the availability of organic ligands plays a key role in its behaviour (Wagener et al., 2008; Gledhill and Buck, 2012). Since dREE and dFe are significantly positively correlated (rho <0.4), assigned to the same cluster, and in close distance in the NMDS (Figures 4, 5), it seems likely that these elements are influenced by similar processes, suggesting a component of organically complexed dREEs in the mesocosms. Studies showed that Fe-complexing organic ligands are also able to complex REEs, especially when the number of organic ligands outnumbers Fe (Christenson and Schijf, 2011; Schijf et al., 2015) as it is common during phytoplankton blooms (Wagener et al., 2008). Additionally, the rather weak significant correlation of DOC with dHREEs (rho=0.21) (Figures 4) indicates a possible link between the two parameters. In groundwater and laboratory studies, especially dHREEs seemed to be influenced by organic complexation (Johannesson et al., 2004; Sonke and Salters, 2006; Christenson and Schijf, 2011; Schijf et al., 2015). This would lead to preferential buffering of dHREEs from adsorption resulting in further retention of HREEs in the dissolved phase and an additional increase in HREE/LREE ratios. We therefore assume that complexation of REEs with components in the DOC pool plays an important role in cycling of REEs under high DOC concentrations (>200 µmol L-1). In order to test this hypothesis, we performed model simulations using a PHREEQC model approach.
Previous studies reported that Phaeocystis sp. are capable of methane production (Klintzsch et al., 2019), which could lead to the establishment of methanotrophic bacteria. They have a variety of methanol-dehydrogenase that use LREEs as cofactors. The elements are transported into the cells via lanthanophores, proteins that specialize in binding LREEs (Cotruvo, 2019; Daumann, 2019; Huang et al., 2019; Glass et al., 2020; Meyer et al., 2021). Thus, at this state of the spring bloom (stationary Phaeocystis), the utilization of LREEs as essential co-factors in enzymes of methanotrophic bacteria might be possible. The highest Chl-a concentrations were observed in P4, making it likely that also the highest amount of methane was produced. However, the simultaneously occurring high gains of dLREEs in P4 make their active incorporation into bacterial cells unlikely. The effect of desorption processes associated with heterotrophic activity might, as already assumed for phase II in all mesocosms, (5.2.2 Phase II- Bacterioplankton maximum) overpower the effect of bacterial sorption on the dREEs patterns. Even though in a mixed and overall oxic water column the influence of active methanotropic bacteria is likely to be insignificant, at this stage of the spring bloom the utilization of LREEs as essential co-factors in enzymes of methanotropic bacteria might theoretically be possible.
5.3 Organic complexation
The organic complexation of dREEs with parts of the complex DOC pool and the potential influence on dREE abundances and fractionation patterns were evaluated using the dREE speciation model in PHREEQC. The model results show that organic REE-DOC complexes can make up a large proportion of the dREE pool. The simulated proportion of REE-DOC complexes significantly increased over the course of the incubation, in line with increasing DOC concentrations, as well as with atomic mass of the REEs. Modelled organic complexation of LREEs thereby seemed irrelevant for the total dLREE pool, contrasting the high relevance of organic complexation for dHREEs. This is in good accordance with previous model studies (Christenson and Schijf, 2011; Schijf et al., 2015) as well as field studies (Johannesson et al., 2004), in which organic complexation increases in relevance with atomic number of REEs. It confirms that OM-cycling and associated existence of DOC influences the distribution and fractionation of dREEs in marine environments.
Stability constants of organic complexes with DFOB, the organic component that was used as a representative for strong organic REE ligands in the applied model, exceed the ones for inorganic carbonate complexes by a factor of 108 (Christenson and Schijf, 2011). As a result, REE-DOC complexes are highly stable and buffered from adsorption processes. Since the HREEs show highest potential for organic complexation, dHREEs are strongly stabilized while LREEs are not influenced by the presence of organic ligands. This explains the gain of dHREEs in P2 and P4 during phase IV, where high DOC concentrations (>200 µmol L-1) were reached, and the reduced loss of dHREEs in P2 during phase III with high DOC concentrations (mean of 215 µmol L-1) compared to phase I (mean of 40 µmol L-1).
Additionally, stabilization of dHREEs in organic complexes explains the HREE/LREE ratios in P2 and P4 at the end of phase III and in phase IV that are strongly elevated over those in phase II, indicating organic HREE complexation in addition to preferential LREE scavenging. This is also evident in HREE/LREE vs. dNd plots, with Nd representing the LREEs (Figure 3B). While in general a linear relationship is observed, indicating that the fractionation is mainly driven by scavenging of LREEs, HREE/LREE ratios for DOC concentrations >200 µmol L-1 (end of phase III and phase IV) lie above the linear trend line. Based on our results, the concentration of DOC has to exceed a threshold level of 200 µmol L-1 to cause an alteration in REE patterns. However, we did not observe a fractionation pattern specific to REE-DOC complexation that would allow identification of organic REE complexation in nature.
Many organic ligands may be able to complex other trace metals with higher affinities for the respective binding agent besides the REEs. The organic ligand used in the model approach is DFOB, a siderophore that is bacterially produced to bind iron and specifically mediate its transport inside the cell (Boukhalfa and Crumbliss, 2002). Complexation of REEs by DFOB could occur, if the siderophore is available in excess of free dFe (Christenson and Schijf, 2011; Schijf et al., 2015). In marine environments, this condition seems to be associated with maxima in Chl-a, occurring during phytoplankton blooms (Wagener et al., 2008). The model does not consider the influence of Fe or other trace metals on REE cycling, so this competition effect is not included in the simulations. We assume, that the DOC we enter into the model, is available for dREE complexation without any competition with dFe. Further model limitations are the fact that we only work with hypothetical numbers of strong organic complexes within the DOC pool without being able to identify which parts and structures of the DOC pool actually occur in the mesocosms and which complex dREEs. The two different approaches, ‘High-DOC’ and ‘Low-DOC’, do however show that the concentration of DOC only influences the proportions of REE-DOC, but not the variations within the REE series (Figure 5). Schijf et al. (2015) stated, that the effect of DFOB on REEs and the associated fractionation is likely to be typical for a large variety of organic ligands. Therefore, regardless of the true structure of the organic ligands, the modelled organic complexes can display a natural scenario. We are, however, aware of the fact that DFOB is not able to mirror the complexity of the DOC pool and that some organic ligands could have different effects on the REEs. Lanthanide-binding proteins excreted from bacteria that need LREEs to grow seem, in contrast to the organic ligands described above (Cotruvo, 2019), to preferentially complex LREEs. These are, however, as stated above (section 5.2.4) likely to be of minor importance given the small niche of bacteria producing these lanthanophores (Huang et al., 2019). The model is an important first step to assess the influence of dissolved organic ligands within the DOC pool on REEs without a claim to quantitative conclusions.
The threshold of 200 µmol L-1 DOC is above the mean DOC concentration in the southern North Sea of around 130 µmol L-1 (Van Engeland et al., 2010). It seems that only in highly productive waters either at specific locations or days during the year, as for instance during phytoplankton spring blooms, as presented in this study, the required ligand concentrations may be reached to cause significant changes in REE fractionation and temporal concentration patterns. It is important to notice, that the DOC threshold presented here is not a fixed number, which can be directly applied to any natural system, but it is rather specific to the studied mesocosm approach. In general, the DOC concentrations are more likely to act in a continuum, with more DOC available, leading to an increase in dREE complexation. If, however, REEs compete with other metals like Fe for the siderophores, dREE complexation might only be possible if organic ligands are available in excess to dFe (Schijf et al., 2015). Thus, a threshold of DOC, or rather a threshold of organic complexing agents, needs to be exceeded in order to significantly complex dREEs and outcompete inorganic REE binding ligands. This threshold then would depend on trace metal concentrations other than REEs, as well as structure and complexity of the DOC pool. To further address this issue, future modelling approaches should include a molecular analysis of the DOC pool to identify the potential REE-ligands within this pool and their temporal variations and to predict their influence on the respective REE concentration patterns in seawater.
6 Conclusions and implications for natural systems
Our findings reveal that the abundances and fractionation patterns of dREEs in highly productive marine environments seem highly altered by POM-associated adsorption and desorption processes as well as organic complexation with DOC. We confirmed two bio-associated shuttles dominating the reactions between POM and dREEs. First, the ‘phytoplankton-shuttle’ is characterized by adsorption processes on diatoms and Phaeocystis sp. bloom derived POM. Indication for transport into phytoplankton cells could not be determined based on the present data. This ‘phytoplankton-shuttle’ showed highest impacts on the LREEs in comparison to the group of HREEs, which resulted in high HREE/LREE ratios in the surrounding seawater. The second bio-associated shuttle identified here is the ‘heterotrophic shuttle’. This shuttle describes the transfer of previously (POM-)bound REEs back to the dissolved pool. This process is likely associated with heterotrophic bacterial activity, which mediates the regeneration of POM and release of REEs, resulting in a higher gain of dLREEs relative to HREEs and decreasing HREE/LREE ratios.
Parts of the phytoplankton bloom derived DOC can complex REEs, if the respective bulk concentrations, or rather the abundance of potential ligands, exceeds a specific threshold value. A model approach revealed that the relevance of organic complexation on dREE increases with atomic mass and has only minor relevance for dLREEs. Since organic complexes can be much more stable than inorganic ones, these organometallic complexes particularly buffer the dHREEs from adsorption, leading to an additional increase in the fractionation of HREE/LREE in areas/at times of high DOC concentrations.
Mesocosm experiments can, however, only mimic but never completely portray natural systems. In natural systems, additional aspects such as water mass mixing, sinking processes, interactions with sediment compartments, influence of lithogenic processes and possible aeolian input, need to be considered. This means that the absolute influence of OM cycling on the REE pattern, which was determined in the present study, cannot be directly transferred to a natural system but needs further evaluation. The relative influence and tendencies observed here are, however, likely valid for the natural marine environment and therefore should be considered in future studies. The effect of OM on REE distribution and fractionation patterns is likely a ubiquitous feature in seawater with high OM content, e.g., during phytoplankton blooms and/or in coastal environments, where this influence may outcompete abiotic factors.
Data availability statement
Measured dREE concentrations, total alkalinity as well as model outcomes and the Database used for the PHREEQC model approach is accessible via the Pangaea data repository (https://doi.pangaea.de/10.1594/PANGAEA.942759).
Author contributions
MSu, CM, and KP conceived the study. MSu performed the REE analyses. CM provided the TA data. MS and JG performed PHREEQC model analyses. CB, LD, NH, LB, and CM, carried out the mesocosm experiment and contributed to data interpretation. KP, TD, MSi, and MSt supervised the experiment and contributed to data interpretation. MS wrote the manuscript with significant contributions from all authors. All authors contributed to the article and approved the submitted version.
Funding
This study was carried out in the framework of the Ph.D. research training group “The Ecology of Molecules” (EcoMol) supported by the Lower Saxony Ministry for Science and Culture (MWK). The MWK together with the Institute of Chemistry and Biology to the Marine Environment (ICBM) financed the establishment of the infrastructure. CB was funded generously by the Helmholtz Institute for Functional Marine Biodiversity (HIFMB), a collaboration between the Alfred-Wegener-Institute, Helmholtz-Center for Polar and Marine Research, and the Carl von Ossietzky University Oldenburg, initially funded by the MWK and the Volkswagen Foundation through the “Niedersächsisches Vorab” grant program (grant number ZN3285). The inoculum for the mesocosms was collected during R/V Heincke research cruise HE504 (under grant number AWI_HE504_leg2_00).
Acknowledgments
We thank all other members of the EcoMol Planktotron team not listed here as co-authors, without whom the experiment would not have been possible. These are in alphabetical order: Vera Bischoff, Simon Dufner, Bert Engelen, Lena Engelmann, Ferdinand Esser, Oliver Ferdinand, Ulrike Feudel, Jan Freund, Matthias Friebe Andrea Gall, Helge Giebel, Mara Heinrichs, Raquel Lopes, Julian Merder, Cristina Moraru, Jutta Niggemann, Lars-Eric Peterson, Christoph Plum, Ralf Rabus, Vanessa Schaars, Matthias Schroeder, Peter Schupp, Ina Ulber, Marie von Schneden, Lars Woehlbrand and Oliver Zielinski. Further, we would like to thank the captain and crew of the RV Heincke and Helge A. Giebel for collecting the inoculum as well as the ICBM machine shop. For their assistance with the analyses of nutrients, trace metals and the rare earth elements we would like to thank Carola Lehners, Eleonore Gründken and Martina Schulz, respectively.
Conflict of interest
The authors declare that the research was conducted in the absence of any commercial or financial relationships that could be construed as a potential conflict of interest.
Publisher’s note
All claims expressed in this article are solely those of the authors and do not necessarily represent those of their affiliated organizations, or those of the publisher, the editors and the reviewers. Any product that may be evaluated in this article, or claim that may be made by its manufacturer, is not guaranteed or endorsed by the publisher.
Supplementary material
The Supplementary Material for this article can be found online at: https://www.frontiersin.org/articles/10.3389/fmars.2022.895723/full#supplementary-material
Data Sheet 1 | Supplementary Material A - Additional Figures.
Data Sheet 2 | Supplementary Material B - PHREEQC model approach.
References
Abbott A. N., Haley B. A., McManus J. (2015). Bottoms up: Sedimentary control of the deep north pacific ocean's ϵNd signature. Geology 43 (11), 1035–1038. doi: 10.1130/G37114.1
Akagi T. (2013). Rare earth element (REE)–silicic acid complexes in seawater to explain the incorporation of REEs in opal and the “leftover” REEs in surface water: New interpretation of dissolved REE distribution profiles. Geochim. Cosmochim. Acta 113, 174–192. doi: 10.1016/j.gca.2013.03.014
Akagi T., Fu F.-F., Hongo Y., Takahashi K. (2011). Composition of rare earth elements in settling particles collected in the highly productive north pacific ocean and Bering Sea: Implications for siliceous-matter dissolution kinetics and formation of two REE-enriched phases. Geochim. Cosmochim. Acta 75, 4857–4876. doi: 10.1016/j.gca.2011.06.001
Alderkamp A.-C., Buma A., van Rijssel M. (2007). The carbohydrates of phaeocystis and their degradation in the microbial food web. Biogeochemistry 83, 99–118. doi: 10.1007/978-1-4020-6214-8_9
Alderkamp A.-C., Sintes E., Herndl G. J. (2006). Abundance and activity of major groups of prokaryotic plankton in the coastal north Sea during spring and summer. Aquat. Microb. Ecol. 45 (3), 237–246. doi: 10.3354/ame045237
Alibo D. S., Nozaki Y. (1999). Rare earth elements in seawater: particle association, shale-normalization, and ce oxidation. Geochim. Cosmochim. Acta 63 (3), 363–372. doi: 10.1016/S0016-7037(98)00279-8
Bau M., Tepe N., Mohwinkel D. (2013). Siderophore-promoted transfer of rare earth elements and iron from volcanic ash into glacial meltwater, river and ocean water. Earth Planet. Sci. 364, 30–36. doi: 10.1016/j.epsl.2013.01.002
Behrens M. K., Muratli J., Pradoux C., Wu Y., Böning P., Brumsack H.-J., et al. (2016). Rapid and precise analysis of rare earth elements in small volumes of seawater - method and intercomparison. Mar. Chem. 186, 110–120. doi: 10.1016/j.marchem.2016.08.006
Bianchi D., Weber T. S., Kiko R., Deutsch C. (2018). Global niche of marine anaerobic metabolisms expanded by particle microenvironments. Nat. Geosci. 11 (4), 263–268. doi: 10.1038/s41561-018-0081-0
Borcard D., Gillet F., Legendre P. (2018). Numerical ecology with r (Cham: Springer International Publishing).
Boukhalfa H., Crumbliss A. L. (2002). Chemical aspects of siderophore mediated iron transport. BioMetals 15 (4), 325–339. doi: 10.1023/A:1020218608266
Bruland K. W., Middag R., Lohan M. C. (2014). “"8.2 - controls of trace metals in seawater,",” in Treatise on geochemistry (Second edition). Eds. Holland H. D., Turekian K. K. (Oxford: Elsevier), 19–51.
Buchan A., LeCleir G. R., Gulvik C. A., González J. M. (2014). Master recyclers: features and functions of bacteria associated with phytoplankton blooms. Nat. Rev. Microbiol. 12 (10), 686–698. doi: 10.1038/nrmicro3326
Byrne R. H. (2002). Inorganic speciation of dissolved elements in seawater: the influence of pH on concentration ratios. Geochem. Trans. 3 (11). doi: 10.1039/b109732f
Byrne R. H., Kim K.-H. (1990). Rare earth element scavenging in seawater. Geochim. Cosmochim. Acta 54, 2645–2656. doi: 10.1016/0016-7037(90)90002-3
Catrouillet C., Guenet H., Pierson-Wickmann A.-C., Dia A., LeCoz M. B., Deville S., et al. (2020). Rare earth elements as tracers of active colloidal organic matter composition. Environ. Chem. 17 (2), 133–139. doi: 10.1071/EN19159
Censi P., Zuddas P., Randazzo L. A., Saiano F., Mazzola S., Aricò P., et al. (2010). Influence of dissolved organic matter on rare earth elements and yttrium distributions in coastal waters. Chem. Ecol. 26 (2), 123–135. doi: 10.1080/02757541003627720
Christenson E. A., Schijf J. (2011). Stability of YREE complexes with the trihydroxamate siderophore desferrioxamine b at seawater ionic strength. Geochim. Cosmochim. Acta 75 (22), 7047–7062. doi: 10.1016/j.gca.2011.09.022
Costa M., Henriques B., Pinto J., Fabre E., Dias M., Soares J., et al. (2020). Influence of toxic elements on the simultaneous uptake of rare earth elements from contaminated waters by estuarine macroalgae. Chemosphere 252, 126562. doi: 10.1016/j.chemosphere.2020.126562
Cotruvo J. A. (2019). The chemistry of lanthanides in biology: Recent discoveries, emerging principles, and technological applications. ACS Cent. Sci. 5 (9), 1496–1506. doi: 10.1021/acscentsci.9b00642
Daumann L. (2019). Essential and ubiquitous: The emergence of lanthanide metallobiochemistry. Angew. Chem. 58 (37), 12795–12802. doi: 10.1002/ange.201904090
De Baar H. J. W., Bacon M. P., Brewer P. G., Bruland K. W. (1985). Rare earth elements in the pacific and Atlantic oceans. Geochim. Cosmochim. Acta 49 (9), 1943–1959. doi: 10.1016/0016-7037(85)90089-4
Degerlund M., Eilertsen H. (2010). Main species characteristics of phytoplankton spring blooms in NE Atlantic and Arctic waters (68–80° n). Estuaries Coasts 33 (2), 242–269. doi: 10.1007/s12237-009-9167-7
Elderfield H. (1988). The oceanic chemistry of the rare-earth elements. Philos. Trans. R. Soc Lond. Ser. A: Math. Phys. Sci. 325, 105–126. doi: 10.1098/rsta.1988.0046
Elderfield H., Greaves M. J. (1982). The rare earth elements in seawater. Nature 296 (5854), 214–219. doi: 10.1038/296214a0
Galili T. (2015)Dendextend: an r package for visualizing, adjusting, and comparing trees of hierarchical clustering. Available at: http://cran.r-project.org/package=dendextend.
Gall A., Uebel U., Ebensen U., Hillebrand H., Meier S., Singer G., et al. (2017). Planktotrons: A novel indoor mesocosm facility for aquatic biodiversity and food web research. Limnol. Oceanogr. Methods 15 (7), 663–677. doi: 10.1002/lom3.10196
Glass J. B., Cowan E. T., Johannesson K. H. (2020). Lanthanide rarity in natural waters: implications for microbial C1 metabolism. FEMS Microbiol. Lett. 367 (22), fnaa165. doi: 10.1093/femsle/fnaa165
Gledhill M., Buck K. (2012). The organic complexation of iron in the marine environment: A review. Front. Microbiol. 3 (69). doi: 10.3389/fmicb.2012.00069
Haley B. A., Frank M., Hathorne E., Pisias N. (2014). Biogeochemical implications from dissolved rare earth element and Nd isotope distributions in the gulf of Alaska. Geochim. Cosmochim. Acta 126, 455–474. doi: 10.1016/j.gca.2013.11.012
Hara Y., Obata H., Doi T., Hongo Y., Gamo T., Takeda S., et al. (2009). Rare earth elements in seawater during an iron-induced phytoplankton bloom of the western subarctic pacific (SEEDS-II). Deep Sea Res. (II Top. Stud. Oceanogr.) 56 (26), 2839–2851. doi: 10.1016/j.dsr2.2009.06.009
Harrel F. E., Dupont C. (2019)Hmisc: Harrell miscellaneous. r package version 4.3-0. Available at: https://CRAN.R-project.org/package=Hmisc.
Huang J., Yu Z., Groom J., Cheng J.-F., Tarver A., Yoshikuni Y., et al. (2019). Rare earth element alcohol dehydrogenases widely occur among globally distributed, numerically abundant and environmentally important microbes. ISME J. 13 (8), 2005–2017. doi: 10.1038/s41396-019-0414-z
Hutchins D., Bruland K. (1994). Grazer-mediated regeneration and assimilation of fe, zn and Mn from planktonic prey. Mar. Ecol. Prog. Ser. 110, 259–269. doi: 10.3354/meps110259
Johannesson K. H., Tang J., Daniels J. M., Bounds W. J., Burdige D. J. (2004). Rare earth element concentrations and speciation in organic-rich blackwaters of the great dismal swamp, Virginia, USA. Chem. Geol. 209 (3), 271–294. doi: 10.1016/j.chemgeo.2004.06.012
Kaufman L., Rousseeuw P. J. (2005). Finding groups in data : An introduction to cluster analysis (Hoboken, New Jersey: John Wiley & Sons, Inc).
Klintzsch T., Langer G., Nehrke G., Wieland A., Lenhart K., Keppler F. (2019). Methane production by three widespread marine phytoplankton species: release rates, precursor compounds, and potential relevance for the environment. Biogeosciences 16 (20), 4129–4144. doi: 10.5194/bg-16-4129-2019
Knust R., Nixdorf U., Hirsekorn M. (2017). Research vessel HEINCKE operated by the Alfred-Wegener-Institute. J. large-scale Res. facilities JLSRF 3, A120. doi: 10.17815/jlsrf-3-164
Kulaksız S., Bau M. (2013). Anthropogenic dissolved and colloid/nanoparticle-bound samarium, lanthanum and gadolinium in the Rhine river and the impending destruction of the natural rare earth element distribution in rivers. Earth Planet. Sci. 362, 43–50. doi: 10.1016/j.epsl.2012.11.033
Lagarde M., Lemaitre N., Planquette H., Grenier M., Belhadj M., Lherminier P., et al. (2020). Particulate rare earth element behavior in the north Atlantic (GEOVIDE cruise). Biogeosciences 17 (22), 5539–5561. doi: 10.5194/bg-17-5539-2020
Lancelot C. (1995). The mucilage phenomenon in the continental coastal waters of the north Sea. Sci. Total Environ. 165 (1-3), 83–102. doi: 10.1016/0048-9697(95)04545-c
Lancelot C., Mathot S. (1987). Dynamics of a phaeocystis-dominated spring bloom in Belgian coastal waters. i. phytoplanktonic activities and related parameters. Mar. Ecol. Prog. Ser. 37, 239–248. doi: 10.3354/meps037239
Lawrence M. G., Kamber B. S. (2007). Rare earth element concentrations in the natural water reference materials (NRCC) NASS-5, CASS-4 and SLEW-3. Geostandards Geoanalytical Res. 31 (2), 95–103. doi: 10.1111/j.1751-908X.2007.00850.x
Liu X., Millero F. (2002). The solubility of iron in seawater. Mar. Chem. 77, 43–54. doi: 10.1016/S0304-4203(01)00074-3
Lunau M., Lemke A., Dellwig O., Simon M. (2006). Physical and biogeochemical controls of microaggregate dynamics in a tidally affected coastal ecosystem. Limnol. Oceanogr. 51, 847–859. doi: 10.4319/lo.2006.51.2.0847
Luo Y.-R., Byrne R. H. (2004). Carbonate complexation of yttrium and the rare earth elements in natural waters. Geochim. Cosmochim. Acta 68 (4), 691–699. doi: 10.1016/S0016-7037(03)00495-2
Marsac R., Catrouillet C., Davranche M., Bouhnik-Le Coz M., Briant N., Janot N., et al. (2021). Modeling rare earth elements binding to humic acids with model VII. Chem. Geol. 567, 120099. doi: 10.1016/j.chemgeo.2021.120099
Marsac R., Davranche M., Gruau G., Bouhnik-Le Coz M., Dia A. (2011). An improved description of the interactions between rare earth elements and humic acids by modeling: PHREEQC-model VI coupling. Geochim. Cosmochim. Acta 75 (19), 5625–5637. doi: 10.1016/j.gca.2011.07.009
Meier S. (2014). Spatiotemporal turnover of a phytoplankton metacommunity in a natural coastal system (University Oldenburg).
Meyer A. C. S., Grundle D., Cullen J. T. (2021). Selective uptake of rare earth elements in marine systems as an indicator of and control on aerobic bacterial methanotrophy. Earth Planet. Sci. 558, 116756. doi: 10.1016/j.epsl.2021.116756
Minoda A., Sawada H., Suzuki S., Miyashita S.-i., Inagaki K., Yamamoto T., et al. (2015). Recovery of rare earth elements from the sulfothermophilic red alga galdieria sulphuraria using aqueous acid. Appl. Microbiol. Biotechnol. 99 (3), 1513–1519. doi: 10.1007/s00253-014-6070-3
Möller P., Morteani G., Dulski P. (2003). Anomalous gadolinium, cerium, and yttrium contents in the adige and isarco river waters and in the water of their tributaries (Provinces trento and Bolzano/Bozen, NE Italy). Acta Hydrochim. Hydrobiol. 31 (3), 225–239. doi: 10.1002/aheh.200300492
Mori C., Beck M., Hintz N. H., Merder J., Bunse C., Dittmar T., et al. (2021). Biogeochemical thallium cycling during a mesocosm phytoplankton spring bloom: Biotic versus abiotic drivers. Geochim. Cosmochim. Acta 313, 257–276. doi: 10.1016/j.gca.2021.08.002
Moriwaki H., Koide R., Yoshikawa R., Warabino Y., Yamamoto H. (2013). Adsorption of rare earth ions onto the cell walls of wild-type and lipoteichoic acid-defective strains of bacillus subtilis. Appl. Microbiol. Biotechnol. 97 (8), 3721–3728. doi: 10.1007/s00253-012-4200-3
Moriwaki H., Yamamoto H. (2013). Interactions of microorganisms with rare earth ions and their utilization for separation and environmental technology. Appl. Microbiol. Biotechnol. 97 (1), 1–8. doi: 10.1007/s00253-012-4519-9
Nozaki Y. (2001). “"Rare earth elements and their isotopes in the ocean",” in Encyclopedia of ocean sciences. Ed. Steele J. H. (USA: Academic Press).
Nozaki Y., Alibo D. S. (2003). Importance of vertical geochemical processes in controlling the oceanic profiles of dissolved rare earth elements in the northeastern Indian ocean. Earth Planet. Sci. 205 (3), 155–172. doi: 10.1016/S0012-821X(02)01027-0
Oksanen J., Guillaume Blanchet F., Friendly M. (2019)Vegan: Community ecology package. r package version 2.5-6. Available at: https://CRAN.R-project.org/package=vegan.
Osterholz H., Singer G., Wemheuer B., Daniel R., Simon M., Niggemann J., et al. (2016). Deciphering associations between dissolved organic molecules and bacterial communities in a pelagic marine system. ISME J. 10 (7), 1717–1730. doi: 10.1038/ismej.2015.231
Paffrath R., Pahnke K., Behrens M. K., Reckhardt A., Ehlert C., Schnetger B., et al. (2020). Rare earth element behavior in a sandy subterranean estuary of the southern north Sea. Front. Mar. Sci. 7 (424). doi: 10.3389/fmars.2020.00424
Parkhurst D. L. (1995). “"User's guide to PHREEQC, a computer program for speciation, reaction-path, advective-transport, and inverse geochemical calculations",” in U.S. geological survey water-resources investigations report (Denver, USA: U.S. Geological Survey). Available at: http://pubs.er.usgs.gov/publication/wri954227.
Pearce C. R., Jones M. T., Oelkers E. H., Pradoux C., Jeandel C. (2013). The effect of particulate dissolution on the neodymium (Nd) isotope and rare earth element (REE) composition of seawater. Earth Planet. Sci. 369-370, 138–147. doi: 10.1016/j.epsl.2013.03.023
Pinto J., Henriques B., Soares J., Costa M., Dias M., Fabre E., et al. (2020). A green method based on living macroalgae for the removal of rare-earth elements from contaminated waters. J. Environ. Manage. 263, 110376. doi: 10.1016/j.jenvman.2020.110376
Pourret O., Davranche M., Gruau G., Dia A. (2007). Rare earth elements complexation with humic acid. Chem. Geol. 243 (1), 128–141. doi: 10.1016/j.chemgeo.2007.05.018
Quinn K., Byrne R., Schijf J. (2006). Sorption of yttrium and rare earth elements by amorphous ferric hydroxide: Influence of pH and ionic strength. Mar. Chem. 99, 128–150. doi: 10.1016/j.marchem.2005.05.011
Quinn K., Byrne R., Schijf J. (2007). Sorption of yttrium and rare earth elements by amorphous ferric hydroxide: Influence of temperature. Environ. Sci. Technol. 41, 541–546. doi: 10.1021/es0618191
Ramasamy D. L., Porada S., Sillanpää M. (2019). Marine algae: A promising resource for the selective recovery of scandium and rare earth elements from aqueous systems. Chem. Eng. J. 371, 759–768. doi: 10.1016/j.cej.2019.04.106
R Core Team (2016). "R: A language and environment for statistical computing" (Vienna, Austria: R Foundation for Statistical Computing).
Rudnick R. L., Gao S. (2003). “"3.01 - composition of the continental crust,",” in Treatise on geochemistry. Eds. Holland H. D., Turekian K. K. (Oxford: Pergamon), 1–64.
Sarazin G., Michard G., Prevot F. (1999). A rapid and accurate spectroscopic method for alkalinity measurements in sea water samples. Water Res. 33 (1), 290–294. doi: 10.1016/S0043-1354(98)00168-7
Schijf J., Byrne R. H. (2021). Speciation of yttrium and the rare earth elements in seawater: Review of a 20-year analytical journey. Chem. Geol. 584, 120479. doi: 10.1016/j.chemgeo.2021.120479
Schijf J., Christenson E. A., Byrne R. H. (2015). YREE scavenging in seawater: A new look at an old model. Mar. Chem. 177, 460–471. doi: 10.1016/j.marchem.2015.06.010
Schoemann V., Becquevort S., Stefels J., Rousseau V., Lancelot C. (2005). Phaeocystis blooms in the global ocean and their controlling mechanisms: a review. J. Sea Res. 53 (1), 43–66. doi: 10.1016/j.seares.2004.01.008
Schoemann V., De Barr H. J. W., De Jong J. T. M., Lancelot C. (1998). Effects of phytoplankton blooms of the cycling of manganese and iron in coastal waters. Limnol. Oceanogr. 43 (7), 1427–1441. doi: 10.4319/lo.1998.43.7.1427
Schoemann V., Wollast R., Chou L., Lancelot C. (2001). Effects of photosynthesis on the accumulation of Mn and fe byPhaeocystiscolonies. Limnol. Oceanogr. 46 (5), 1065–1076. doi: 10.4319/lo.2001.46.5.1065
Shiller A. M., Chan E. W., Joung D. J., Redmond M. C., Kessler J. D. (2017). Light rare earth element depletion during deepwater horizon blowout methanotrophy. Sci. Rep. 7 (1), 10389. doi: 10.1038/s41598-017-11060-z
Sholkovitz E. R., Landing W. M., Lewis B. L. (1994). Ocean particle chemistry: The fractionation of rare earth elements between suspended particles and seawater. Geochim. Cosmochim. Acta 58 (6), 1567–1579. doi: 10.1016/0016-7037(94)90559-2
Sonke J. E., Salters V. J. M. (2006). Lanthanide–humic substances complexation. i. experimental evidence for a lanthanide contraction effect. Geochim. Cosmochim. Acta 70 (6), 1495–1506. doi: 10.1016/j.gca.2005.11.017
Spearman C. (1904). The proof and measurement of association between two things. Am. J. Psychol. 15 (1), 72–101. doi: 10.2307/1412159
Stichel T., Hartman A. E., Duggan B., Goldstein S. L., Scher H., Pahnke K. (2015). Separating biogeochemical cycling of neodymium from water mass mixing in the Eastern north Atlantic. Earth Planet. Sci. 412, 245–260. doi: 10.1016/j.epsl.2014.12.008
Strady E., Kim I., Radakovitch O., Kim G. (2015). Rare earth element distributions and fractionation in plankton from the northwestern Mediterranean Sea. Chemosphere 119, 72–82. doi: 10.1016/j.chemosphere.2014.05.049
Takahashi Y., Châtellier X., Hattori K. H., Kato K., Fortin D. (2005). Adsorption of rare earth elements onto bacterial cell walls and its implication for REE sorption onto natural microbial mats. Chem. Geol. 219 (1), 53–67. doi: 10.1016/j.chemgeo.2005.02.009
Takahashi Y., Hirata T., Shimizu H., Ozaki T., Fortin D. (2007). A rare earth element signature of bacteria in natural waters? Chem. Geol. 244 (3), 569–583. doi: 10.1016/j.chemgeo.2007.07.005
Takata H., Tagami K., Aono T., Uchida S. (2009). Determination of trace levels of yttrium and rare earth elements in estuarine and coastal waters by inductively coupled plasma mass spectrometry following preconcentration with NOBIAS-CHELATE resin. Atomic Spectrosc. -Norwalk Connecticut- 30, 10–19.
Tang J., Johannesson K. H. (2003). Speciation of rare earth elements in natural terrestrial waters: assessing the role of dissolved organic matter from the modeling approach. Geochim. Cosmochim. Acta 67 (13), 2321–2339. doi: 10.1016/S0016-7037(02)01413-8
Taylor S. R., McLennan S. M. (1985). The continental crust: Its composition and evolution (Oxford, London: Cambridge University Press).
Teeling H., Fuchs B. M., Bennke C. M., Krüger K., Chafee M., Kappelmann L., et al. (2016). Recurring patterns in bacterioplankton dynamics during coastal spring algae blooms. eLife 5, e11888. doi: 10.7554/eLife.11888
Tsuruta T. (2006). Selective accumulation of light or heavy rare earth elements using gram-positive bacteria. Colloids Surf. B. Biointerfaces 52, 117–122. doi: 10.1016/j.colsurfb.2006.04.014
Turner D. R., Whitfield M., Dickson A. G. (1981). The equilibrium speciation of dissolved components in freshwater and sea water at 25°C and 1 atm pressure. Geochim. Cosmochim. Acta 45 (6), 855–881. doi: 10.1016/0016-7037(81)90115-0
Van Engeland T., Soetaert K., Knuijt A., Laane R. W. P. M., Middelburg J. J. (2010). Dissolved organic nitrogen dynamics in the north Sea: A time series analysis, (1995–2005). Estuar. Coast. Shelf Sci. 89 (1), 31–42. doi: 10.1016/j.ecss.2010.05.009
Wagener T., Pulido-Villena E., Guieu C. (2008). Dust iron dissolution in seawater: Results from a one-year time-series in the Mediterranean Sea. Geophys. Res. Lett. 35 (16). doi: 10.1029/2008GL034581
Wei T., Simko V. (2007). “"R package "corrplot",” in Visualization of a correlation matrix (Version 0.84). Available at: https://github.com/taiyun/corrplot.
Wiltshire K., Kraberg A., Bartsch I., Boersma M., Franke H.-D., Freund J., et al. (2010). Helgoland roads, north Sea: 45 years of change. Estuaries Coasts 33, 295–310. doi: 10.1007/s12237-009-9228-y
Zhu Y., Itoh A., Fujimori E., Umemura T., Haraguchi H. (2006). Determination of rare earth elements in seawater by ICP-MS after preconcentration with a chelating resin-packed minicolumn. J. Alloys Compounds 408-412, 985–988. doi: 10.1016/j.jallcom.2004.12.092
Keywords: rare earth elements, coastal North Sea, metal organic complexation, biogeochemical trace metal cycling, metal microbe interaction, biogeochemical modelling, PHREEQC
Citation: Sutorius M, Mori C, Greskowiak J, Boettcher L, Bunse C, Dittmar T, Dlugosch L, Hintz NH, Simon M, Striebel M and Pahnke K (2022) Rare earth element behaviour in seawater under the influence of organic matter cycling during a phytoplankton spring bloom – A mesocosm study. Front. Mar. Sci. 9:895723. doi: 10.3389/fmars.2022.895723
Received: 14 March 2022; Accepted: 30 June 2022;
Published: 28 July 2022.
Edited by:
Johan Schijf, University of Maryland, College Park, United StatesReviewed by:
Jennifer Glass, Georgia Institute of Technology, United StatesBrian A. Haley, Oregon State University, United States
Alan M. Shiller, University of Southern Mississippi, United States
Copyright © 2022 Sutorius, Mori, Greskowiak, Boettcher, Bunse, Dittmar, Dlugosch, Hintz, Simon, Striebel and Pahnke. This is an open-access article distributed under the terms of the Creative Commons Attribution License (CC BY). The use, distribution or reproduction in other forums is permitted, provided the original author(s) and the copyright owner(s) are credited and that the original publication in this journal is cited, in accordance with accepted academic practice. No use, distribution or reproduction is permitted which does not comply with these terms.
*Correspondence: Mara Sutorius, bWFyYS5zdXRvcml1c0B1b2wuZGU=; Corinna Mori, Y29yaW5uYS5tb3JpQHVvbC5kZQ==
†Present address: Carine Bunse, Helmholtz Institute for Functional Marine Biodiversity at theUniversity of Oldenburg (HIFMB), Oldenburg, Germany