
94% of researchers rate our articles as excellent or good
Learn more about the work of our research integrity team to safeguard the quality of each article we publish.
Find out more
ORIGINAL RESEARCH article
Front. Mar. Sci., 11 August 2022
Sec. Marine Evolutionary Biology, Biogeography and Species Diversity
Volume 9 - 2022 | https://doi.org/10.3389/fmars.2022.895554
 Yanshuo Liang1,2,3†
 Shuangshuang Zhang1,2,3†Changxiang Yan4
 Stefano G. A. Draisma5
 Attachai Kantachumpoo6
 Zhao Li3,7Yude Lin1,2,8
 Jiang Zhu4Jie Zhang1,2*
 Delin Duan1,2*
Long-distance drifting of seaweeds driven by ocean currents is an ideal model for exploring population-level genetic connectivity and phylogeographic structure. In the Indo-Pacific convergence region, we integrated phylogeographic and ocean current data and Lagrangian particle simulations to explore how the ocean currents contributed to the biogeographical patterns and population genetic connectivity of Sargassum polycystum. The oceanographic transport and direction of gene flow was in line with contemporary ocean currents. The S. polycystum geographical dispersal from glacial refugia homogenized the footprint of genetic divergence. The multidisciplinary intersection provides insights into the evolutionary history and biogeographic conservation of tropical seaweeds in the Indo-Pacific convergence region.
The Indo-Pacific convergence region is an important center of origin of marine biodiversity (Leliaert et al., 2018; Tittensor et al., 2010), and a highly dynamic hydrological system. Complex geological events influenced the distribution and demographic patterns of marine species (Briggs, 1999; Tsang et al., 2012; Wang et al., 2016). Ocean currents may drive marine species for long distances and shape the demographic patterns, population connectivity, and genetic structure of marine flora and fauna (Galindo et al., 2006; Li et al., 2017a; Li et al., 2017b). The Indo-Pacific convergence region is characterized by seasonally changing ocean currents (Figure 1) (Fang et al., 2009). Under the influence of the winter monsoon, the surface circulation of the South China Sea forms the northeast monsoon current (NMC) that flows from the northeast to the southwest and reverses in the summer (Fang et al., 2005). It facilitates the long-distance dispersal of marine species and strengthens the genetic exchange between the northern and southern geographic populations (Wang et al., 2016; Banerjee et al., 2020). Previous studies usually inferred the spatiotemporal dynamics of marine species from molecular data (Wang et al., 2016; Li et al., 2017a; Bertola et al., 2020), whereas the impact of complex marine dynamic factors to the marine species dispersal and population connectivity received less attention. Therefore, there is a need to integrate the physical oceanographic influences on the dispersal abilities, routes, and flow patterns of seaweed propagules, and to reveal the population dynamics of marine species for future seaweeds conservation (Alberto et al., 2011). Integrating the advantages of various disciplines to launch phylogeography research will more comprehensively reveal the process of biological evolution (Zhang et al., 2022). Phylogeographic patterns may not always be congruent with the contemporary ocean currents, because the glaciation events and dispersal ability may have affected population genetic exchange (He et al., 2011; Nakajima et al., 2014). Sea level fluctuations caused by the glacial-interglacial cycles during the Pleistocene epoch (1.8 Ma-11,000 years BP) greatly affected land mass configurations and biodiversity distribution patterns in the Indo-Pacific region (Wang, 1999; Voris, 2000). The low sea level formed isolated marine basins, such as the South China Sea, which was reduced to an inland sea during the last glacial maximum (LGM) (Voris, 2000). During the LGM genetic exchange of marine species the northwest Pacific Ocean and the Indian Ocean was only possible via the eastern part of the Indonesian archipelago and limited exchange caused divergence of Indo-Pacific populations (He et al., 2011; Cheang et al., 2012; Chan et al., 2014; Chan et al., 2022).
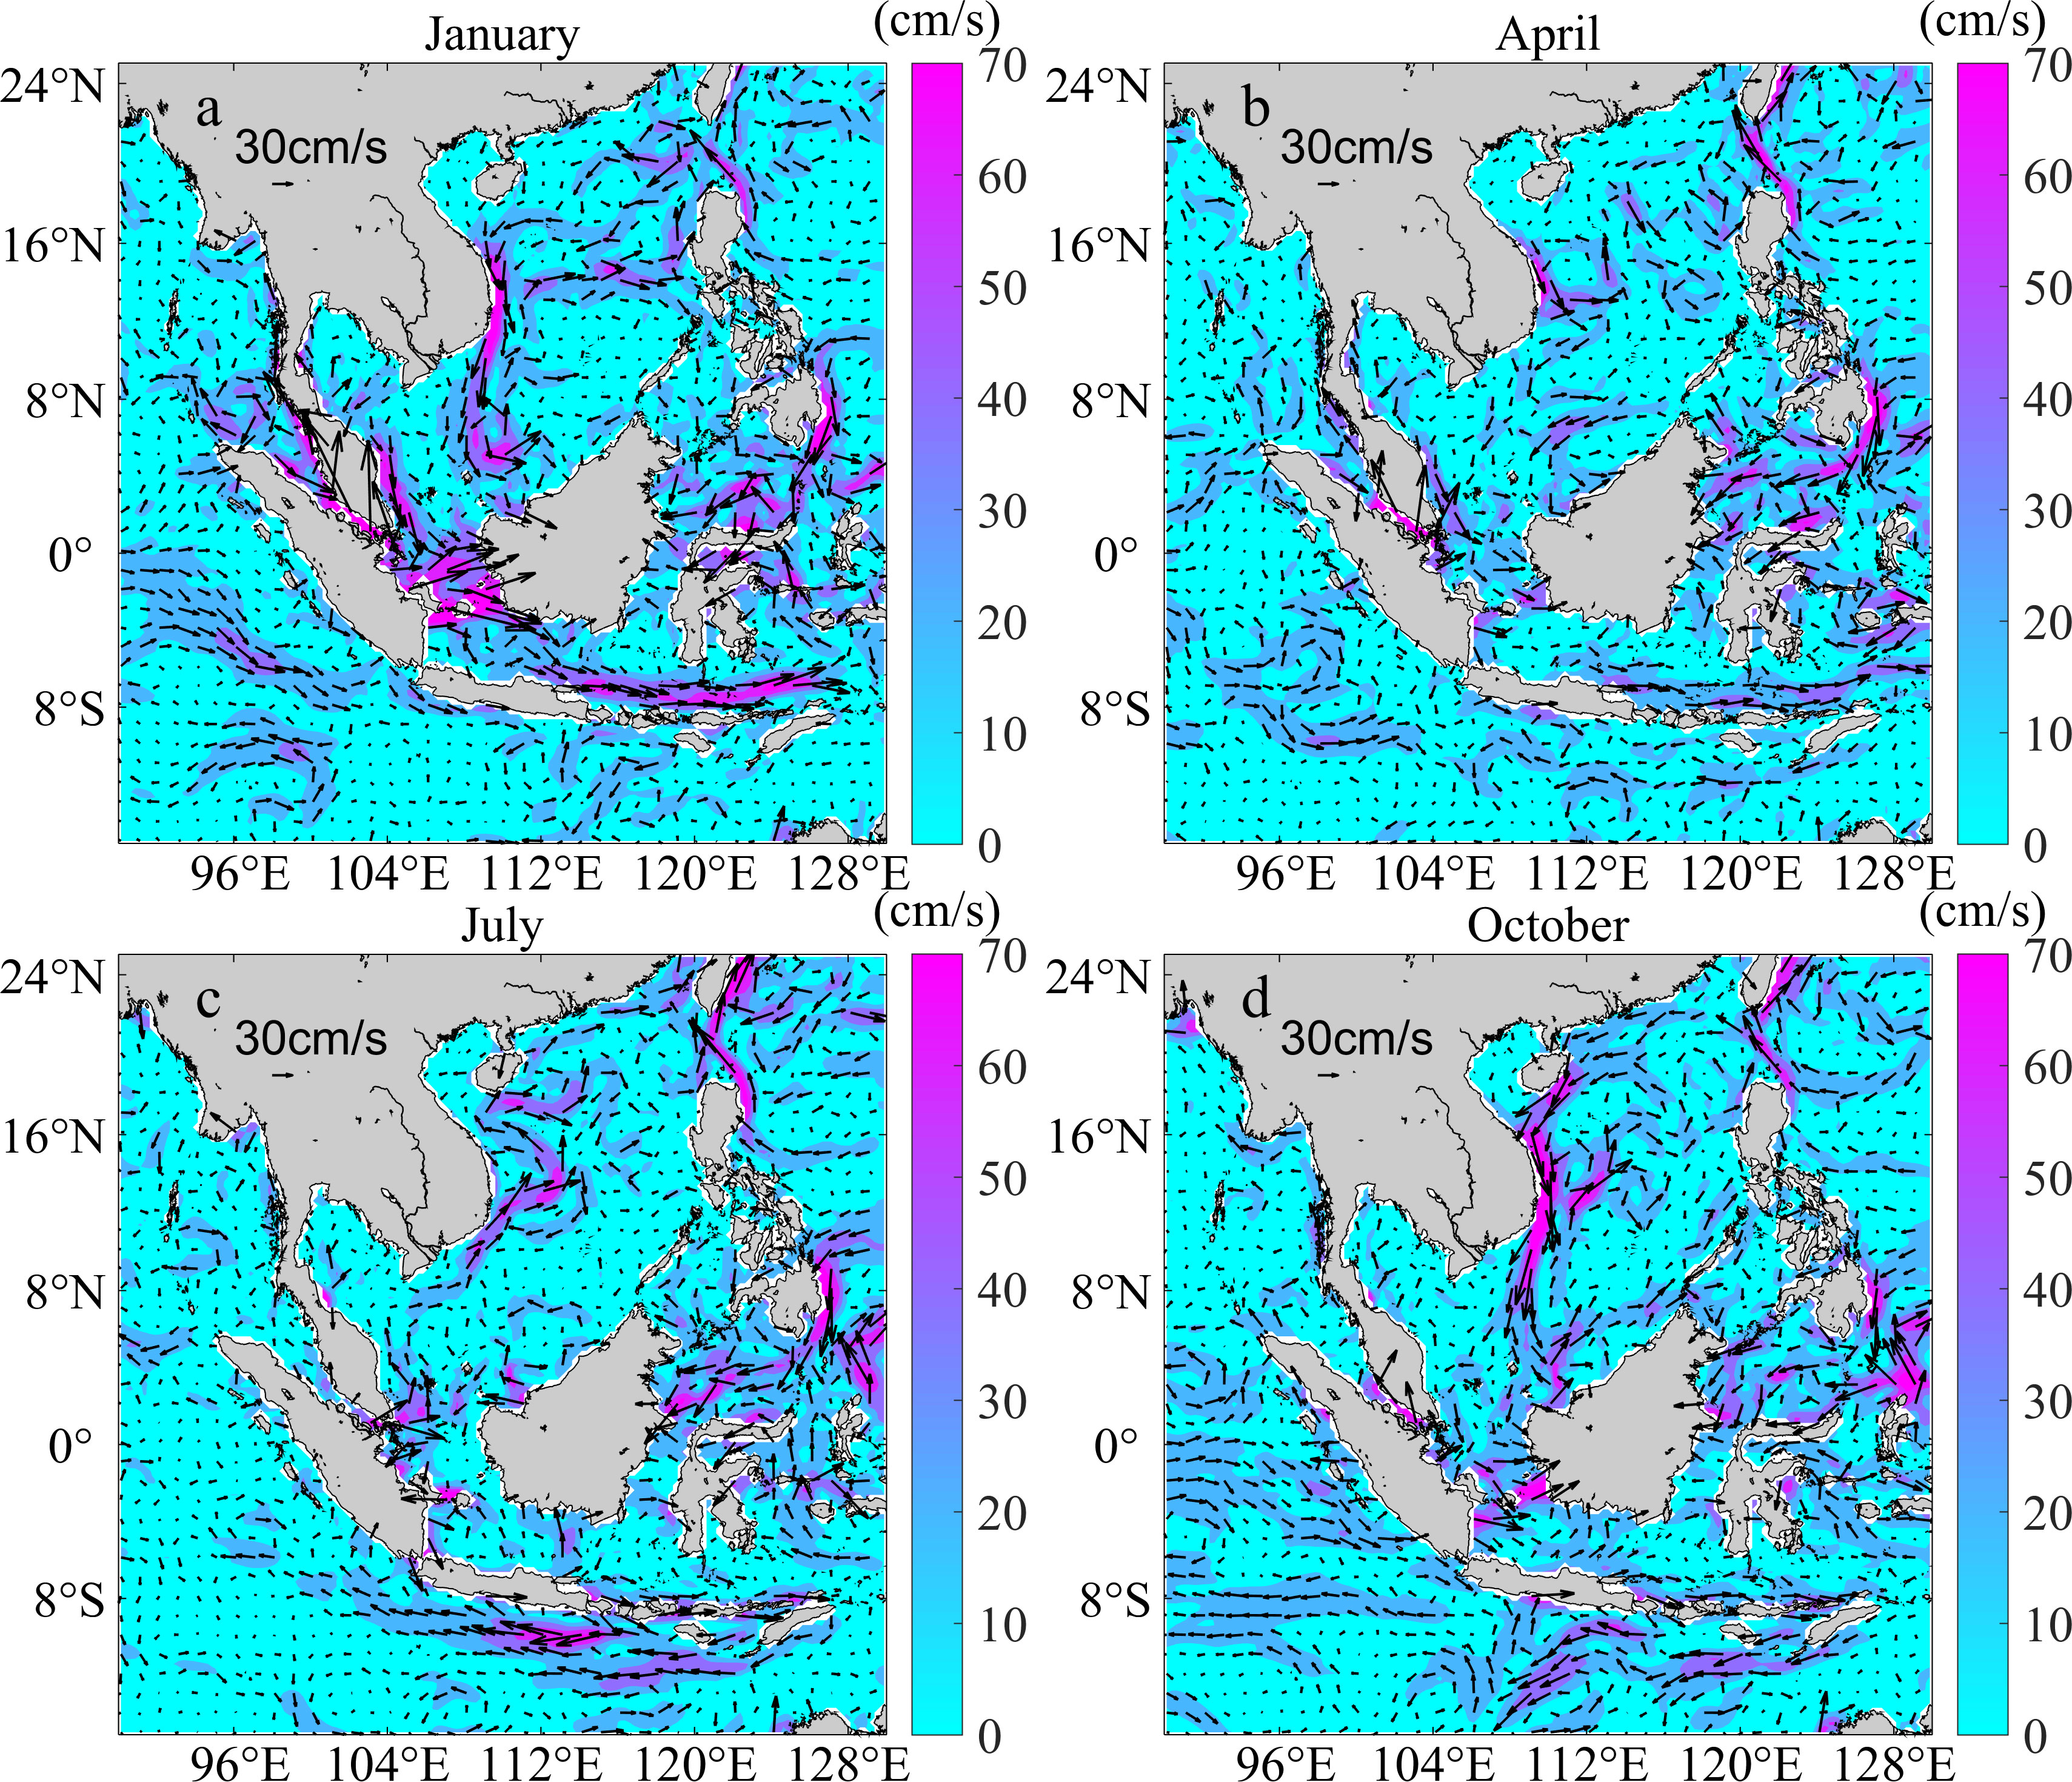
Figure 1 Ocean currents in January, April, July, and October, 2019 in the Indo-Pacific convergence region. Arrows show the circulation direction, and the arrow length and color scale bar indicate the flow rate.
Sargassum C. Agardh, 1820 (Fucales, Phaeophyceae) is a species-rich genus of large brown seaweed with its center of diversity in the Indo-Pacific (Draisma et al., 2010). In situ experiments of Sargassum spp. germlings have shown that dispersal is extremely limited (1–5 m) (Kendrick and Walker, 1995). However, the presence of gas vesicles (aerocysts or pneumatocysts) on adult thalli provides flotation to detached zygote bearing thalli (extruded eggs remain firmly attached to the interior of the conceptacles until 2-3 days after fertilization), facilitating long-distance dispersal (Draisma et al., 2010). Detached zygotes settle on a hard substrate and then continue to grow to maturity, and may become reproductive after three months (Li et al., 2016). Floating thalli may colonize new geographic areas by ocean currents, promoting population genetic exchange (Wong et al., 2008). Rafting dispersal is an ideal model for the investigation of population genetic structure and biogeographic patterns under oceanographic influences (Komatsu et al., 2007).
Sargassum polycystum C. Agardh, 1824 is widely distributed in the mid-intertidal to shallow subtidal zones of the Indo-Pacific region, with a distribution ranging from Okinawa, Japan, to the Central South Pacific Basin (Hu et al., 2018). Similar to other Sargassum species, S. polycystum germlings have weak spreading ability, but detached thalli can form floating mats and drift across a large geographic area (~5,000 km) (Cowen and Sponaugle, 2009; Mizuno et al., 2014). Its genetic diversity, geographic structure of lineage, and possible existence of a glacial refugium were reported for Southeast Asia (Chan et al., 2013; Kantachumpoo et al., 2014; Hu et al., 2018), but without extensive documentation about the influence of ocean currents.
In this study, we aim to estimate the genetic diversity and demographic history of S. polycystum and determine its colonization routes, to examine whether and how contemporary ocean currents drive its present phylogeographic structure and population connectivity in the Indo-Pacific convergence region, and further reveal the diversified evolutionary patterns and spatiotemporal processes of S. polycystum.
To construct the direction of ocean surface currents in the Indo-Pacific convergence region, we downloaded geostrophic current data for January, April, July, and October, 2019, from the Archiving, Validation and Interpretation of Satellite Oceanographic data (AVISO) of the National Center for space research of France (https://resources.marine.copernicus.eu/product-download/SEALEVEL_GLO_PHY_L4_NRT_OBSERVATIONS_008_046), and used MATLAB v1.4m software (Pawlowicz, 2020) to plot the monthly mean ocean surface current in this region.
A total of 234 S. polycystum individuals were newly collected from 12 sites ranging from Chonburi, Thailand, to Malacca, Malaysia (ten populations from Thailand and two populations from Malaysia; Table 1). In each site, 11-50 individuals were randomly selected at >10 m intervals to minimize the chance of collecting genetically identical samples. The apical tissue of 3-5 cm was excised from each individual and stored in silica gel for molecular analysis. In addition, nine populations (Table 1: 2-10) from Hu et al. (2018) and four populations (Table 1: 1, 11, 24, 25) from Kantachumpoo et al. (2014) were integrated with the data. Finally, the 576 S. polycystum samples from 25 populations were analyzed.
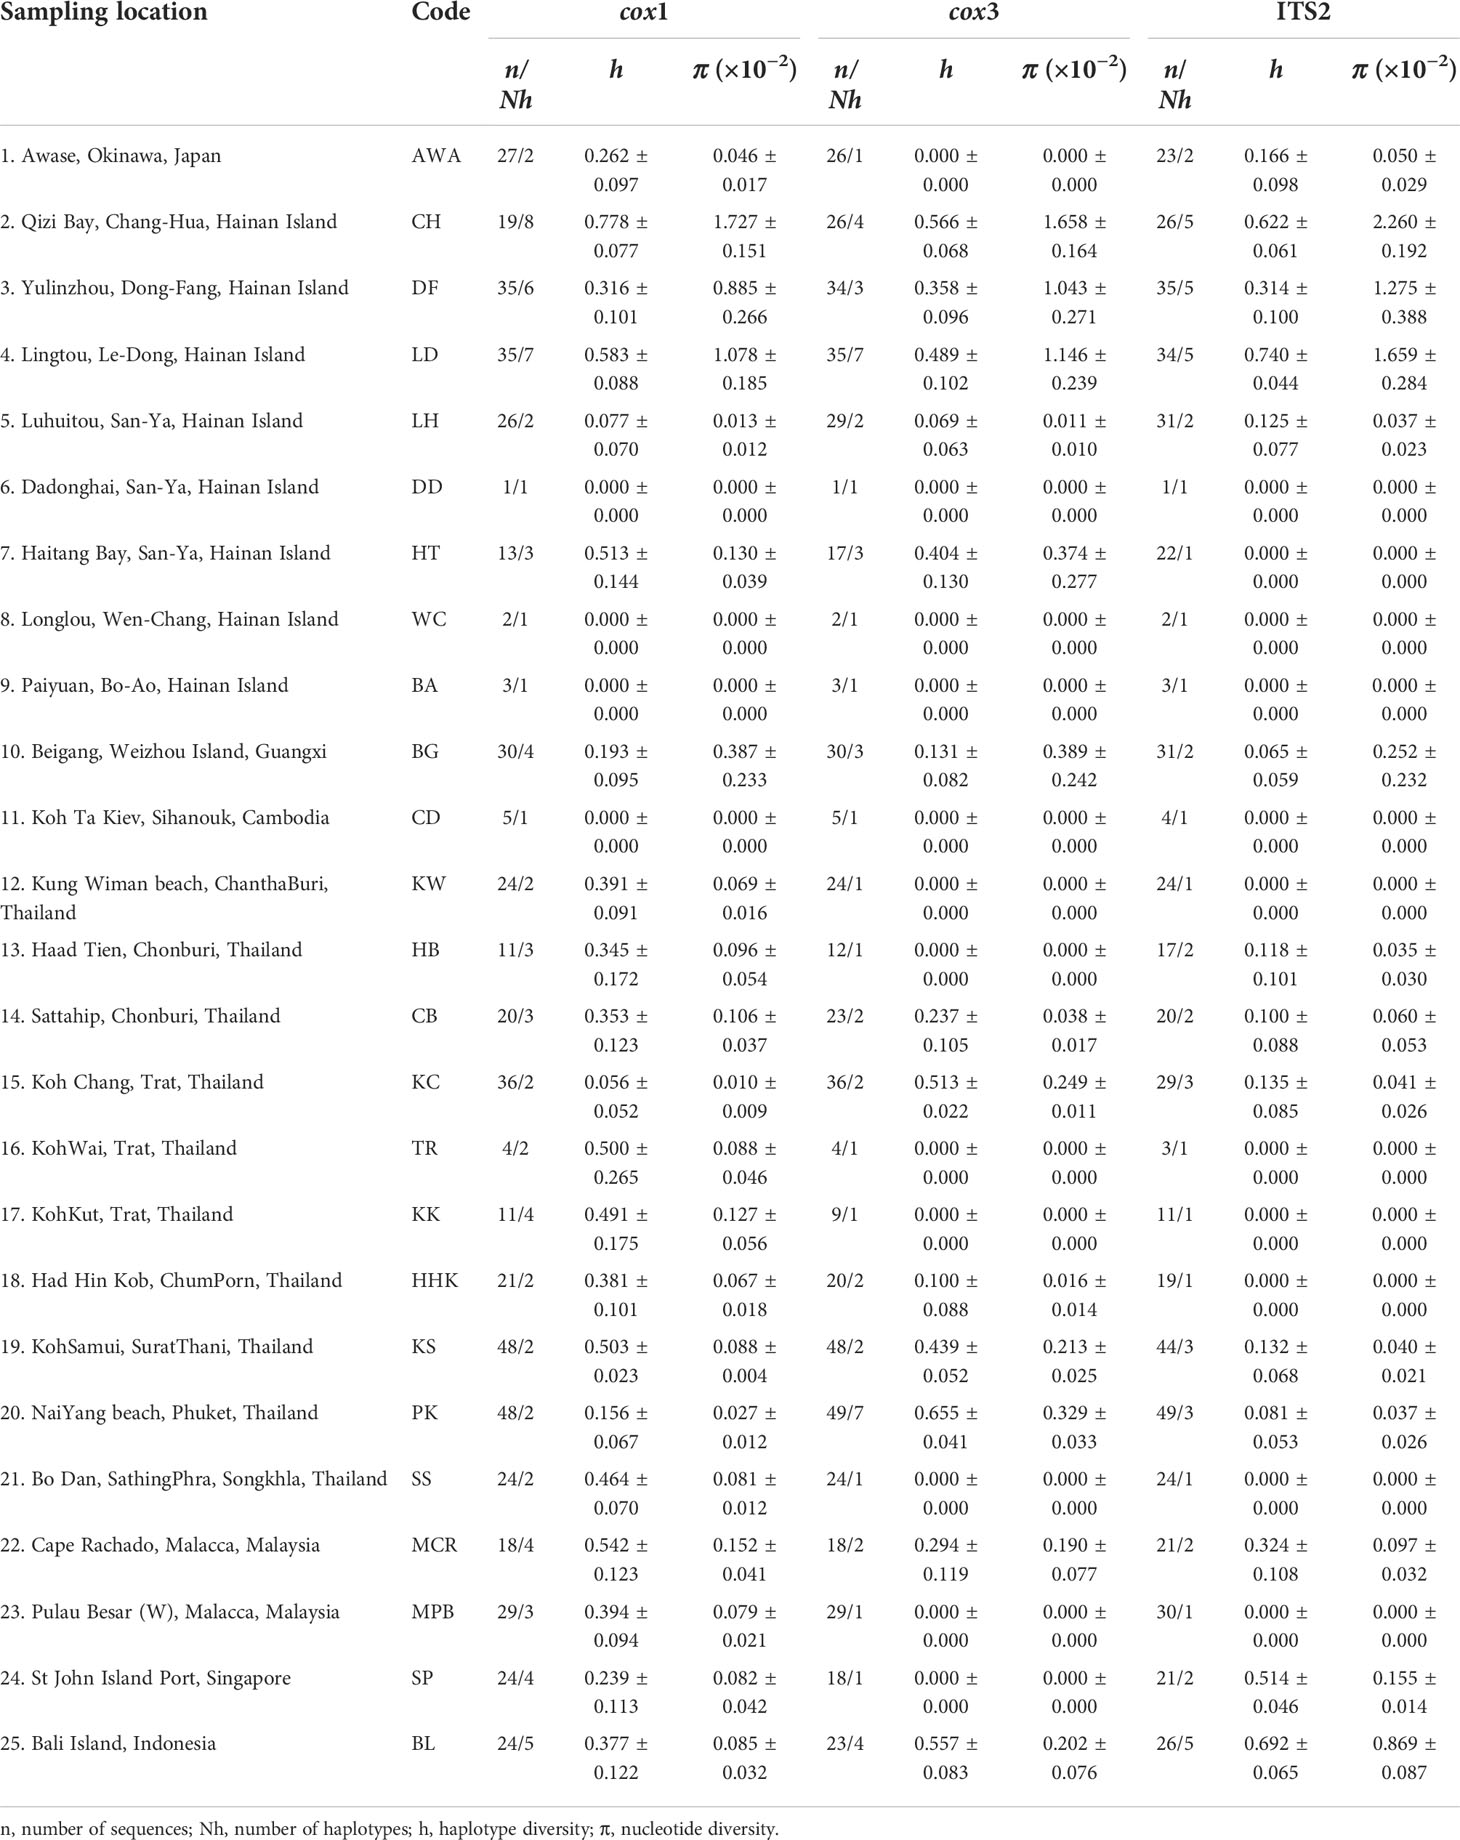
Table 1 Genetic diversity indices of Sargassum polycystum populations inferred from mitochondrial cox1, cox3 and nuclear ITS2.
Total genomic DNA was extracted using a FastPure Plant DNA Isolation Mini Kit (Vazyme Biotech Co., Ltd., Nanjing, China) according to the manufacturer’s instructions. To improve PCR amplification and sequencing efficiency, new primer pairs for cox3 and ITS2 were developed based on the available sequences of S. polycystum (GenBank numbers: MF135698.1 and MF135715.1): cox3-F (5′-AGGAGCAAGCTAAGATGGTTCA-3′) and cox3-R (5′-ACACTATTACATTAAATCCCCACCA-3′) for cox3; ITS2-SF (5′-GAAGAACGCAGCGAAATGCG-3′) and ITS2-SR (5′-CAGCGGGTCTTCTTGCTTGA-3′) for ITS2. Mitochondrial cox1 was amplified using GazF2 (5′-CAACCAYAAAGATATWGGTAC-3′) and GazR2 (5′-GGATGACCAAARAACCAAAA-3′) (Lane et al., 2007). PCR amplification was performed in 50 μL of reaction volume, containing 25 μL of 2×Taq plus Master Mix II (Vazyme Biotech), 2 μL of forward primer (10 μmol/L), 2 μL of reverse primer (10 μmol/L), 1 μL of template DNA, and 20 μL of RNase-free water. The thermo-cycling parameters were set according to the instructions of 2×Taq plus Master Mix II, and the annealing temperature was set at 48°C for cox1, 52.5°C for cox3, and 52°C for ITS2. Electrophoresis, purification, and sequencing were performed according to previous methods (Hu et al., 2011).
Sequences were aligned and manually trimmed with BioEdit v.7.2.5 (Hall, 1999) and MEGA v.7.0 (Kumar et al., 2016). The genetic diversity indices included the number of haplotypes (Nh), number of polymorphic sites (S), haplotype diversity (h), and nucleotide diversity (π), which were estimated using DnaSP v.6 (Rozas et al., 2017). Pairwise population genetic differentiation (FST) was estimated using Arlequin v.3.5 (Excoffier and Lischer, 2010). The significance of covariance components for all results was tested using 105 permutations. This program was also used to determine the hierarchical analysis of molecular variance (AMOVA) for detecting the proportion of genetic differentiation among regions, and within and among populations. To evaluate the evolutionary relationships among cox1 and cox3 haplotypes or ITS2 ribotypes, parsimony median-joining networks were constructed using Network v.10 (Bandelt et al., 1999).
ModelTest v.3.7 (Posada and Crandall, 1998) was used to identify the best-fit substitution model for each locus under the Akaike information criterion (cox1: GTR+I+G, G = 0.9494, I = 0.7866; cox3: HKY+G, G = 0.1156; ITS2: TrNef+G, G = 1.0000). Phylogenetic relationships of cox1 and cox3 haplotypes and ITS2 ribotypes were constructed with maximum likelihood (ML) and Bayesian inference (BI) methods using PhyML v.3.1 (Guindon and Gascuel, 2003) and MrBayes v.3.2 (Ronquist and Huelsenbeck, 2001), respectively. The congeneric species S. aquifolium (cox1: HQ416034; cox3: NC_033408; ITS2: HQ416057), S. pacificum (cox1: HQ416046; ITS2: EU100784), and S. vachellianum (cox3: KR132242) were chosen as outgroups (all belong to the same Sargassum subgenus Sargassum as S. polycystum). The ML tree was reconstructed using 103 bootstrap replicates with a subtree-pruning-regrafting heuristic method. For BI analysis, the Markov Chain Monte Carlo (MCMC) process was run for 2 × 10⁶ generations using four chains with a tree sampling frequency of every 200 generations, discarding the first 10% as burn-in and calculating the posterior consensus tree.
Gene cluster analysis was inferred based on a Bayesian clustering method using STRUCTURE v.2.3.4 (Pritchard et al., 2000; Hubisz et al., 2009). Three independent runs were performed for each value of K (number of clusters) from 1 to 10, with 100,000 iterations following a burn-in period of 10,000 MCMC iterations. The online tool Structure Harvester was used to determine the optimal K value (Evanno et al., 2005; Earl and von Holdt, 2012), and the results of 10 replicate runs for each K value were combined in CLUMPP v.1.1.2 (Jakobsson and Rosenberg, 2007) and displayed graphically using Distruct v.1.1 (Rosenberg, 2004).
The isolation-by-distance (IBD) model was used to determine whether the gene flow among S. polycystum populations in the Indo-Pacific convergence region accord with the stepping-stone model (Bohonak, 2002). Mantel tests were performed using IBD v1.52 to assess the relationship between genetic distances, measured as FST/(1-FST), and the pairwise geographic distances. Geographic distance between sites (minimum coastline distances) was estimated using a web-based calculator (www.movable-type.co.uk/scripts/latlong.html).
To estimate gene flow between populations in the Indo-Pacific convergence region, all the sampling sites were divided into six sub-regions corresponding to known marine areas or putative refugia, including the northwest Pacific Ocean (AWA), the South China Sea (CH, DF, LD, LH, DD, HT, WC, BA, and BG), the Gulf of Thailand (CD, KW, HB, CB, KC, TR, KK, HHK, KS, and SS), the Andaman Sea (PK), the Strait of Malacca (MCR, MPR, and SP), and the Java Sea (BL) (Table 1 and Figure 2). Bayesian coalescent analysis in MIGRATE-n v.3.7 (Beerli, 2006) was used to estimate mutation-scaled immigration rates (M = m/μ, where m is the historical migration rate, and μ is the mutation rate per generation) and population sizes (Θ = xNeμ, where Ne is the effective population size, and x is the inheritance parameter depending on the data; usually 4 for nuclear data and 1 for mitochondrial data). According to the formula, the effective number of migrants was calculated using the relation Nm = Θ×(M/x). The analyses included four long chains and three replicates. Burn-in was set at 104 with a sampling increment of 100 and a total of 5×10⁴ recorded steps. Heating was set with four temperatures (1.0, 1.5, 3.0, and 1.0) with a static scheme.
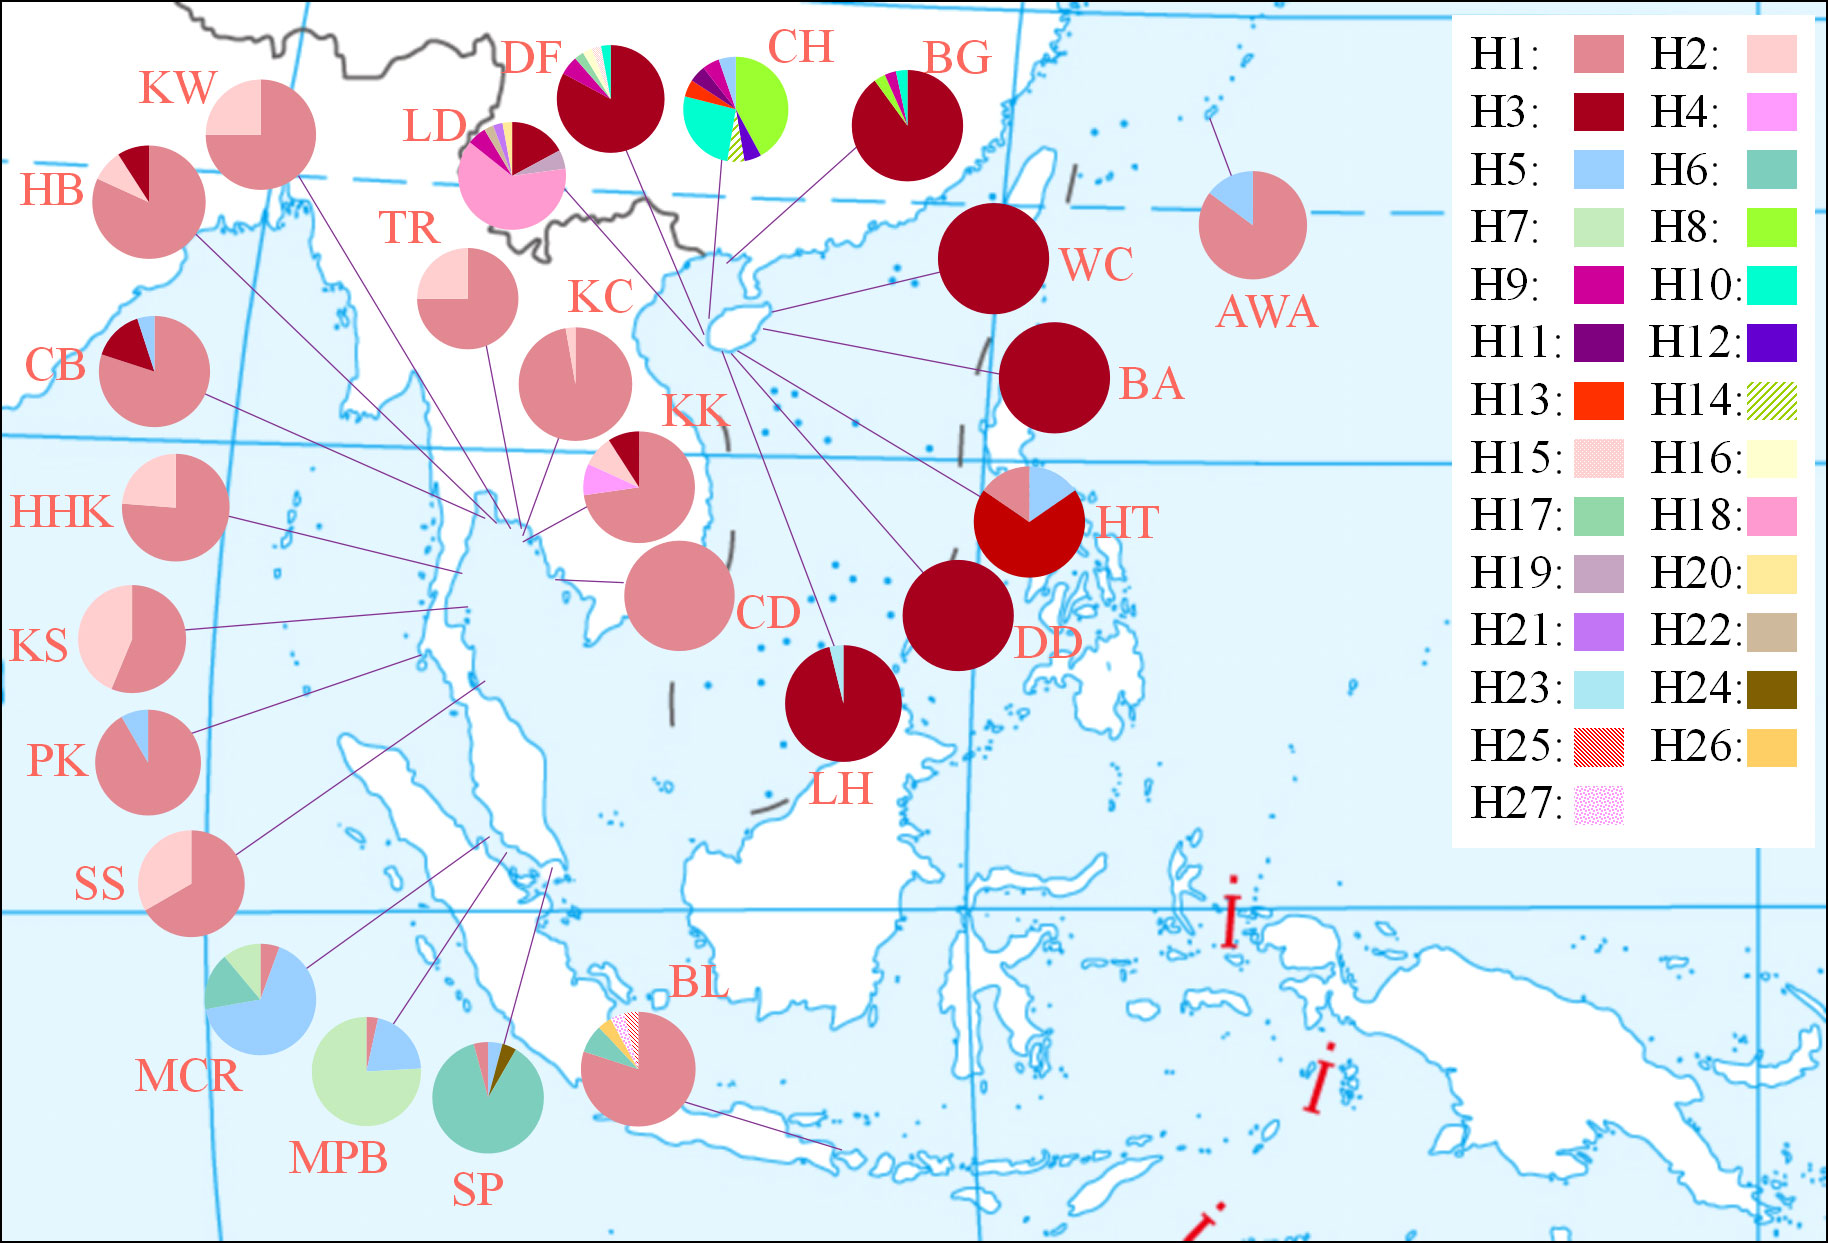
Figure 2 Geographic distribution and relative frequency of 27 mitochondrial cox1 haplotypes in 25 populations.
Evolutionary scenarios of S. polycystum were performed using the approximate Bayesian computation (ABC) approach in DIYABC v.2.1.0 (Cornuet et al., 2014). To keep the scenarios simple and reduce the computational time, 282 individuals were randomly selected from 16 populations for the DIYABC analyses. Four scenarios were defined based on the major groups identified by the geographic distribution (Figure 4): (a) Group H consisted of eight populations (CH, DF, LD, LH, DD, HT, WC, and BA) from Hainan Island, (b) group T contained three populations (KS, KC, and SS) from the Gulf of Thailand, (c) group M included three populations (MCR, MPR, and SP) from the Strait of Malacca, and (d) group B included one population (BL) from Bali. Four scenario hypotheses were tested: (1) S. polycystum survived in the Hainan Island refugium during the Pleistocene glacial epoch and expanded southward postglacially; (2) S. polycystum survived in the Bali refugium and expanded northward postglacially; (3) groups H and B survived in the glacial refugia, and group H split into group T, which diverged into group M; (4) similar to scenario 3, but group M had shared haplotypes/ribotypes with groups T and B; i.e., group M was an admixture of groups T and B.
Prior distribution parameters of effective population size, time of divergence, and mutation rate per generation are listed in Supplementary Table S1. The default settings were used for other prior parameters. Because the DIYABC software requires a population to be traced to its ancestor, the ancestor was set as NA. For each scenario, the current populations were set at time t0, and the divergence time from the most recent common ancestor was set at t3 (Figure 4). One million simulations were run for each scenario, and the most likely scenario was chosen to calculate the posterior probability of the 1% of the simulated data sets closest to the observed data sets using logistic regression (Cornuet et al., 2014). In addition, the model checking option of the software was adopted to check the goodness-of-fit of the selected scenario by principal component analysis (Cornuet et al., 2008).
To quantify the dispersal possibilities of S. polycystum driven by ocean currents, we applied the off-line Lagrangian particle tracking technique based on the regional Hybrid Coordinate Ocean Model (HYCOM), and simulate the oceanographic connectivity between six sampling areas (Bleck et al., 1992). The K-Profile Parameterization mixing scheme was employed for the vertical diffusion of momentum, heat and salt (Thoppil et al., 2011). The regional HYCOM was configured in the West Pacific and Indian oceans (30°E-184°E, 32°S-51°N) with a 1/5°×1/5° horizontal resolution which assimilated the satellite sea surface temperature, altimetry data, in-situ subsurface temperature, and salinity observations with the ensemble optimal interpolation from 1993 to 2019. We simulated the advection of particles using one-day output of average velocity, sea surface height, temperature, and salinity. The two-dimensional Lagrangian particle tracking method was adopted and all the particles were advected in the surface ocean using TRACMASS (Döös, 1995; De Vries and Döös, 2001).
The simulations were carried out for the six sampling regions respectively, namely as L1 (Okinawa, Japan), L2 (Hainan Island), L3 (Gulf of Thailand), L4 (Phuket, Thailand), L5 (Strait of Malacca) and L6 (Bali). All the data were from the output of the regional HYCOM. We seeded more than 2000 particles on each sampling location, and all the particles were released in the six regions in model years: 1 January 1993, 1 June 1993, 1 January 1998, 1 June 1998, 1 January 2003, 1 June 2003, 1 January 2008, 1 June 2008, 1 January 2013, 1 June 2013. The trajectories were integrated from the release time to 31 December 2019. The particle positions were saved each day and used for the calculation for the trajectories traveling from one location to another. Only the trajectories were not calculated between L4 and L5, due to their complex and less oceanic current exchange which contributed less to the population connectivity.
The ocean currents were complex and exhibited obvious seasonal changes in the plotted ocean current distribution in the Indo-Pacific convergence region (Figure 1). In the South China Sea, the current direction was mainly from north to south in autumn (October) and winter (January) and from south to north in spring (April) and summer (July). Moreover, there are complex meso-scale eddies in the north of the South China Sea. In autumn and winter, the ocean current flows southeast from the Strait of Malacca across the Java Sea, while it exhibited reverses directions in spring and summer.
From the 25 location samples, 538, 545, and 550 sequences were obtained for cox1 (571 bp), cox3 (618 bp), and ITS2 (336 bp), respectively (Table 1). There were 27, 21, and 22 haplotypes or ribotypes for cox1, cox3, and ITS2, respectively, with 31, 40, and 36 polymorphic sites [Figure 2 (cox1) and Supplementary Figure S1 (cox3, ITS2)]. Genetic diversity indices based on three molecular data sets consistently showed that the populations of Qizi Bay, Chang-Hua, Hainan Island (CH), Lingtou, Le-Dong, Hainan Island (LD), and Bali, Indonesia (BL), had high haplotype/ribotype and nucleotide diversity (h = 0.377-0.778, π = 0.00085-0.02260; Table 1), whereas those of the south and west of Hainan Island (LH, LD, WC, BA), Beigang, Weizhou Island, Guangxi (BG), and Koh Ta Kiev, Sihanouk, Cambodia (CD), had much lower diversity (h = 0.000-0.193, π = 0.00000-0.00389).
The ML and BI trees based on mitochondrial cox1 and cox3 and nuclear ITS2 revealed substantial phylogeographic structure. The ML and BI trees showed an identical topology with robust branch support values. Phylogenetic and network analyses consistently showed a basic biogeographic pattern of two lineages in space: lineage 1 occurred on the west coast of Hainan Island and lineage 2 occurred on the southeast coast of Hainan Island, in Okinawa, and in Southeast Asia (Figures 3A, B; Supplementary Figures S2A, B; Supplementary Figures S3A, B). Gene cluster analysis results were consistent with the phylogenetic results and geographic haplotype distribution. S. polycystum populations were hierarchically structured and the optimal structure was found to be K = 2 based on the delta K values (Supplementary Figure S4). where S. polycystum individuals in the western Hainan Island formed a clade (BG, CH, DF, LD), whereas individuals from other populations formed another clade (Figure 3C; Supplementary Figures S2C, S3C).
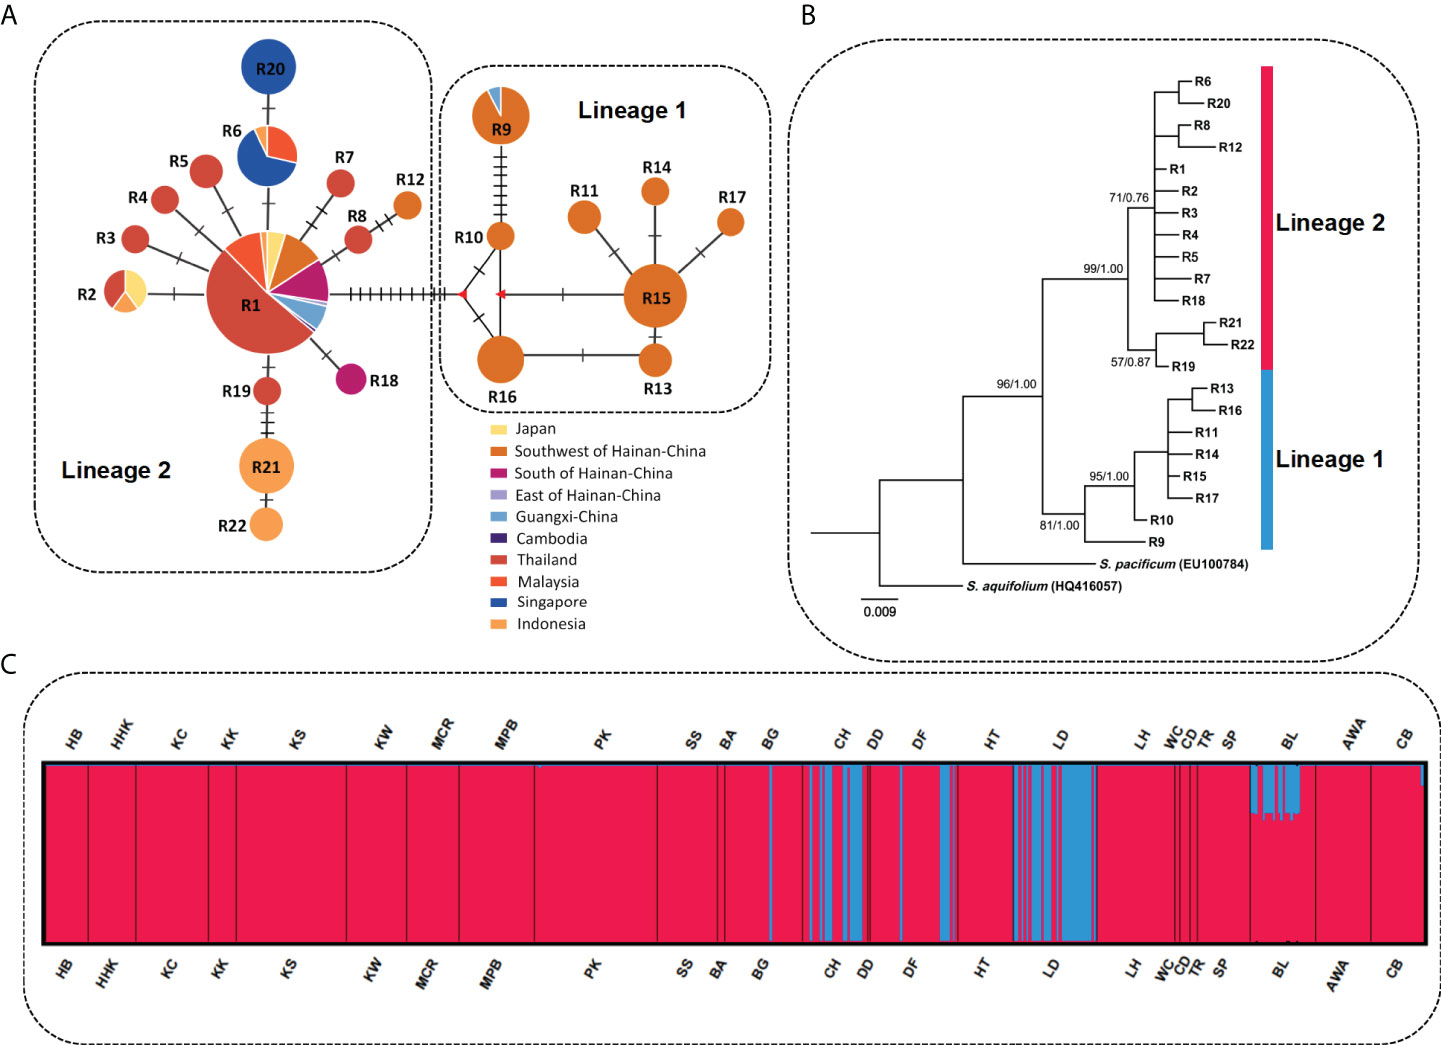
Figure 3 Parsimony median-joining network, phylogenetic relationships among ribotypes, and STRUCTURE analysis of S. polycystum inferred from nuclear ITS2. (A) Median-joining network of nuclear ITS2 ribotypes. Circle size is proportional to the population sample size. Each crossbar between ribotypes represents one mutation step, and different colors indicate different regions. Small red triangles indicate extinct or unsampledribotypes. (B) Maximum likelihood (ML) tree of S. polycystum based on nuclear ITS2 ribotypes. Node values are bootstrap supports (left) and BI posterior probabilities (right). (C) STRUCTURE analysis results based on nuclear ITS2 for S. polycystum at K = 2. Population codes are the same as in Table 1.
Pairwise FST values based on ITS2 revealed low levels of genetic differentiation in S. polycystum (72.3% of FST values < 0.25), with most estimates being statistically non-significant (Supplementary Table S2). The populations of Qizi Bay, Chang-Hua, Hainan Island (CH), Lingtou, Le-Dong, Hainan Island (LD), St. John Island Port, Singapore (SP), and Bali, Indonesia (BL), significantly diverged from others, with medium-to-high FST values (FST = 0.298-0.871). In contrast, combined mitochondrial cox1+cox3 revealed low-to-moderate FST values when the populations of western Hainan Island, i.e., Qizi Bay, Chang-Hua (CH) and Yulinzhou, Dong-Fang (DF), were compared with the other populations (FST = −0.719-0.553). In addition, no significant regional scale population genetic differentiation was detected when S. polycystum samples were divided into country and marine area groups (cox1+cox3: ΦSC = 0.2211/0.0879, P > 0.05; ITS2: ΦSC = 0.1391/0.0707, P > 0.05; Supplementary Table S3). Likewise, regional structured genetic variance was low when S. polycystum samples were divided into latitudinal and longitudinal groups (cox1+cox3: ΦSC = 0.1412/0.1757, P < 0.05; ITS2: ΦSC = 0.1452/0.1375, P < 0.05).
Comparing the scenarios of four ABC models, the highest posterior probability value was scenario 4 (0.426; 95% CI: 0.398-0.425), but it had only a slightly higher value than scenario 3 (0.381; 95% CI: 0.367-0.394; Figure 4 and Supplementary Table S4). The location of the observed data near the simulated data cluster in the principal component analysis indicated that the selected scenarios were a good fit for the observed data (Supplementary Figures S5A, B). In scenario 4, the median values of the effective population size of N1 (H), N2 (T), N3 (M), N4 (B), and NA (putative ancestral population) were 663,000, 67,400, 55,800, 391,000, and 2,100,000, respectively (Supplementary Figure S5C and Table S5). The divergence times when N1 split from N2 (t2) and N4 (t3) were estimated to be 51,900 (95% CI: 17,100-95,600) and 228,000 (95% CI: 53,400-695,000) generations ago, respectively. With an estimation of one years per generation, the divergence times of t2 and t3 were converted to the absolute time of 0.052 and 0.228 Ma, respectively. Moreover, the median value of the admixture time (t1) was 16,500 (95% CI: 2,170-43,800) generations, which corresponded to 0.017 Ma (Supplementary Figure S5C and Table S5).
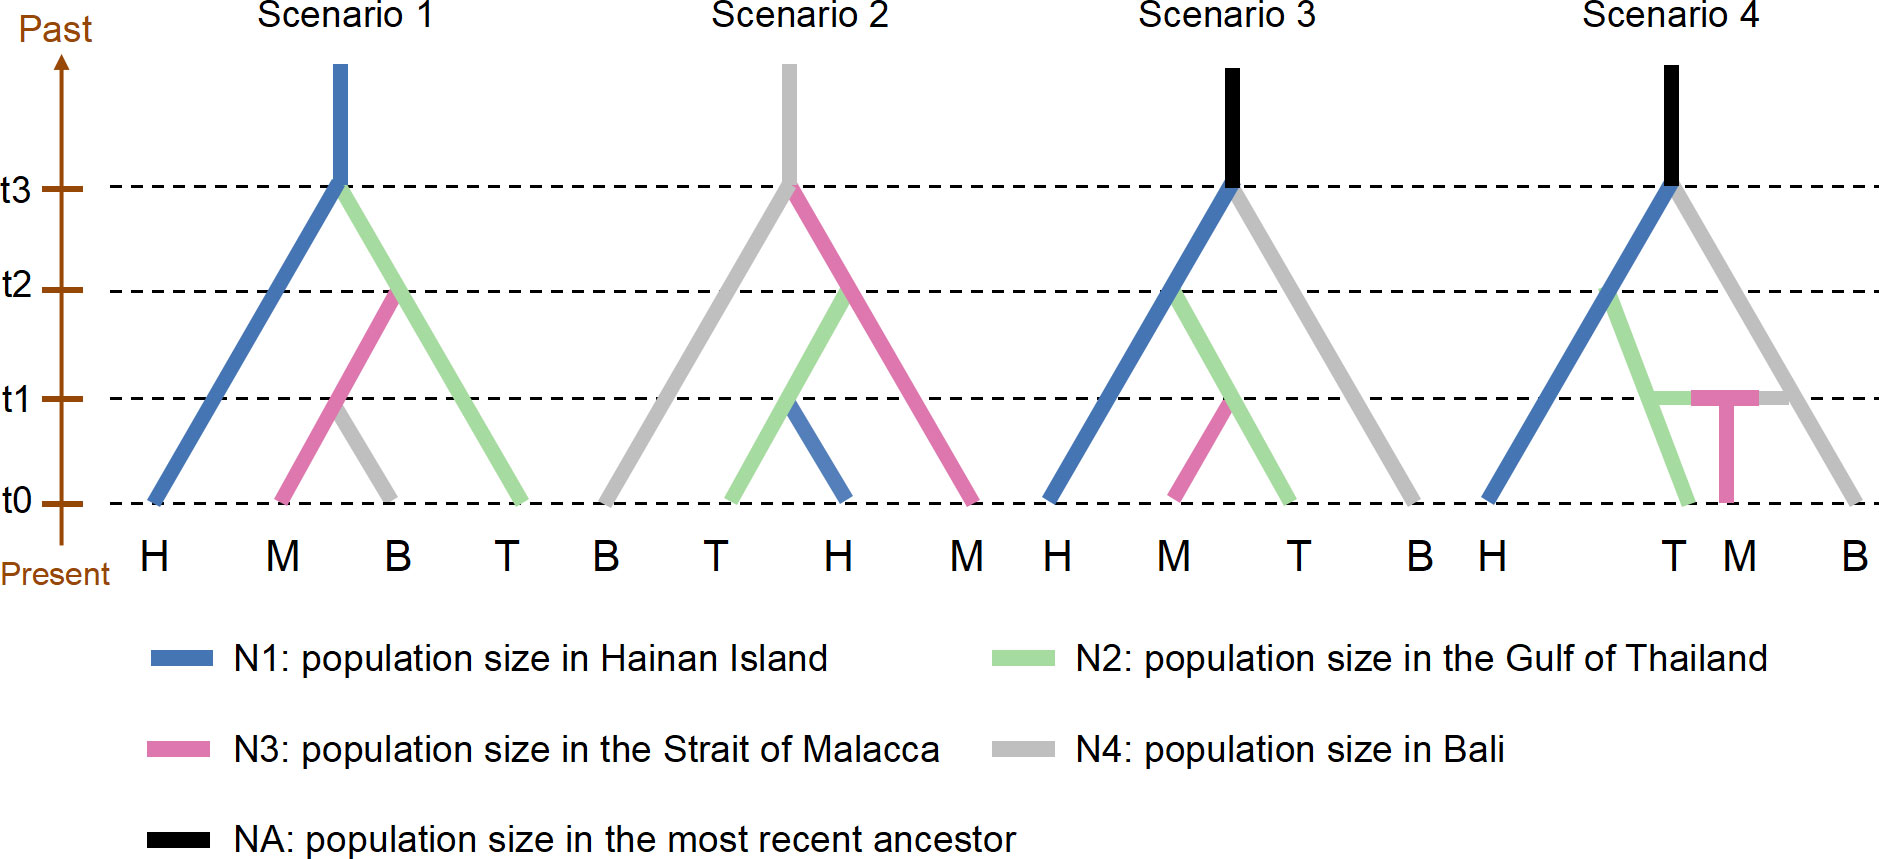
Figure 4 Probable demographic scenarios tested with approximate Bayesian computation (ABC) models implemented in DIYABC. Prior distribution parameters are listed in Supplementary Table S1.
The test for IBD among S. polycystum populations was non-significant (cox1+cox3: R2 = 0.0014, p = 0.113; ITS2: R2 = 0.0195, p = 0.0612; Supplementary Figure S6), indicating that the S. polycystum population genetic structure did not fit the IBD model. To detect genetic exchange between regions, gene flow was calculated between six regions: the northwest Pacific Ocean (1: AWA), the South China Sea (2: CH, DF, LD, LH, DD, HT, WC, BA, and BG), the Gulf of Thailand (3: CD, KW, HB, CB, KC, TR, KK, HHK, KS, and SS), the Andaman Sea (4: PK), the Strait of Malacca (5: MCR, MPR, and SP), and the Java Sea (6: BL). Bayesian migration analyses inferred from ITS2 and cox1+cox3 both revealed highly asymmetric gene flow in S. polycystum along the Indo-Pacific convergence region. The direction of gene flow was mainly from north to south (Figures 5A, B). In the South China Sea, the populations of Hainan Island showed high levels of outward genetic migration to Thailand and Japan (2→1: Nm = 1.152–2.257; 2→3: Nm = 1.522-3.660), whereas gene flow in the opposite directions was weak. Asymmetric genetic exchange occurred between populations of the Gulf of Thailand and the Strait of Malacca. Gene flow from the Gulf of Thailand (3) to the Strait of Malacca (5) was significantly higher than that in the opposite direction (3→5: Nm = 0.080-0.300; 5→3: Nm = 0.064-0.259). Furthermore, asymmetric gene flow was detected between populations of Bali (6) and the Strait of Malacca (5), mainly from Bali to the Strait of Malacca (6→5: Nm = 0.140–6.139; 5→6: Nm = 0.087-0.233). There was one slight deviation found in gene flow between populations of the Andaman Sea (4) and the Strait of Malacca (5) based on different markers. Combined mitochondrial data showed strong gene flow from the Andaman Sea to the Strait of Malacca (4→5: Nm = 0.238; 5→4: Nm = 0.070), whereas symmetric gene flow was found between the two populations based on nuclear ITS2 (4→5: Nm = 0.235; 5→4: Nm = 0.297).
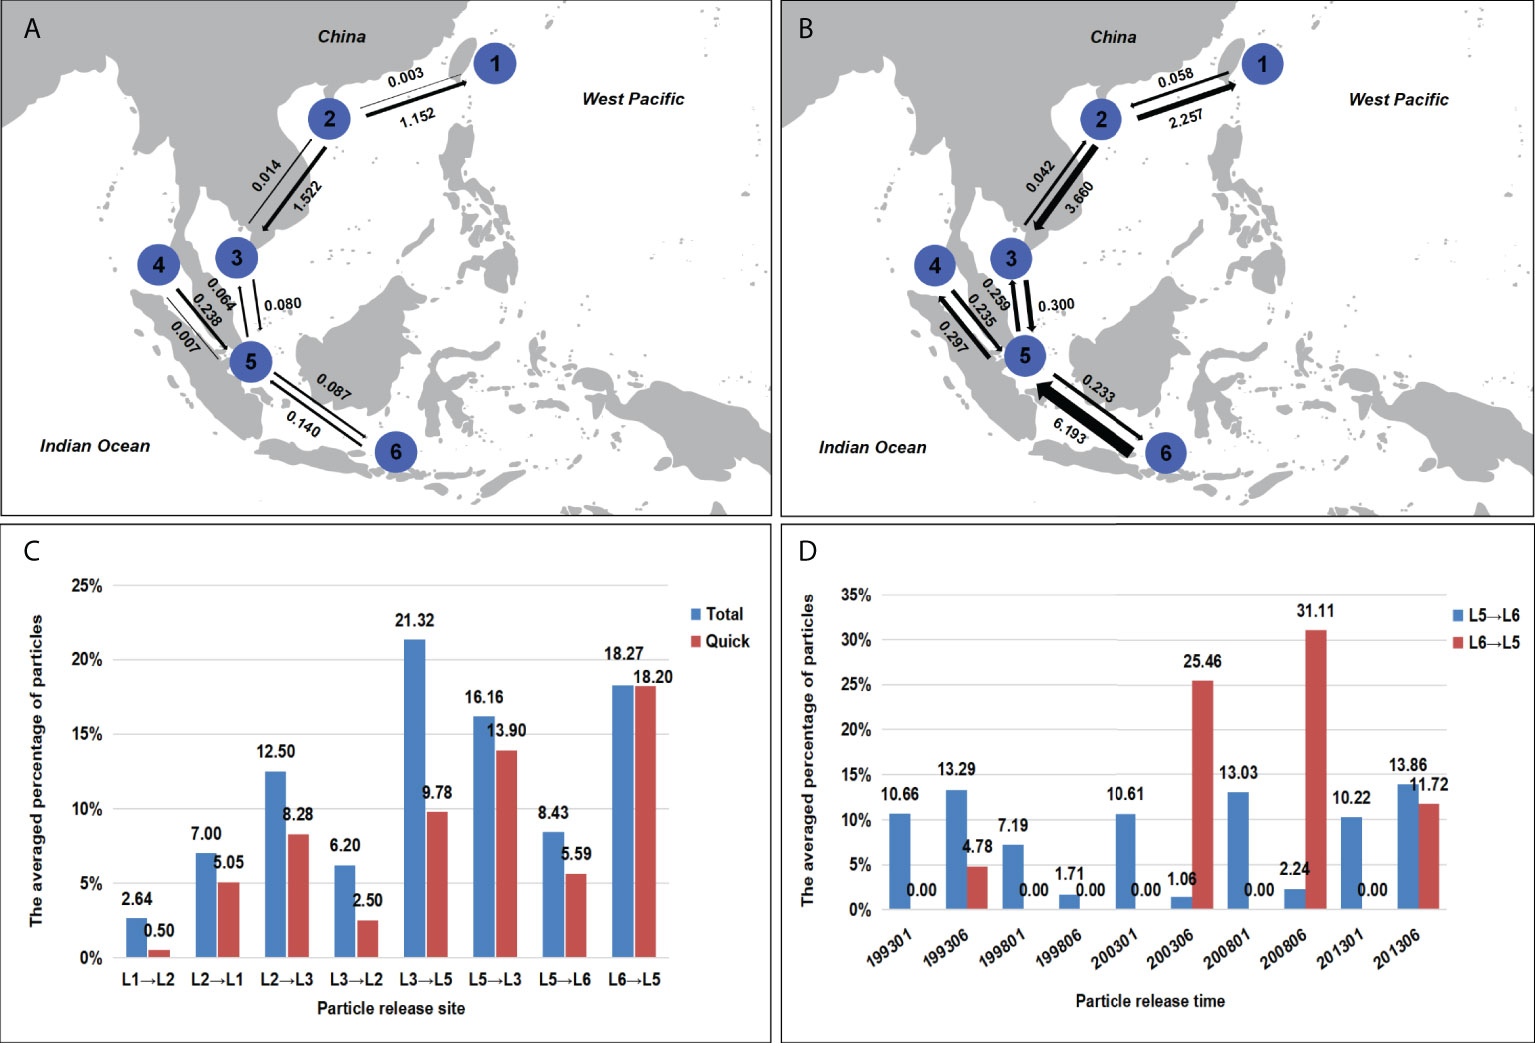
Figure 5 Gene flow (Nm) and Lagrangian particles transport simulations. (A) Gene flow by MIGRATE-n between adjacent S. polycystum populations in the Indo-Pacific convergence region based on mitochondrial cox1+cox3, and (B) was based on nuclear ITS2. Numbers above/below the arrows represent migration rates in the direction of the arrow. Arrow thickness is scaled according to the value. (C) The averaged percentage of particles traveling in total released particles over all release experiments and the averaged percentage of particles traveling in a direct path. The arrow indicates the direction of particle transportation. In the legend, red corresponds to the direct path, and blue corresponds to all paths. (D) The percentage of particles traveling from one location to another in total released particles at different released times. Red: from L6 to L5, blue: from L5 to L6.
The averaged percentage over all release experiments showed that more particles travel from L2 to L1 than that in the opposite direction (Figure 5C). Similarly, more particles travel from L2 to L3 than from L3 to L2, from L3 to L5 than from L5 to L3, and from L6 to L5 than from L5 to L6. Moreover, the number of particles traveling from L2 to L1 was nearly twice than that of the opposite direction, similar results were obtained for L2 and L3 as well as L5 and L6. The number of particles from L3 to L5 was 1.3 times of that in the opposite direction. These were consistent with the gene flow estimation between the different sampling locations. Moreover, the direction of particles traveling and the number of particles arriving exhibited different variations when released at different times. The particle number from L3 to L2was higher than that from L2 to L3 in three release experiments, the particles from L5 to L3 were more than from L3 to L5 in four release experiments (Supplementary Figures S7B, C). Noticeably, the transport of particles from L6 to L5 has been detected only in summer.
The particle trajectories showed some tracking paths that did not follow the major current systems from one location to another (Supplementary Figures S8, S9). Usually, the time taken for particles traveling was short when driven by the major current systems. To estimate how much particles were driven by the major current systems, we defined the trajectory path as the direct, when the time taken from one location to another was less than one year. The averaged percentage of particles traveling in direct paths from L1 to L2 (6%) was the lowest due to the intricate current systems (Figure 5C). The direct paths reached 68% of all paths from L2 to L1, while it was about, 85% from L5 to L3, 58% from L5 to L6, and 99% from L6 to L5 (Figure 5C). This suggests that the advection of particles in these sampling locations is mainly driven by the main current system.
The interaction of biological habits and physical marine environment can promote the long-distance dispersal of individuals and influence the ecological environment of post-colonization habitats (Cowen and Sponaugle, 2009). Sargassum species have high dispersal potential and propagules that detach from the thallus can grow and reproduce after three months (Mizuno et al., 2014). The distribution patterns of haplotype H1 and ribotype R1 covered a wide geographic distance (~3,000 km; Figure 2 and Supplementary Figure 1) reflecting the ability of S. polycystum to drifting across long distances. In addition, the relationship between the geographic and genetic distance is not significant and thus not consistent with an IBD pattern (Supplementary Figure S6). This implies that geographic isolation is not the main factor that influences the biogeographic patterns and genetic diversity. The homogeneous genetic structure of S. polycystum is more likely caused by contemporary ocean currents in the Indo-Pacific convergence region.
Our integrated results indicate that the Lagrangian particle tracking and gene flow directionality are consistent with ocean current data (Figure 5). It indicates that the ocean current systems are the main physical factor influencing S. polycystum population connectivity and its geographic distribution. As a marine refugium to S. polycystum (Hu et al., 2018), Hainan Island has an obvious tendency to spread outside in marine ecological environments. In the South China Sea, S. polycystum populations dispersed southward from Hainan Island to the Gulf of Thailand and eventually to the Strait of Malacca (Nm: 2→3→5; Total particles: L2→L3→L5; Figure 5). The northeast monsoon current (NMC) formed in autumn and winter may be the main driving force of its southward dispersal. It flows southward along the east of Hainan Island in the South China Sea and then into the Indian Ocean through the Strait of Malacca (Fang et al., 2004; Fang et al., 2005). Although the ocean current directions changed seasonally, the gene flow and the particle tracking number in the opposite direction were significantly lower than the direction of NMC (Figures 5A–C). This implies that the NMC strongly contributed to S. polycystum population connectivity in the South China Sea. Moreover, the genetic exchange from Hainan Island (2) to Okinawa, Japan (1), was found to be significantly higher than that in the opposite direction (2→1: Nm = 1.152–2.257, 1→2: Nm = 0.003-0.058; Figures 5A, B), and the South China Sea warm current, which flows from the southwest to the northeast throughout the year (Fang et al., 2005), might facilitate the population migration from Hainan Island to Okinawa, resulting in the asymmetric genetic exchange. The northward Kuroshio Current along the east coast of Luzon Island might also have played an important role in the migration to Japan (Su, 2001). Due to the lack of sampling data from southern Taiwan, China, it is not clear whether the Taiwan is a transit station for the migration of Hainan Island to Japan. Particle tracking simulation also supported this result (Total particles: L2→L1 > L1→L2).
The seasonal variations of ocean currents and mesoscale eddies also impact the dispersal of S. polycystum (Figure 1; Supplementary Figures S7, S9). The winter monsoon currents are the main reason for the southward dispersal of S. polycystum populations in the South China Sea. In the Java Sea, the Karimata through-flow, one branch of the Indonesian through-flow, flows from the Java Sea through the Kalimata Strait to the Malacca Strait and the southern South China Sea during the northern hemisphere summer (Fang et al., 2009). Moreover, S. polycystum populations in tropical regions are only fertile during the summer months, the strong Karimata through-flow during the summer months might have contributed to the migration of S. polycystum from Bali (6) to the Strait of Malacca (5), this could explain the detected asymmetric gene flow. Although the Karimata through-flow reverses in winter, our simulations only detected the particle transport from L6 to L5 in summer (Figure 5D), and indicated that the Karimata through-flow was weaker in winter, leading to a smaller gene flow from the Strait of Malacca (5) to Bali (6). Besides the seasonal change of ocean currents, the mesoscale eddies may also influence dispersal routes. There are some results which are inconsistent with the direction of the main ocean currents in multiple particle release experiments. For example, the particle release experiment in January 2013 showed that there were significantly more particles from L3 to L2 than in the opposite direction, we suspect that the mesoscale eddies in the South China Sea might disturb the direction of particle transport resulting in the complex trajectories (Supplementary Figures S8B, H, J) (Fang et al., 2004; Zheng et al., 2017). Nevertheless, the proportion of particles transported by direct paths is significantly higher (Figure 5C and Supplementary Figure S9), suggesting that the long-distance dispersal of S. polycystum is mainly driven by the ocean current systems.
In addition, human-mediated dispersal (e.g., biological dispersal into ballast water) may also contribute to geographic structure and genetic diversity (Guzinski et al., 2018; Le Cam et al., 2020). We have detected significant gene flow between Phuket, Thailand (4) and the Strait of Malacca (5), but did not find any particle trajectories which reached any recovery site. Therefore, we speculate that ocean currents may not be the main force for the gene exchange between the two populations. The Strait of Malacca is an important channel connecting the Pacific and Indian Oceans and the frequent shipping may be a contributing factor to population connectivity here.
Glacial refugia provided habitats for intertidal species to avoid extinction and served as centers of origin and genetic resource pools for postglacial species dispersal and recolonization (Maggs et al., 2008; Provan and Bennett, 2008). According to the genetic diversity level and ancestral haplotypes, Hu et al. (2018) proposed the existence of a glacial refugium for S. polycystum in the southwest of Hainan Island and possible the secondary shelters around Bali. Genetic diversity and number of endemic haplotypes/ribotypes are higher in the populations from southwest Hainan Island (CH and LD) and Bali (BL) (Figure 2 and Table 1; Supplementary Figure S1). Generally, populations in glacial refugia tend to have a longer evolutionary history than resettled populations, thus accumulating higher genetic diversity and unique genotypes (Maggs et al., 2008). The colonization route with the highest posterior probability value revealed that the S. polycystum populations in the South China Sea (Gulf of Thailand) may originate from the glacial refugium in the southwest of Hainan Island, and sequentially colonized southward from Hainan Island to the Strait of Malacca. Moreover, the Bali population had secondary contact with the Gulf of Thailand population in the Strait of Malacca, contributing to its genetic divergence (Figure 4). The S. polycystum may origin from multiple glacial refugia rather than a monophyletic origin, and postglacial demographic expansion may influence the present phylogeographic structure.
Historical vicariance of marginal seas and refugia caused by the sea level fluctuation could cause the genetic divergence in S. polycystum (Chan et al., 2013; Wang et al., 2016). The Sunda Shelf emerged in the southern South China Sea during the Middle Pleistocene (0.150-0.250 Ma) and formed Sundaland, which connected mainland Asia with western Indonesia and parts of the Philipines (Pelejero et al., 1999; Voris, 2000; Bird et al., 2005). Sundaland formed an obvious geographic barrier for marine organisms on both sides and may have influenced the divergence of S. polycystum populations in Hainan Island and Bali. The high genetic divergence between populations from southwestern Hainan Island (LD) and Bali (BL) (FST: ITS2 = 0.305-0.768, cox1+cox3 = 0.220-0.860; Supplementary Table S2) supports this hypothesis. The phylogeographic structure of S. polycystum populations in the Indo-Pacific convergence region was similar to that of Maggs et al.’s Model IV (Maggs et al., 2008), suggesting that divergent populations from multiple glacial refugia were genetically mixed in the secondary contact zone (Provan and Bennett, 2008). This was supported by the high genetic diversity detected in the populations of the Strait of Malacca (MCR, MPB, and SP) (h = 0.239-0.542, π = 0.00079-0.00190; Table 1). Nonetheless, additional samples (e.g. from the Gulf of Bengal, west coast of Sumatra, the east coast of Borneo, and the Philippines) and evidences are needed to enforce our conclusions.
In conclusion, the colonization routes and demographic distributions of S. polycystum in the Indo-Pacific convergence region, reflected historical events which influenced its phylogeographic structure. The integrations of dynamic ocean current data, physical oceanographic simulation, and molecular genetics data revealed that the ocean current system could drive its geographical dispersal and population genetic connectivity, and caused their phylogeographical distributions and diversity patterns.
The datasets presented in this study can be found in online repositories. The names of the repository/repositories and accession number(s) can be found below: https://www.ncbi.nlm.nih.gov/genbank/, OK074006-OK074528, https://www.ncbi.nlm.nih.gov/genbank/, OK074529-OK075073, https://www.ncbi.nlm.nih.gov/genbank/, OK041530-OK042079.
YSL, JZhu, JZha, and DD conceived and designed the project. SD and AK provided samples and some analytical data. YSL, SZ, and YL performed the molecular experiments and analyzed. ZL mapped the ocean currents. YL, SZ, CY, and JZha analyzed and integrated the data. YSL drafted the manuscript, JZha and DD revised the manuscript. All authors discussed the results and approved the final version of this manuscript.
This research was supported by the Strategic Priority Research Program of Chinese Academy of Sciences (XDB42030203, XDB42040106, XDA19060102), National Natural Science Foundation of China (41761144057, 41776041), Shandong Provincial Natural Science Foundation (ZR2019BC024), and the Thailand Research Fund (RDG6130002).
Thanks to Dr. ZM Hu for providing some analytical data, to Drs. DZ Yang, J Wang and Zh Wang for their comments and suggestions during the ocean currents analysis. We either thank TopEdit (www.topeditsci.com) for linguistic assistance for the preparation of this manuscript.
The authors declare that the research was conducted in the absence of any commercial or financial relationships that could be construed as a potential conflict of interest.
All claims expressed in this article are solely those of the authors and do not necessarily represent those of their affiliated organizations, or those of the publisher, the editors and the reviewers. Any product that may be evaluated in this article, or claim that may be made by its manufacturer, is not guaranteed or endorsed by the publisher.
The Supplementary Material for this article can be found online at: https://www.frontiersin.org/articles/10.3389/fmars.2022.895554/full#supplementary-material
Alberto F., Raimondi P. T., Reed D. C., Watson J. R., Siegel D. A., Mitarai S., et al. (2011). Isolation by oceanographic distance explains genetic structure for Macrocystis pyrifera in the Santa Barbara channel. Mol. Ecol. 20, 2543–2554. doi: 10.1111/j.1365-294X.2011.05117.x
Bandelt H. J., Forster P., Röhl A. (1999). Median-joining networks for inferring intraspecific phylogenies. Mol. Biol. Evol. 16, 37–48. doi: 10.1093/oxfordjournals.molbev.a026036
Banerjee A. K., Guo W., Qiao S., Li W., Xing F., Lin Y., et al. (2020). Land masses and oceanic currents drive population structure of Heritiera littoralis, a widespread mangrove in the indo-West Pacific. Ecol. Evol. 10, 7349–7363. doi: 10.1002/ece3.6460
Beerli P. (2006). Comparison of Bayesian and maximum-likelihood inference of population genetic parameters. Bioinformatics. 22, 341–345. doi: 10.1093/bioinformatics/bti803
Bertola L. D., Boehm J. T., Putman N. F., Xue A. T., Hickerson M. J. (2020). Asymmetrical gene flow in five co-distributed syngnathids explained by ocean currents and rafting propensity. Proc. R. Soc B. 287, 20200657. doi: 10.1098/rspb.2020.0657
Bird M. I., Taylor D., Hunt C. (2005). Palaeoenvironments of insular south East Asia during the last glacial period: A savanna corridor in sundaland. Quat. Sci. Rev. 24, 2228–2242. doi: 10.1016/j.quascirev.2005.04.004
Bleck R., Rooth C., Hu D., Smith L. T. (1992). Salinity-driven thermocline transients in a wind-and thermohaline-forced isopycnic coordinate model of the north Atlantic. J. Phys. Oceanogr. 22, 1486–1505. doi: 10.1175/1520-0485(1992)022<1486:SDTTIA>2.0.CO;2
Bohonak A. J. (2002). IBD (Isolation by distance): A program for analyses of isolation by distance. J. Hered. 93, 153–154. doi: 10.1093/jhered/93.2.153
Briggs J. C. (1999). Coincident biogeographic patterns: Indo-West Pacific Ocean. Evolution. 53, 326–335. doi: 10.1111/j.1558-5646.1999.tb03769.x
Chan S. W., Cheang C. C., Chirapart A., Gerung G., Tharith C., Ang P. (2013). Homogeneous population of the brown alga Sargassum polycystum in Southeast Asia: Possible role of recent expansion and asexual propagation. PloS One 8, e77662. doi: 10.1371/journal.pone.0077662
Chan S. W., Cheang C. C., Yeung C. W., Chirapart A., Gerung G., Ang P. (2014). Recent expansion led to the lack of genetic structure of Sargassum aquifolium populations in southeast Asia. Mar. Biol. 161, 785–795. doi: 10.1007/s00227-013-2377-3
Chan B. K. K., Tsao Y. F., Wangkulangkul K., Amjud K., Sukparangsi W. (2022). Biogeography and biodiversity of the intertidal barnacle Tetraclita species in the gulf of Thailand and Andaman Sea – influences of oceanographic currents and pleistocene glaciations. Front. Mar. Sci. 8. doi: 10.3389/fmars.2021.774041
Cheang C. C., Tsang L. M., Ng W. C., Williams G. A., Chu K. H., Chan B. K. K. (2012). Phylogeography of the cold-water barnacle Chthamalus challengeri in the north-western pacific: Effect of past population expansion and contemporary gene flow. J. Biogeogr. 39, 1819–1835. doi: 10.1111/j.1365-2699.2012.02742.x
Cornuet J. M., Pudlo P., Veyssier J., Dehne-Garcia A., Gautier M., Leblois R., et al. (2014). DIYABC v2.0: A software to make approximate Bayesian computation inferences about population history using single nucleotide polymorphism, DNA sequence and microsatellite data. Bioinformatics. 30, 1187–1189. doi: 10.1093/bioinformatics/btt763
Cornuet J. M., Santos F., Beaumont M. A., Robert C. P., Marin J. M., Balding D. J., et al. (2008). Inferring population history with DIYABC: A user-friendly approach to approximate Bayesian computation. Bioinformatics. 24, 2713–2719. doi: 10.1093/bioinformatics/btn514
Cowen R. K., Sponaugle S. (2009). Larval dispersal and marine population connectivity. Annu. Rev. Mar. Sci. 1, 443–466. doi: 10.1146/annurev.marine.010908.163757
De Vries P., Döös K. (2001). Calculating Lagrangian trajectories using time-dependent velocity fields. J. Atmos. Ocean. Tech. 18, 1092–1101. doi: 10.1175/1520-0426(2001)018<1092:CLTUTD>2.0.CO;2
Döös K. (1995). Interocean exchange of water masses. J. Geophys. Res. 100, 13499–13514. doi: 10.1029/95JC00337
Draisma S. G. A., Ballesteros E., Rousseau F., Thibaut T. (2010). DNA Sequence data demonstrate the polyphyly of the genus Cystoseira and other sargassaceae genera (Phaeophyceae). J. Phycol. 46, 1329–1345. doi: 10.1111/j.1529-8817.2010.00891.x
Earl D. A., von Holdt B. M. (2012). STRUCTURE HARVESTER: A website and program for visualizing STRUCTURE output and implementing the evanno method. Conserv. Genet. Resour. 4, 359–361. doi: 10.1007/s12686-011-9548-7
Evanno G., Regnaut S., Goudet J. (2005). Detecting the number of clusters of individuals using the software STRUCTURE: A simulation study. Mol. Ecol. 14, 2611–2620. doi: 10.1111/j.1365-294X.2005.02553.x
Excoffier L., Lischer H. E. L. (2010). Arlequin suite ver 3.5: A new series of programs to perform population genetics analyses under Linux and windows. Mol. Ecol. Res. 10, 564–567. doi: 10.1111/j.1755-0998.2010.02847.x
Fang G. H., Susanto D., Soesilo I., Zheng Q. A., Li Q. F., Xun W. Z. (2005). A note on the south China Sea shallow interocean circulation. Adv. Atmo. Sci. 22, 946–954. doi: 10.1007/BF02918693
Fang G. H., Wang Y. G., Wei Z. X., Fang Y., Qiao F. L., Hu X. M. (2009). Interocean circulation and heat and freshwater budgets of the south China Sea based on a numerical model. Dynam. Atmos. Oceans. 47, 55–72. doi: 10.1016/j.dynatmoce.2008.09.003
Fang G. H., Wei Z. X., Wang Y. G., Chen H. Y., Wang X. Y. (2004). An extended variable-grid global ocean circulation model and its preliminary results of the equatorial pacific circulation. Acta Oceanol. Sin. 23, 23–39. doi: 10.1029/2003JC001866
Galindo H. M., Olson D. B., Palumbi S. R. (2006). Seascape genetics: a coupled oceanographic-genetic model predicts population structure of Caribbean corals. Curr. Biol. 16, 1622–1626. doi: 10.1016/j.cub.2006.06.052
Guindon S., Gascuel O. (2003). A simple, fast and accurate algorithm to estimate large phylogenies by maximum likelihood. Syst. Biol. 52, 696–704. doi: 10.1080/10635150390235520
Guzinski J., Ballenghien M., Daguin-Thiébaut C., Lévêque L., Viard F. (2018). Population genomics of the introduced and cultivated pacific kelp Undaria pinnatifida: Marinas-not farms-drive regional connectivity and establishment in natural rocky reefs. Evol. Appl. 11, 1582–1597. doi: 10.1111/eva.12647
Hall T. A. (1999). BioEdit: a user-friendly biological sequence alignment editor and analysis program for windows 95/98/NT. Nucl. Acids Symp. Ser. 41, 95–98. doi: 10.1021/bk-1999-0734.ch008
He L., Zhang A., Zhu C., Weese D., Qia Z. (2011). Phylogeography of the mud crab (Scylla serrata) in the indo-West pacific reappraised from mitochondrial molecular and oceanographic clues: Transoceanic dispersal and coastal sequential colonization. Mar. Ecol. 32, 52–64. doi: 10.1111/j.1439-0485.2010.00406.x
Hubisz M. J., Falush D., Stephens M., Pritchard J. K. (2009). Inferring weak population structure with the assistance of sample group information. Mol. Ecol. Res. 9, 1322–1332. doi: 10.1111/j.1755-0998.2009.02591.x
Hu Z. M., Kantachumpoo A., Liu R. Y., Sun Z. M., Yao J. T., Komatsu T. (2018). A late pleistocene marine glacial refugium in the Southwest of Hainan Island, China: Phylogeographical insights from the brown alga Sargassum polycystum. J. Biogeogr. 45, 355–366. doi: 10.1111/jbi.13130
Hu Z. M., Uwai S., Yu S. H., Komatsu T., Duan D. L. (2011). Phylogeographic heterogeneity of the brown macroalga Sargassum horneri (Fucaceae) in the northwestern pacific in relation to late pleistocene glaciation and tectonic configurations. Mol. Ecol. 20, 3894–3909. doi: 10.1111/j.1365-294X.2011.05220.x
Jakobsson M., Rosenberg N. A. (2007). CLUMPP: A cluster matching and permutation program for dealing with label switching and multimodality in analysis of population structure. Bioinformatics. 23, 1802–1806. doi: 10.1093/bioinformatics/btm233
Kantachumpoo A., Uwai S., Noiraksar T., Komatsu T. (2014). Levels and distribution patterns of mitochondrial cox3 gene variation in brown seaweed, Sargassum polycystum c. agardh (Fucales, phaeophyceae) from southeast Asia. J. Appl. Phycol. 26, 1301–1308. doi: 10.1007/s10811-013-0175-4
Kendrick G. A., Walker D. I. (1995). Dispersal of propagules of Sargassum spp. (Sargassaceae, phaeophyta): Observations of local patterns of dispersal and consequences for recruitment and population structure. J. Exper. Mar. Biol. Ecol. 192, 273–288. doi: 10.1016/0022-0981(95)00076-4
Komatsu T., Tatsukawa K., Filippi J. B., Sagawa T., Matsunaga D., Mikami A., et al. (2007). Distribution of drifting seaweeds in eastern East China Sea. J. Mar. Syst. 67, 245–252. doi: 10.1007/s10811-007-9302-4
Kumar S., Stecher G., Tamura K. (2016). MEGA7: Molecular evolutionary genetics analysis version 7.0 for bigger datasets. Mol. Biol. Evol. 33, 1870–1874. doi: 10.1093/molbev/msw054
Lane C. E., Lindstrom S. C., Saunders G. W. (2007). A molecular assessment of northeast pacific Alaria species (Laminariales, phaeophyceae) with reference to the utility of DNA barcoding. Mol. Phylogenet. Evol. 44, 634–648. doi: 10.1016/j.ympev.2007.03.016
Le Cam S., Daguin-Thiébaut C., Bouchemousse S., Engelen A. H., Mieszkowska N., Viard F. (2020). A genome-wide investigation of the worldwide invader Sargassum muticum shows high success albeit (almost) no genetic diversity. Evol. Appl. 13, 500–514. doi: 10.1111/eva.12837
Leliaert F., Payo D. A., Gurgel C. F. D., Schils T., Draisma S. G. A., Saunders G. W., et al. (2018). Patterns and drivers of species diversity in the Indo-Pacific red seaweed Portieria. J. Biogeogr. 45, 2299–2313. doi: 10.1111/jbi.13410
Li J. J., Hu Z. M., Gao X., Sun Z. M., Choi H. G., Duan D. L., et al. (2017a). Oceanic currents drove population genetic connectivity of the brown alga Sargassum thunbergii in the north-west pacific. J. Biogeogr. 44, 230–242. doi: 10.1111/jbi.12856
Li J. J., Hu Z. M., Sun Z. M., Yao J. T., Liu F. L., Fresia P., et al. (2017b). Historical isolation and contemporary gene flow drive population diversity of the brown alga Sargassum thunbergii along the coast of China. BMC Evol. Biol. 17, 246. doi: 10.1186/s12862-017-1089-6
Li J., Yang Y., Chen Q., Fang L., He Z., Guo W., et al. (2016). Pronounced genetic differentiation and recent secondary contact in the mangrove tree Lumnitzera racemosa revealed by population genomic analyses. Sci. Rep. 6, 29486. doi: 10.1038/srep29486
Maggs C. A., Castilho R., Foltz D., Henzler C., Jolly M. T., Kelly J., et al. (2008). Evaluating signatures of glacial refugia for North Atlantic benthic marine taxa. Ecology 89, S108–S122. doi: 10.1890/08-0257.1
Mizuno S., Ajisaka T., Lahbib S., Kokubu Y., Komatsu T. (2014). Spatial distributions of floating seaweeds in the East China Sea from late winter to early spring. J. Appl. Phycol. 26, 1159–1167. doi: 10.1007/s10811-013-0139-8
Nakajima Y., Matsuki Y., Lian C. L., Fortes M. D., Uy W. H., Campos W. L., et al. (2014). The kuroshio current influences genetic diversity and population genetic structure of a tropical seagrass, Enhalusa coroides. Mol. Ecol. 23, 6029–6044. doi: 10.1111/mec.12996
Pawlowicz R. (2020) M_Map: A mapping package for MATLAB, version 1.4m. [Computer software]. Available at: www.eoas.ubc.ca/~rich/map.html.
Pelejero C., Kienast M., Wang L., Grimalt J. O. (1999). The flooding of sundaland during the last deglaciation: Imprints in hemipelagic sediments from the southern south China Sea. Earth Planet. Sci. Lett. 171, 661–671. doi: 10.1016/S0012-821X(99)00178-8
Posada D., Crandall K. A. (1998). Modeltest: Testing the model of DNA substitution. Bioinformatics. 14, 817–818. doi: 10.1093/bioinformatics/14.9.817
Pritchard J., Stephens M., Rosenberg N., Donnelly P. (2000). Association mapping in structured populations. Am. J. Hum. Genet. 67, 170–181. doi: 10.1086/302959
Provan J., Bennett K. D. (2008). Phylogeographic insights into cryptic glacial refugia. Trends Ecol. Evol. 23, 564–571. doi: 10.1016/j.tree.2008.06.010
Ronquist F., Huelsenbeck J. P. (2001). MrBAYES: Bayesian inference of phylogeny. Bioinformatics. 8, 754–755. doi: 10.1093/bioinformatics/17.8.754
Rosenberg N. (2004). DISTRUCT: A program for the graphical display of population structure. Mol. Ecol. Notes. 4, 137–138. doi: 10.1046/j.1471-8286.2003.00566.x
Rozas J., Ferrer-Mata A., Sánchez-DelBarrio J. C., Sara G. R., Pablo L., Ramos-Onsins S. E., et al. (2017). DnaSP 6: DNA sequence polymorphism analysis of large data sets. Mol. Biol. Evol. 34, 3299–3302. doi: 10.1093/molbev/msx248
Su J. L. (2001). A review of circulation dynamics of the coastal oceans near China. Acta Oceanol. Sin. 23, 21–25. doi: 10.3321/j.issn:0253-4193.2001.04.001
Thoppil P. G., Richman J. G., Hogan P. J. (2011). Energetics of a global ocean circulation model compared to observations. Geophys. Res. Lett. 38, L15607. doi: 10.1029/2011GL048347
Tittensor D. P., Mora C., Jetz W., Lotze H. K., Ricard D., Berghe E. V., et al. (2010). Global patterns and predictors of marine biodiversity across taxa. Nature 466, 1098–1101. doi: 10.1038/nature09329
Tsang L. M., Wu T. H., Shih H. T., Williams G. A., Chu K. H., Chan B. K. (2012). Genetic and morphological differentiation of the Indo-West Pacific intertidal barnacle Chthamalus malayensis. Integr. Comp. Biol. 52, 388. doi: 10.1093/icb/ics044
Voris H. K. (2000). Maps of pleistocene Sea levels in Southeast Asia: shorelines, river systems and time durations. J. Biogeogr. 27, 1153–1167. doi: 10.1046/j.1365-2699.2000.00489.x
Wang P. (1999). Response of Western pacific marginal seas to glacial cycles: Paleoceanographic and sedimentological features. Mar. Geol. 156, 5–39. doi: 10.1016/S0025-3227(98)00172-8
Wang J., Ganmanee M., Shau-Hwai A. T., Mujahid A., Yun W. (2016). Pleistocene events and present environmental factors have shaped the phylogeography of the intertidal limpet Cellana toreuma (Reeve 1855) (Gastropoda: Nacellidae) in Southeast Asia and China. J. Mollus. Stud. 82, 378–390. doi: 10.1093/mollus/eyv071
Wong C. L., Ng W. S., Phang S. M. (2008). Taxonomic notes on Sargassum species (Sargassaceae, phaeophyta) from Malaysia. Kuala Lumpur: Institute of ocean and earth science (IOES). Phycologia. 2, 105–131. doi: 10.2216/11-125.1
Zhang X., Ge lin U., Spicer R. A., Wu F. X., Farnsworth A., Chen P. R., et al. (2022). Rapid Eocene diversification of spiny plants in subtropical woodlands of central Tibet. Nat. Commun. 13, 3787–3796. doi: 10.1038/s41467-022-31512-z
Keywords: Sargassum polycystum, phylogeographic structure, ocean current, Lagrangian particle simulation, colonization route, Indo-Pacific convergence region
Citation: Liang Y, Zhang S, Yan C, Draisma SGA, Kantachumpoo A, Li Z, Lin Y, Zhu J, Zhang J and Duan D (2022) Influence of Indo-Pacific ocean currents on the distribution and demographic patterns of the brown seaweed Sargassum polycystum in tropical east Asia. Front. Mar. Sci. 9:895554. doi: 10.3389/fmars.2022.895554
Received: 14 March 2022; Accepted: 14 July 2022;
Published: 11 August 2022.
Edited by:
Fernando P. Lima, Centro de Investigacao em Biodiversidade e Recursos Geneticos (CIBIO-InBIO), PortugalReviewed by:
Anna Maria Addamo, Joint Research Centre (JRC), ItalyCopyright © 2022 Liang, Zhang, Yan, Draisma, Kantachumpoo, Li, Lin, Zhu, Zhang and Duan. This is an open-access article distributed under the terms of the Creative Commons Attribution License (CC BY). The use, distribution or reproduction in other forums is permitted, provided the original author(s) and the copyright owner(s) are credited and that the original publication in this journal is cited, in accordance with accepted academic practice. No use, distribution or reproduction is permitted which does not comply with these terms.
*Correspondence: Delin Duan, ZGxkdWFuQHFkaW8uYWMuY24=; Jie Zhang, emhhbmdqaWUwNjE2QDEyNi5jb20=
†These authors have contributed equally to this work and share first authorship
Disclaimer: All claims expressed in this article are solely those of the authors and do not necessarily represent those of their affiliated organizations, or those of the publisher, the editors and the reviewers. Any product that may be evaluated in this article or claim that may be made by its manufacturer is not guaranteed or endorsed by the publisher.
Research integrity at Frontiers
Learn more about the work of our research integrity team to safeguard the quality of each article we publish.