 Xiangyun Hou
 Shuyang Ma
 Yongjun Tian
 Shaoqing Zhang3,4
- 1Frontiers Science Center for Deep Ocean Multispheres and Earth System and Key Laboratory of Mariculture, Ministry of Education, Ocean University of China, Qingdao, China
- 2Laboratory for Marine Fisheries Science and Food Production Processes, Pilot National Laboratory for Marine Science and Technology (Qingdao), Qingdao, China
- 3Frontiers Science Center for Deep Ocean Multispheres and Earth System and Key Laboratory of Physical Oceanography, Institute for Advanced Ocean Study, The College of Ocean and Atmosphere, Ocean University of China, Qingdao, China
- 4Functional Laboratory for Ocean Dynamical Processes and Climate, Pilot National Laboratory for Marine Science and Technology (Qingdao), Qingdao, China
Skipjack tuna (Katsuwonus pelamis, SKJ), a widely distributed and highly migratory pelagic fish, dominates the global tuna catch, especially in the Pacific Ocean, with nearly 70% of world catch. Studies have reported that SKJ in the tropical Pacific was strongly associated with Niño-Southern Oscillations, while the relationship between SKJ in the Northwest Pacific (NWP, the second-contributed statistical area of SKJ Pacific catch) and climate variability has not yet been well understood. Considering the teleconnection between western Pacific and Atlantic Ocean, this study investigates the potential relationship between the relative abundance CPUE (Catch Per Unit Effort) of SKJ and climate indices including trans-basin and basin signals at different spatial-temporal scales in the NWP during 1972–2019 using Convergent Cross Mapping (CCM) and Threshold Generalized Additive Model (TGAM) techniques. Results show the Atlantic Multidecadal Oscillation (AMO) plays a causal role in the temporal SKJ variations with an optimal lag at 15 months, while further analysis preliminarily reveals sea surface temperature acts as a vital medium in the relationship through teleconnection. The AMO effected SKJ processes are nonstationary over the study time, of which the transition years occurred in the early 1990s (around 1991/92). Providing an unprecedented insight into climate variability effect on SKJ in the NWP, this study has essential implications and reference for predicting and managing SKJ fishery through incorporating the climate index in estimating the SKJ abundance in advance, and for the connection between large-migrating species and tans-basin climatic variation.
1 Introduction
Tunas are important in ecological meaning and are highly commercial for being an upper predator distributed extensively in the ocean. Studies have found that population dynamics of tunas were involved with climate variability, which was shown in aspects of the recruitment variability, fishing ground distribution, and catch fluctuations (Sugimoto et al., 2001; Lima & Naya, 2011; Carlos Baez et al., 2020; Wu et al., 2020a), and could be well described by large-scale climate patterns, such as the ENSO (El Niño-Southern Oscillation), IOD (Indian Ocean Dipole), and AMO (Atlantic Multi-decadal Oscillation) (Lehodey et al., 1997; Lan et al., 2013; Faillettaz et al., 2019).
Skipjack tuna (Katsuwonus pelamis, hereinafter as SKJ), has been the most productive tuna fishery species worldwide. Its catch ranked third among the ten marine capture species for the ninth consecutive year in 2017 (FAO, 2020). SKJ catch in the Pacific (nearly 0.9 million tons per year) has contributed to more than 70% of global SKJ catch since 1950. This can be attributed to its shorter life cycle with the first mature length (about 45 cm) and wider habitats from temperate to equatorial areas than other tunas (Collette & Nauen, 1983). Up to date, the maximum reported SKJ age was 12 years (Collette & Nauen, 1983). Studies involved with stock assessment and tagging surveys typically assume that SKJ forms a single stock in the Pacific Ocean with long-distance movement, which is characterized by migrating from west to east along the equator and migrating across the equator longitudinally (Kiyofuji et al., 2019; Ashida, 2020; Moore et al., 2020). Despite this, Ashida (2020) found that the first mature time, spawning mode, and fecundity of SKJ varied between the tropical Pacific Ocean and the extratropical waters.
The first response of SKJ to climate oscillations was verified in the western tropical Pacific (the highest production area among the Pacific (Figure S1, FAO online data), which supported the prediction of SKJ fishery two months in advance through ENSO index (Lehodey et al., 1997). By contrast, whether SKJ in the Northwest Pacific (hereinafter as NWP), the major contributor in the extratropical Pacific and the second contributor in the whole Pacific from 1950 to 2000 (Figure S1, FAO online data), is linked with climate variability remains unclear. SKJ in the NWP comprises individuals with various migration patterns evidenced through parasite identification (Takano et al., 2021). Based on the tagging experiments, SKJ in the NWP mainly comprises three groups: the first group that the North Pacific Gyre Oscillation (NPGO) or Pacific Decadal Oscillation (PDO) might influence as it migrated from the northeast Pacific, the second group whose parents linked with ENSO, mainly comprised small-size SKJ individuals traveled from the western tropical Pacific (Lehodey et al., 1997; Arai et al., 2005; Moore et al., 2020), and the third group who spawns at the offshore area of the Nansei Islands, Japan and makes a northward seasonal migration across Kuroshio Current in the NWP (defined as a local group too) (Kiyofuji et al., 2019; Tawa et al., 2020) (Figure 1). Previous studies showed that the effects of basin-scale climate variability on fisheries varied largely in the NWP. For example, the suitable habitat of neon flying squid extended southward with increasing abundance during La Niña events, whereas albacore tuna Catch Per Unit Effort (CPUE). is lower (Mukti & Saitoh, 2004; Yu et al., 2019). In contrast, Japanese anchovy was positively related to PDO on a centurial scale through sea surface temperature (SST) (Zhou et al., 2015). Notably, recent research discovered the trans-basin interaction between the Pacific and Atlantic Oceans (Enfield et al., 2001; Zhang & Delworth, 2007), and the AMO plays a vital role in the natural variability of the western Pacific (Sun et al., 2017; Sun et al., 2020; Sun et al., 2021), especially on the NWP through the North Pacific subtropical mode water (Wu et al., 2020b). In this sense, whether one or multiply long-term climate oscillations could be a proxy for controlling the SKJ fluctuation in the NWP is to be concerned and is of great economic importance for adopting pre-emptive management rules to keep the sustainable development of the SKJ fishery.
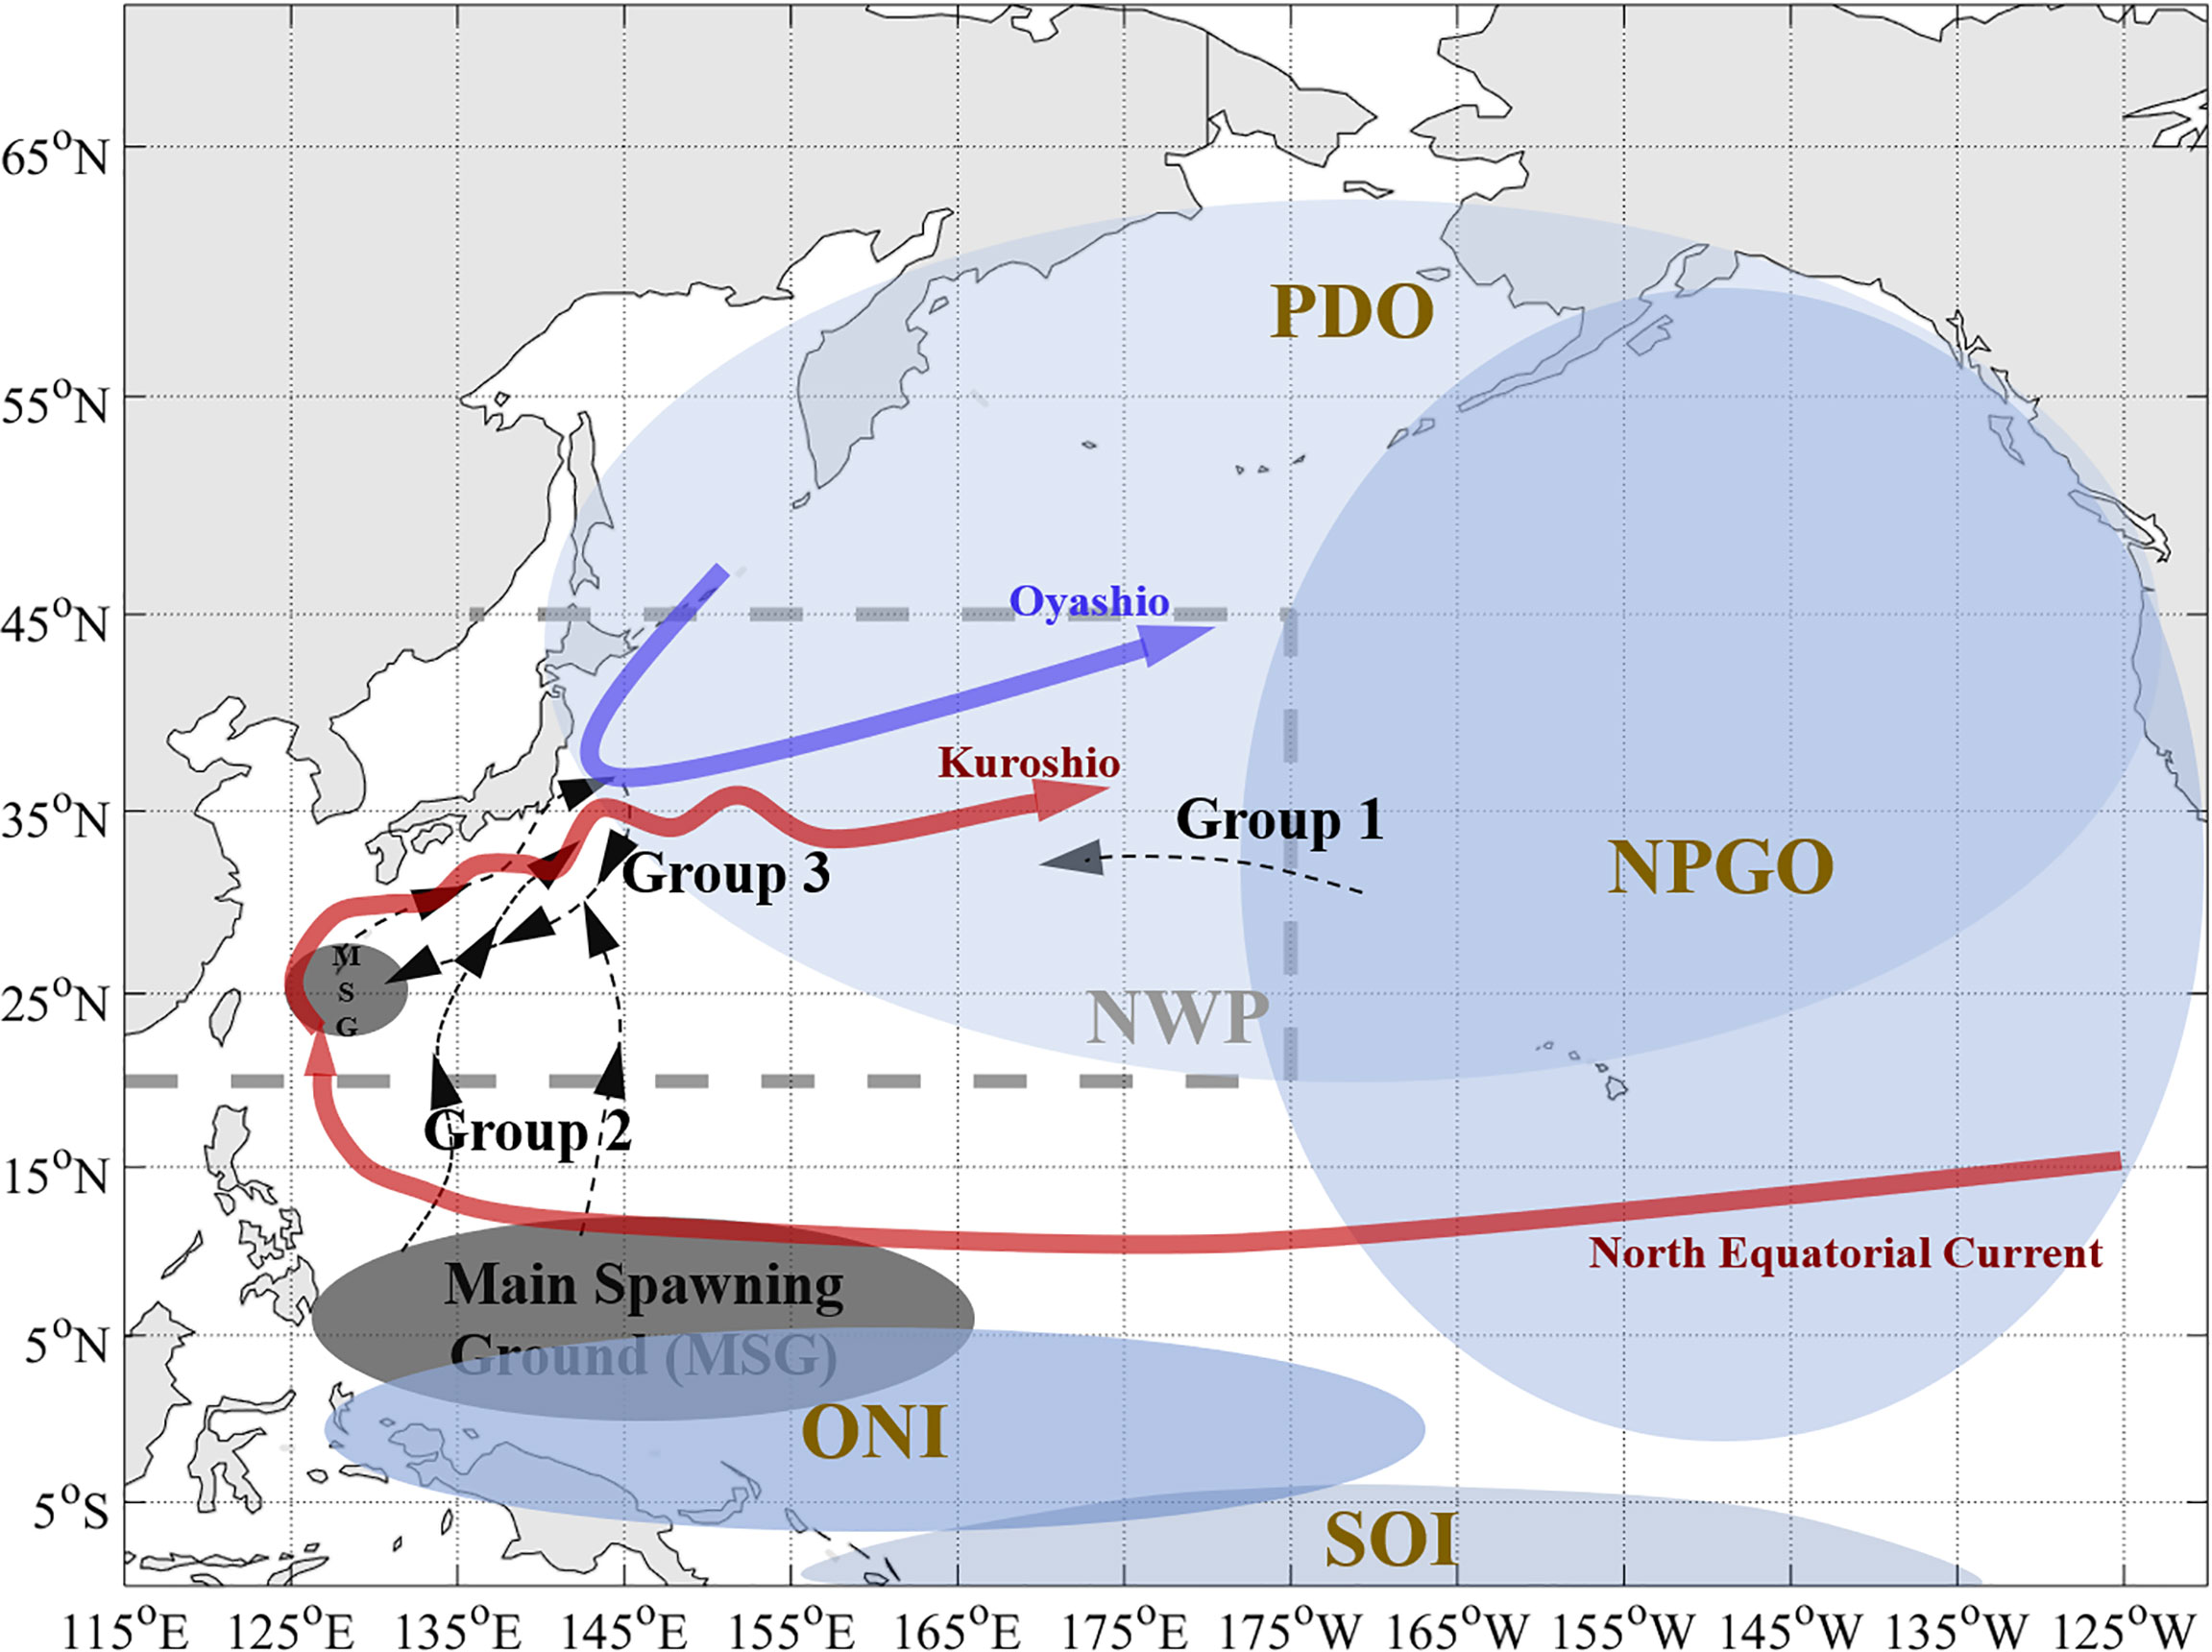
Figure 1 Schematic of the study area in the north Pacific with main currents, climate background, and migration routes of skipjack tuna inside. The study area (Northwest Pacific, NWP) is surrounded by the grey-dotted lines and the mainland coast of countries, including China, Korea, South Korea, Japan, and Russia. Blue ellipses show the defined scope of climate indices with different brightness. The main spawning grounds (MSG) of SKJ in the western Pacific and potential migration routes of three groups of skipjack tuna in the NWP are indicated with black arrow lines and grey ellipses, respectively (Arai et al., 2005; Kiyofuji et al., 2019; Tawa et al., 2020; Moore et al., 2020). The paths of Kuroshio Current with its origin (North Equatorial Current) and extension and Oyashio Current are shown by red and dark blue arrow lines, respectively.
Many studies found that the tuna response to climatic regime shifts was “seesaw”-like. Such as, yellowfin tuna in the western Indian Ocean was in phase with the Dipole Modular Index during negative IOD phases, and vice versa (Lan et al., 2013).The suitable habitat of Atlantic bluefin tuna in the North Atlantic Ocean was controlled by an opposite pattern in the zonal direction during different AMO phases (Faillettaz et al., 2019). Indeed, the modulation of climate oscillations would be more complex and uncertain with longer time, especially for the upper predator on the ecosystem, such as tunas on a decadal scale. Ménard et al. (2007) reported that yellowfin tuna and bigeye tuna were intermittently linked with the Indian Oscillation Index at decadal scales (from 1955 to 2003). Therefore, the relationship between climate indices and tuna is probably time-dependent or phase-dependent rest on the regime shift point of the climate index. Recent studies supported that Threshold Generalized Additive Model (TGAM) performs well in identifying the change point of a relationship by fitting two functions for different periods (Puerta et al., 2019; Ma et al., 2020; Ma et al., 2021), which can be used to understand whether the SKJ-climate relationship in the NWP is nonstationary and determine the regime-shift point as well.
Correlation analysis is frequently used in the ecological study to couple with environment, while the correlation does not imply causation because of the joint driving factor between two variables. Moreover, a mirage correlation that is characterized by a weak or an intermittent correlation across the long time series could hide the real causation signal (Sugihara et al., 2012; Chang et al., 2017). Sugihara et al. (2012) developed a non-parametric method that could distinguish the real cause-effect relationship from the above situations through transforming the time series into low-dimension and nonlinear dynamic systems in the state space, which is called the cross-convergence mapping (CCM). It has been successfully used in fishery oceanography, Doi et al. (2021) revealed that temperature influenced species richness over thousands-year time scales. Nakayama et al. (2018) showed that the population dynamics of anchovy and sardine in the NWP were controlled by the double effect of climate change and interspecies dynamics.Combined with the above considerations, this study applies CCM and TGAM methods to SKJ in the NWP, and the prominent climate patterns that overlap migratory SKJ habitat to identify: a) whether there is a causal connection between SKJ in the NWP and climate variability, especially for the AMO), b) whether the interaction process between climate variability and SKJ is nonstationary on the decadal scale.
2 Materials and Methods
2.1 Study Area
NWP area is referred to as FAO Major Fishing Area 61, which is compassed by the north of 20°N and the west of 175°W across the mainland coast of countries, including China, North Korea, South Korea, Japan, and Russia. Note that SKJ catch in the southwestern corner of FAO Area 61, i.e., west of 115°E and south of 20°N, is excluded in the study as it is near zero and the study area is limited to the south of 45°N of NWP area, considering the distribution of SKJ (Figure 1).
2.2 Fishery Data
Monthly aggregated SKJ catch data using fishery gear types (pole and line, and purse seine) were provided from WCPFC (Western and Central Pacific Fisheries Commission, http://www.wcpfcnt/public-domain, last accessed in November 2020). The primary result of retrieved data for the NWP area showed that pole and line fishery was the main operating gear with its catch nearly six times to the purse seine fishery during 1972–2019. Finally, this study uses the pole and line data with a resolution of 5°, which comprises year, month, catch, effort (operating days), latitude, and longitude. CPUE is assumed to be a common proxy for fish relative abundance. In this study, the CPUE of SKJ is defined as SKJ catch in metric tons per operating day.
2.3 Climatic Data
Five climate indices associated largely with the NWP and SKJ migration (Figure 1), and SST data of the NWP with a resolution of 5°are employed in this study (Table 1). All data were monthly time series with a period of 1972–2019.
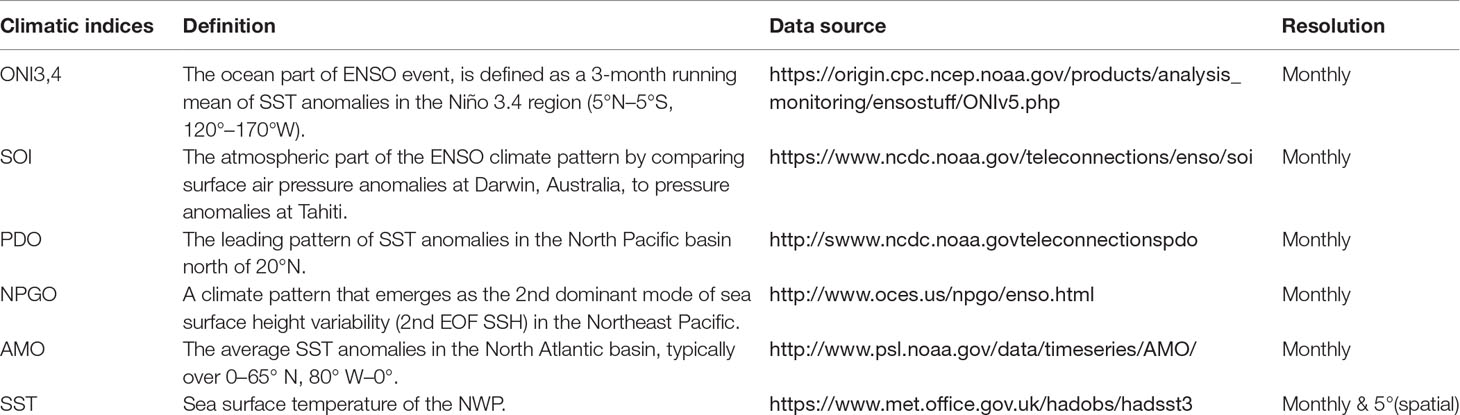
Table 1 The definition and sources of climatic indices.
2.4 Convergent Cross Mapping
Convergent cross mapping (CCM) is an approach that can distinguish causality from mirage correlation in time series from dynamical (i.e., nonlinear) systems, which is nonparametric and rooted on state space reconstruction (Sugihara et al., 2012). The fundamental CCM principle is that the cause time series left its footprints on the effect time series at a state space level. Before applying CCM analysis, CPUEda is created to represent the anomaly fluctuations of SKJ relative abundance by detrending CPUE first and subsequently monthly anomaly of the detrended CPUE. The relationship between CPUEda and climate indices were preliminarily analyzed using the Spearman rank correlation, which provides a measure of a monotonic relationship between two continuous random variables and is useful with non-normal data, the 95% significance level is set on the correlation analysis. Results showed no prominent relationship between climate indices and SKJ existed except for a weak and negative correlation between NPGO and SKJ (Table S1). Here, time series are transformed into a dynamic system of low-dimension and nonlinear to represent its space state before performing CCM by the following steps:
1) Determining the Best Embedding Dimension (E)
Based on Takens’ Theorem, the dynamics of the system can be gotten from the time lags of a single time series. For one time series X of length L, {X}={X1,X2,...,XL} the lagged-coordinate vectors series, { xt }=< Xt,Xt−1τ,Xt−2τ…, Xt−(E−1)τ > (1+(E−1)τ<t<L), are reconstructed as “shadow” attractor manifold MX to be used in CCM (Sugihara et al., 2012). Here, τ is the time lag, E is the embedding dimension (i.e., the number of time-delayed coordinates). Following the simplex projection method (Sugihara & May, 1990), the selection of E was based on leave-one out cross-validation. The best E for each time series was determined from 2 to 10 dimensions according to the prediction skill (here Pearson correlation coefficient (ρ) was used).
2) Identifying Nonlinear Dynamical Systems From Linear Stochastic Systems (θ)
The nonlinearity of time series embedded with the optimal E could be identified using the S-map procedure, which fits local linear maps to describe the dynamics through various weight options (Sugihara, 1994). The nonlinear localization parameter, θ, is defined to determine the degree to which points are weighted when fitting the local linear map. Specifically, when θ> 0, nearby points in the state space receive larger weight, and the local linear map can differ in state-space to accommodate nonlinear behavior, suggestive of nonlinear dynamics. When θ= 0, all points are equally weighted, meaning that the local linear map is identical for various points in the reconstructed state-space. Following (Chang et al., 2017; Tsonis, 2018), if predictability improves with increasing θ (i.e., the best θ > 0), indicating the evidence for nonlinear dynamics; if not (i.e., the best θ = 0), the time series would be first-differenced to extract the nonlinear characteristic further. Here, the first-differenced derivates of NGPO, PDO, and SOI (NPGOfd, PDOfd, and SOIfd) are created based on the posterior results (Figures S3, S4). Finally, CPUEda, AMO, ONI, NPGOfd, PDOfd, and SST are qualified indices with nonlinear dynamics to sequent CCM experiments (Figures S3−S5).
3) Causality Test and Lag-Time Analysis by CCM and Extended CCM
CCM determines causality by generating a cross-mapped estimate of Y(t), denoted by Ŷ(t) | Mx i.e., predicting the current quantity of one variable Myusing the time lags of another variable Mx (Sugihara et al., 2012; Chang et al., 2017). This prediction skill (ρ) is quantified by calculating the Pearson correlation coefficient between the predicted and observed values of Y(t) and is be computed over many random subsamples of the time series to quantify convergence. The parameter library size (L) depended on the sample length (Lmax), and best E+1 (Lmin) represents the subsample size. The significance of the cross-mapping skill is tested using 1000 surrogate time series to simulate null distributions. If there is a causal relationship between X and Y, the cross-mapping plot would be “convergent,” which means that the prediction skill (ρ) enhances and approaches a definite limit with increasing L. Note that the direction of cross-mapping (xmap) is opposite to the direction of the cause-effect, that is, the prediction skill of X xmap Y reached a convergence indicates Y causes X and vice visa.
Extended CCM (ECCM) was developed to determine the optimal delay-lag and distinguish the real unidirectional causal relationship from bidirectional causation through adjusting the cross-map lag time (l) (Ye et al., 2015). The true unidirectional causality means that a negative lag for cross mapping tested in the true causal direction (i.e., the result variable is better at predicting the past values of the causal variable rather than future values) and a positive lag exists tested in the other direction (the causal variable best predicts the future result variable). Based on the posterior results (Figures 4, 8A), a significant and unidirectional causal relationship between CPUEda and AMO and a strong bidirectional relationship between SST and AMO were determined. For CPUEda and AMO, the detailed time lag is further determined using ECCM to understand the potential process better. Considering the maximum SKJ age is 12 years (mentioned earlier), the yearly lag-time was first determined by the time-interval parameter (l = 1 year, lmax = 12), and the accurate monthly lag-time (l = 1 month) was determined over 1000 random libraries (with various seed value) of Library size (Lmax=565). For SST and AMO, ECCM would check whether the direction is truly unidirectional further.The “rEDM” package conducted analyses in this section in R. Details algorithm for this methods can be found in (Sugihara et al., 2012; Ye et al., 2015).
2.5 Generalized Additive Model and Threshold Generalized Additive Model
Generalized additive models (GAM) and threshold generalized additive models (TGAM) were used to determine the relationship type (stationary or non-stationary) between SKJ and the causal climate index (AMO, from the above results). Specifically, a “stationary” relationship is better fitted by a single function throughout the period of the time series and is typically formulated using a GAM (Ciannelli et al., 2004):
where Y is the response variable (the square root of CPUE that conforms to normal distribution), X1 is the predictor (AMO), X2 is the month variable (as a categorical variable), and s, α, and ε are smooth function (with k ≤ 3 to avoid overfitting), intercept, and error terms, respectively.
Different functions better fits a “non-stationary” relationship for different periods, and the responses to drivers have an abrupt change over a threshold year (Litzow et al., 2018), which is formulated using a TGAM (with specific to two time periods) (Puerta et al., 2019):
where y is the threshold year that separates two periods with varying responses to drivers, set as between the 0.1 lower and the 0.9 upper quantiles of the time series at a month scale, the designations of X1, X2, and Y are the same as them in the GAM. The nonstationary optimization model is selected by minimizing the model’s generalized cross-validation score (GCV) (Casini et al., 2009). The superior model was selected and further conducted based on the minimum Akaike information criterion (AIC). The analyses in this section were conducted using “mgcv” package in R.Analyses flow is shown in Figure 2.
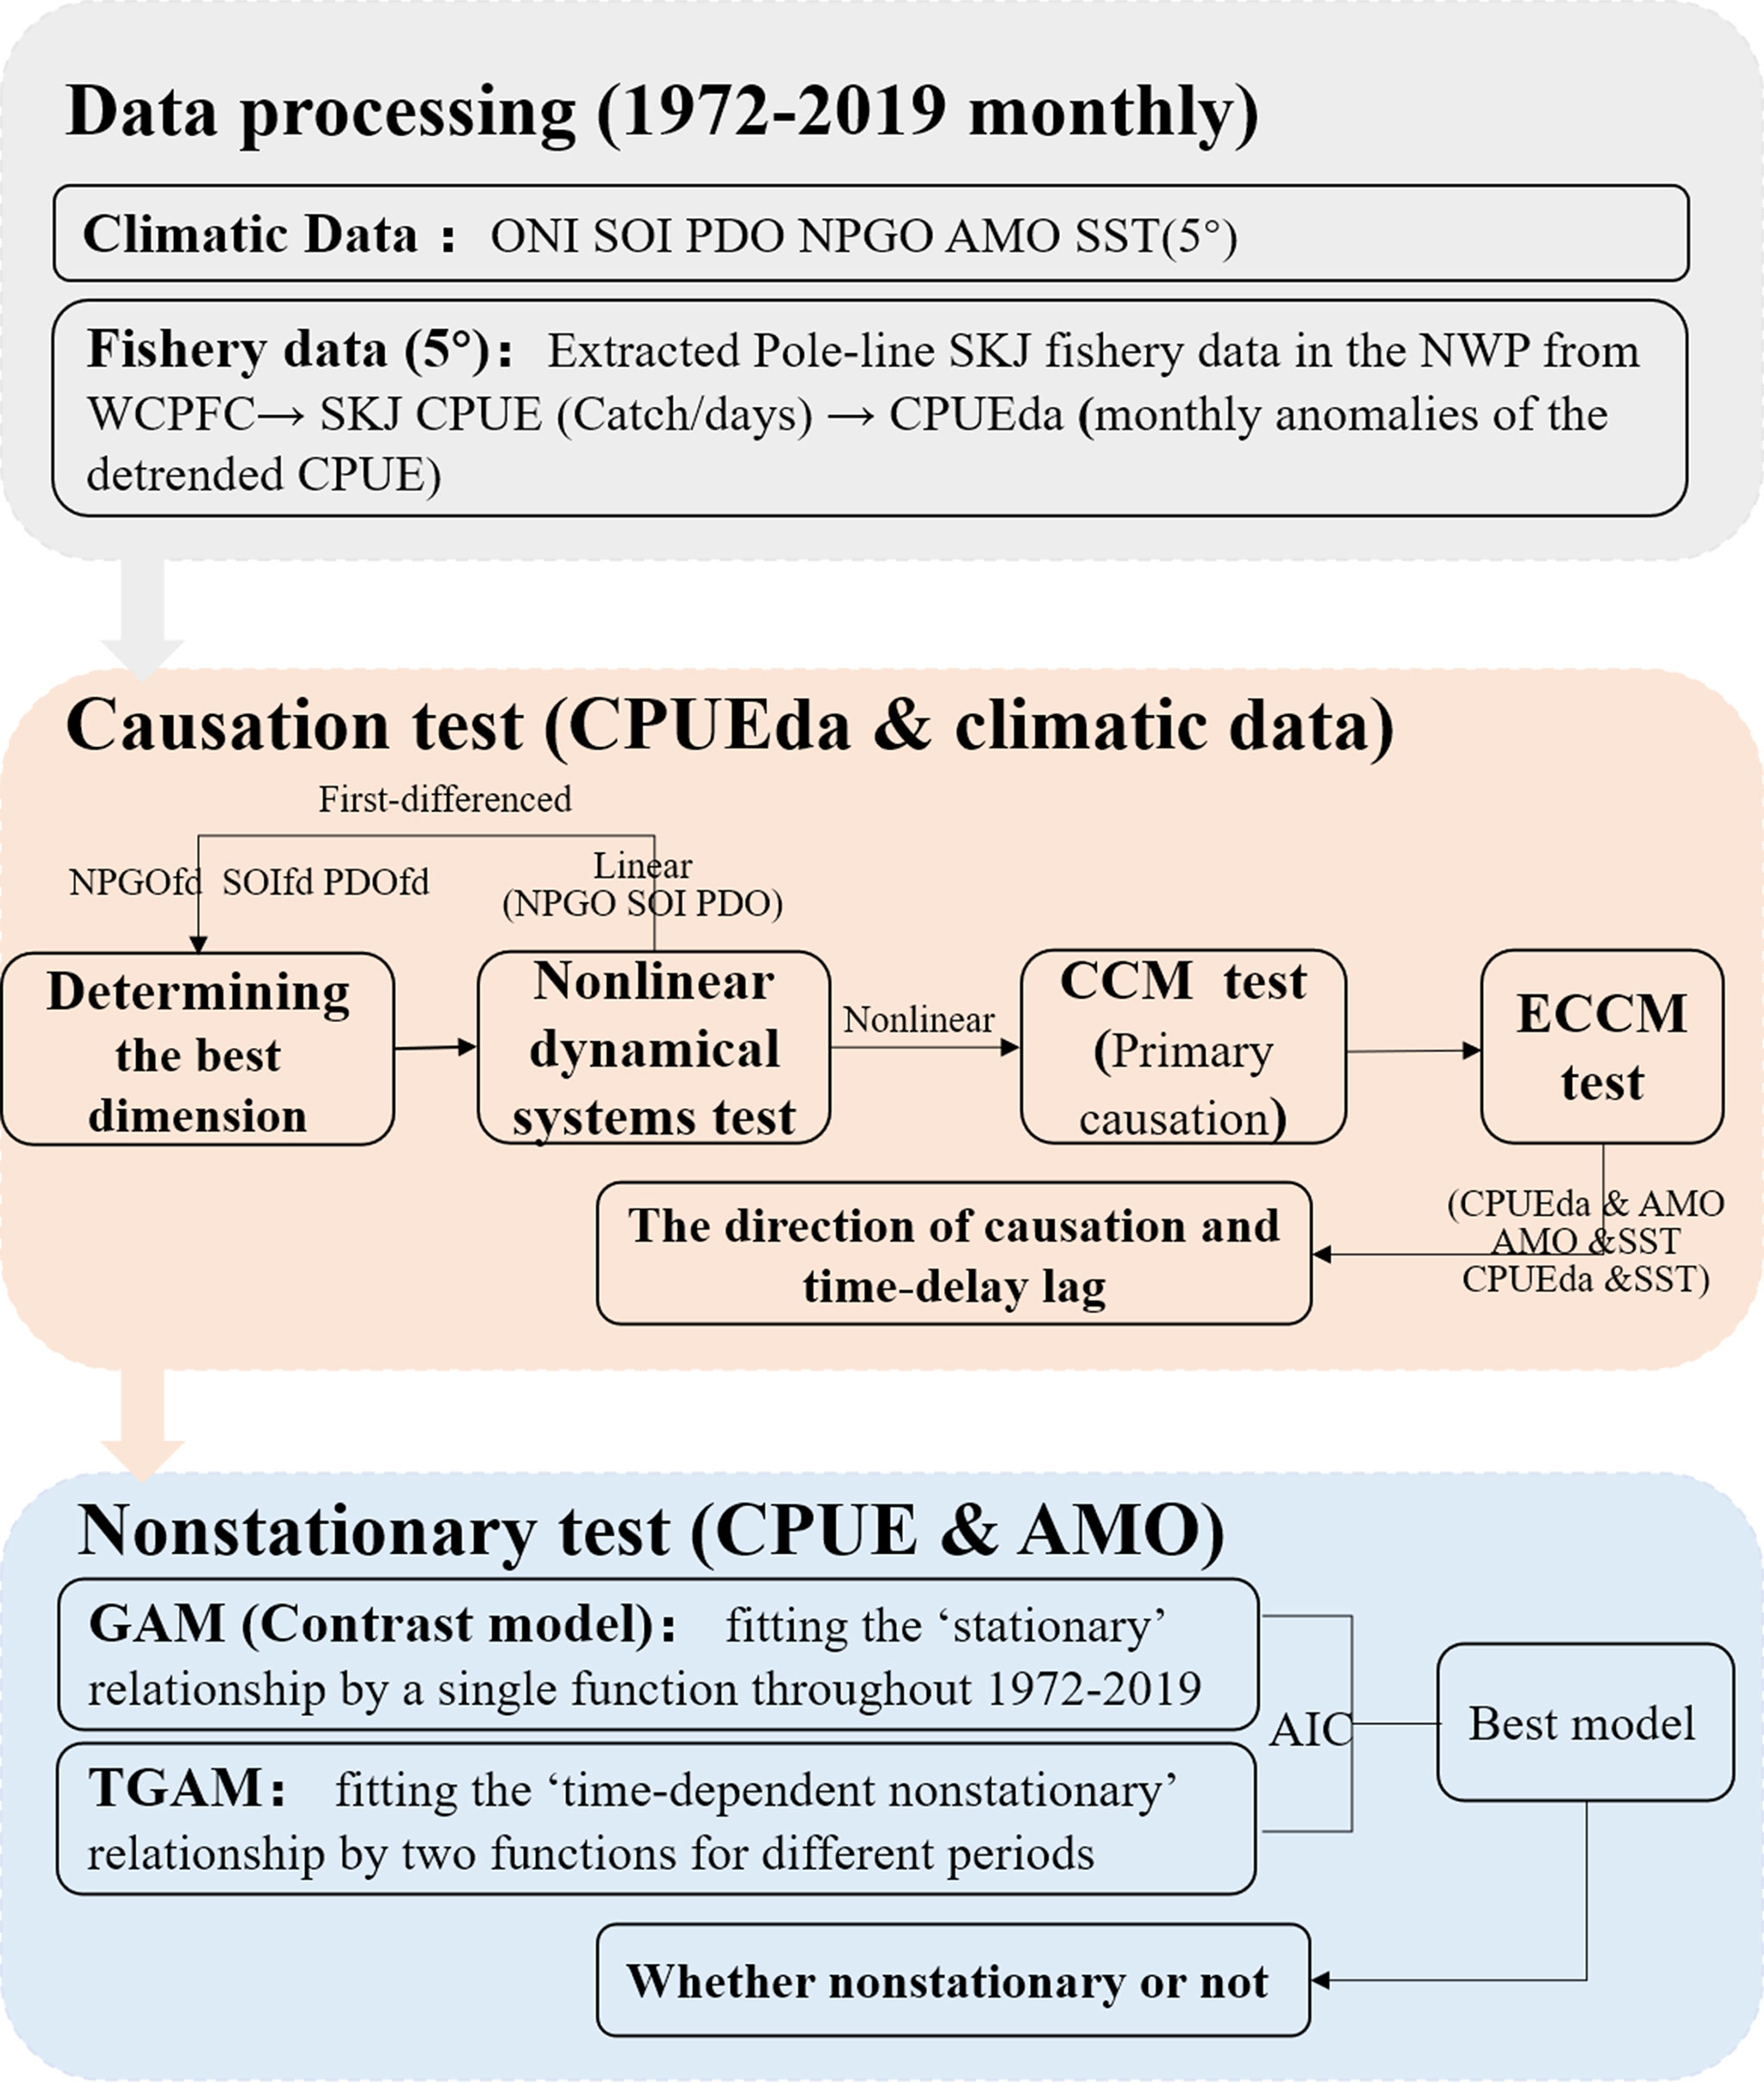
Figure 2 Flow chart of the statistical methods conducted in this study.
3 Results
3.1 Temporal and Spatial Variations in CPUE and Catch of SKJ
The fluctuations of SKJ catch present earlier increase and later decrease in trend during 1972–2019: An increasing trend was determined from 1972 to 1984 with the highest catch (151,649-mt) occurring in 1984; a relative stable segment during 1985–2005 is characterized by a slight decline; at last, an obvious declining trajectory appeared since 2006, where the lowest catch (25,267-mt) occurred in 2014. (Figure 3A). The CPUE of SKJ fluctuates with a rising trend over the study period at the decadal scale. It remains a line before the 1980s, but increases sharply in the mid-1990s, reaching the first peak (5.61-mt/day) in 1993 and gently fluctuating during 1994–2014, then the maximum peak (5.84-mt/day) occurred in 2015. (Figure 3A).
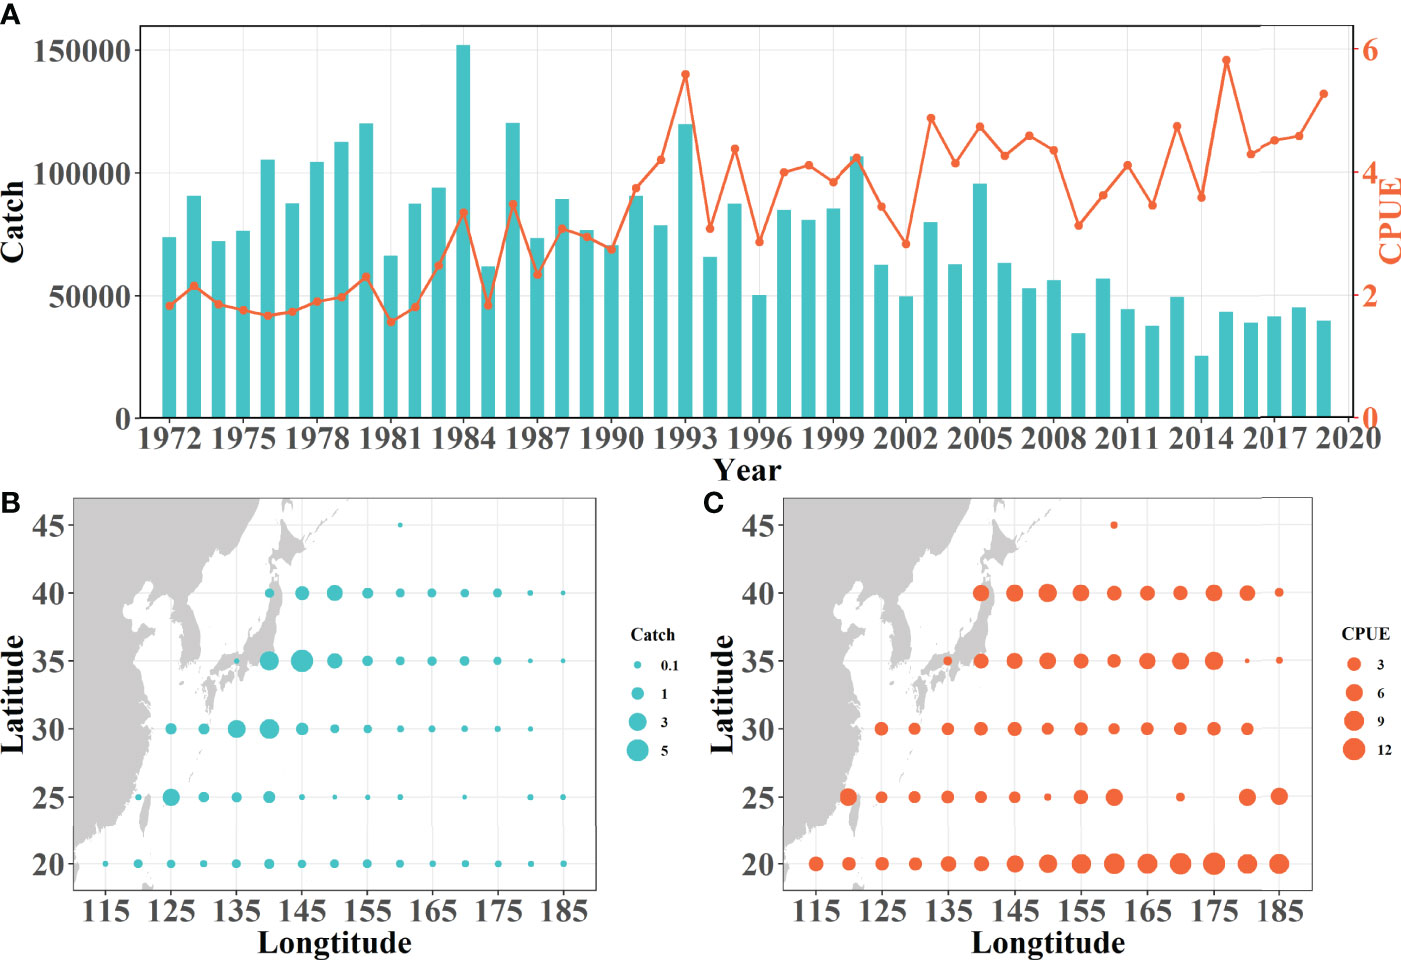
Figure 3 Characteristics of temporal variations and spatial distributions of skipjack tuna in the study area during 1972–2019. (A) Timeseries variations of skipjack catch (blue lake bar) and CPUE (bright orange line). (B) Spatial distribution of skipjack accumulative catches (million metric tons). (C) Spatial distribution of skipjack mean CPUE (metric tons per day).
The high-catch areas distribute along the western boundary of the NWP, which overlaps the path of the Kuroshio Current fitly. Among these, the biggest patchy area of high catch is near the mixed area between Kuroshio Current front and Oyashio Current (Figure 3B). By contrast, the spatial distribution of SKJ CPUE is characterized by many meridional strips, where two intensified trips of CPUE are located at the most northern area (along 35°–40° N) and the southeast corner (150°E across on the 20°N), respectively (Figure 3C).
3.2 Causal Relationships Between SKJ CPUEda and Climate Indices
An obvious convergence of the AMO causing on CPUEda and a declined trend of the opposite predicting skill (CPUEda causing on the AMO) are found with the library size larger (Figure 4), which shows the interaction between the AMO and SKJ is unidirectional, and indicates that the abnormal fluctuation of SKJ CPUE in the NWP depended on the long-term variation of the AMO, despite the insignificant correlation (r = −0.004, Table S1). The ECCM results further attest that the strongest causation occurs at a lag of 1 year at an annual scale. (Figure 5A). More specifically, the maximum lag on the month scale is identified at 15 months (Figure 5B).
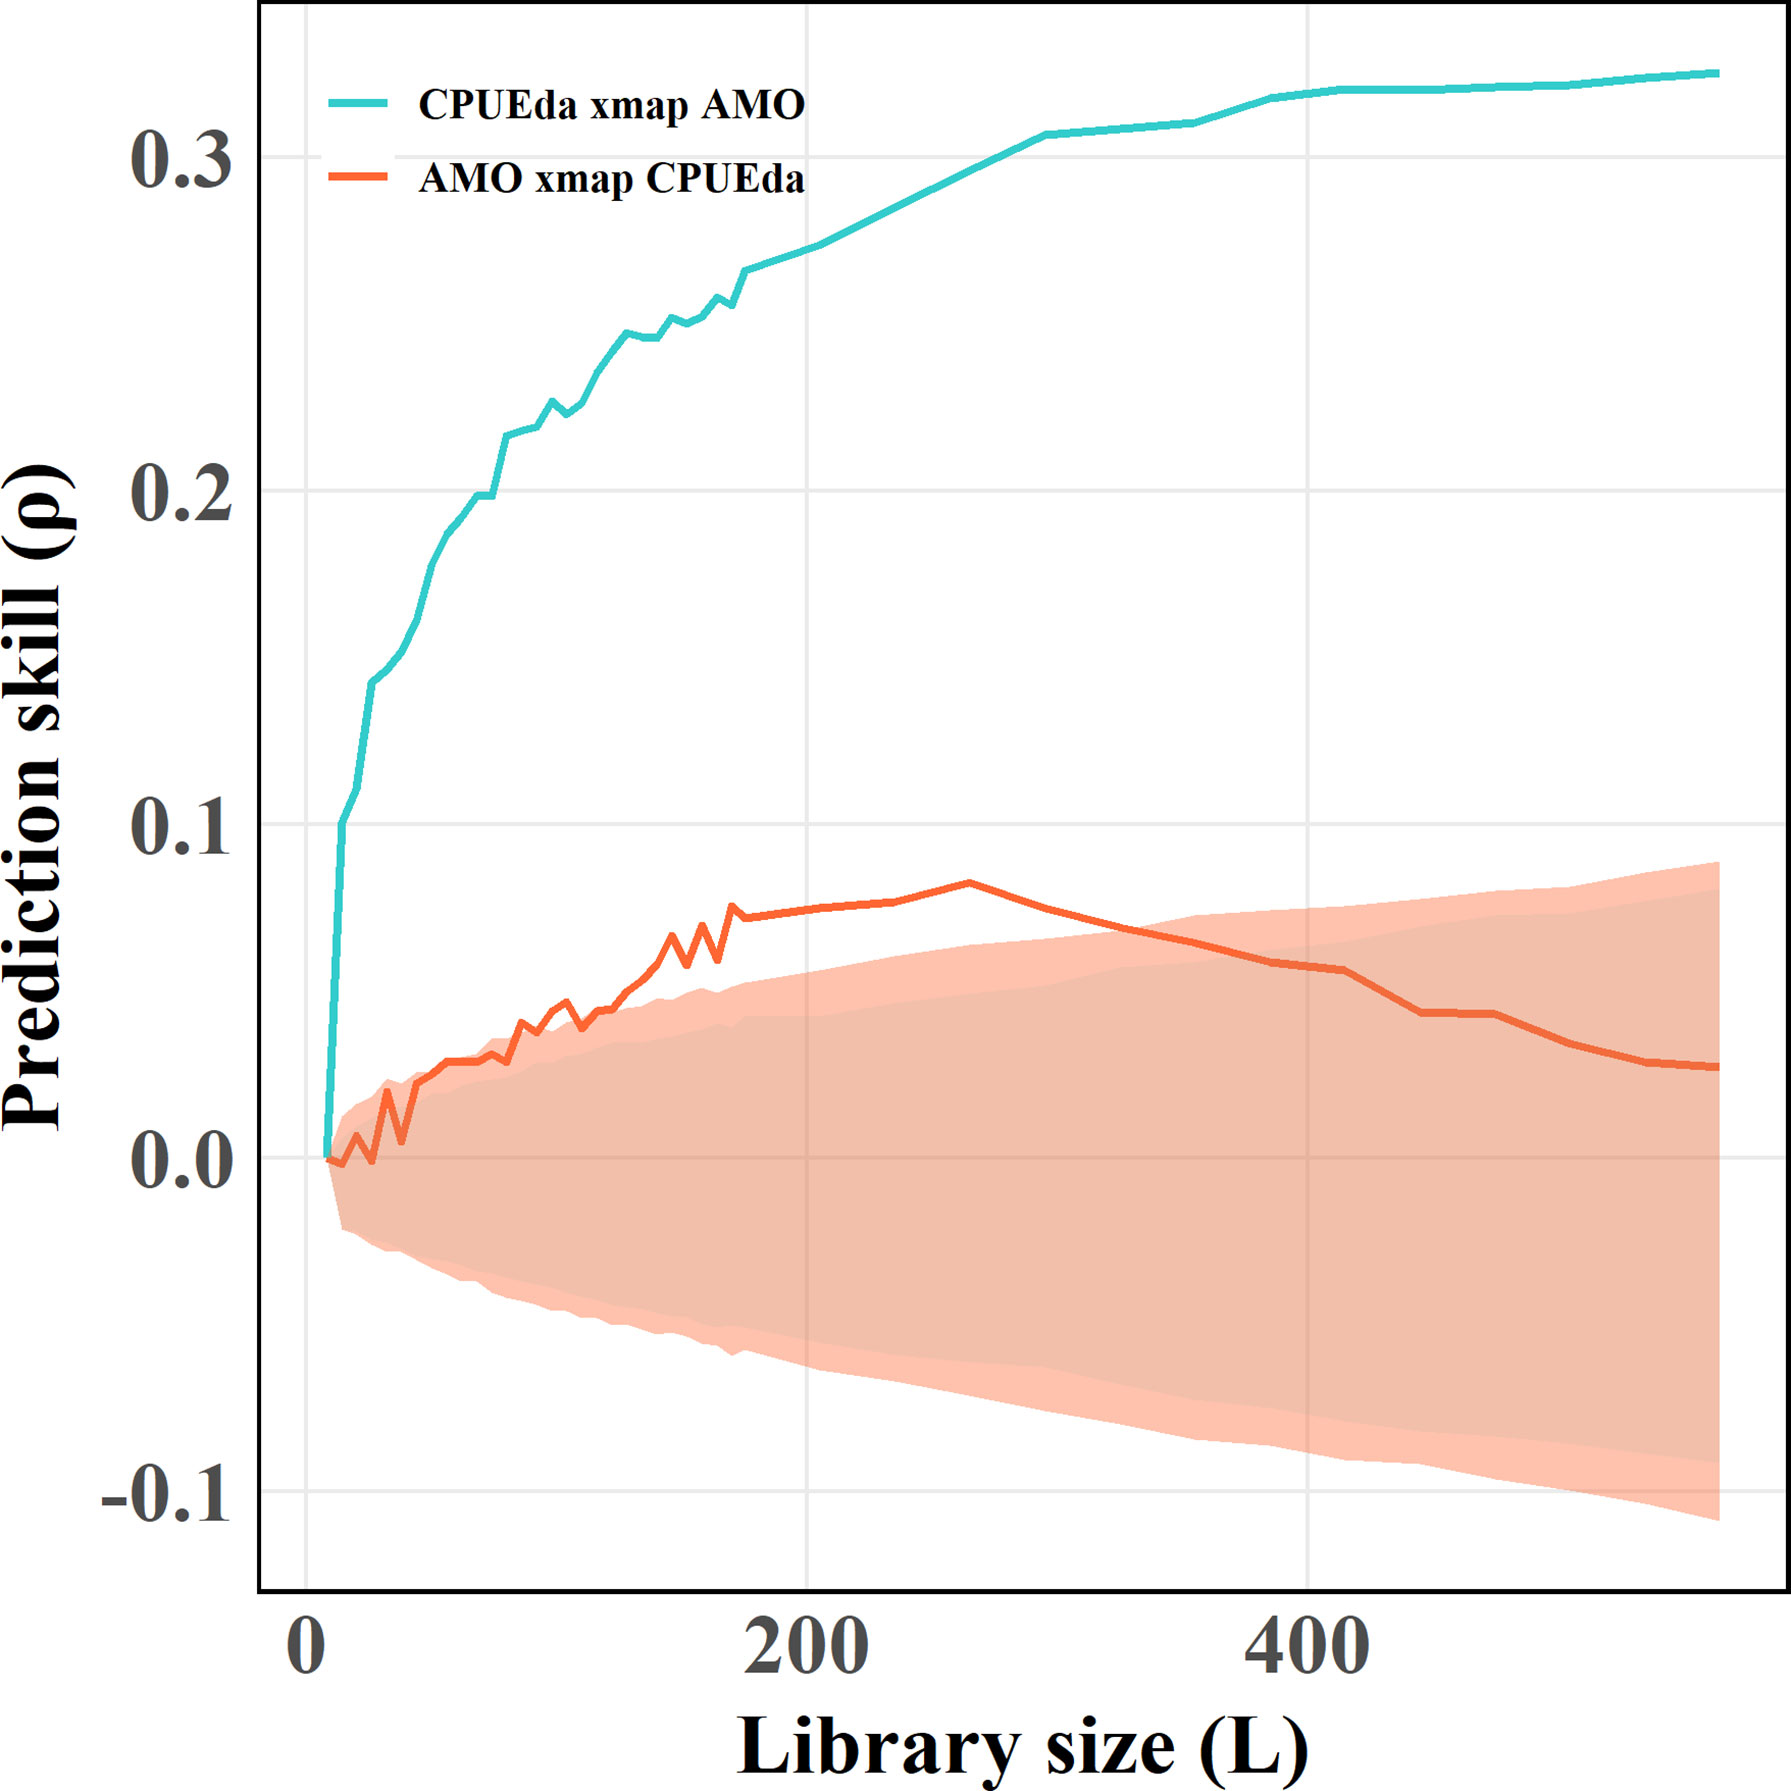
Figure 4 Results of the CCM applied to the nonlinear dynamics of CPUEda and AMO. The blue lake and bright orange lines represent the effect of AMO on skipjack and the opposite effective direction, respectively. The different color shadows represent the 95th percentile of the results of CCM for the surrogate data versus the original effect time series.
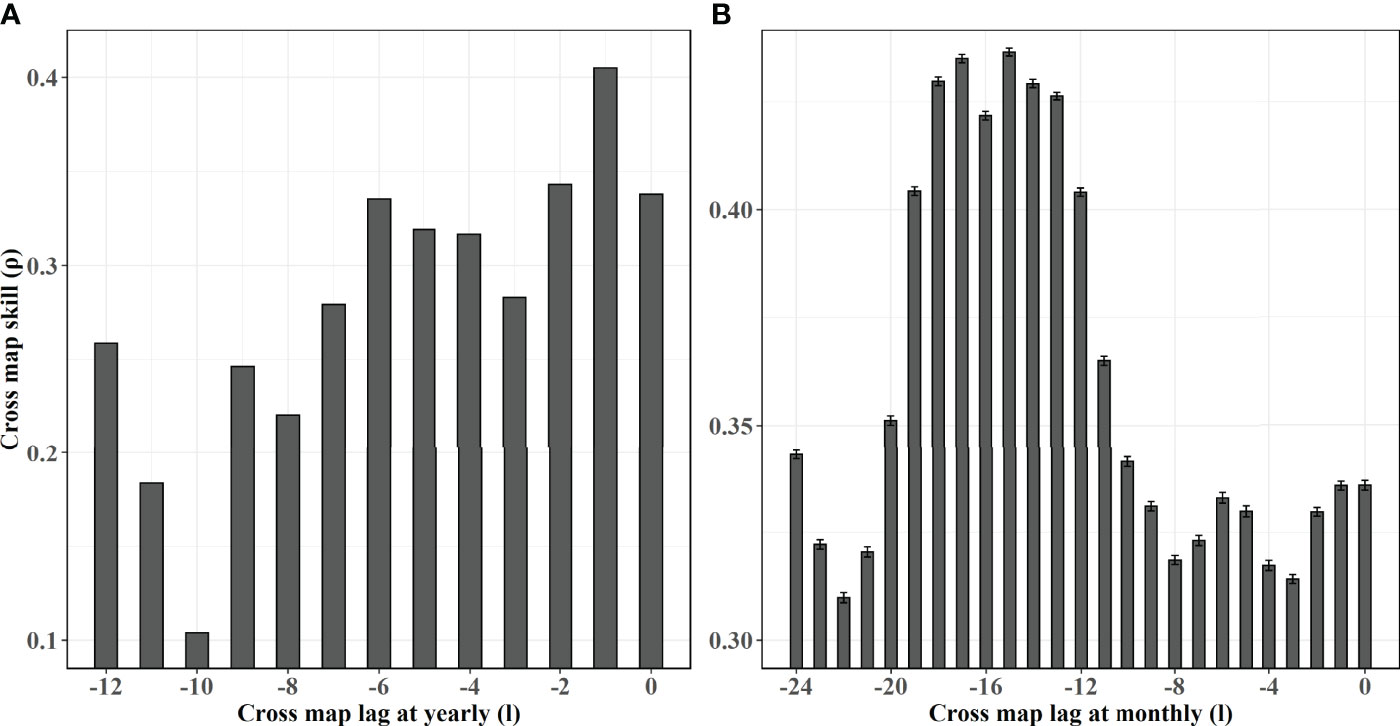
Figure 5 Results of the ECCM applied to the nonlinear dynamics of CPUEda and AMO at yearly scales (panel a) and month scales (panel b). The black bar shows the mean cross map skill from AMO to skipjack at various time lags, where the units of (A, B) are year and month, respectively. Specifically, the vertical lines in panel B show the standard deviations over 1000 random libraries.
For other climate indices, the predicting skill of the ONI causing on CPUEda shows a weak convergence at the library size (L = 400) with a declined trend after the library size reached 400 (Figure S6). Considering the maximum predicting skill is less than 0.1, the ONI effect on SKJ is almost neglected. The predicting skills between PDOfd and NPGOfd cross-with CPUEda presented with negative values make no sense (Figure S6), which shows no causal interaction between SKJ with PDO and NPGO at the statistical level.
3.3 Nonstationary Relationship Between SKJ CPUE and the AMO
For the comparison between stationary and nonstationary models, the TGAM model obviously causes lower AIC (Figure 6), showing better model performances than the GAM model. Consequently, the relationship between SKJ and the AMO during the whole period is nonstationary. Following the variations in the GCV of TGAM model, the threshold years that distinguished eras for fitting AMO-CPUE relationship separately was around 1991/92 (Figure 7). Two eras were found with various relationships between CPUE and the AMO (Table 2), where the AMO is significantly related to CPUE in the era1 (1972–1991), while this relationship was insignificant in the era2 (1992–2019, Figure 8).
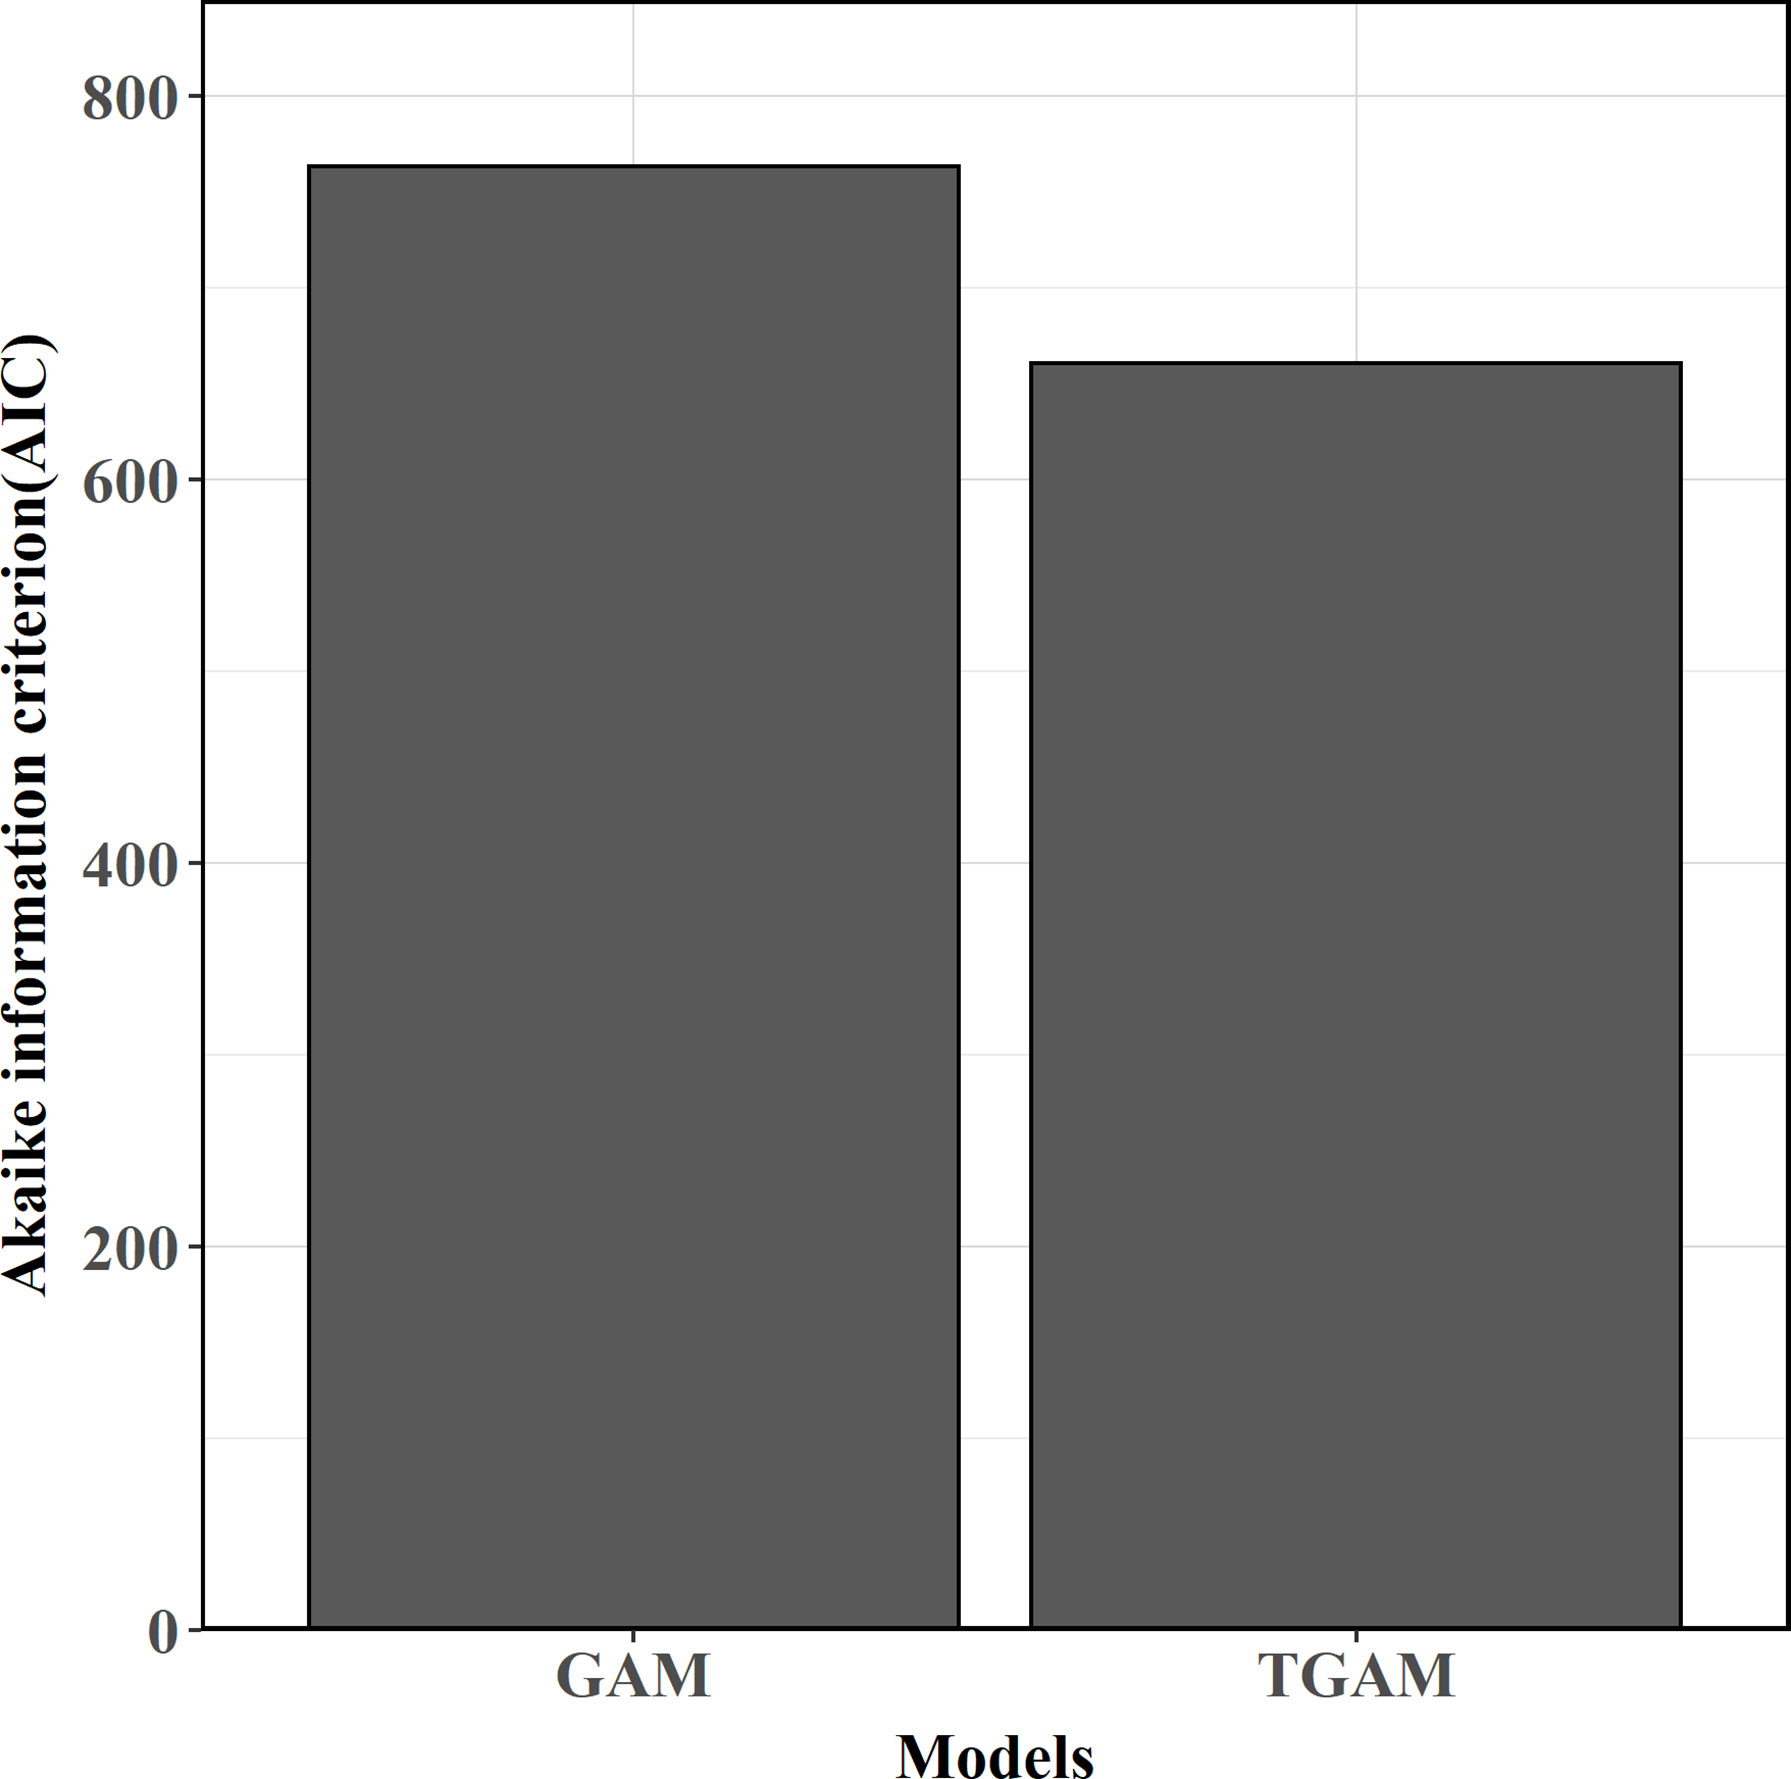
Figure 6 Model comparisons between stationary and non-stationary models.
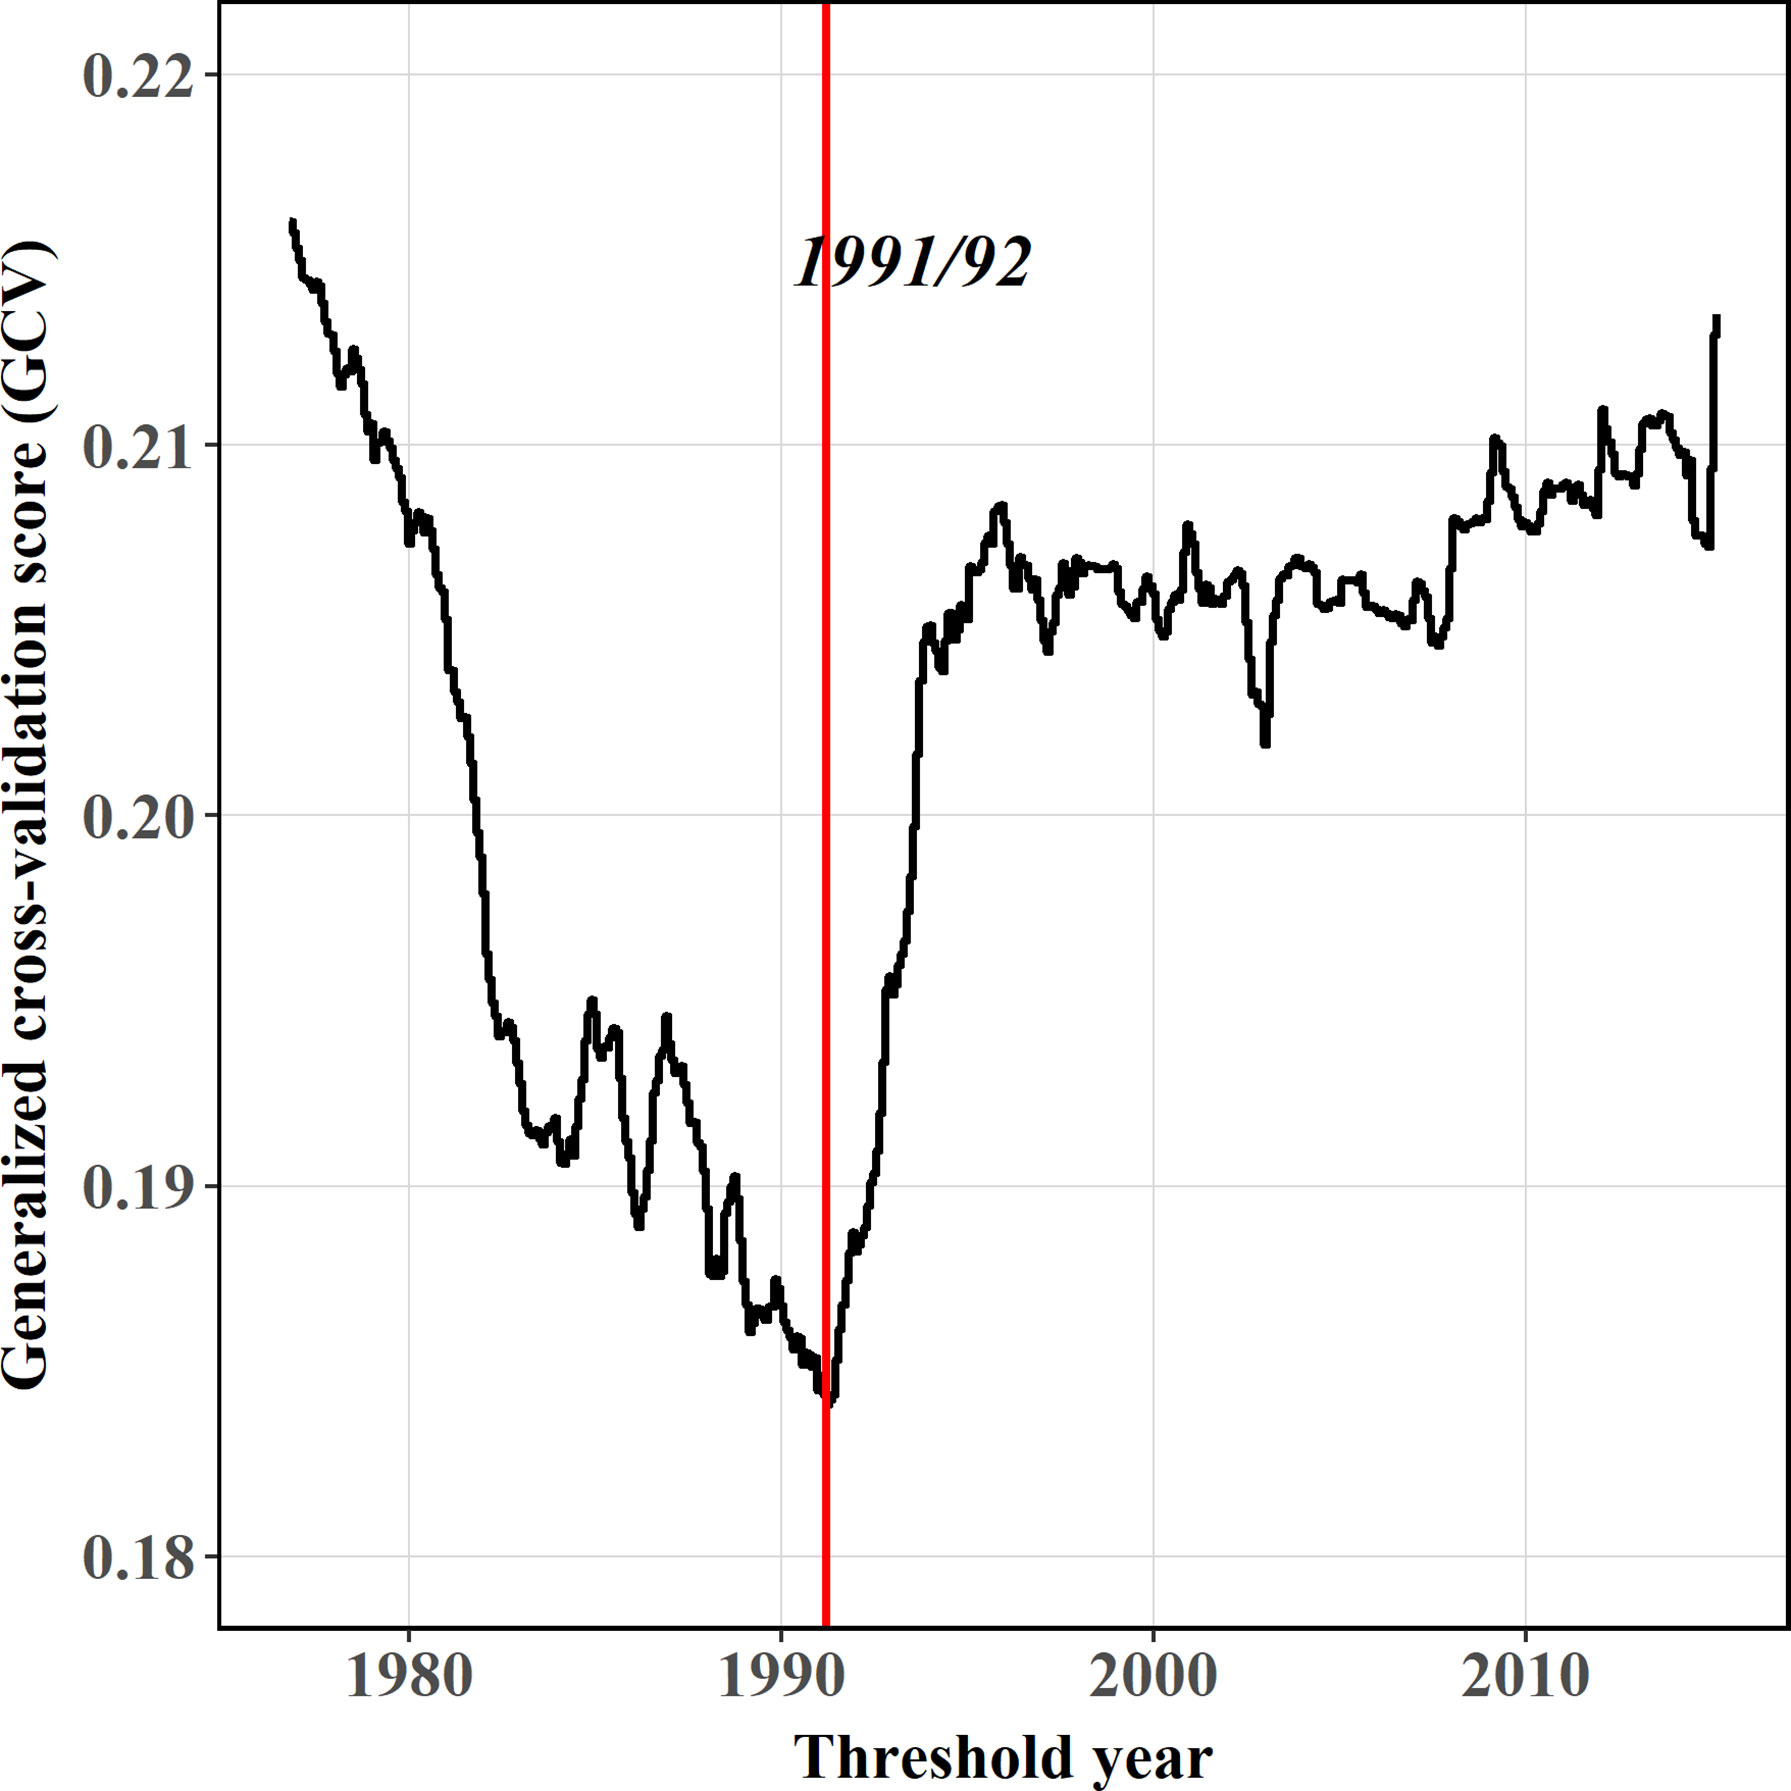
Figure 7 Generalized cross-validation score (GCV) paths of the best fitted models by TGAM. The red line represents the threshold year characterized by concave GCV paths.
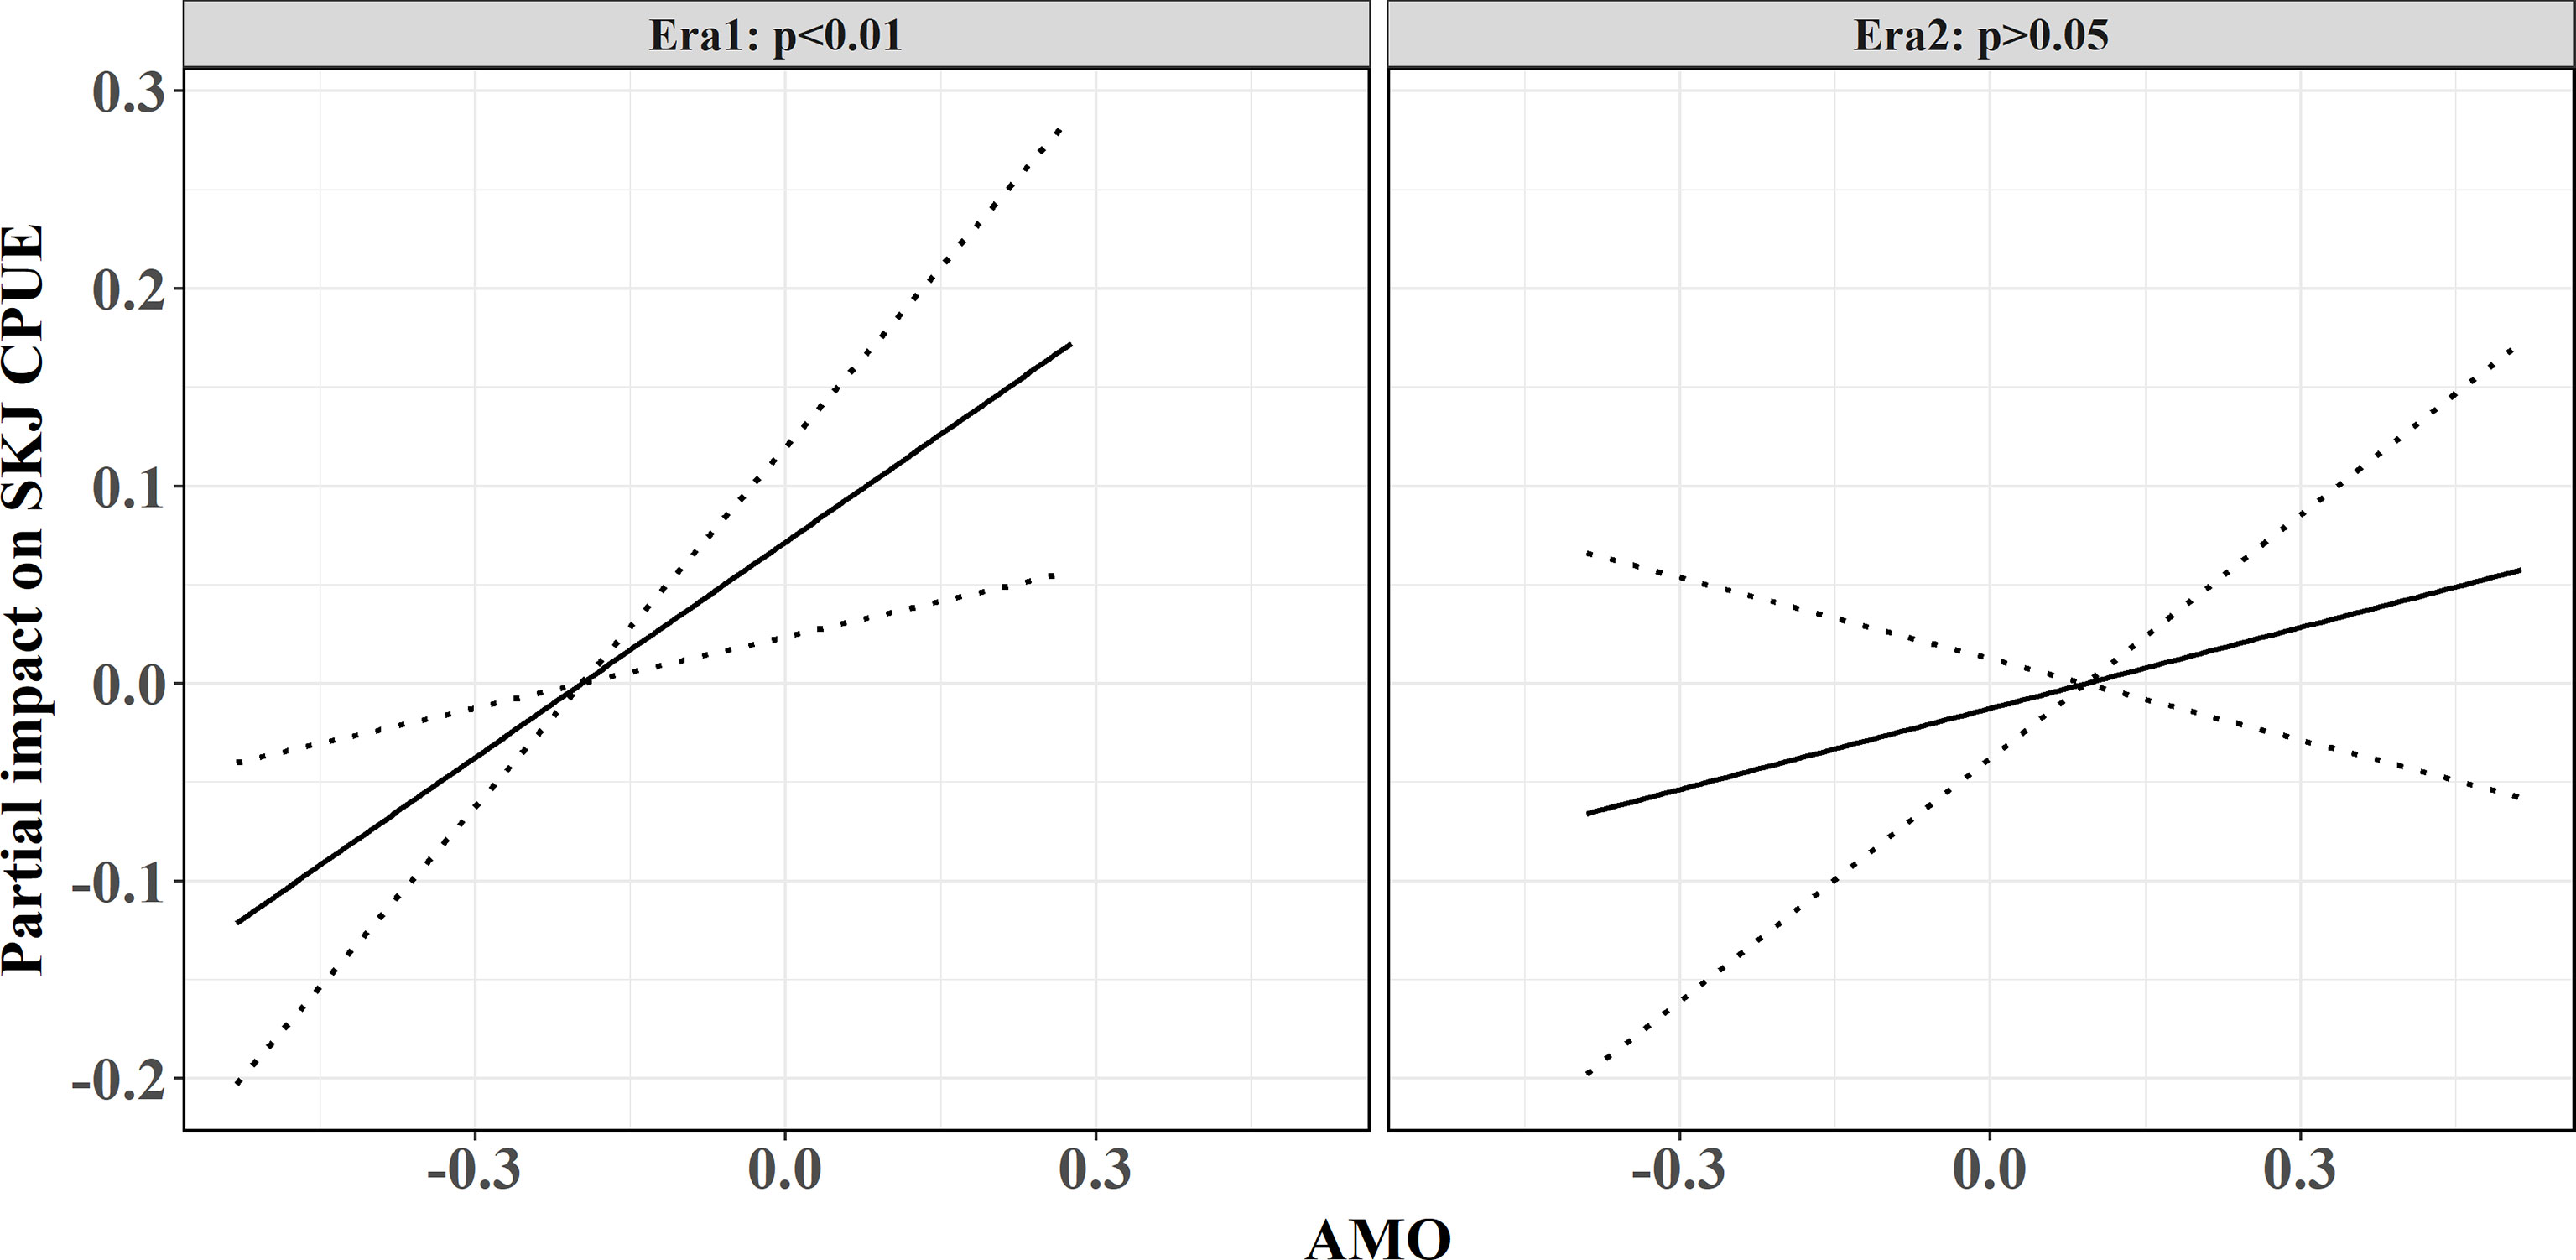
Figure 8 Fitting relationships between the AMO and SKJ CPUE in various eras using the best-fitted models. The left and right panels represent the first era before 1991 and the second era posterior 1991, respectively.
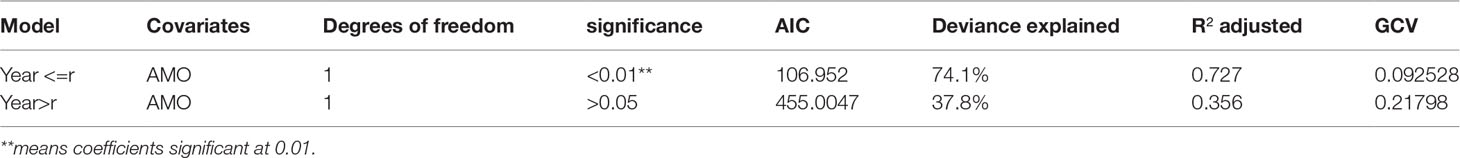
Table 2 Significant covariates degrees of freedom goodness of fit (Akaike Information Criterion, AIC), model performance with deviance explained in percentage and regression coefficient R-sq. adjusted are indicated for identified threshold year GAM models.
4. Discussion
This study presents the continuous pole-line catch data of SKJ in the NWP area over the 1972–2019 period, where the SKJ catch shows a relatively higher level before the 21st century and contributed secondly to the SKJ catch in the Pacific while its role has been weakening in the recent two decades. (Figures 3A; S1). As pole-line is the uniform fishing gear and the effort defined as days is homogeneous, the reduction in SKJ catch may result from the decreased effort instead of the fishing method since 1981 (Figure S2). By contrast, CPUE indicates an increasing trend during the whole period, which conforms with the stock assessment report in 2019 that SKJ is not over-fished and the population level is healthy (Vincent et al., 2019). Therefore, this study uses CPUE, to obtain the long-term change feature of SKJ relative abundance at the temporal scale, to link with climate indices. The CCM results showed that the AMO was causally related to the variability of SKJ relative abundance in the NWP, while the ONI, NPGO, and PDO have little effect on SKJ in this study.
4.1 Relationships Between SKJ Groups in the NWP With Climate Patterns
As mentioned earlier, three groups migrated from distinct areas constitute most SKJ in the NWP (Figure 1). Because of the least contribution of the northeast Pacific SKJ catch to its catch in Pacific during 1972–2019 (Figure S1), and the scared long-scale SKJ movement between the northeast Pacific and NWP through the conventional tagging (Moore et al., 2020), it is assumed that the SKJ from the northeast Pacific (i.e., group 1) hardly contributes to the SKJ in the NWP. Besides, no causal linkage between NPGO and SKJ in this paper supports the assumption from another perspective (Figure S6).
In contrast, the second group from the western tropical Pacific is considered as an important component of the SKJ in the NWP. SKJ catch in the western tropical Pacific has ranked the first since 1950 (Figure S1) and was significantly related to ENSO events (Lehodey et al., 1997). During the ENSO episodes, the SKJ purse seine fishery in the western tropical Pacific showed profound displacement between the warm and cold pools with catch fluctuations. Tag-release programs and otolith studies showed that there are one or two various migratory routes between the NWP and western tropical Pacific (Arai et al., 2005; Kiyofuji et al., 2019). However, the ONI makes a weak linkage with SKJ in this study. Accounting for a weaker effect on the high-latitude extratropical area (like the NWP) of ENSO than on low-latitude tropical areas (Alexander et al., 2004), ENSO records may be faded in the NWP, which may have little effect on SKJ. Besides, recent studies found that the fluctuation of SST in the western tropical Pacific is largely in phase with AMO on the decadal scales through atmospheric teleconnection and the interaction of air-ocean dynamics (Sun et al., 2017; Sun et al., 2021). When the Atlantic is in a positive phase with positive SST anomalies, so is the western tropical Pacific, which fitly overlaps and affects the migratory environment of the second group to reach the NWP area (Figure 11). Therefore, the production of the second migratory group may largely depends on the spawning parents linked with ENSO in the western tropical Pacific, while the survival rate of the second group migrated to the NWP is most likely to rest on the AMO.
More notably, the subsurface layer of the NWP was evidenced to correlate with the AMO without lag (Wu et al., 2020b). Since the 21st century, studies have indicated that the AMO dominates the multidecadal variability of the Atlantic Ocean and exhibits significant footprints on transoceanic basins, especially on the Pacific Ocean, which reflects in modulating the variability of Pacific prominent modes (such as ENSO, PDO et al.) and inducing the synchronous response of physical environment (such as the anomalous warm of western Pacific SST, the increased upper ocean heat content and the intensified tropical cyclones during positive AMO phases) (Enfield et al., 2001; d’Orgeville & Peltier, 2007; Levine et al., 2017; Sun et al., 2017; Wang et al., 2017; Gong et al., 2020; Sun et al., 2020; Wu et al., 2020b; Zhang & Delworth, 2007). Moreover, a novel discovery is that the AMO played a decisive role in SKJ in the NWP during 1972–2019, which is consistent with the notion that the AMO could explain fish catch variability in the NWP by dominating the subtropical mode water (Figure 11) (Wu et al., 2020b).Indeed, an obvious and significant causal affection of the AMO on SST in the NWP is identified in this paper using CCM and ECCM techniques (Figures 9A,B), due to the negative optimal SST lag caused (predicted) by the AMO and the positive optimal AMO lag caused by SST (Figure 9B), which indicates that SST should be the essential oceanographic medium between the AMO and SKJ, and which is further verified using CCM test between SST and CPUEda who showed an obvious convergent trait of the prediction skill from CPUEda to SST (Figure 10). Accordingly, the SKJ inhabiting in the NWP, especially for the residents (i.e., the third group) and the immigrants from the second group, are possibly forced by the AMO through SST (Figure 11).
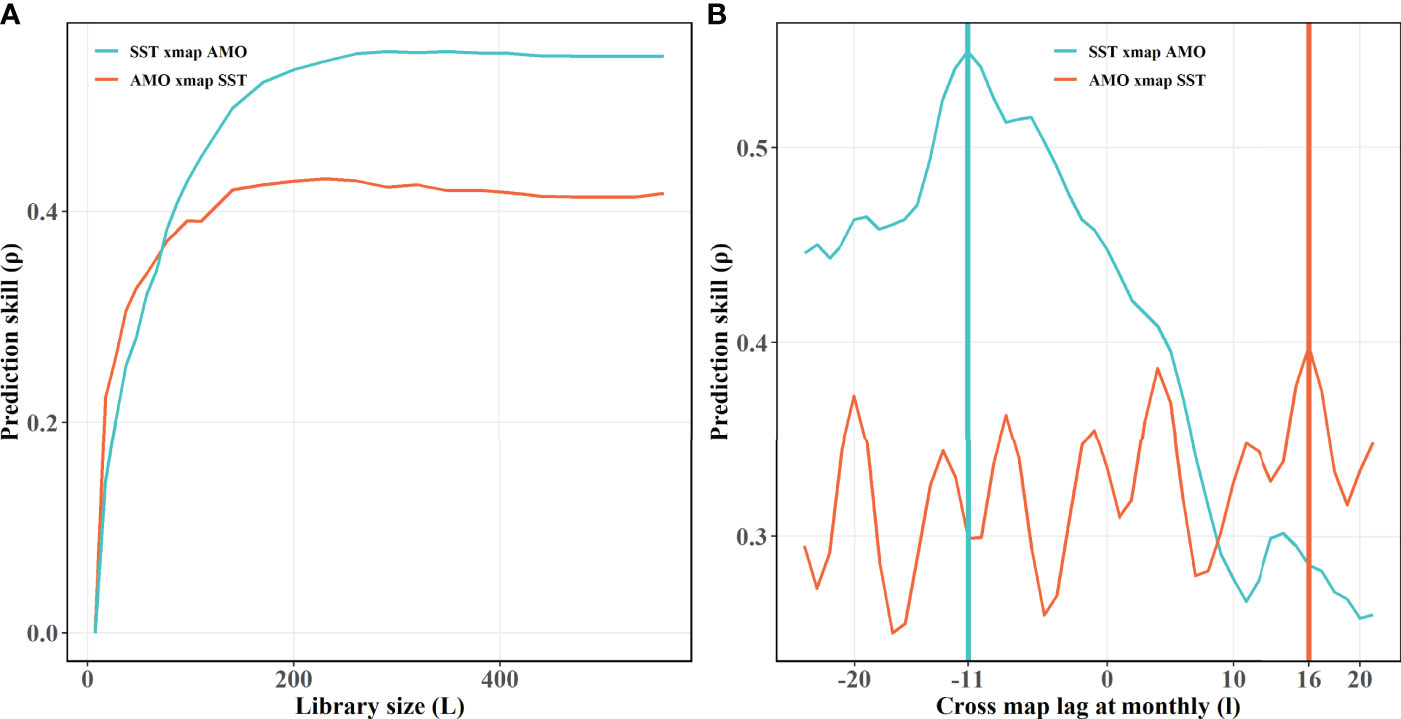
Figure 9 Results of the CCM and ECCM applied to the nonlinear dynamics of SST and the AMO. (A) Results of the CCM without time lag, (B) Results of the ECCM at different lags (l = 1 month). The blue lake lines indicate that the AMO causes SST; the bright orange lines represent the opposite effective directions from SST to AMO. The vertical lines in panel b represent the optimal lag times by the best prediction skills at varying interaction directions, respectively.
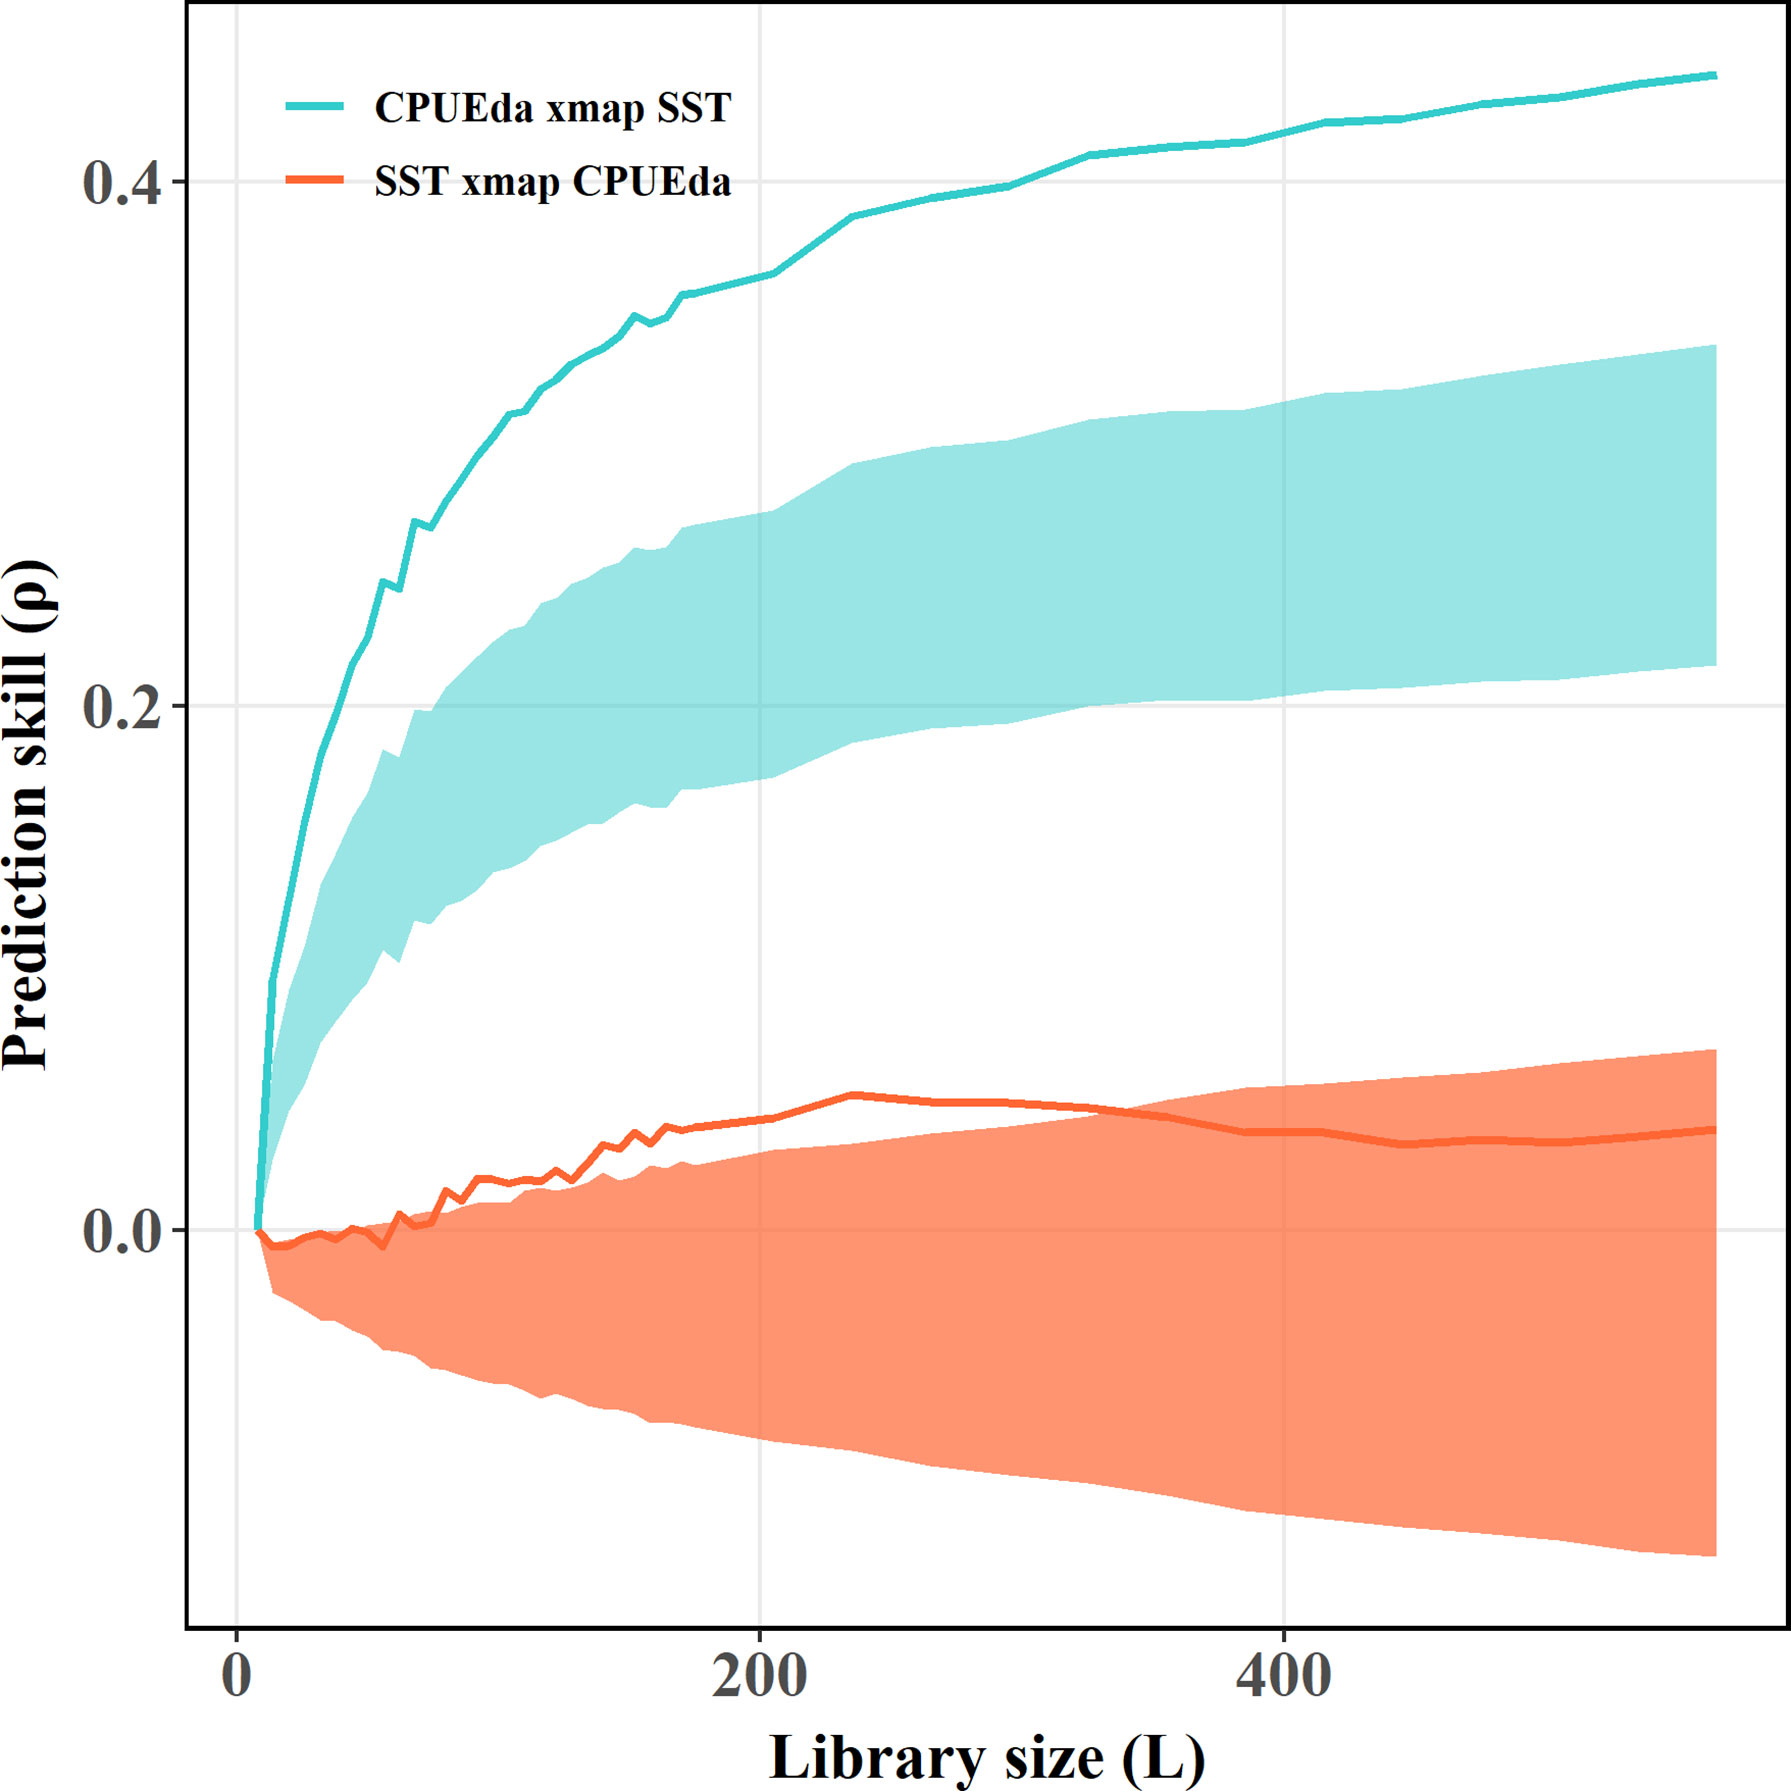
Figure 10 Results of the CCM applied to the nonlinear dynamics of CPUEda and SST. The blue lake and bright orange lines indicate the effect of SST on CPUE and the opposite effective direction from CPUE to SST, respectively. The shadows represent the 95th percentile of the results of the CCM for the surrogate data versus the original effect time series.
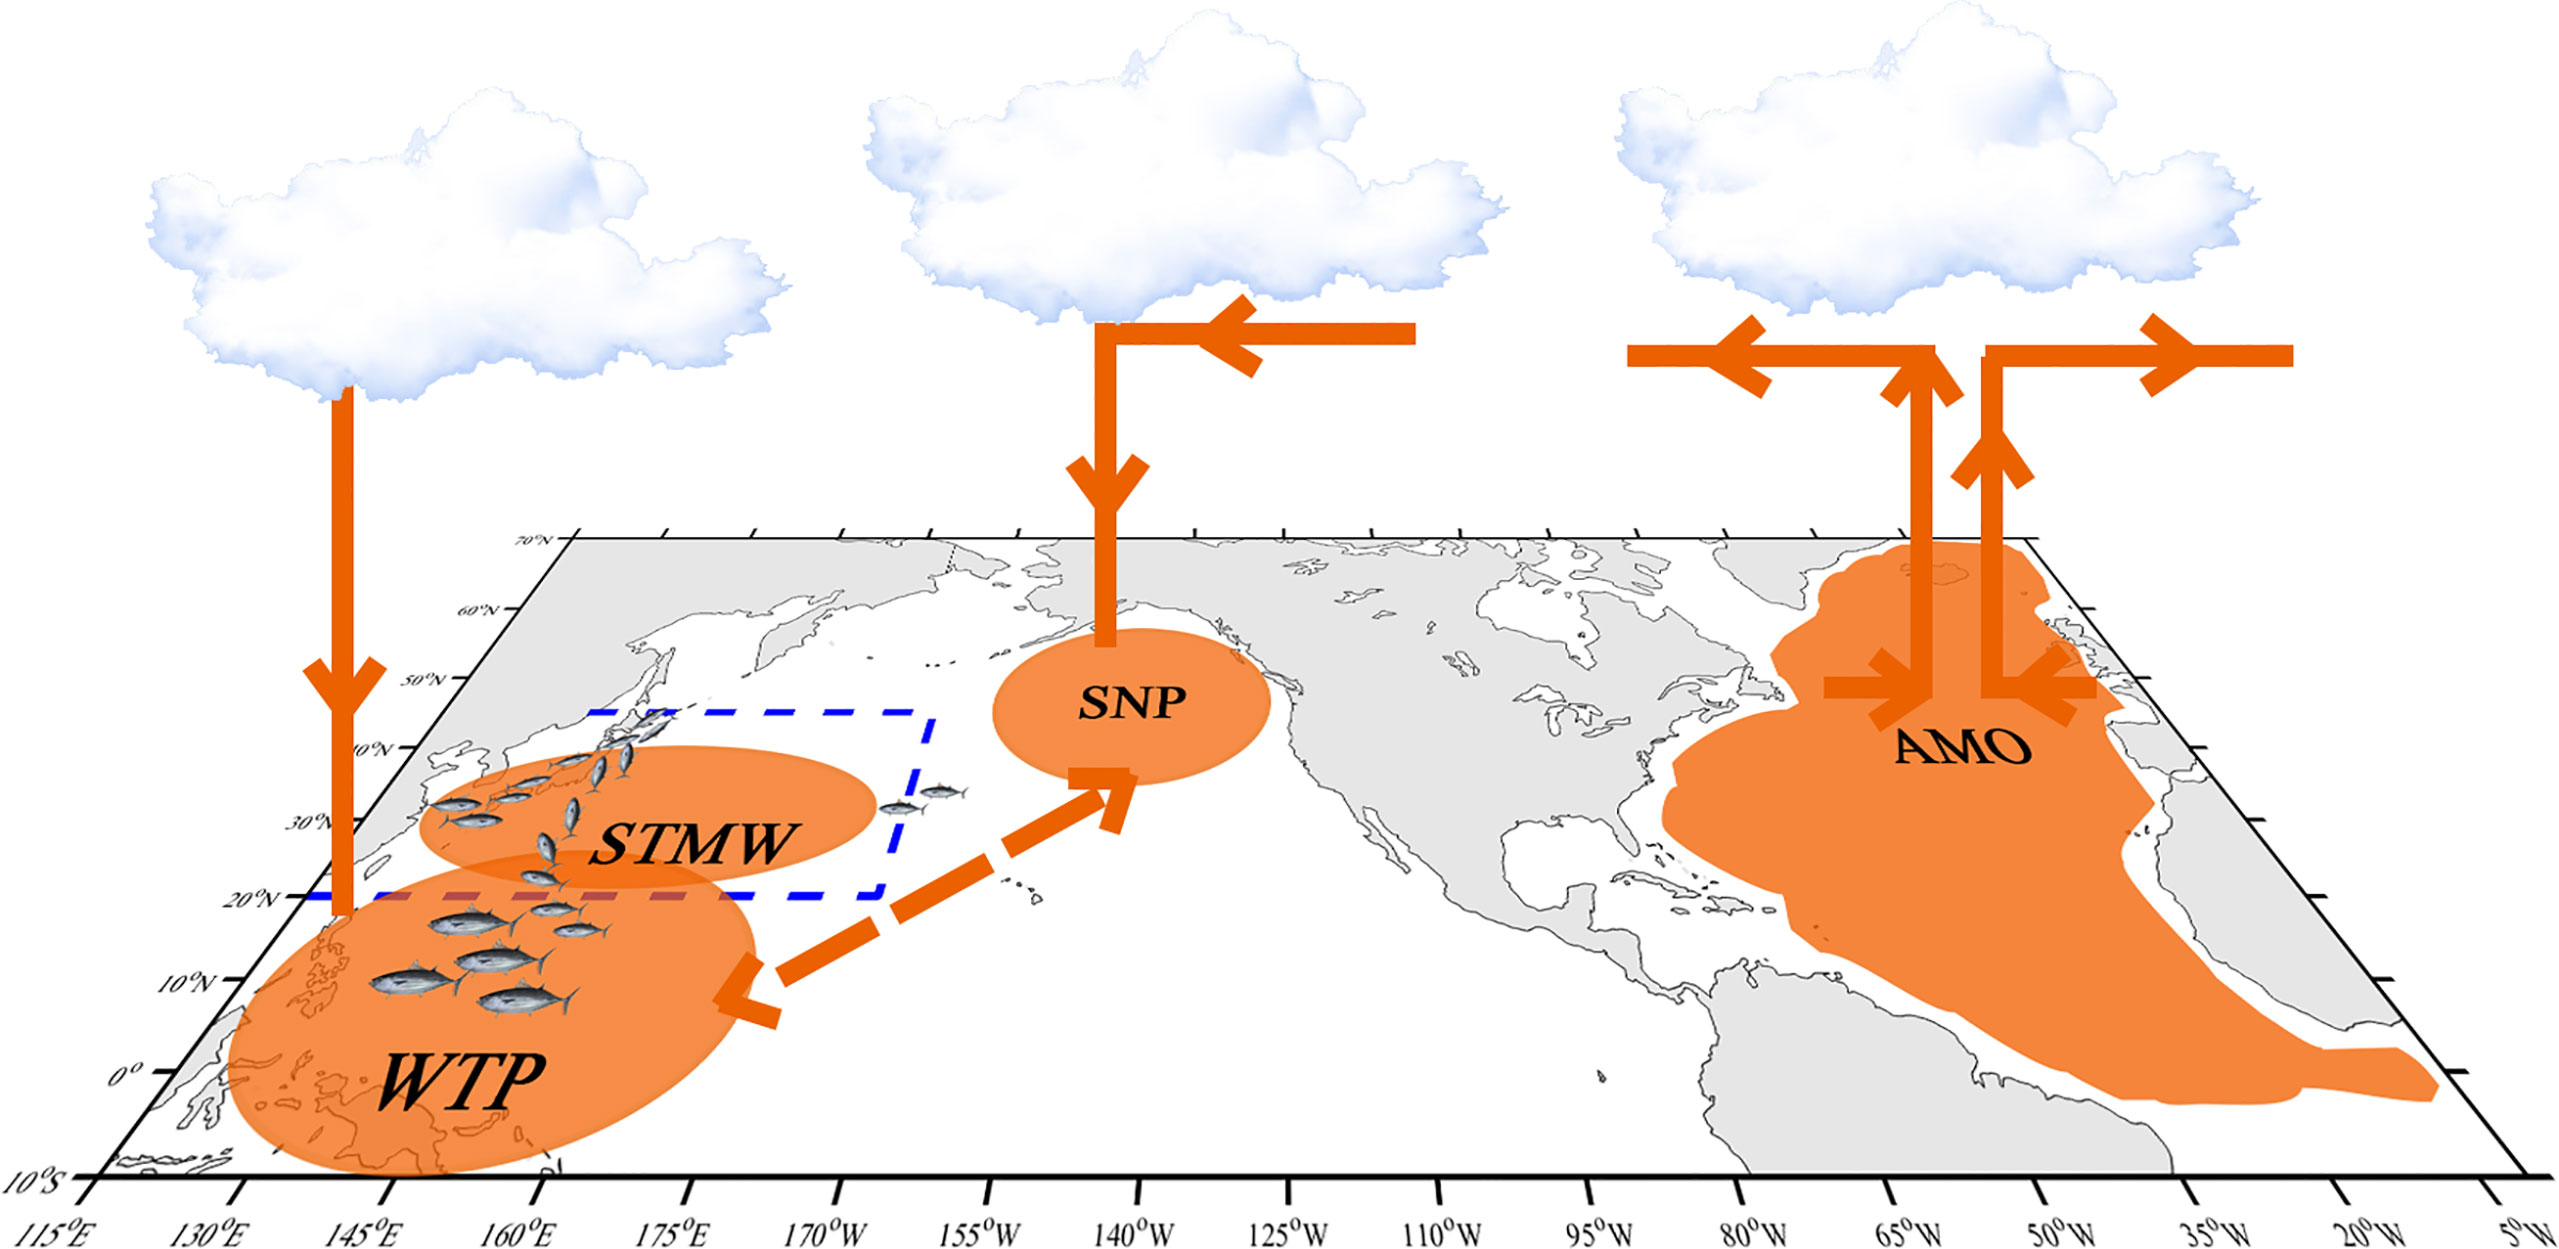
Figure 11 Schematic process of SKJ in the Northwest Pacific affected by the AMO. The blue dotted line shows the study area in this paper. The orange patches, lines, and arrows show the possible affection process in the western pacific caused by the AMO in the north Atlantic (Sun et al., 2017; Wu et al., 2020b). SNP means subtropical North Pacific, WTP means western tropical Pacific, STMW means subtropical mode water in the study area.
Previous studies have shown that environmental changes caused by climate variability could affect tunas in recruitment, spawning, distribution, etc. For instance, SST anomaly concurred with ENSO events in the Indian Ocean could reflect in the tuna fishery (e.g., yellowfin tuna and bigeye tuna) in the Indian Ocean (Syamsuddin et al., 2013; Báez et al., 2020). Although PDO is the proxy of SST anomaly signals in the north Pacific, this study shows that PDO makes no causality with SKJ in the NWP, which is consensus with the point that the NWP ecosystem could not be completely explained by PDO, of which many species fluctuations could not be associated with PDO yet on a decadal scale (Tian et al., 2014; Ma et al., 2020; Wu et al., 2020b; Ma et al., 2021). Conversely, in this study, SKJ in the NWP over 1972–2019 is caused by the AMO through SST. The plausible explanation for this is that SST variation first affects the habitat suitability of SKJ and second triggers the SKJ relative abundance anomalies. Similar phenomena was confirmed in Atlantic bluefin tuna in the north Atlantic and SKJ in the tropical Pacific (Lehodey et al., 1997; Faillettaz et al., 2019). However, the fishery ground covered the whole study area without obvious changes all the way in this paper. Therefore, the possible explanation is that the SST variability involves in the growth and development of SKJ during its lifetime. SKJ could adopt various breeding strategies depending on the external SST; it could spawn all over the year in the tropical ocean, but spawn seasonally in the extratropical water (Ashida, 2020). Moreover, the early-life ontogenetic SKJ development (juvenile) is positive and significantly related to SST (Ashida et al., 2018) too. Combined with the maturity age (1.1–1.6 year) of SKJ in the NWP (Ashida, 2020), and the optimal causal relationship between the AMO and SKJ at the lag of 15 months (Figure 5B), this paper implies the AMO effects on the recruitment process of one generation of SKJ cohort through SST. Specifically, the second group leading a bold and long-distance migration for feeding ground in the NWP (Moore et al., 2020) would experience SST variability caused by the AMO in their migratory processes, which directly influenced their survival and growth rates. On the other hand, the fecundity of the local spawning cohort and the subsequent growth and development rate of SKJ would depend on SST controlled by the AMO. Consequently, the early life of SKJ in the NWP is affected by the AMO through SST.
4.2 Possible Explanations for the Nonstationary Relationship Between the AMO and SKJ
TGAM results show that SKJ CPUE correlates linearly with AMO at the former era (1972–1991), while the correlation disappears at the latter era (1992–2019). Although the most famous and climatic regime shift documented in the North Pacific Ocean was in 1976–1977, recent major alterations in some components of the North Pacific ecosystem were identified a further shift in 1989 in the northeast Pacific and a nonlinear and non-stationary with threshold years in the 1990s in the NWP, respectively (Hare & Mantua, 2000; Litzow et al., 2018; Ma et al., 2021). This time-dependent nonstationary responses between AMO and SKJ occurred around the early 1990s as well, which may indicate a complex ecological effect of the ecosystem. As the opportunistic feeder, SKJ could consume various preys, such as squid, crustaceans, and some mackerel or perciform fish during migration (Aoki et al., 2017). Such region-dependent feeding could probably moderate the down-top biotic effect on SKJ through the food chain, while the inverse control from predators (like sharks and billfishes in the eastern tropical Pacific Ocean, (Hunsicker et al., 2012; Chang et al., 2022) is unclear in the NWP.
Studies to date have explored the teleconnection mechanism between the AMO and Pacific ocean through the atmosphere bridge and ocean-atmosphere interaction, of which the direct oceanographic variations in the western pacific surface triggered by the AMO is SST (Sun et al., 2020; Wu et al., 2020b), In this sense, this paper explored the causation between local SST and SKJ, which is consistent with many studies that highlighted the importance of SST on tuna abundance (Zainuddin, 2011; Tangke et al., 2020; Salazar et al., 2021). The distinct relationships between the AMO and SKJ during two eras in this study may respond to the various stages in the thermal niche response curve of SKJ with warmer SST. SST before 1991 may be within the ascending stages of the niche response curve, which is slowly more suitable for the SKJ growth. While SST since 1991 could match the gentle slope stages of the curve (relative decrease but still in positive). Apart from SST, other biotic factors (such as Mixed layer depths and Chlorophyll-a) could also represent the primary habitat environment in defining SKJ suitable habitat (Mugo et al., 2020; Salazar et al., 2021). Although no obvious shift of the SKJ fishery ground is found during different eras in current study, future work is needed to explore the multi-effect from environment factors on the SKJ distribution and abundance. Additionally, the temporal evolution of AMO has shown a trend of increasing volatility in recent decades, indicating that the AMO is non-stationary (Beyraghdar Kashkooli & Modarres, 2020). Chen et al. (2019)reported that modulating effect from the AMO on the relationship between wintertime North Pacific oscillations and ENSO is different during various AMO episodes, which may further show the nonstationary relationship between the AMO and Pacific. Therefore, the nonstationary trait between AMO and SKJ may be attributed to a comprehensive process coupled with the AMO variability, the SKJ population dynamics affected by biotic and abiotic factors.
4.3 The Strength and Extension of the CCM Technique
Compare with the spearman correlation results (Table S1), CCM method shows a stronger ability for determining a distinct causation between SKJ and climate variability (AMO) in this study, and provides the key evidence of the causation direction from AMO via SST effecting on SKJ. This is consistent with the notion that the CCM is superior to traditional correlation techniques on determining the caused signal with big datasets (Chang et al., 2017). With the high development of observed tools and computer science, big ocean data are birthed and how to mine the potential information under these common datasets becomes a hot issue. The CCM method is of great benefit to prompt this analysis. Moreover, the extension of CCM methods involved with multiple factors, such as Multivariate CCM and Multiview CCM (Ye & Sugihara, 2016; Hu et al., 2021) are also recommended understanding the comprehensive mechanism between organisms with climate variability and local physical factors in the ecosystem.
This study proposes that the trans-basin interaction between the AMO and Pacific Ocean has affected the NWP SKJ fishery at 15 months in advance. Similar phenomena occurred in the Indian ocean as well. Such as, the tuna fishery in the Indian ocean could suffer an obvious decline were out of phase with PDO (Báez et al., 2020; Wu et al., 2020a). Tunas or other large pelagic fish (such as swordfishes, sharks) who migrated at the meso-large spatial scale experiences large environmental variation during its whole life history, large-scale climate indices that combine many physical variables would likely serve as an appropriate proxy for explaining and predicting the long-term abundance variation of the species. With the deeper understanding of the teleconnection pattern among oceans and atmosphere under the global climate change, the trans-basin effect of climate patterns on the prediction of the large-scale migratory species should be highlighted as the same as the basin climatic oscillations in the future.
Data Availability Statement
The raw data supporting the conclusions of this article will be made available by the authors, without undue reservation.
Ethics Statement
Ethical review and approval was not required for the animal study because this study didn’t involve with the physiology scope of the skipjack tuna, while it focused on relationship between the stock variation of skipjack tuna with climate based on the data derivedfrom the international fishery manage organization—WCPFC (Western and Central Pacific Fisheries Commission).
Author Contributions
XH, YT, and SM conceived the study. XH and SM provided guidance in the methods. XH conducted the data compilation and analysis. XH, YT, SM, and SZ wrote and revised the manuscript. YT obtained funding for the study. All authors contributed to the article and approved the submitted version.
FUNDING
This work was supported by the National Natural Science Foundation of China (Grant Nos. 41930534).
Conflict of Interest
The authors declare that the research was conducted in the absence of any commercial or financial relationships that could be construed as a potential conflict of interest.
Publisher’s Note
All claims expressed in this article are solely those of the authors and do not necessarily represent those of their affiliated organizations, or those of the publisher, the editors and the reviewers. Any product that may be evaluated in this article, or claim that may be made by its manufacturer, is not guaranteed or endorsed by the publisher.
Acknowledgments
The authors appreciate the online open-access data and scripts providers. And the two reviewers for their invaluable comments on the manuscript.
Supplementary Material
The Supplementary Material for this article can be found online at: https://www.frontiersin.org/articles/10.3389/fmars.2022.895219/full#supplementary-material
Supplementary Figure 1 | The composition of skipjack tuna catches in the pacific from 1950–2019 (FAO). The different colors represent the catch in six major fishing areas.
Supplementary Figure 2 | Timeseries variations of skipjack tuna effort (days) during 1972–2019.
Supplementary Figure 3 | The optimal embedding dimensions of the time series.
Supplementary Figure 4 | The identification and quantification of nonlinearity of the time series.
Supplementary Figure 5 | The nonlinearity tests of the first-differenced indices (NPGOfd, PDOfd, SOIfd). The first row represents the optimal embedding dimensions of climate indices at the state space level; the second row represents the identification and quantification of nonlinearity of climate indices.
Supplementary Figure 6 | The CCM results between CPUEda and climate indices (NPGOfd, ONI, PDOfd). Blue lines represent the climate indices effect on CPUE.
Supplementary Figure 7 | Graphical residuals exploration results for the model during the first era (1972−1991).
Supplementary Figure 8 | Graphical residuals exploration results for the model during the second era (1992–2019).
Supplementary Table 1 | Linear Correlations between SKJ CPUEda and climate indices during 1972–2019. *means coefficients significant at 0.05.
References
Alexander M. A., Lau N.-C., Scott J. D. (2004). “Broadening the Atmospheric Bridge Paradigm: ENSO Teleconnections to the North Pacific in Summer and to the Tropical West Pacific-Indian Oceans Over the Seasonal Cycle,” in Earth Climate: The Ocean-Atmosphere Interaction, Oxford, England. vol. 147 . Eds. Wang C., Xie S.-P., Carton J. ( AGU Monograph).
Aoki Y., Kitagawa T., Kiyofuji H., Okamoto S., Kawamura T. (2017). Changes in Energy Intake and Cost of Transport by Skipjack Tuna (Katsuwonus Pelamis) During Northward Migration in the Northwestern Pacific Ocean. Deep. Sea. Res. Part II: Topical. Stud. Oceanography. 140, 83–93. doi: 10.1016/j.dsr2.2016.05.012
Arai T., Kotake A., Kayama S., Ogura M., Watanabe Y. (2005). Movements and Life History Patterns of the Skipjack Tuna Katsuwonus Pelamis in the Western Paci¢c, as Revealed by Otolith Sr:Ca Ratios. J. Mar. Biol. Assoc. United Kingdom 6. 1−9 doi: 10.1017/S0025315405012336
Ashida H. (2020). Spatial and Temporal Differences in the Reproductive Traits of Skipjack Tuna Katsuwonus Pelamis Between the Subtropical and Temperate Western Pacific Ocean. Fisheries Res. 221, 105352. doi: 10.1016/j.fishres.2019.105352
Ashida H., Watanabe K., Tanabe T. (2018). Growth Variability of Juvenile Skipjack Tuna (Katsuwonus Pelamis) in the Western and Central Pacific Ocean. Environ. Biol. Fishes 101 (3), 429–439. doi: 10.1007/s10641-017-0708-9
Báez J. C., Czerwinski I. A., Ramos M. L. (2020). Climatic Oscillations Effect on the Yellowfin Tuna (Thunnus Albacares) Spanish Captures in the Indian Ocean. Fisheries Oceanography. 29 (6), 572–583. doi: 10.1111/fog.12496
Beyraghdar Kashkooli O., Modarres R. (2020). Is the Volatility and non-Stationarity of the Atlantic Multidecadal Oscillation (AMO) Changing? Global Planetary Change 189, 103160. doi: 10.1016/j.gloplacha.2020.103160
Carlos Baez J., Czerwinski I. A., Lourdes Ramos M. (2020). Climatic Oscillations Effect on the Yellowfin Tuna (Thunnus Albacares) Spanish Captures in the Indian Ocean. Fisheries Oceanography. 29 (6), 572–583. doi: 10.1111/fog.12496
Casini M., Hjelm J., Molinero J.-C., Lovgren J., Cardinale M., Bartolino V., et al. (2009). Trophic Cascades Promote Threshold-Like Shifts in Pelagic Marine Ecosystems. Proc. Natl. Acad. Sci. 106 (1), 197–202. doi: 10.1073/pnas.0806649105
Chang Y.-C., Chiang W.-C., Madigan D. J., Tsai F.-Y., Chiang C.-L., Hsu H.-H., et al. (2022). Trophic Dynamics and Feeding Ecology of Skipjack Tuna (Katsuwonus Pelamis) Off Eastern and Western Taiwan. Molecules 27 (3), 1073. doi: 10.3390/molecules27031073
Chang C.-W., Ushio M., Hsieh C. (2017). Empirical Dynamic Modeling for Beginners. Ecol. Res. 32 (6), 785–796. doi: 10.1007/s11284-017-1469-9
Chen S., Song L., Chen W. (2019). Interdecadal Modulation of AMO on the Winter North Pacific Oscillation–Following Winter ENSO Relationship. Advances in Atmospheric Sciences.36, 11. doi: 10.1007/s00376-019-9090-1
Ciannelli L., Chan K.-S., Bailey K. M., Stenseth N. (2004). Nonadditive Effects of The Environment on The Survival of a Large Marine Fish Population. Ecology 85 (12), 3418–3427. doi: 10.1890/03-0755
Collette B. B., Nauen C. E. (1983). FAO Species Catalogue. Vol. 2. Scombrids of the World. An Annotated and Illustrated Catalogue of Tunas, Mackerels, Bonitos and Related Species Known to Date. FAO Fish. Synop. 125 (2), 137.
Doi H., Yasuhara M., Ushio M. (2021). Causal Analysis of the Temperature Impact on Deep-Sea Biodiversity. Biol. Lett. 17 (7), 20200666. doi: 10.1098/rsbl.2020.0666
d’Orgeville M., Peltier W. R. (2007). On the Pacific Decadal Oscillation and the Atlantic Multidecadal Oscillation: Might They be Related: PDO and AMO Related? Geophysical. Res. Lett. 34 (23) L23705. doi: 10.1029/2007GL031584
Enfield D. B., Mestas-Nunez A. M., Trimble P. J. (2001). The Atlantic Multidecadal Oscillation and its Relation to Rainfall and River Flows in the Continental US. Geophysical. Res. Lett. 28 (10), 2077–2080. doi: 10.1029/2000GL012745
Faillettaz R., Beaugrand G., Goberville E., Kirby R. R. (2019). Atlantic Multidecadal Oscillations Drive the Basin-Scale Distribution of Atlantic Bluefin Tuna. Sci. Adv. 5 (1), eaar6993. doi: 10.1126/sciadv.aar6993
Gong Y., Li T., Chen L. (2020). Interdecadal Modulation of ENSO Amplitude by the Atlantic Multi-Decadal Oscillation (AMO). Climate Dynamics. 55 (9–10), 2689–2702. doi: 10.1007/s00382-020-05408-x
Hare S. R., Mantua N. J. (2000). Empirical Evidence for North Pacific Regime Shifts in 1977 and 1989. Prog. Oceanography. 47 (2–4), 103–145. doi: 10.1016/S0079-6611(00)00033-1
Hunsicker M., Olson R., Essington T., Maunder M., Duffy L., Kitchell J. (2012). Potential for Top-Down Control on Tropical Tunas Based on Size Structure of Predator–Prey Interactions. Mar. Ecol. Prog. Ser. 445, 263–277. doi: 10.3354/meps09494
Hu J., Wang P., Zhang H. (2021). The Relationship Between Environmental Factors and Catch Abundance of Hairtail in the East China Sea Using Empirical Dynamic Modeling. Fishes 6 (4), 80. doi: 10.3390/fishes6040080
Kiyofuji H., Aoki Y., Kinoshita J., Okamoto S., Masujima M., Matsumoto T., et al. (2019). Northward Migration Dynamics of Skipjack Tuna (Katsuwonus Pelamis) Associated With the Lower Thermal Limit in the Western Pacific Ocean. Prog. Oceanography. 175, 55–67. doi: 10.1016/j.pocean.2019.03.006
Lan K.-W., Evans K., Lee M.-A. (2013). Effects of Climate Variability on the Distribution and Fishing Conditions of Yellowfin Tuna (Thunnus Albacares) in the Western Indian Ocean. Climatic. Change 119 (1), 63–77. doi: 10.1007/s10584-012-0637-8
Lehodey P., Bertignac M., Hampton J., Lewis A., Picaut J. (1997). El Niño Southern Oscillation and Tuna in the Western Pacific. Nature 389 (6652), 715–718. doi: 10.1038/39575
Levine A. F. Z., McPhaden M. J., Frierson D. M. W. (2017). The Impact of the AMO on Multidecadal ENSO Variability: AMO IMPACTS ON ENSO. Geophysical. Res. Lett. 44 (8), 3877–3886. doi: 10.1002/2017GL072524
Lima M., Naya D. E. (2011). Large-Scale Climatic Variability Affects the Dynamics of Tropical Skipjack Tuna in the Western Pacific Ocean. Ecography 34 (4), 597–605. doi: 10.1111/j.1600-0587.2010.06422.x
Litzow M. A., Ciannelli L., Puerta P., Wettstein J. J., Rykaczewski R. R., Opiekun M. (2018). Non-Stationary Climate–Salmon Relationships in the Gulf of Alaska. Proc. R. Soc. B: Biol. Sci. 285 (1890), 20181855. doi: 10.1098/rspb.2018.1855
Ma S., Tian Y., Fu C., Yu H., Li J., Liu Y., et al. (2021). Climate-Induced Nonlinearity in Pelagic Communities and non-Stationary Relationships With Physical Drivers in the Kuroshio Ecosystem. Fish. Fisheries 22 (1), 1–17. doi: 10.1111/faf.12502
Ma S., Tian Y., Li J., Yu H., Cheng J., Sun P., et al. (2020). Climate Variability Patterns and Their Ecological Effects on Ecosystems in the Northwestern North Pacific. Front. Mar. Sci. 7. doi: 10.3389/fmars.2020.546882
Ménard F., Marsac F., Bellier E., Cazelles B. (2007). Climatic Oscillations and Tuna Catch Rates in the Indian Ocean: A Wavelet Approach to Time Series Analysis. Fisheries Oceanography. 16 (1), 95–104. doi: 10.1111/j.1365-2419.2006.00415.x
Moore B. R., Bell J. D., Evans K., Farley J., Grewe P. M., Hampton J., et al. (2020). Defining the Stock Structures of Key Commercial Tunas in the Pacific Ocean I: Current Knowledge and Main Uncertainties. Fisheries Res. 230, 105525. doi: 10.1016/j.fishres.2020.105525
Mugo R., Saitoh S.-I., Igarashi H., Toyoda T., Masuda S., Awaji T., et al. (2020). Identification of Skipjack Tuna (Katsuwonus Pelamis) Pelagic Hotspots Applying a Satellite Remote Sensing-Driven Analysis of Ecological Niche Factors: A Short-Term Run. PLoS One 15 (8), e0237742. doi: 10.1371/journal.pone.0237742
Mukti Z., Saitoh S. (2004). Detection of Potential Fishing Ground for Albacore Tuna Using Synoptic Measurements of Ocean Color and Thermal Remote Sensing in the Northwestern North Pacific. Geophysical. Res. Lett. 31 (20), L20311. doi: 10.1029/2004GL021000
Nakayama S., Takasuka A., Ichinokawa M., Okamura H. (2018). Climate Change and Interspecific Interactions Drive Species Alternations Between Anchovy and Sardine in the Western North Pacific: Detection of Causality by Convergent Cross Mapping. Fisheries Oceanography. 27 (4), 312–322. doi: 10.1111/fog.12254
Puerta P., Ciannelli L., Rykaczewski R. R., Opiekun M., Litzow M. A. (2019). Do Gulf of Alaska Fish and Crustacean Populations Show Synchronous non-Stationary Responses to Climate? Prog. Oceanography. 175, 161–170. doi: 10.1016/j.pocean.2019.04.002
Salazar J. E., Benavides I. F., Portilla Cabrera C. V., Guzmán A. I., Selvaraj J. J. (2021). Generalized Additive Models With Delayed Effects and Spatial Autocorrelation Patterns to Improve the Spatiotemporal Prediction of the Skipjack (Katsuwonus Pelamis) Distribution in the Colombian Pacific Ocean. Regional. Stud. Mar. Sci. 45, 101829. doi: 10.1016/j.rsma.2021.101829
Sugihara G. (1994). Nonlinear Forecasting for The Classification of Natural Time-Series. Philos. Trans. R. Soc. A-Mathematical. Phys. Eng. Sci. 348 (1688), 477–495. doi: 10.1098/rsta.1994.0106
Sugihara G., May R. (1990). Nonlinear Forecasting as A Way of Distinguishing Chaos From Measurement Error in Time-Series. Nature 344 (6268), 734–741. doi: 10.1038/344734a0
Sugihara G., May R., Ye H., Hsieh C., Deyle E., Fogarty M., et al. (2012). Detecting Causality in Complex Ecosystems. Science 338 (6106), 496. doi: 10.1126/science.1227079
Sugimoto T., Kimura S., Tadokoro K. (2001). Impact of El Niño Events and Climate Regime Shift on Living Resources in the Western North Pacific. Prog. Oceanography. 49 (1–4), 113–127. doi: 10.1016/S0079-6611(01)00018-0
Sun C., Kucharski F., Li J., Jin F.-F., Kang I.-S., Ding R. (2017). Western Tropical Pacific Multidecadal Variability Forced by the Atlantic Multidecadal Oscillation. Nat. Commun. 8 (1), 15998. doi: 10.1038/ncomms15998
Sun C., Liu Y., Gong Z., Kucharski F., Li J., Wang Q., et al. (2020). The Footprint of Atlantic Multidecadal Oscillation on the Intensity of Tropical Cyclones Over the Western North Pacific. Front. Earth Sci. 8. doi: 10.3389/feart.2020.604807
Sun C., Liu Y., Xue J., Kucharski F., Li J., Li X. (2021). The Importance of Inter-Basin Atmospheric Teleconnection in the SST Footprint of Atlantic Multidecadal Oscillation Over Western Pacific. Climate Dynamics. 57 (1-2), 239–252. doi: 10.1007/s00382-021-05705-z
Syamsuddin M. L., Saitoh S.-I., Hirawake T., Bachri S., Harto A. B. (2013). Effects of El Niño–Southern Oscillation Events on Catches of Bigeye Tuna (Thunnus Obesus) in the Eastern Indian Ocean Off Java. Fishery. Bull. 111 (2), 175–188. doi: 10.7755/FB.111.2.5
Takano T., Iwaki T., Waki T., Murata R., Suzuki J., Kodo Y., et al. (2021). Species Composition and Infection Levels of Anisakis (Nematoda: Anisakidae) in the Skipjack Tuna Katsuwonus Pelamis (Linnaeus) in the Northwest Pacific. Parasitol. Res. 120(5) , 1605–1615. doi: 10.1007/s00436-021-07144-5
Tangke U., Silooy F. D., Rochmady, Saing Z. (2020). Sea Surface Temperature and Chlorophyll-a Condition of Skipjack Tuna (Katsuwonus Pelamis) Catching Area in Ternate Island Marine Waters. J. Physics.: Conf. Ser. 1517, 12039. doi: 10.1088/1742-6596/1517/1/012039
Tawa A., Kodama T., Sakuma K., Ishihara T., Ohshimo S. (2020). Fine-Scale Horizontal Distributions of Multiple Species of Larval Tuna Off the Nansei Islands, Japan. Mar. Ecol. Prog. Ser. 636, 123–137. doi: 10.3354/meps13216
Tian Y., Uchikawa K., Ueda Y., Cheng J. (2014). Comparison of Fluctuations in Fish Communities and Trophic Structures of Ecosystems From Three Currents Around Japan: Synchronies and Differences. ICES. J. Mar. Sci. 71 (1), 19–34. doi: 10.1093/icesjms/fst169
Tsonis A. A. (Ed.) (2018). Advances in Nonlinear Geosciences ( Springer International Publishing), Cham, Switzerland. doi: 10.1007/978-3-319-58895-7
Vincent M. T., Pilling G. M., Hampton J. (2019) Stock assessment of skipjack tuna in the western and central Pacific Ocean. Scientific Committee Fifteenth Regular Session, WCPFC-SC15-2019/SA-WP-05-Rev2.
Wang J., Yang B., Ljungqvist F. C., Luterbacher J., Osborn T. J., Briffa K. R., et al. (2017). Internal and External Forcing of Multidecadal Atlantic Climate Variability Over the Past 1,200 Years. Nat. Geosci. 10 (7), 512–517. doi: 10.1038/ngeo2962
Wu Y.-L., Lan K.-W., Tian Y. (2020a). Determining the Effect of Multiscale Climate Indices on the Global Yellowfin Tuna (Thunnus Albacares) Population Using a Time Series Analysis. Deep. Sea. Res. Part II: Topical. Stud. Oceanography. 175, 104808. doi: 10.1016/j.dsr2.2020.104808
Wu B., Lin X., Yu L. (2020b). North Pacific Subtropical Mode Water is Controlled by the Atlantic Multidecadal Variability. Nat. Climate Change 10 (3), 238–243. doi: 10.1038/s41558-020-0692-5
Ye H., Deyle E. R., Gilarranz L. J., Sugihara G. (2015). Distinguishing Time-Delayed Causal Interactions Using Convergent Cross Mapping. Sci. Rep. 5 (1), 14750. doi: 10.1038/srep14750
Ye H., Sugihara G. (2016). Information Leverage in Interconnected Ecosystems: Overcoming the Curse of Dimensionality. Science 353 (6302), 922–925. doi: 10.1126/science.aag0863
Yu W., Chen X., Zhang Y., Yi Q. (2019). Habitat Suitability Modelling Revealing Environmental-Driven Abundance Variability and Geographical Distribution Shift of Winter-Spring Cohort of Neon Flying Squid Ommastrephes Bartramii in the Northwest Pacific Ocean. Ices. J. Mar. Sci. 76 (6), 1722–1735. doi: 10.1093/icesjms/fsz051
Zainuddin M. (2011). Skipjack Tuna in Relation to Sea Surface Temperature and Chlorophyll-A Concentration of Bone Bay Using Remotely Sensed Satellite Data. Jurnal. Ilmu. Dan. Teknologi. Kelautan. Tropis. 3 (1), 9. doi: 10.29244/jitkt.v3i1.7837
Zhang R., Delworth T. L. (2007). Impact of the Atlantic Multidecadal Oscillation on North Pacific Climate Variability: Impact on North Pacific Variability. Geophysical. Res. Lett. 34 (23), 229–241. doi: 10.1029/2007GL031601
Keywords: Skipjack tuna, climate variability, causality, trans-basin teleconnection, nonstationary relationship
Citation: Hou X, Ma S, Tian Y and Zhang S (2022) The Effects of Trans-Basin Climate Variability on Skipjack Tuna in the Northwest Pacific Ocean: Causal and Nonstationary. Front. Mar. Sci. 9:895219. doi: 10.3389/fmars.2022.895219
Received: 13 March 2022; Accepted: 01 June 2022;
Published: 18 July 2022.
Edited by:
Jun Xu, Institute of Hydrobiology (CAS), ChinaReviewed by:
Xinqing Zheng, State Oceanic Administration, ChinaLilis Sadiyah, Center for Fisheries Research, Indonesia
Copyright © 2022 Hou, Ma, Tian and Zhang. This is an open-access article distributed under the terms of the Creative Commons Attribution License (CC BY). The use, distribution or reproduction in other forums is permitted, provided the original author(s) and the copyright owner(s) are credited and that the original publication in this journal is cited, in accordance with accepted academic practice. No use, distribution or reproduction is permitted which does not comply with these terms.
*Correspondence: Yongjun Tian, eWp0aWFuQG91Yy5lZHUuY24=