- 1State Key Laboratory of Satellite Ocean Environment Dynamics, Second Institute of Oceanography, Ministry of Natural Resources, Hangzhou, China
- 2Observation and Research Station of Yangtze River Delta Marine Ecosystems, Ministry of Natural Resources, Zhoushan, China
- 3Key Laboratory of Ocean Space Resource Management Technology, Ministry of Natural Resources, Marine Academy of Zhejiang Province, Hangzhou, China
- 4Ocean College, Zhejiang University, Zhoushan, China
- 5Innovation Team, Southern Marine Science and Engineering Guangdong Laboratory (Zhuhai), Zhuhai, China
- 6Atmospheric and Oceanic Sciences Program, Princeton University, Princeton, NJ, United States
- 7Institute of Coastal Systems—Analysis and Modeling, Helmholtz−Zentrum Hereon, Geesthacht, Germany
- 8Key Laboratory of Marine Ecosystem Dynamics, Ministry of Natural Resources, Second Institute of Oceanography, Ministry of Natural Resources, Hangzhou, China
- 9Guangxi Key Laboratory of Beibu Gulf Marine Resources, Environment and Sustainable Development, Fourth Institute of Oceanography, Ministry of Natural Resources, Beihai, China
Details of the development of coastal hypoxia in response to the passage of Typhoon Bavi (2020) in the East China Sea were reconstructed by numerical modeling using a three-dimensional coupled physical–biogeochemical model. The model was validated via repeated surveys along a transect across a submerged river valley off the Changjiang Estuary before and after the passage of Typhoon Bavi. Before Bavi’s arrival, survey data indicated that the coastal hypoxia had formed off the Changjiang Estuary. However, the hypoxia was not eliminated but instead migrated and aggravated along the observed transect after the typhoon passage. This phenomenon cannot be attributed to the typhoon-induced mixing. Simulation results reveal that the observed development and spatial migration of hypoxia was mainly controlled by typhoon-induced oceanic advection. Results show that Bavi stimulated a regional quasi-barotropic cyclonic loop circulation and coastal downwelling reversing general summer circulation patterns. The onshore transport of the warmer shelf water and subsequent downwelling resulted in a warming of coastal water. The southward coastal current and downwelling induced by the typhoon also led to a migration of the hypoxic zone. Meanwhile, a massive transport of resuspended planktonic detritus from the steep inner shelf and the shallow Changjiang bank toward the submerged river valley occurred. This study reveals that the typhoon-driven currents can play an important role in the development of hypoxia and redistribution of deposited organic matter in coastal shelf seas, which may have both short- and long-term effects on the regional marine biogeochemical environment.
Introduction
A tropical cyclone (TC), referred to as a “typhoon” when occurring in the northwestern Pacific Ocean with a maximum wind speed of at least 32.7 m·s−1, exerts significant impact on the ocean through the input of freshwater and exchange of momentum and heat over several hundreds of kilometers around its center (Price, 1981; Morey et al., 2006; Mei et al., 2015). Recovery of the upper ocean in response to passage of a TC may take several days to weeks (Hazelworth, 1968; Price et al., 1986; Hart et al., 2007; Wang et al., 2016; Zhang et al., 2021). The violent synoptic disturbance brought by TCs may also cause dramatic changes in the marine environment (Chai et al., 2021; Zhang et al., 2021). Recently, an increase in the frequency of TCs passing coastal seas has been revealed by Wang and Toumi (2021) as a global pattern. This indicates an increasing impact of TCs on coastal ecosystems.
Widespread coastal hypoxia, conventionally defined as occurring when the dissolved oxygen (DO) concentration falls below 2–3 mg·L−1, degrades the biodiversity and the resilience of marine ecosystems (Wu, 2002; Diaz and Rosenberg, 2008; Vaquer-Sunyer and Duarte, 2008; Breitburg et al., 2018; Fennel and Testa, 2019). Coastal hypoxia is sensitive to mixing and advection (Ni et al., 2016; Zhou et al., 2017; Zhang W. et al., 2019; Zhou et al., 2020). The response of coastal hypoxia to TCs is associated with the interaction of the local biogeochemical environment and the extreme weather conditions produced by a TC, which may lead to severe ecological hazards (Stauffer et al., 2012). Coastal hypoxia also mediates the mean CO2 air–sea flux (Li et al., 2019; Yu et al., 2020). In order to understand the impact of TCs on the long-term CO2 air–sea flux, it is important to distinguish the responses of hypoxic and non-hypoxic zones to the impact of TCs (Li et al., 2019).
In the open upper ocean, a TC can deepen the mixed layer, drive non-axisymmetrical surface Ekman cyclonic divergence flow, and shed near-inertial wakes and internal waves (Zhang et al., 2021). A TC will cool the sea surface primarily via enhancing vertical mixing, which is also attributed to TC-induced upwelling and air–sea heat exchange; meanwhile, a TC will warm the subsurface water due to mixing, which is also modulated by near-inertial pumping (Zhang H. et al., 2016; Zhang H. et al., 2019). During the recovery period, high-chlorophyll patches are frequently observed along TC tracks at the sea surface (Pan et al., 2017), which can be up to 30-fold more concentrated when compared to conditions before the passage of a TC (Lin et al., 2003), although the underlying mechanisms are still not clear (Chai et al., 2021).
The confined lateral boundaries and shallow depth of coastal waters make the hydrodynamic response to the passage of a TC more complicated than that in the open ocean (Halliwell et al., 2011; Glenn et al., 2016; Seroka et al., 2016). One distinct phenomenon is that passage of a TC may result in an increase in the coastal sea surface temperature (SST) when its periphery sweeps the coast (Sun et al., 2014; Seroka et al., 2016; Seroka et al., 2017; Zhang Z. et al., 2019; Jin et al., 2020; Wang and Zhang, 2021). The increase in coastal SST is caused by the advection driven by a TC, which transports the warmer shelf water towards the coast to overlay the cooler coastal water. Similar phenomena also occur in late summer and autumn in other regions subject to storms when surface water temperatures are higher at mid-shelf than along coasts (Zhang W. et al., 2016). Zhang Z. et al. (2019) even found that the increase in coastal SST in turn contributed to the rapid intensification of a TC before landfall. The onshore water transport further induced coastal downwelling episodically in an upwelling prevailing season (Zhang Z. et al., 2019). To date, the nature of the hypoxia response in association with TC-induced coastal ocean warming remains unknown.
Several observational endeavors, including the cruise in this study, found that a coastal hypoxic zone still persisted despite of the passage of a TC (Su et al., 2017; Wang et al., 2017; Guo et al., 2019; Zhao et al., 2021). The time series data obtained from moorings further revealed the relief and the subsequential reoccurrence of hypoxia off the Changjiang Estuary in response to the passage of the TC (Ni et al., 2016). Ni et al. (2016) suggested that although the strong winds from the TC would relieve the hypoxic conditions through mixing, the mixing would also support a subsequent phytoplankton bloom and result in re-establishment of hypoxia. Wang et al. (2017) suggested that apart from the strong mixing, the elevated river discharge caused by TC-induced heavy rainfall would also contribute to the nutrients needed by the subsequent phytoplankton bloom to re-establish hypoxia. Zhao et al. (2021) found that although the local respiration rate was the major driver of hypoxia after passage of the TC, the invasion of subsurface water from the outer-shelf with low-oxygen content also contributed an additional 8.6 ± 1.7% of the depletion of DO in the hypoxic zone off the Pearl River Estuary. Guo et al. (2019) found that although a TC eye passed through the core hypoxic zone, the stratification at the submerged river valley off the Changjiang Estuary was not completely eliminated and the residual hypoxic water persisted there. The case studies have suggested quite complex and various coupled physical–biogeochemical responses in terms of hypoxia to a passing TC.
The East China Sea (ECS) is located on a wide continental shelf and enclosed by the northwestern Pacific Ocean, which is often exposed to typhoons. On average, ~5 typhoons cross the ECS mostly in the summer and autumn (Li et al., 2019). Seasonal hypoxic zones have been often found off the Changjiang Estuary and in the submerged river valley, which are distributed from 28°N to 33°N (Figure 1A) (Li et al., 2002; Wei et al., 2007; Zhou et al., 2010; Zhu et al., 2011; Wang et al., 2012; Zhang W. et al., 2019; Chi et al., 2020; Zhou et al., 2020). Therefore, the ECS is an ideal region for studying the responses of coastal hypoxia to typhoons passing in various scenarios. This study focused on a scenario that the passing typhoon is incapable to completely destroy the stratification at the hypoxic zone owing to insufficient wind speed or impacting duration. In that scenario, both the hypoxic water mass and particulate organic matter may be migrated by the typhoon-induced oceanic advection, which appends new knowledge to the diversity in the typhoon–hypoxia interaction.
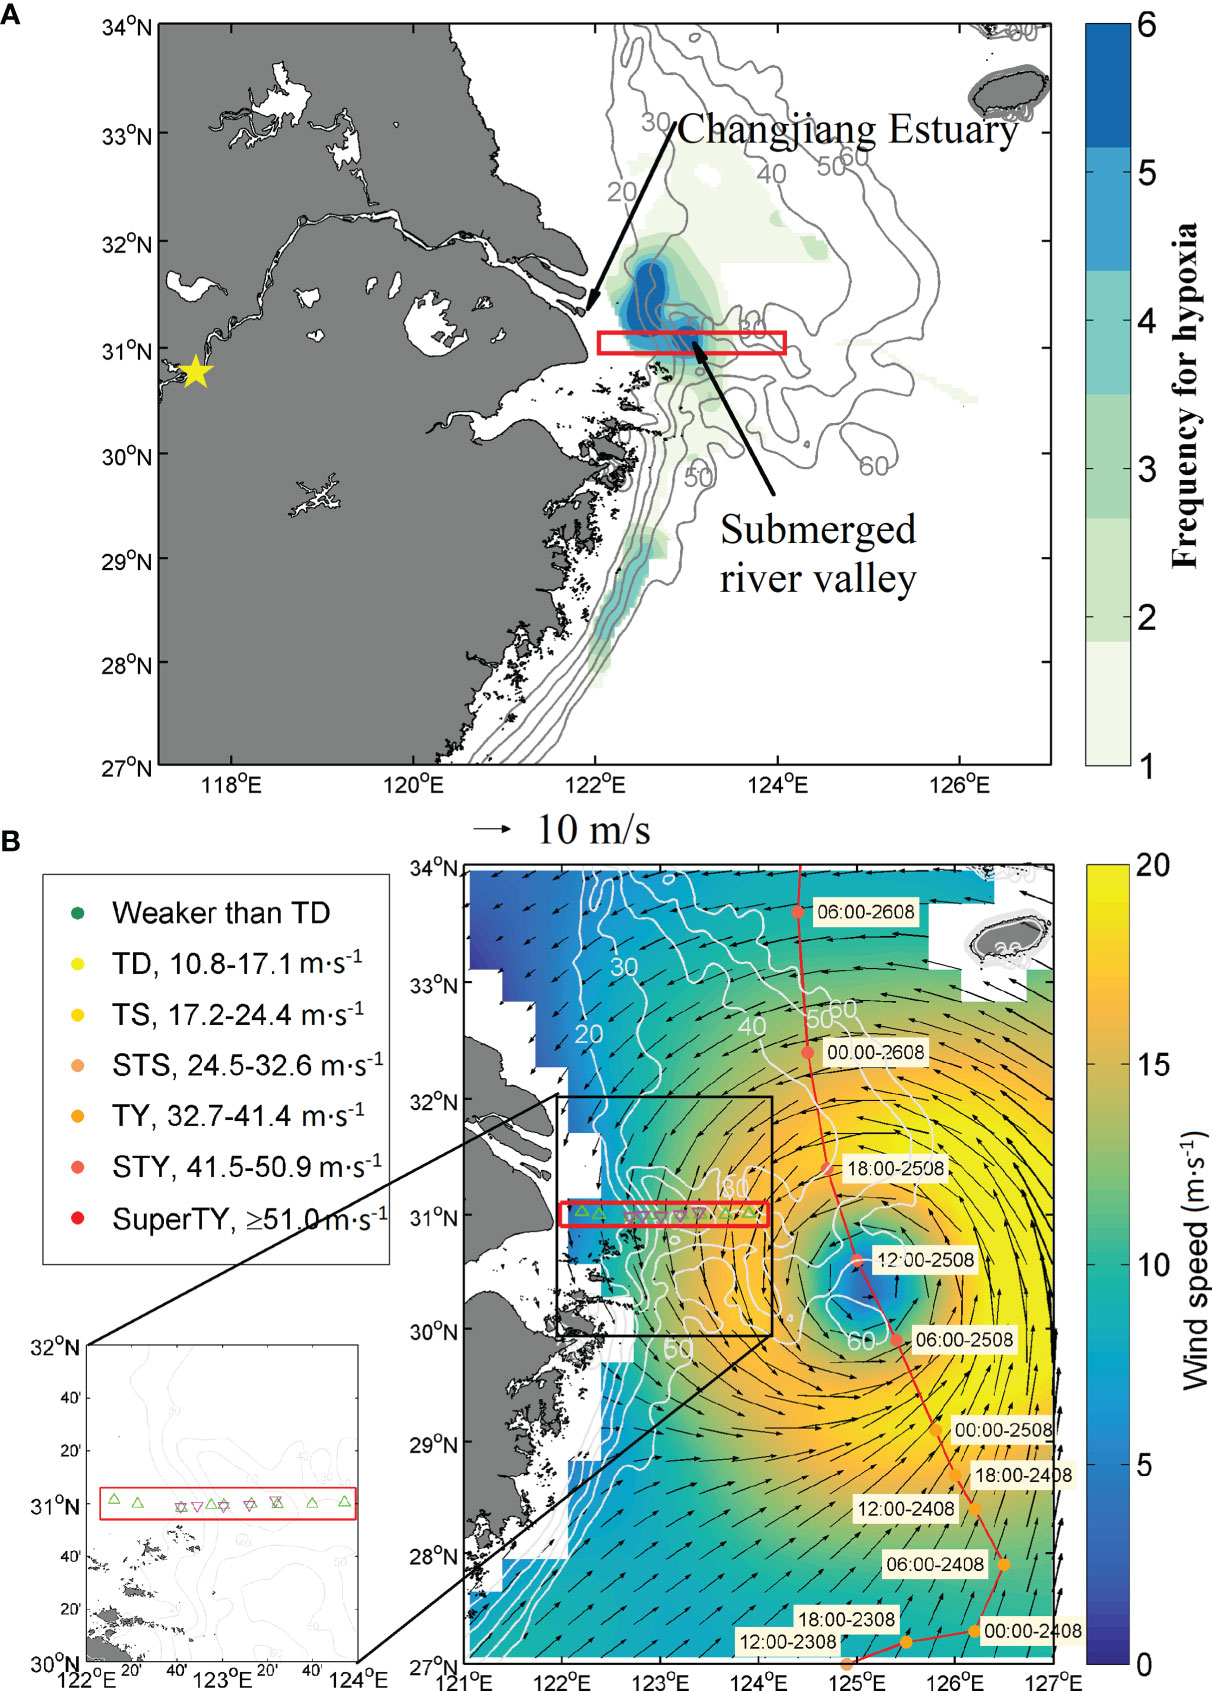
Figure 1 (A) The occurrence frequency for hypoxia off the Changjiang Estuary retrieved from 20 ship-borne surveys from 1988 to 2015 based on 3.0 mg·L−1 contours of dissolved oxygen (DO) concentration. Cruise information and hypoxia extents can be referred to Zhou et al. (2020). The isobaths are shown by gray contours with 10-m intervals from 20 to 60 m. The location of “Datong hydrologic station” is indicated by a yellow pentagram. (B) The wind field vectors over the ECS at 12:00, August 25, 2020 were derived from the cross-calibrated multi-platform (CCMP) ocean vector wind analysis product and are denoted by black vectors where the color indicates speed. The typhoon track (red line) was derived from the western north Pacific Tropical Cyclone database created by the China Meteorological Administration (Ying et al., 2014; Lu et al., 2021). Typhoon strength is classified by the maximum wind speed near the center of the circulation denoted by dots in different colors with the strength marked every 6 h (format: time–date). TD, tropical depression; TS, tropical storm; STS, severe tropical storm; TY, typhoon; STY, severe typhoon; SuperTY, super typhoon. The sampling stations before and after the typhoon passage are denoted by green upward-pointing triangles and purple downward-pointing triangles, respectively. The red rectangle highlights the transect analyzed in this study. The isobaths are shown using white contours at 10-m intervals from 20 to 60 m. A zoomed-in map appears below the legend.
Materials and Methods
Ship-Borne Survey
A ship-borne survey was conducted off the Changjiang Estuary for hypoxia from August 17 to 30, 2020. Prior to that cruise, Tropical Storm Jangmi (Enteng) passed the ECS with a lifetime from August 6 to 11. During the cruise, Typhoon Bavi (Figure 1B) passed the ECS. Bavi developed initially in the northwestern Pacific Ocean, skirted the Island of Taiwan, and finally entered the ECS heading to the northeast. It then went north on August 24. During its passage over the ECS, its eye was mostly off the 40-m isobath. Bavi had gradually intensified over the ECS and became a typhoon on August 24. It crossed the latitude where the submerged river valley is located on the 25th and reached its peak intensity on the 26th. Bavi left the ECS from the north boundary on the 26th. This typhoon stayed ~200 km from the west coast of mainland China during its passage over the ECS (Figure 1B). Many typhoons have followed similar paths while passing over the ECS (Sun et al., 2015). The cruise was then divided into two legs, which were conducted from the 17th to 22nd before the typhoon passage and from the 28th to 30th after the typhoon passage, respectively. The first leg took in situ measurements at nine stations along the 31°N transect as shown in Figure 1B. The second leg revisited the 31°N transect with measurements taken at five stations (Figure 1B). An SBE911 plus CTD with SBE-43 DO and FLNTURTD-6001 sensors was used to collect temperature, salinity, DO, chlorophyll-a (Chla), and turbidity profiles.
Remote Sensing Datasets
Two Optimally Interpolated (OI) SST products involving multi-platform remote sensing data and other available observational data were employed for model validation. One product was obtained from the US National Oceanic and Atmospheric Administration (NOAA) with a resolution of 1/4° (Reynolds et al., 2007) (available at https://psl.noaa.gov/dat/gridded/data.noaa.oisst.v2.highres.html). The other, with a resolution of 9 km, was produced by the Remote Sensing Systems (REMSS), which was sponsored by US National Oceanographic Partnership Program and the US National Aeronautics and Space Administration Earth Science Physical Oceanography Program (Wentz et al., 2000) (available at www.remss.com).
Model Description
A coupled physical–biogeochemical model was applied. The physical module was based on a customized Regional Ocean Modeling Systems (ROMS) model particularly tuned for the ECS (Shchepetkin and McWilliams, 2005; Haidvogel et al., 2008; Zhou et al., 2015; Zhou et al., 2017). The biogeochemical module was based on the carbon, silicate, and nitrogen ecosystem (CoSiNE) model (Chai et al., 2002; Xiu and Chai, 2014). The coupled ROMS-CoSiNE model (hereafter BYESbio24) was capable of simulating the seasonal, and synoptic, variation of the hypoxic zone in the ECS (Zhou et al., 2017; Zhou et al., 2020; Tian et al., 2022).
The curvilinear grid of the BYESbio24 model covered 117.5−132.0°E and 23.5−41.0°N with a homogeneous 1/24° horizontal resolution. The s-coordinate terrain-following vertical grid had 30 levels. For spin-up, a flow field was initiated from a climatological January mean based on observations spanning from 1958 to 1987 (Chen, 1992) and driven by climatological Comprehensive Ocean–Atmosphere Data Set (COADS, available at http://iridl.ldeo.columbia.edu/SOURCES/) with forcings for three annual cycles. The climatological run output was then used as the initial field for a continuous realistic run from 1998 to 2020. The daily-averaged outputs in 2020 were analyzed in this study. The detailed setup is listed by Zhou et al. (2015). Furthermore, the lateral and surface forcings in the present study were updated along with newly released products. The tidal constituents including major diurnal and semi-diurnal components were derived from the Oregon State University TPXO9-atlas (Egbert and Erofeeva, 2002). The 6-hourly wind field was obtained from the cross-calibrated multi-platform (CCMP, available at www.remss.com) ocean vector wind analysis product (Atlas et al., 2011; Wentz et al., 2015; Mears et al., 2019). Figure 1B shows that the typhoon eye location from the CCMP dataset was consistent with that from the western north Pacific TC database created by the China Meteorological Administration (Ying et al., 2014; Lu et al., 2021). Any wind speed that was larger than 25 m·s−1 was reassigned as 25 m·s−1, and this was then converted to the sea surface stress via the formula by Large and Pond (1981) because the wind-induced stress ceases to increase or perhaps decreases slightly with TC-scale winds (Powell et al., 2003). The surface heat and freshwater fluxes were obtained from the European Centre for Medium-Range Weather Forecasts ERA5 product (Hersbach, 2019; Hersbach et al., 2020) (available at https://cds.climate.copernicus.eu/cdsapp#!/dataset/reanalysis-era5-single-levels?tab=overview). The temperature, salinity, velocity, and sea level elevation at open boundaries were nudged to the daily-mean HYbrid Coordinate Ocean Model (available at https://www.hycom.org) hindcast outputs (George and Halliwell, 1998; Bleck, 2002; Kelly et al., 2007). The CoSiNE model consisted of 13 state variables: nitrate, phosphate, silicate, ammonium, diatoms, picophytoplankton, microzooplankton, mesozooplankton, nitrogen-based detritus organic matter (hereafter detritus), biogenic silica detritus, DO, total CO2, and total alkalinity. The model framework was elaborated by Chai et al. (2002) and Xiu and Chai (2014). The customized CoSiNE model, particularly for the ECS and Changjiang Estuary, was provided by Zhou et al. (2017). The runoff and nutrient concentrations at Datong hydrological station in the lower reach of the Changjiang River (Figure 1A) were from the Changjiang Maritime Safety Administration (available at https://cj.msa.gov.cn/ ) and measurements by the research team in the Second Institute of Oceanography, Ministry of Natural Resources, respectively. For other setups, parameterization schemes, parameters, and validations, one can refer to Zhou et al. (2017), Zhou et al. (2020). The ROMS and CoSiNE modules were coupled online, i.e., all the 13 state variables were driven by the real-time hydrodynamics.
Results
Model Validation and Limitations
In order to validate the modeled SST, the simulated daily-mean SSTs averaged over the ECS for the entire year were compared with the two OI SST products (Figure 2). The high correlation coefficients between the model outputs and the observational products suggest good performance of the model in simulating the daily variation in temperature. The heterogeneous SST change after Bavi’s passage was also well reproduced by the model (Figure 3). The model (Figure 3A) and the two OI SST products (Figures 3B, C) all exhibit sea surface cooling to the east of approximately 123°E and sea surface warming approximately to the west of 123°E in response to Bavi’s passage. Note that the model estimated milder cooling than that found by the OI SST products, while the sea surface warming in the model was stronger. The daily-mean model outputs were further compared with survey data for profiles in terms of temperature, salinity, Chla, and DO in Figures 4A–D. The model outputs agreed relatively well with both of the measurements during Legs 1 and 2 taking into the dramatic variations induced by the passing typhoon. Figures 4A–D also indicate some substantial discrepancies between the observed and simulated parameters. Looking into the individual profiles, the model overestimated the temperature of a bottom water mass, which was with an observed temperature of ~19°C found during Leg 1, to the east of 123.5°E (Figure 4A). This suggests that the model probably underestimated the stratification where the Taiwan warm current (TWC) prevails before the passage of Bavi. The model overestimated the salinity of the Changjiang diluted water (CDW) particularly within the observed range of 25–30 PSU during Leg 1 (Figure 4B). This suggests that the model probably underestimated the mixing near the Changjiang Estuary. The model generally overestimated the DO concentration in bottom water when the observed DO concentration was <8 mg·L−1 (Figure 4D). This is probably because the sediment oxygen consumption was not taken into account by the model (Meng et al., 2022).
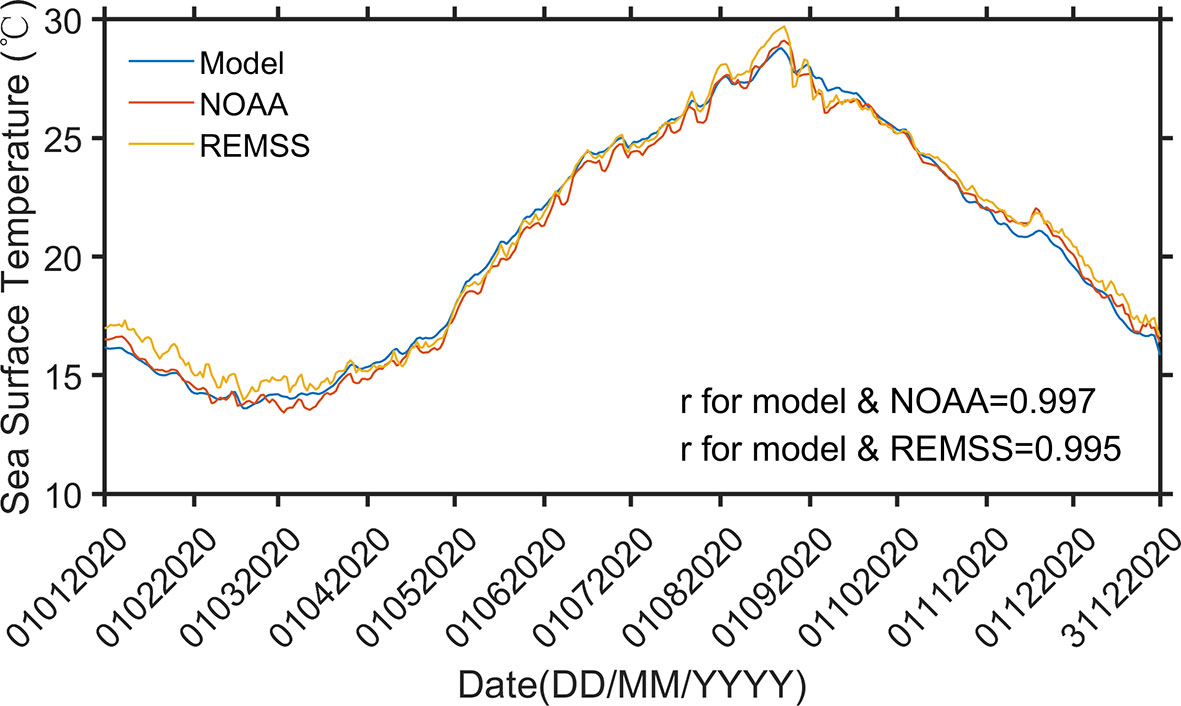
Figure 2 Averaged daily mean sea surface temperature (SST) within 121–127°E and 27–32°N from the numerical model (in this figure: Model), US National Oceanic and Atmospheric Administration (NOAA) Optimally Interpolated (OI) SST product (in this figure: NOAA), and the Remote Sensing Systems OI SST product (in this figure: REMSS) over time. The Pearson correlation coefficients between the model outputs and the observational products, r, are shown.
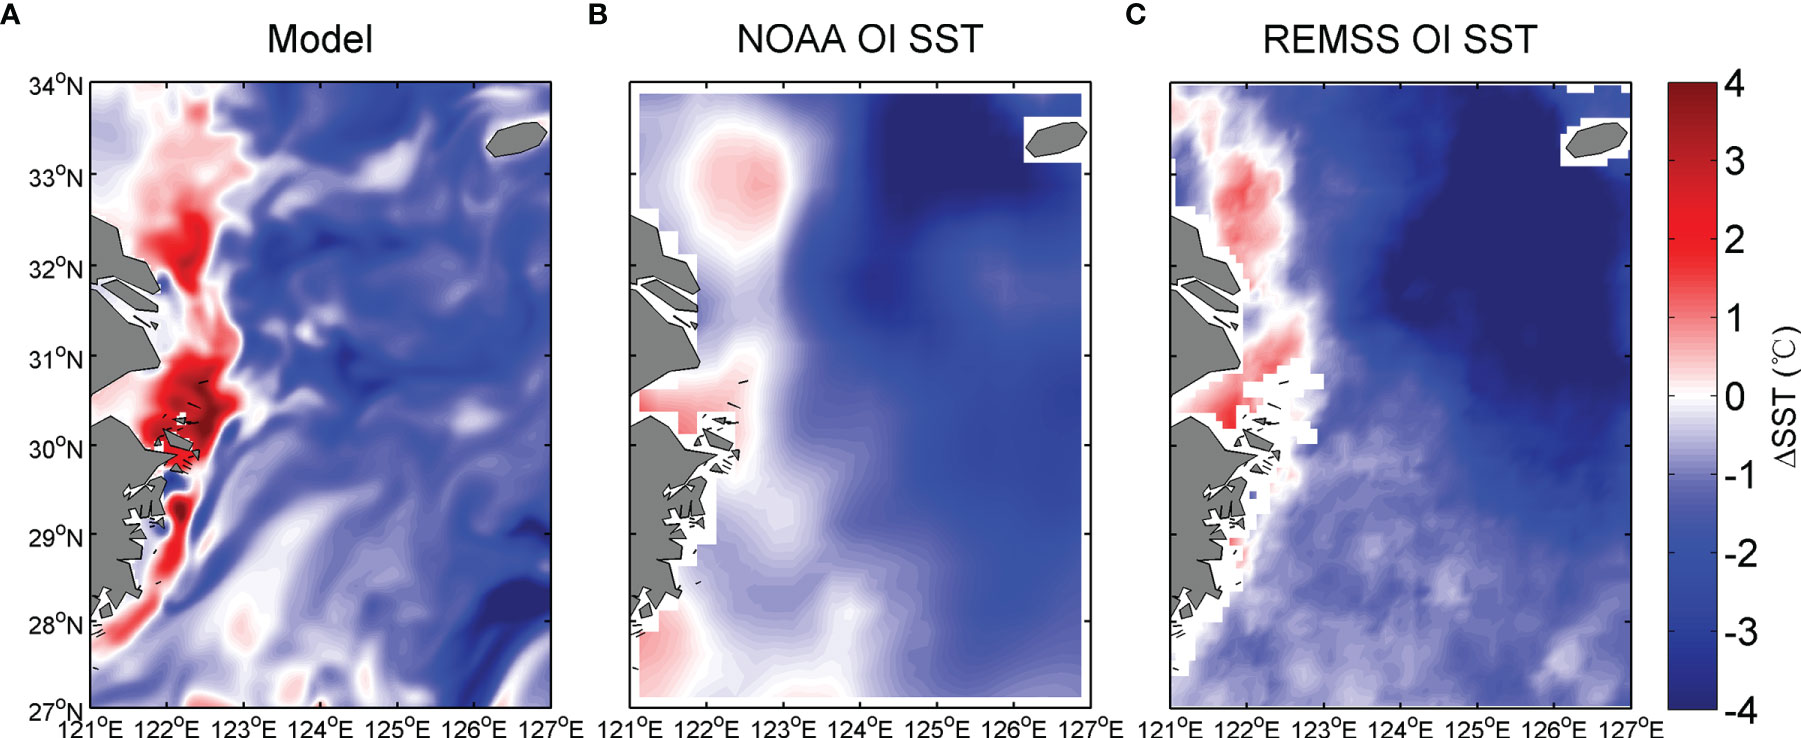
Figure 3 Sea surface temperature (SST) difference (ΔSST) found by subtracting daily mean SST on August 22, 2020 from that on August 28, 2020 derived from the (BYESbio24 model; (A), US National Oceanic and Atmospheric Administration (NOAA) Optimally Interpolated (OI) SST product (B), and Remote Sensing Systems (REMSS) OI SST product (C).
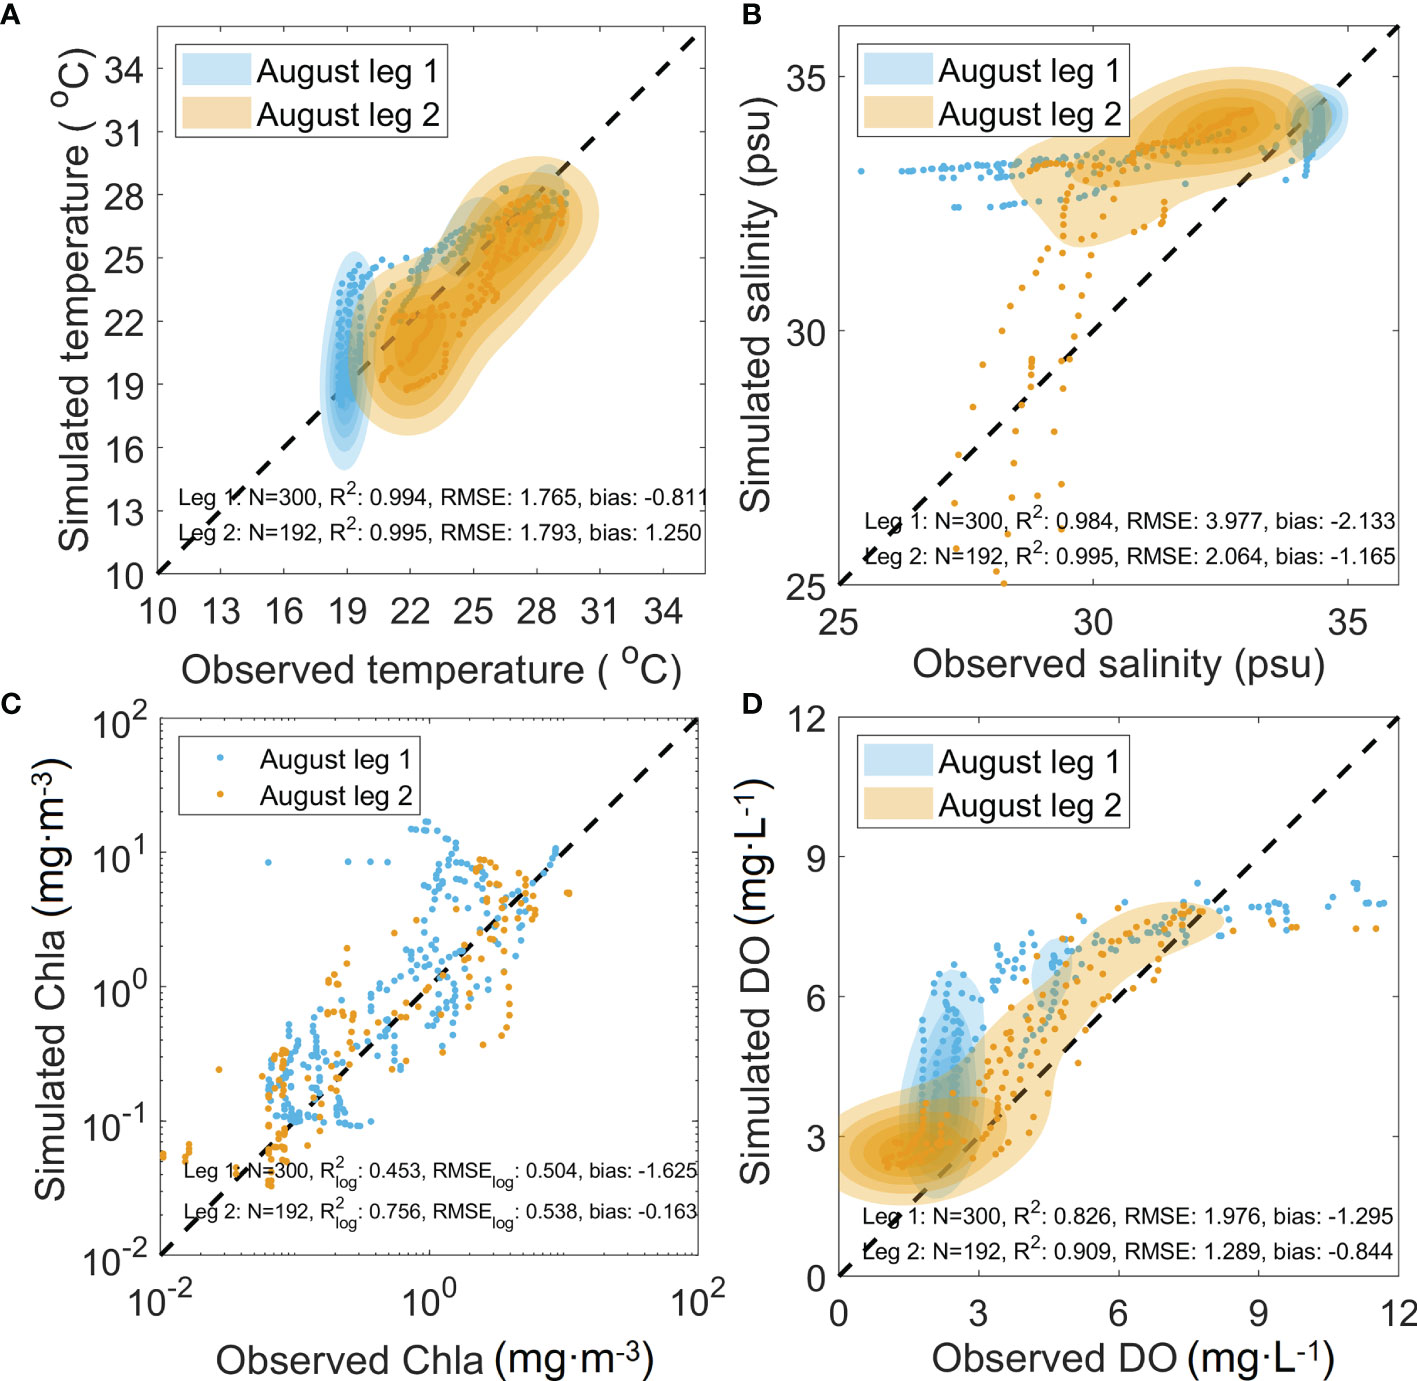
Figure 4 Point to point comparisons between the survey data and the daily-mean model outputs. Measured (A) temperature, (B) salinity, (C) chlorophyll-a (Chla), and (D) dissolved oxygen (DO) data at 1-m-depth intervals were retrieved from stations conducted during Leg 1 (blue) and Leg 2 (orange). The darker patch in Panels (A, B, D) indicates the higher point density. The number of samples (N), coefficient of determination (R2), root-mean-square error (RMSE), and bias are exhibited in the figure. The coefficient of determination and root-mean-square error in Panel (C) were calculated in logarithmic space, which are denoted by and RMSElog, respectively.
Repeated survey at the 31°N transect revealed complex three-dimensional variations in both hydrographical and ecological environments in response to Bavi’s passage (Figures 5A–C). The survey also revealed that surface cooling occurred to the east of 123°E, while surface warming occurred to the west of 123°E, which is consistent with the findings of the OI SST products (Figures 3B, C). However, subsurface warming occurred beneath the cooled surface layer based on the survey data. Correspondingly, both the coastal water to the west of 123°E and the subsurface water to the east of 123°E were diluted, while the offshore surface water to the east of 123°E was condensed as inferred from the variation in salinity field (Figure 5B). The variation in DO was more complicated and exhibited a sandwich-like vertical structure particularly to the east of 123°E; that is, in response to the passage of Bavi, DO concentration declined, increased, and declined again from the surface to the subsurface, and at the bottom, respectively. In Figures 5D–F, the daily-mean state variables on the 22nd were subtracted from those on the 28th to represent the simulated coastal ocean response to the passage of Bavi. Figure 5D shows that the model reproduced the turnover from sea surface warming to sea surface cooling quite well at approximately 123°E, and the internal warming that occurred to the east of 123°E. Nevertheless, the simulated cooled surface layer depth was thicker than that of the observational result. Figure 5E shows that the model also reproduced the near-shore freshening response and the offshore condensed response in surface water. However, the turnover location derived from the model occurred more offshore than that based on observational data. In addition, the freshening process in the bottom water beneath the condensed layer was also reproduced by the model. The model qualitatively reproduced the sandwich-like vertical variation in DO concentration (Figure 5F). Nevertheless, both the reduction in DO concentration in the surface layer and increment of the DO concentration in the subsurface layer derived from the model were milder than the observations, while the simulated subsurface water mass with an increased DO concentration was located closer to shore than the observed location. Note that the observed extent in the reduction in DO in the bottom water agreed well with the simulated results.
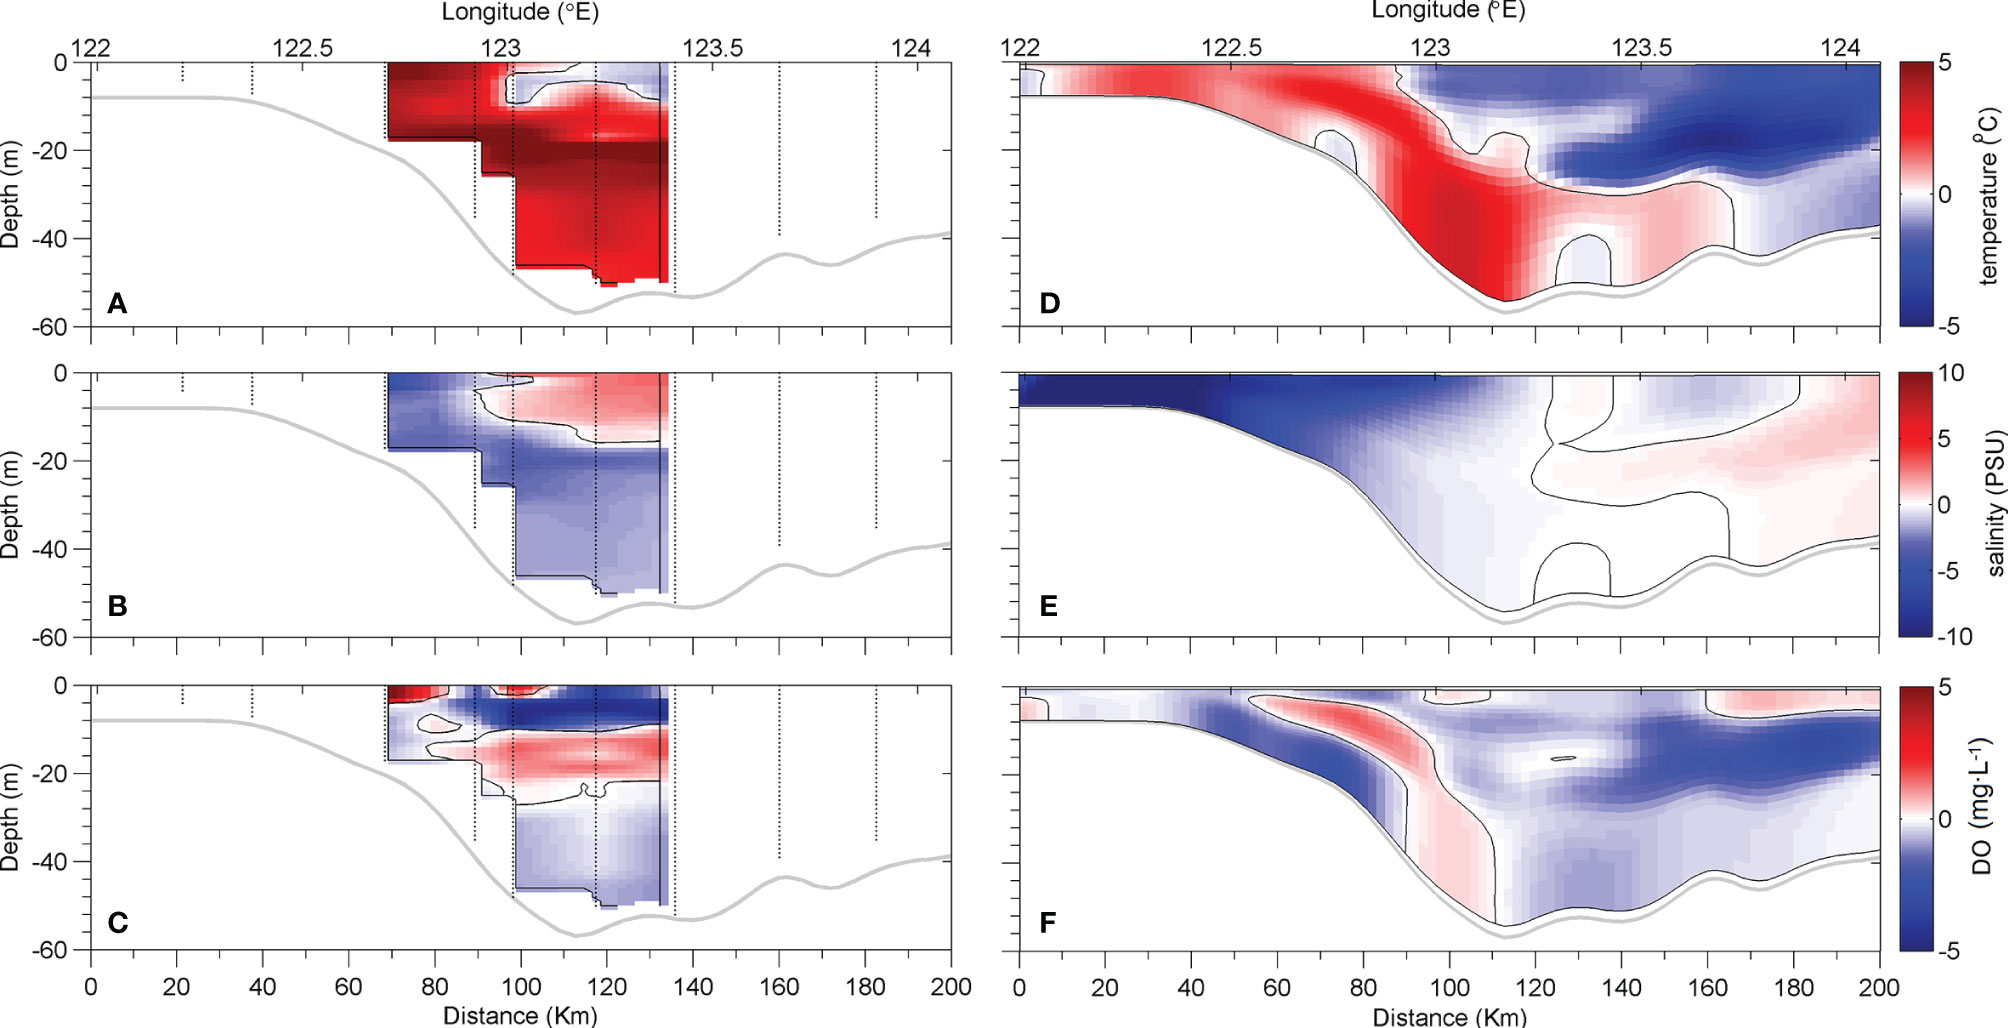
Figure 5 Differences in (A) temperature, (B) salinity, and (C) dissolved oxygen (DO) found by subtracting the profiles at the repeated sample stations (indicated by small black dots) conducted during Leg 1 from those during Leg 2 in the survey at the 31°N transect. Differences in (D) temperature, (E) salinity, and (F) dissolved oxygen (DO) at the 31°N transect derived from the model obtained by subtracting daily mean model output on August 22, 2020 from that on August 28, 2020. Zero contour lines are plotted by thin black solid lines throughout the figure.
The model errors are within reasonable ranges that do not alter the conclusive results. The root-mean-square error (RMSE) for temperature compared to the ship-borne survey data is within ~2°C (Figure 4A), which is smaller than the coastal variation in temperature (~5°C) before and after the passage of Bavi (Figures 5A, D). When compared with the ship-borne survey data, the RMSE for salinity is within ~4 PSU (Figure 4B). Note that the survey stations are few in number and very close to the coast. However, it is still smaller than the variation in coastal salinity (~10 PSU) before and after the passage of Bavi (Figures 5B, E). The RMSE for DO is within ~2 mg·L−1 (Figure 4D), half less than the coastal DO variation (~5 mg·L−1) before and after Bavi’s passage (Figures 5C, F). Nevertheless, further improvement is needed in the modeling to better resolve the multi-scale air–sea interaction processes under the circumstance of severe disturbance by a tropical cyclone. For example, wind-induced shear stress on the ocean surface ceases to increase along with an increase in wind speed once a threshold is met and even slightly decreases afterwards (Powell et al., 2003). Our model assumes that such a threshold in wind speed is 25 m·s−1, as most empirical parameterizations do, but does not consider a subsequent decrease of shear stress when wind speed exceeds this value. This might result in an overestimation of wind shear stress on the semicircle side of Bavi where winds were strongest due to a superimposition of the TC’s translation and rotational speeds and the background atmospheric system (Figure 1B). Furthermore, the present model does not include waves. Waves not only play an important role in modulating the air–sea momentum transfer (Huang and Qiao, 2021) but also drive a transfer of momentum to the deeper coastal water through breaking on the surface (Bruneau et al., 2018). In the ECS, a significant impact of waves on the bottom shear stress, which is comparable to the tide-induced bottom shear stress, is mostly confined within the shallower inner-shelf with <20-m depth (Luo et al., 2017). The present simulation results are of larger uncertainty in areas shallower than 20-m depth (underestimation of particle resuspension and turbulent mixing and associated biogeochemical processes). The modeling of air–sea gas exchange also involves remarkable uncertainties particularly during a typhoon passing over a hypoxic zone (Li et al., 2019). Although the scheme of Keeling et al. (1998), which was used in the model to calculate the air–sea flux of oxygen, has been demonstrated to well reproduce the seasonal variations in the oxygen flux, its applicability to extreme wind events is limited (Prytherch et al., 2010). Nevertheless, because the wind speed in the study area (between 122°E and 125°E) was generally below 20 m·s−1 (Figure 1B), the uncertainty in the estimate of the air–sea air exchange flux should lie within an acceptable range so that it does not alter the general distribution pattern of DO.
Currents Before, During, and After the Typhoon Passage
The passage of Bavi drove violent change in the regional circulation system (sequences in Figures 6A–D and Figures 7A–D). The daily-mean outputs on the 22nd and 28th were taken to represent the states before and after Bavi’s passage, and the daily mean outputs on the 25th and 26th were taken to illustrate the rapid change that occurred during Bavi’s passage. Before Bavi’s passage (Figure 6A), the surface currents in the shallow region (depth ≤ 50 m) were mild and heterogeneous when compared with the currents on the outer shelf (depth > 50 m). The outflow from the Changjiang River meandered on the shelf driving the CDW towards the northeast (Figure 6A). The strong barotropic northeastward TWC prevails off the 50-m isobath on the shelf (Figure 7A). A minor portion of the inshore branch of the TWC guided northward flushing into the submerged river valley following the topography (Figure 7A). During Bavi’s passage through the ECS on August 25, a regional cyclonic loop current centered at ~124.5°E and ~30.0°N was stimulated (Figure 6B); it did not significantly attenuate until reaching the ocean bottom (Figure 7B). As Bavi moved further to the north on August 26, the shrinking cyclonic loop current centered at ~124.0°E and ~31.0°N was still found in the surface layer (Figure 6C), while the extent of the cyclonic loop current at the bottom was larger than that in the surface layer (Figure 7C). Shortly after Bavi’s passage, the suppressed TWC (Figures 7B, C) quickly recovered (Figure 7D), while the southward coastal current remained in place due to the bottom trap effect (Zhang et al., 2018).
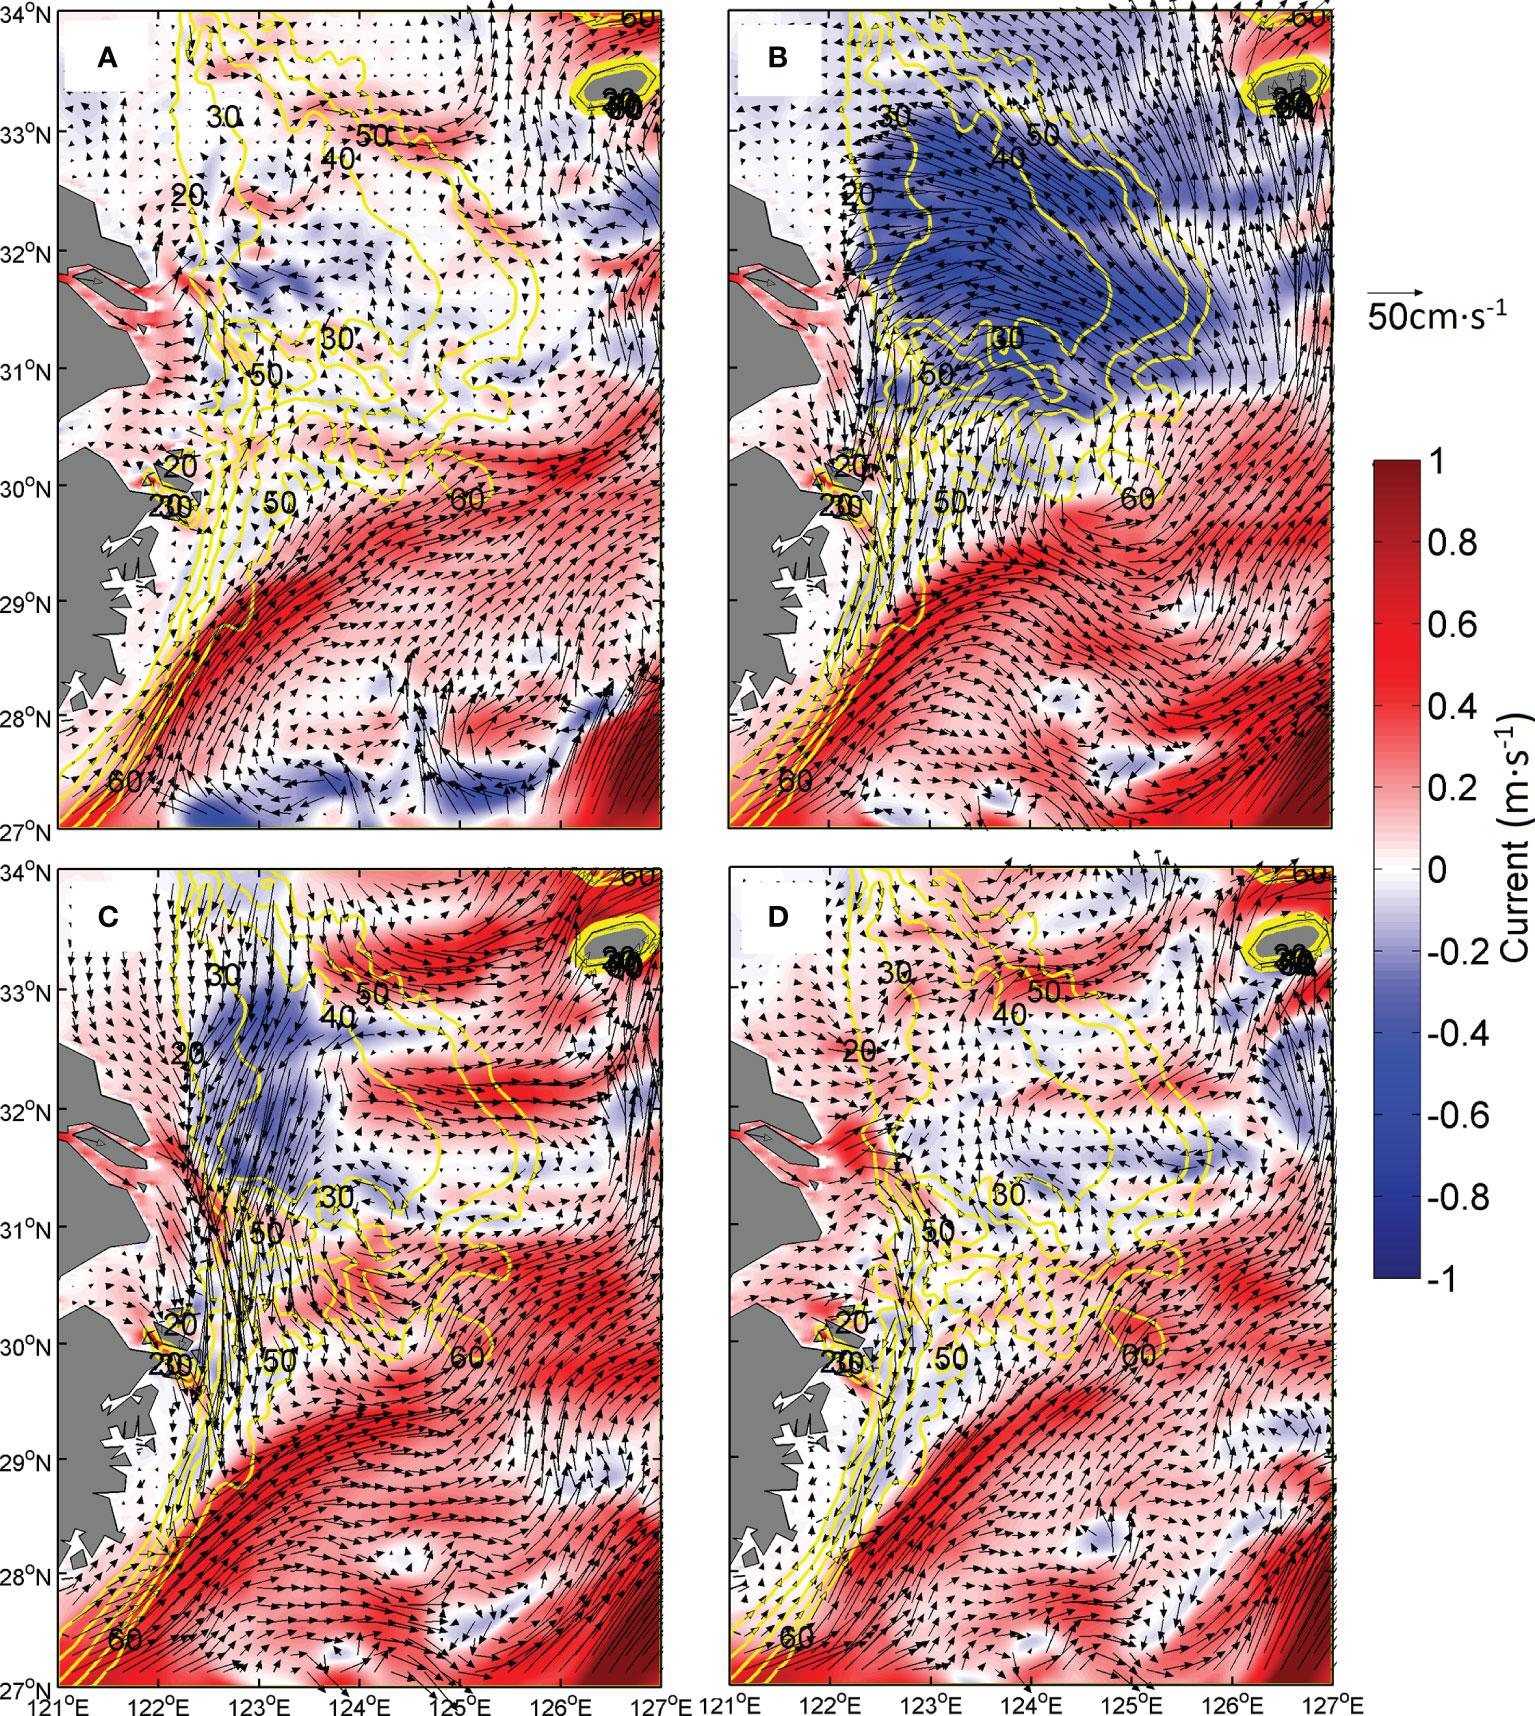
Figure 6 Vectors for daily-mean surface currents superimposed by colors for zonal velocity on August (A) 22, (B) 25, (C) 26, and (D) 28, 2020. Yellow lines indicate isobaths.
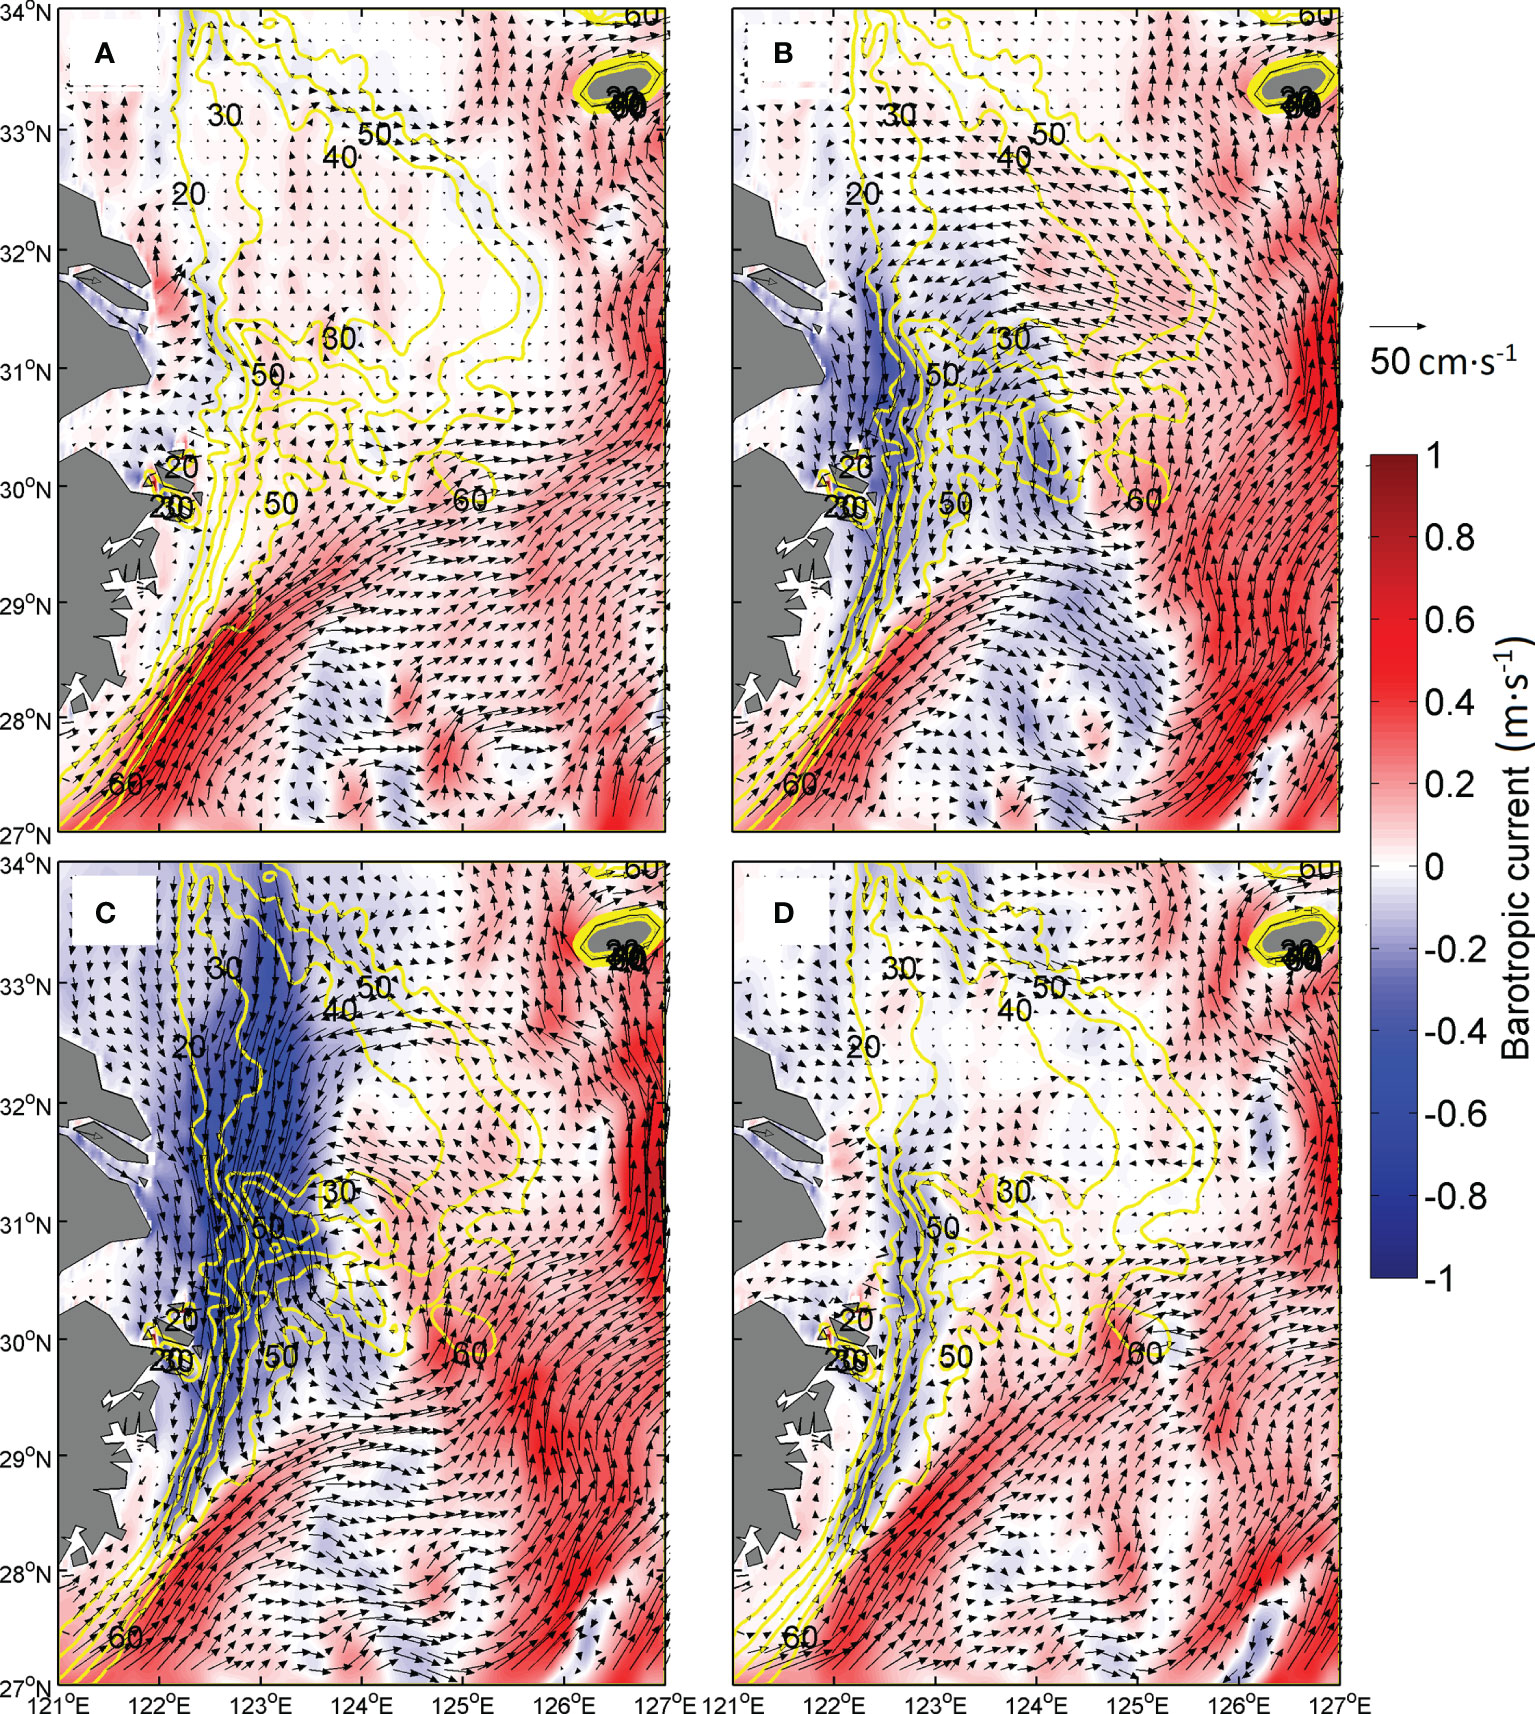
Figure 7 Vectors for daily mean barotropic currents superimposed by colors for meridional velocity on August (A) 22, (B) 25, (C) 26, and (D) 28, 2020. Yellow lines indicate isobaths.
Figures 8A–L further reveal the three-dimensional flow fields in response to the passage of Bavi. Figure 8A can be interpreted as showing that, before the passage of Bavi, the CDW moved offshore from the shallow inner shelf, but the inshore branch of the TWC at the bottom layer clung to the steep slope around 123°E and was oriented inshore following the topography. As the typhoon eye crossed 31°N from the 25th to 26th, strong onshore surface flow at the 31°N transect was initially found (Figure 8B), followed by intensification of the coastal relaxation offshore flow at the bottom (Figure 8C). After Bavi had passed, a relatively strong subsurface offshore flow still persisted across the steep slope (Figure 8D). In the meridional direction, the inshore branch of the TWC pushed the northward flow at the bottom before Bavi had passed (Figure 8E). Since the typhoon eye track was all the way to the east of the steep slope, strong southward flow was driven by Bavi down to the bottom (Figures 8F, G). The southward flow along the steep slope remained after Bavi’s passage (Figure 8H). A coastal upwelling was found before the passage of Bavi that was centered on the steep slope where the depth was approximately 40 m (Figure 8I). On the 25th, the coastal upwelling remained and intensified (Figure 8I). Nevertheless, as shown in Figures 8I, J, the vertical flow field seemed to be contaminated by the near-inertial wakes shed by a preceding Tropical Storm Jangmi spanning from August 6 to 11 along a similar track as that of Bavi. On August 26, a strong downwelling was found across the steep slope (Figure 8K). On August 28, the near-inertial oscillation again was obvious, which should be attributed to Bavi, while an upwelling across the steep slope had formed, which was next to a downwelling branch (Figure 8L).
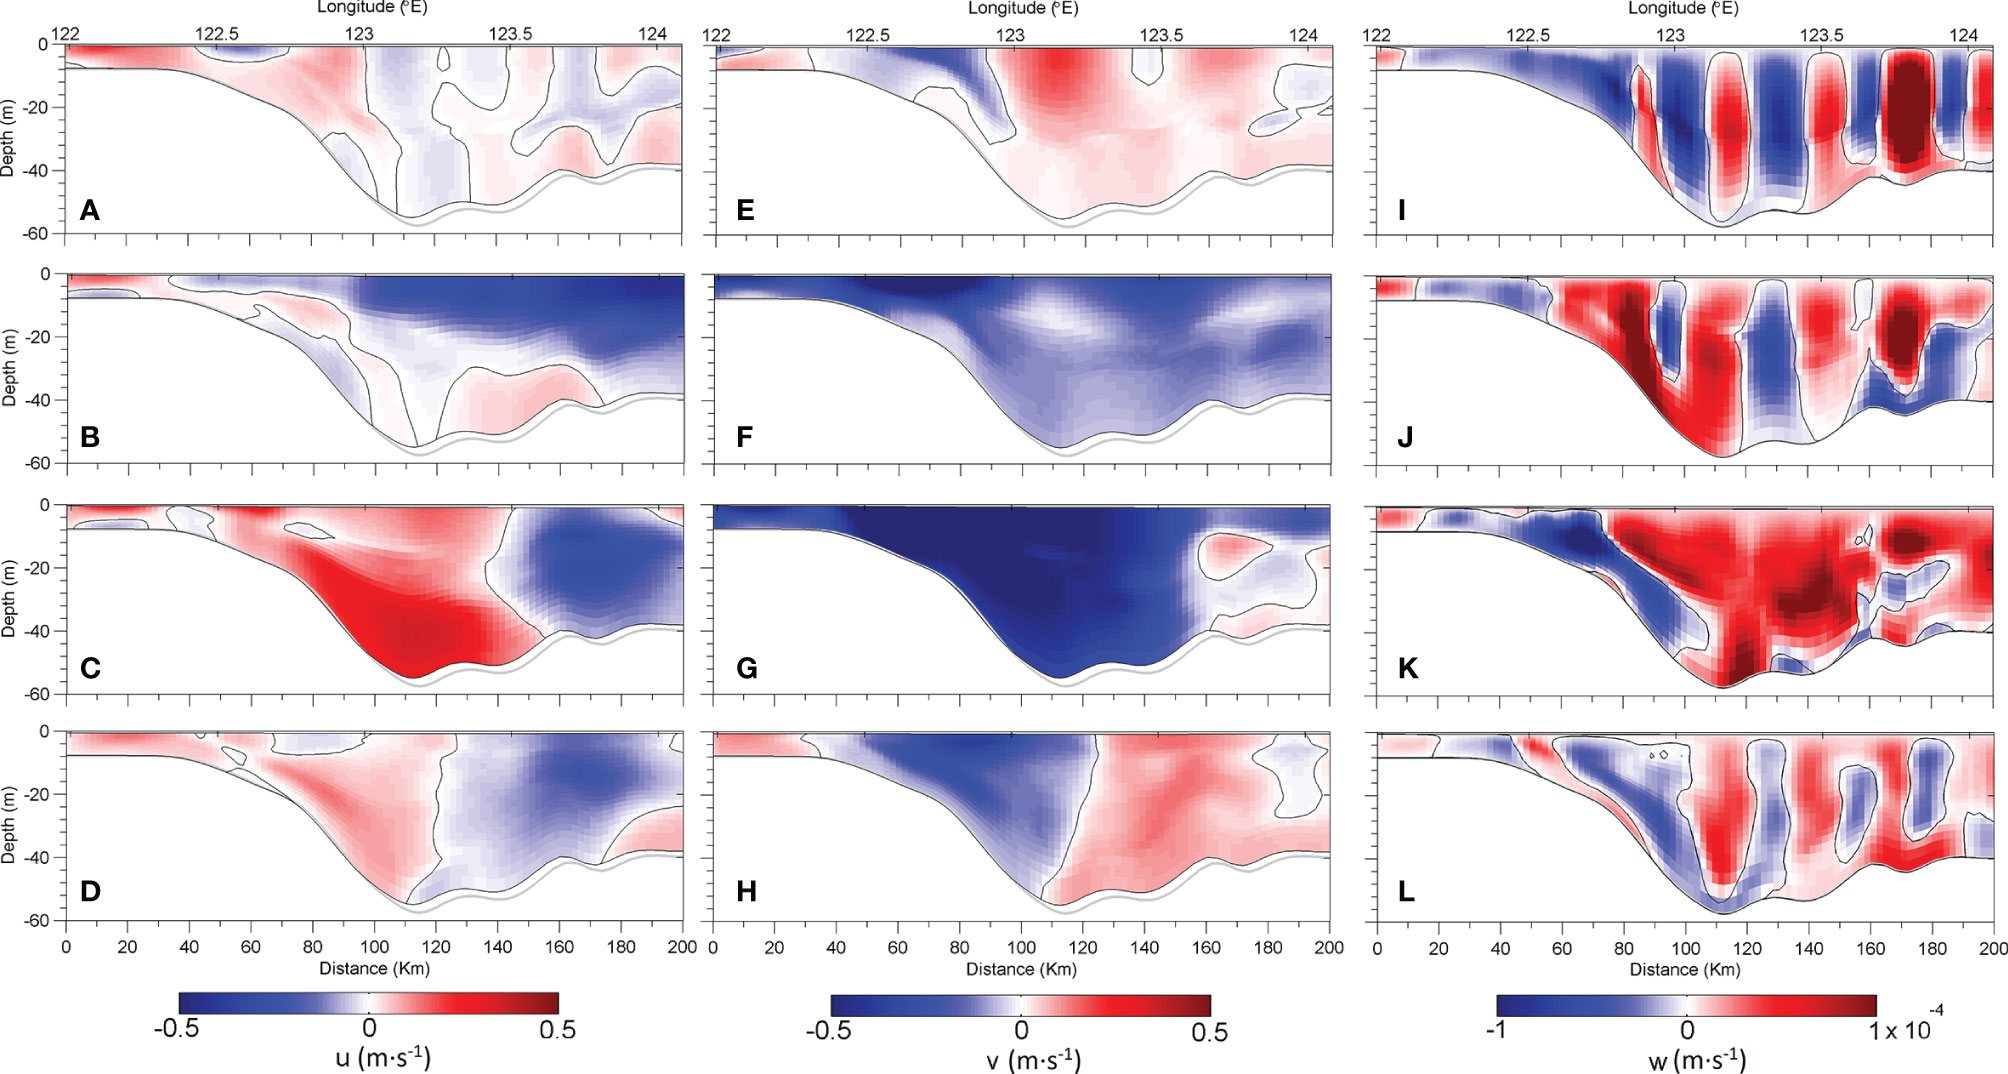
Figure 8 The modeled daily-mean zonal velocity (u; positive eastward) at the 31°N transect on August 22 (A), 25 (B), 26 (C), and 28 (D), 2020. The modeled daily-mean meridional velocity (v; positive northward) at the 31°N transect on August 22 (E), 25 (F), 26 (G), and 28 (H), 2020. The modeled daily-mean vertical velocity (w; positive upward) at the 31°N transect on August 22 (I), 25 (J), 26 (K), and 28 (L), 2020.
Dissolved Oxygen Before, During, and After the Typhoon Passage
The modeled bottom DO distributions before (Figure 9A), during (Figures 9B, C), and after (Figure 9D) the passage of Bavi revealed an astonishing fact. The hypoxic zone did not disappear; instead, it extended southward and eastward in response to the typhoon passage.
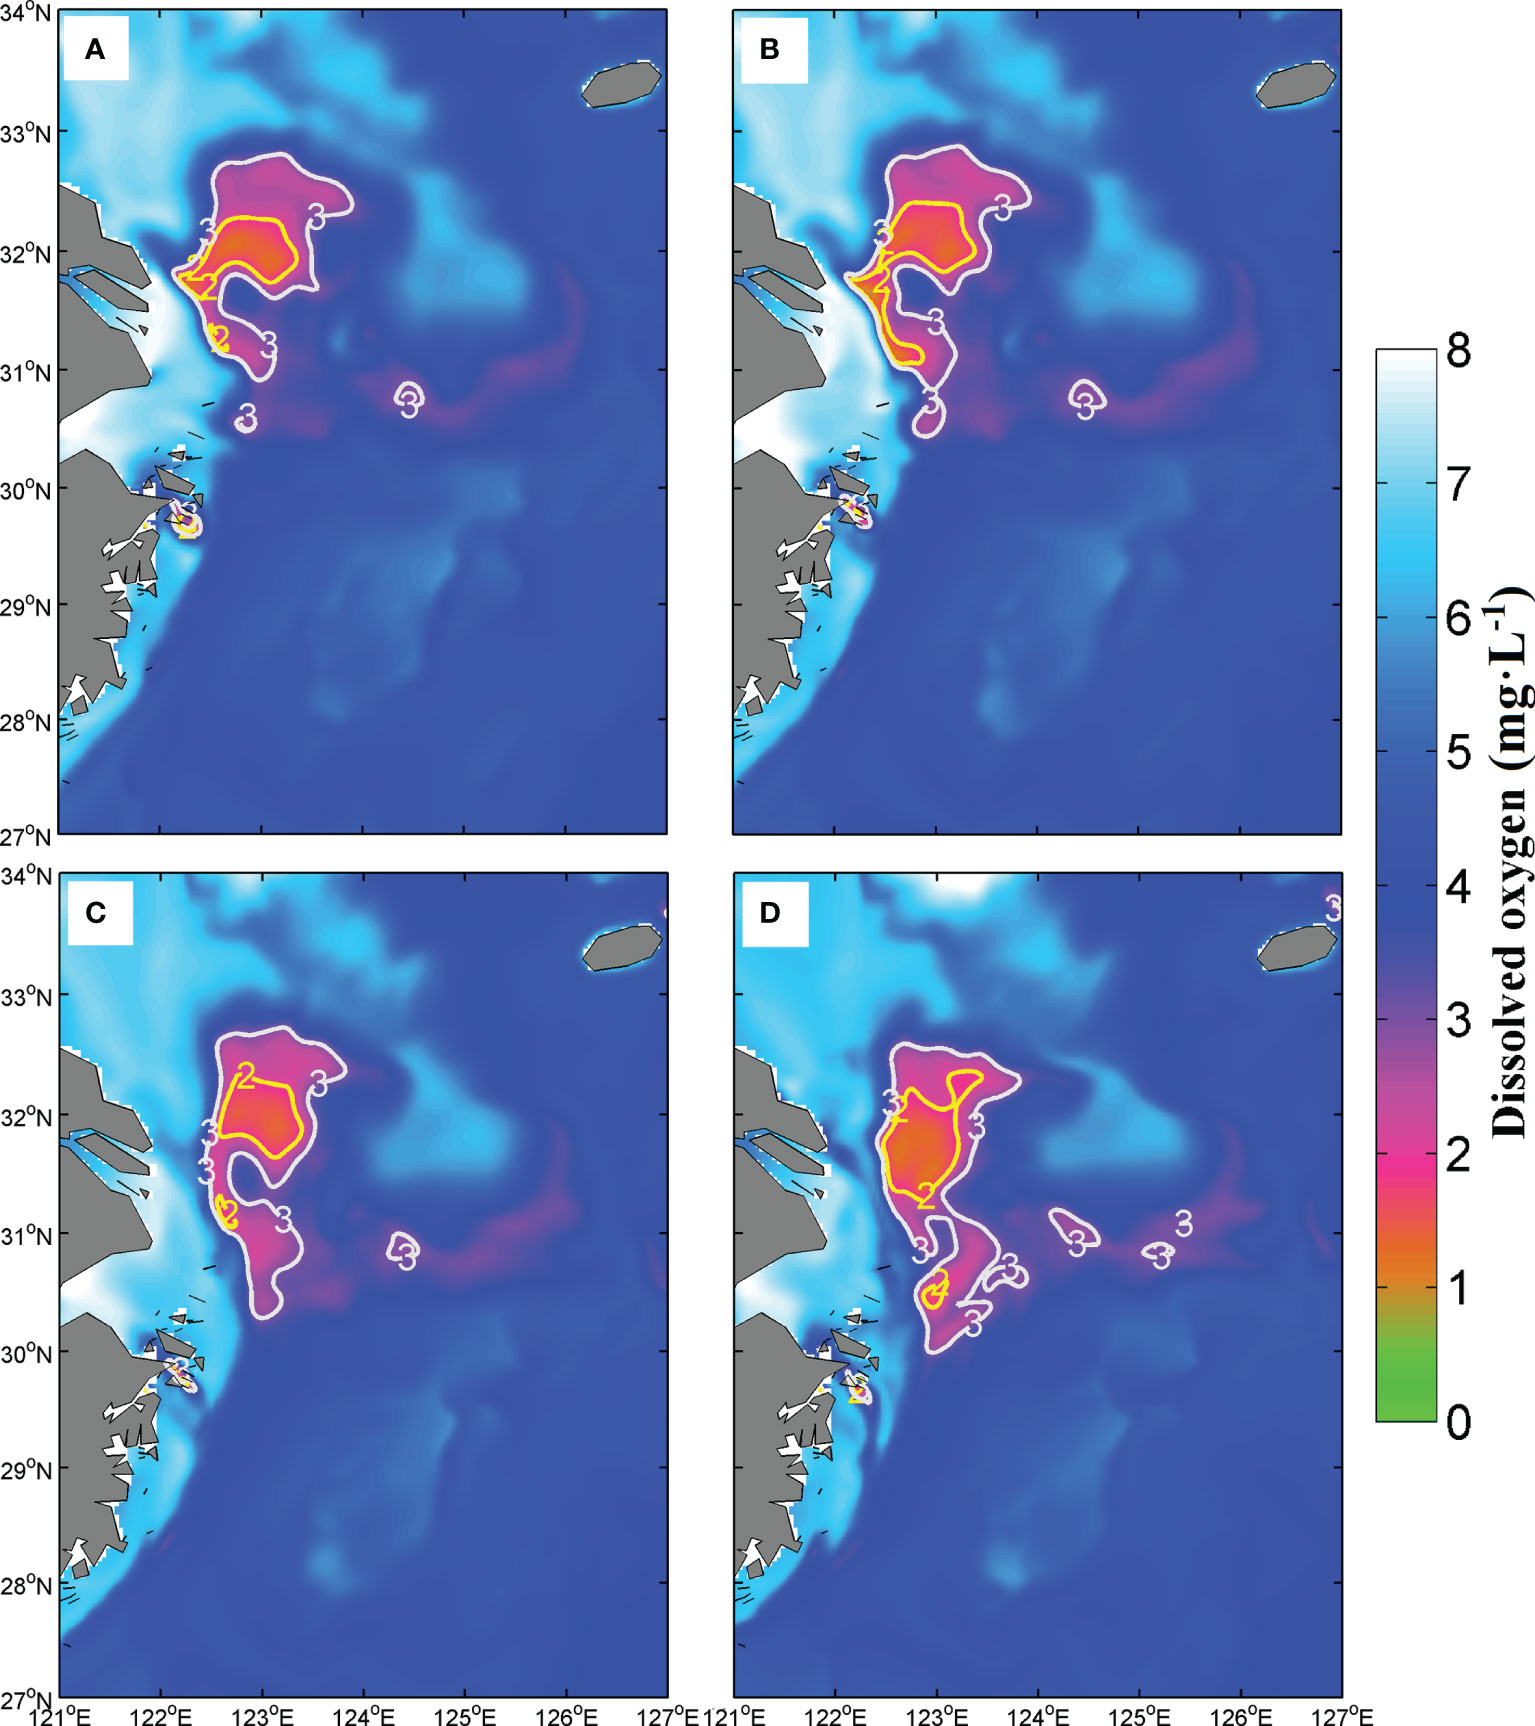
Figure 9 The modeled bottom DO concentration distributions on August (A) 22, (B) 25, (C) 26, and (D) 28, 2020. Yellow and white contour lines indicate DO concentrations of 2 and 3 mg·L−1, respectively.
The high and low DO concentrations in the surface and bottom layers, respectively, at the 31°N transect before the passage of Bavi suggest that high levels of primary production occur in the surface layer and decomposition of excessive organic matter occurs in the bottom layer (Figure 10A). On August 25 (Figure 10B), the DO concentration in the surface layer declined relative to that on the 22nd (Figure 10A), suggesting that the release of oversaturated oxygen caused by enhanced mixing occurred during Bavi’s passage. The hypoxic zone (DO < 3 mg·L−1) on the 25th (Figure 10B) enlarged relative to that on the 22nd (Figure 10A). The zone also moved upward, which may be associated with the upwelling on the steep slope (Figure 8J). On August 26 (Figure 10C), the hypoxic zone extended further offshore and moved downward, which may be associated with the downwelling on the steep slope shown in Figures 8C, K. Shortly after Bavi passed, the hypoxic zone split and shrank when compared with that on the 26th (Figures 10C, D). However, the zone was still distributed in a wider longitudinal extent than that before Bavi’s passage (Figures 10A, D). Comparing to the measured DO concentration at the 31°N transect before and after the passage of Bavi (Figures 10E, F), the model underestimated the hypoxia condition in bottom water. As mentioned, this may have been caused by the underestimation of stratification by the model and the lack of a sediment oxygen consumption module. The aggravation of hypoxia at the submerged river valley can be told from the observation (Figures 10E, F). That variation, which occurred in such a short time, can be only explained by the water mass movement as revealed by the model.
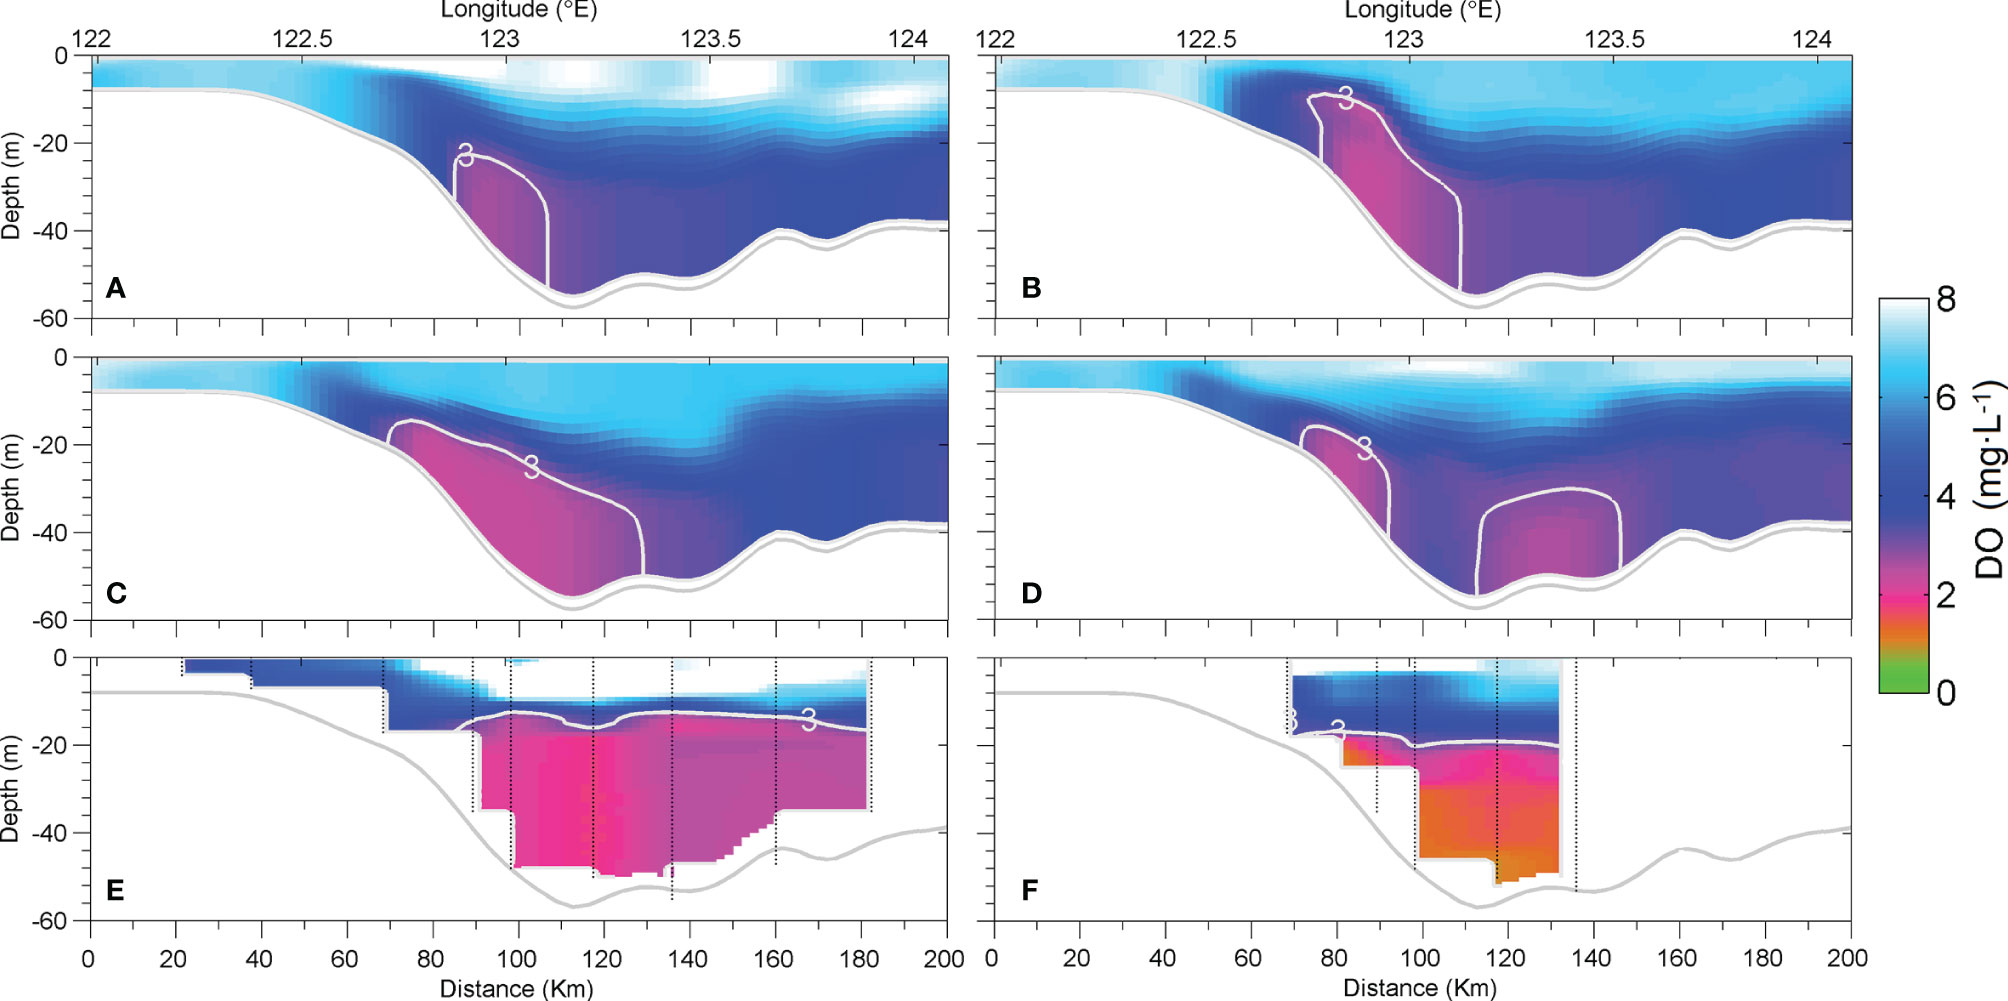
Figure 10 The modeled daily-mean DO concentrations at the 31°N transect on August 22 (A), 25 (B), 26 (C), and 28 (D), 2020. Measured DO at the 31°N transect during Leg 1 (E) and Leg 2 (F), respectively. The white contour line is for 3 mg·L−1.
Detritus Before, During, and After the Typhoon Passage
A hotspot for the accumulation of detritus before the passage of Bavi was found on the steep slope to the west of 123°E (Figure 11A), which was consistent to a recent study targeting the distribution of hypoxia (Wei et al., 2021). During Bavi’s passage, the variation in the distribution of detritus (Figures 11B, C) was weaker than that of DO (Figures 10B, C). Comparing the distributions before and after the passage of Bavi, the amount of detritus on the steep slope decreased, while a remarkable amount of detritus accumulated at the submerged river valley to the east of 123°E (Figure 11D).
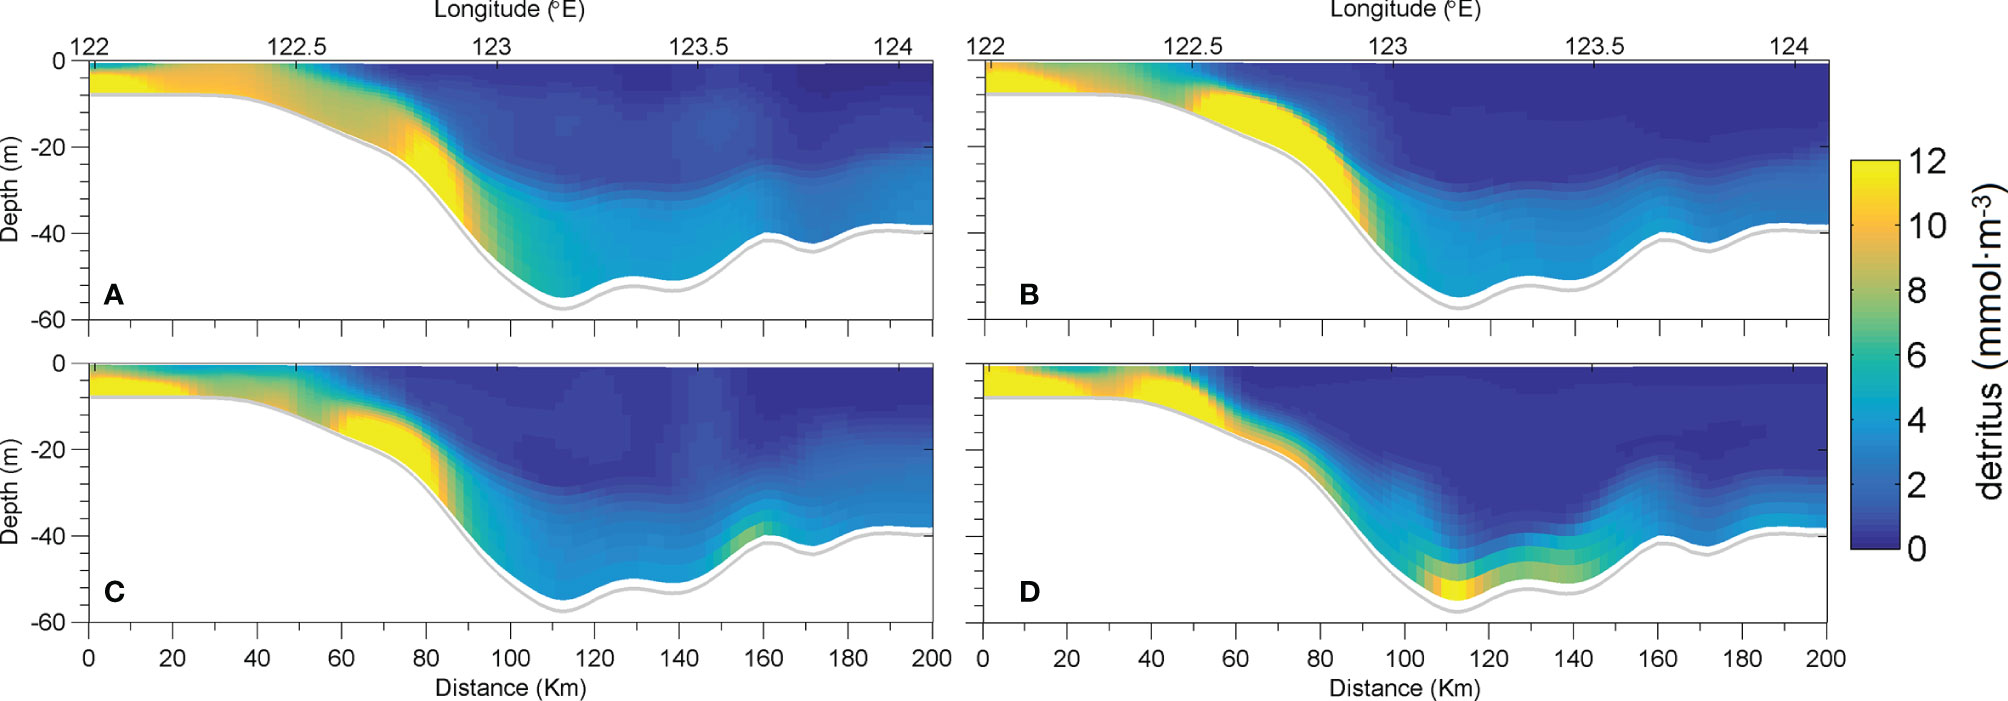
Figure 11 The modeled daily-mean detritus concentrations at the 31°N transect on August (A) 22, (B) 25, (C) 26, and (D) 28, 2020.
Although the turbidity can be regulated by both the suspended particulate matter and the dissolved matter, field measurements have found a close correlation between turbidity and the suspended particulate matter concentration in the bottom water on the ECS shelf (Hoshika et al., 2003). The particulate organic carbon content and particulate organic nitrogen content of the particulate matter in those bottom water samples were found to be relatively steady (Hoshika et al., 2003). Therefore, it can be argued that the measured turbidity before and after the passage of Bavi (Figures 12A, B) qualitatively reflected the variation in detritus organic matter concentration in the bottom water. Figure 12C exhibits a substantial decrease in turbidity in the bottom layer on the steep slope after the passage of Bavi. It suggests the reduction in detritus organic matter there, which is consistent with the simulated result.
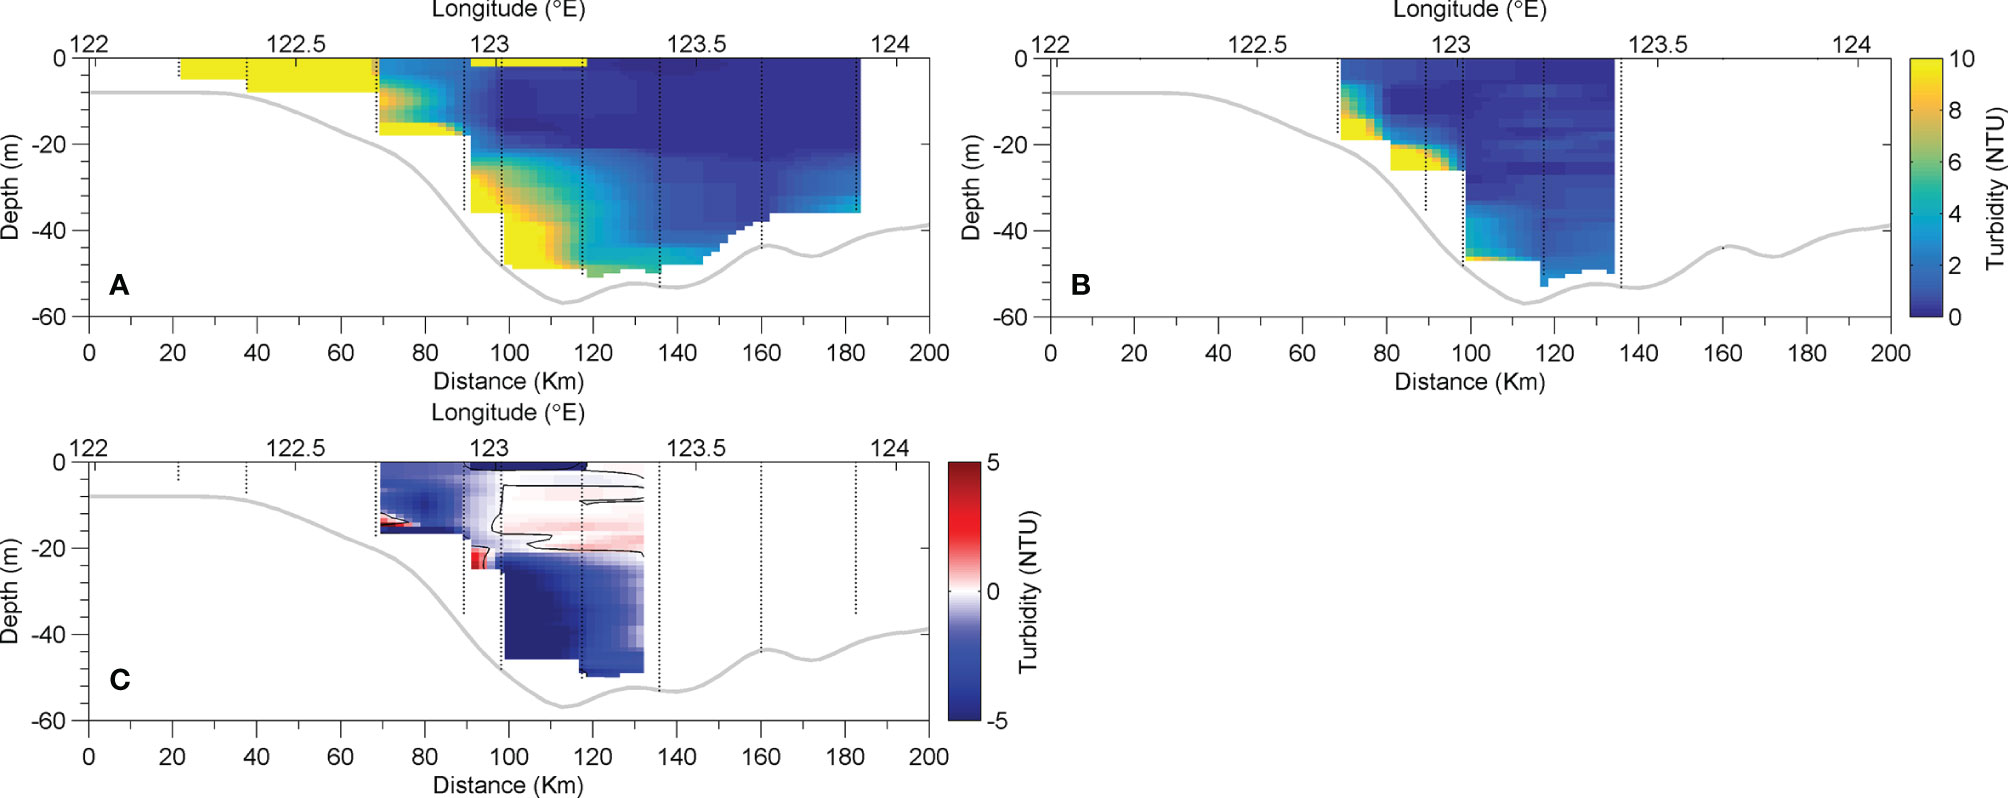
Figure 12 Measured turbidity at the 31°N transect during Leg 1 (A) and Leg 2 (B), respectively. (C) Difference in turbidity found by subtracting the profiles at the repeated sample stations (indicated by small black dots) conducted during Leg 1 from those during Leg 2 in the survey at the 31°N transect. Zero contour lines are plotted by thin black solid lines.
Cross-Isobath Transports of DO and Detritus
The governing equations for DO and detritus concentrations can be written in a uniform form as Eq. (1):
where the x- and y-axes point horizontally eastwards and northwards, respectively, while the z-axis points vertically upwards; C stands for DO or detritus; velocity components in the x, y, and z coordinates are denoted by u, v and w, respectively; ws is the additional sinking velocity that is 0 m·s−1 for DO but 1.736 × 10 m·s−1 for detritus; kh and kv are the horizontal and vertical diffusivities, respectively; S is the source/sink term that resulted from the biogeochemical processes; and F is composed of the extrinsic fluxes through the boundaries. In order to diagnostically examine the transport of substances during the typhoon’s passage, the sequential daily-mean xadv, yadv, vadv, hdiff, vdiff, and bio terms marked in Eq. (1) at the 31°N transect were calculated. Positive xadv and yadv terms indicate effluxes from the control volume in terms of a specific substance due to zonal advection and meridional advection, respectively. A positive vadv term indicates efflux due to vertical convection. Positive hdiff and vdiff terms indicate influxes due to horizontal mixing and vertical mixing, respectively. The positive bio term indicates the increment of a specific substance within the control volume through intrinsic biogeochemical processes. Figures 13A–P show xadv, yadv, vdiff, and bio terms for DO on the days before, during, and after Bavi’s passage. The distribution of the vadv term is not explicitly displayed. The hdiff term was minor throughout, and it was neglected in the analyses. Two regions enclosed by rectangles in Figures 13A–P were particularly focused on, in order to understand why the DO concentration in Region I increased after Bavi’s passage, but the DO concentration in Region II decreased. Region I is located on the steep slope where exceptionally high detritus concentration (Figure 11A) and low DO concentration (Figure 10A) were found before Bavi’s passing. It is also a typical situation in summer related to hypoxia (Wei et al., 2021). Region II is located on the submerged river valley floor. Lower amounts of detritus (Figure 11A) and higher DO concentrations (Figure 10A) were observed in Region II than those in Region I before the passage of Bavi. However, an increase in detritus concentration (Figure 11D) and a decrease in DO concentration (Figure 10D) were found in Region II after Bavi’s passage. The variations in the DO and detritus budgets in Regions I and II during passage of the typhoon manifest the underlying mechanisms for the seaward/offshore migration of the hypoxic water and particulate organic matter. The diagnostic terms within Regions I and II were averaged and are shown versus dates spanning from August 22 to 28 in Figures 13Q, R, respectively.
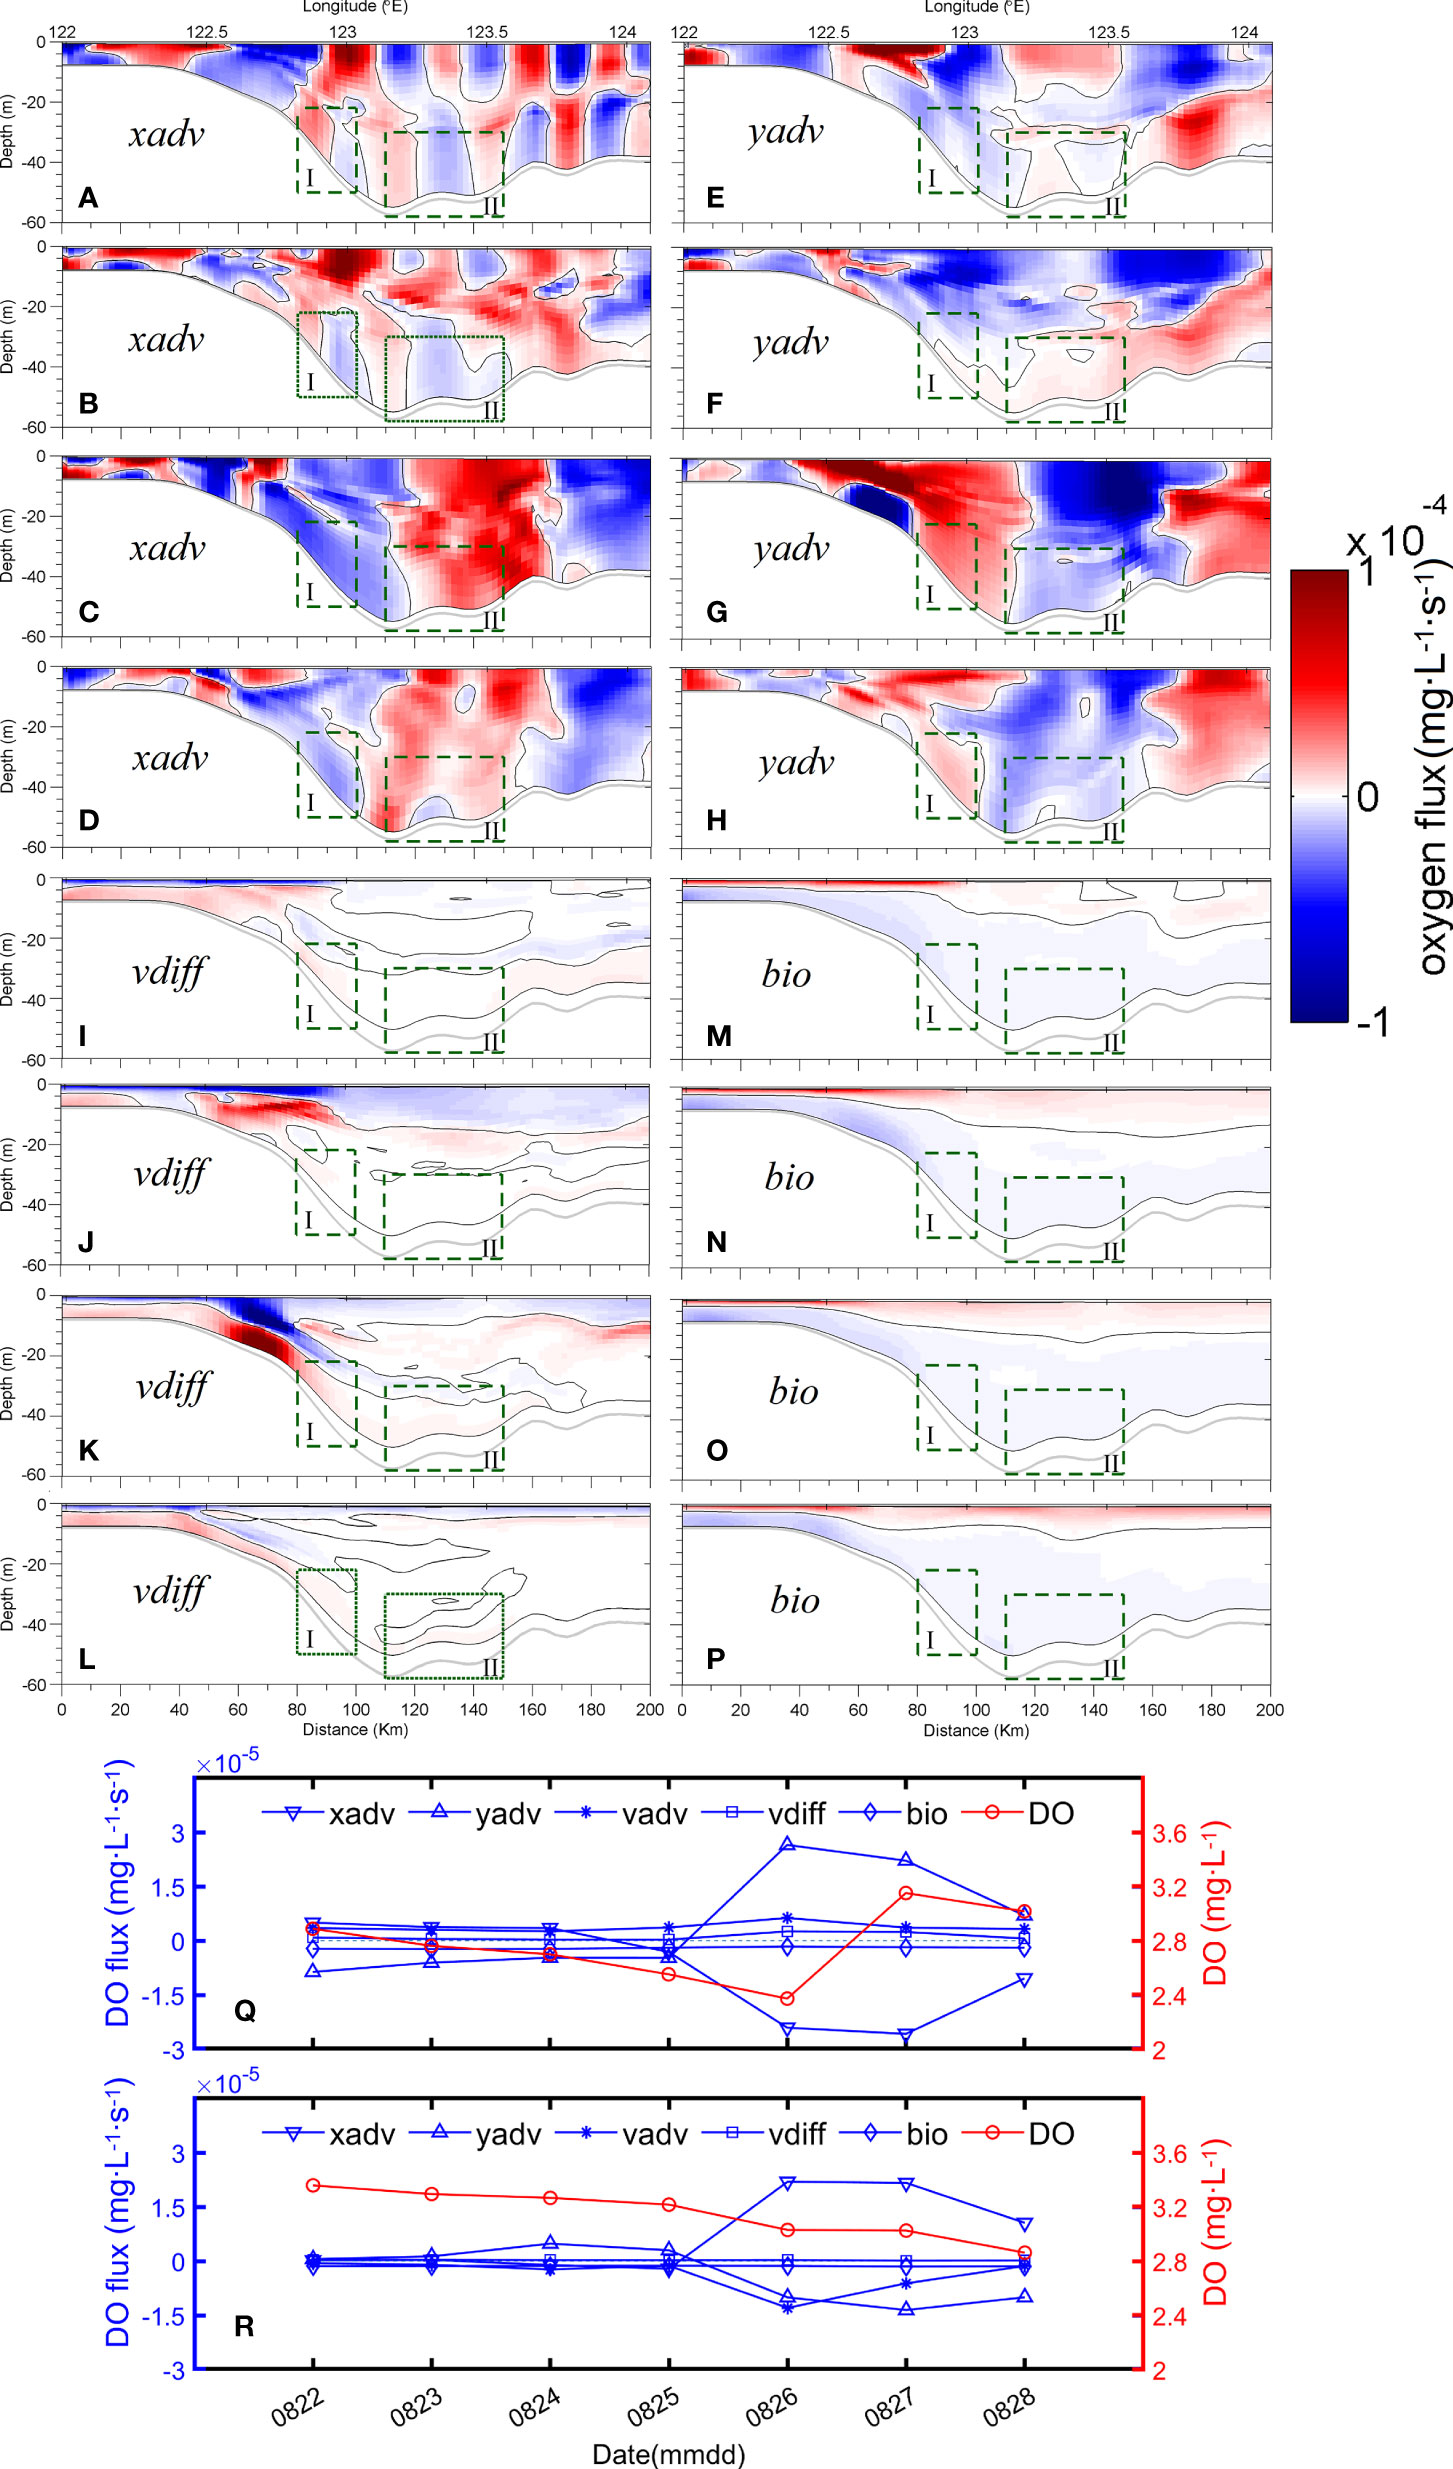
Figure 13 The diagnostic terms for xadv, yadv, vdiff, and bio in terms of dissolved oxygen (DO) at the 31°N transect on August 22 (A–D), 25 (E–H), 26 (I–L), and 28 (M–P), 2020. Regions I and II are marked by dashed rectangles in (A–P). (Q, R) are time series of diagnostic terms in terms of DO averaged in Regions I and II, respectively.
In Region I, the DO concentration slightly decreased until August 26, but it abruptly increased from the 26th to 27th; it then decreased slightly by the 28th (Figure 13Q). The zonal transport, xadv, and the meridional transport, yadv, dominated the DO variation particularly during the typhoon’s passage. Before Bavi passed, the prevailing bottom onshore current (Figure 8A) conveyed low-DO water (Figure 10A) into Region I, while the northward current (Figure 8E) conveyed relatively high-DO water (Figure 9A) into Region I (Figure 13Q). However, along with the reversing of both the zonal and meridional currents (Figures 8C, G), the coastal high-DO water (Figure 10B) and the hypoxic water in the north (Figure 9B) were transported into Region I (Figure 13Q). The oxygen depletion by biogeochemical processes was steady during Bavi’s passage, suggesting that the local organic matter was abundant and able to sustain bacterial respiration (Figure 13Q). The contributions of vertical diffusion and advection to the DO budget in Region I were slightly elevated but not prominent (Figure 13Q).
In Region II, the DO concentration continuously decreased during the study period, and the interruption caused by the passage of Bavi was not obvious (Figure 13R). Compared to Region I, both the hydrodynamics and biogeochemical processes were much weaker in Region II before Bavi’s passage (Figure 13R). The zonal transport removed DO from Region II during the passage of Bavi, but the meridional transport together with the vertical transport compensated for the lost DO for Region II (Figure 13R). The almost constant biogeochemical oxygen consumption rate that occurred despite of the typhoon’s passage suggests that organic matter was abundant there during the study period. Therefore, another question arises: what are the supplement pathways for the accumulation of organic matter in Region II?
Similar to the diagnostic analysis for DO, xadv, yadv, vdiff, and bio terms for detritus on the days before, during, and after the passage of Bavi are shown in Figures 14A–P. The diagnostic terms within Regions I and II were averaged and plotted in sequence in Figures 14Q, R, respectively. Before the passage of Bavi, the detritus concentration in Region I was much higher than that in Region II. However, after Bavi’s passage, the detritus concentration in Region I was comparable to that in Region II. It is of interest to investigate the processes that redistributed detritus within the submerged river valley. In both Regions I (Figure 14Q) and Region II (Figure 14R), the vdiff and bio terms were predominant and appeared to be opposite, i.e., they were large and varied in an opposite way. Looking into Figures 14I–P, the vertical peak value of vdiff normally occurred in subsurface layer above the submerged river valley, and the pattern of bio term coincide with that of vdiff. These findings suggest that the respiration in the water column consumed a major portion of freshly deposited planktonic detritus. However, the lateral/cross-isobath transports during the typhoon’s passage played a significant role in redistributing the detritus. In Region I, the zonal transport nearly ceased to replenish the detritus during the passage of Bavi, while the meridional transport changed dramatically between the removal and supplement status for the detritus (Figure 14Q). In Region II, zonal transport removed the detritus during Bavi’s passage, while meridional transport replenished the detritus (Figure 14R). As a result, the accumulated detritus on the steep slope before Bavi’s passage was diluted, and additional detritus was evenly found in the submerged river valley (Figures 11A, D).
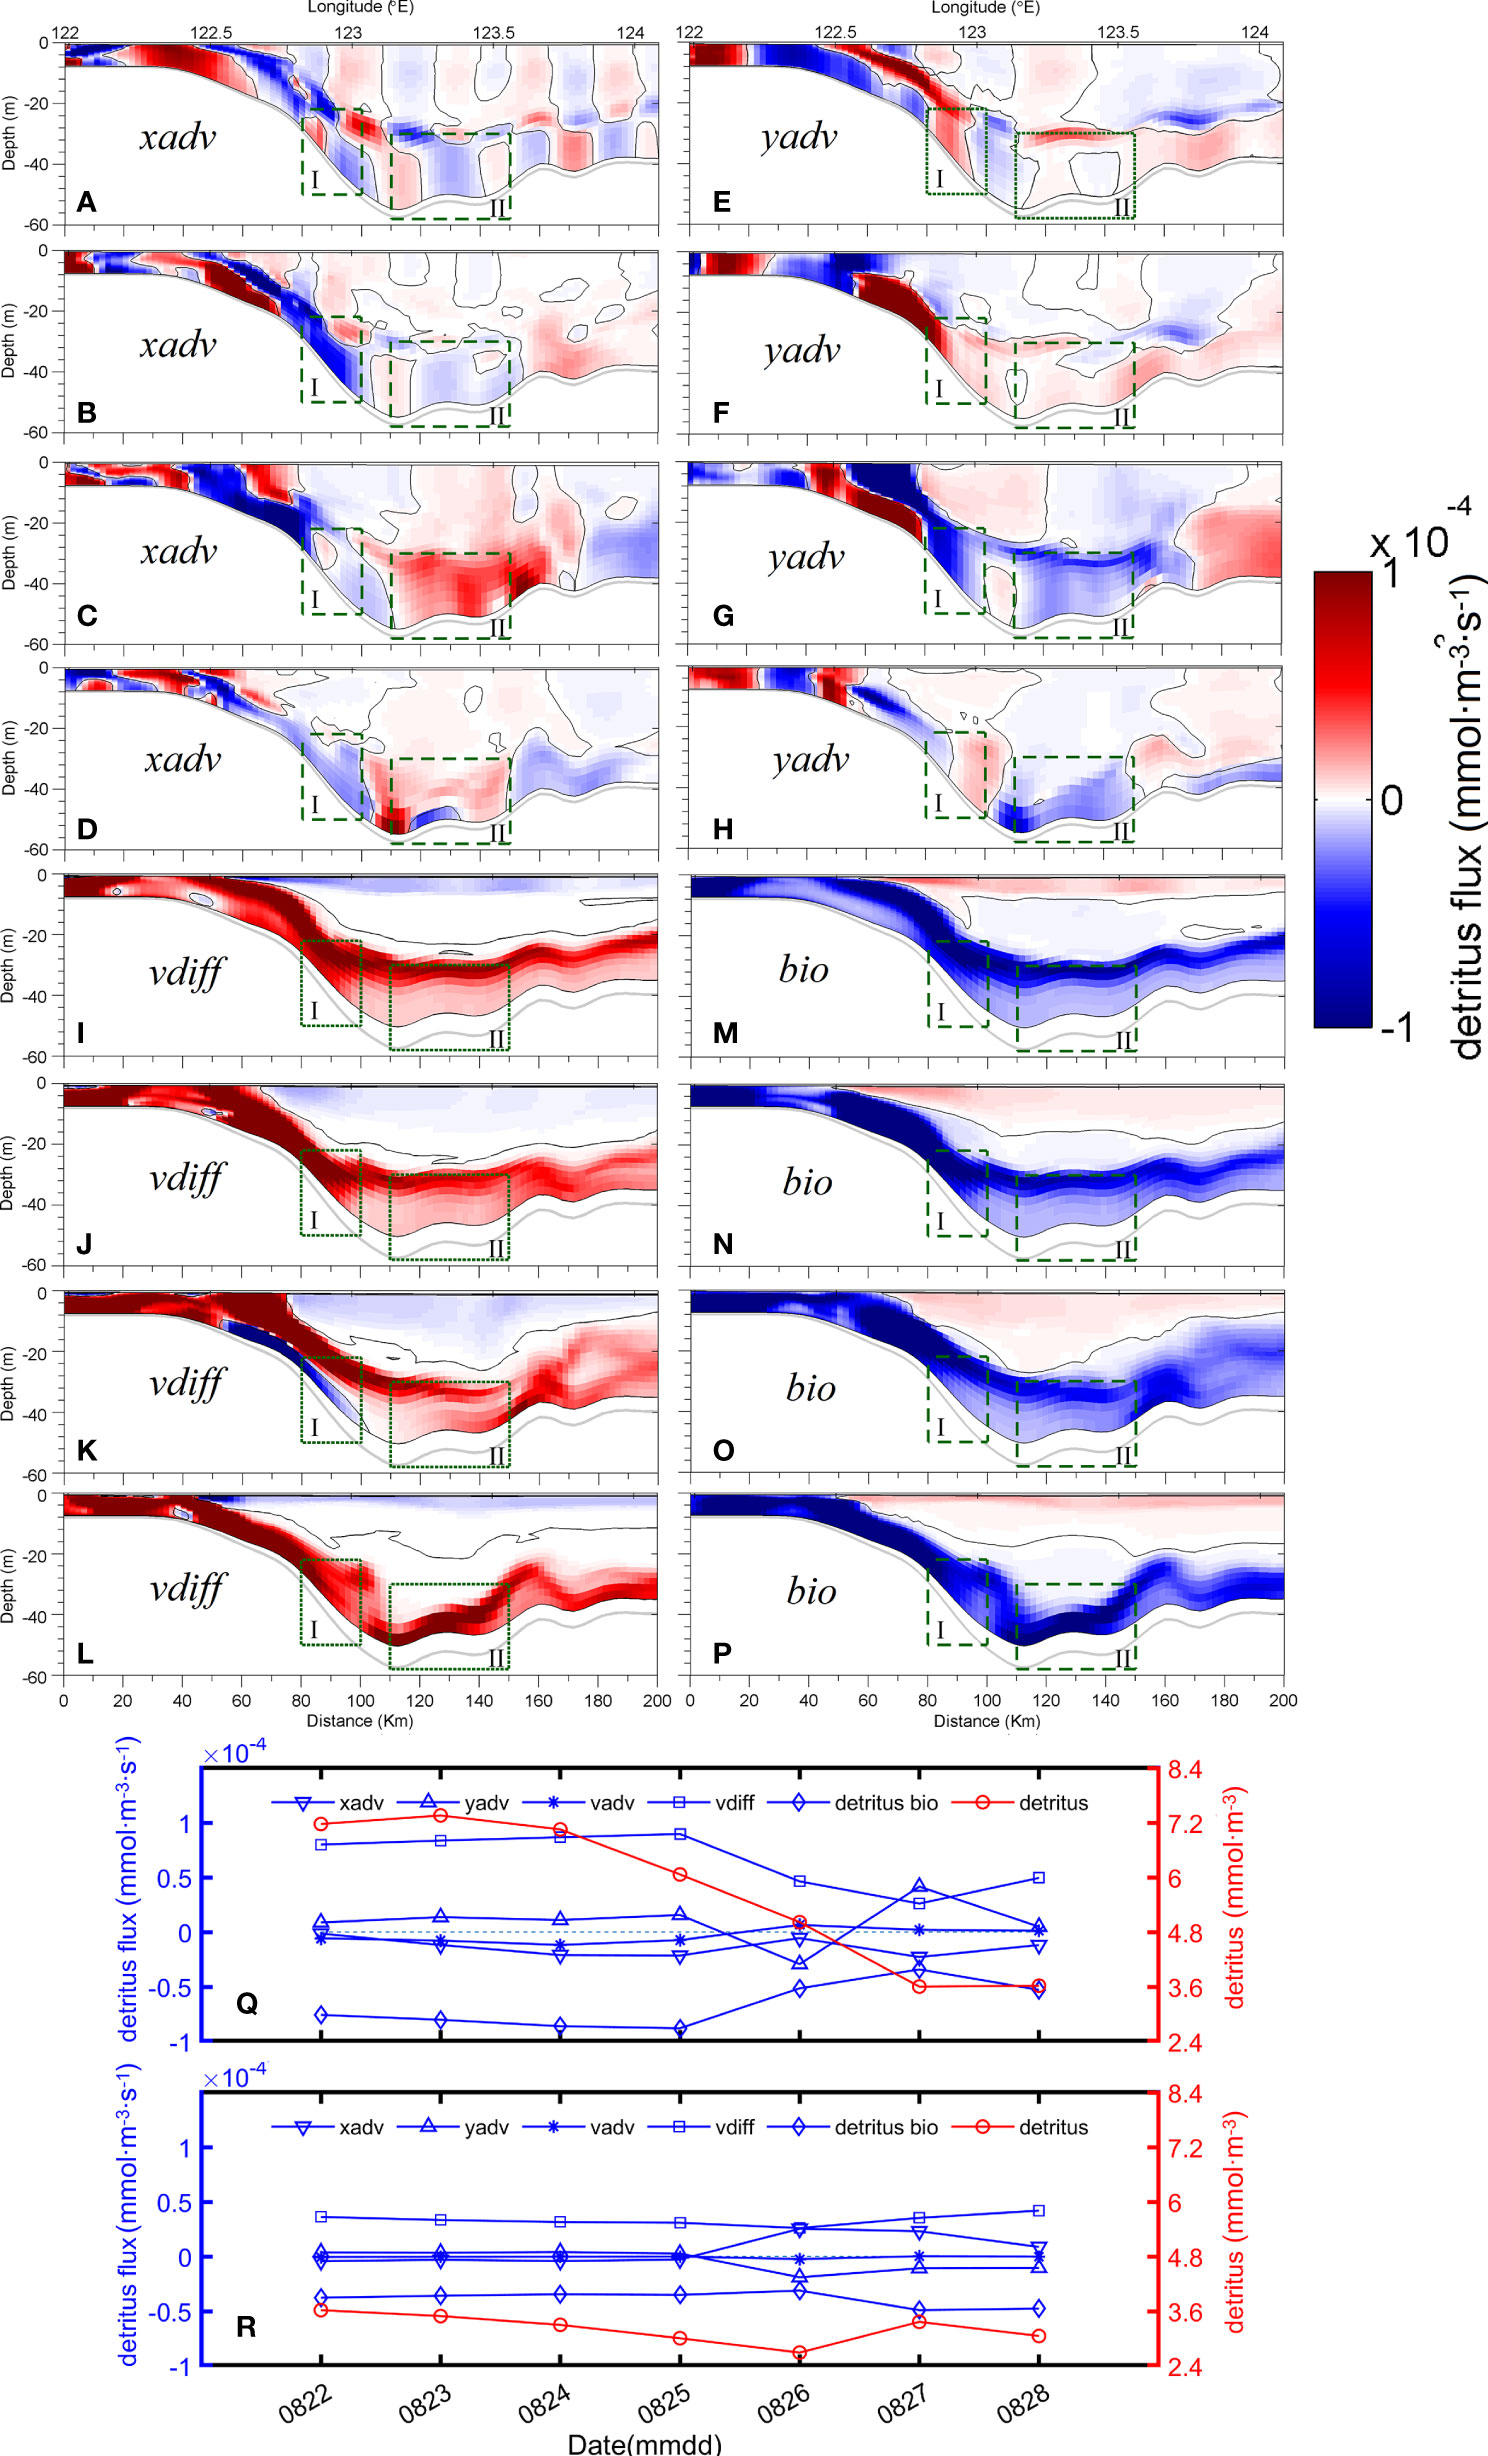
Figure 14 The diagnostic terms for xadv, yadv, vdiff, and bio in terms of detritus at the 31°N transect on August 22 (A–D), 25 (E–H), 26 (I–L), and 28 (M–P), 2020. Regions I and II are marked by dashed rectangles in Panels (A–P). Panels (Q, R) are time series of diagnostic terms in terms of detritus averaged in Regions I and II, respectively.
Discussion
Reversal of Hydrographic Regime by the Typhoon and Consequence in Biogeochemistry
As pointed out previously, a change in coastal ocean temperature in response to a typhoon/TC passage has been found in many cases due to far-field advection rather than local mixing (Sun et al., 2014; Seroka et al., 2016; Seroka et al., 2017; Zhang Z. et al., 2019; Jin et al., 2020; Wang and Zhang, 2021). This was also confirmed in the passage of Bavi. A warming of coastal waters induced by onshore transport of shelf water was accompanied by violent synoptic variation in the three-dimensional current system, which further exerted profound impact on the marine biogeochemical environment.
In normal summer conditions, the decomposition of oceanic phytoplankton-produced organic matter in a strongly stratified hydrographic environment facilitates the formation and persistence of the seasonal hypoxia off the Changjiang Estuary (Zhou et al., 2010; Wang et al., 2017; Zhou et al., 2017; Zhang W. et al., 2019; Liblik et al., 2020; Zhang et al., 2020; Zhou et al., 2020). However, a lateral transport of sinking detritus by energetic subsurface currents often results in a spatial shift between the location of algal blooms in surface waters and the near-bottom hypoxic zones (Zhou et al., 2020). An offshore advection of CDW together with the TWC carries a large amount of detritus northward to the submerged river valley, making the area one of the hotspots for hypoxia (Zhang et al., 2020). The fresh and warm CDW plume is directed offshore but with a high variability in its dimension (Zhou et al., 2009). A persistent upwelling in boreal summer centred on the steep slope along the ~40-m isobath was predominantly driven by a secondary circulation across the tidal front (Lü et al., 2006). Bottom cold water will upwell to the surface to form a cold core, which is 3°C–4°C cooler than the surrounding coastal water, located to the west of 123°E (Lü et al., 2006). Based on the understanding of these circulation patterns, Wei et al. (2021) proposed three major physical mechanisms for the formation and development of hypoxia off the Changjiang Estuary: (1) organic detritus is concentrated by flow convergence on the offshore side of the bottom front located on the steep slope where the core of the hypoxic zone is formed; (2) coastal upwelling brings the hypoxic water upward; and (3) the CDW plume drives a seaward expansion of oxygen-deficient water.
The aim of the process-oriented study is to understand the key dynamic process transmitting the impact of the passing typhoon to the biogeochemical parameters. It is crucial to statistically estimate the overall impact of the passage of typhoons on regional biogeochemical budgets over a long period. By linking the impact of passage of typhoons and the high concentrations of carbon dioxide in hypoxic bottom waters with the vertical mixing process, Li et al. (2019) found hypoxic bottom waters to be a carbon source to atmosphere. However, in this study, the coastal warming, the internal freshening, the aggravation of bottom hypoxia, and the decrease in bottom turbidity after the typhoon passage found by the repeated surveys cannot be completely explained by the vertical mixing process. Based on the good reproduction of the variations in the state variables by the model, it is revealed that the phenomena mentioned above at the transect were probably due to the variation in the three-dimensional circulation system.
During the passage of Bavi, the common circulation patterns in summer were interrupted or even reversed reflecting in a shoreward transport of warmer water from the mid-shelf and subsequent downwelling. This advection rather than mixing played an important role in driving the variation of hypoxia and carbon transport. The originally north-eastward spreading CDW plume was turned southward by the cyclonic loop current generated by the typhoon (Figures 6B, C). The influence of the cyclonic loop current reached down to the bottom, and the bottom water masses were also transported southward (Figures 7B, C). The pre-typhoon upwelling was reversed to downwelling (Figure 8K), which led to an internal warming and freshening of seawater to the east of 123°E (Figures 5A, B). As a consequence, the hypoxic zone was spatially shifted, and organic detritus was massively resuspended and redistributed.
The Impact of Bavi’s Passage on Migration of Hypoxic Water and Redistribution of Particulate Organic Matter
The impact of Bavi’s passage on migration of the hypoxic water and redistribution of particulate organic matter is summarized as follows, which may be found in other coastal waters subject to both hypoxia and TCs. During the typhoon passage, the cyclonic wind field (Figure 15) stimulated a regional cyclonic loop current in the ECS and a coastal downwelling occurred, which is contrary to the general circulation pattern in summer. The onshore transport of warmer water resulted in coastal warming (Figure 15). Both southward and offshore/seaward bottom currents intruded into the submerged river valley across isobaths. Before the typhoon passed, the water masses with low DO concentration and high planktonic detritus organic matter were distributed at the shallow Changjiang bank to the north of the submerged river valley and on the steep slope to the west of the submerged river valley. Due to the transport of hypoxic water by the currents driven by the typhoon (Figure 15), the hypoxic zone at the submerged valley migrated offshore/seaward. By the typhoon-driven currents, the particulate organic matter was also transported to the deeper sea floor (Figure 15). The synoptic transport of detritus suggests a significant pathway for cross-isobath transport of particulate organic matter, and the subsequential decomposition may further affect the evolution of hypoxia long after the typhoon’s passage.
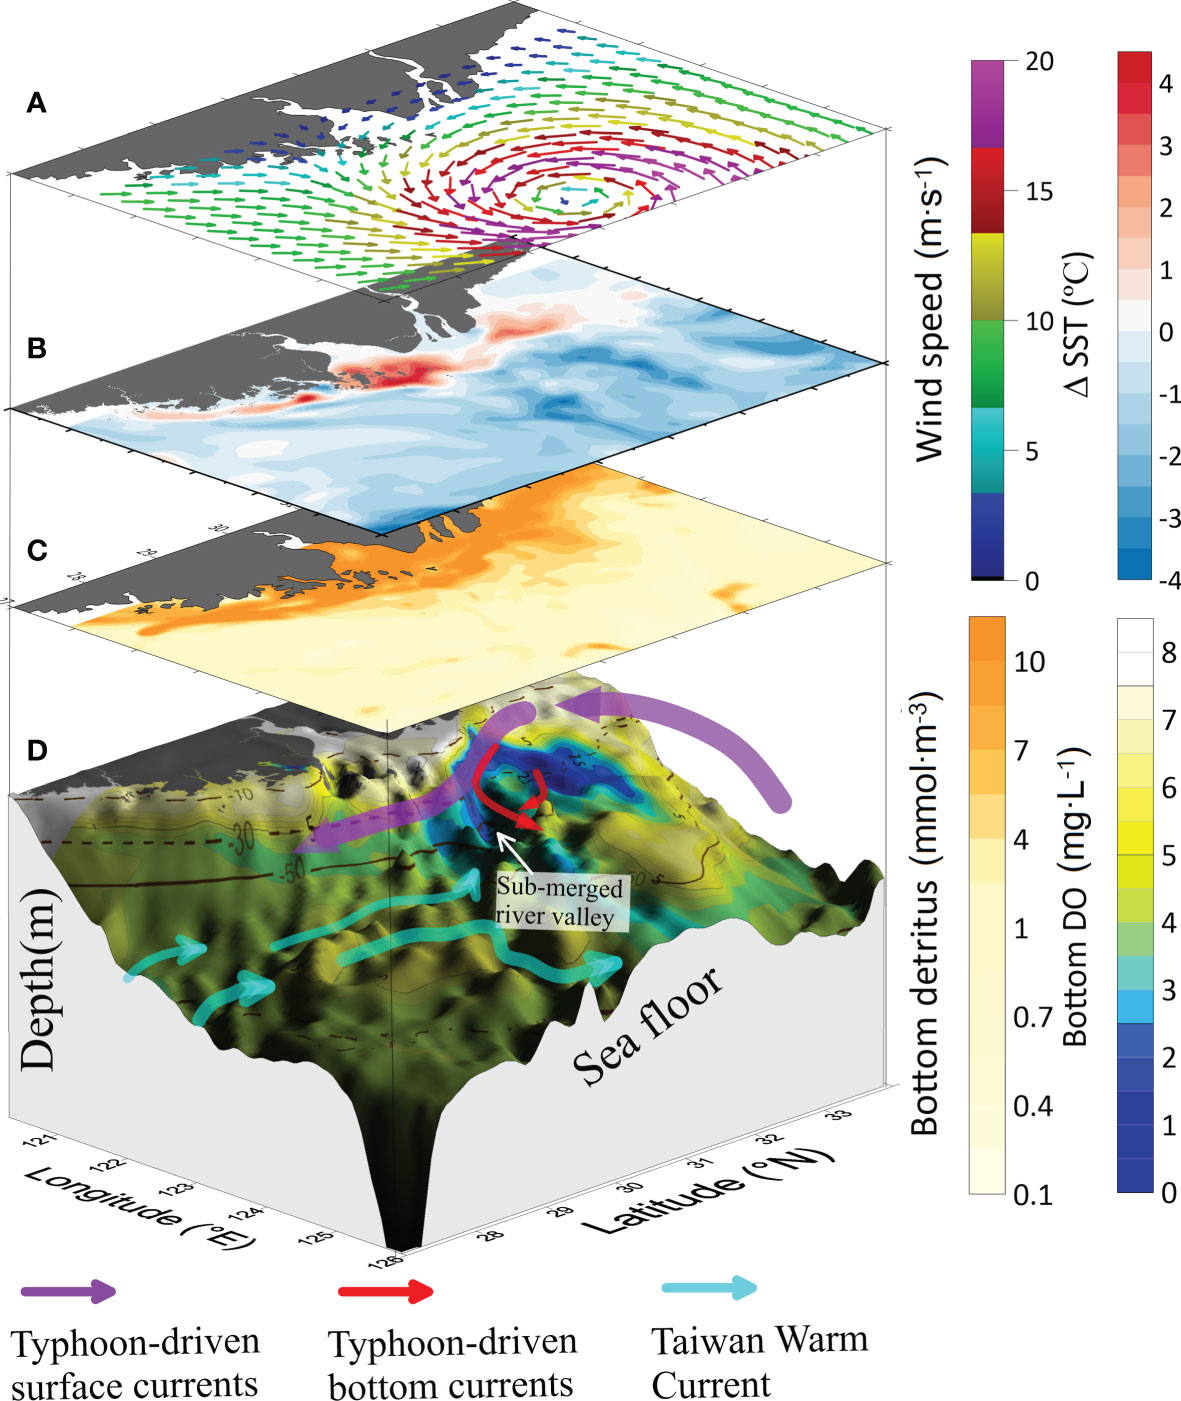
Figure 15 Schematic diagram for the coastal ocean warming induced by the passage of Bavi and the impact of the typhoon’s passage on migration of hypoxic water and redistribution of particulate organic matter: (A) the typhoon wind field; (B) variation in the sea surface temperature (SST) before and after the typhoon passage; (C) distribution of planktonic detritus organic matter before the typhoon’s passage; and (D) the dissolved oxygen (DO) concentration before the typhoon’s passage, bathymetry, and currents.
Conclusions
The process-oriented study on the development of coastal hypoxia off the Changjiang Estuary in response to the passage of a typhoon in close proximity to the coast via repeated surveys and the three-dimensional physical–biogeochemical model revealed the following findings:
1. The typhoon-induced physical process that largely changed the coastal environment can be advection more than mixing as suggested in this year. A phenomenon indicating the predominant role of advection is the coastal ocean warming. During the passage of Bavi, a regional quasi-barotropic cyclonic loop current in the opposite direction of the general coastal currents in summer was generated. A strong shoreward transport of shelf surface water and the subsequent coastal downwelling resulted in a warming of the coastal water.
2. The observed offshore migration of the hypoxic zone along a transect through the submerged river valley after Bavi’s passage was a result of the cross-isobath intrusion of bottom hypoxic water from the north and west.
3. The cross-isobath intrusion of bottom water also transported particulate organic matter from the inner shelf and the shallow Changjiang bank towards the submerged river valley, suggesting both short- and long-term effects on the regional marine biogeochemical environment induced by the passage of Bavi.
However, the impact of typhoon passages through the ECS on the seasonal variation in the hypoxic zone and their impact on the long-term sequestration of carbon remain unclear. More efforts will be needed to address these questions.
Data Availability Statement
The raw data supporting the conclusions of this article will be made available by the authors, without undue reservation.
Author Contributions
QM, FZ, JC, and DH proposed the scientific questions. QM and FZ designed the original ideas and coordinated the research. JZ, JC, and FZ designed the cruise. DL conducted field measurements. XM and BW analyzed the field data. QM, FZ, DT, and JL prepared the coupled physical–biogeochemical modeling and validated the model. JX, HZ, and SW analyzed the physical response of the coastal ocean to the typhoon. QM, XN, WZ, BW, and DL analyzed the biogeochemical of the coastal ocean to the typhoon. QM and FZ wrote the original manuscript draft. All authors contributed to the article and approved the submitted version.
Funding
This work was supported by Key R&D Program of Zhejiang (Contract No. 2022C03044), National Key R&D Program of China (Grant No. 2018YFD0900906), National Programme on Global Change and Air-Sea Interaction (Phase II) (Grant Nos. GASI-01-CJK and GASI-04-WLHY-03), Zhejiang Provincial Ten Thousand Talents Plan (Grant No. 2020R52038), National Natural Science Foundation of China (Grant Nos. 41876026 and 41806095), Scientific Research Fund of the Second Institute of Oceanography, MNR (Grant No. SL2102), Research Fund of Zhejiang Province (Grant No. 330000210130313013006), the Project of State Key Laboratory of Satellite Ocean Environment Dynamics (Grant Nos. SOEDZZ2203, SOEDZZ1905, SOEDZZ2103, and SOEDZZ2105), the Innovation Group Project of Southern Marine Science and Engineering Guangdong Laboratory (Zhuhai) (No. 311021001), and the project supported by Southern Marine Science and Engineering Guangdong Laboratory (Zhuhai) (Grant No. SML2021SP207). The cruises were supported jointly by Long-Term Observation and Research Plan in the Changjiang Estuary and the Adjacent East China Sea Project (LORCE, Grant No. SZ2001), Hypoxia and Acidification Monitoring and Warning Project of MNR.
Conflict of Interest
The authors declare that the research was conducted in the absence of any commercial or financial relationships that could be construed as a potential conflict of interest.
Publisher’s Note
All claims expressed in this article are solely those of the authors and do not necessarily represent those of their affiliated organizations, or those of the publisher, the editors and the reviewers. Any product that may be evaluated in this article, or claim that may be made by its manufacturer, is not guaranteed or endorsed by the publisher.
Acknowledgments
We sincerely acknowledge the genuine help of Prof. R. Toumi for highlighting the novelty. All model simulations were supported by the high-performance computing cluster of State Key Laboratory of Satellite Ocean Environment Dynamics.
References
Atlas R., Hoffman R. N., Ardizzone J., Leidner S. M., Jusem J. C., Smith D. K., et al. (2011). A Cross-Calibrated, Multiplatform Ocean Surface Wind Velocity Product for Meteorological and Oceanographic Applications. Bull. Am. Meteorol. Soc. 92 (2), 157–174. doi: 10.1175/2010bams2946.1
Bleck R. (2002). An Oceanic General Circulation Model Framed in Hybrid Isopycnic-Cartesian Coordinates. Ocean. Modell. 4 (1), 55–88. doi: 10.1016/S1463-5003(01)00012-9
Breitburg D., Levin L. A., Oschlies A., Grégoire M., Chavez F. P., Conley D. J., et al. (2018). Declining Oxygen in the Global Ocean and Coastal Waters. Science 359 (6371), eaam7240. doi: 10.1126/science.aam7240
Bruneau N., Toumi R., Wang S. (2018). Impact of Wave Whitecapping on Land Falling Tropical Cyclones. Sci. Rep. 8 (1), 652. doi: 10.1038/s41598-017-19012-3
Chai F., Dugdale R. C., Peng T. H., Wilkerson F. P., Barber R. T. (2002). One-Dimensional Ecosystem Model of the Equatorial Pacific Upwelling System. Part I: Model Development and Silicon and Nitrogen Cycle. Deep Sea Res. Part II: Topical Stud. Oceanogr. 49, 13, 2713–2745. doi: 10.1016/S0967-0645(02)00055-3
Chai F., Wang Y., Xing X., Yan Y., Xue H., Wells M., et al. (2021). A Limited Effect of Sub-Tropical Typhoons on Phytoplankton Dynamics. Biogeosciences 18 (3), 849–859. doi: 10.5194/bg-18-849-2021
Chen D. X. (1992). Marine Atlas of Bohai Sea, Yellow Sea and East China Sea, Hydrology (Beijing: China Ocean Press).
Chi L., Song X., Yuan Y., Wang W., Cao X., Wu Z., et al. (2020). Main Factors Dominating the Development, Formation and Dissipation of Hypoxia Off the Changjiang Estuary (CE) and its Adjacent Waters, China. Environ. Poll. 265, 115066. doi: 10.1016/j.envpol.2020.115066
Diaz R. J., Rosenberg R. (2008). Spreading Dead Zones and Consequences for Marine Ecosystems. Science 321 (5891), 926–929. doi: 10.1126/science.1156401
Egbert G. D., Erofeeva S. Y. (2002). Efficient Inverse Modeling of Barotropic Ocean Tides. J. Atmos. Ocean. Technol. 19 (2), 183–204. doi: 10.1175/1520-0426(2002)019<0183:Eimobo>2.0.Co;2
Fennel K., Testa J. M. (2019). Biogeochemical Controls on Coastal Hypoxia. Annu. Rev. Mar. Sci. 11 (1), 105–130. doi: 10.1146/annurev-marine-010318-095138
Glenn S. M., Miles T. N., Seroka G. N., Xu Y., Forney R. K., Yu F., et al. (2016). Stratified Coastal Ocean Interactions With Tropical Cyclones. Nat. Commun. 7 (1), 10887. doi: 10.1038/ncomms10887
Guo Y., Rong Z., Li B., Xu Z., Li P., Li X. (2019). Physical Processes Causing the Formation of Hypoxia Off the Changjiang Estuary After Typhoon Chan-Ho. J. Oceanol. Limnol. 37 (1), 1–17. doi: 10.1007/s00343-019-7336-5
Haidvogel D. B., Arango H., Budgell W. P., Cornuelle B. D., Curchitser E., Di Lorenzo E., et al. (2008). Ocean Forecasting in Terrain-Following Coordinates: Formulation and Skill Assessment of the Regional Ocean Modeling System. J. Comput. Phys. 227 (7), 3595–3624. doi: 10.1016/j.jcp.2007.06.016
Halliwell G. R. (1998). Simulation of North Atlantic Decadal/Multidecadal Winter SST Anomalies Driven by Basin-Scale Atmospheric Circulation Anomalies. J. Phys. Oceanogr. 28 (1), 5–21. doi: 10.1175/1520-0485(1998)028<0005:Sonadm>2.0.Co;2
Halliwell G. R., Shay L. K., Brewster J. K., Teague W. J. (2011). Evaluation and Sensitivity Analysis of an Ocean Model Response to Hurricane Ivan. Month. Weath. Rev. 139 (3), 921–945. doi: 10.1175/2010mwr3104.1
Hart R. E., Maue R. N., Watson M. C. (2007). Estimating Local Memory of Tropical Cyclones Through MPI Anomaly Evolution. Month. Weath. Rev. 135 (12), 3990–4005. doi: 10.1175/2007mwr2038.1
Hazelworth J. B. (1968). Water Temperature Variations Resulting From Hurricanes. J. Geophys. Res. (1896-1977) 73 (16), 5105–5123. doi: 10.1029/JB073i016p05105
Hersbach H., Bell B., Berrisford P., Hirahara S., Horányi A., Muñoz-Sabater J., et al. (2020). The ERA5 Global Reanalysis. Q. J. R. Meteorol. Soc. 146 (730), 1999–2049. doi: 10.1002/qj.3803
Hoshika A., Tanimoto T., Mishima Y., Iseki K., Okamura K. (2003). Variation of Turbidity and Particle Transport in the Bottom Layer of the East China Sea. Deep Sea Research Part II: Topical Studies in Oceanography 50, 2, 443–455. doi: 10.1016/S0967-0645(02)00462-9
Huang C. J., Qiao F. (2021). Simultaneous Observations of Turbulent Reynolds Stress in the Ocean Surface Boundary Layer and Wind Stress Over the Sea Surface. J. Geophys. Res.: Ocean 126 (2), e2020JC016839. doi: 10.1029/2020JC016839
Jin W., Liang C., Hu J., Meng Q., Lü H., Wang Y., et al. (2020). Modulation Effect of Mesoscale Eddies on Sequential Typhoon-Induced Oceanic Responses in the South China Sea. Remote Sens. 12 (18), 3059. doi: 10.3390/rs12183059
Keeling R. F., Stephens B. B., Najjar R. G., Doney S. C., Archer D., Heimann M. (1998). Seasonal Variations in the Atmospheric O2/N2 Ratio in Relation to the Kinetics of Air-Sea Gas Exchange. Global Biogeochem. Cycle. 12 (1), 141–163. doi: 10.1029/97GB02339
Kelly K. A., Thompson L., Cheng W., Metzger E. J. (2007). Evaluation of HYCOM in the Kuroshio Extension Region Using New Metrics. J. Geophys. Res.: Ocean 112, C01004. doi: 10.1029/2006JC003614
Large W. G., Pond S. (1981). Open Ocean Momentum Flux Measurements in Moderate to Strong Winds. J. Phys. Oceanogr. 11 (3), 324–336. doi: 10.1175/1520-0485(1981)011<0324:Oomfmi>2.0.Co;2
Liblik T., Wu Y., Fan D., Shang D. (2020). Wind-Driven Stratification Patterns and Dissolved Oxygen Depletion Off the Changjiang (Yangtze) Estuary. Biogeosciences 17 (10), 2875–2895. doi: 10.5194/bg-17-2875-2020
Li D., Chen J., Ni X., Wang K., Zeng D., Wang B., et al. (2019). Hypoxic Bottom Waters as a Carbon Source to Atmosphere During a Typhoon Passage Over the East China Sea. Geophys. Res. Lett. 46 (20), 11329–11337. doi: 10.1029/2019GL083933
Lin I., Liu W. T., Wu C.-C., Wong G. T. F., Hu C., Chen Z., et al. (2003). New Evidence for Enhanced Ocean Primary Production Triggered by Tropical Cyclone. Geophys. Res. Lett. 30 (13), 1718. doi: 10.1029/2003GL017141
Li D., Zhang J., Huang D., Wu Y., Liang J. (2002). Oxygen Depletion Off the Changjiang (Yangtze River) Estuary. Sci. China Ser. D.: Earth Sci. 45 (12), 1137–1146. doi: 10.1360/02yd9110
Luo Z., Zhu J., Wu H., Li X. (2017). Dynamics of the Sediment Plume Over the Yangtze Bank in the Yellow and East China Seas. J. Geophys. Res.: Ocean 122 (12), 10073–10090. doi: 10.1002/2017JC013215
Lü X., Qiao F., Xia C., Zhu J., Yuan Y. (2006). Upwelling Off Yangtze River Estuary in Summer. J. Geophys. Res.: Ocean 111 (C11), C11S08. doi: 10.1029/2005JC003250
Lu X., Yu H., Ying M., Zhao B., Zhang S., Lin L., et al. (2021). Western North Pacific Tropical Cyclone Database Created by the China Meteorological Administration. Adv. Atmos. Sci. 38 (4), 690–699. doi: 10.1007/s00376-020-0211-7
Mears C. A., Scott J., Wentz F. J., Ricciardulli L., Leidner S. M., Hoffman R., et al. (2019). A Near-Real-Time Version of the Cross-Calibrated Multiplatform (CCMP) Ocean Surface Wind Velocity Data Set. J. Geophys. Res.: Ocean 124 (10), 6997–7010. doi: 10.1029/2019JC015367
Mei W., Lien C.-C., Lin I.-I., Xie S.-P. (2015). Tropical Cyclone?Induced Ocean Response: A Comparative Study of the South China Sea and Tropical Northwest Pacific. J. Climate 28 (15), 5952–5968. doi: 10.1175/jcli-d-14-00651.1
Meng Q., Zhang W., Zhou F., Liao Y., Yu P., Tang Y., et al. (2022). Water Oxygen Consumption Rather Than Sediment Oxygen Consumption Drives the Variation of Hypoxia on the East China Sea Shelf. J. Geophys. Res.: Biogeosci. 127 (2), e2021JG006705. doi: 10.1029/2021JG006705
Morey S. L., Bourassa M. A., Dukhovskoy D. S., O’Brien J. J. (2006). Modeling Studies of the Upper Ocean Response to a Tropical Cyclone. Ocean. Dynamic. 56 (5), 594–606. doi: 10.1007/s10236-006-0085-y
Ni X., Huang D., Zeng D., Zhang T., Li H., Chen J. (2016). The Impact of Wind Mixing on the Variation of Bottom Dissolved Oxygen Off the Changjiang Estuary During Summer. J. Mar. Syst. 154, 122–130. doi: 10.1016/j.jmarsys.2014.11.010
Pan G., Chai F., Tang D., Wang D. (2017). Marine Phytoplankton Biomass Responses to Typhoon Events in the South China Sea Based on Physical-Biogeochemical Model. Ecol. Modell. 356, 38–47. doi: 10.1016/j.ecolmodel.2017.04.013
Powell M. D., Vickery P. J., Reinhold T. A. (2003). Reduced Drag Coefficient for High Wind Speeds in Tropical Cyclones. Nature 422 (6929), 279–283. doi: 10.1038/nature01481
Price J. F. (1981). Upper Ocean Response to a Hurricane. J. Phys. Oceanogr. 11 (2), 153–175. doi: 10.1175/1520-0485(1981)011<0153:Uortah>2.0.Co;2
Price J. F., Weller R. A., Pinkel R. (1986). Diurnal Cycling: Observations and Models of the Upper Ocean Response to Diurnal Heating, Cooling, and Wind Mixing. J. Geophys. Res.: Ocean 91 (C7), 8411–8427. doi: 10.1029/JC091iC07p08411
Prytherch J., Yelland M. J., Pascal R. W., Moat B. I., Skjelvan I., Srokosz M. A. (2010). Open Ocean Gas Transfer Velocity Derived From Long-Term Direct Measurements of the CO2 Flux. Geophys. Res. Lett. 37 (23), L23607. doi: 10.1029/2010GL045597
Reynolds R. W., Smith T. M., Liu C., Chelton D. B., Casey K. S., Schlax M. G. (2007). Daily High-Resolution-Blended Analyses for Sea Surface Temperature. J. Climate 20 (22), 5473–5496. doi: 10.1175/2007jcli1824.1
Seroka G., Miles T., Xu Y., Kohut J., Schofield O., Glenn S. (2016). Hurricane Irene Sensitivity to Stratified Coastal Ocean Cooling. Month. Weath. Rev. 144 (9), 3507–3530. doi: 10.1175/mwr-d-15-0452.1
Seroka G., Miles T., Xu Y., Kohut J., Schofield O., Glenn S. (2017). Rapid Shelf-Wide Cooling Response of a Stratified Coastal Ocean to Hurricanes. J. Geophys. Res.: Ocean 122 (6), 4845–4867. doi: 10.1002/2017JC012756
Shchepetkin A. F., McWilliams J. C. (2005). The Regional Oceanic Modeling System (ROMS): A Split-Explicit, Free-Surface, Topography-Following-Coordinate Oceanic Model. Ocean. Modell. 9 (4), 347–404. doi: 10.1016/j.ocemod.2004.08.002
Stauffer B. A., Gellene A. G., Schnetzer A., Seubert E. L., Oberg C., Sukhatme G. S., et al. (2012). An Oceanographic, Meteorological, and Biological ‘Perfect Storm’ Yields a Massive Fish Kill. Mar. Ecol. Prog. Ser. 468, 231–243. doi: 10.3354/meps09927
Su J., Dai M., He B., Wang L., Gan J., Guo X., et al. (2017). Tracing the Origin of the Oxygen-Consuming Organic Matter in the Hypoxic Zone in a Large Eutrophic Estuary: The Lower Reach of the Pearl River Estuary, China. Biogeosciences 14 (18), 4085–4099. doi: 10.5194/bg-14-4085-2017
Sun M., Duan Y., Zhu J., Wu H., Zhang J., Huang W. (2014). Simulation of Typhoon Muifa Using a Mesoscale Coupled Atmosphere-Ocean Model. Acta Oceanol. Sin. 33 (11), 123–133. doi: 10.1007/s13131-014-0561-z
Sun J., Wang Y., Zuo J. (2015). Characteristic Analysis of Typhoon Along Coastal Areas of Jiangsu and Zhejiang Provinces. J. Hohai. Univ. (Natur. Sci. Chinese.) 43 (3), 215–221. doi: 10.3876/j.issn.10001980.2015.03.005
Tian D., Zhou F., Zhang W., Zhang H., Ma X., Guo X. (2022). Effects of Dissolved Oxygen and Nutrients From the Kuroshio on Hypoxia Off the Changjiang River Estuary. J. Oceanol. Limnol. 40 (2), 515–529. doi: 10.1007/s00343-021-0440-3
Vaquer-Sunyer R., Duarte C. M. (2008). Thresholds of Hypoxia for Marine Biodiversity. Proc. Natl. Acad. Sci. 105 (40), 15452–15457. doi: 10.1073/pnas.0803833105
Wang B., Chen J., Jin H., Li H., Huang D., Cai W.-J. (2017). Diatom Bloom-Derived Bottom Water Hypoxia Off the Changjiang Estuary, With and Without Typhoon Influence. Limnol. Oceanogr. 62 (4), 1552–1569. doi: 10.1002/lno.10517
Wang S., Toumi R. (2021). Recent Migration of Tropical Cyclones Toward Coasts. Science 371 (6528), 514–517. doi: 10.1126/science.abb9038
Wang B., Wei Q., Chen J., Xie L. (2012). Annual Cycle of Hypoxia Off the Changjiang (Yangtze River) Estuary. Mar. Environ. Res. 77, 1–5. doi: 10.1016/j.marenvres.2011.12.007
Wang G., Wu L., Johnson N. C., Ling Z. (2016). Observed Three-Dimensional Structure of Ocean Cooling Induced by Pacific Tropical Cyclones. Geophys. Res. Lett. 43 (14), 7632–7638. doi: 10.1002/2016GL069605
Wang T., Zhang S. (2021). Effect of Summer Typhoon Linfa on the Chlorophyll-A Concentration in the Continental Shelf Region of Northern South China Sea. J. Mar. Sci. Eng. 9 (8), 794. doi: 10.3390/jmse9080794
Wei H., He Y., Li Q., Liu Z., Wang H. (2007). Summer Hypoxia Adjacent to the Changjiang Estuary. J. Mar. Syst. 67 (3), 292–303. doi: 10.1016/j.jmarsys.2006.04.014
Wei Q., Yao P., Xu B., Zhao B., Ran X., Zhao Y., et al. (2021). Coastal Upwelling Combined With the River Plume Regulates Hypoxia in the Changjiang Estuary and Adjacent Inner East China Sea Shelf. J. Geophys. Res.: Ocean 126, e2021JC017740. doi: 10.1029/2021JC017740
Wentz F. J., Gentemann C., Smith D., Chelton D. (2000). Satellite Measurements of Sea Surface Temperature Through Clouds. Science 288 (5467), 847–850. doi: 10.1126/science.288.5467.847
Wentz F. J. J., Scott J., Hoffman R., Leidner M., Atlas R., Ardizzone J. (2015). Remote Sensing Systems Cross-Calibrated Multi-Platform (CCMP) 6-Hourly Ocean Vector Wind Analysis Product on 0.25 Deg Grid, Version 2.0 (Santa Rosa, CA: Remote Sensing Systems). Available at: https://www.remss.com/measurements/ccmp.
Wu R. S. S. (2002). Hypoxia: From Molecular Responses to Ecosystem Responses. Mar. Poll. Bull. 45 (1), 35–45. doi: 10.1016/S0025-326X(02)00061-9
Xiu P., Chai F. (2014). Connections Between Physical, Optical and Biogeochemical Processes in the Pacific Ocean. Prog. Oceanogr. 122, 30–53. doi: 10.1016/j.pocean.2013.11.008
Ying M., Zhang W., Yu H., Lu X., Feng J., Fan Y., et al. (2014). An Overview of the China Meteorological Administration Tropical Cyclone Database. J. Atmos. Ocean. Technol. 31 (2), 287–301. doi: 10.1175/jtech-d-12-00119.1
Yu P., Wang Z. A., Churchill J., Zheng M., Pan J., Bai Y., et al. (2020). Effects of Typhoons on Surface Seawater Pco2 and Air-Sea CO2 Fluxes in the Northern South China Sea. J. Geophys. Res.: Ocean 125 (8), e2020JC016258. doi: 10.1029/2020JC016258
Zhang H., Chen D., Zhou L., Liu X., Ding T., Zhou B. (2016). Upper Ocean Response to Typhoon Kalmaegi, (2014). J. Geophys. Res.: Ocean 121 (8), 6520–6535. doi: 10.1002/2016JC012064
Zhang W., Cui Y., Santos A. I., Hanebuth T. J. J. (2016). Storm-Driven Bottom Sediment Transport on a High-Energy Narrow Shelf (NW Iberia) and Development of Mud Depocenters. J. Geophys. Res. - Ocean 121, 5751–5772. doi: 10.1002/2015JC011526
Zhang H., Fennel K., Laurent A., Bian C. (2020). A Numerical Model Study of the Main Factors Contributing to Hypoxia and its Interannual and Short-Term Variability in the East China Sea. Biogeosciences 17 (22), 5745–5761. doi: 10.5194/bg-17-5745-2020
Zhang H., He H., Zhang W.-Z., Tian D. (2021). Upper Ocean Response to Tropical Cyclones: A Review. Geosci. Lett. 8 (1), 1. doi: 10.1186/s40562-020-00170-8
Zhang H., Liu X., Wu R., Liu F., Yu L., Shang X., et al. (2019). Ocean Response to Successive Typhoons Sarika and Haima, (2016) Based on Data Acquired via Multiple Satellites and Moored Array. Remote Sens. 11 (20), 2360. doi: 10.3390/rs11202360
Zhang Z., Wang Y., Zhang W., Xu J. (2019). Coastal Ocean Response and Its Feedback to Typhoon Hato, (2017) Over the South China Sea: A Numerical Study. J. Geophys. Res.: Atmos. 124 (24), 13731–13749. doi: 10.1029/2019JD031377
Zhang W., Wu H., Hetland R. D., Zhu Z. (2019). On Mechanisms Controlling the Seasonal Hypoxia Hot Spots Off the Changjiang River Estuary. J. Geophys. Res.: Ocean 124 (12), 8683–8700. doi: 10.1029/2019JC015322
Zhang Z., Wu H., Yin X., Qiao F. (2018). Dynamical Response of Changjiang River Plume to a Severe Typhoon With the Surface Wave-Induced Mixing. J. Geophys. Res.: Ocean 123 (12), 9369–9388. doi: 10.1029/2018JC014266
Zhao Y., Uthaipan K., Lu Z., Li Y., Liu J., Liu H., et al. (2021). Destruction and Reinstatement of Coastal Hypoxia in the South China Sea Off the Pearl River Estuary. Biogeosciences 18 (8), 2755–2775. doi: 10.5194/bg-18-2755-2021
Zhou F., Chai F., Huang D., Wells M., Ma X., Meng Q., et al. (2020). Coupling and Decoupling of High Biomass Phytoplankton Production and Hypoxia in a Highly Dynamic Coastal System: The Changjiang (Yangtze River) Estuary. Front. Mar. Sci. 7.
Zhou F., Chai F., Huang D., Xue H., Chen J., Xiu P., et al. (2017). Investigation of Hypoxia Off the Changjiang Estuary Using a Coupled Model of ROMS-CoSiNE. Prog. Oceanogr. 159, 237–254. doi: 10.1016/j.pocean.2017.10.008
Zhou F., Huang D., Ni X., Xuan J., Zhang J., Zhu K. (2010). Hydrographic Analysis on the Multi-Time Scale Variability of Hypoxia Adjacent to the Changjiang River Estuary (in Chinese With English Abstract). Acta Ecolog. Sin. 30 (17), 4728–4740.
Zhou F., Xuan J., Ni X., Huang D. (2009). A Preliminary Study on Variations of the Changjiang Diluted Water Between August 1999 and 2006. Acta Oceanol. Sin. 28, 1–11.
Zhou F., Xue H., Huang D., Xuan J., Ni X., Xiu P., et al. (2015). Cross-Shelf Exchange in the Shelf of the East China Sea. J. Geophys. Res.: Ocean 120 (3), 1545–1572. doi: 10.1002/2014JC010567
Keywords: hypoxia, tropical cyclone/typhoon, East China Sea, coastal ocean warming, particulate organic matter, physical–biogeochemical model
Citation: Meng Q, Zhou F, Ma X, Xuan J, Zhang H, Wang S, Ni X, Zhang W, Wang B, Li D, Tian D, Li J, Zeng J, Chen J and Huang D (2022) Response Process of Coastal Hypoxia to a Passing Typhoon in the East China Sea. Front. Mar. Sci. 9:892797. doi: 10.3389/fmars.2022.892797
Received: 09 March 2022; Accepted: 13 April 2022;
Published: 20 May 2022.
Edited by:
Tim Rixen, Leibniz Centre for Tropical Marine Research (LG), GermanyReviewed by:
Tarron Lamont, Department of Environment, Forestry and Fisheries (DEFF), South AfricaBirgit Gaye, University of Hamburg, Germany
Copyright © 2022 Meng, Zhou, Ma, Xuan, Zhang, Wang, Ni, Zhang, Wang, Li, Tian, Li, Zeng, Chen and Huang. This is an open-access article distributed under the terms of the Creative Commons Attribution License (CC BY). The use, distribution or reproduction in other forums is permitted, provided the original author(s) and the copyright owner(s) are credited and that the original publication in this journal is cited, in accordance with accepted academic practice. No use, distribution or reproduction is permitted which does not comply with these terms.
*Correspondence: Feng Zhou, emhvdWZlbmdAc2lvLm9yZy5jbg==
 Qicheng Meng
 Feng Zhou
 Xiao Ma
 Jiliang Xuan
 Han Zhang
 Shuai Wang6
 Xiaobo Ni
 Wenyan Zhang
 Bin Wang
 Dewang Li
 Di Tian
 Jia Li
 Jiangning Zeng
 Jianfang Chen
 Daji Huang