- Department of Civil and Environmental Engineering, Amirkabir University of Technology (Tehran Polytechnic), Tehran, Iran
The turbulence and mixing generated by schools of three fish species, namely koi, pangasius, and goldfish, were quantified in a series of controlled laboratory experiments. The effects of fish abundance, light, and water temperature on the turbulence parameters of the flow produced by the three fish species in a quiescent background were investigated by measuring the velocity field using acoustic Doppler velocimetry. It was observed that the turbulent flow was approximately homogeneous and isotropic and had low-mean velocities. The results show that increasing fish abundance and body size, dimming the ambient light, and increasing the water temperature increase the root-mean-square velocity, the integral time scale, and the rate of dissipation of turbulent kinetic energy. Consequently, fish abundance and body size, as well as environmental parameters, can influence fish-generated turbulence. To further quantify turbulent mixing, the dissipation rate, the mixing efficiency, and the vertical eddy diffusivity were extrapolated for the three fish species at their natural abundances. The dissipation rate of O(10-7-10-6) W/kg, the mixing efficiency of O(10-2-10-1), and the vertical eddy diffusivity of O(10-4) m2/s were estimated. These values are within the range of those of the physical sources. This demonstrates that the contribution of aquatic animals to the turbulent mixing of water environments may be significant, at least locally" to the end of the sentence so that it reads: "mixing of water environments may be significant, at least locally. Furthermore, the dissipation rate and eddy diffusivity are found to increase with the Reynolds numbers of aquatic species.
Introduction
Turbulence plays a key role in the mixing of lakes, seas, and oceans. In the past, researchers mainly identified winds, currents, and tides as the main sources of turbulence and mixing in the water bodies, and the contribution of aquatic organisms has been ignored. More recent studies have highlighted the potential role of aquatic animals in the turbulent mixing of water bodies (Dewar et al., 2006; Kunze et al., 2006; Katija, 2012; Wilhelmus and Dabiri, 2014; Camozzi, 2017). The biologically-generated turbulence/mixing is referred to as biogenic turbulence/mixing or biomixing.
The potential contribution of aquatic animals to water-body mixing was first suggested by Munk (1966). Many years later, Huntley and Zhou (2004) and Dewar et al. (2006) argued by scale analysis that aquatic animals contribute to the mechanical energy required to mix the oceans at a rate comparable to other physical driving forces such as wind and tides. Furthermore, it was shown that the dissipation rate of turbulent kinetic energy per unit mass, or simply dissipation rate, induced by schooling animals is comparable to those of major storms and is estimated to be O(10-5) W/kg (where O(.) denotes order of magnitude), regardless of animal size and species (Huntley and Zhou, 2004). However, Kunze (2019) argued that biogenic turbulence is only locally significant in dense aggregations of aquatic animals.
The biomixing resulting from vertical migrations of marine species such as krill and zooplankton has been investigated in several studies. Kunze et al. (2006) found the biogenic turbulence generated by the vertical migration of krill in a coastal inlet (Saanich Inlet, British Columbia) to be an important source of mixing in coastal oceans. The measured dissipation rate was similar to the estimate of Huntley and Zhou (2004) for Atlantic krill. On the contrary, another study in the same coastal region found that the dissipation rate caused by 10,000 krill per cubic meter of water was only on the order of 10-8 W/kg (Rousseau et al., 2010).
The biogenic turbulence and mixing caused by vertical migration of a zooplankton Daphnia Magna were experimentally examined in the laboratory by Noss and Lorke (2014). Their results indicated that the migration of Daphnia Magna does not noticeably enhance mixing. Similarly, Simoncelli et al. (2018), who studied another species of zooplankton (Daphnia) in a small man-made lake, did not observe a significant biologically-enhanced dissipation rate, turbulent kinetic energy, and turbulent diffusivity, even at concentrations as high as 60 organisms per liter. Moreover, Kunze (2011) found that contributions from low-Reynolds number swimming marine organisms such as zooplankton are negligible to ocean mixing overall. On the other hand, Dean et al. (2016) showed with CFD modeling of the diel vertical migration that the zooplankton concentration affects the dissipation rate and that large concentrations may increase the ambient turbulence.
In addition to small marine species, a number of studies have examined the biogenic turbulence caused by fish. Gregg and Horne (2009) evaluated the dissipation rate and mixing efficiency associated with the horizontal movement of a group of fish in the Monterey Bay area. They argued that although fish could increase the energy of the ocean, they could not play a significant role in mixing the ocean. The dissipation rate within a school of Japanese sardines was measured in the laboratory by Tanaka et al. (2017). The dissipation rate was O(10-4) W/kg inside the school, while that of the background level was O(10-5) W/kg. They also estimated a noticeably high turbulent diffusivity of 2.1×10⁻²-2.4×10⁻¹ m2/s, using all ranges of the dissipation rate and buoyancy frequency. A study on juvenile Atlantic salmon in a circular tank also showed that the turbulent kinetic energy, dissipation rate, and turbulent transport of oxygen increased in the presence of fish (Plew et al., 2015). Moreover, Camozzi (2017) quantified the turbulence generated by smaller schooling tropical fish, namely neon and Congo tetras, in laboratory experiments. His results revealed that the biogenic turbulence parameters, including the root-mean-square (RMS) velocity and the dissipation rate, are independent of fish abundance. However, the parameters were found to have a relationship with animal body size. Finally, by examining the effect of juvenile carp on the flow in the rectangular tank, Bi et al. (2020) found that the increase in turbulence caused by fish is small and limited.
Despite many numerical, laboratory, and field studies on different aquatic species, there is still no general agreement on the importance of biogenic turbulence in the mixing and circulation of lakes, seas, and oceans. The main reason for significant differences in the results (e.g., dissipation rates) may probably be the lack of accurate identification of the parameters affecting biogenic turbulence. Moreover, biomixing needs to be further quantified by more experimental studies measuring the mixing efficiency and turbulent diffusivity (Katija, 2012). In fact, the quantification of such parameters makes it possible to determine the potential contribution of biogenic inputs to turbulent mixing in water bodies. The present work aims to expand the previous research by investigating biogenic turbulence generated by selected species of fish in a controlled laboratory environment. We quantify the turbulence created by fish schools having different body sizes and constrained within an aquarium as they respond to abundance, water temperature, and light in a quiescent background. Lastly, by comparing the dissipation rate, mixing efficiency, and turbulent diffusivity with those caused by other aquatic animals and physical sources, the importance of biogenic turbulence in lakes, seas, and oceans is identified.
Materials and methods
Experiments were performed to measure the velocity field generated by selected fish schools in an aquarium located at the Hydraulic Laboratory of Amirkabir University of Technology (Tehran Polytechnic). The animal study was reviewed and approved by the University. The schematic of the experimental setup is shown in Figure 1. The aquarium was 1.13-m long, 0.32-m wide, and 0.55-m deep and was equipped with an air pump, filter, heater, lamp, and thermometer. The water depth in the aquarium during the experiments was 0.50 m. The experiments were conducted in a quiescent background and the velocity field measured was only that created by the hovering/schooling fish. To reduce stress and create relatively stable conditions for the fish, we performed all the tests between 10 am and 2 pm, with the aquarium exposed to natural daylight, except for light experiments, which will be explained later. The different species of freshwater fish in this study included ten koi (Cyprinus rubrofuscus) with an average body length (ℓ) of 5 cm, ten pangasius (Pangasianodon hypophthalmus) with ℓ = 8 cm, and ten goldfish (Carassius auratus) with ℓ = 12 cm.
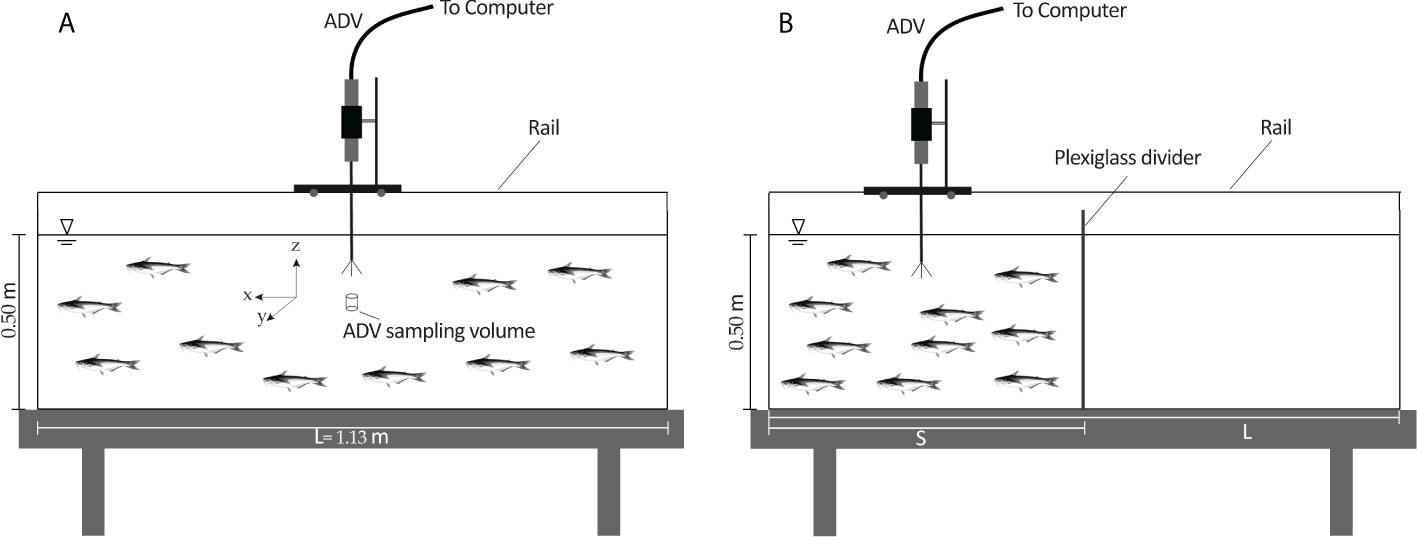
Figure 1 The schematic diagram of the aquarium and measurement apparatus, acoustic Doppler velocimeter (ADV) for: (A) the minimum abundance of 50 animal/m3, and (B) the abundances of 100 to 300 animal/m3 created by restricting the water volume using a plexiglass divider (S = L/n, n = 2-6).
In three sets of experiments, the effects of fish abundance, light, and water temperature on the biogenic turbulence were examined. A plexiglass divider was used to constrain the fish to smaller water volumes in the aquarium, as shown in Figure 1B, thereby varying the fish abundance per unit volume of water. The abundances of 50 to 300 fish per cubic meter of water were created for different species of fish. For the light experiments, the influence of artificial light, natural daylight, and darkness was investigated. To create artificial light, a yellow light projector with a voltage of 220 and a power of 1000 watts (150,000 lumens) was used. Furthermore, dark conditions were created upon covering all the aquarium sides with black cardboard. The water temperature was approximately 24°C for abundance and light experiments. Lastly, the effect of water temperature was evaluated by varying the water temperature from 22 to 28°C, at a constant abundance of 50 fish per cubic meter, for the selected species of fish. The temperature range of the tests was suitable for the three fish species and did not pose a threat to their health. It is worth noting that based on our observations during the three sets of experiments, the fish schooled erratically and uniformly within the water volume.
A Nortek 10-MHz ADVLab acoustic Doppler velocimeter (ADV) was used to measure the three-dimensional velocity field. The ADV probe was located at equal distances from the side walls and 5 cm below the water surface. Given that the sampling volume of the ADV is located 5 cm below the transmitter (Nortek, 2018), the measurements were taken at a depth of approximately 10 cm. The distance between the probe and sampling volume minimizes the flow disturbance. During the measurements, the sampling frequency of the ADV was set to 25 Hz (maximum). The nominal velocity range setting of ±3 cm/s, which spanned the entire range of measured velocities, was selected. The sampling volume height was set to its maximum (9.1 mm), which resulted in a decreased Doppler noise (Kazemi et al., 2021). The accuracy of the ADV for velocity measurements was 0.5% of the measured values ±1 mm/s (Nortek, 2018). To ensure high signal-to-noise ratios of the measurements, it is necessary to mix suspended particles in the water. Typical particles used in previous studies, e.g., hollow glass spheres and talcum powder (Khorsandi et al., 2012; Moeini et al., 2020; Kazemi et al., 2022), may endanger the health of fish. Therefore, in the present study, low concentrations of chickpea flour were mixed with water, which did not remarkably influence fish health and behavior. The air pump was turned off 5 minutes before each test so that the turbulence measured was only that generated by the fish. The data was recorded for a duration of 30 minutes (45,000 data points) for each test. Figure 2 shows an example of the effect of record length on the RMS velocity, in the presence of pangasius school. We remark that our sampling times were especially long to ensure convergence of statistics. For each experiment, the tests were repeated three times.
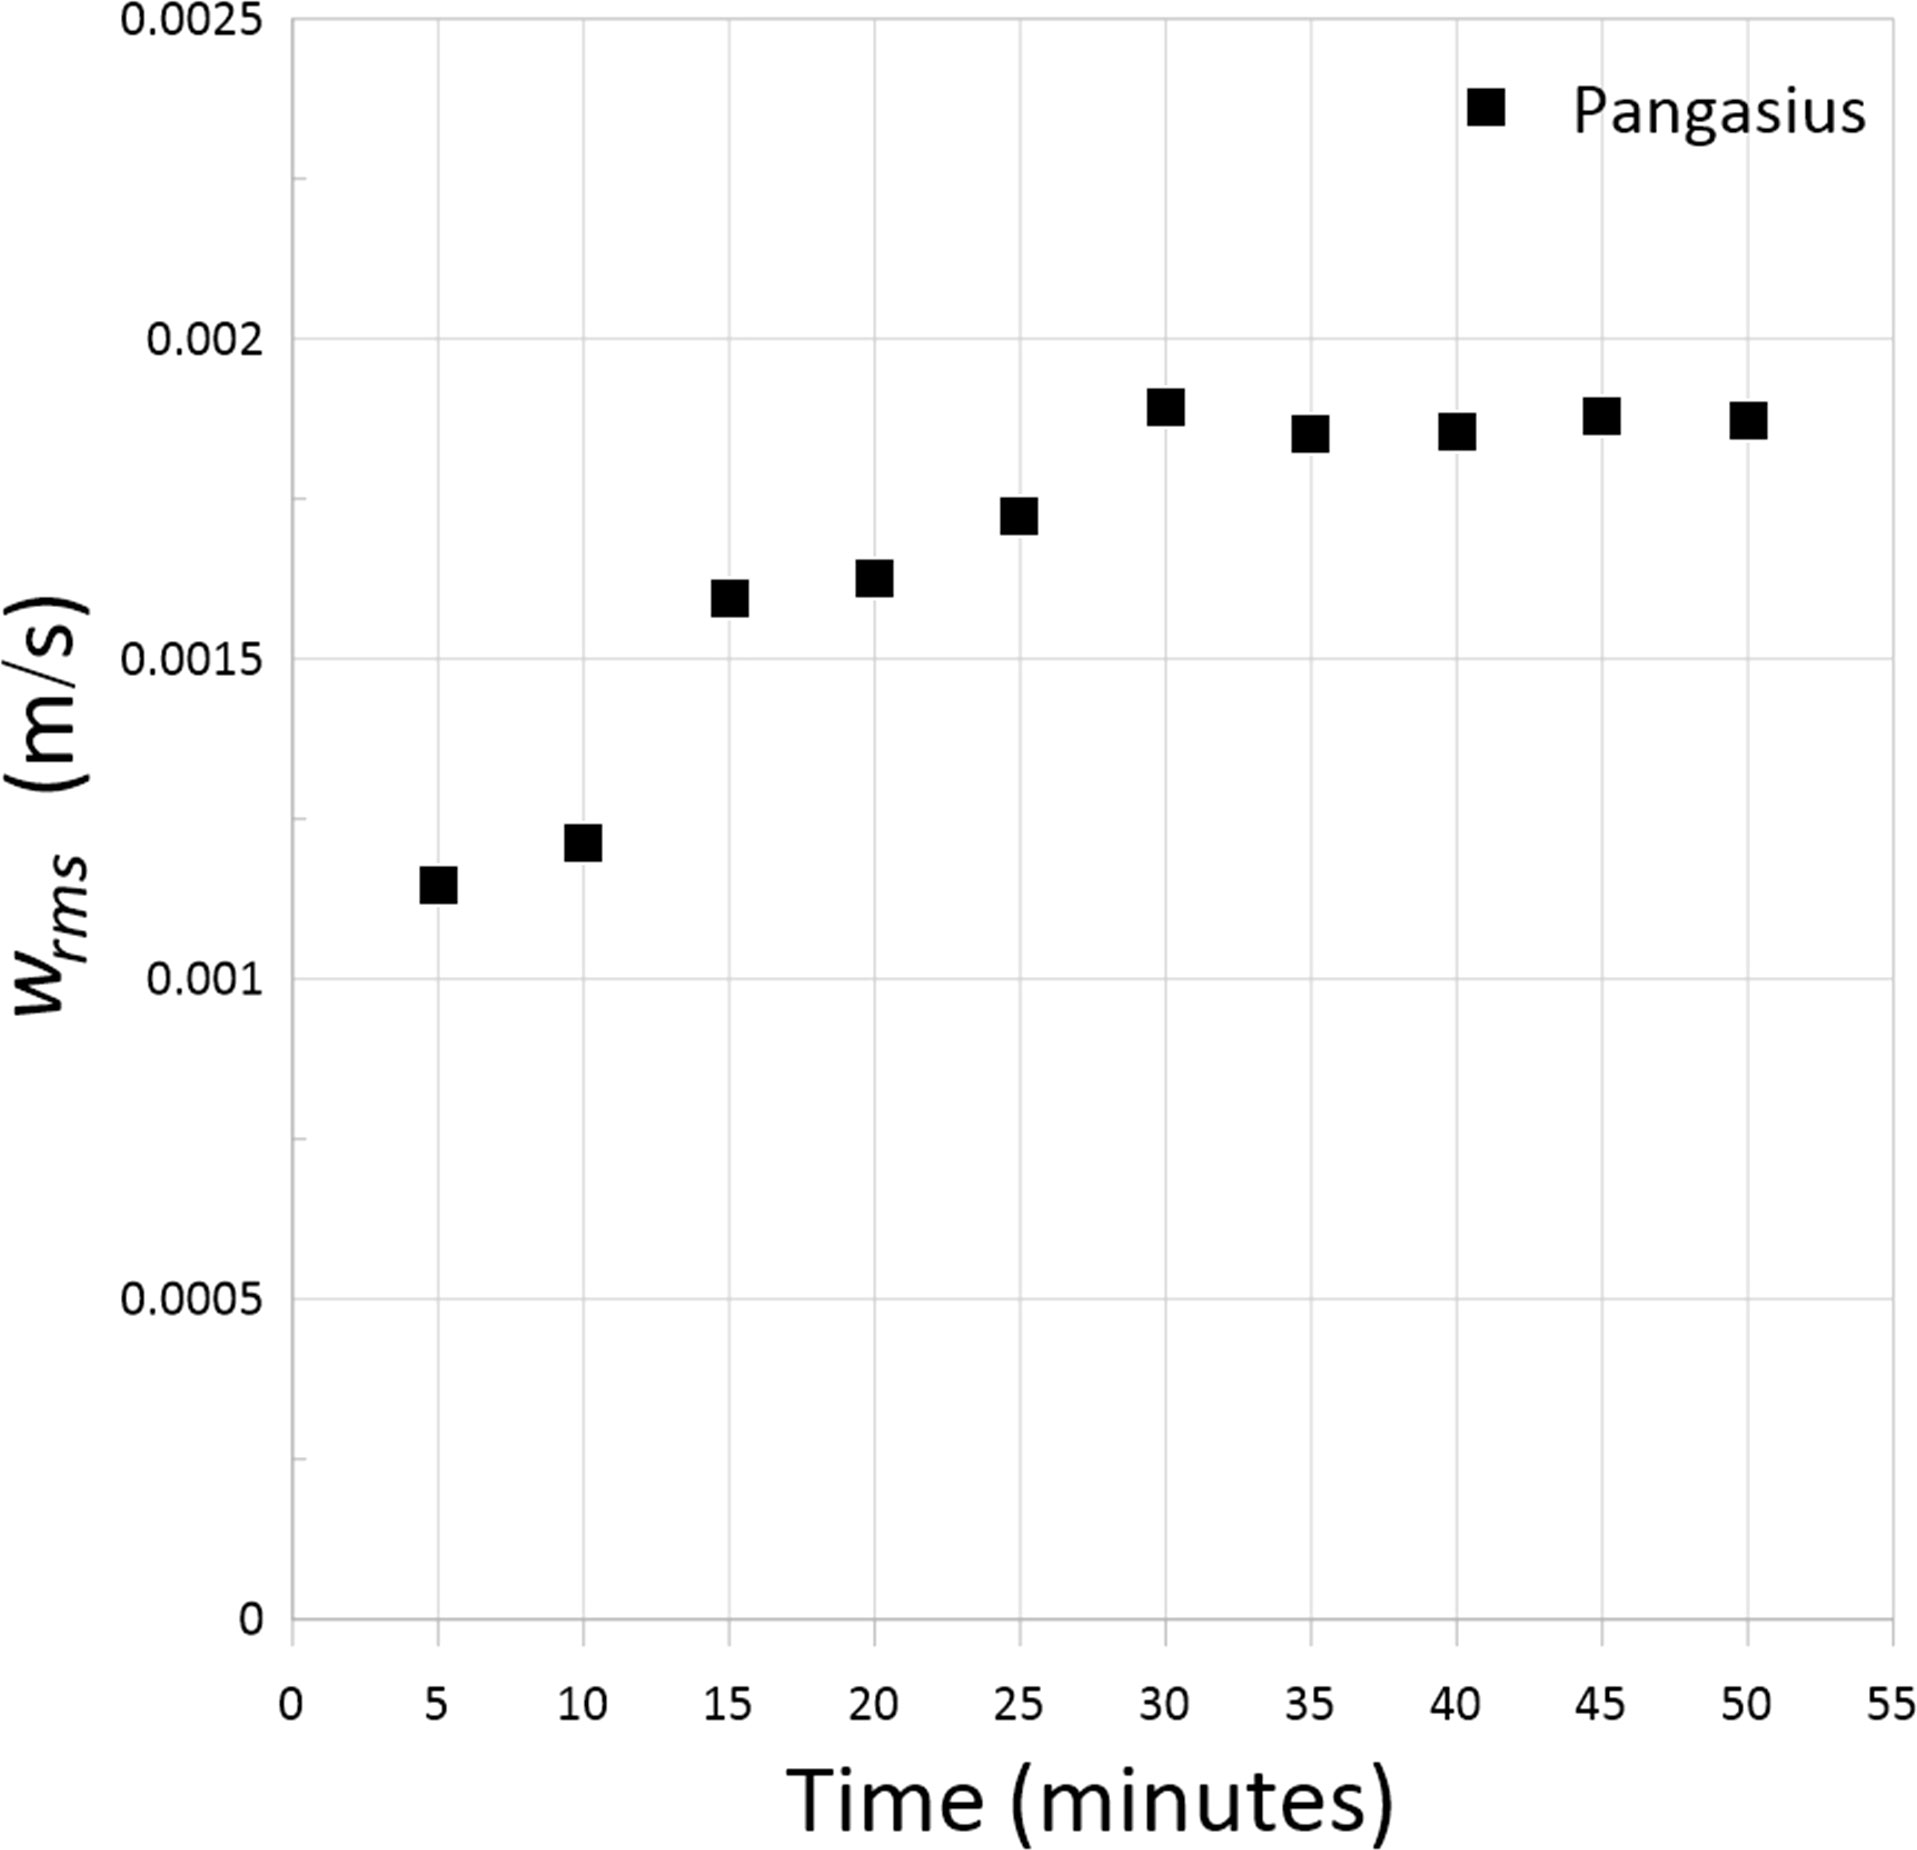
Figure 2 RMS velocity as a function of data record length at the presence of pangasius school at the abundance of 50 animal/m3.
ADVs measure the three-dimensional velocities in the crossbeam and beamwise directions. It has been shown that the RMS velocities measured in the beamwise direction are accurate, while those measured in the crossbeam directions are overestimated because of Doppler noise (Khorsandi et al., 2012; Moeini et al., 2020; Nejatipour and Khorsandi, 2021; Homayounfar and Khorsandi, 2022).
The post-processing of the data was necessary given the occasional presence of a fish within the sampling volume, which resulted in spikes as well as data with a low signal-to-noise ratio (SNR) and correlation. The data was post-processed using the WinADV software (version 2.024), which was developed by the US Bureau of Reclamation, and is based on the phase-space thresholding method (Goring and Nikora, 2002; Wahl, 2003). Furthermore, the data with SNR and correlation lower than 15 and 70% respectively were removed from the time series, according to the ADV manufacturer’s recommendation. Increasing the fish body size and abundance increased the number of discarded data, which varied between 5 and 15%. Out of the three tests repeated for each case, the test with better data quality, i.e., less discarded data, was selected for analysis. Moreover, the noise reduction method proposed by Khorsandi et al. (2012), which is based on measurements using two different probe orientations, was used to improve the statistics measured in the crossbeam directions of the ADV in section 3.1.
Results
In this section, the characteristics of biogenic turbulence are first examined. Subsequently, the effect of fish abundance, light, and temperature on the turbulence generated by schools of koi, pangasius, and goldfish are evaluated.
Characterization of biogenic agitation
To characterize the flow generated by the fish, ADV measurements were conducted in the aquarium in the presence of the selected fish species. Since the characteristics of the turbulence produced by the different fish schools studied herein were similar, only the measurements taken in the presence of pangasius at two abundances of 50 and 150 animals/m3 and at a water temperature of 24°C are presented in this section. The results pertaining to koi and goldfish are summarized in the Supplementary Material.
A summary of statistics measured at the two abundances of pangasius school is presented in Table 1. In this table, u, v and w are the respective velocities in the x, y and z directions. u and w velocities were measured in the beamwise direction using two different ADV orientations, and v velocity was measured along the crossbeam direction of the ADV probe. <Ui> is the mean velocity and ui rmsis the RMS velocity defined as, where ui is the fluctuating velocity. Si=ui3/ui23/2 and Ki=ui4/ui22 are the skewness and kurtosis of the velocity fluctuations, respectively. ϵ is the dissipation rate presenting the conversion of kinetic energy into internal energy (heat) (Pope, 2000), and in isotropic turbulence, is equal to, where υ is the kinematic viscosity of fluid (Tennekes and Lumley, 1972). The dissipation rate may be estimated from the rate of energy supply to the small-scale eddies as , where Cϵ is a constant (0.3), and T is the integral time scale (Taylor, 1935; Tennekes and Lumley, 1972; Camozzi, 2017). The integral time scale is defined by , where ρ is the autocorrelation coefficient and τ is the lag time (Pope, 2000). Reλ (≡ ) and RT (≡ wrmsℓ/υ) are the Taylor-microscale and turbulence Reynolds numbers, respectively (Variano and Cowen, 2008).

Table 1 Comparison of the statistics measured in the x, y and z directions of the aquarium at different pangasius abundances.
It can be seen in Table 1 that the ratios of mean to RMS velocities (<Ui>/ui rms) are much smaller than 1, indicating that the mean velocities are negligible. The ratios of RMS velocity components, i.e., urms/ui rms, vrms/ui rms andwrms/ui rms, are close to 1, which suggest that the turbulence generated by the fish is approximately isotropic for both abundances. The isotropy improves as the abundance increases from 50 to 150 animal/m3. The skewnesses at both abundances are nearly zero, indicating that their probability density functions (PDFs) are almost symmetric. The kurtoses measured in different directions are similar for each abundance and are not far from the value 3 of a Gaussian distribution. Slightly lower values are found for the abundance of 50 animals/m3, and slightly higher values for 150 animals/m3. Therefore, the relatively heavier tails of high-abundance data indicate a larger probability of large fluctuations than in the low-abundance case. Homogeneity, isotropy and a negligible mean velocity are also characteristics of homogeneous isotropic turbulence with zero-mean flow, as generated in the laboratory using random jet arrays (Variano and Cowen, 2008; Khorsandi et al., 2013; Pérez-Alvarado et al., 2016; Sahebjam et al., 2022) and oscillating grids (Hopfinger and Toly, 1976; Fernando and De Silva, 1993). However, the RMS velocities, Taylor-microscale Reynolds number and turbulence Reynolds number of the turbulent flow created by the fish are up to one order of magnitude smaller than those reported for the flows produced by random jet arrays and oscillating grids.
The Eulerian temporal power density spectra of the u, v and w velocities for the two abundances of pangasius are plotted in Figure 3. A constant-slope range can be observed, indicating the development of an energy cascade with an inertial subrange, remarkably with a -5/3 slope. Therefore, the fish generated turbulence with a sufficiently high turbulence Reynolds number. The spectra for the low-abundance flow, i.e., the flow with lower turbulence Reynolds number, extend up to frequency of 3 Hz, where the noise floor starts. On the other hand, the high-abundance flow has a higher turbulence Reynolds number resulting in finer small scales; therefore, its spectra extend to higher frequencies before reaching the noise floor at ~ 10 Hz. Increasing the abundance also results in higher values of the spectra, as expected from their higher RMS velocities. (The area under the spectrum is equal to the velocity variance, which is equivalent to the square of the RMS velocity.) Furthermore, the velocity spectra measured in the three directions are similar for each abundance, confirming that the flow is approximately isotropic. Note that u and w spectra were measured along the beamwise direction using two different probe orientations, and v spectra were measured along the crossbeam direction of the probe. The v spectra have higher noise floors, because the effect of noise is more substantial in the crossbeam direction.
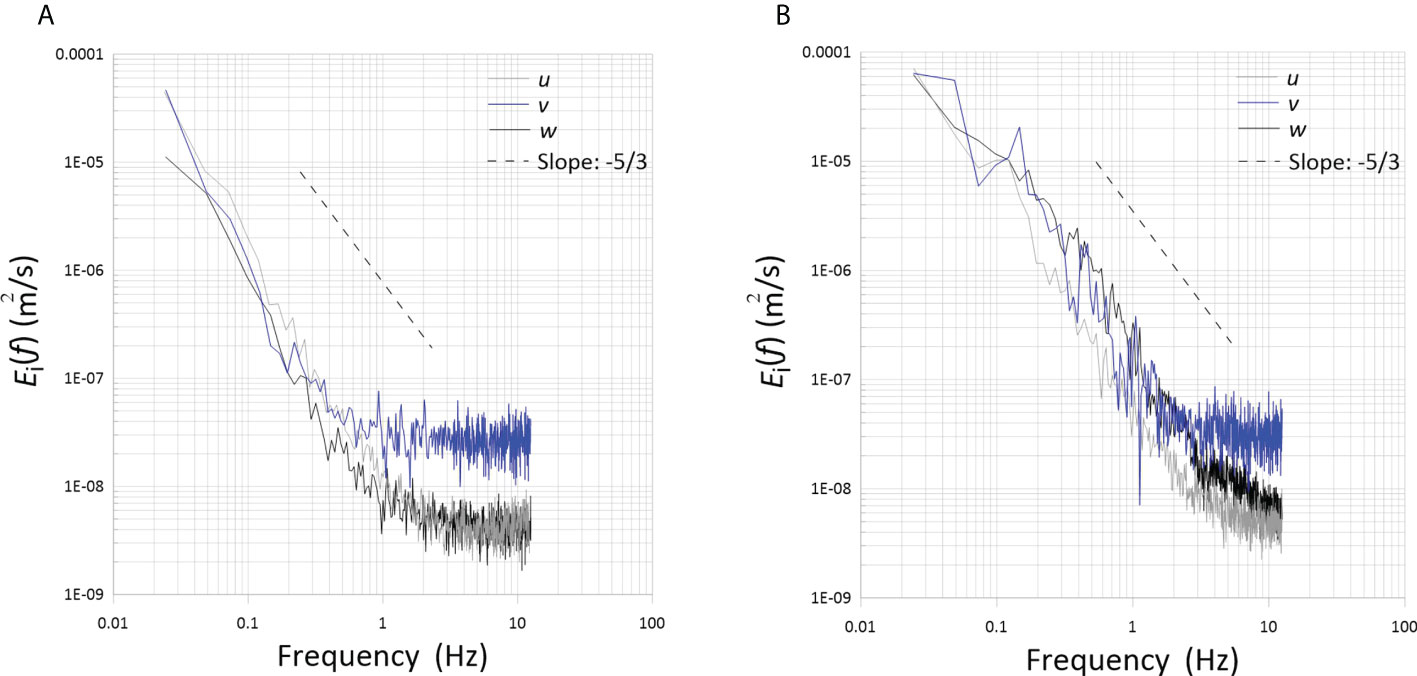
Figure 3 Power spectra of the fluctuating velocities measured with pangasius at two abundances of (A) 50 and (B) 150 animal/m3.
To quantify the temporal resolution of the measurements, the square root of the areas under the spectra as a function of frequency [(], normalized by the corresponding RMS velocities inferred from the statistical moments of the acquired data, are shown in Figure 4. Given that the integral under the spectrum is equal to the velocity variance (or, alternately, ], the figure can be used to infer the effects of the temporal resolution of the measurements on the large-scale quantities (i.e. ui rms) presented herein. One observes that the square roots of the normalized integrated spectra tend to 1 as the frequency increases. Thus, we can conclude that the 25-Hz sampling frequency was sufficiently high to resolve RMS velocities.
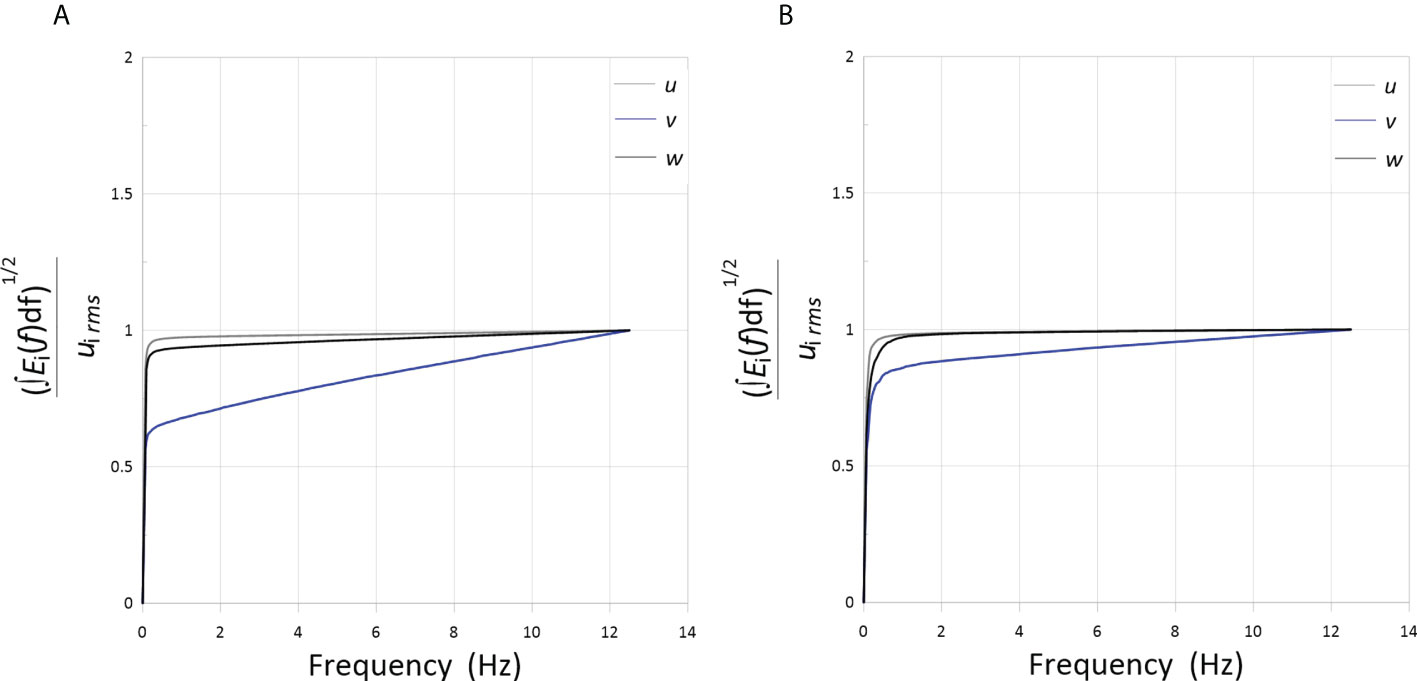
Figure 4 normalized by the RMS velocity plotted for u, v, and w, as a function of frequency measured for pangasius school at the abundance of (A) 50 and (B) 150 animal/m3.
Figure 5 depicts the PDFs of the fluctuating components of u, v and w velocities for the two abundances of pangasius. The PDFs have an approximately Gaussian distribution, as expected from their skewness and kurtosis presented in Table 1. This, once again, indicates that the flow generated by the fish school has the characteristics of homogeneous and isotropic turbulence (Pope, 2000; Alméras et al., 2017; Camozzi, 2017).
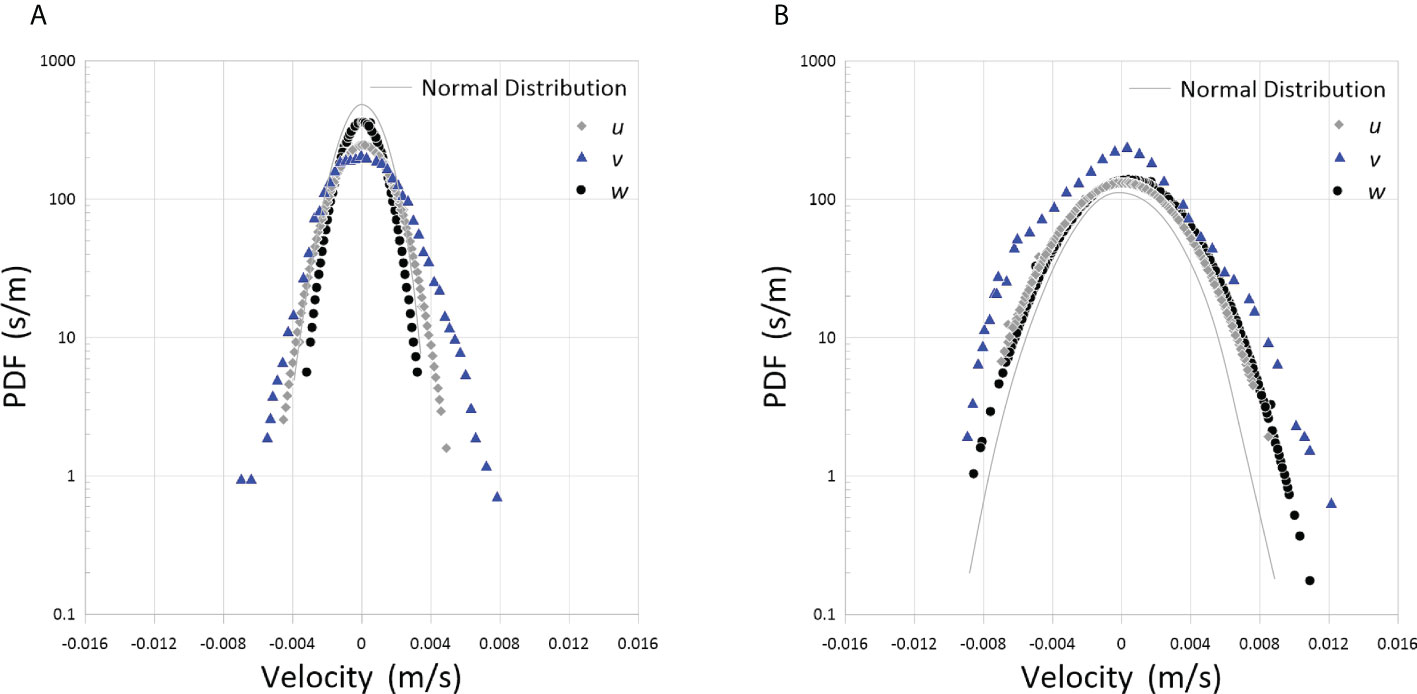
Figure 5 PDFs of the fluctuating velocities measured with pangasius at two abundances of (A) 50 and (B) 150 animal/m3.
The homogeneity and isotropy of the turbulence created by Congo tetra ranging in length from 5-8 cm has also been previously confirmed by Camozzi (2017). Given the approximate isotropy of the turbulence, the turbulence statistics presented in the next sections were calculated from the velocity measured using the beamwise direction of the ADV probe aligned with the z direction of the aquarium.
Effect of abundance on biogenic turbulence
The effect of abundance on the biogenic turbulence created by the schools of koi, pangasius, and goldfish with different abundances of 50 to 300 fish per cubic meter of water are investigated in this section. During the experiments, it was observed that at low abundances, due to sufficient space, the fish schooled throughout the aquarium and mostly swam horizontally and uniformly. On the other hand, as the abundance increased, the swimming space for the fish decreased, forcing the fish to move in the vertical direction. At overly high abundances, i.e., smaller water volumes, the fish did not swim uniformly and constantly changed direction. Eventually, the excessive increase in abundance caused a significant reduction in space, and as a result, the fish were no longer able to freely swim and became almost still.
The RMS velocities of the flow created by the three different fish species are plotted as a function of fish abundance in Figure 6. The RMS velocities increase linearly with increasing the abundance up to a certain point, referred to herein as the “saturation point,” beyond which the fish movement is restricted, and the RMS velocities decrease. In fact, increasing the fish abundance—insofar as it changes the swimming direction of fish from horizontal to vertical—causes more active eddies and increases the turbulence level. However, a slowdown in fish swimming speed due to an excessive increase in abundance and a significant reduction in fish spacing decreases the RMS velocities. The rate of increase in RMS velocities with abundance (i.e., the slope of the lines in the linear range before the saturation point) increases with the fish body size. The slope increases in this order: koi (ℓ = 6 cm)< pangasius (ℓ = 8 cm)< goldfish (ℓ = 12 cm). It is worth noting that, in addition to the fish body size, the gait of the fish may also influence the turbulence level. Furthermore, the turbulent kinetic energy, defined as TKE = in isotropic turbulence, varies with the square of fish abundance up to the saturation point, as expected (not shown).
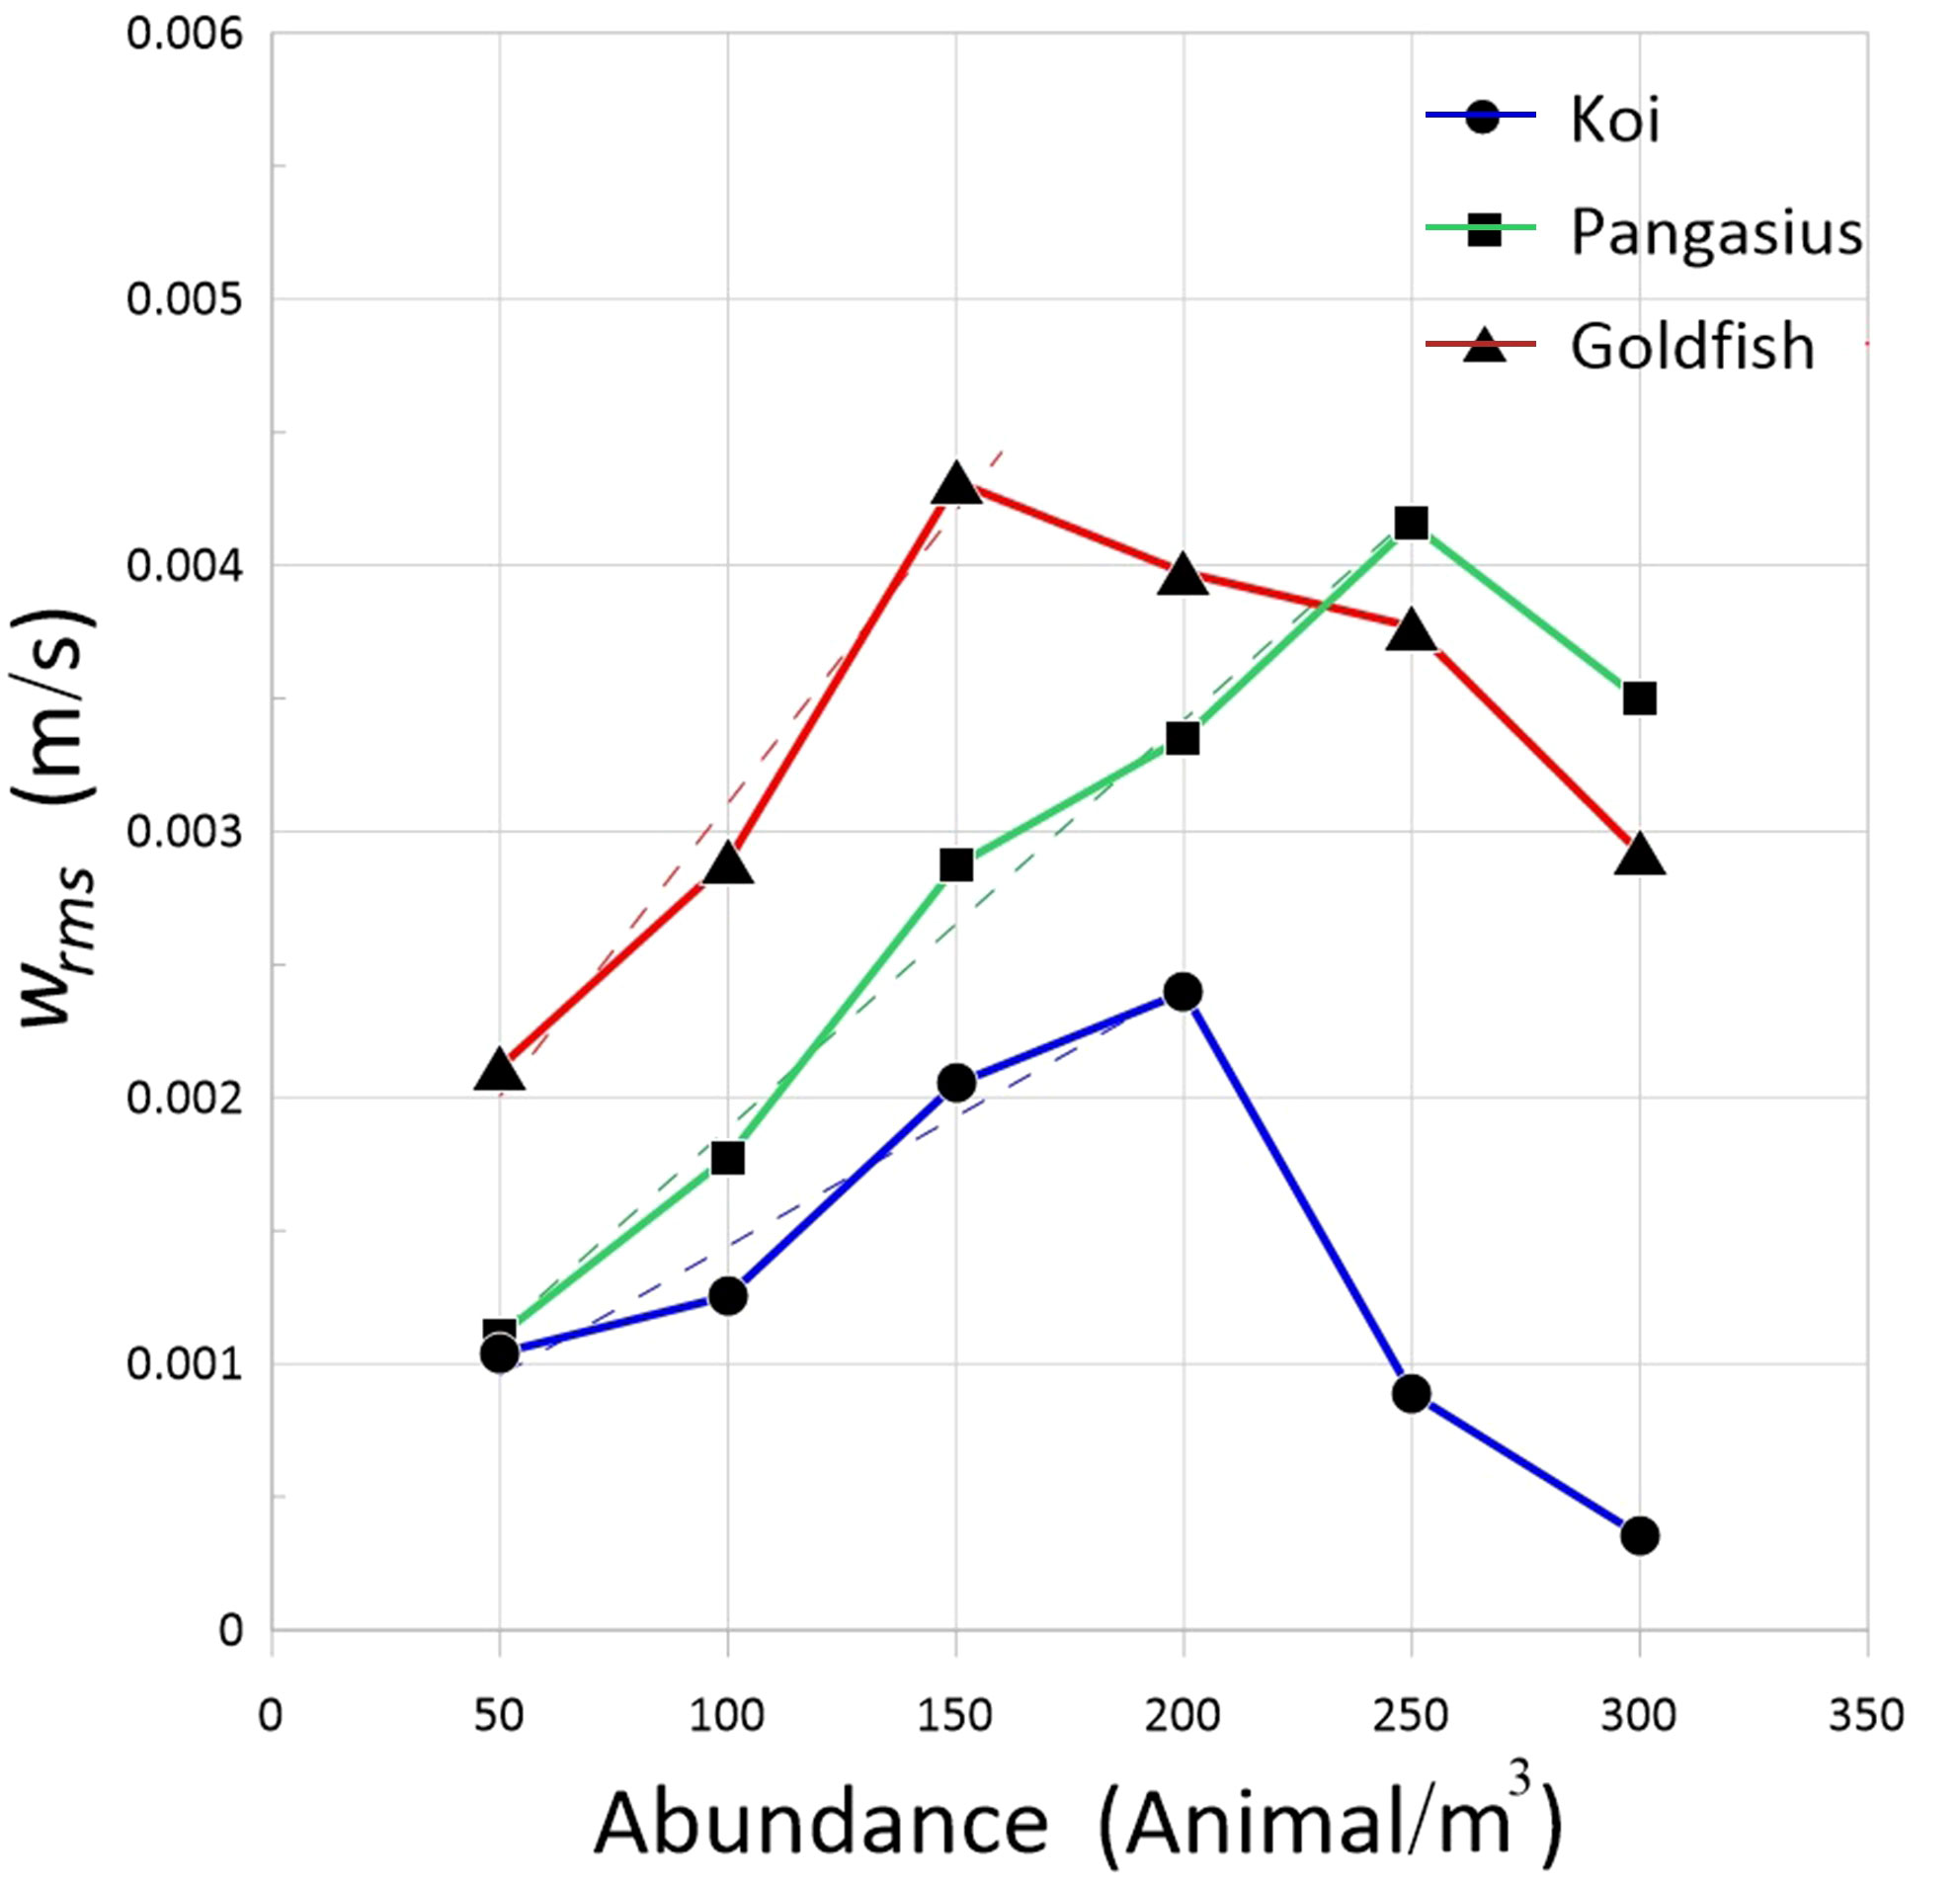
Figure 6 RMS velocities of the flow generated by the schools of koi, pangasius, and goldfish as a function of abundance. The broken lines are least-squares linear regressions fitted to the data.
Table 2 presents the flow’s integral time scales for various fish abundances. The integral time scale increases with increasing the fish abundance up to the saturation point, indicating that the time interval over which the fluctuating velocity is correlated with itself increases. Furthermore, the increase of the integral time scale with abundance is approximately linear, and the rate of the increase is higher for the flows created by koi and pangasius than that generated by goldfish. Beyond the saturation point, the integral time scale decreases, similar to what was observed for the RMS velocities.
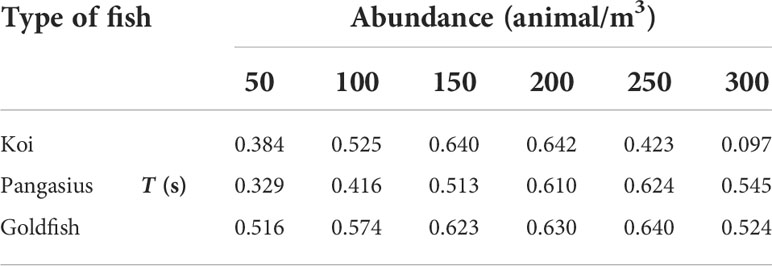
Table 2 Integral time scale of the flow generated by the selected fish schools at various abundances and at a water temperature of 24°C.
Figure 7 plots the dissipation rate versus the abundance for selected fish species. There is an approximately linear increase in the dissipation rate with the abundance for different fish schools up to the saturation point, after which the dissipation rate decreases. The initial linear trend of dissipation rate is not surprising, given that both the RMS velocities and integral time scale increase linearly with the abundance in this range. Moreover, in the linear range, the rate of increase of dissipation rate increases with increasing the body size of the fish.
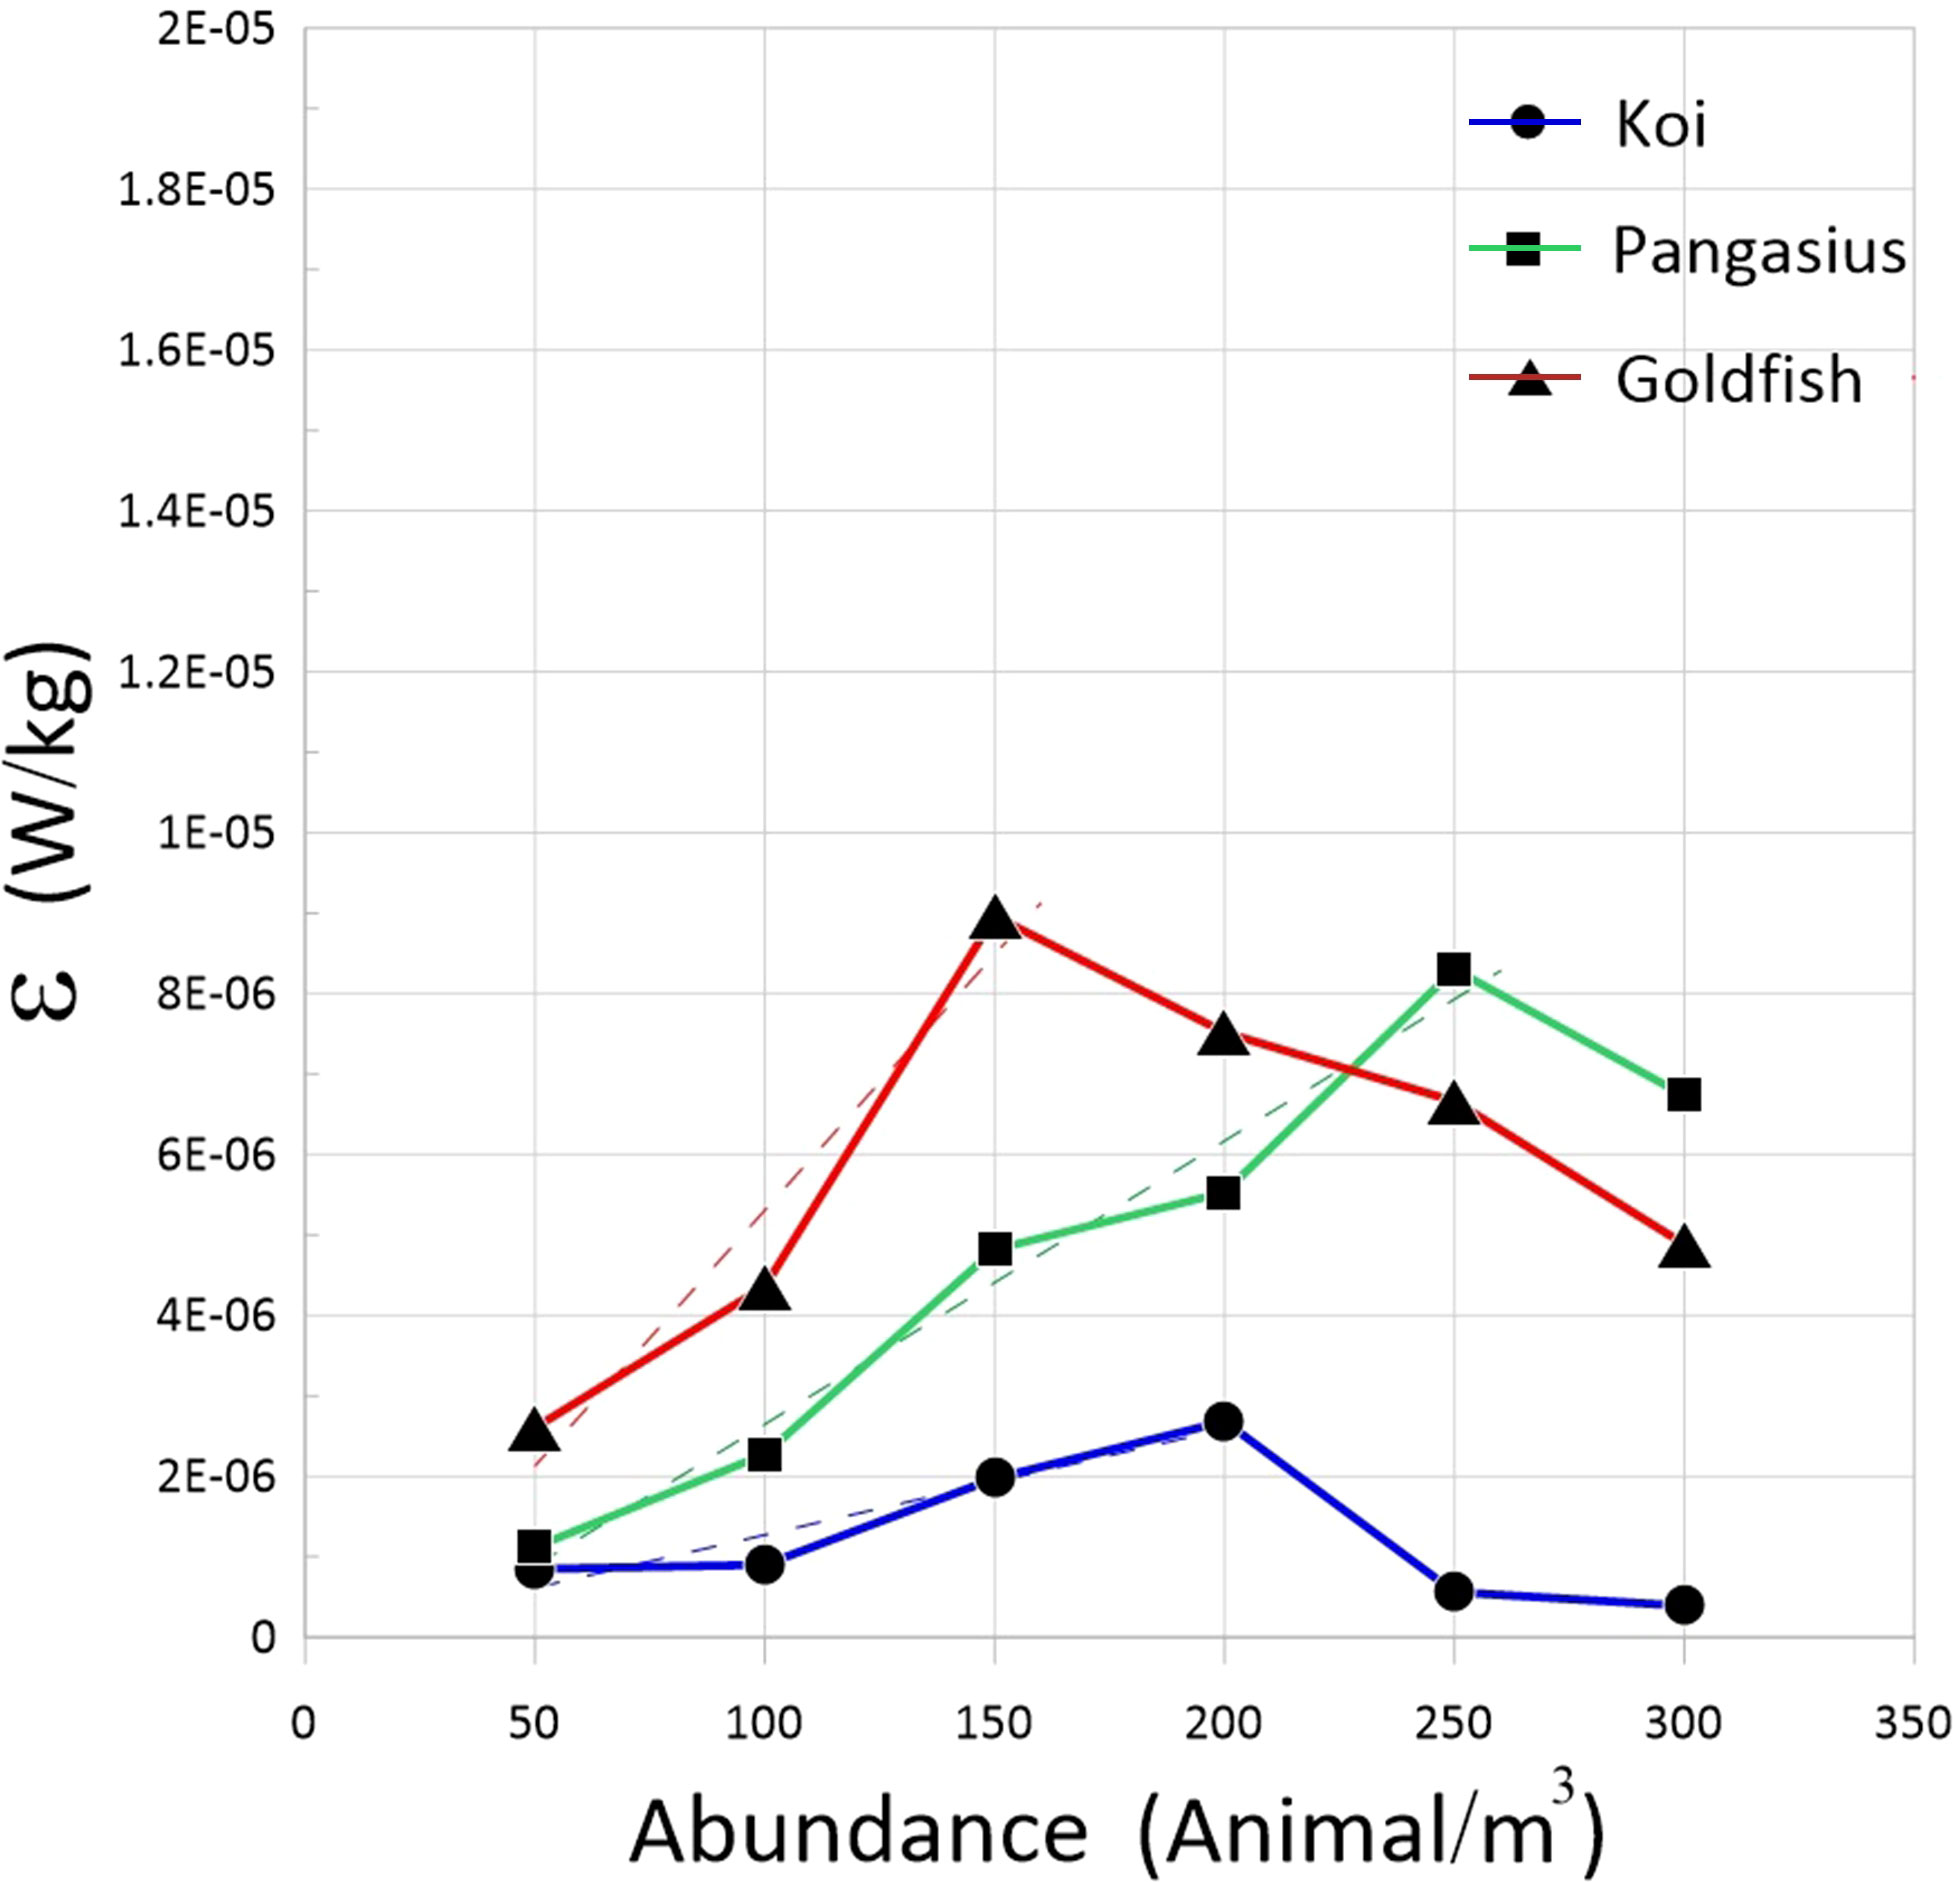
Figure 7 Dissipation rates of the flow generated by the schools of koi, pangasius, and goldfish as a function of abundance. The broken lines are least-squares linear regressions fitted to the data.
The linear increase of RMS velocities and dissipation rate with increasing abundance observed in the present study is in contrast with the results of Camozzi (2017), who did not find a relationship with the aforementioned parameters and abundance. The reason for this might be due to the smaller body size of fish in his experiments. Moreover, the dissipation rates measured in the present work increase with body size as opposed to the theoretical predictions of Huntley and Zhou (2004), which found the dissipation rate to be O(10-5) and independent of the body size. The dissipation rates associated with the fish in our study, even at the high abundances, are lower than those estimated by Huntley and Zhou (2004).
Effect of light on biogenic turbulence
The biogenic turbulence caused by koi, pangasius, and goldfish schools was measured at three different levels of ambient light: artificial light, natural daylight, and absolute darkness. The experiments were carried out at the abundance of 50 fish per cubic meter of water and water temperature of 24°C. The fish activity and behavior are expected to change in the light and dark (e.g., see Blaxter and Batty 2009).
Figure 8 depicts the RMS velocities measured in the presence of the three fish schools exposed to artificial light, natural daylight, and absolute darkness. Overall, as the aquarium was darkened, the RMS velocities and consequently the level of turbulence generated by the fish, especially koi and pangasius, increased. This presumably indicates that the fish became more active with decreasing the light level, and their swimming speed increased, hence increasing the turbulence level. Goldfish showed less sensitivity to light. Furthermore, the larger the fish, the higher the RMS velocities regardless of the light conditions.
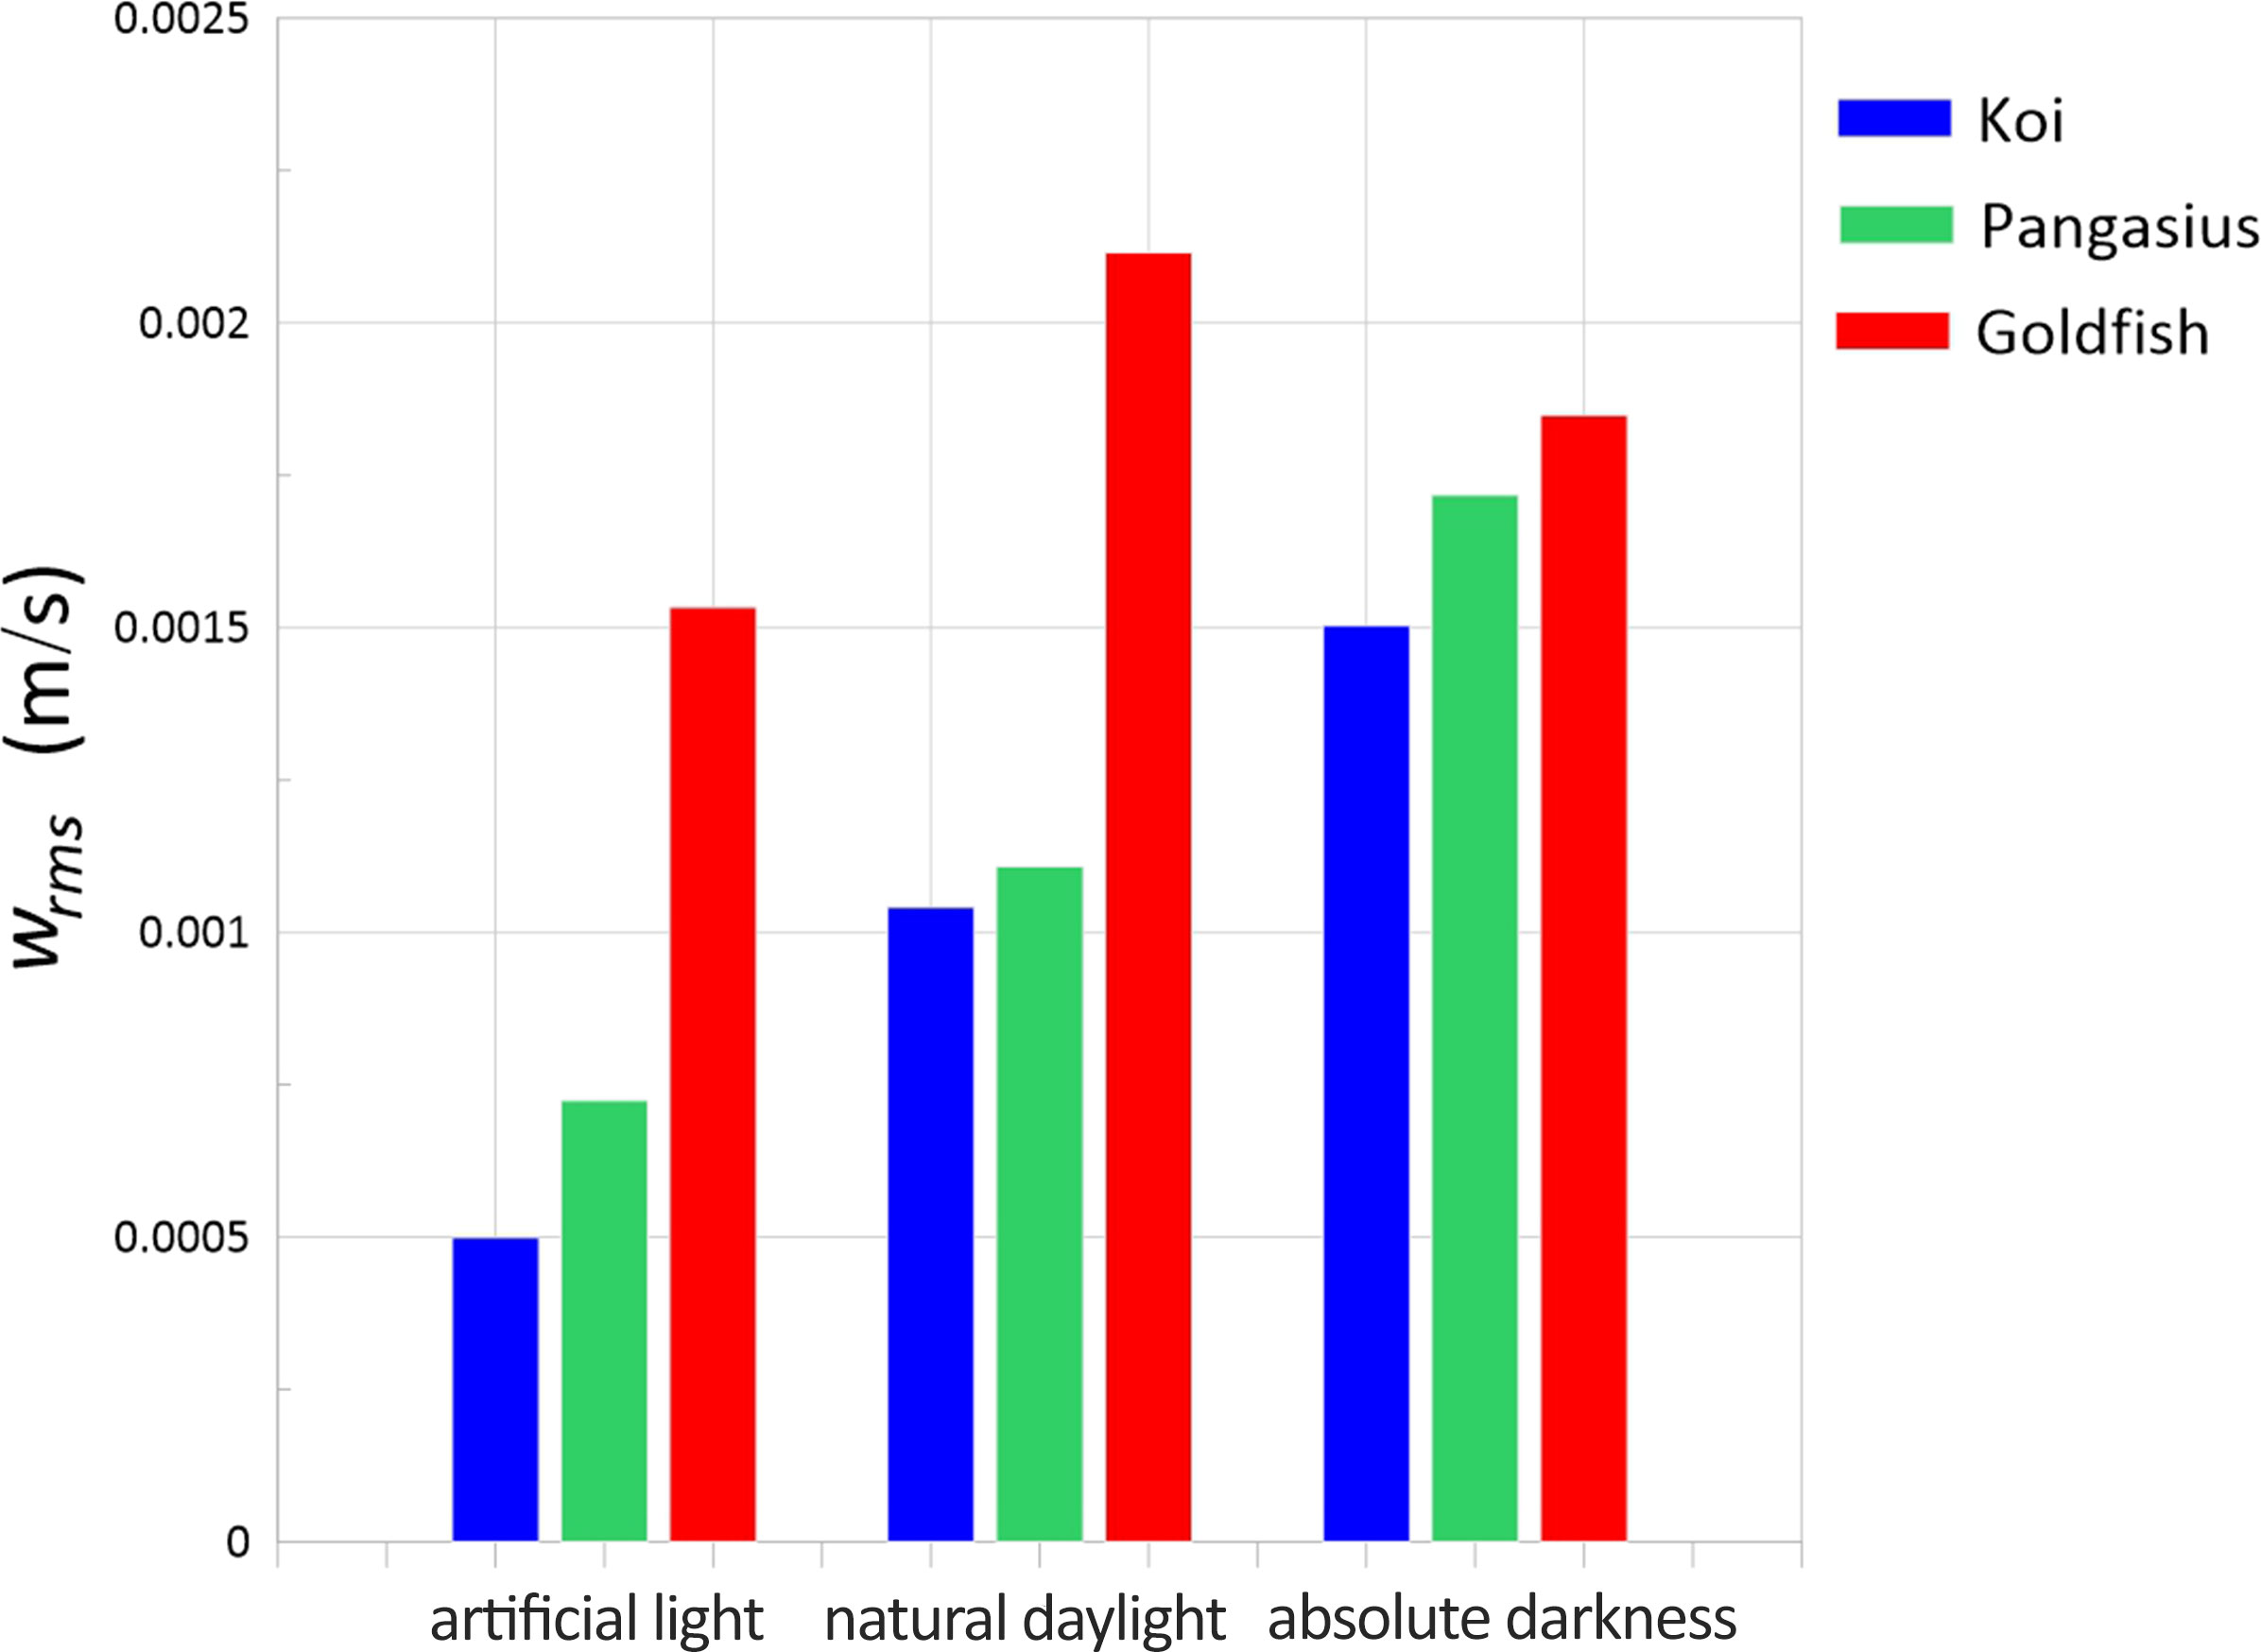
Figure 8 RMS velocities of the flow generated by the schools of koi, pangasius, and goldfish as a function of the light level.
The integral time scales of the flow generated by the fish schools at three different ambient light levels are presented in Table 3. The integral time scale of the flow generally increased as the aquarium darkened, possibly due to increased fish activity.
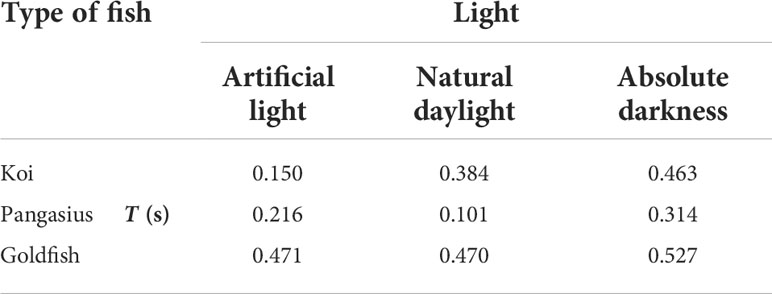
Table 3 Integral time scale of the flow created by the fish schools exposed to artificial light, natural daylight, and absolute darkness at an abundance of 50 animal/m3 and at a water temperature of 24°C.
The dissipation rates measured for different schools exposed to artificial light, natural daylight, and absolute darkness are plotted in Figure 9. Similarly, the dissipation rates increased for koi and pangasius with decreasing the light level. The increase was more significant (one order of magnitude) for pangasius, indicating that the biogenic turbulence may vary noticeably with the level of light, which is a function of parameters such as time of day, season, and geographic location, at least for some aquatic animals. The dissipation rate associated with the goldfish was highest when the aquarium was exposed to natural daylight.
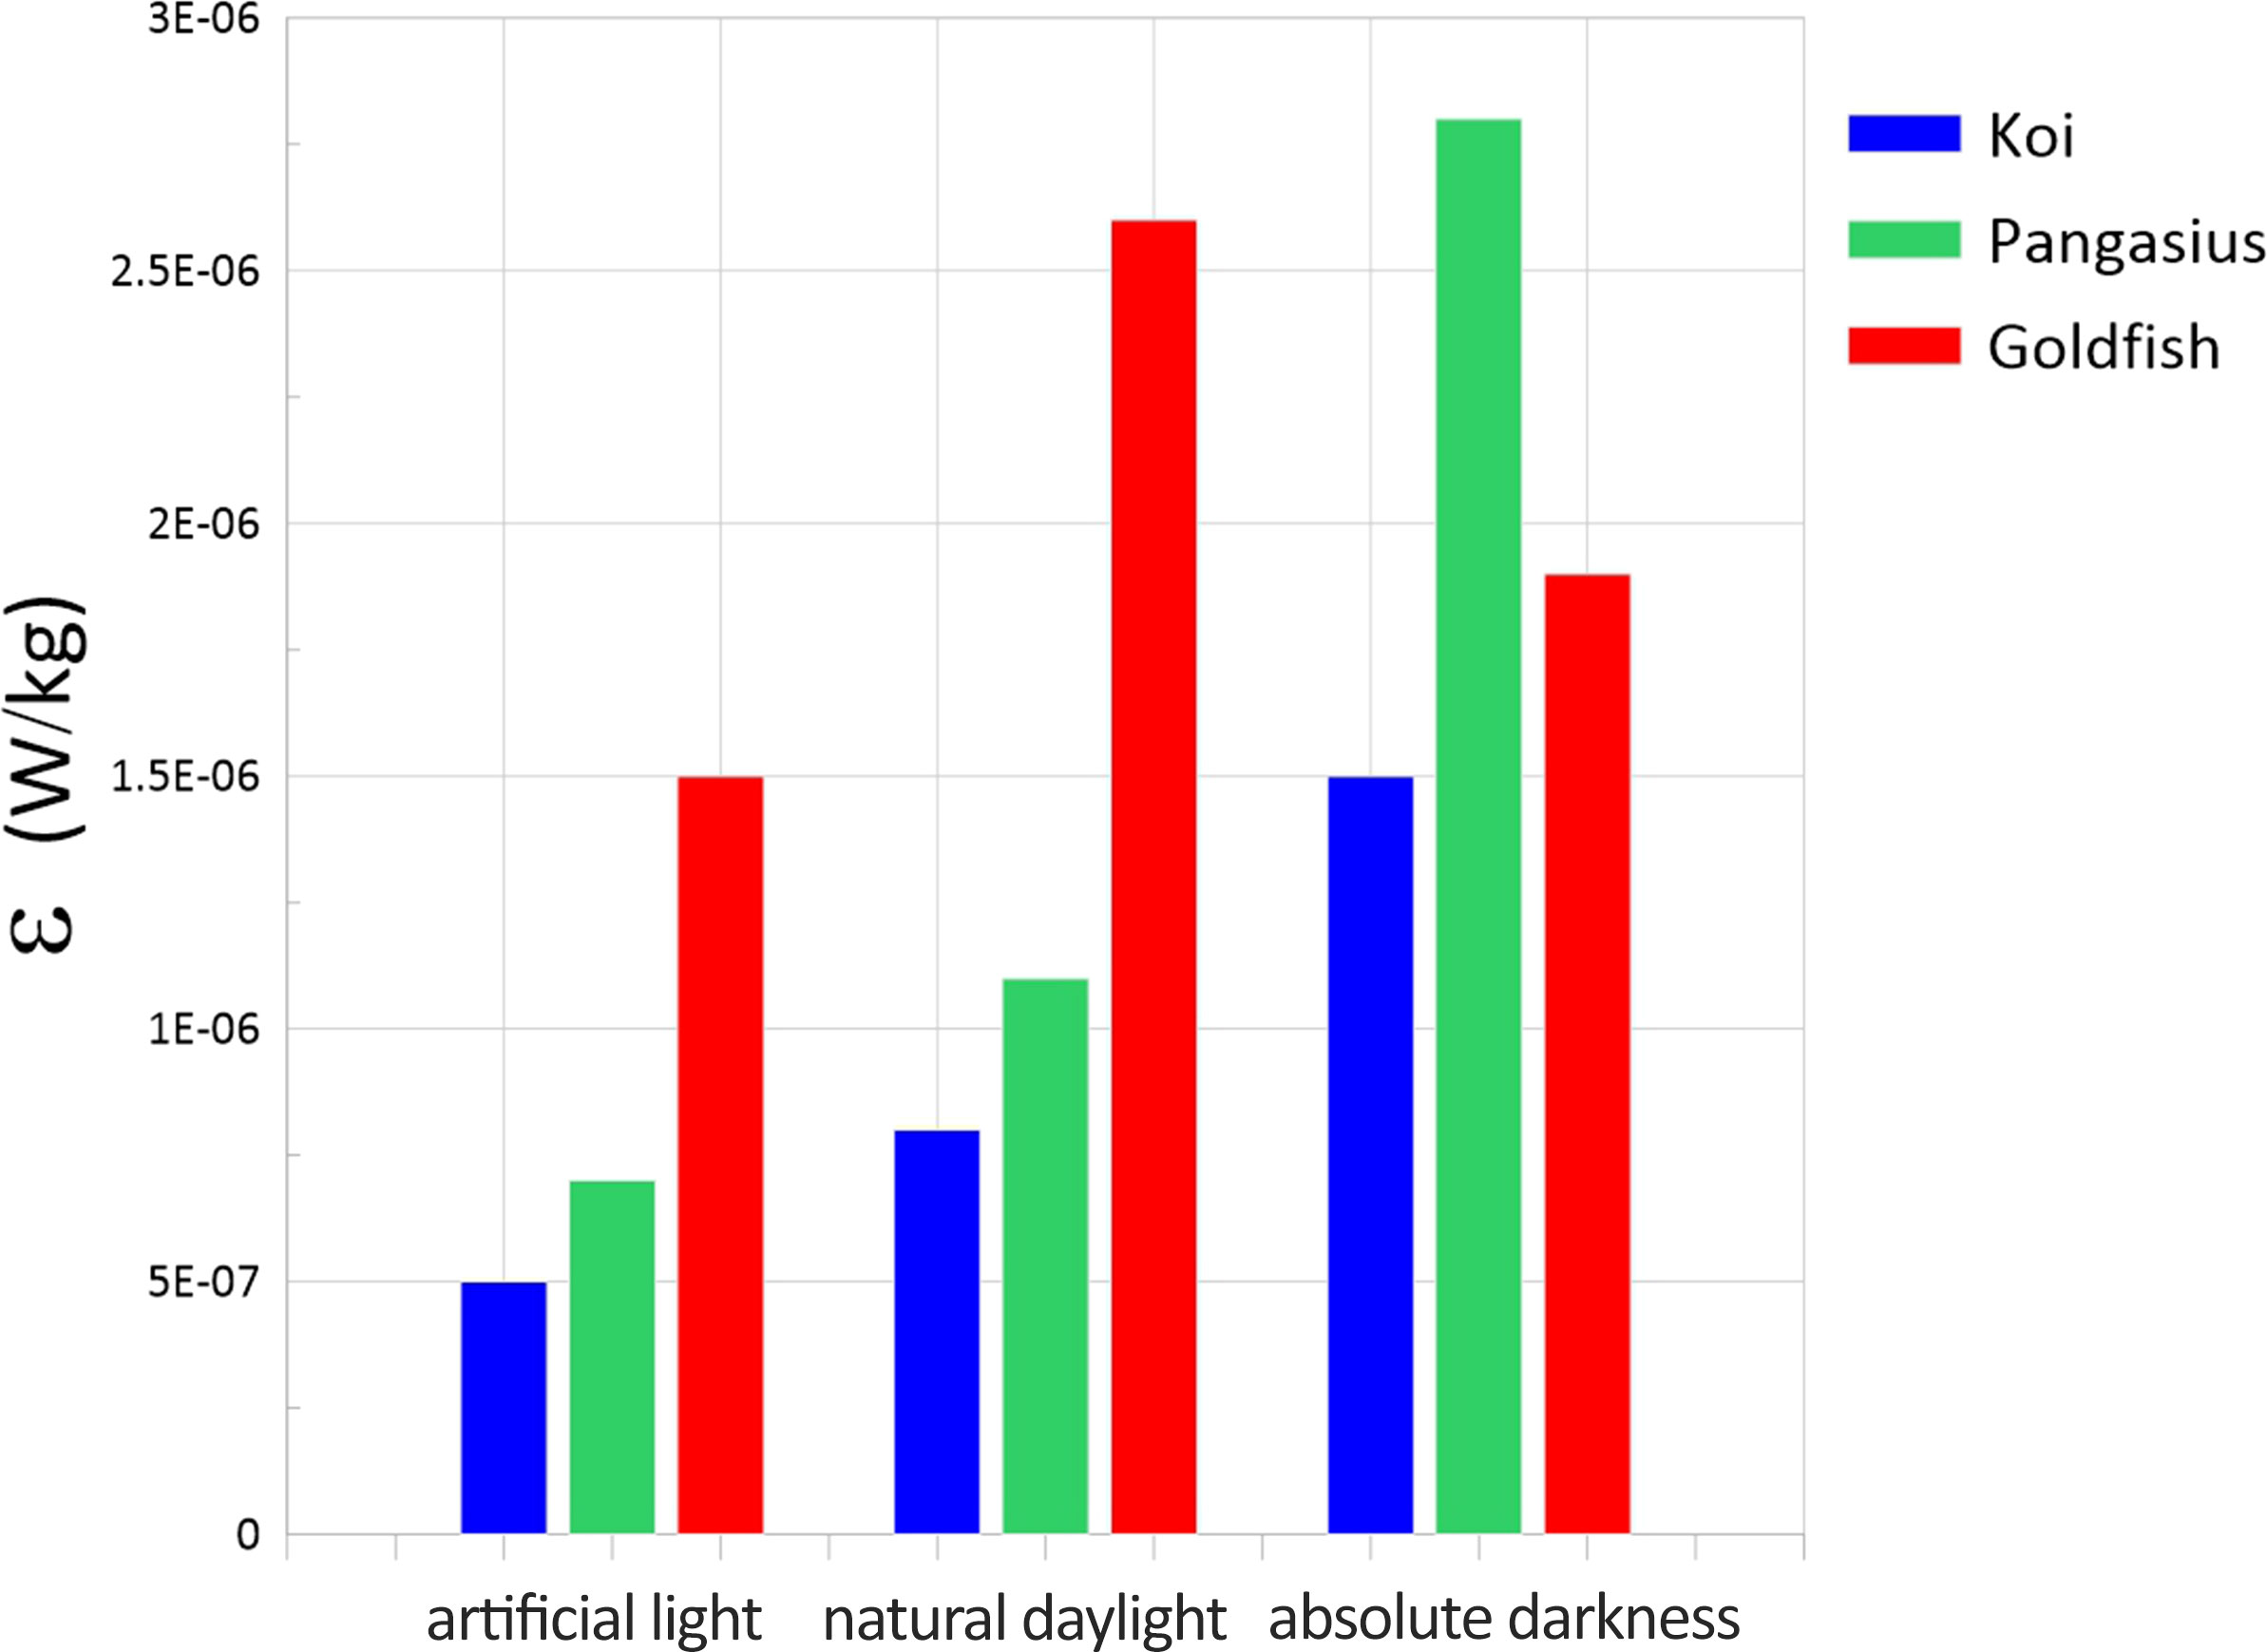
Figure 9 Dissipation rates of the flow generated by the schools of koi, pangasius, and goldfish as a function of the light level.
Effect of temperature on biogenic turbulence
The effect of water temperature on the biogenic turbulence caused by the three fish schools, at the abundance of 50 fish per cubic meter of water and with the aquarium exposed to natural daylight, were examined. The water temperature was brought to selected values in the range 22-28°C. During the experiments, an increase in fish activity with increasing water temperature was observed.
Figure 10 shows the variation of RMS velocities for the different schools with water temperature. As expected from the increased fish activity, the RMS velocities increased with increasing water temperature. The RMS velocities increased at different rates for each fish school, likely because of different reactions to temperature changes.
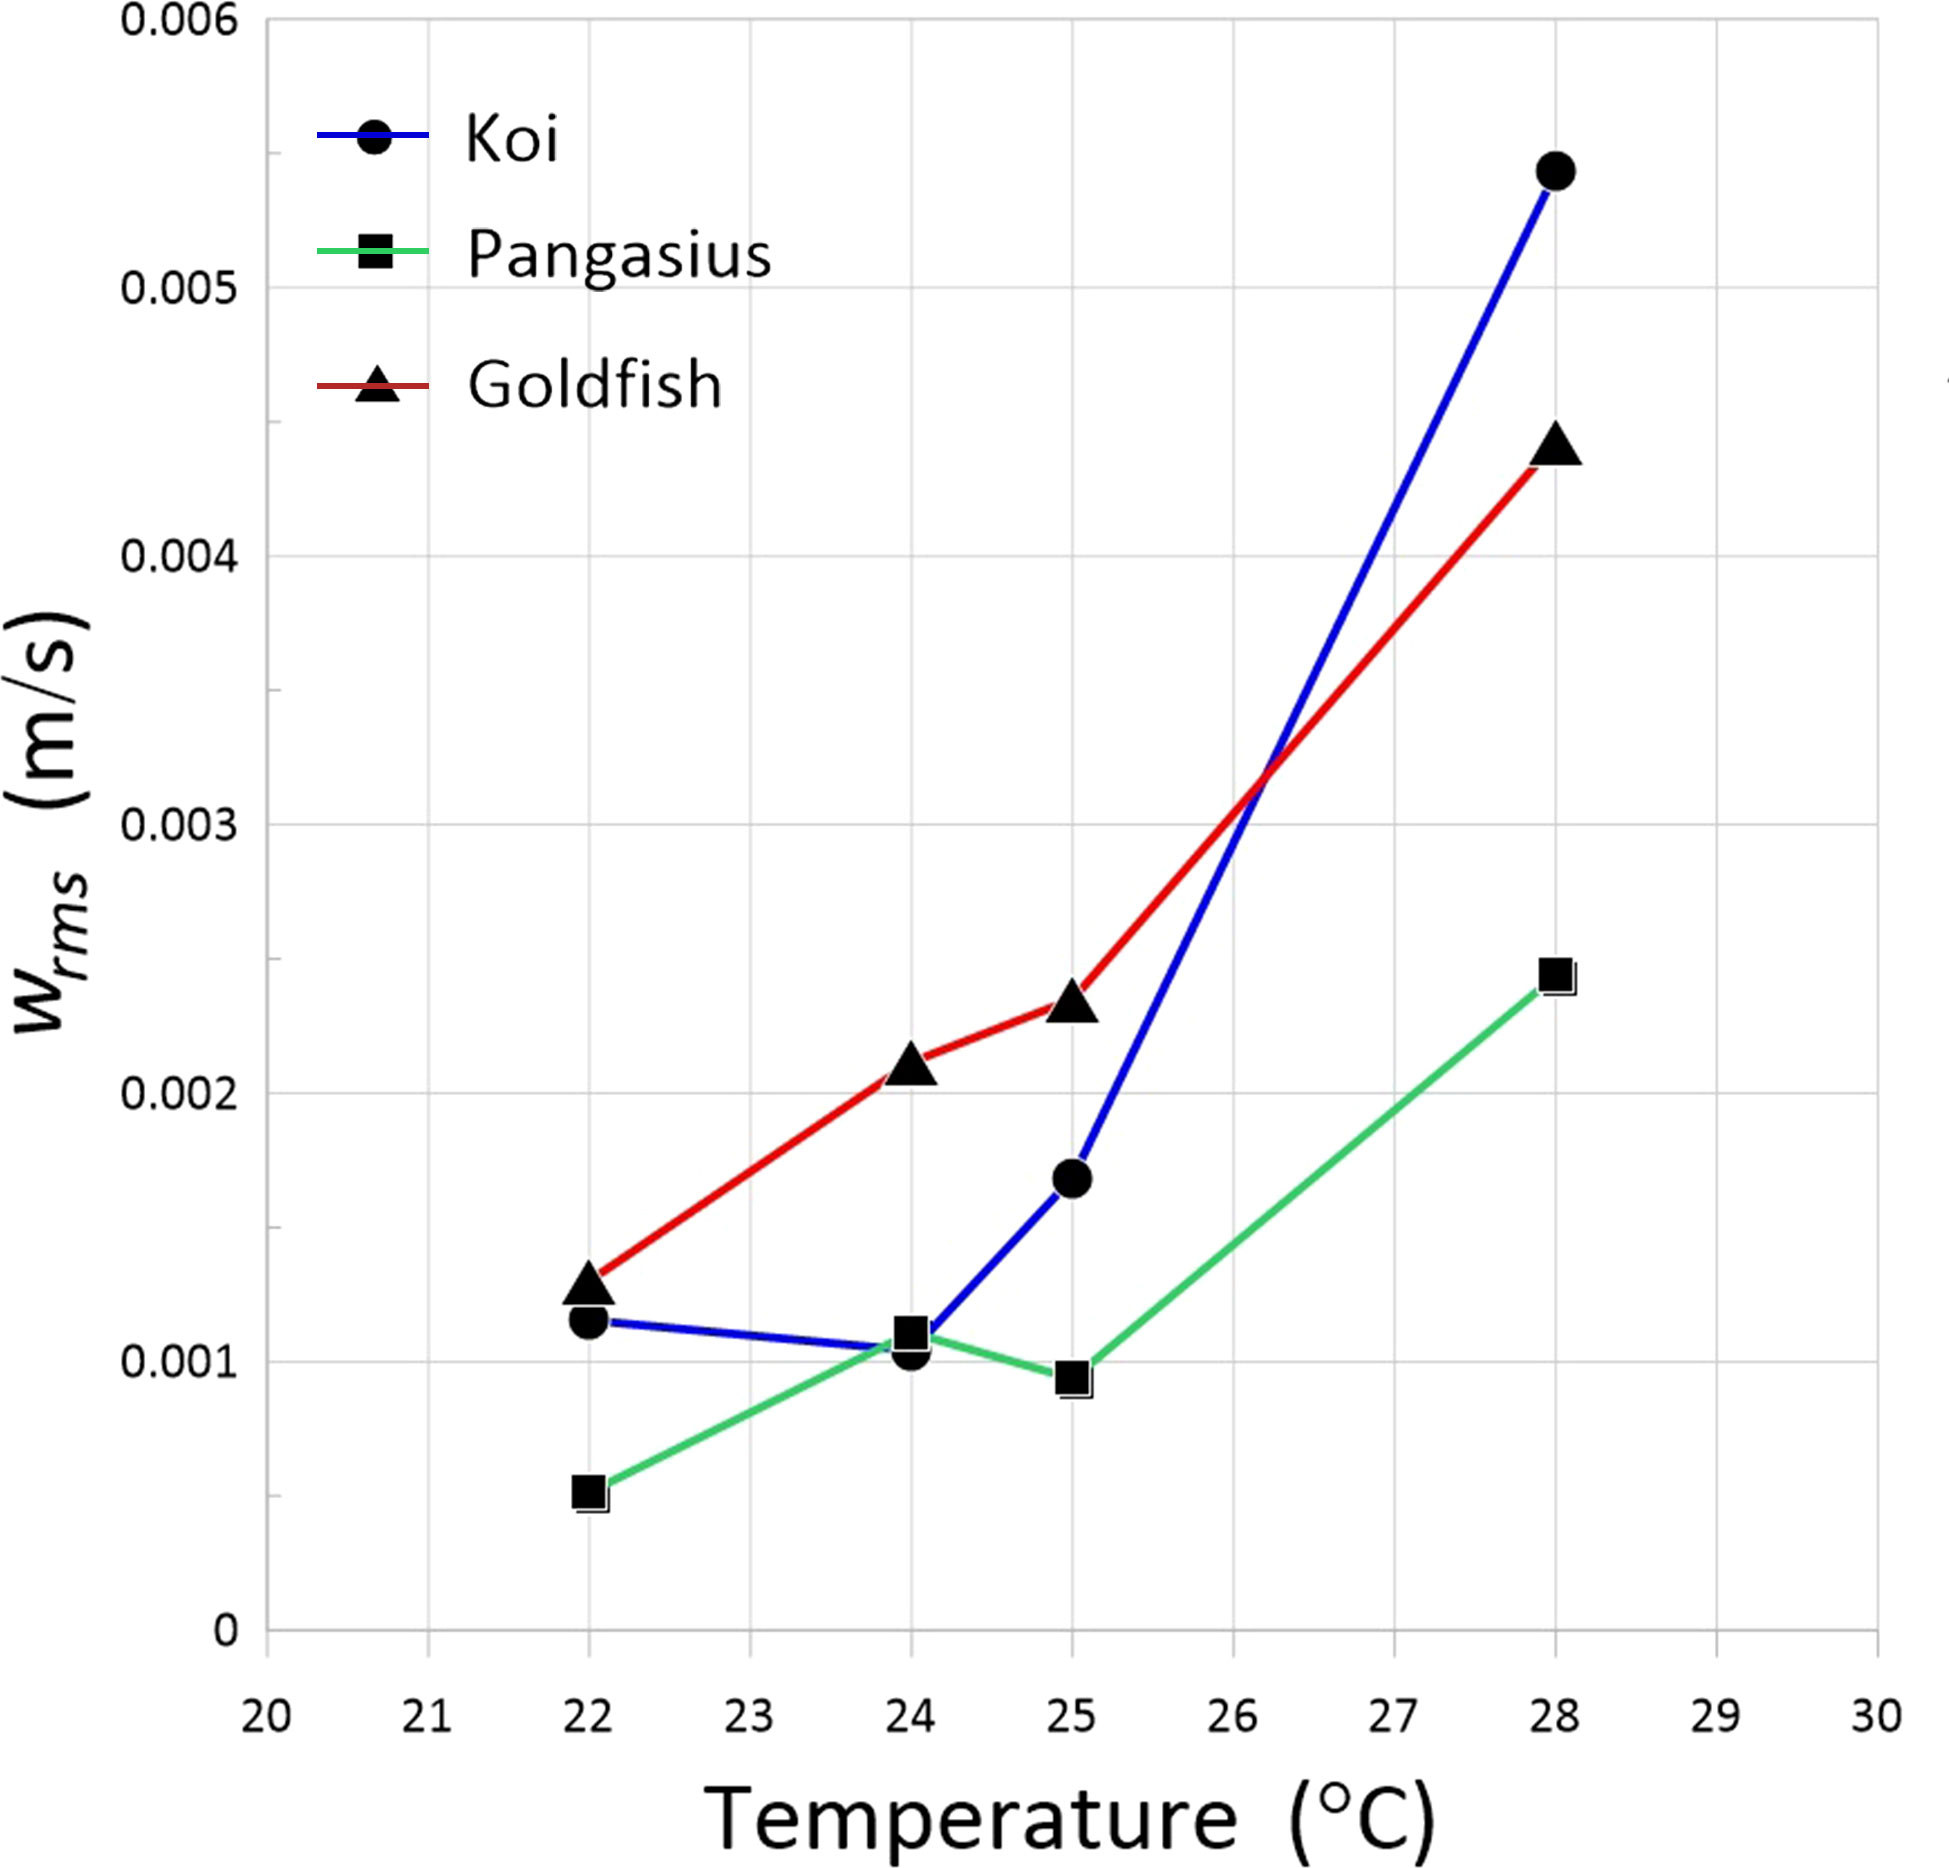
Figure 10 RMS velocities of the flow generated by the schools of koi, pangasius, and goldfish as a function of water temperature.
Table 4 presents the integral time scales of the flows associated with the fish schools for the selected water temperatures. Overall, increasing the water temperature resulted in an increase in the integral time scales. The highest rate of increase in the integral time scale with temperature was observed for pangasius.
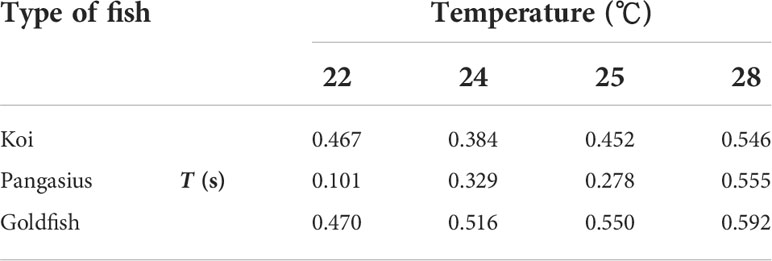
Table 4 Integral time scale of the flow created by the fish schools at the selected water temperatures and at an abundance of 50 animal/m3.
The dissipation rate as a function of water temperature is plotted in Figure 11. The dissipation rates for the three fish schools increased with increasing water temperature. Once again, the rate of increase varied for the three fish, probably due to their different behavior at different temperatures. There was one order of magnitude increase in the dissipation rate associated with the flow generated by koi and goldfish schools when the temperature increased from 22 to 28°C. The motion of pangasius fish increased the dissipation rate of the flow less than the other fish. Therefore, the variation of dissipation rate with water temperature indicates that the change of water temperature at different seasons and geographic locations may probably have a significant effect on the biogenic turbulence.
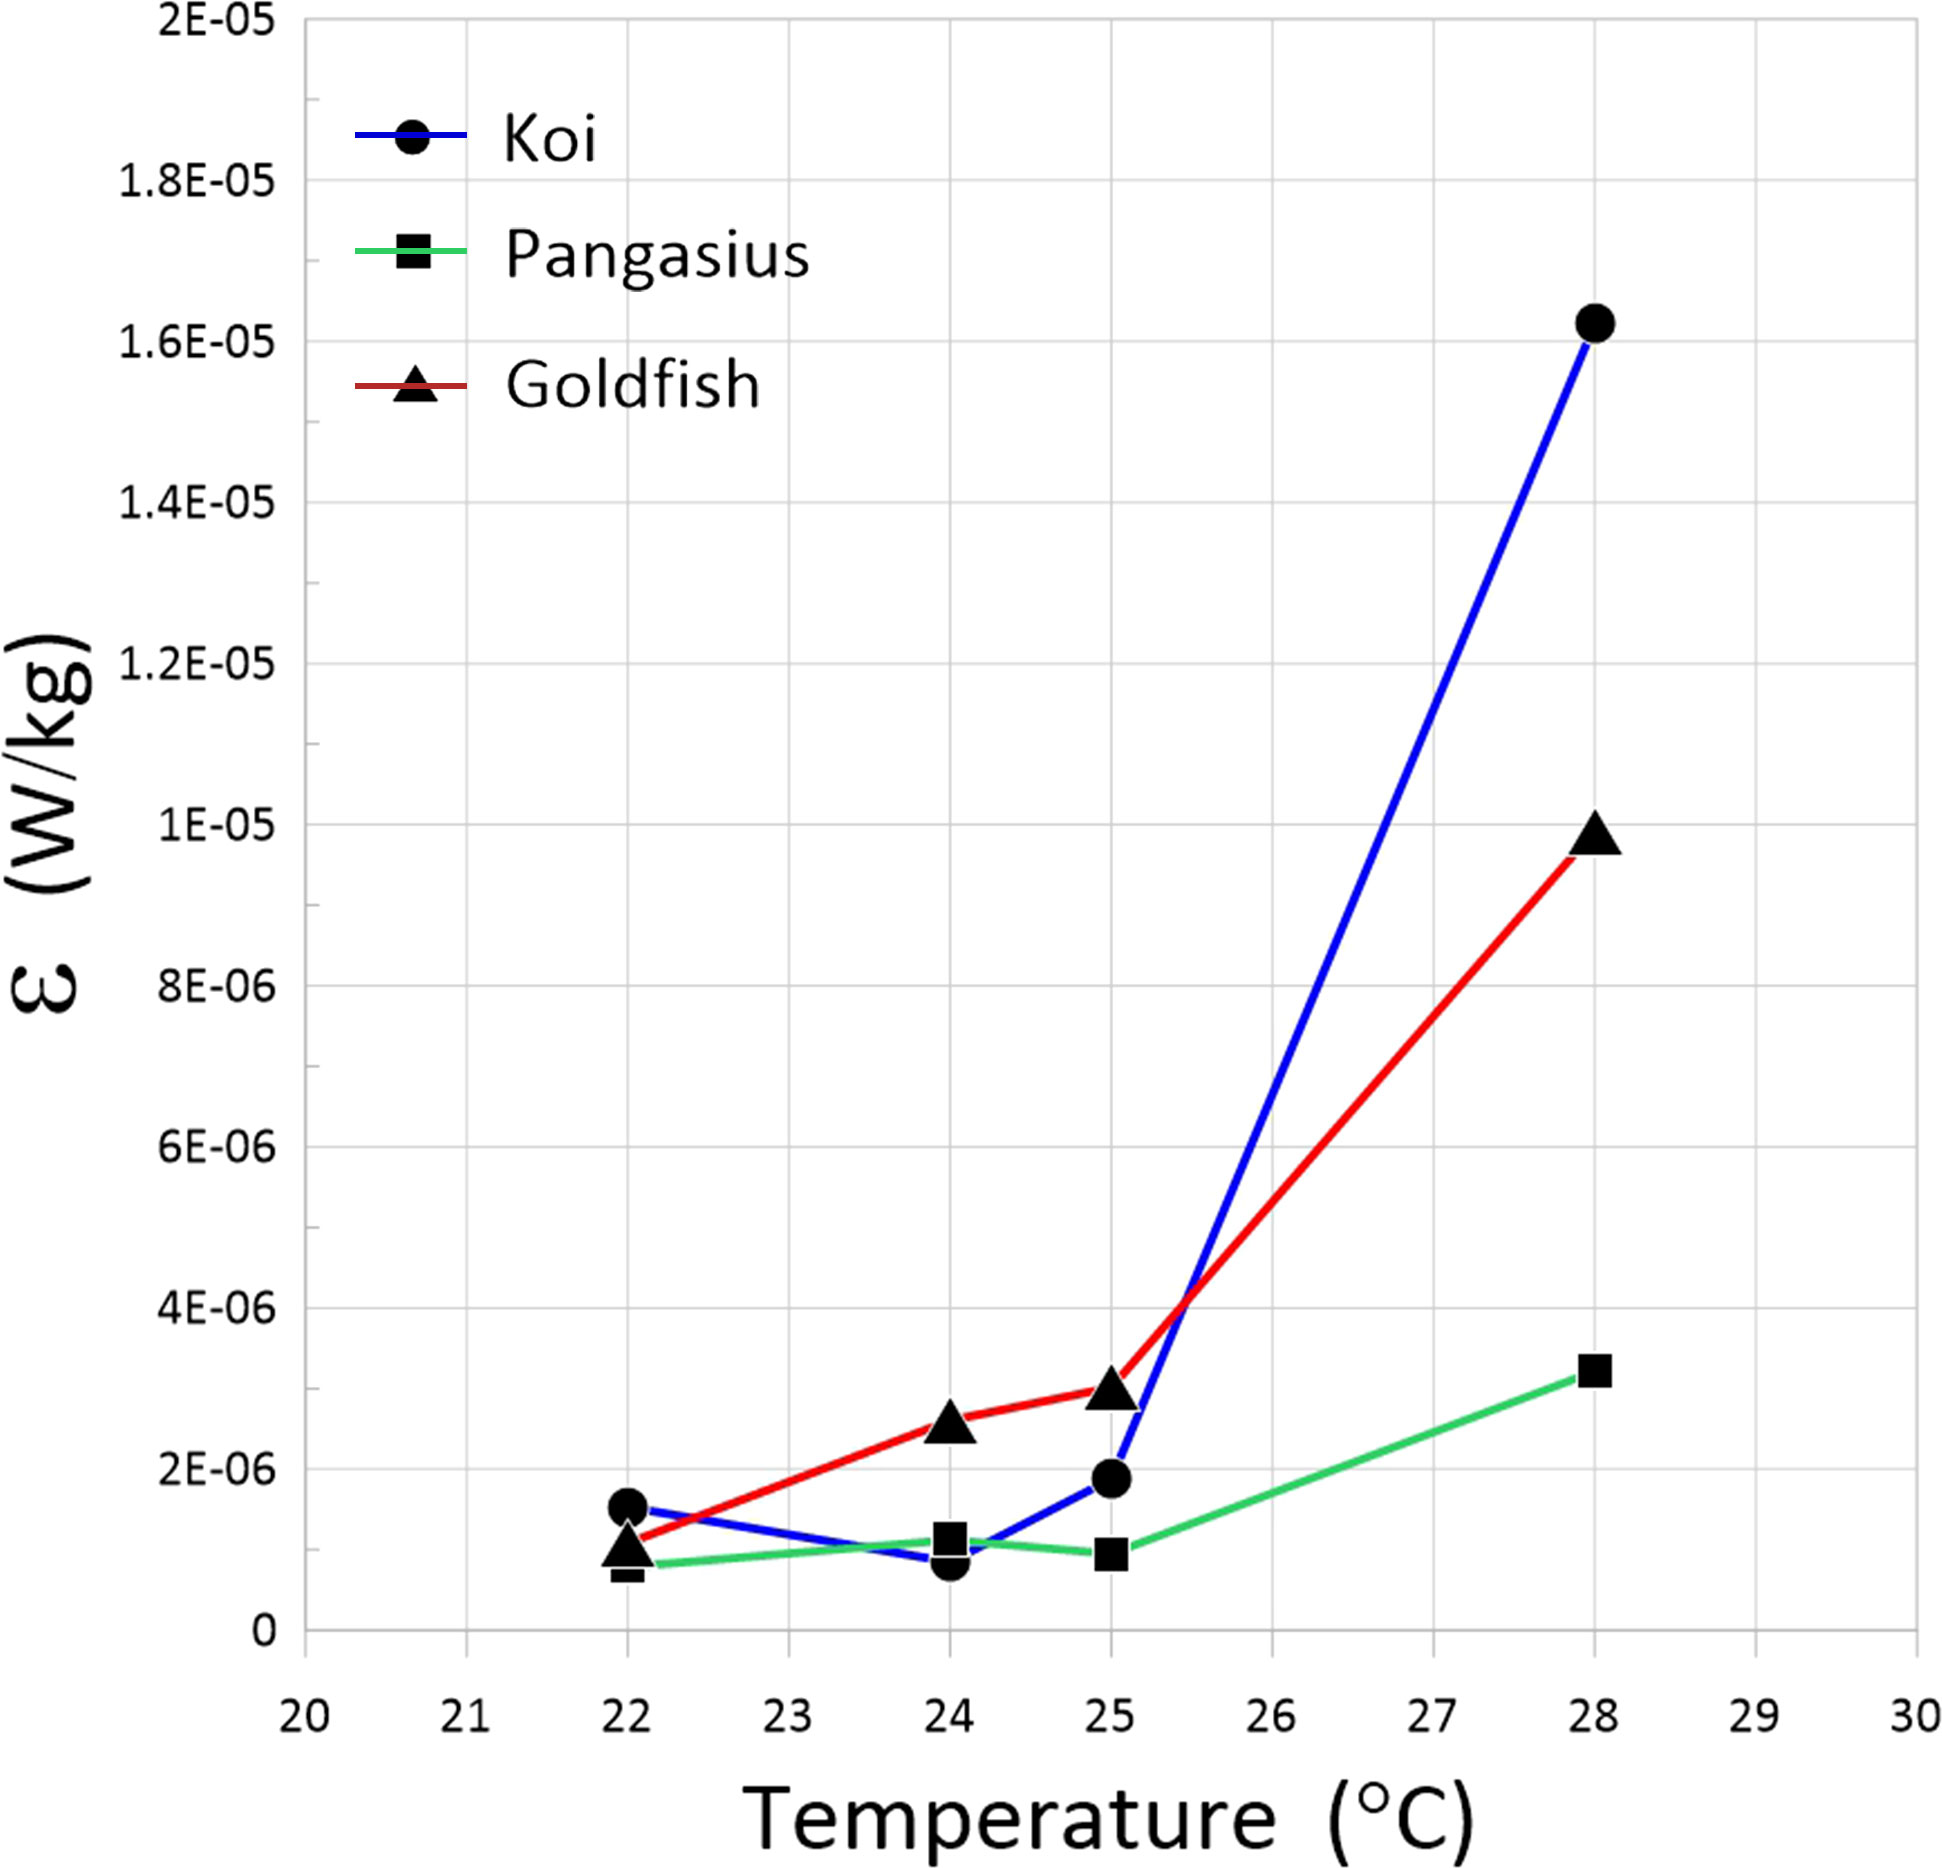
Figure 11 Dissipation rates of the flow generated by the schools of koi, pangasius, and goldfish as a function of water temperature.
Discussion
According to the results presented herein, fish abundance and body size, and external environmental parameters, such as temperature and light, influence the biogenic turbulence. To further quantify the biogenic turbulence and mixing, the dissipation rate, mixing efficiency, and eddy diffusivity of koi, pangasius, and goldfish schools have been evaluated at their natural abundances. The natural abundances of koi, pangasius, and goldfish are approximately 37, 1, and 2 fish per cubic meter of water, respectively (Hicks et al., 2015).
Given the curve fits obtained from Figure 7, the dissipation rate of the three fish species at their natural abundances can be estimated by extrapolation. Since it was not possible to perform the experiments in our setup at the very low natural abundances of pangasius and goldfish, we relied on extrapolation, despite the fact that it may introduce errors in the estimates. Figure 12 plots the dissipation rates of the aquatic animals estimated in the present and past studies as a function of Reynolds number, defined as Re = Uℓ/υ , where U is the average cruising speed of the aquatic animal. In general, the dissipation rate increases with Reynolds number. Furthermore, the dissipation rates of most marine organisms with Reynolds number greater than 1,000 is higher than 10-7 W/kg.
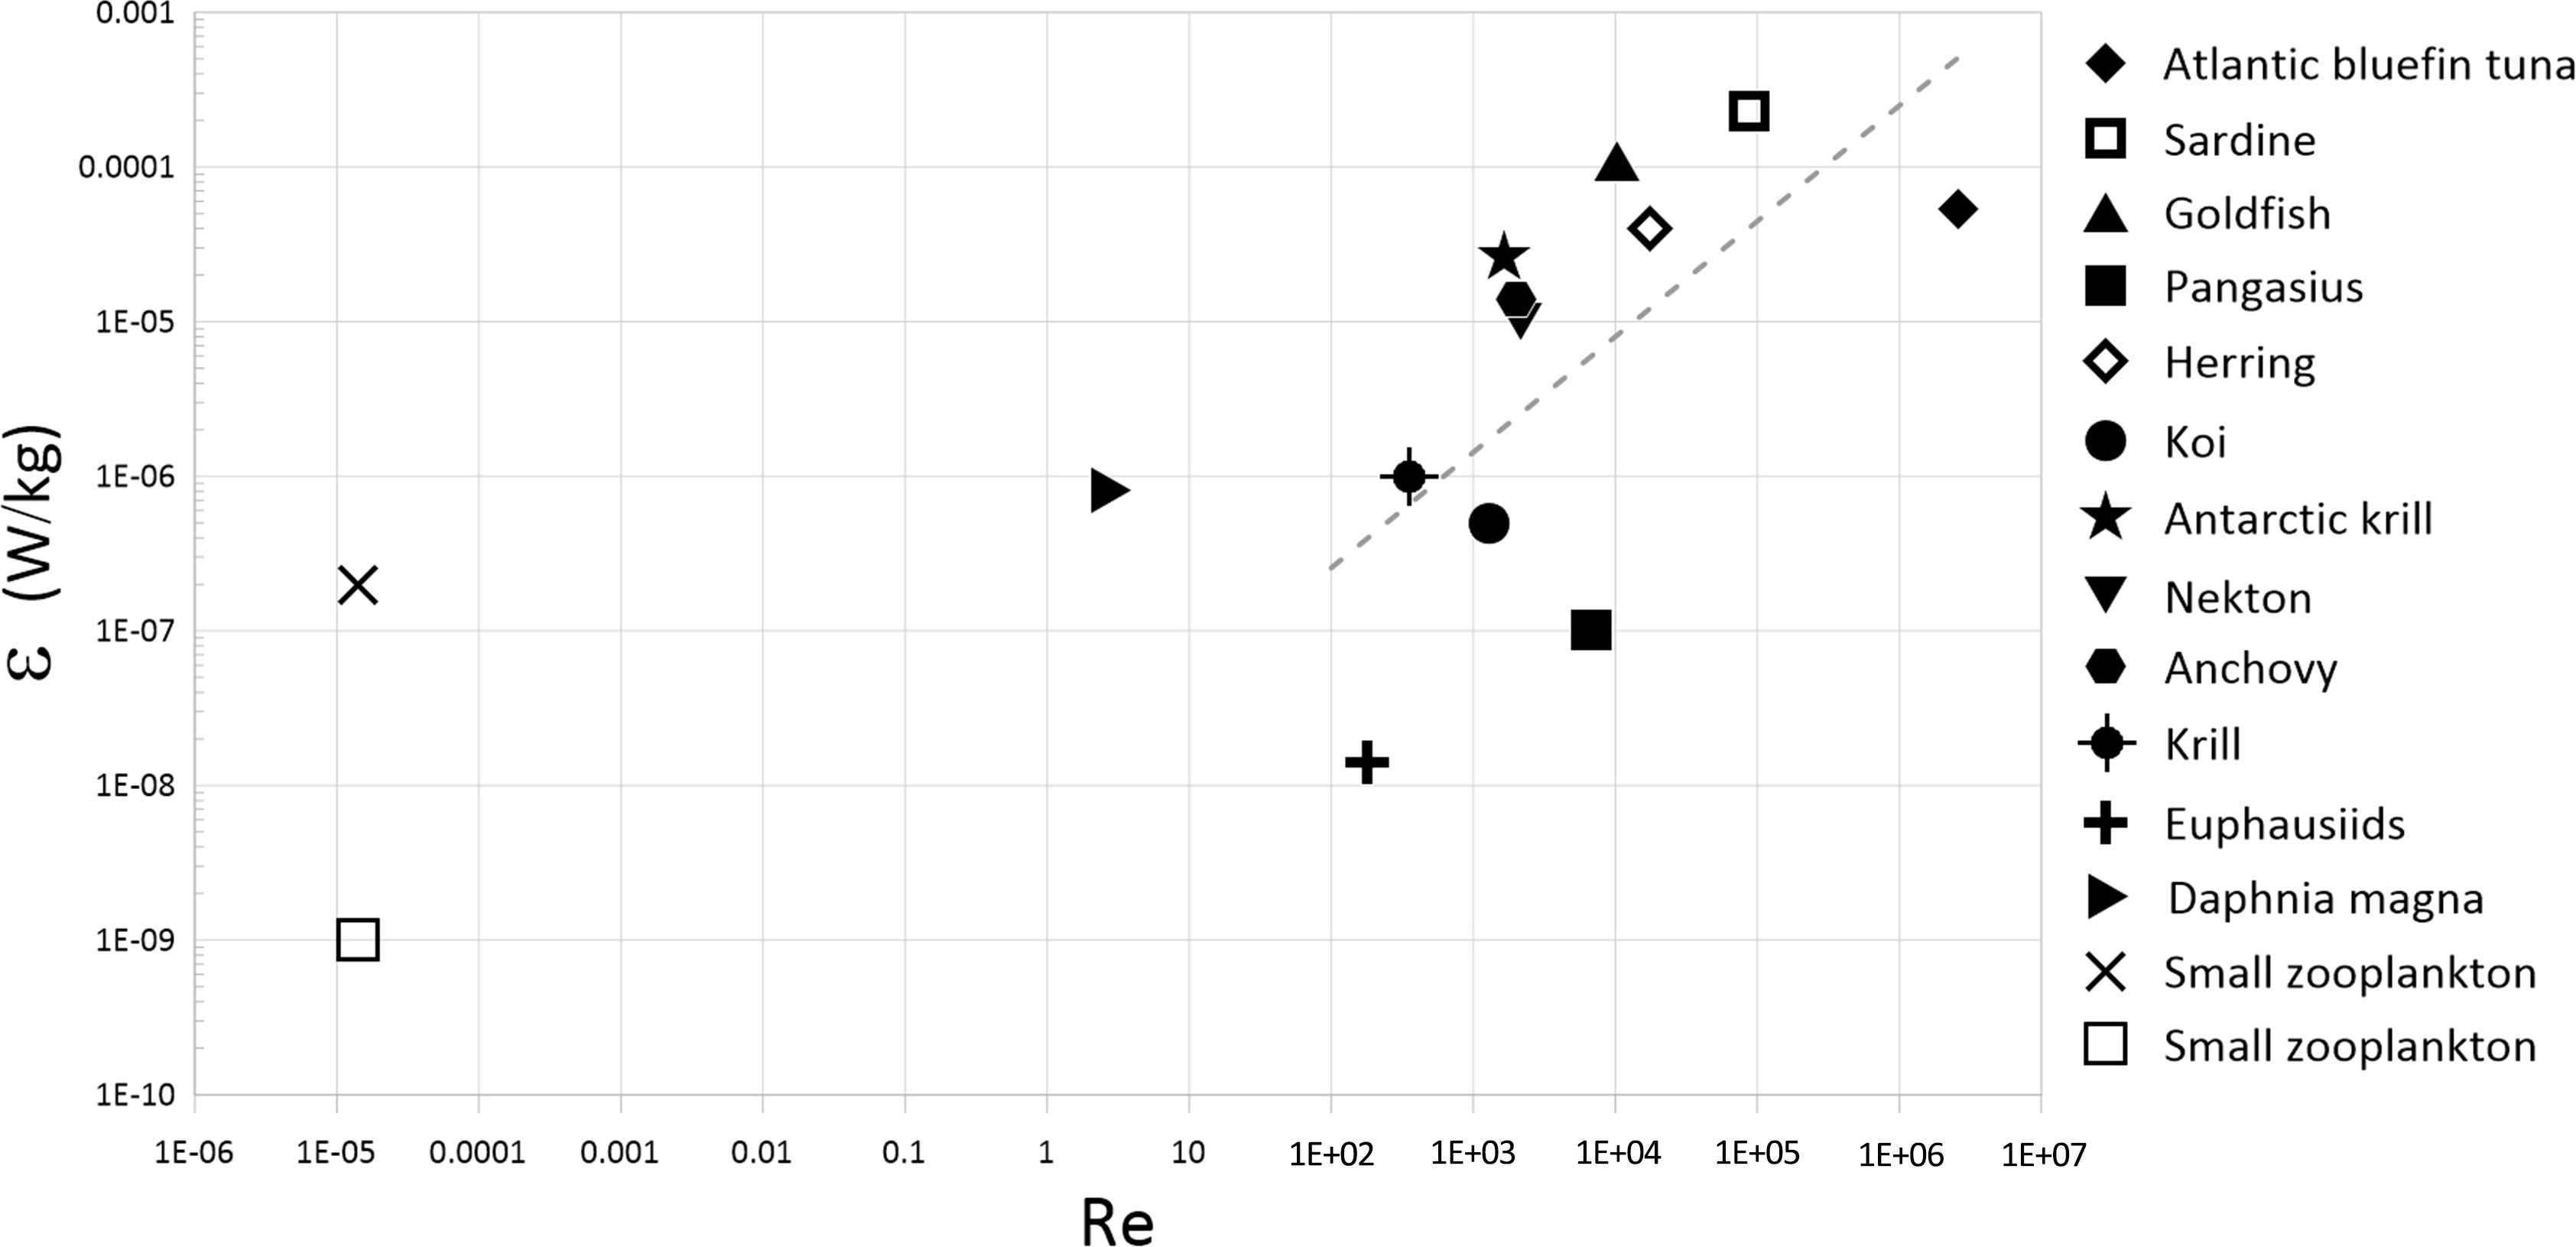
Figure 12 Dissipation rates associated with aquatic species having different Reynolds numbers based on the cruise speed. The broken line is a least-squares linear regression fitted to the data with Re > 100.
The dissipation rates of the fish schools studied in the present work are compared to those of the physical sources in Table 5. Despite the relatively low Reynolds numbers of the fish in the current study, their dissipation rates of O(10-7)-O(10-6) W/kg are within the lower bound of those of the physical sources. Consequently, the biogenic turbulence generated even by relatively small-sized fish may potentially be an essential source of turbulence and turbulent momentum mixing in lakes, seas, and oceans.
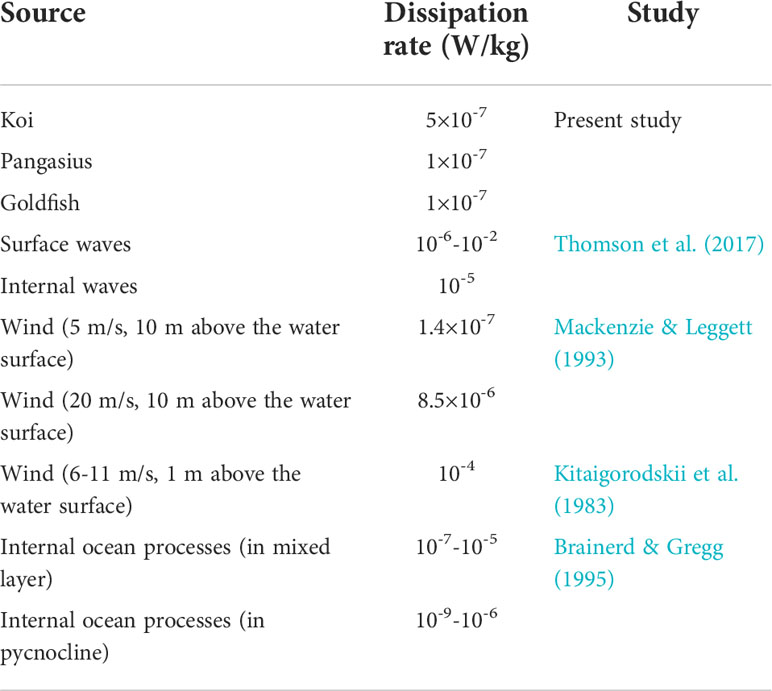
Table 5 Dissipation rates associated with the fish schools (at their natural abundances and at a water temperature of 24°C) in the present study and those of various physical sources.
The dissipation rates of flows generated by aquatic animals may not solely be sufficient to evaluate biomixing, and quantification of mixing efficiency (Γ) and vertical eddy diffusivity (Kv) is also necessary (Visser, 2007; Katija, 2012). The mixing efficiency describes the ability of turbulence to mix a stratified water column and is the proportion of kinetic energy that results in potential-energy increase (Visser, 2007). The mixing efficiency can be estimated as Γ = 0.33(LT/Lo)0.63, where, LT is the Thorpe scale (biogenetically-generated overturning scale or integral length scale) and L0 is the Ozmidov length scale, defined as Lo = (ϵ/N3)½, where N is a buoyancy frequency ~ 0.01 1/s for the upper ocean (Visser, 2007; Tanaka et al., 2017). In the present study, LT is assumed to be the integral length scale of the flow generated by the fish school and is estimated as LT = U × T (Moeini et al., 2021). The vertical eddy diffusivity can be expressed as Kv = Γϵ/N2 (Katija, 2012; Tanaka et al., 2017; Simoncelli et al., 2018). Note that since the mixing efficiency and eddy diffusivity are obtained using the velocity dissipation rate, they are related to the momentum mixing. However, the density/mass/scalar mixing may also be inferred from these parameters.
In our study, the mixing efficiencies of 0.04, 0.07, and 0.11 were, respectively, estimated for koi, pangasius, and goldfish schools at their natural abundances. The mixing efficiencies measured in the present study is much higher than those estimated for a school of krill (Γ = 10-4-10-2, Visser, 2007), similar to that of the centimeter-sized organisms with Re=100 (Γ = 0.04, Wang and Ardekani, 2015), and generally smaller than that estimated for a sardine school (Γ = 0.05-0.23, Tanaka et al., 2017). The maximum mixing efficiency can reach 0.2 for turbulent flows in the laboratory and geophysical turbulence (Osborn, 1980; Shih et al., 2005; Kunze, 2011; Gregg et al., 2018).
The vertical eddy diffusivities associated with the schools of koi, pangasius, and goldfish, as well as those of the other aquatic animals from previous studies, are shown as a function of Reynolds number in Figure 13. It can be seen that in general, the vertical eddy diffusivity increases with Reynolds number for various aquatic animals. The flows generated by fish schools in the present study have higher vertical eddy diffusivity than those caused by smaller swimming organisms such as zooplanktons, probably because of the larger body size of the fish and consequently larger and stronger fish-generated turbulent eddies.
Table 6 compares the vertical eddy diffusivity of the three fish schools with those of the physical processes. The turbulence is capable of mixing the water column if the vertical eddy diffusivity is greater than the molecular temperature diffusivity (DT ~ 10-7 m2 s-1) (Simoncelli et al., 2018). The vertical eddy diffusivities measured in the present study are within the range of those of the physical processes and are much greater than the molecular temperature diffusivity. This indicates that even small-sized fish with Re as low as 1000 can effectively mix the water column. On the other hand, the aquatic animals with Re< 1 may not cause significant mixing given their small eddy diffusivity of less than 10-7 m2/s (see Figure 13).
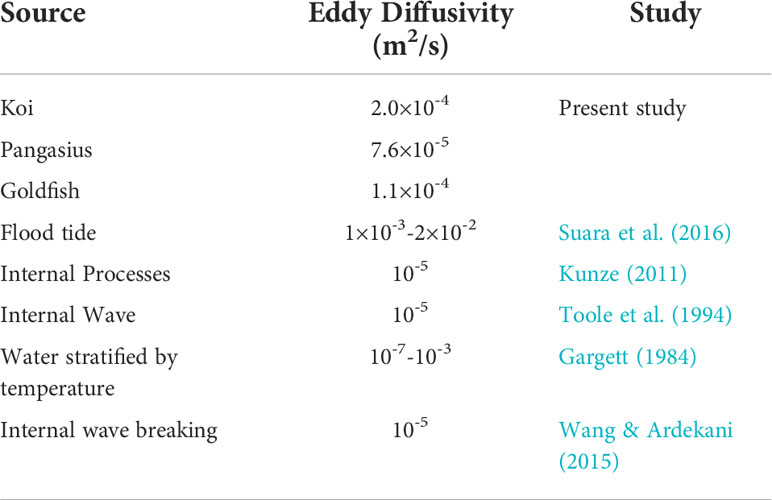
Table 6 Comparison of the eddy diffusivities associated with the fish schools (at their natural abundances and at a water temperature of 24°C) in the present study and those of various physical sources.
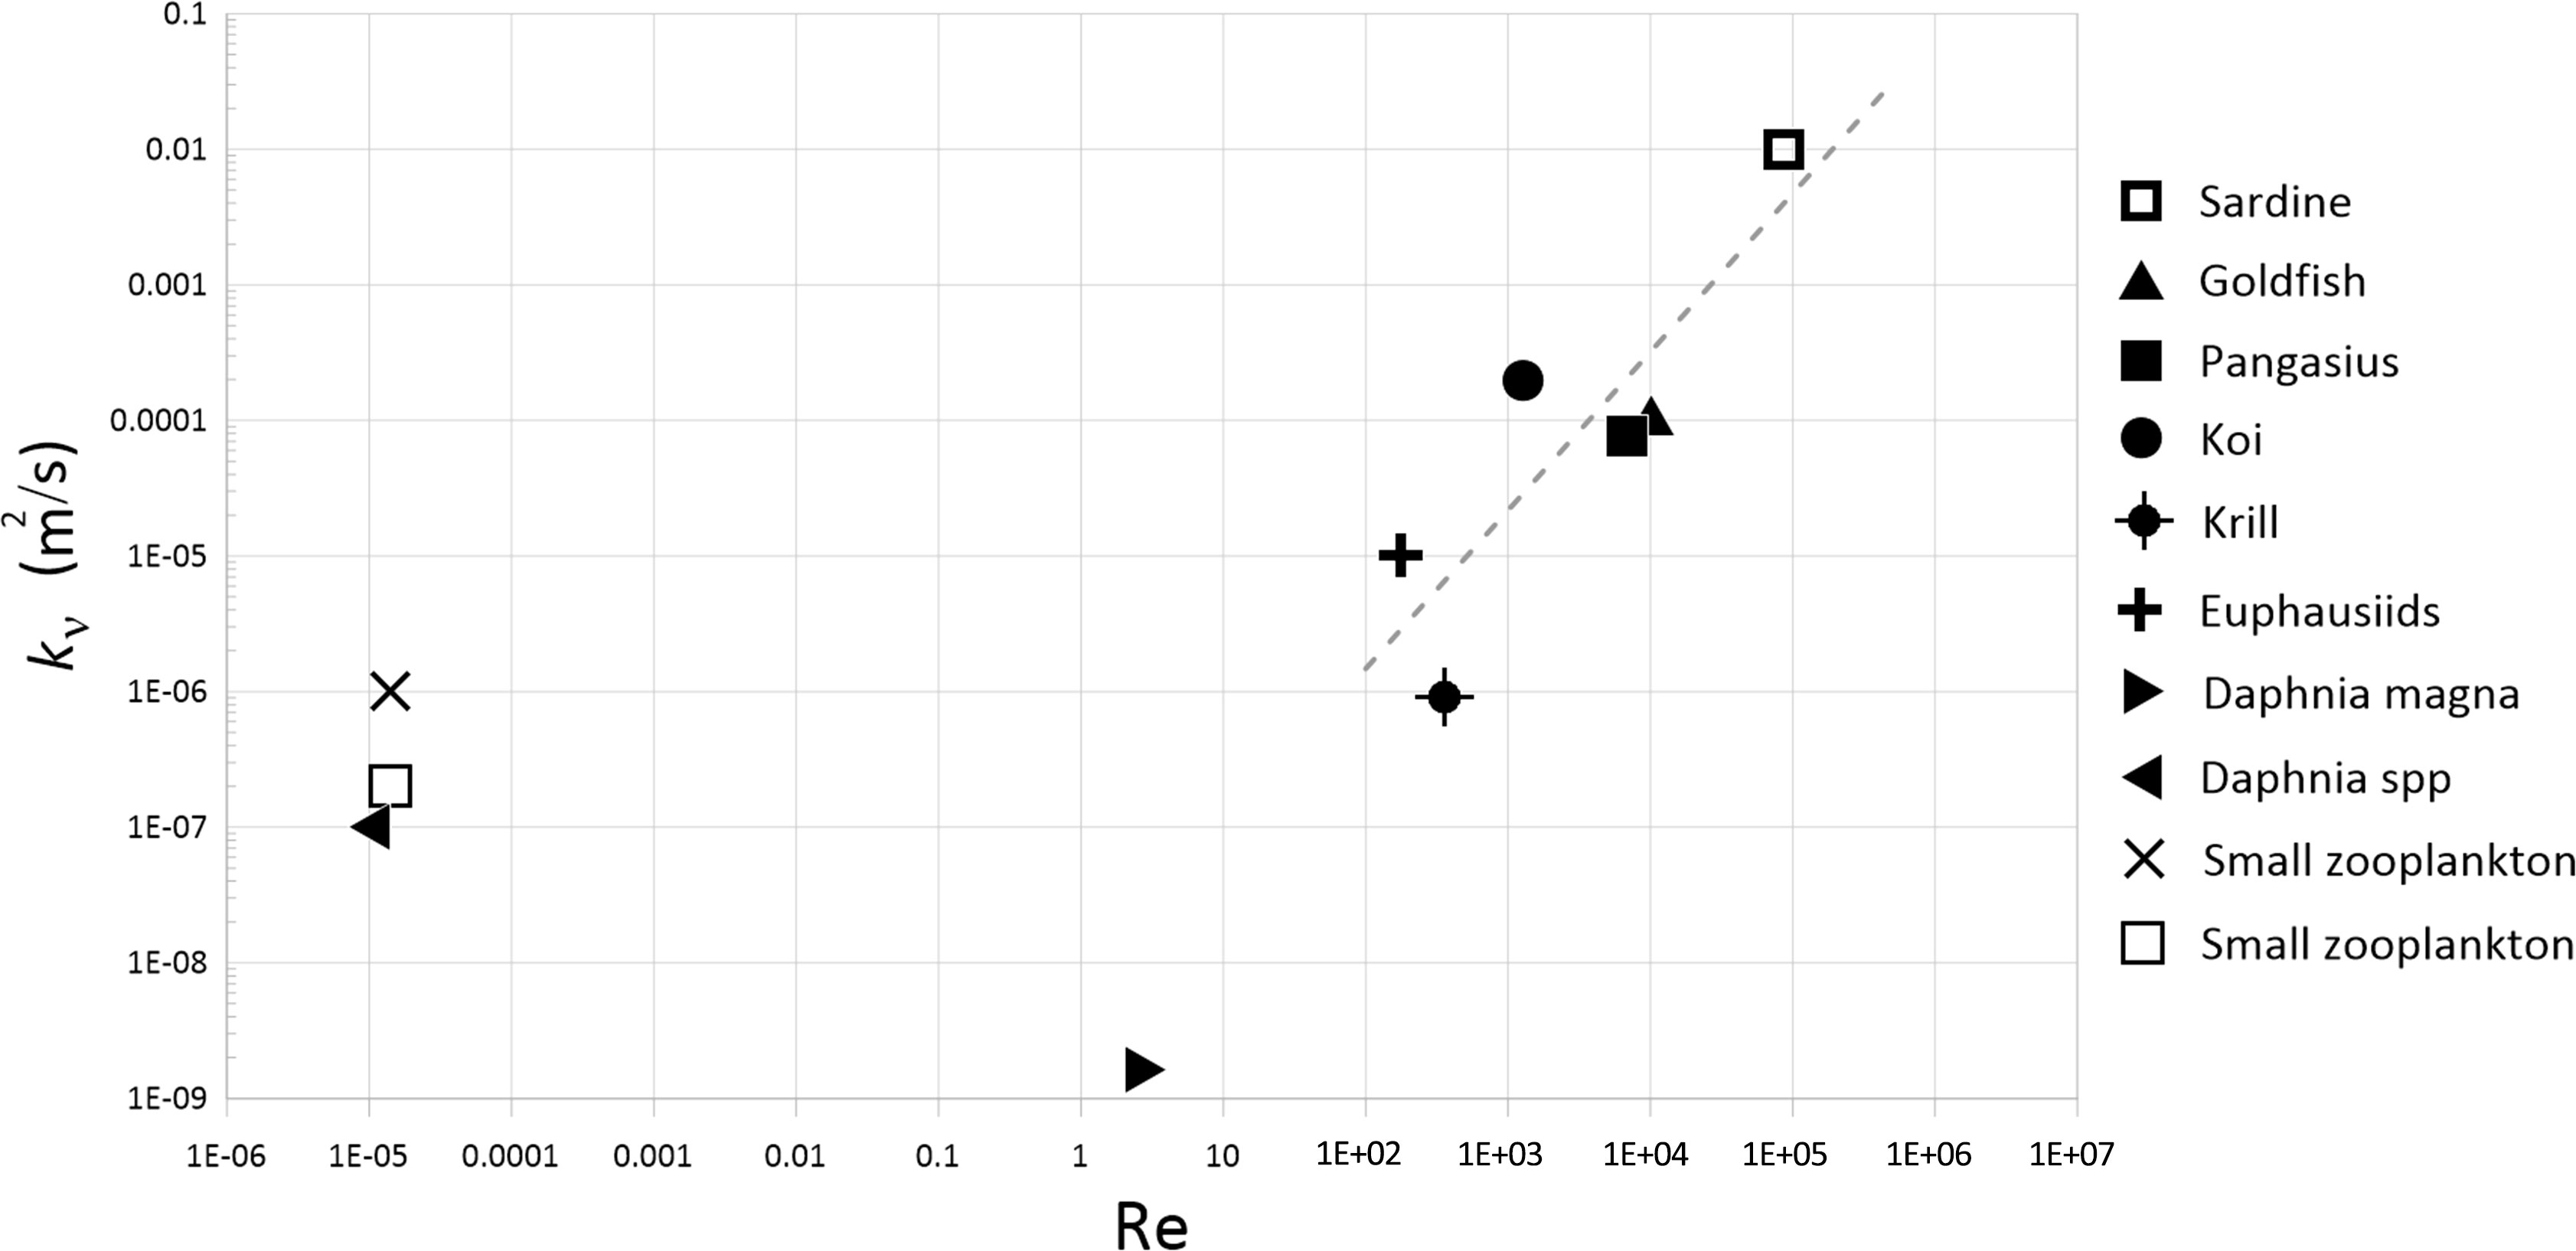
Figure 13 Eddy diffusivities associated with aquatic species having different Reynolds numbers based on the cruise speed. The broken line is a least-squares linear regression fitted to the data with Re > 100.
Lastly, we emphasize that our results relate to a controlled laboratory environment. In natural water bodies, other parameters can affect biogenic turbulence and mixing, for example the thermal stratification may suppress eddies generated by aquatic animals, resulting in lower biomixing than that observed in the laboratory (Tanaka et al., 2017).
Conclusions
The turbulence parameters of the flow generated by schools of koi, pangasius, and goldfish in laboratory experiments were measured using an acoustic Doppler velocimeter. The results showed that the turbulence produced by the fish was approximately homogeneous and isotropic and had relatively low-mean velocities. Furthermore, the velocity spectra agreed well with the −5/3 power-law spectrum in the inertial subrange, and the PDFs of the velocity fluctuations had a Gaussian distribution.
As the fish abundance increased, the RMS velocities, integral time scales and dissipation rates were found to increase linearly up to a point where the fish movement was restricted, beyond which the aforementioned parameters decreased. The rate of increase of the RMS velocities and dissipation rates with abundance was higher for the turbulence generated by the larger fish. It was also observed that dimming the ambient light and increasing the water temperature increased the RMS velocities, integral time scales and dissipation rates. Our findings suggest that significant differences in turbulence parameters associated with aquatic animals reported in previous studies (in addition to the behavioral characteristics) might be attributed to the abundance and body size of the animals as well as environmental parameters, e.g., light and temperature.
Finally, the dissipation rate, the mixing efficiency, and the vertical eddy diffusivity estimated for the three fish species at their natural abundances are higher than those previously estimated for smaller aquatic species and are within the lower bound range of those of the physical sources. This proposes that biogenic turbulence is likely to play an essential role in the mixing of lakes, seas, and oceans, at least locally. The dissipation rate and eddy diffusivity were also found to increase with the Reynolds numbers of aquatic animals. Further studies are necessary to evaluate the fish-generated turbulent mixing, especially in the field.
Data availability statement
The raw data supporting the conclusions of this article will be made available by the authors, without undue reservation.
Ethics statement
The animal study was reviewed and approved by Amirkabir University of Technology.
Author contributions
SA, conceptualization, methodology, investigation, resources, data curation, visualization, project administration, and writing - original Draft. BK, supervision, conceptualization, methodology, validation, writing – review, and editing. All authors contributed to the article and approved the submitted version.
Acknowledgments
The authors would like to thank the reviewers for their useful comments and suggestions.
Conflict of interest
The authors declare that the research was conducted in the absence of any commercial or financial relationships that could be construed as a potential conflict of interest.
Publisher’s note
All claims expressed in this article are solely those of the authors and do not necessarily represent those of their affiliated organizations, or those of the publisher, the editors and the reviewers. Any product that may be evaluated in this article, or claim that may be made by its manufacturer, is not guaranteed or endorsed by the publisher.
Supplementary material
The Supplementary Material for this article can be found online at: https://www.frontiersin.org/articles/10.3389/fmars.2022.892249/full#supplementary-material
References
Alméras E., Mathai V., Lohse D., Sun C. (2017). Experimental investigation of the turbulence induced by a bubble swarm rising within incident turbulence. J. Fluid Mech. 825, 1091. doi: 10.1017/jfm.2017.410
Bi C. W., Zhao Y. P., Dong G. H. (2020). Experimental study on the effects of farmed fish on the hydrodynamic characteristics of the net cage. Aquaculture 524, 735239. doi: 10.1016/j.aquaculture.2020.735239.
Blaxter J. H. S., Batty R. S. (1987). Comparisons of herring behaviour in the light and dark: changes in activity and responses to sound. J. Mar. Biolog. Assoc. U.K 67, 849. doi: 10.1017/S0025315400057088
Brainerd K. E., Gregg M. C. (1995). Surface mixed and mixing layer depths. Deep Sea Res. Part I Oceanogr. Res. Pap 42 (9), 1521–1543. doi: 10.1016/0967-0637(95)00068-H
Camozzi S. (2017). Quantification of biogenic turbulence. M. Eng. thesis Dept. Mechanical Engineering McGill Univ. Available at: https://escholarship.mcgill.ca/concern/theses/pg15bh564
Dean C., Soloviev A., Hirons A., Frank T., Wood J. (2016). Biomixing due to diel vertical migrations of zooplankton: Comparison of computational fluid dynamics model with observations. Ocean Model 98, 51–64. doi: 10.1016/j.ocemod.2015.12.002
Dewar W. K., Bingham R. J., Iverson R. L., Nowacek D. P., St Laurent L. C., Wiebe P. H. (2006). Does the marine biosphere mix the ocean? J. Mar. Res. 64, 541–561. doi: 10.1357/002224006778715720
Fernando H. J. S., De Silva I. P. D. (1993). Note on secondary flows in oscillating-grid, mixing-box experiments. Phys. Fluids A 5 (7), 1849–1851. doi: 10.1063/1.858808
Gargett A. E. (1984). Vertical eddy diffusivity in the ocean interior. J. Mar. Res. 42 (2), 359–393. doi: 10.1357/002224084788502756
Goring D. G., Nikora V. I. (2002). Despiking acoustic Doppler velocimeter data. J. Hydraul. Eng. 128 (1), 117–126. doi: 10.1061/(ASCE)0733-9429(2002)128:1(117)
Gregg M. C., D'Asaro E. A., Riley J. J., Kunze E. (2018). Mixing efficiency in the ocean. Annu. Rev. Mar. Sci. 10 (1), 443–473. doi: 10.1146/annurev-marine-121916-063643
Gregg M. C., Horne J. K. (2009). Turbulence, acoustic backscatter, and pelagic nekton in Monterey bay. Phys. Oceanogr. 39 (5), 1097–1114. doi: 10.1175/2008JPO4033.1
Hicks B. J., Brijs J., Daniel A., Morgan D., Ling N. (2015). Biomass estimation of invasive fish (New Zealand: Gothenburg University).
Homayounfar F., Khorsandi B. (2022). Evaluating acoustic Doppler velocimetry pulse-pair spacing/velocity range setting for turbulent flow measurements. Phys. Fluids 34 (3), 035116. doi: 10.1063/5.0086303
Hopfinger E. J., Toly J. A. (1976). Spatially decaying turbulence and its relation to mixing across density interfaces. J. Fluid Mech. 78, 155–175. doi: 10.1017/S0022112076002371
Huntley M. E., Zhou M. (2004). Influence of animals on turbulence in the sea. Mar. Ecol. Prog. Ser. 273, 65–79. doi: 10.3354/meps273065
Katija K. (2012). Biogenic inputs to ocean mixing. J. Exp. Biol. 215 (6), 1040–1049. doi: 10.1242/jeb.059279
Kazemi M., Khorsandi B., Mydlarski L. (2021). Effect of acoustic Doppler velocimeter sampling volume size on measurements of turbulence. J. Atmos. Ocean Technol. 38 (2), 259–268. doi: 10.1175/JTECH-D-20-0174.1
Kazemi M., Khorsandi B., Mydlarski L. (2022). Circular turbulent wall jets in quiescent and coflowing surroundings. Phys. Fluids 34, 025116. doi: 10.1063/5.0079921
Khorsandi B., Gaskin S., Mydlarski L. (2013). Effect of background turbulence on an axisymmetric turbulent jet. J. Fluid Mech. 736, 250–286. doi: 10.1017/jfm.2013.465
Khorsandi B., Mydlarski L., Gaskin S. (2012). Noise in turbulence measurements using acoustic Doppler velocimetry. J. Hydraul. Eng. 138 (10), 829–838. doi: 10.1061/(ASCE)HY.1943-7900.0000589
Kitaigorodskii S., Donelan M., Lumley J., Tarray E. (1983). Wave-turbulent interactions in the upper ocean. part II. statistical characteristics of wave and turbulent components of the random velocity field in the marine surface layer. J. Phys. Oceanogr. 13 (11), 1988–1999. doi: 10.1175/1520-0485(1983)013<1988:WTIITU>2.0.CO;2
Kunze E. (2011). Fluid mixing by swimming organisms in the low-reynolds-number limit. J. Mar. Res. 69, 591–601. doi: 10.1357/002224011799849435
Kunze E. (2019). Biologically generated mixing in the ocean. Annu. Rev. Mar. Sci. 11 (1), 215–226. doi: 10.1146/annurev-marine-010318-095047
Kunze E., Dower J. F., Beveridge I., Dewey R., Bartlett K. P. (2006). Observation of biologically generated turbulence in a coastal inlet. Science 313, 1768–1770. doi: 10.1126/science.1129378
Mackenzie B., Leggett W. (1993). Wind-based models for estimating the dissipation rates of turbulent energy in aquatic environments: empirical comparisons. Mar. Ecol. Prog. Ser. 94, 207–216. doi: 10.3354/meps094207
Moeini M., Khorsandi B., Mydlarski L. (2020). Effect of acoustic Doppler velocimetry sampling frequency on statistical measurements of turbulent axisymmetric jets. J. Hydraul. Eng. 146 (7), 4020048. doi: 10.1061/(ASCE)HY.1943-7900.0001767
Moeini M., Khorsandi B., Mydlarski L. (2021). Effect of coflow turbulence on the dynamics and mixing of a non-buoyant turbulent jet. J. Hydraul. Eng. 147 (1), 04020088. doi: 10.1061/(ASCE)HY.1943-7900.0001830
Munk W. H. (1966). Abyssal recipes. Deep Sea Res. Oceanogr. 13 (4), 707–730. doi: 10.1016/0011-7471(66)90602-4
Nejatipour P., Khorsandi B. (2021). Effect of nozzle geometry on the dynamics and mixing of self-similar turbulent jets. Water Sci. Technol. 84 (12), 3907–3915. doi: 10.2166/wst.2021.483
Noss C., Lorke A. (2014). Direct observation of biomixing by vertically migrating zooplankton. Limnol. Oceanogr. 59 (3), 724–732. doi: 10.4319/lo.2014.59.3.0724
Nortek. (2018). The comprehensive manual for velocimeters. https://www.nortekgroup.com/assets/software/N3015-030-Comprehensive-Manual-Velocimeters_1118.pdf.
Osborn T. R. (1980). Estimates of the local rate of vertical diffusion from dissipation measurements. Phys. Oceanogr. 10 (1), 83–89. doi: 10.1175/1520-0485(1980)010<0083:EOTLRO>2.0.CO;2
Pérez-Alvarado A., Mydlarski L., Gaskin S. (2016). Effect of the driving algorithm on the turbulence generated by a random jet array. Exp Fluids 57, 20. doi: 10.1007/s00348-015-2103-7
Plew D. R., Klebert P., Rosten T. W., Aspaas S., Birkevold J. (2015). Changes to flow and turbulence caused by different concentrations of fish in a circular tank. J. Hydraul. Res. 53 (3), 364–383. doi: 10.1080/00221686.2015.1029016
Rousseau S., Kunze E., Dewey R., Bartlett K., Dower J. (2010). On turbulence production by swimming marine organisms in the open ocean and coastal waters. J. Phys. Oceanogr. 40, 2107–2121. doi: 10.1175/2010JPO4415.1
Sahebjam R., Kohan K. F., Gaskin S. (2022). The dynamics of an axisymmetric turbulent jet in ambient turbulence interpreted from the passive scalar field statistics. Phys. Fluids 34, 015129. doi: 10.1063/5.0071023
Shih L. H., Koseff J. R., Ivey G. N., Ferziger J. H. (2005). Parameterization of turbulent fluxes and scales using homogeneous sheared stably stratified turbulence simulations. J. Fluid Mech. 525, 193. doi: 10.1017/S0022112004002587
Simoncelli S., Thackeray S. J., Wain D. J. (2018). On biogenic turbulence production and mixing from vertically migrating zooplankton in lakes. Aquat. Sci. 80, 35. doi: 10.1007/s00027-018-0586-z
Suara K., Brown R., Borgas M. (2016). Eddy diffusivity: A single dispersion analysis of high resolution drifters in a tidal shallow estuary. J. Environ. Fluid Mechanics 16, 5. doi: 10.1007/s10652-016-9458-z
Tanaka M., Nagai T., Okada T., Yamazaki H. (2017). Measurement of sardine-generated turbulence in a large tank. Mar. Ecol. Prog. Ser. 571, 207–220. doi: 10.3354/meps12098
Taylor G. I. (1935). “Statistical theory of turbulence,” in Proceeding of the royal society of London a: Mathematical, physical and engineering sciences, vol. 151, 421–444. doi: 10.1098/rspa.1935.0158
Thomson J., Schwendeman M. S., Zippel S. F., Moghimi S., Gemmrich J., Rogers W. E. (2016). Wave-breaking turbulence in the ocean surface layer. J. Phys. Oceanogr. 46, 1857–1870. doi: 10.1175/JPO-D-15-0130.1.
Toole J. M., Schmitt R. W., Polzin K. L. (1994). Estimates of diapycnal mixing in the abyssal ocean. J. Science. 264 (5162), 1120–1123. doi: 10.1126/science.264.5162.1120
Variano E. A., Cowen E. A. (2008). A random-jet-stirred turbulence tank. J. Fluid Mech. 604, 1–32. doi: 10.1017/S0022112008000645
Visser A. W. (2007). Biomixing of the oceans. Science 316 (5826), 838–839. doi: 10.1126/science.1141272
Wahl T. L. (2003). Discussion of “Despiking acoustic Doppler velocimeter data” by Derek g. goring and Vladimir i. nikora. J. Hydraul. Eng. 129 (6), 484–487. doi: 10.1061/(ASCE)0733-9429(2003)129:6(484)
Wang S., Ardekani A. M. (2015). Biogenic mixing induced by intermediate reynolds number swimming in stratified fluids. Sci. Rep. 5, 17448. doi: 10.1038/srep17448
Keywords: biogenic turbulence, biomixing, fish school, mixing efficiency, acoustic doppler velocimeter (ADV), dissipation rate
Citation: Ahani S and Khorsandi B (2022) Effects of abundance, water temperature and light on the turbulence and mixing generated by fish schools of different sizes in quiescent water in a laboratory. Front. Mar. Sci. 9:892249. doi: 10.3389/fmars.2022.892249
Received: 08 March 2022; Accepted: 25 July 2022;
Published: 25 August 2022.
Edited by:
Zhiyu Liu, Xiamen University, ChinaReviewed by:
Giordano Lipari, Watermotion Waterbeweging, NetherlandsIlya Saushin, Federal State Budgetary Institution of Science Kazan Scientific Center of Russian Academy of Sciences, Russia
Copyright © 2022 Ahani and Khorsandi. This is an open-access article distributed under the terms of the Creative Commons Attribution License (CC BY). The use, distribution or reproduction in other forums is permitted, provided the original author(s) and the copyright owner(s) are credited and that the original publication in this journal is cited, in accordance with accepted academic practice. No use, distribution or reproduction is permitted which does not comply with these terms.
*Correspondence: Babak Khorsandi, Yi5raG9yc2FuZGlAYXV0LmFjLmly
†ORCID: Babak Khorsandi, orcid.org/0000-0003-4088-9740
 Sana Ahani
 Babak Khorsandi