- 1Key Laboratory of Marine Resource Chemistry and Food Technology (TUST), Ministry of Education, Tianjin University of Science and Technology, Tianjin, China
- 2Laborator for Marine Fisheries Science and Food Production Process, Pilot National Laboratory for Marine Science and Technology (Qingdao), Qingdao, China
- 3Chinese Academy of Science (CAS) Key Laboratory of Ocean Circulation and Waves, Institute of Oceanology, Chinese Academy of Sciences, Qingdao, China
- 4Center for Ocean Mega-Science, Chinese Academy of Sciences, Qingdao, China
- 5School of Marine Science and Technology, Tianjin University, Tianjin, China
The Amundsen Sea is one of the regions with the highest primary productivity in the Antarctic. To better understand the role of the Southern Ocean in the global carbon cycle and in climate regulation, a better understanding of the variations and environmental controls of primary productivity is needed. Using cluster analysis, the Amundsen Sea was divided into nine bioregions. The biophysical differences among bioregions enhanced confidence to identify priorities and regions to study the temporal and spatial variations in primary production. Four nearshore bioregions with high net primary productivity or rapidly increasing rates were selected to analyze temporal and spatial variations in primary productivity in the Amundsen Sea. Due to changes in net solar radiation and sea ice, primary production had significant seasonal variation in these four bioregions. The phenology had changed at two bioregions (6 and 7), which has the third and fourth highest primary production, due to changes in the dissolved iron. Annual primary production showed increasing trends in these four bioregions, and it was significant at three bioregions. The variation in primary production in the bioregion (9), which has the highest primary production, was mainly affected by variations in sea surface temperatures. In the bioregion (8), which has the second-highest primary production, the primary production was significantly positively correlated with sea surface temperature and significantly negatively correlated with sea ice thickness. The long-term changes of primary productivity in bioregions 6 and 7 were thought to be related to changes in the dissolved iron, and dissolved iron was the limiting factor in these two bioregions. Bioregionalization not only disentangles multiple factors that control the spatial differences, but also disentangles limiting factors that affect the phenology, decadal and long-term changes in primary productivity.
Introduction
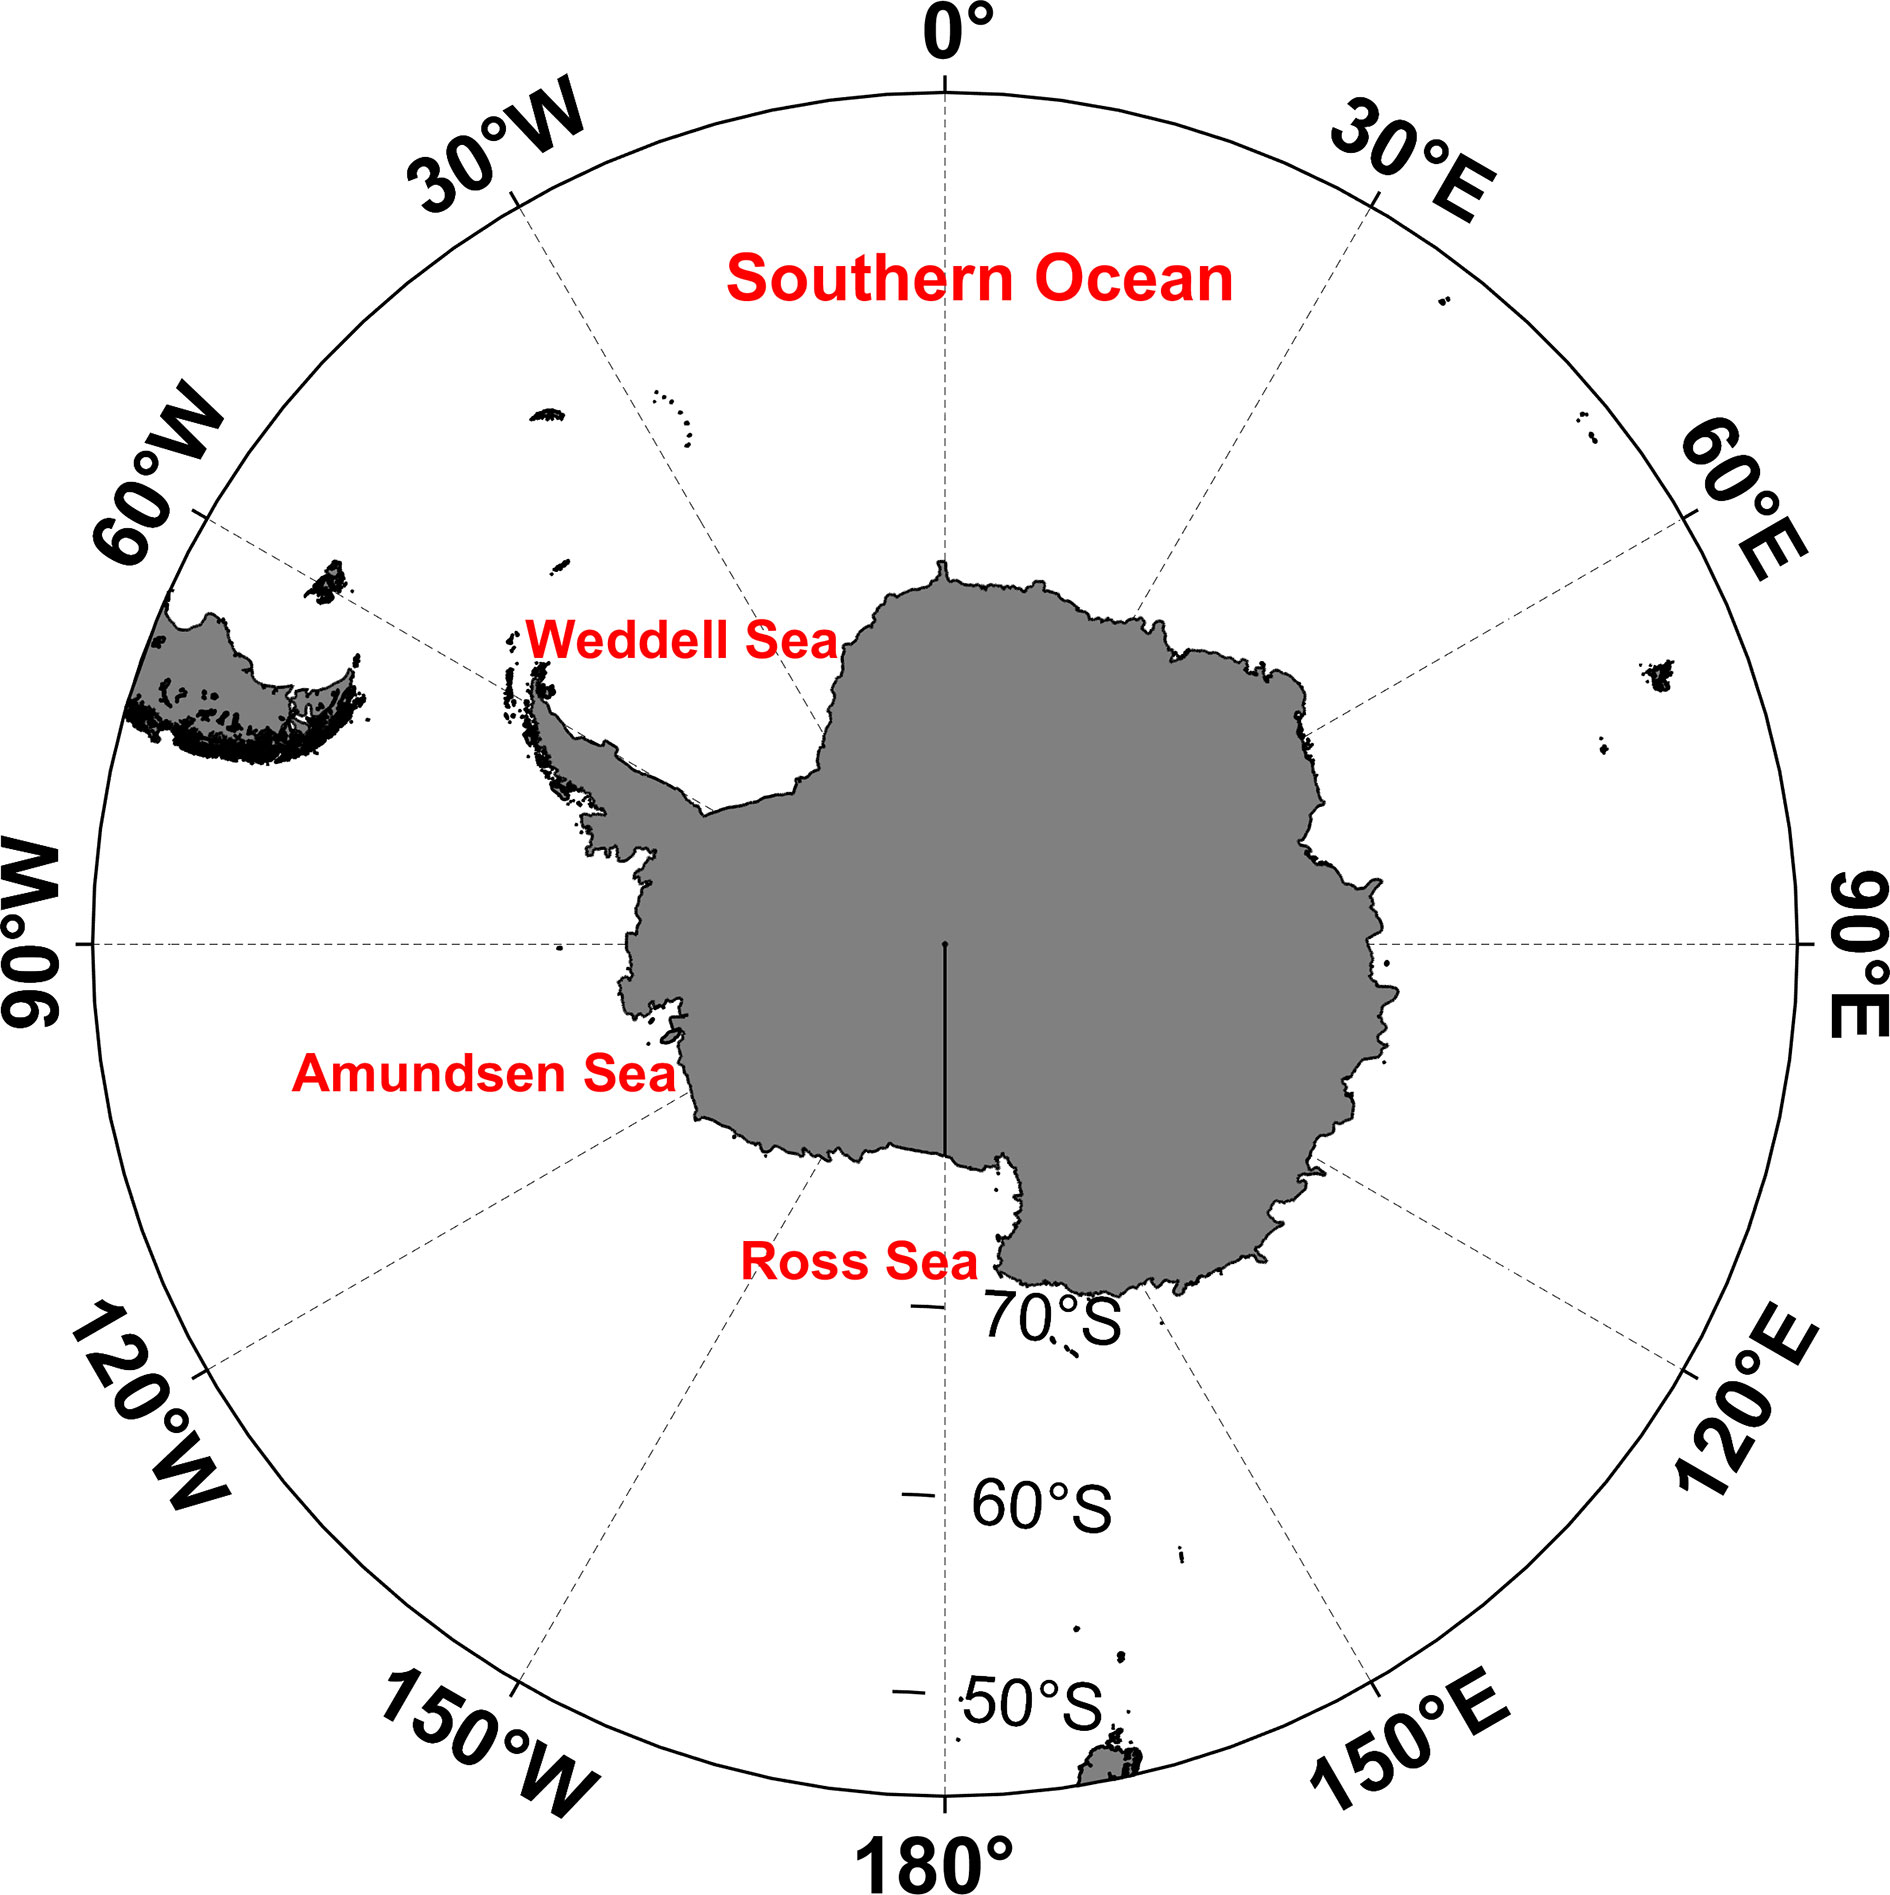
The Southern Ocean, also known as the Antarctic Ocean, encompasses 10% of the global ocean and contains parts of the South Pacific Ocean, the South Atlantic Ocean, the South Indian Ocean, and the marginal seas around Antarctica, such as the Ross Sea, Weddell Sea, and the Amundsen Sea. The Southern Ocean contains 40% of the total oceanic inventory of anthropogenic carbon dioxide (Khatiwala et al., 2009), and plays an important role in Earth’s climate regulation, especially by neutralizing the effects of rising carbon dioxide concentrations and rising global temperatures (Reid et al., 2009; Ma et al., 2012; Bijma et al., 2013; Petrou et al., 2016). The Amundsen Sea (Figure 1) lies between the Cape Flying Fish and Cape Dart on Slip Island, and is one of the most rapidly warming regions on Earth (Bromwich et al., 2013), and it is one of the least studied Antarctic continental shelf regions (Griffiths, 2010; Pabis et al., 2014).
Primary productivity plays an important role in the transformation of dissolved elements in the ocean and in ocean-atmosphere carbon exchange (Amthor and Baldocchi, 2001). Previous studies have indicated that the phenology, decadal and long-term changes in primary productivity in the Southern Ocean have been and will continue to be affected by the current and predicted changes in ocean circulation and hydrology associated with climate variability (Lannuzel et al., 2007; Herraiz-Borreguero et al., 2016; Kim and Kim, 2021). Significant spatial differences exist in the changes in primary productivity in the Southern Ocean, both over large latitudinal scales and at regional scales (Arrigo et al., 2008; Ardyna et al., 2017). These spatial differences are related to nutrient availability (mainly iron and possibly nitrate and silicic acid), temperature, light availability, sea-ice coverage, and mortality factors (Boyd, 2002; Smith Jr. and Comiso, 2008; Behrenfeld and Boss, 2014; Arrigo et al., 2015). These factors are controlled by vertical mixing, advection, sea ice cover, and seasonal variations in solar irradiance (Ardyna et al., 2017). However, studies of the primary productivity of the Southern Ocean have been limited in their ability to assess spatial variabilities over both short and long timescales for a variety of different reasons, such as lack of observation and uneven distribution of surveys (Arrigo et al., 2008). Primary productivity also shows significant spatial differences in the Amundsen Sea. The Amundsen Sea Polynya is the region of particularly high productivity in the Southern Ocean (Arrigo and van Dijken, 2003; Lee et al., 2012). Although some studies have been conducted on primary productivity in the Amundsen Sea (Arrigo and van Dijken, 2003; Arrigo et al., 2012; Lee et al., 2012; Park et al., 2017; Lim et al., 2019; Kwon et al., 2021), the spatial differences and mechanisms that drive differences in phenology, decadal and long-term changes in primary productivity are still not clear.
Bioregionalization is one method used to define ecosystems. Under this approach, regions are defined based on physical and biological properties, the method can be defined as the process of delineating the continuous spatial coverage of contiguous spatial units that support distinct biological assemblages (Costello, 2009; Koubbi et al., 2011; Roberson et al., 2017). Usually, the spatial units are delineated using geophysical and biological observation data, modeled data, or a combination of both (Grantham et al., 2010). The obtained bioregions can be used for monitoring and reporting the state of the environment, modeling and predicting the effects of climate changes, and identifying priority areas for protection (Greger and Bodtker, 2007; Spalding et al., 2007; Rice et al., 2011). In recent years, the delimitation of marine bioregions has also been used to disentangle multiple limiting factors that affect the efficiency of biological pumps mediated by phytoplankton (Longhurst, 2007; Ardyna et al., 2017), the spatial and temporal changes of key ecological parameters (Bowman et al., 2018). In the Southern Ocean, bioregionalization has been widely used to identify representative areas for protection at broad and regional scales, such as in the Southern Ocean (Grant et al., 2006), Ross Sea region (Sharp et al., 2010), and Weddell Sea (Teschke et al., 2016). Delineating the effects of environmental forcing on temporal and spatial variations in primary productivity remains challenging and requires novel approaches. We used bioregionalization to provide a basis for understanding variations in primary productivity in the Amundsen Sea.
In this paper, we conducted a cluster analysis using variables from the Global Ocean Reanalysis and Simulations (GLORYS) dataset to obtain a bioregional map of the Amundsen Sea. Using the bioregionalization outputs, we analyzed the limiting factors that affect spatial differences, the phenology, decadal and long-term changes in primary productivity in the Amundsen Sea.
Data and Methodology
Data
The physical and ecological variables used in the bioregionalization were derived from the Global Ocean Reanalysis and Simulation Version 4 (GLORYS2v4) dataset (https://resources.marine.copernicus.eu/?option=com_csw&task=results&pk_vid=f205f72451b76b161622075614d28a7a). GLORYS2v4 is an ocean reanalysis, which is a scientific method that produces a comprehensive record of how ocean properties are changing over time. This reanalysis is performed with the NEMOv3.1 ocean model in configuration ORCA025_LIM. The vertical grid has 75 levels in depth with partial steps at the bottom. GLORYS2v4 has assimilated observations, containing delayed time along-track satellite Sea Level Anomaly, Sea Ice Concentration, Sea Surface Temperature, and in situ profiles of temperature and salinity from the Coriolis Ocean dataset for Reanalysis (CORA) 4 database. The monthly mean values from 1993 to 2015 with a resolution of 1/4°×1/4° were used in this work.
In situ observed temperature and salinity data were acquired during the ANTXXVI/3 from the research ice breaker Polarstern (Gohl, 2010). The Climate Data Record (CDR) of sea ice concentration from obtained from NSIDC (Meier et al., 2017). Chlorophyll-a data were obtained from the Ocean Colour Climate Change Initiative (OC-CCI, http://www.esa-oceancolour-cci.org) project.
Previous studies have shown that variables obtained from GLORY2v4 perform well against observations in the Amundsen Sea (Uotila et al., 2019; Huang et al., 2020). In this work, we also compare the temperature, salinity, sea ice concentration, and chlorophyll against observations in the Amundsen Sea (shown in Supplementary Figures S1–S3). Results showed that comparisons between the GLORYS2v4 and in situ/satellite measurements of the temperature, salinity, sea ice concentration, and chlorophyll show a good agreement. The temperature of GLORYS2v4 had a good fit to the observed water temperature structure at section S01. The mean temperature obtained from the observation at section S01 was 34.70 ± 0.03°C, and it was 34.70 ± 0.04°C from GLORYS2v4. The sea ice concentration of GLORYS2v4 was significant correlated with sea ice concentration from CDR, the correlation coefficient were larger than 0.9 both in winter and summer. The monthly/annual surface chlorophyll concentrations of GLORYS2v4 had a good fit to the observed monthly/annual surface chlorophyll concentrations distributions. Also, the mixed layer depths were calculated according to Brainerd and Gregg (1995) at the S01 section (Figure S1). The mixed layer depths obtained from the observations ranged from 4 to 24 m with a mean of 15 m. At the same time, the mixed layer depths obtained from GLORYS2v4 ranged from 5 to 27 m with a mean of 17m. The above results enhanced the confidence in the quality of the GLORYS2v4 to get the bioregions in the Amundsen Sea.
As variables measured at the ocean surface are strongly correlated with processes at depth, the surface variables can reflect the properties of the water column (Longhurst, 2007; Oliver and Irwin, 2008). Therefore, the variables of the first layer were used in this work. The extents of all variables were clipped to match the study area, ranging from 80°to 150°W and 55°to 80°S. In addition to net primary productivity (nppv in Table 1), other physical and biological variables were also selected. These variables were selected according to two principles: first, variables selected by other studies conducted in the Southern Ocean were also selected in this work, including the sea surface temperature (SST), sea surface height (SSH), salinity, water depth, sea ice persistence index, sea bottom temperature, and chlorophyll (Table 1); second, variables that could affect primary productivity were also selected, including the mixed layer depth, and dissolved iron (Table 1). The parameters used in the clustering analysis contained the average states of the variables (mean value across the time series), their variability (annual maximum mean, annual minimum mean, long-term change rate), and topographic gradient. The sea ice persistence index (ICE) was calculated as the proportion of the overall time during which the grid was covered by sea ice (the sea ice concentration larger than 50%). The index was calculated as ICE=M1/M, where M1 is the number of months which monthly sea ice concentration is less than 50%, M stands for the number of months used in a year. All variables were standardized to zero means and unit standard deviations to eliminate issues associated with units of measurement.
Methodology
Bioregions were obtained in this work using cluster methods. Cluster analysis is a class of techniques in which a set of objects or cases classified in the same group (called a cluster) are more similar to each other than to those in other groups. One advantage of cluster techniques is that they allow for areas with similar characteristics to be defined regardless of their location, thereby producing results representative of intrinsic spatial patterns and environmental variables (Leathwick et al., 2003; Snelder et al., 2007). Cluster analysis has been commonly used to identify bioregions and is still widely used today (Milligan and Cooper, 1987; Ebach et al., 2015; Roberson et al., 2017; Bloomfield and Knerr, 2018). For the Southern Ocean, physical and biological variables, including the water temperature, salinity, depth, chlorophyll, and sea-ice information, were used to obtain the bioregions to facilitate systematic planning for the protection of marine habitat diversity (Grant et al., 2006; Sharp et al., 2010; Teschke et al., 2016; Godet et al., 2020). In this work, hierarchical clustering and the K-means clustering method were selected to obtain bioregions in the Amundsen Sea. K-means clustering is a data-mining method that classifies objects (variables) into K clusters, objects within a given cluster are more similar to each other (in the multivariate space) than to those in other clusters. The key advantage of K-mean clustering over other unsupervised approaches are its low complexity, quick computation, capacity to deal with large data sets, and adjustable cluster membership (Govender and Sivakumar, 2020). This approach has been successfully applied in the North Atlantic (Lacour et al., 2015), the Southern Ocean (Ardyna et al., 2017), and the Mediterranean Sea (Mayot et al., 2016) as well as at the global scale (D’Ortenzio and d’Alcalà, 2012). The number of K categories used for the K-means clustering was determined using the hierarchical clustering method, which depends on the pairwise distances between data points to merge or divide data into a series of clusters (Fraley and Raftery, 1998). The K-mean clustering was carried out using the open source Geoda software (Anselin et al., 2006). In this study, the physical and biological variables listed in Table 1 were used in the clustering analysis. The long-term change rate was calculated using linear regression. The significance of the correlations and trends identified in this study was checked using t-tests and Mann–Kendall tests (von Storch and Zwiers, 1999; Feng et al., 2015), respectively. The pre-whitening method was used to avoid autocorrelations in the work (Kulkarni and von Storch, 1995). The software of computing hierarchical clustering, linear regression, and significance of correlations was R (https://www.r-project.org/).
The Mann-Kendall test, first introduced by Mann (1945), is a non-parametric statistical method to test the significant of change trend of time series. It is widely utilized to examine climatic factors’s long-term trends and abrupt change point of climate factors. The statistic UFk is an order normalization parameter of time series X calculated in order. If UFk is more (or less) than 0, it indicates that the sequence is increasing (decreasing). For a given significant level α, if the absolute value of UFk is greater than U_α (for α=0.05,U_α= ± 1.96), the sequence has a significant trend. UBk is an order normalized parameter calculated in reverse order of time series X. If there is an intersection point between the two curves of UFk and UBk, and the point is between the U_α, the point corresponding to the abrupt change point.
Results and Discussion
Primary Productivity in the Amundsen Sea
The mean value (Figure 2A) and seasonality amplitude (the difference between maximum value of monthly mean and minimum value of monthly mean) (Figure 2B) of primary production in the Amundsen Sea were calculated using the data obtained from GLORYS2v4. The spatial differences existed in the Amundsen Sea, and the mean primary production values of the Amundsen Sea ranged from 1.5 to 14 mgC m-3 day-1. In most areas, the mean value was less than 3 mgC m-3 day-1. The primary production was largest in Pine Island Bay, and minimum values occurred on the two areas adjacent to of Pine Island Bay, with a mean value of less than 2 mgC m-3 day-1. This distribution was consistent with other studies about primary production in the Amundsen Sea (Park et al., 2019). The seasonality amplitude of primary production (Figure 2B) ranged from 10 to 100 mgC m-3 day-1 and showed some similar spatial characteristics with the mean values, the amplitude was also largest in Pine Island Bay. However, the spatial variations in the seasonality amplitude were more complicated than those of the mean value. The seasonality amplitude was not the smallest in the two areas adjacent to Pine Island Bay, featuring a mean value less than 2 mgC m-3 day-1.
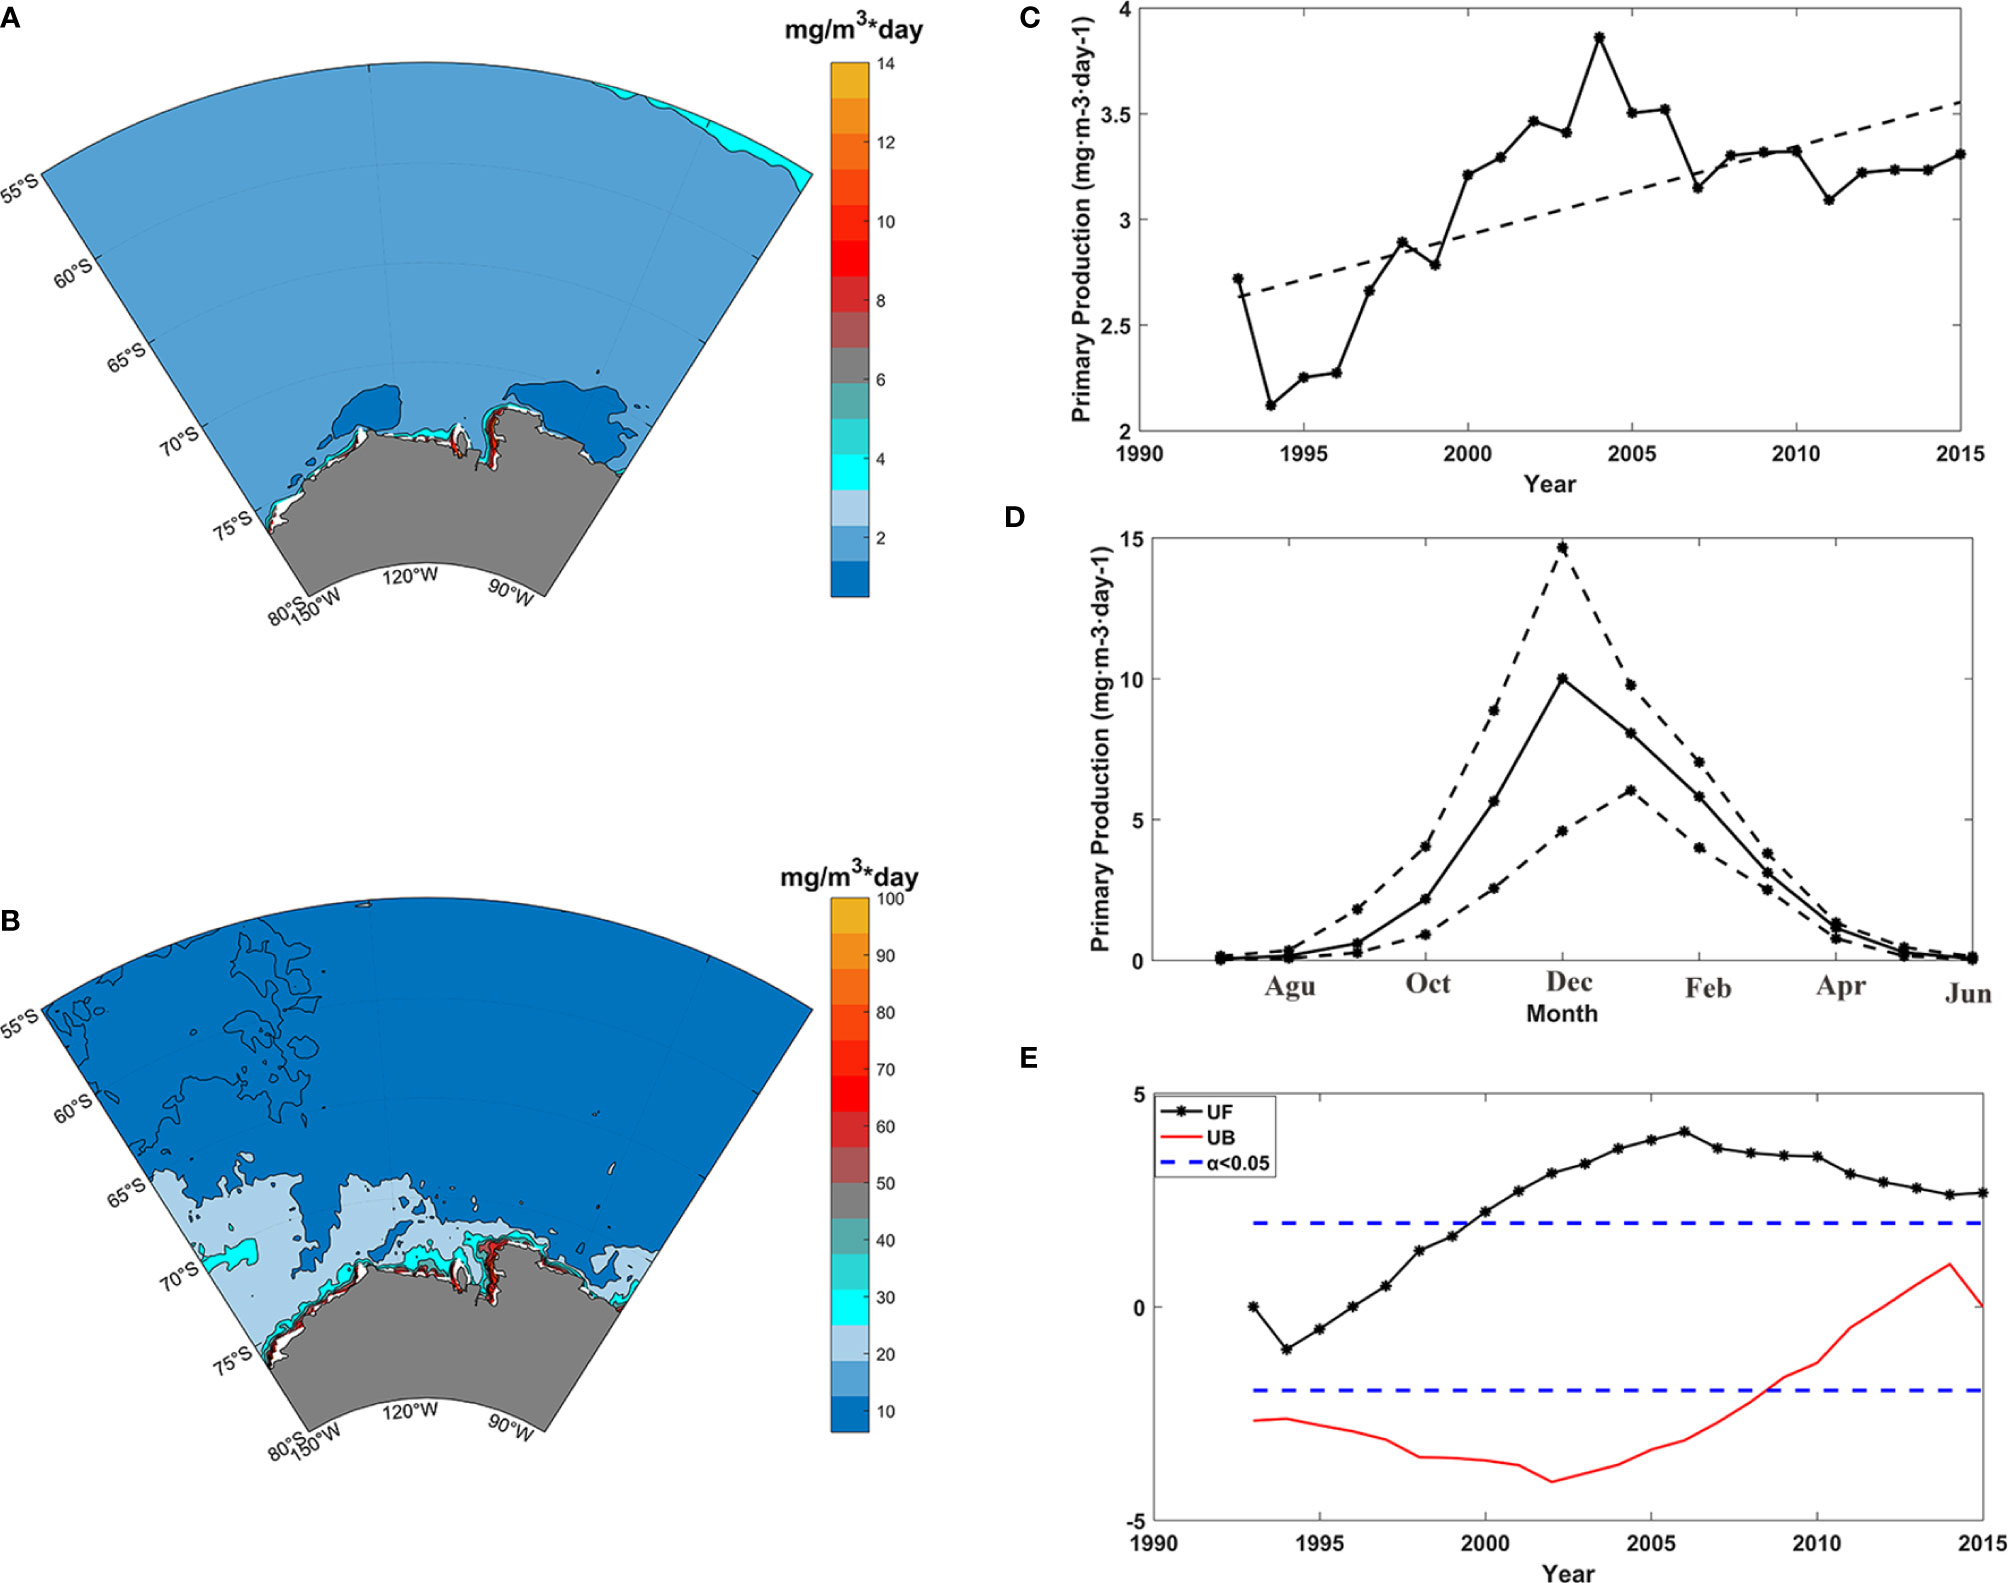
Figure 2 Primary production in the Amundsen Sea, (A) mean value of primary production from 1993 to 2015; (B) seasonality amplitude of primary production; (C) annual values of (black line) and long-term changes in (black dashed line) primary production; (D) MK-values (y-axes) obtained from the sequential Mann-Kendall test against time for annual primary production, the black line represents the progressive UF(t) and the red line represents the retrograde UB(t); (E) monthly primary production values (black line) and amplitudes of the monthly values (black broken line).
The annual primary production showed an increasing trend from 1993 to 2015 (Figure 2C). The primary production was relatively high from 2000 to 2006; reached a maximum in 2004, and displayed low values from 1993 to 1996; a minimum occurred in 1994. Furthermore, the progressive UF(t) and the retrograde UB(t) series of the sequential Mann-Kendall test (Mann, 1945) were calculated against time for the annual mean primary production (Figure 2E). The results showed that primary production featured an increasing trend in general. The positive trend was significant after 1999, and no abrupt change existed in the annual primary production. Primary production exhibited clear seasonal variability (Figure 2D), it began to increase in August, reached a maximum in December, and began to decrease after December. From April to September, the primary production was less than 2 mgC m-3 day-1. The monthly primary production varied greatly in the summer months, and the amplitude was largest in December (ranging from 4.5 to 14.5 mgC m-3 day-1). Above results were consistent with previous studies using observations (Arrigo and van Dijken, 2003; Park et al., 2017; Lim et al., 2019; Kwon et al., 2021), and enhanced the confidence in the data quality and in the analysis.
Bioregion Classification and Characterization
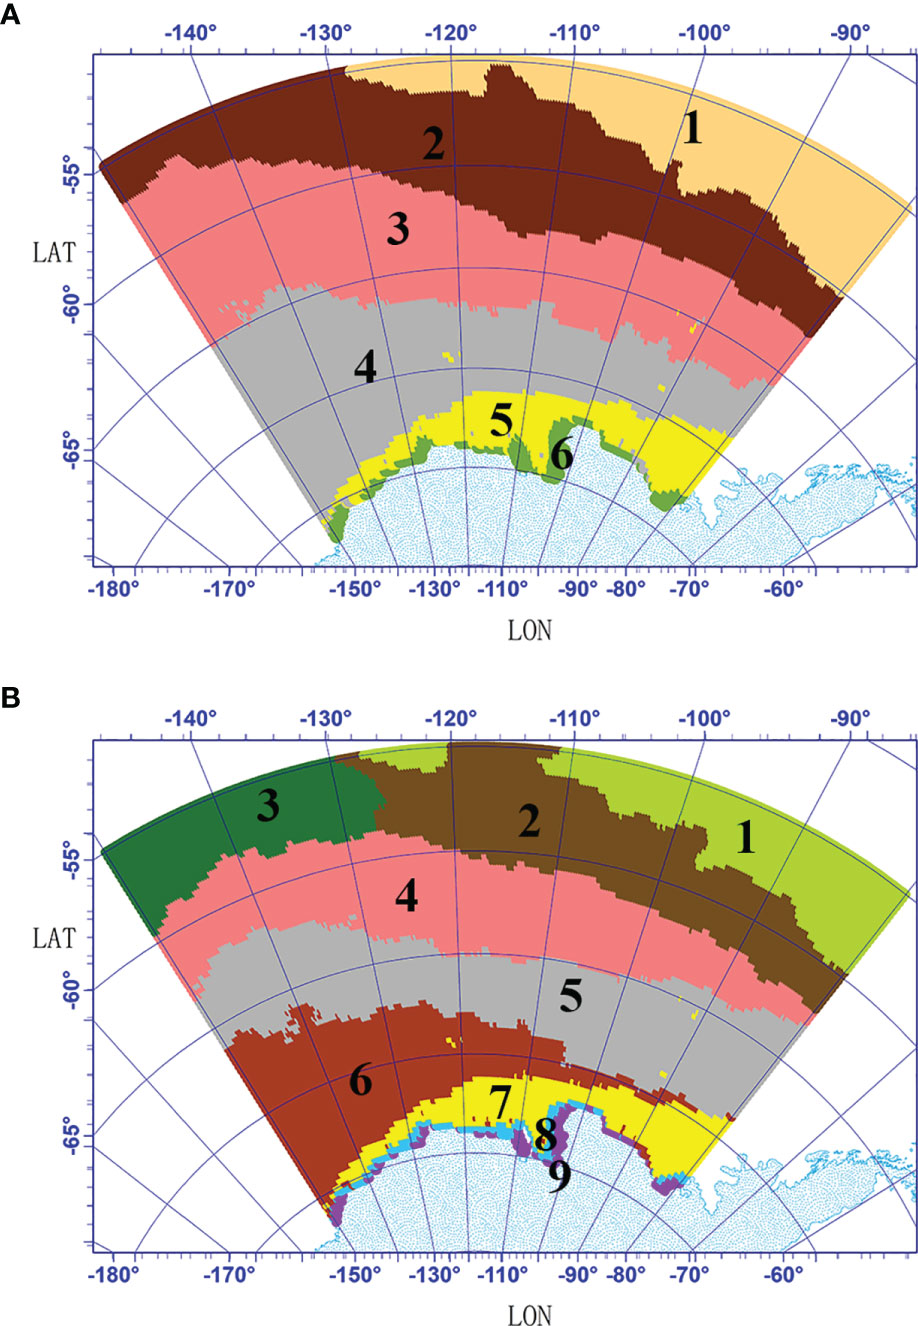
To obtain the number of clusters (K), hierarchical clustering was carried out in the Amundsen Sea by computing the similarity of all the pixel at the mean values. The dendrogram obtained from the hierarchical clustering algorithm was used to guide the clustering process (Figure 3). Norse (2010) indicated that if K is too large, important details are overlooked; if K is too small, the result is an unmanageable number of decision-making groups. To obtain a more reasonable result, K-means cluster analyses were carried out twice (K=6 and K=9) (Figure 4). The results show that spatial distribution had similar characteristics between the K=6 and K=9 results. But differences also existed, when K=9 was selected, the coastal area was divided into 2 bioregions (9-8 and 9-9). When K=6 was selected, the coastal area was divided into 1 bioregion (6-6). The northern boundary area was divided into two bioregions (6-1and 6-2) when K=6, while it was divided into three bioregions (9-1, 9-2, and 9-3) when K=9. When K=6, the central region was divided into two bioregions (6-3 and 6-4), and when K=9, the central region was divided into three bioregions (9-4, 9-5, and 9-6). For comparison, the mean values of the variables in different bioregions were calculated (6-6, 9-8 and 9-9; 6-2, 9-2, and 9-3) (Table 2). The results showed that the differences in the physical variables were small among bioregions 6-6, 9-8, and 9-9, while the differences in the biological variables were quite pronounced. The mean values of chl and nppv were significantly smaller in the 9-8 bioregion than those in the 6-6 and 9-9 bioregions. The differences in biological variables among bioregions 6-2, 9-2, and 9-3 were small, while the differences in physical variables were quite clear, especially the mlp, ssh, and fice variables. The above results indicated that the bioregions obtained from K=9 can describe the detailed differences in fice, mlp, chl and nppv more clearly than the bioregions obtained from K=6. All these variables are important in a spatial analysis of primary production in the Amundsen Sea; therefore, we ultimately selected the resulting bioregions when K=9.
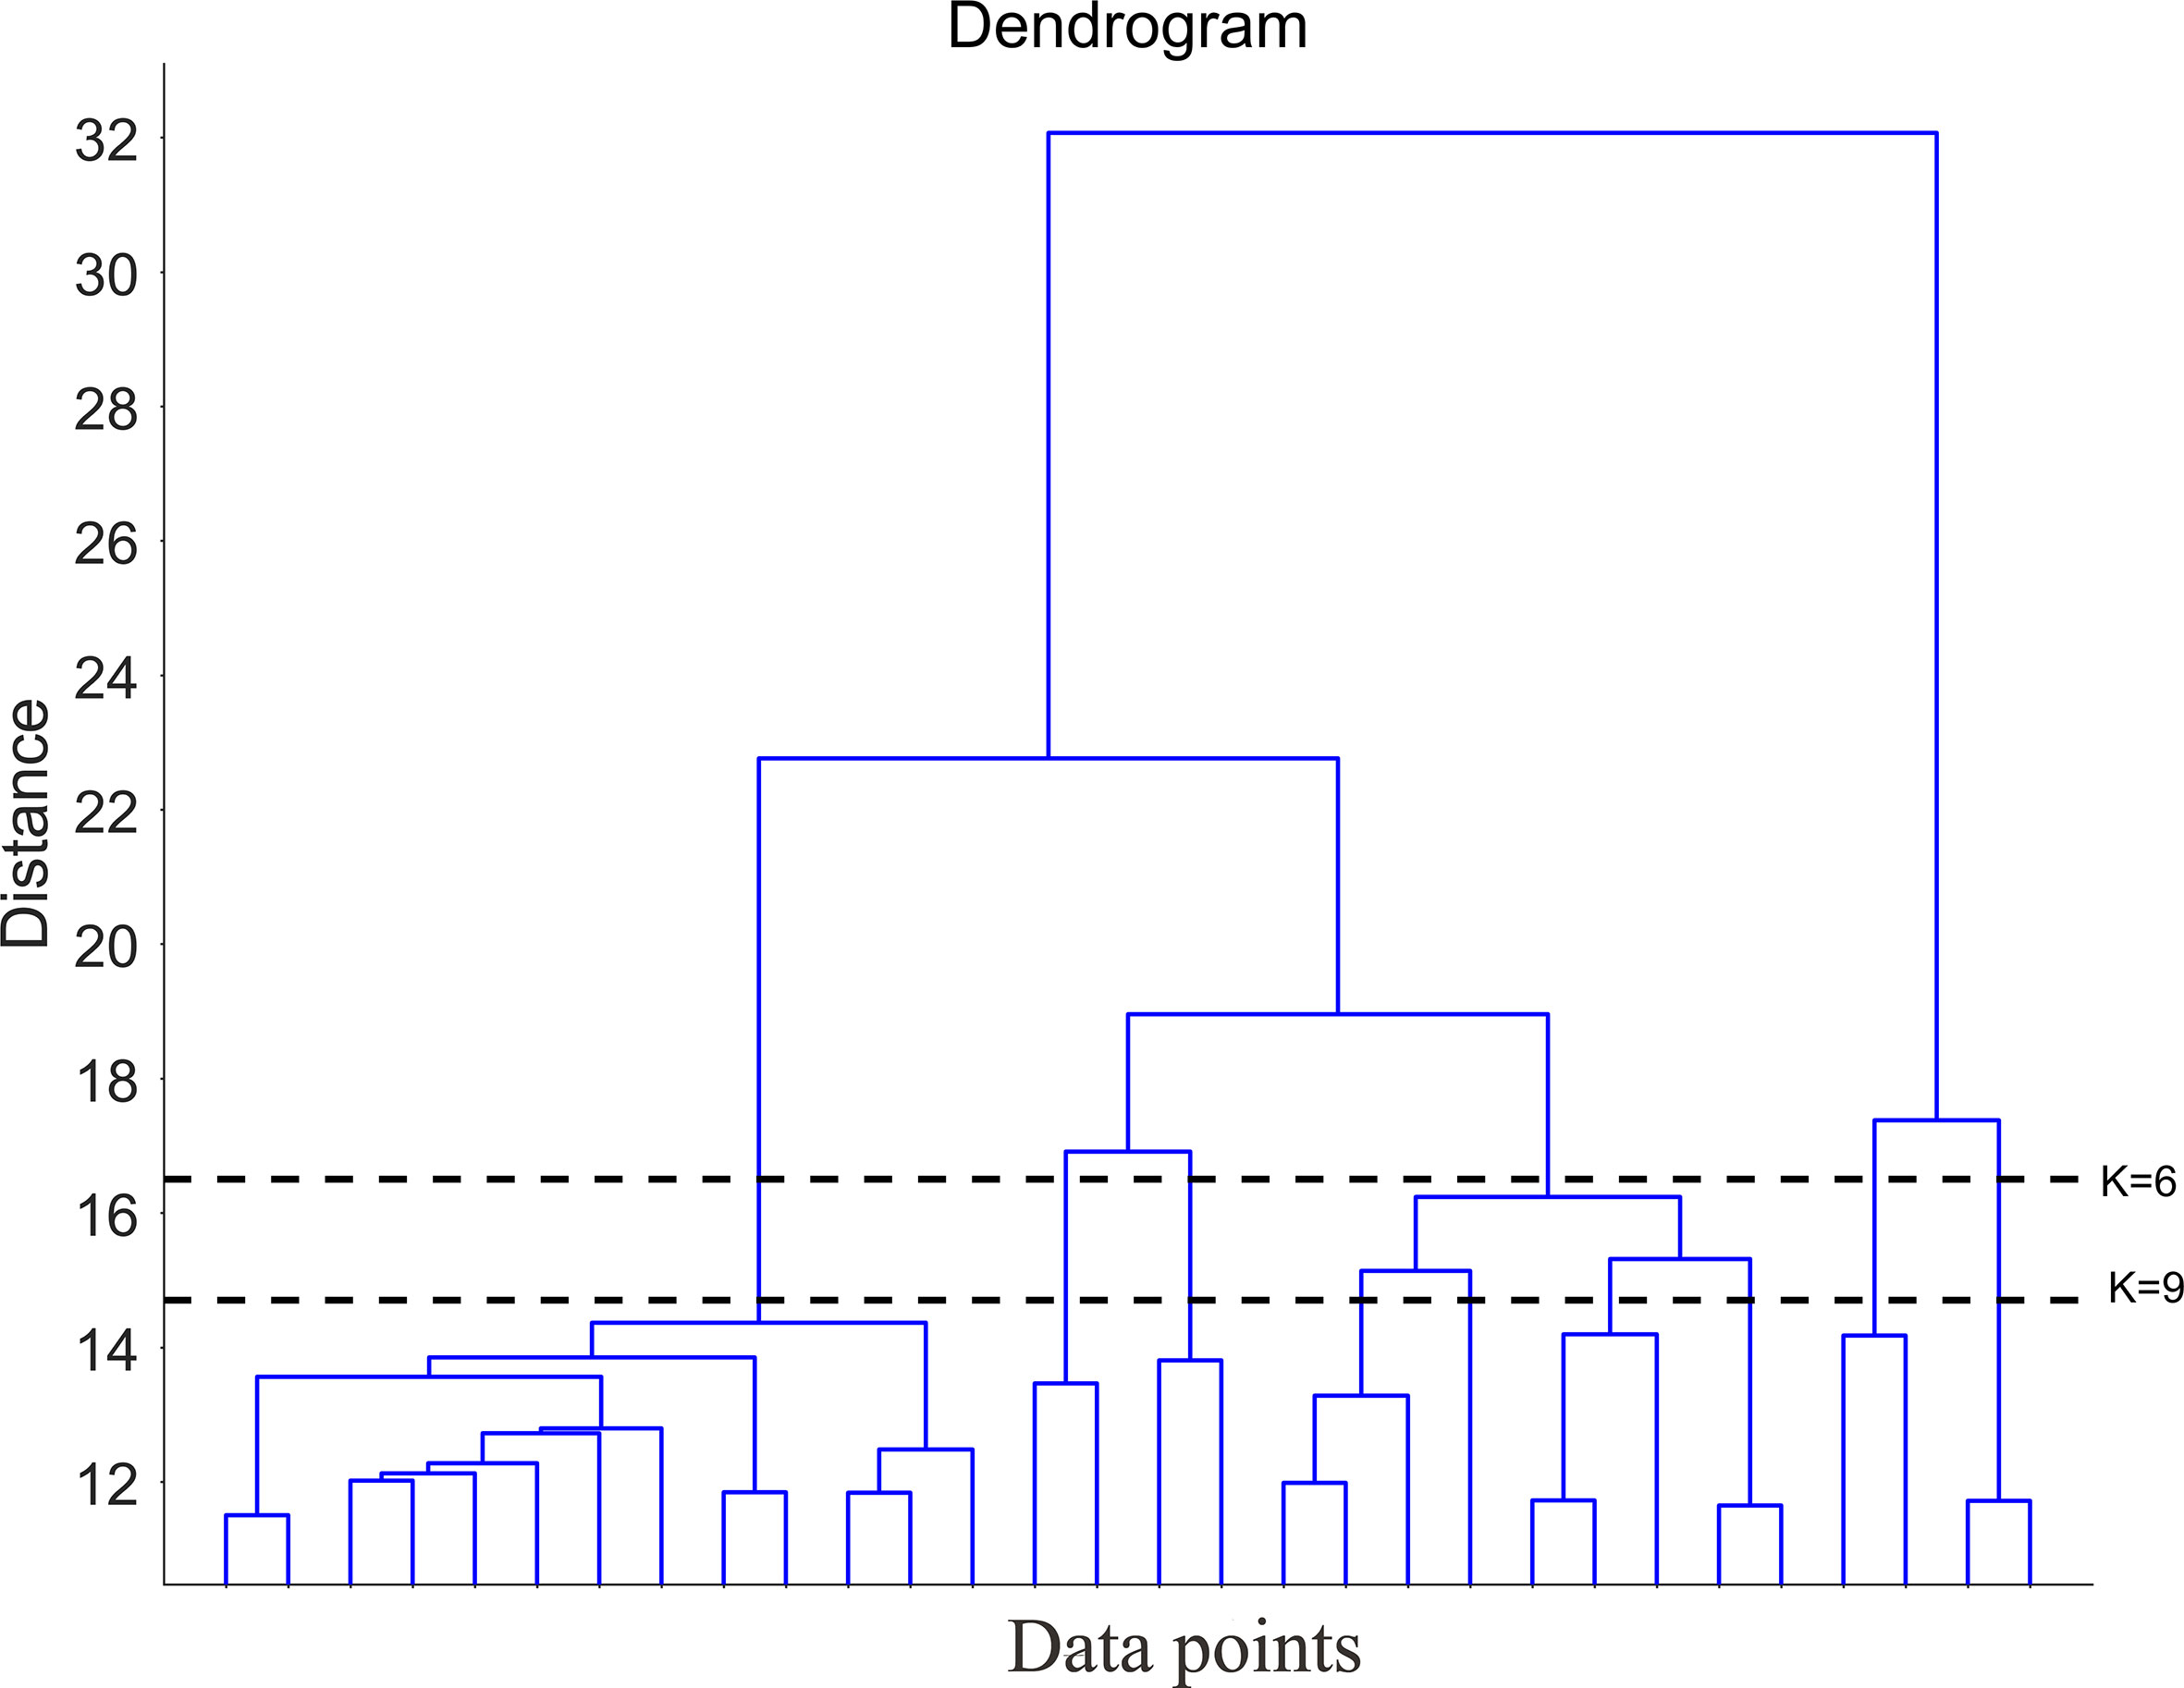
Figure 3 Dendrogram obtained from hierarchical clustering. The dotted lines (K=6 and K=9) show the levels at which the dendrogram was cut to produce the groups.
The parameters that characterize the key properties of each bioregion differed among the bioregions (Supplementary Table S1 and Figure 5). Here, we listed four levels of each parameter to help characterize each bioregion relative to the study area: the maximum value, the second-highest value, the minimum value, and the second-lowest value. Bioregions 8 and 9 are associated with the continental shelf and slope edge down to approximately 300 m. The Amundsen Sea Polynya is located in this region (Swalethorp et al., 2019), and these two bioregions are the areas through which the coastal current flows in the Amundsen Sea (Kim et al., 2016). Bioregions 8 and 9 showed some similar features; they were both distinguished by low tem, low mlp, low sal, high chl, high nppv, high fe, and low dep values. There were also some differences between bioregions 8 and 9; bioregion 9 had the lowest bot value, while bioregion 8 had the second-highest bot value. The fice values of bioregion 8 were higher than those of bioregion 9, the tem values of bioregion 8 were lower than those of bioregion 9, bioregion 9 had the second-highest longitudinal gradient, and bioregion 8 had the second-lowest latitudinal gradient. Although bioregion 8 had the second-highest nppv value, the nppv value of bioregion 9 (8.51 mgC m-3 day-1) was much higher than that of bioregion 8 (5.86 mgC m-3 day-1).
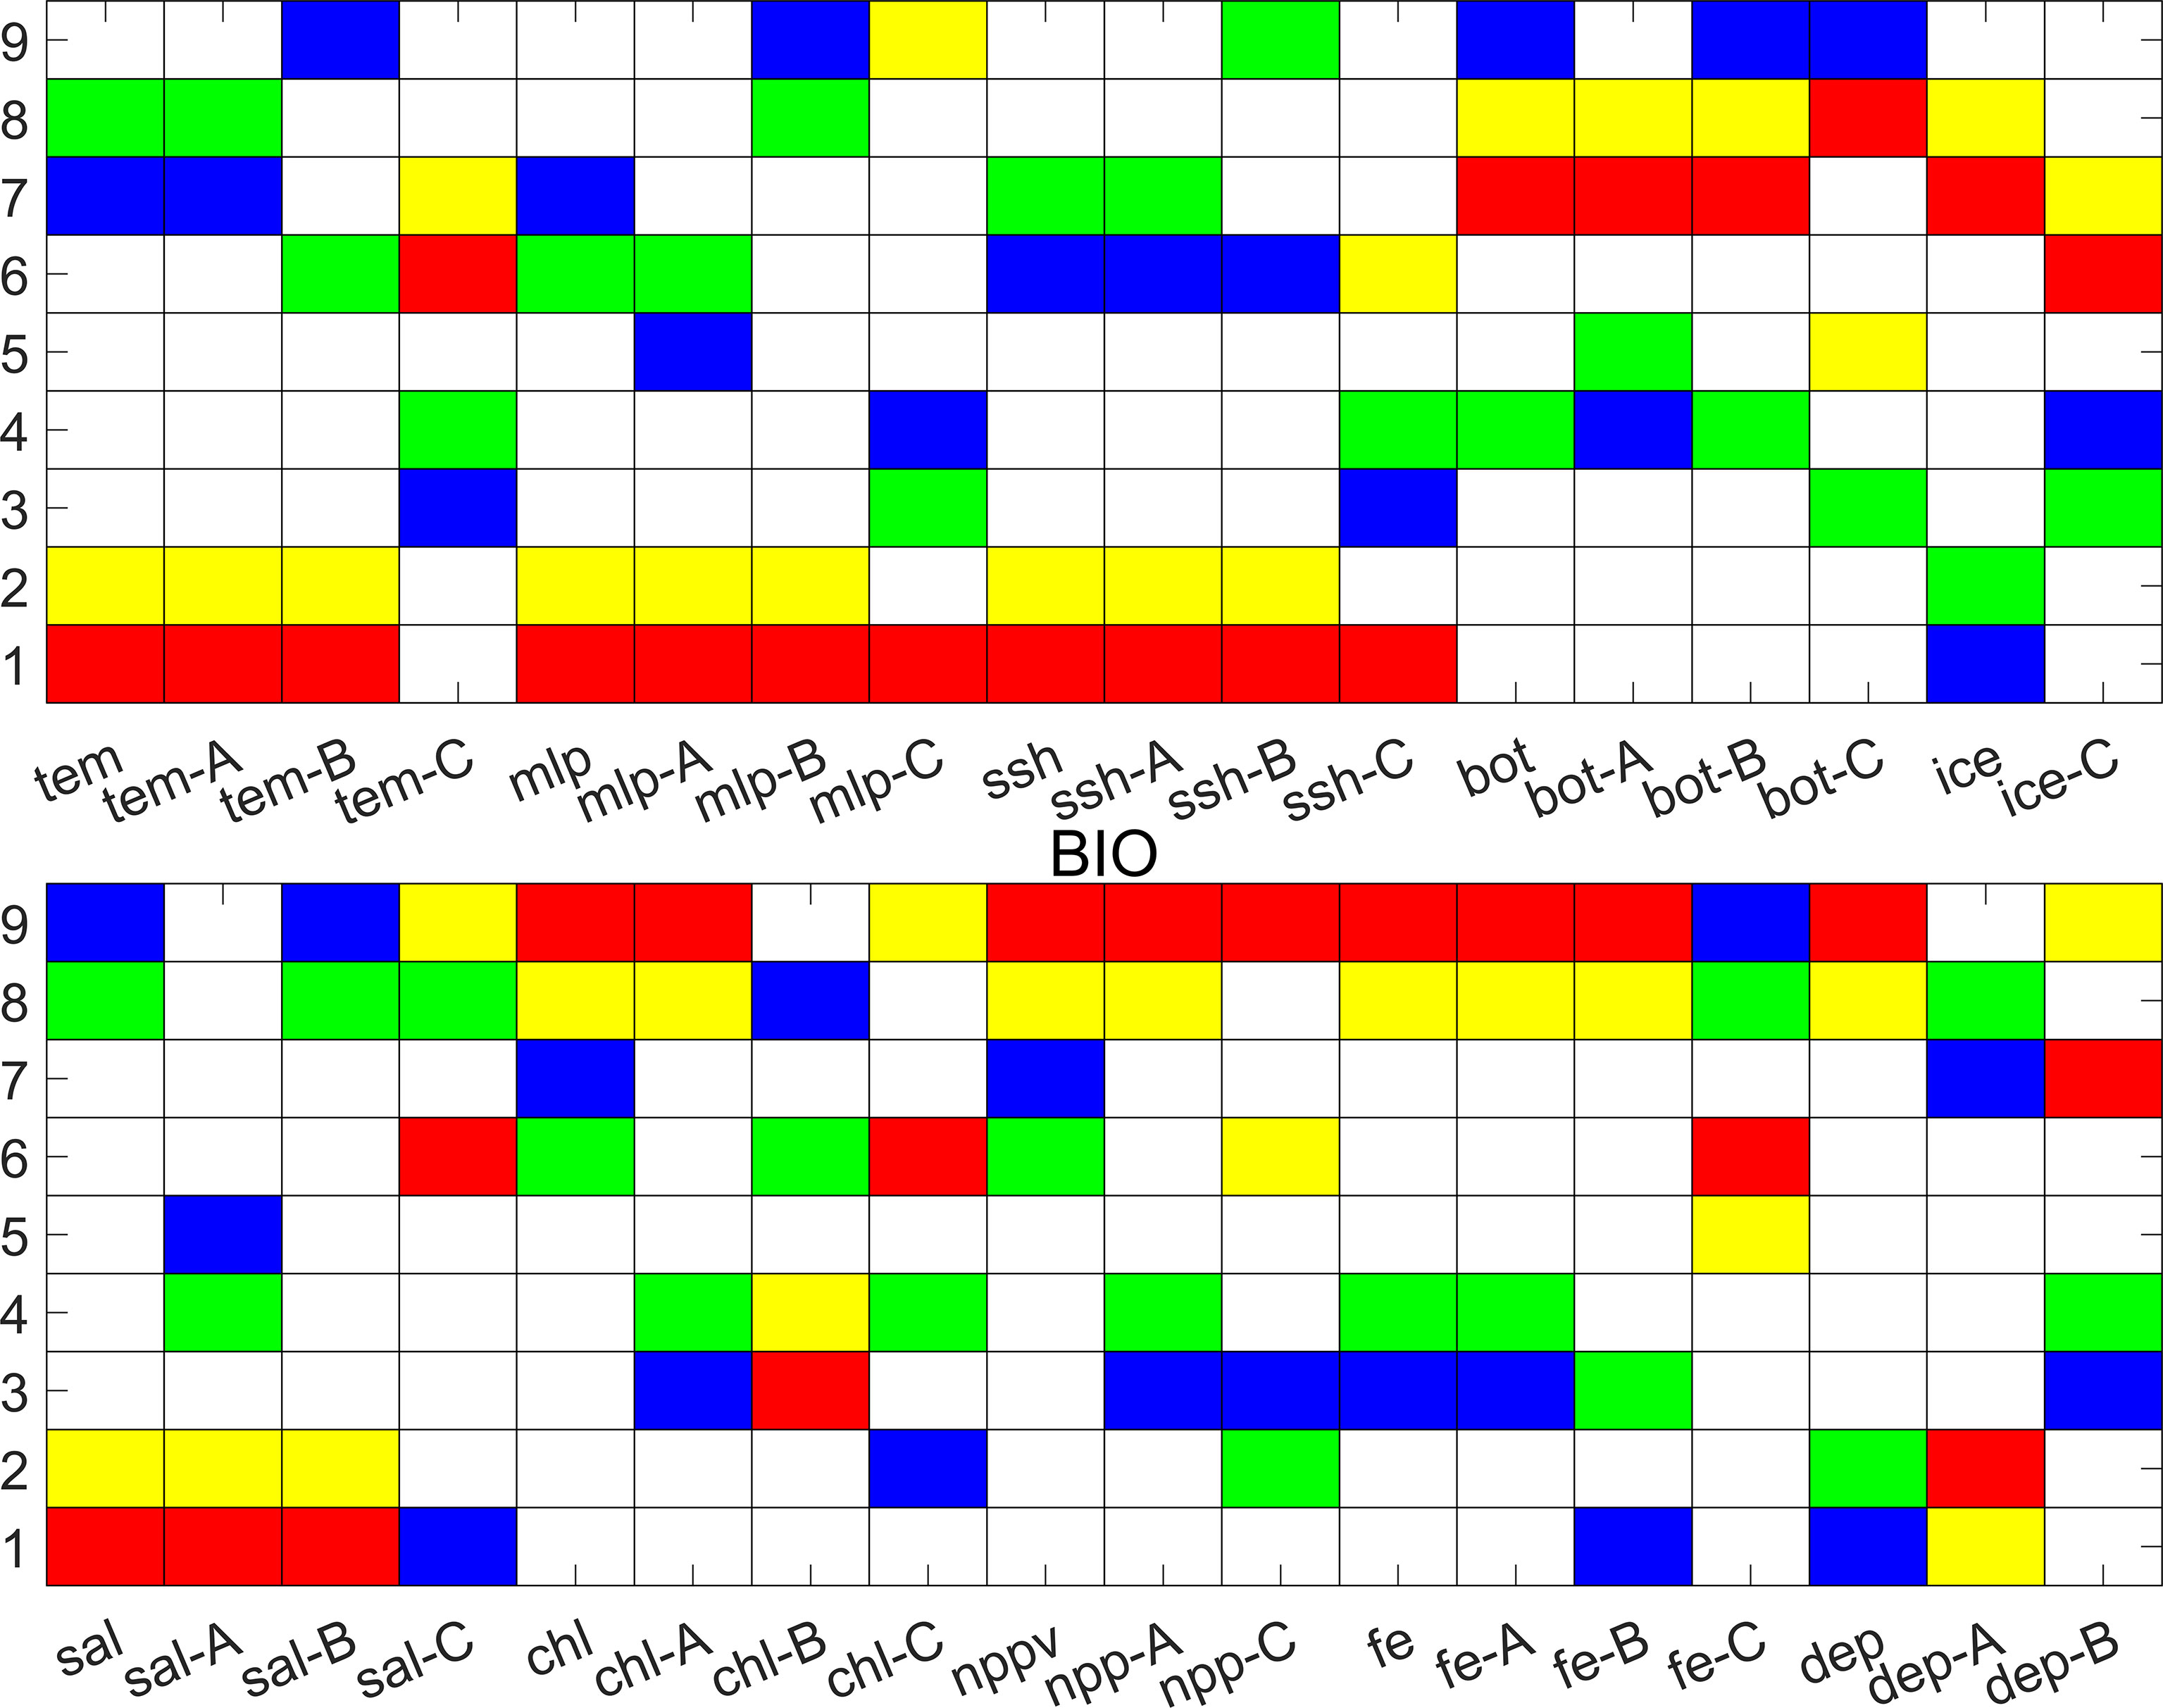
Figure 5 Parameters that characterize the key properties of bioregions, showing the maximum value (red), the second-highest value (yellow), the minimum value (blue) and the second-lowest value (green) of each parameter, including the annual maximum mean (A), annual minimum mean (B), and long-term change rate (C) (dep-A: latitudinal gradient, dep-B: longitudinal gradient).
Bioregion 7 was located within the continental slope, and its boundary was mostly consistent with the Antarctic Slope Front (Martinson, 2012). Bioregion 7 was distinguished by the lowest tem, lowest mlp, second-lowest ssh, highest bot, highest fice, lowest chl, and lowest nppv, the lowest latitudinal gradient and highest longitudinal gradient. In this bioregion, Circumpolar Deep Water (CDW) intrudes onto the shelf, after which it mixes with surrounding water and masses to become Modified Circumpolar Deep Water (MCDW) (Arneborg et al., 2012). MCDW is a potential source of dissolved iron fueling primary productivity in bioregions 8 and 9 (St-Laurent et al., 2017; Dinniman et al., 2020).
Bioregions 1, 2, 3, 4, 5, and 6 were located in the abyssal plain. Bioregion 6 was distinguished by the second-lowest mlp, the lowest ssh. Bioregion 6 was therefore assumed to be closely associated with the Ross Gyre (Dotto et al., 2018). The Ross Gyre is formed by the interaction between the Antarctic Circumpolar Current and the Antarctic Continental Shelf and rotates clockwise. The northern boundary of bioregion 5 mostly consisted of winter sea ice (Comiso et al., 2003). Bioregion 4 was distinguished by the second-lowest bot, the second-lowest fe, and the second-lowest annual maximum chl values. The sea ice of bioregion 4 decreased from 1993 to 2015 (Table S1), and the rate of sea ice decrease was the largest in bioregion 4 among all bioregions. Bioregions 1, 2, and 3 were located at the northern boundary of the study region, and these bioregions are the areas through which Antarctic Circumpolar Current flows. Bioregion 1 was distinguished by the highest tem, the highest mlp, the highest ssh, the lowest fice, the highest sal and the lowest dep values. Bioregion 2 was distinguished by the second-highest tem, the second-highest mlp, the second-highest ssh, the second-lowest fice, the second-highest sal, and the second-lowest dep values. Bioregion 3 was distinguished by the lowest fe value the lowest longitudinal gradient, and the lowest long-term change rate of tem.
The above results indicated that the bioregions differed in their physical and biological characteristics (including primary productivity). These bioregions can be used to study the temporal and spatial variations in primary productivity in the Amundsen Sea. Furthermore, the 9 bioregions had biophysical significance; therefore, they are also useful for systematic conservation planning of marine protected areas (MPAs) in the Amundsen Sea (Fraschetti et al., 2008; Treml and Halpin, 2012).
Variations in Primary Productivity
In the Amundsen Sea, intense phytoplankton blooms occasionally develop, making primary productivity highly variable both temporally and spatially (Moore and Abbott, 2000; Arrigo et al., 2008) (Figure 2B). Our results outlined in section 3.2 indicated that the 9 obtained bioregions can be used to reflect the temporal differences in primary productivity in the Amundsen Sea. The mean value, annual maximum mean, and long-term change rate of primary production were calculated in the 9 bioregions and are shown in Figure 6. The results showed that the mean and annual maximum mean values of primary production in bioregions 8 and 9 were obviously larger than those in other bioregions. This is because the polynyas in the Amundsen Sea are located in bioregion 8 and 9. And the annual maximum mean values of primary production of bioregions 6 and 7 were the third and fourth largest. The long-term change rate of bioregion 9 was the largest, followed by those of bioregions 6 and 7. Therefore, bioregions 6, 7, 8, and 9 were selected as typical bioregions with which to analyze variations in primary productivity in the Amundsen Sea.
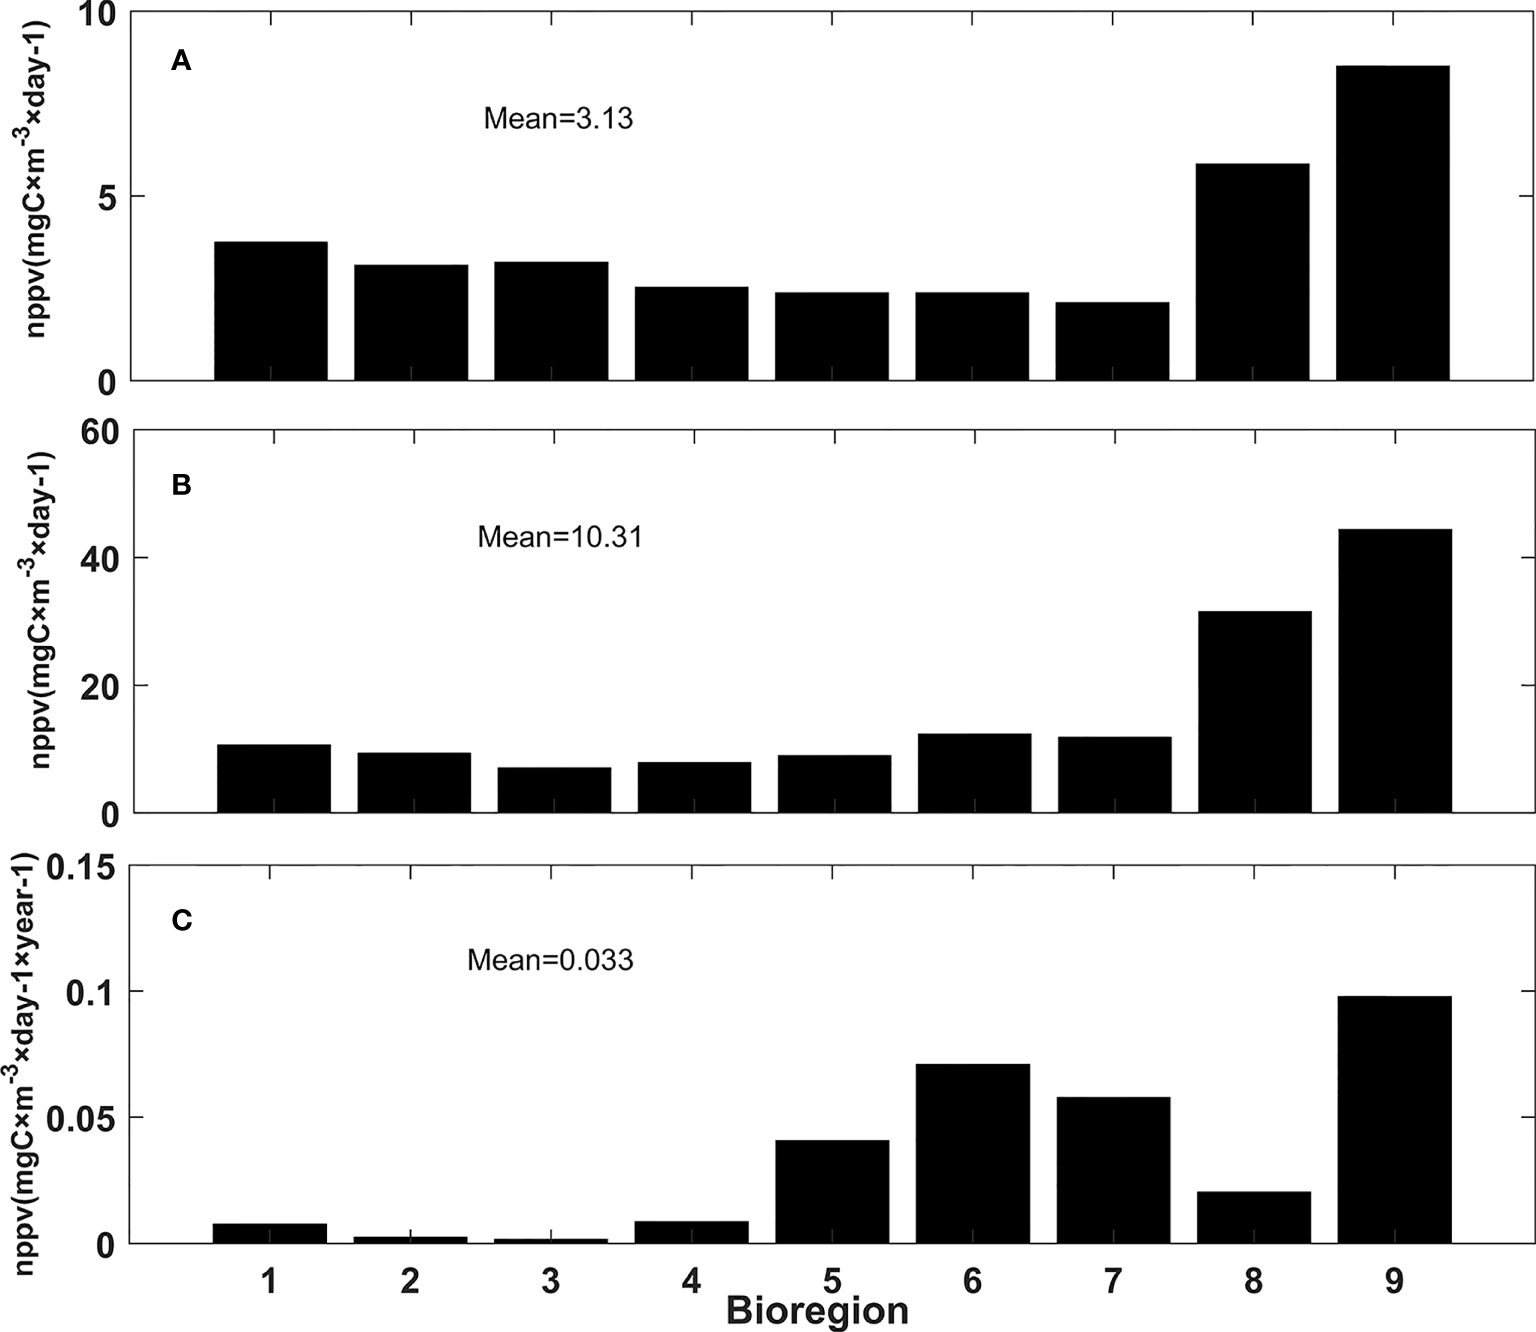
Figure 6 Mean values (A), annual maximum mean values (B), and long-term change rates (C) of primary production in 9 bioregions, the mean value of the whole bioregions was also listed in the figure.
Primary productivity exhibited clear seasonal variability in these four bioregions (Figure 7A). The primary production was large from November to March, and the monthly variations were more obviously in bioregions 8 and 9 than in the other bioregions. From April to October, the differences among these 4 bioregions became small, and primary production in these 4 bioregions was less than 1 mgC m-3 day-1. Seasonal variations in primary productivity in the Amundsen Sea were mainly caused by changes in net solar radiation, sea ice, and iron (Moore and Abbott, 2000; Stammerjohn et al., 2015; Wu and Hou, 2017; St-Laurent et al., 2019). In the Amundsen Sea, the sea ice coverage increased after March and reached a maximum value in austral winter (Figure 7B). After September, the sea ice coverage decreased and reached a minimum value in austral summer. The production of meltwater, the generation of a stratified surface layer, and the release of biogenic elements (such as iron) increased phytoplankton growth and accumulation within the marginal ice zone (Ritterhoff and Zauke, 1997; Smith Jr. and Comiso, 2008; St-Laurent et al., 2019). The net solar radiation of the Southern Ocean has significant seasonal variations and is higher in spring (September to November) and summer (December to February) and lower in autumn (March to May) and winter (June to August). At the same time, sea ice coverage can regulate the availability of irradiance to phytoplankton in the Amundsen Sea. Under the effects of polar night and large sea ice coverage, the primary production was close to 0 from May to September in these four bioregions. Results also showed that the dissolved iron also exhibited clear seasonal variability. The iron reached a maximum in November, and then decreased, it reached its minimum in February (Figure 7C). The seasonal cycles of Fe are dominated by iron scavenging and by remineralization (St-Laurent et al., 2019). In December and January, the primary production increase rapidly and provided a large inventory of sinking biogenic particles, the scavenging increases rapidly during this period. Over the rest of the year, scavenging decreases gradually. From January to June the Fe gradual recovery through remineralization of organic particles or the dissolution/solubilization of surface bound labile particulate iron. Previous studies of the coastal polynya also found that the phytoplankton bloom is primarily light-limited in its early stages, but as the pool of dissolved iron is depleted by phytoplankton uptake, there is a transition towards iron limitation (St-Laurent et al., 2019).
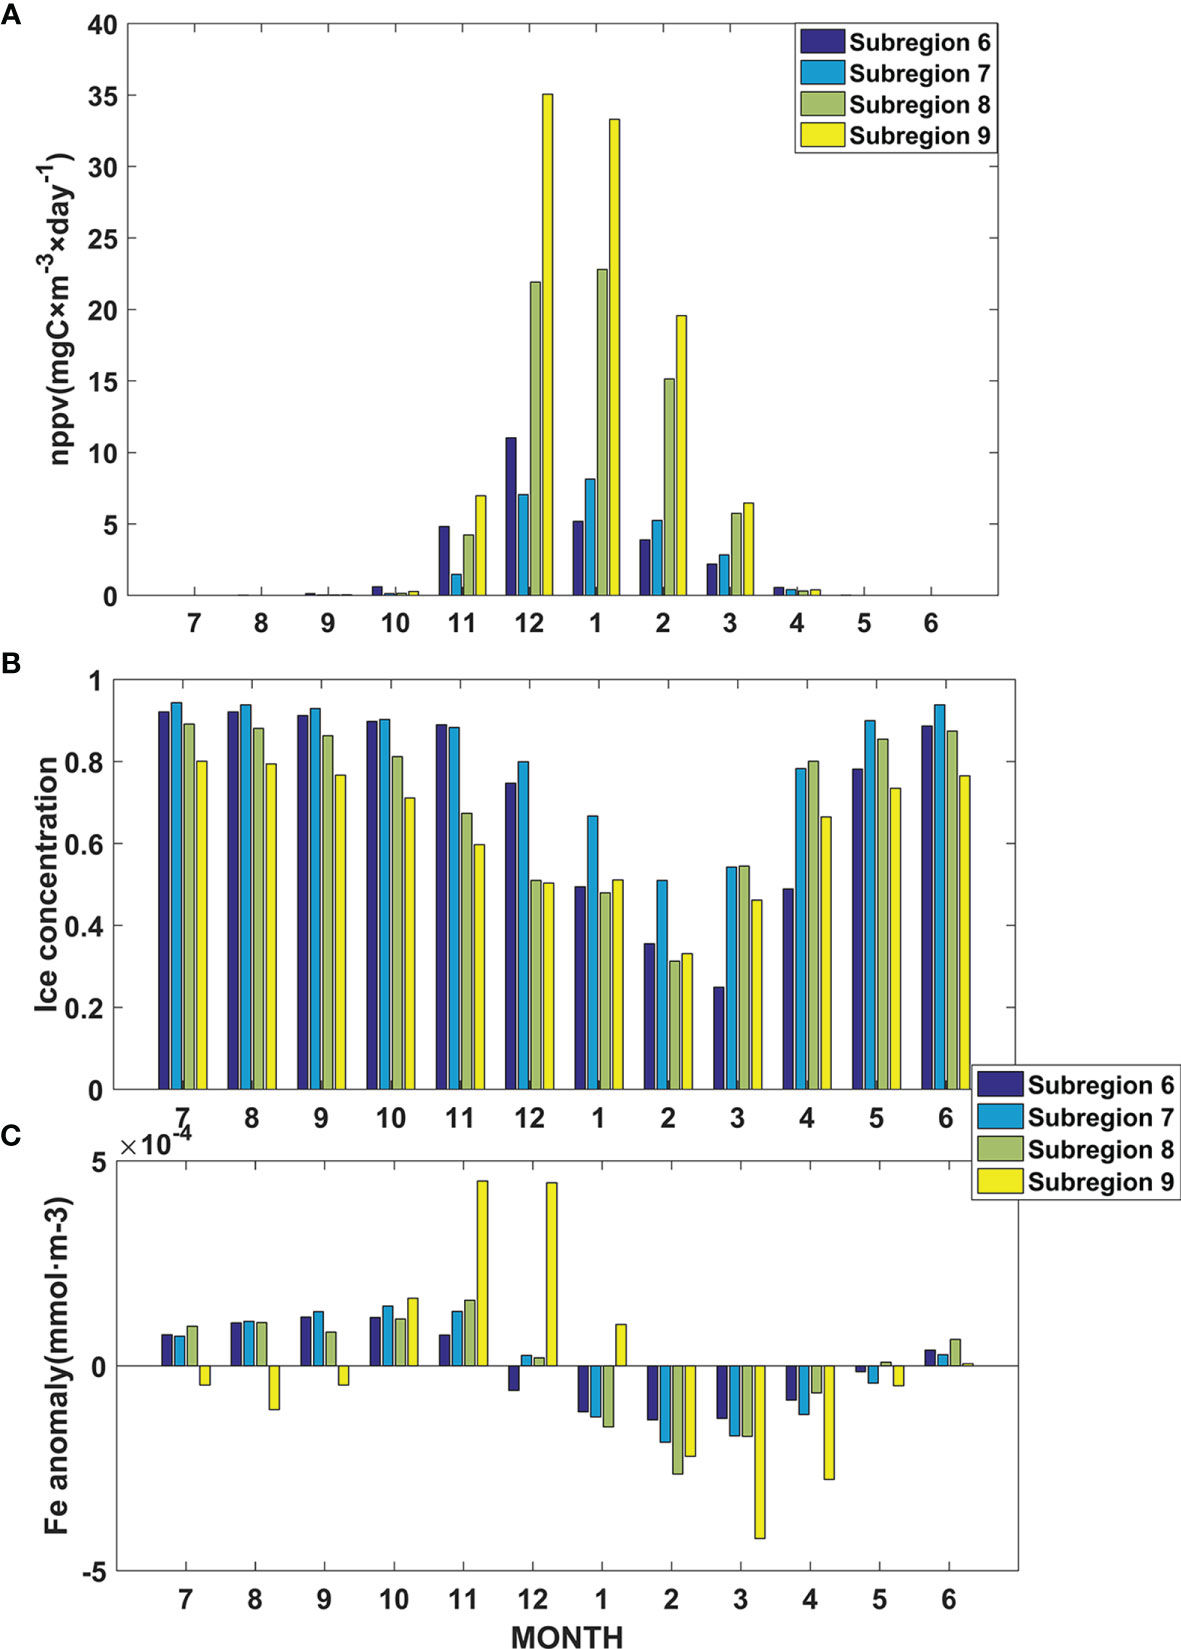
Figure 7 (A) Monthly mean net primary productivity values in bioregions 6, 7, 8, and 9 from 1993 to 2015; (B) Monthly mean ice concentration in bioregions 6, 7, 8, and 9 from 1993 to 2015; (C) Monthly mean dissolved iron anomaly in bioregions 6, 7, 8, and 9 from 1993 to 2015.
The results also showed that the phenology changed over the study period in bioregions 6 and 7 (Figure 8). In bioregion 3, primary production reached a maximum in January before 1998, while after 1998, maximum primary production occurred in December. In bioregion 6, the primary production rates in November and December increased significantly after 1998. In bioregion 7, primary production reached its maximum in January before 2001; after 2001, the maximum primary production occurred in December. In bioregion 7, primary production increased significantly in November and December after 2001. These variations in primary production in bioregions 6 and 7 were thought to be related to the changes in nutrients (Figure 9). In bioregion 6, the dissolved iron concentrations increased significantly in November and December after 1998; these increased values were more than 2 times higher than those recorded before 1998. Increased dissolved iron concentrations resulted in increased primary production in November and December after 1998. In bioregion 7, the dissolved iron concentrations also increased in August, September, November and December after 1998, and the nitrate, phosphate, and silicate concentrations increased significantly in August, September, November and December after 2000.
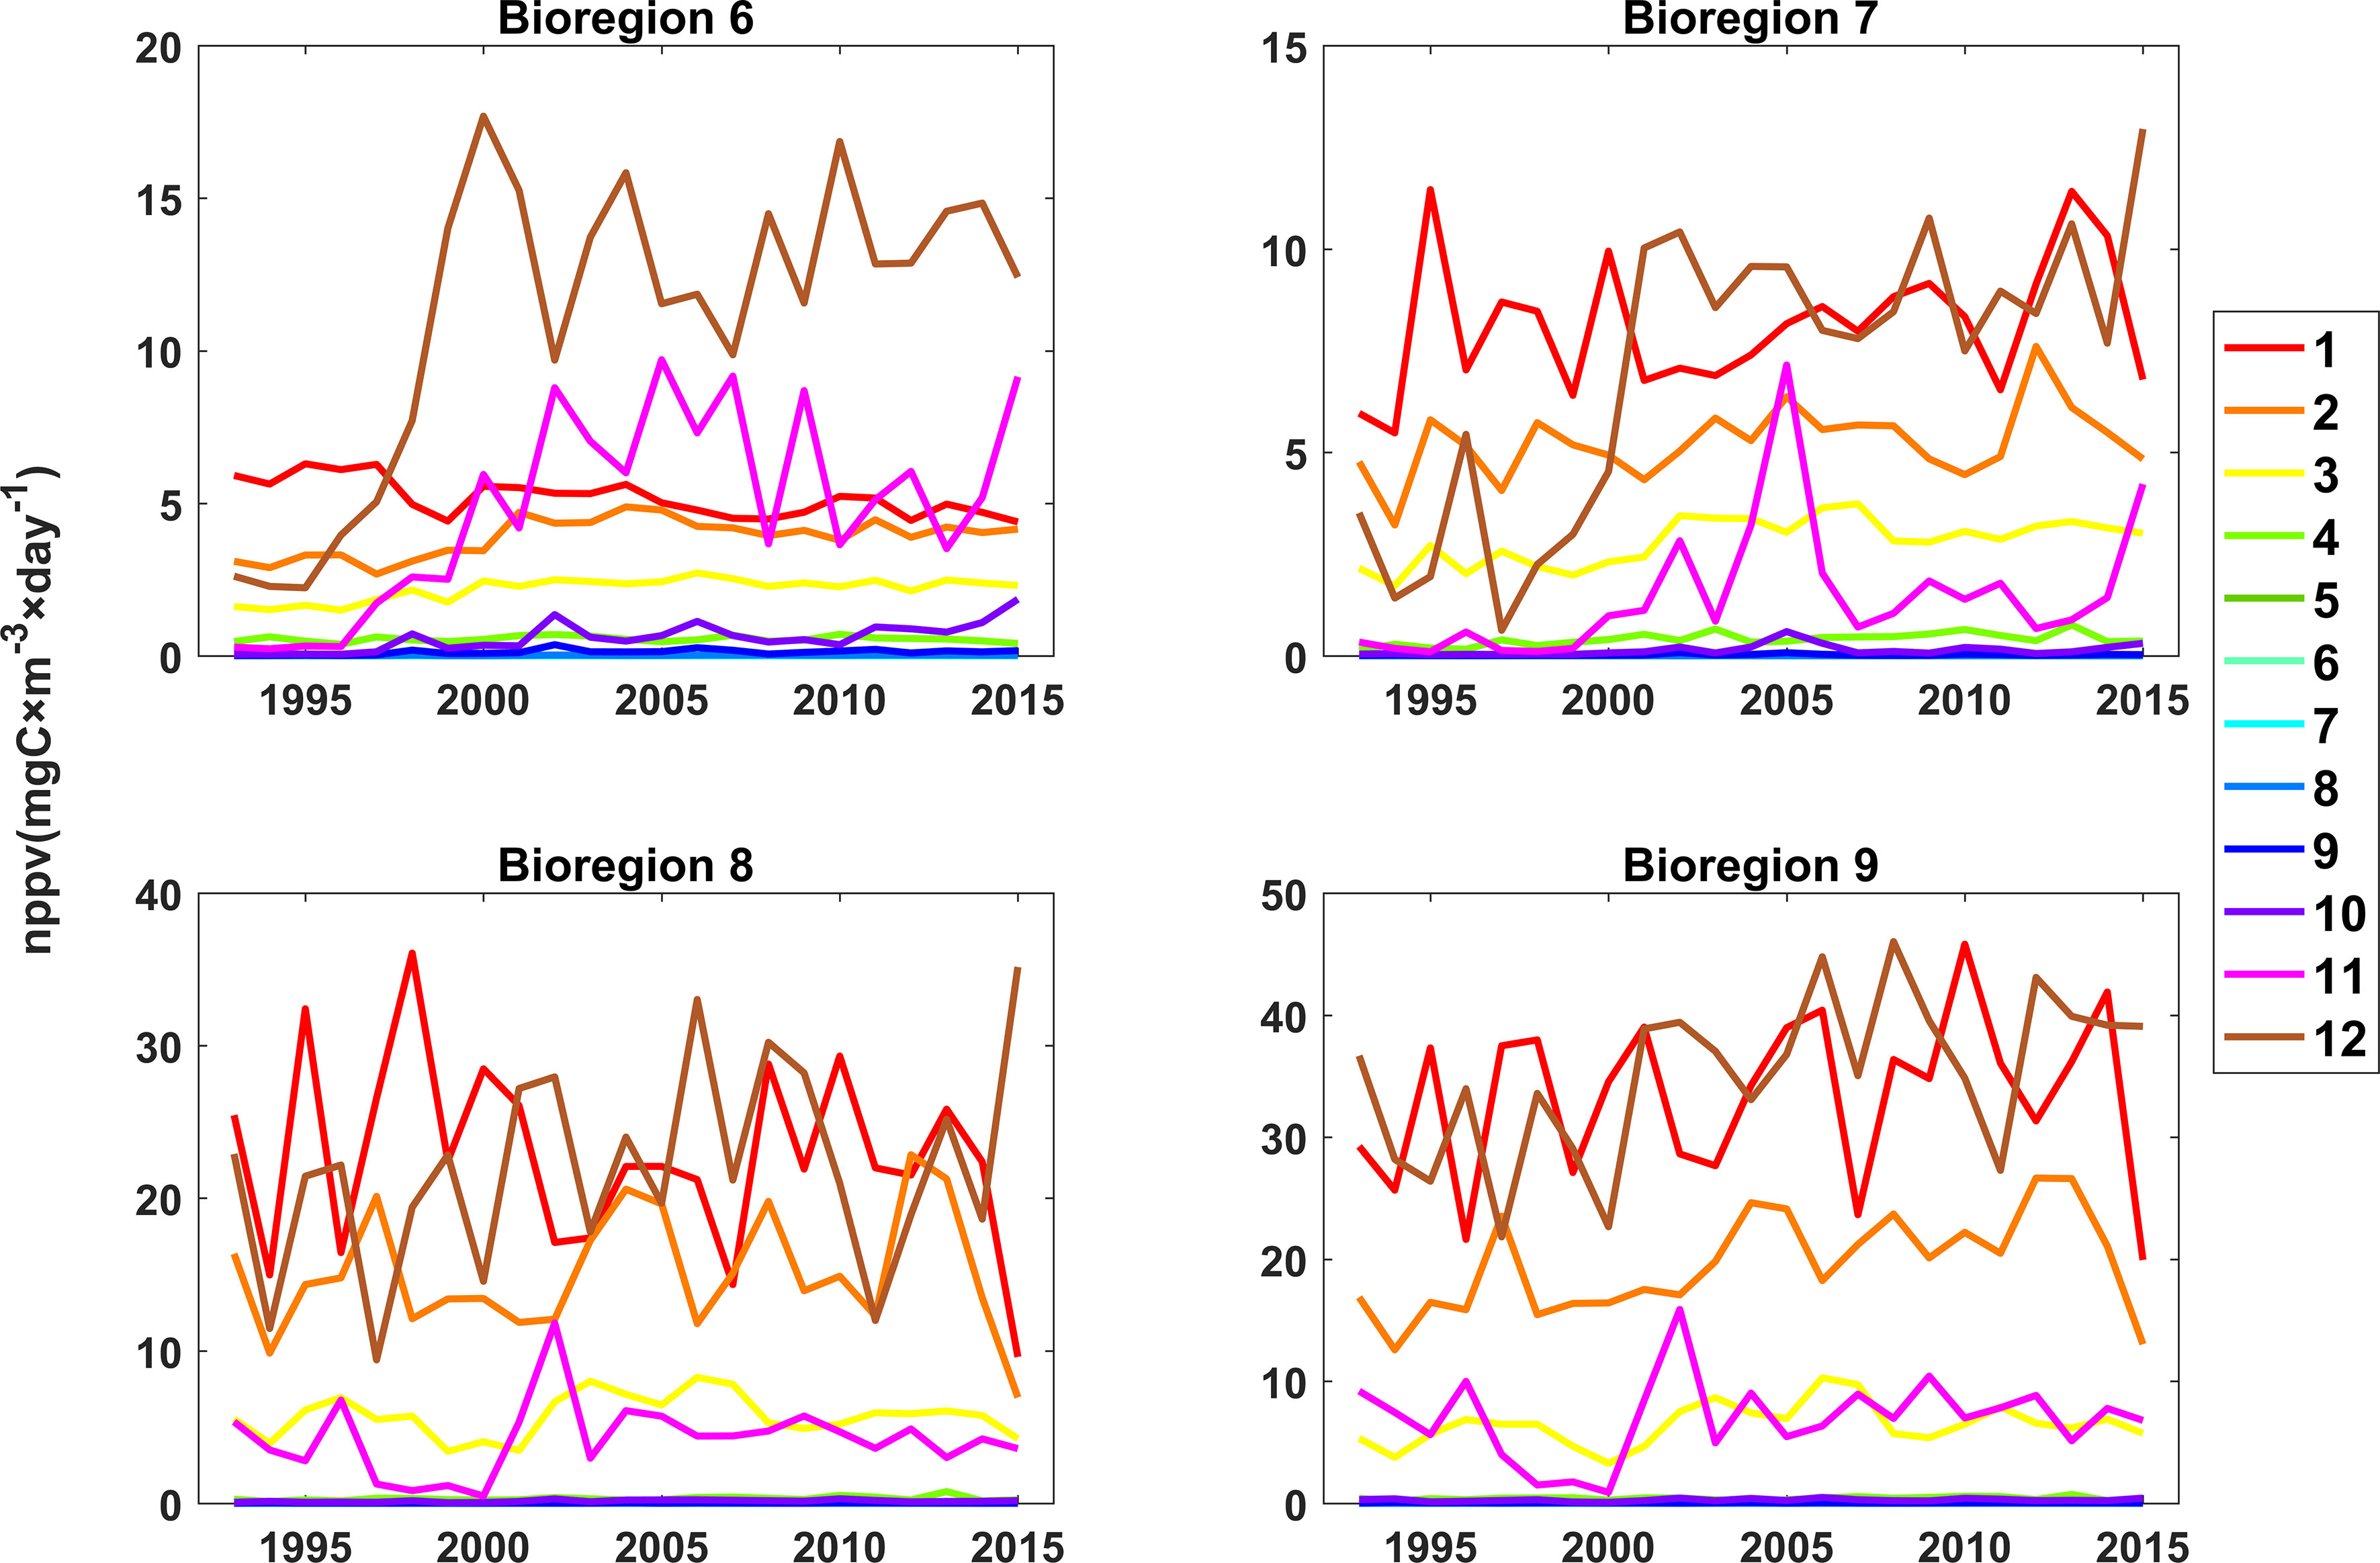
Figure 8 Changes in monthly net primary productivity values in bioregions 6, 7, 8, and 9 from 1993 to 2015 (the colors represent different months).
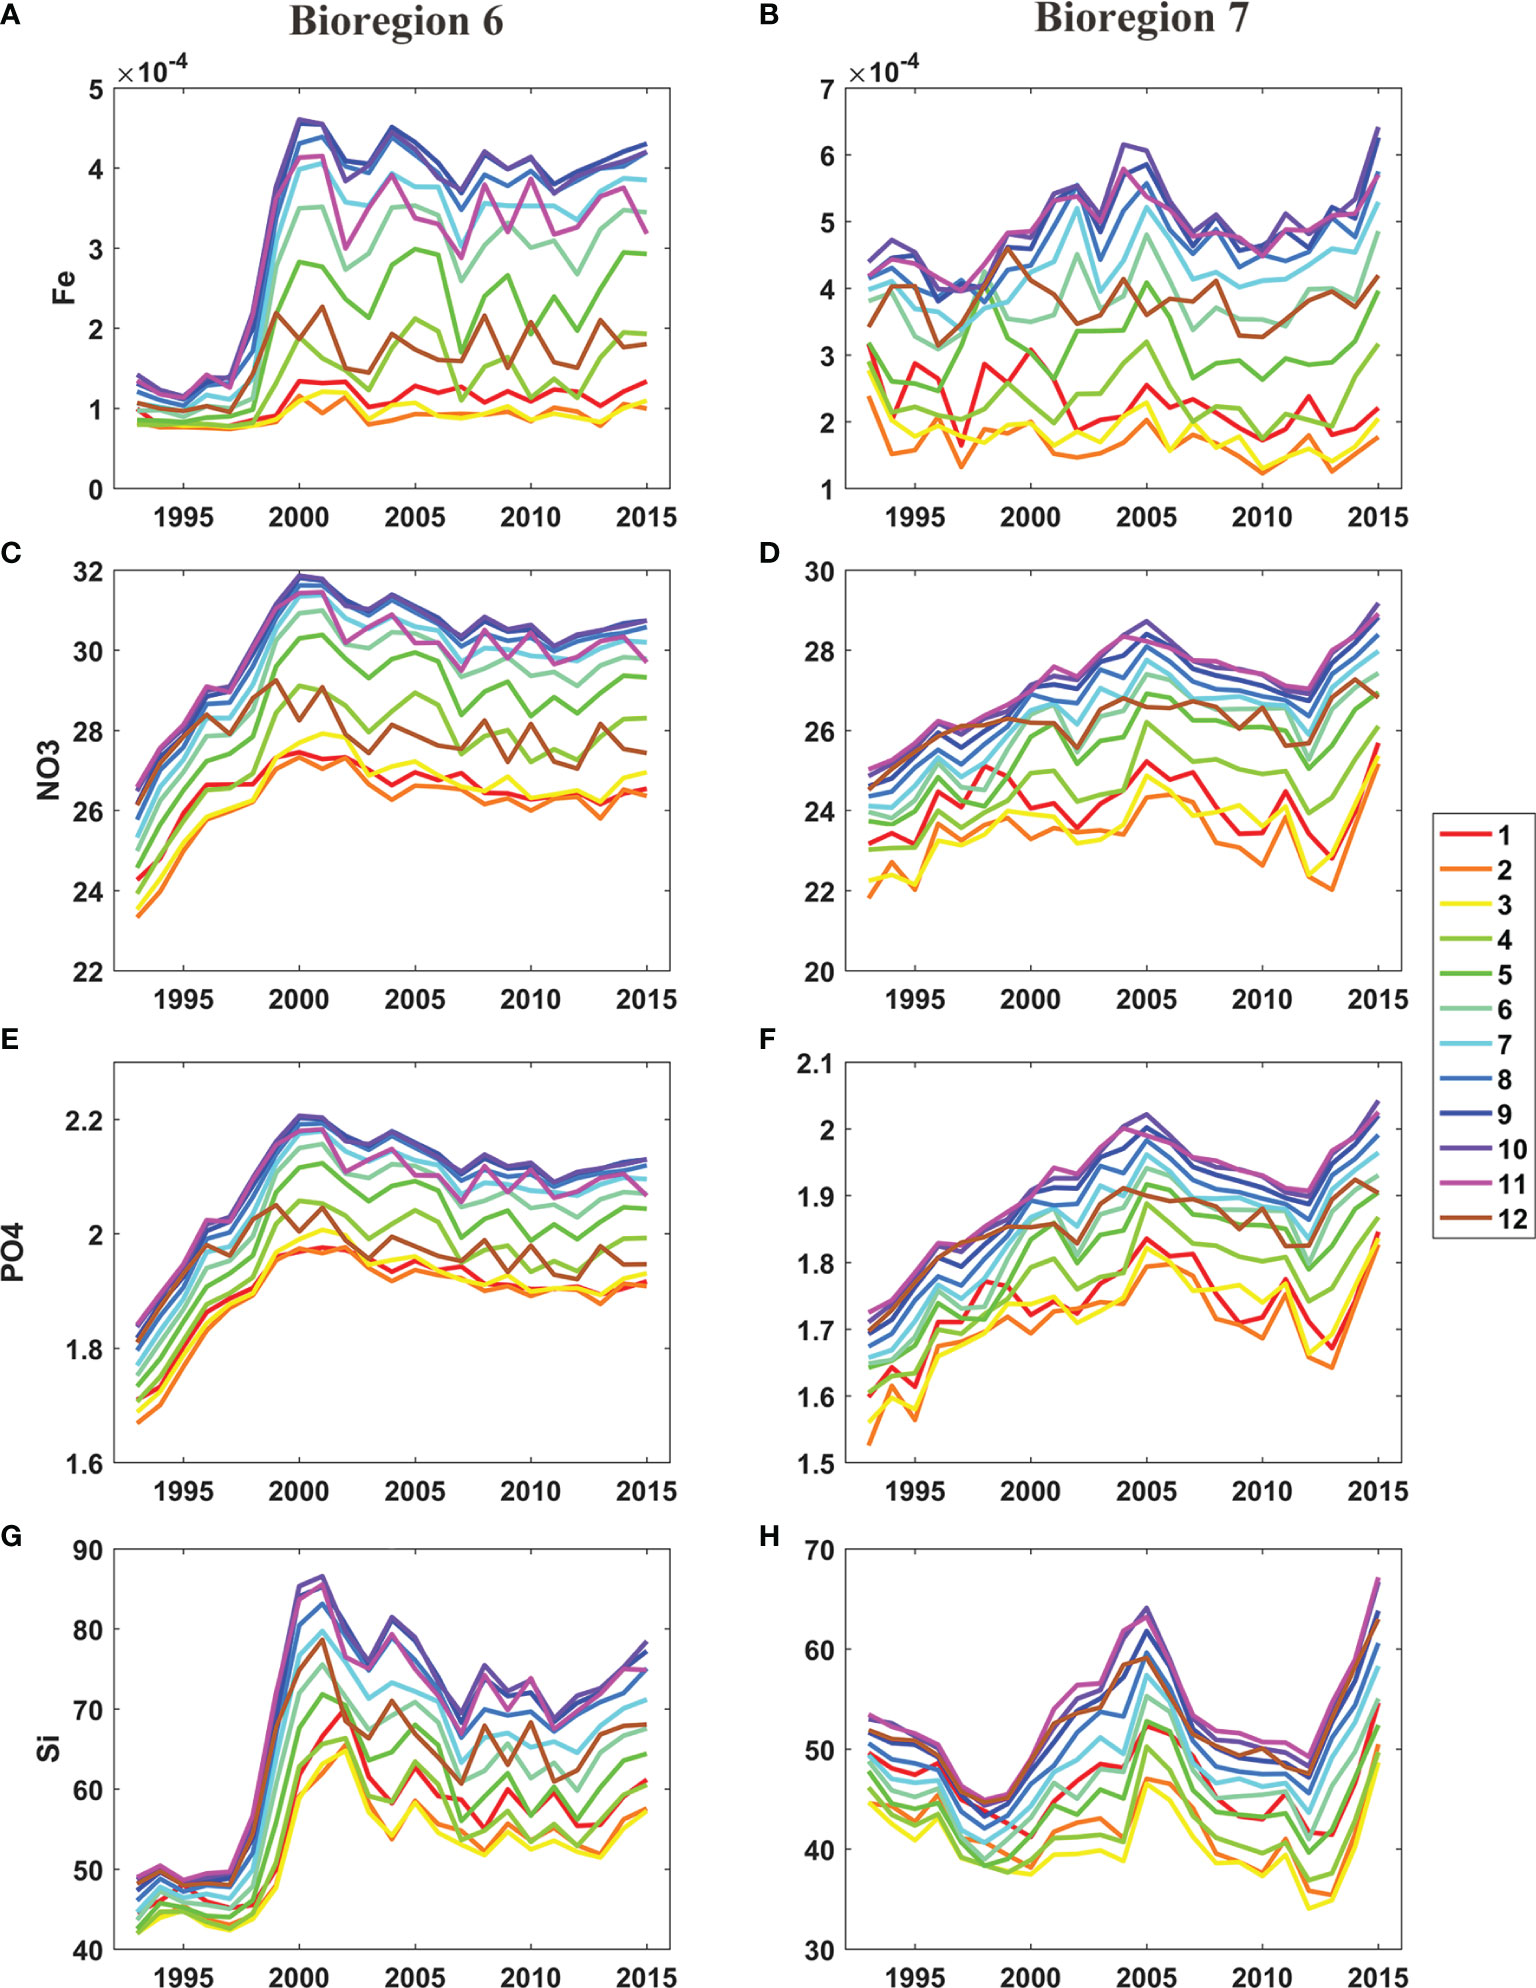
Figure 9 Changes in monthly Fe (A, B) (mmol m-3), monthly nitrate (C, D) (mmol m-3), month phosphate (E, F) (mmol m-3) and monthly silicate (G, H) (mmol m-3) in bioregion 6 (left panels) and 7 (right panels).
The variation of these nutrients was caused by changes of the seasonal cycle of the sea ice in the offshore area in the Amundsen Sea. Stammerjohn et al. (2015) found that the winter ice season duration showed a rapid decrease since 2000 and the summer open duration showed a rapid increase since 2000 in the offshore area in the Amundsen Sea. Previous studies have shown that sea ice coverage in west Antarctica water and in the Amundsen Sea has decreased drastically over the last few decades (Randall-Goodwin et al., 2015; Stammerjohn et al., 2015). On the one hand, the melting sea ice is a potentially important source of dissolved iron, nitrate, phosphate, and silicate (Lannuzel et al., 2010). On the other hand, the melting sea ice can lead to salinity-driven vertical stratification (the “meltwater pump”), it can transport sediment-derived nutrients to the upper water column (St-Laurent et al., 2017; Twelves et al., 2021). Throughout much of the Southern Ocean, macronutrients are abundant and low Fe concentrations limit productivity (Tagliabue et al., 2014). Also, Alderkamp et al. (2015) showed that the primary production is stressed by limited iron availability while macronutrients are generally abundant in the Amundsen Sea. Alderkamp et al. (2015) indicated that primary productivity would be stressed by low iron concentrations during December and January in the Amundsen Sea. So the changes in dissolved iron resulted in increased primary production in November and December after 2000. Kwon et al. (2021) also found that the increase in iron can lead to a shift in the bloom peak timing to earlier than January in the Amundsen Sea continental shelf water (mostly in bioregion 5) using a 1-D pelagic ecosystem model.
The changes in primary production from 1993 to 2015 in bioregions 6, 7, 8, and 9 were also analyzed (Figure 10). The results showed that primary production showed positive linear trends in these four bioregions, and these trends were significant at the 95% confidence level in bioregions 6, 7, and 9. Bioregion 9 had the fastest growth rate, and the decadal variations in bioregion 9 were also larger than those in the other 3 bioregions. Primary production reached highest in 2006 and was relatively low in 1994, 1999, 2000, and 2015. The increasing trend observed in bioregion 8 was not significant, but the interannual variations were more significant in bioregion 8 than those in bioregions 6 or 7. The interannual and decadal variations between bioregion 8 and bioregion 9 were quite similar, with a correlation coefficient of approximately 0.75 (calculated using the time series after long-term trend removal). In bioregion 9, a significant positive correlation existed between primary production and sea surface temperatures in summer (from November to March), and the correlation coefficient was 0.46 (Table 3). In bioregion 8, the interannual and decadal variations in primary production were positively correlated with the sea surface temperature in summer, and the correlation coefficient was 0.45. These variations in primary production were also significantly negatively correlated with sea ice thickness, and the correlation coefficient was -0.54 of bioregion 8 and -0.24 of bioregion 9. Therefore, the changes in primary production recorded in bioregions 8 and 9 may have been caused by changes in the sea surface temperatures in summer and changes of sea ice thickness in these areas. Previous studies have shown that SSTs can impact rates of products directly through the relationship between temperature and phytoplankton metabolic rate; SSTs can also affect surface ocean stratification and sea ice distributions (Arrigo et al., 2008). The decline in sea ice thickness can increase the light availability, which has significant effects on the blooms in the nearshore and coastal polynyas in the Amundsen Sea (Venables et al., 2013; Schofield et al., 2015; Oliver et al., 2019). The growth rate of primary production was calculated using linear regression (Figure 10). The growth rate of primary production in bioregion 6 was larger than that in bioregions 7 and 8. This primary production rise accelerated before 2000, while after 2000, no significant long-term change was observed in bioregion 6. Primary production rose with fluctuations in bioregion 7 and reached a maximum in 2005. The decadal and long-term changes in primary production recorded in bioregions 6 and 7 were thought to be related to changes in dissolved iron. The correlation coefficients between primary production and dissolved iron were 0.96 in bioregion 6 and 0.59 in bioregion 7, indicating that dissolved iron was an important factor limiting primary productivity. We also found that the primary production was significantly positively correlated with nitrate, phosphate, and silicate in bioregions 6 and 7. The correlation coefficients were all larger than 0.6 in bioregions 6 and 7. However, the Southern Ocean is the largest high-nutrient region (Lee et al., 2012). And the differences in nitrate, phosphate, and silicate were quite small among these four bioregions. These positive correlations may be caused by the significant correlation between the dissolved iron and nitrate, phosphate, and silicate in bioregions 6 and 7 (all larger than 0.8). The nitrogen: phosphorus ratios were in the range of 13.5 to 14.5, which was quite near to the Redfield ratio. Justić et al. (1995) indicated that the nutrients will inhibit the growth of phytoplankton when nitrate<1mmol m-3, phosphate<0.1 mmol m-3, silicate<2mmol m-3, respectively. In the Amundsen Sea, the concentrations of nitrate, phosphate and silicate were substantially higher than the limitations (Figure 9). As a result, the nitrate, phosphate, and silicate were not thought to be limiting factors of primary productivity in the Amundsen Sea.
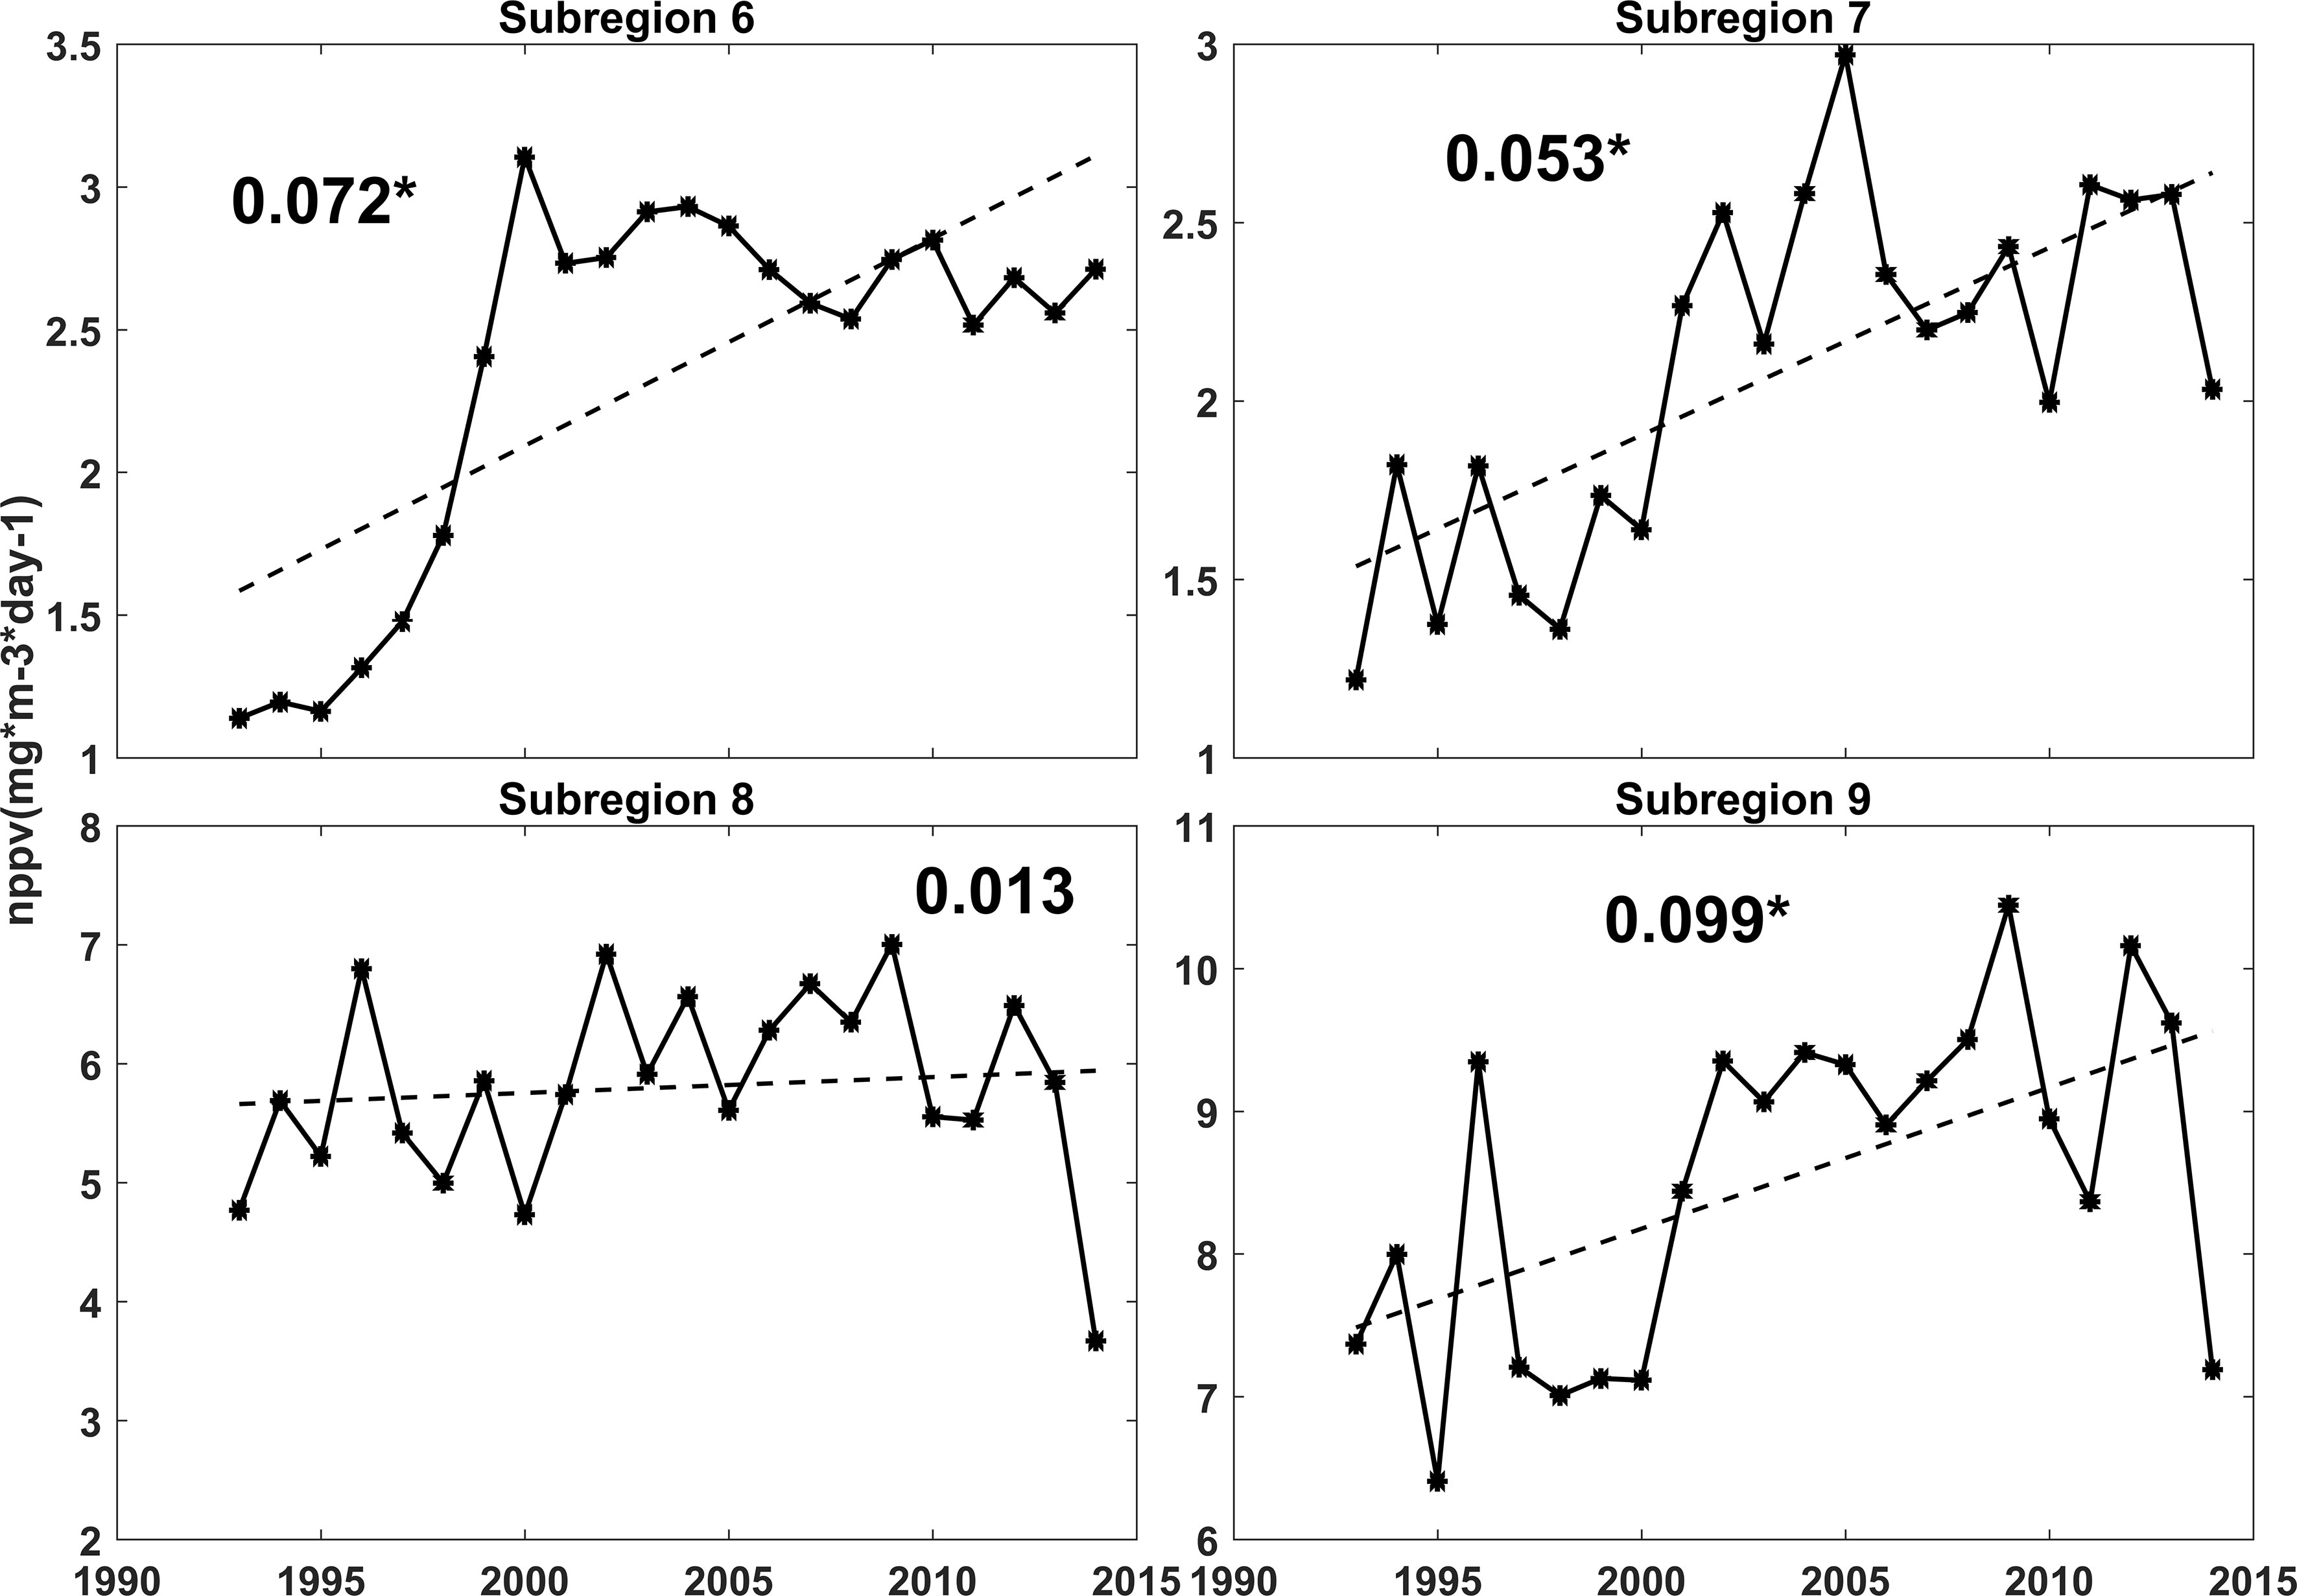
Figure 10 Annual net primary productivity rates (full line) in bioregions 6, 7, 8 and 9 from 1993 to 2015, the dotted lines indicate the linear trends (numbers are the slope of long-term change). The * means that the trend is significant.

Table 3 Correlation between primary production and environmental factors of bioregion 6, 7, 8 and 9.
The environmental controls of primary productivity of 6 and 7 showed some differences with that of bioregions 8 and 9. These differences may be caused by the differences of the dissolved iron concentrations. The dissolved iron concentrations in bioregions 8 (with mean value of 9.85×10⁻⁴ mmol m-3) and 9 (with mean value of 2.5×10⁻³ mmol m-3) were the highest in the Amundsen Sea area (Figure 5) and much larger than that of bioregion 6 and 7 (Figure 9). So dissolved iron was not the limiting factor for primary productivity in these two bioregions. In bioregion 8 and 9 the decadal and long-term changes of primary productivity were more correlated with the SST and sea ice. In bioregion 6 and 7, the dissolved iron concentrations were much smaller than that of bioregion 8 and 9. The primary productions were also positive correlated with SSTs and negative correlated with sea ice thickness, but the correlation were not significant at 95% confidence levels. So the primary production was mainly controlled by dissolved iron concentrations in bioregions 6 and 7. The spatial differences in the limitation of dissolved iron on the primary productivity of the Amundsen Sea were consistent with previous results (Yager et al., 2012).
Conclusion
The Amundsen Sea is one of the least-studied regions in the Southern Ocean and has significant spatial differences in primary productivity. In this work, we used bioregionalization to provide a basis for understanding the temporal and spatial variations in primary productivity in the Amundsen Sea.
The spatial differences were quite significant in the Amundsen Sea; in most areas, the mean primary production was less than 3 mgC m-3 day-1. However, near the coast of Pine Island Bay, mean primary production reached 14 mgC m-3 day-1. Primary production exhibited clear seasonal variabilities and was largest in December at approximately 10 mgC m-3 day-1.
The Amundsen Sea was divided into 9 bioregions using hierarchical clustering and the K-means clustering method. Four nearshore bioregions (6, 7, 8, and 9) were selected to analyze variations in primary productivity in the Amundsen Sea. Due to changes in the dissolved iron, the phenology of primary production changed in bioregions 6 and 7. Primary production showed positive linear trends in these four bioregions due to changes in SST, sea ice and dissolved iron. The long-term primary changes of bioregions 6 and 7 were thought to be limited by changes in the dissolved iron concentrations. Our results indicated that although there were some same similar characteristics existed in the changes of primary productions, the spatial differences were quite large in the Amundsen. We thought that our findings, including the spatial differences and mechanisms that drive differences in phenology, decadal and long-term changes in primary productivity, can be helpful for predicting how the primary production will respond to future change, and also for analysis and protection of the ecosystem in the Amundsen Sea.
The above results indicated that in addition to being used in the systematic conservation planning of marine protected areas, bioregionalization is also an effective method to disentangle multiple limiting factors that affect spatial differences, the phenology, decadal and long-term changes in the physical and ecological variables, such as the primary productivity.
Data Availability Statement
The original contributions presented in the study are included in the article/Supplementary Material. Further inquiries can be directed to the corresponding author.
Author Contributions
JF wrote the first version of the manuscript, DL performed addition analyses, JZ made figures, and LZ revised the text. All authors contributed to the article and approved the submitted version.
Funding
This study was supported by impact and response of Antarctic seas to climate change under contract RFSOCC2020-2022-No.18, Project of Scientific Research Program of Tianjin Municipal Education Commission (2017KJ181) and National Science Foundation of Tianjin (19JCZDJC40600).
Conflict of Interest
The authors declare that the research was conducted in the absence of any commercial or financial relationships that could be construed as a potential conflict of interest.
Publisher’s Note
All claims expressed in this article are solely those of the authors and do not necessarily represent those of their affiliated organizations, or those of the publisher, the editors and the reviewers. Any product that may be evaluated in this article, or claim that may be made by its manufacturer, is not guaranteed or endorsed by the publisher.
Supplementary Material
The Supplementary Material for this article can be found online at: https://www.frontiersin.org/articles/10.3389/fmars.2022.891663/full#supplementary-material
References
Alderkamp A. C., van Dijken G. L., Lowry K. E., Connelly T. L., Lagerström M., Sherrell R. M., et al. (2015). Fe Availability Drives Phytoplankton Photosynthesis Rates During Spring Bloom in the Amundsen Sea Polynya, Antarctica Vol. 3 (Elementa: Science of the Anthropocene), 000043.
Amthor J. S., Baldocchi D. D. (2001). “Terrestrial Higher Plant Respiration and Net Primary Production,” in Terrestrial Global Productivity (San Diego: Academic Press), 33–59.
Anselin L., Syabri I., Kho Y. (2006). Geoda: An Introduction to Spatial Data Analysis. Geograohic. Anal. 38 (1), 5–22. doi: 10.1111/j.0016-7363.2005.00671.x
Ardyna M., Claustre H., Sallée J. B., D’Ovidio F., Gentili B., van Dijken G., et al. (2017). Delineating Environmental Control of Phytoplankton Biomass and Phenology in the Southern Ocean. Geophys. Res. Lett. 44, 5016–5024. doi: 10.1002/2016GL072428
Arneborg L., Wåhlin A. K., Björk G., Lijebladh B., Orsi A. H. (2012). Persistent Inflow of Warm Water Onto the Central Amundsen Shelf. Nat. Geosci. 5 (12), 876–880. doi: 10.1038/ngeo1644
Arrigo K. R., Lowry K. E., van Dijken G. L. (2012). Annual Changes in Sea Ice and Phytoplankton in Polynyas of the Amundsen Sea, Antarctica. Deep Sea Res. Part II: Topical Stud. Oceanogr. 71-76, 5–15. doi: 10.1016/j.dsr2.2012.03.006
Arrigo K. R., van Dijken G. L. (2003). Phytoplankton Dynamics Within 37 Antarctic Coastal Polynya Systems. J. Geophy. Res. 108, C83271. doi: 10.1029/2002JC001739
Arrigo K. R., van Dijken G. L., Bushinsky S. (2008). Primary Production in the Southern Ocean 1997-2006. J. Geophys. Res. 113, C08004. doi: 10.1029/2007JC004551
Arrigo K. R., van Dijken G. L., Strong A. L. (2015). Environmental Controls of Marine Productivity Hot Spots Around Antarctica. J. Geophys. Res.: Oceans 120 (8), 5545–5565. doi: 10.1002/2015JC010888
Behrenfeld M., Boss E. (2014). Resurrecting the Ecological Underpinnings of Ocean Plankton Blooms, Annu. Rev. Mar. Sci. 6, 167–194. doi: 10.1146/annurev-marine-052913-021325
Bijma J., Pörtner H. O., Yesson C., Rogers A. D. (2013). Climate Change and the Oceans – What Does the Future Hold? Mar. Pollut. Bull. 74 (2), 495–505. doi: 10.1016/j.marpolbul.2013.07.022
Bloomfield N. J., Knerr N. (2018). And Encinas-Viso, F.: A Comparison of Network and Clustering Methods to Detect Biogeographical Regions. Ecography 41, 1–10. doi: 10.1111/ecog.02596
Bowman J. S., Kavanaugh M. T., Donsy S. C., Ducklow H. W. (2018). Recurrent Seascape Units Identify Key Ecological Processes Along the Western Antarctic Peninsula. Global Change Biol. 24 (7), 3065–3078. doi: 10.1111/gcb.14161
Boyd P. W. (2002). Environmental Factors Controlling Phytoplankton Processes in the Southern Ocean. J. Phycol. 38 (5), 844–861. doi: 10.1046/j.1529-8817.2002.t01-1-01203.x
Brainerd K. E., Gregg M. C. (1995). Surface Mixed and Mixing Layer Depths. Deep Sea Res. Part I 42 (9), 1521–1543.
Bromwich D. H., Nicolas J. P., Monaghan A. J., Lazzara M., Keller L. M., Weidner G. A., et al. (2013). Central West Antarctica Among the Most Rapidly Warming Regions on Earth. Nat. Geosci. 6, 139–145. doi: 10.1038/ngeo1671
Comiso J. C., Cavalieri D. J., Markus T. (2003). Sea Ice Concentration, Ice Temperature, and Snow Depth Using AMSR-E Data. IEEE Trans. Geosci. Remote Sens. 41 (2), 243–252. doi: 10.1109/TGRS.2002.808317
Costello M. J. (2009). Distinguishing Marine Habitat Classification Concepts for Ecological Data Management. Mar. Ecol. Prog. Ser. 397, 253e268. doi: 10.3354/meps08317
Dinniman M. S., St-Lauernt P., Arrigo K. R., Hofmann E. E., van Dijken G. L. (2020). Analysis of Iron Source in Antarctic Continental Shelf Water. J. Geophys. Res.: Oceans e2019JC015736.
D’Ortenzio F., d’Alcalà M. R. (2009). On the Trophic Regimes of the Mediterranean Sea: A Satellite Analysis. Biogeosciences 6 (2), 139–148. doi: 10.5194/bg-6-139-2009
Dotto T. S., Garabato A. N., Bacon S., Tsamados M., Holland P. R., Hooley J., et al. (2018). Variability of the Ross Gyre, Southern Ocean: Drivers and Responses Revealed by Satellite Altimetry. Geophys. Res. Lett. 45 (12), 6195–6201. doi: 10.1029/2018GL078607
Ebach M. C., Murphy D. J., Gonzalez-Orozco C., Miller J. (2015). A Revised Area Taxonomy of Phytogeographical Regions Within the Australian Bioregionalisation Atlas. Phytotaxa 208 (4), 261–277. doi: 10.11646/phytotaxa.208.4.2
Feng J., von Storch H., Jiang W., Weisse R. (2015). Assessing Changes in Extreme Sea Level Along the Coast of China. J. Geophys. Res.: Oceans 120 (12), 8039–8051. doi: 10.1002/2015JC011336
Fraley C., Raftery A. (1998). How Many Clusters? Which Clustering Method? Answers via Model-Based Cluster Analysis. Comput. J. 41, 578–588. doi: 10.1093/comjnl/41.8.578
Fraschetti S., Terlizzi A., Boero F. (2008). How Many Habitats are There in the Sea (and Where)? J. Exp. Mar. Bio. Ecol. 366, 109.e115. doi: 10.1016/j.jembe.2008.07.015
Godet C., Robuchon M., Leroy B., Cotté C., Baudena A., Silva O. D., et al. (2020). Matching Zooplankton Abundance and Environment in the South Indian Ocean and Southern Ocean. Deep Sea Res. Part I: Oceanogr. Res. Papers 163, 103347. doi: 10.1016/j.dsr.2020.103347
Gohl K. (2010). The Expedition of the Research Vessel Polarstern to the Amundsen Sea, Antatctica, in 2010 (ANT-XXIV/3). Rep. Polar Mar. Res. 617, 173.
Govender P., Sivakumar V. (2020). Application of K-Means and Hierarchical Clustering Techniques for Analysis of Air Pollution: A Review, (1980-2019). Atmos. Pollut. Res. 11 (1), 40e56. doi: 10.1016/j.apr.2019.09.009
Grant S., Constable A., Raymond B., Doust S. (2006). “Bioregionalisation of the Southern Ocean. Report of an Expert Workshop, Hobart, Australia, September 2006,” WWF-Australia and ACE CRC.
Grantham H. S., Pressey R. L., Wells J. A., Beattie A. J. (2010). Effectiveness of Biodiversity Surrogates for Conservation Planning: Different Measures of Effectiveness Generate a Kaleidoscope of Variation. PloS One 5. doi: 10.1371/journal.pone.0011430
Greger E. J., Bodtker K. M. (2007). Adaptive Classification of Marine Ecosystems: Identifying Biological Meaningful Regions in the Marine Environment. Deep Sea Res. I 54, 385–402. doi: 10.1016/j.dsr.2006.11.004
Griffiths H. J. (2010). Antarctic Marine Biodiversity—What do We Know About the Distribution of Life in the Southern Ocean? PloS One 5 (7), e1130. doi: 10.1371/journal.pone.0011683
Herraiz-Borreguero L., Lannuzel D., van der Merwe P., Treverrow A., Pedro J. B. (2016). Large flux of Iron From the Amery Ice Shelf Marine Ice to Prydz Bay, East Antarctica. J. Geophys. Res. Oceans 121, 6009–6020. doi: 10.1002/2016JC011687
Huang J., Zhang Z., Wang X. (2020). Evaluation of Four High-Resolution Sea Ice Reanalysis Products in the Ross Sea and Amundsen Sea. Chin. J. Polar Res. 32 (4), 452–468. doi: 10.13679/j.jdyj.20200007
Justić D., Rabalais N. N., Turner R. E., Dortch Q. (1995). Changes in Nutrient Structure of River-Dominated Coastal Waters: Stoichiometric Nutrient Balance and its Consequences. Estuarine Coastal Shelf Sci. 40 (3), 339–356. doi: 10.1016/S0272-7714(05)80014-9
Khatiwala S., Primeau F., Hall T. (2009). Reconstruction of the History of Anthropogenic CO2 Concentrations in the Ocean. Nature 462 (7271), 346–349. doi: 10.1038/nature08526
Kim S. U., Kim K. Y. (2021). Impact of Climate Change on the Primary Production and Related Biogeochemical Cycles in the Coastal and Sea Ice Zone of the Southern Ocean. Sci. Total Environ. 751, 141678. doi: 10.1016/j.scitotenv.2020.141678
Kim C. S., Kim T. W., Cho K. H., Ha H. K., Lee S. H., Kim H. C., et al. (2016). Variability of the Antarctic Coastal Current in the Amundsen Sea. Estuarine Coastal Shelf Sci. 181 (5), 123–133. doi: 10.1016/j.ecss.2016.08.004
Koubbi P., Moteki M., Duhamel G., Goarant A., Hulley P. A., O'Driscoll R., et al. (2011). Ecoregionalization of Myctophid Fish in the Indian Sector of the Southern Ocean: Results From Generalized Dissimilarity Models. Deep. Res. Part II Top. Stud. Oceanogr. 58, 170e180. doi: 10.1016/j.dsr2.2010.09.007
Kulkarni A., von Storch H. (1995). Monte Carlo Experiments on the Effect of Serial Correlation on the Mann-Kendall-Test of Trends. Meteor Z. 4, 82–85. doi: 10.1127/metz/4/1992/82
Kwon Y. S., La H. S., Jung J., Lee S. H., Kim T. W., Kang H. W., et al. (2021). Exploring the Roles of Iron and Irradiance in Dynamics of Diatoms and Phaeocystis in the Amundsen Sea Continental Shelf Water. J. Geophys. Res.: Oceans 126 (3), 1–23. doi: 10.1029/2020JC016673
Lacour L., Claustre H., Prieur L., D’Ortenzio F. (2015). Phytoplankton Biomass Cycles in the North Atlantic Subpolar Gyre: A Similar Mechanism for Two Different Blooms in the Labrador Sea. Geophys. Res. Lett. 42, 5403–5410. doi: 10.1002/2015GL064540
Lannuzel D., Schoemann V., de Jong J., Pasquer B., van der Merwe P., Masson F., et al. (2010). Distribution of Dissolved Iron in Antarctic Sea Ice: Spatial, Seasonal, and Inter-Annual Variability. J. Geophys Res. Biogeosci. 115, G03022. doi: 10.1029/2009JG001031
Lannuzel D., Schoemann V., De Jong J., Tison J. L., Chou L. (2007). Distribution and Biogeochemical Behaviour of Iron in the East Ant-Arctic Sea Ice. Mar. Chem. 106 (1), 18–32. doi: 10.1016/j.marchem.2006.06.010
Leathwick J. R., Overton J., McLeod M. (2003). An Environmental Domain Classification of New Zealand and its Use as a Tool for Biodiversity Management. Conserv. Biol. 17, 1612–1623. doi: 10.1111/j.1523-1739.2003.00469.x
Lee S. H., Kim B. K., Yun M. S., Joo H., Yang E. J., Kim Y. N., et al. (2012). Spatial Distribution of Phytoplankton Productivity in the Amundsen Sea, Antarctica. Polar Biol. 35, 1721–1733. doi: 10.1007/s00300-012-1220-5
Lim Y. J., Kim T. W., Lee S., Lee D., Park J., Kim B., et al. (2019). Seasonal Variations in the Small Phytoplankton Contribution to the Total Primary Production in the Amundsen Sea, Antarctica. J. Geophys. Res. Oceans 124 (11), 8324–8341. doi: 10.1029/2019JC015305
Longhurst A. (2007). Ecological Geography of the Sea. 2nd ed (Burlington, Mass: Academic Press), 542.
Mann H. B. (1945). Nonparametric Tests Against Trend. Econometrica 13, 245–259. doi: 10.2307/1907187
Martinson D. G. (2012). Antarctic Circumpolar Current's Role in the Antarctic Ice System: An Overview. Palaeogeogr. Palaeoclimatol. Palaeoecol. 335–336, 71–74. doi: 10.1016/j.palaeo.2011.04.007
Ma H., Wang Z., Shi J. (2012). The Role of the Southern Ocean Physical Processes in Global Climate System. Adv. Earth Sci. 27 (4), 398–412. doi: 10.11867/j.issn.1001-8166.2012.04.0398
Mayot N., D’Ortenzio F., d’Alcalà M. R., Lavigne H., Claustre H. (2016). Interannual Variability of the Mediterranean Trophic Regimes From Ocean Color Satellites. Biogeosciences 13 (6), 1901–1917. doi: 10.5194/bg-13-1901-2016
Meier W. N., Fetterer F., Savoie M., Mallory S., Duerr R., Stroeve J. (2017). NOAA/NSIDC Climate Data Record of Passive Microwave Sea Ice Concentration, Version 3 (Boulder, Colorado USA: NSIDC: National Snow and Ice Data Center). doi: 10.7265/N59P2ZTG
Milligan G. W., Cooper M. C. (1987). Methodology Review: Clustering Methods. Appl. Psychol. Meas. 11, 329–354. doi: 10.1177/014662168701100401
Moore J. K., Abbott M. R. (2000). Phytoplankton Chlorophyll Distributions and Primary Production in the Southern Ocean. J. Geophys. Res. 105 (C12), 28709–28722. doi: 10.1029/1999JC000043
Norse E. A. (2010). Ecosystem-Based Spatial Planning and Management of Marine Fisheries: Why and How. Mar. Pollut. Bull. 86 (2), 179–195.
Oliver M. J., Irwin A. J. (2008). Objective Global Ocean Biogeographic Provinces. Geophys. Res. Lett. 35, L15601. doi: 10.1029/2008GL034238
Oliver H., St-Laurent P., Sherrell R. M., Yager P. L. (2019). Modeling Iron and Light Controls on the Summer Phaeocystis Antarctica Bloom in the Amundsen Sea Polynya. Global Biogeochem. Cycles 33 (5), 570–596. doi: 10.1029/2018GB006168
Pabis K., Hara U., Presler P., Sicinski J. (2014). Structure of Bryozoan Communities in an Antarctic Glacial Fjord (Admiralty Bay, South Shelands). Polor Biol. 37, 737–751.
Park K., Hahm D., Choi J. O., Xu S., Kim H. C., Lee S. H. (2019). Spatiotemporal Variation in Summer Net Community Production in the Amundsen Sea Polynya: A Self-Organizing Map Analysis Approach. Continent. Shelf Res. 184, 21–29. doi: 10.1016/j.csr.2019.07.001
Park J., Kuzminovm F. I., Bailleul B., Yang E. J., Lee S., Falkowski P. G., et al. (2017). Light Availability Rather Than Fe Controls the Magnitude of Massive Phytoplankton Bloom in the Amundsen Sea Polynyas, Antarctica. Limnol. Oceanogr. 62 (5), 2260–2276. doi: 10.1002/lno.10565
Petrou K., Kranz S. A., Trimborn S., Hassler C. S., Ameijeiras S. B., Sackett O., et al. (2016). Southern Ocean Phytoplankton Physiology in a Changing Climate. J. Plant Physiol. 203, 135–150. doi: 10.1016/j.jplph.2016.05.004
Randall-Goodwin E., Meredith M. P., Jenkins A., Yager P. L., Sherrell R. M., Abrahamsen E. P., et al. (2015). Freshwater Distributions and Water Mass Structure in the Amundsen Sea Polynya Region, Antarctica. Elem. Sci. Anth. 3, 000065. doi: 10.12952/journal.elementa.000065
Reid P. C., Fischer A. C., Lewis-Brown E., Meredith M. P., Sparrow M., Andersson A. J., et al. (2009). Impacts of the Oceans on Climate Change. Adv. Mar. Biol. 56, 1–150. doi: 10.1016/S0065-2881(09)56001-4
Rice J., Gjerde K. M., Ardron J., Arico S., Cresswell I., Escobar E., et al. (2011). Policy Relevance of Biogeographic Classification for Conservation and Management of Marine Biodiversity Beyond National Jurisdiction, and the GOODS Biogeographic Classification. Ocean. Coast. Manag. 54, 110e122. doi: 10.1016/j.ocecoaman.2010.10.010
Ritterhoff J., Zauke G. P. (1997). Trace Metals in Field Samples of Zooplankton From the Fram Strait and the Greenland Sea. Sci. Total Environ. 199, 255–270. doi: 10.1016/S0048-9697(97)05457-0
Roberson L. A., Lagabrielle E., Lombard A. T., Sink K., Livingstone T., Grantham H., et al. (2017). Pelagic Bioregionalisation Using Open-Access Data for Better Planning of Marine Protected Area Networks. Ocean Coastal Manage. 148, 214–230. doi: 10.1016/j.ocecoaman.2017.08.017
Schofield O. M., Miles T., Alderkamp A.-C., Lee S., Haskins C., Rogalsky E., et al. (2015). In Situ Phytoplankton Distributions in the Amundsen Sea Polynya Measured by Autonomous Gliders. Elementa: Sci. Anthropocene 3, 000073. doi: 10.12952/journal.elementa.000073
Sharp B. R., Parker S. J., Pinkerton M., Breen B. A., Cummings V. J., Dunn A., et al. (2010). “Bioregionalisation and Spatial Ecosystem Processes in the Ross Sea Region,” in Document WG-EMM-10/30 (Hobart, TAS: CCAMLR).
Smith W. O. Jr., Comiso J. C. (2008). Influence of Sea Ice on Primary Production in the Southern Ocean, A Satellite Perspective. J. Geophys. Res. Oceans 113, C05S93. doi: 10.1029/2007JC004251
Snelder T. H., Leathwick J., Dey K., Rowden A. A., Weatherhead M. A., Fenwick G. D., et al. (2007). Development of an Ecological Marine Classification in the New Zealand Region. Environ. Manage. 39, 12–29. doi: 10.1007/s00267-005-0206-2
Spalding M. D., Fox H. E., Allen G. R., Davidson N., FerdaNa Z., Finlayson M., et al. (2007). Marine Ecoregions of the World: A Bioregionalization of Coastal and Shelf Areas. Bioscience 57, 573–583. doi: 10.1641/B570707
Stammerjohn S. E., Maksym T., Lowry K. E., Arrigo K. R., Yuan X., Raphael M., et al. (2015). Seasonal Sea Ice Changes in the Amundsen Sea, Antarctica, Over the Period of 1979-2014. Elementa: Sci. Anthropocene 3, 000055. doi: 10.12952/journal.elementa.000055
St-Laurent P., Yager P. L., Sherrell R. M., Oliver H., Dinniman M. S., Stammerjohn S. E. (2019). Modeling the Seasonal Cycle of Iron and Carbon Fluxes in the Amundsen Sea Polynya, Antarctica. J. Geophys. Res.: Oceans 124 (3), 1544–1565. doi: 10.1029/2018JC014773
St-Laurent P., Yager P. L., Sherrell R. M., Stammerjohn S. E., Dinniman M. S. (2017). Pathways and Supply of Dissolved Iron in the Amundsen Sea (Antarctica). J. Geophys. Res.: Oceans 122 (9), 7135–7162. doi: 10.1002/2017JC013162
Swalethorp R., Dinasquet J., Logares R., Bertilsson S., Kjellerup S., Krabberød A. K., et al. (2019). Microzooplankton Distribution in the Amundsen Sea Polynya (Antarctica) During an Extensive Phaeocystis Antarctica Bloom. Prog. Oceanogr. 170, 1–10. doi: 10.1016/j.pocean.2018.10.008
Tagliabue A., Sallée J. B., Bowie A., Lévy M., Swart S., Boyd P. W. (2014). Surface-Water Iron Supplies in the Southern Ocean Sustained By Deep Winter Mixing. Nat. Geosci. 7, 314–320.
Teschke K., Beaver D., Bester M. N., Bombosch A., Boremann H., Brandt A., et al. (2016). Scientific Background Document in Support of the Development of a CCAMLR MPA in the Weddell Sea (Antarctica)—version 2016—Part A: General Context of the Establishment of MPAs and Background Information on the Weddell Sea MPA Planning Area. CCAMLR SC-CAMLR-XXXV/BG/11, 1–112.
Treml E. A., Halpin P. N. (2012). Marine Population Connectivity Identifies Ecological Neighbors for Conservation Planning in the Coral Triangle. Conserv. Lett. 5, 441–449. doi: 10.1111/j.1755-263X.2012.00260.x
Twelves A. G., Goldberg D. N., Henley S. F., Mazloff M. R., Jones D. C. (2021). Self-Shading and Meltwater Spreading Control the Transition From Light to Iron Limitation in an Antarctic Coastal Polynya. J. Geophys. Res.: Oceans 126 (2), 1–28. doi: 10.1029/2020JC016636
Uotila P., Goosse H., Haines K., Chevallier M., Barthélemy A., Bricaud C., et al. (2019). An Assessment of Ten Ocean Reanalyses in the Polar Regions. Clim. Dynam. 52, 1613–1650. doi: 10.1007/s00382-018-4242-z
Venables H. J., Clarke A., Mereddith M. P. (2013). Wintertime Controls on Summer Stratification and Productivity at the Western Antarctic Peninsula. Limnol. Oceanogr. 58, 1035–1047. doi: 10.4319/lo.2013.58.3.1035
von Storch H., Zwiers F. W. (1999). Statistical Analysis in Climate Research (Cambridge: United Kingdom at the University Press).
Wu S. Y., Hou S. (2017). Impact of Icebergs on Net Primary Productivity in the Southern Ocean. Cryosphere 11, 707–722. doi: 10.5194/tc-11-707-2017
Keywords: Amundsen Sea, primary productivity, bioregions, dissolved iron, climate change
Citation: Feng J, Li D, Zhang J and Zhao L (2022) Variations and Environmental Controls of Primary Productivity in the Amundsen Sea. Front. Mar. Sci. 9:891663. doi: 10.3389/fmars.2022.891663
Received: 08 March 2022; Accepted: 29 April 2022;
Published: 26 May 2022.
Edited by:
Biraja Kumar Sahu, Council of Scientific and Industrial Research (CSIR), IndiaReviewed by:
Sanjiba Kumar Baliarsingh, Indian National Centre for Ocean Information Services, IndiaFajin Chen, Guangdong Ocean University, China
Copyright © 2022 Feng, Li, Zhang and Zhao. This is an open-access article distributed under the terms of the Creative Commons Attribution License (CC BY). The use, distribution or reproduction in other forums is permitted, provided the original author(s) and the copyright owner(s) are credited and that the original publication in this journal is cited, in accordance with accepted academic practice. No use, distribution or reproduction is permitted which does not comply with these terms.
*Correspondence: Liang Zhao, emhhb2xpYW5nQHR1c3QuZWR1LmNu
 Jianlong Feng1,2
 Delei Li
 Liang Zhao