 Soo Rin Lee
 Seok-Gwan Choi2
 Chang-Keun Kang
 Hyun-Woo Kim
94% of researchers rate our articles as excellent or good
Learn more about the work of our research integrity team to safeguard the quality of each article we publish.
Find out more
ORIGINAL RESEARCH article
Front. Mar. Sci., 19 August 2022
Sec. Marine Molecular Biology and Ecology
Volume 9 - 2022 | https://doi.org/10.3389/fmars.2022.888167
The diet of the Antarctic toothfish (Dissostichus mawsoni) was analyzed using metabarcoding to determine whether spatiotemporal factors are related to its feeding ecology. A diet metabarcoding analysis was conducted for five years from 2016 to 2020 using 1,777 samples collected from two distantly located subareas, 88.3 and 58.4.1. Metabarcoding results revealed 105 prey haplotypes (29 families, 45 genera) in the stomach contents of D. mawsoni, which can serve as valuable genetic information for the accurate identification of piscine species inhabiting the Southern Ocean. Most of the stomach contents of D. mawsoni consisted of fish taxa, comprising 99.61% of read count, which is consistent with other studies indicating that D. mawsoni is piscivorous. The prey compositions were highly different between the two subareas (88.3 and 58.4.1) regardless of the year, indicating that the diet of D. mawsoni strongly reflects the fish assemblages in geographically different habitats. These results strongly suggest that the stomach contents are good ecological indicators for monitoring any changes in the marine ecosystem caused by either the fishery of D. mawsoni, the most voracious piscine predator in its habitat, or environmental changes. In addition, quantitative polymerase chain reaction results of the two most abundant Macrourus prey species of Antarctic toothfish, M. caml and M. whitsoni, showed that the distribution of these two species may be related to the dynamics of gyres, which flow along the Antarctic continent.
The Antarctic toothfish Dissostichus mawsoni Norman, 1937, is a species of the Nototheniidae family that is native to the Southern Ocean. Owing to its ecological and economic importance, its fishery has been strictly managed by the Commission for the Conservation of Antarctic Marine Living Resources since 1997. One of the main concerns regarding D. mawsoni fishery is the lack of accurate information about the impact of fishing on the ecosystem. Since its diet reflects the status of the food web, many studies on the feeding ecology of D. mawsoni have been conducted in various sites of Antarctica, including Bouvet Island (Petrov, 2011), Cosmonaut Sea (Pakhomov and Tseytlin, 1993), Elephant Island (Grohsler, 1992), Lazarev Sea (Petrov and Tatarnikov, 2011), McMurdo Sound (Calhaem and Christoffel, 1969; Eastman, 1985), Pacific sector (Yukhov, 1971), Ross Sea (Yukhov, 1982; Fenaughty and Stevens, 2003; Kokorin, 2010; Stevens et al., 2014), South Sandwich Islands (Roberts et al., 2011), South Shetland Islands (Takahashi and Iwami, 1997), Area 58.4 (Park et al., 2015; Seong et al., 2021), and Weddell Sea (Petrov and Gordeev, 2015). Previous studies have shown that D. mawsoni mainly preys on benthic fish and cephalopods. However, prey species or their compositions vary in each study, and accurate species names often remain unknown for partially digested preys (Fenaughty and Stevens, 2003; Petrov and Tatarnikov, 2011; Roberts et al., 2011; Stevens et al., 2014; Seong et al., 2021). Identifying species inhabiting the Antarctic waters has been challenging, mainly because of the morphological similarity or phenotypic plasticity of various species (Piacentino and Barrera-Oro, 2009; Lautredou et al., 2010; Convey and Peck, 2019). In addition, it is challenging to identify partially digested preys in the stomach (Hashimoto, 1974). Besides the difficulty in species identification, the digestion time and rates for each prey are also different, which may produce biased results that are inappropriate for quantitative and morphological analyses (Amundsen and Sá nchez‐Hernández, 2019). Most importantly, analysis takes a long time and requires a high budget and labor to obtain statistically reliable data. Therefore, most studies on the diet of D. mawsoni have focused a single research term and area.
Diet studies using molecular techniques can be good alternatives to conventional methods. Owing to its cost efficiency and high sensitivity, metabarcoding has been used for diet studies in various animals (Guillerault et al., 2017; Mata et al., 2019; Mychek-Londer et al., 2020). A previous study reported the diet of D. mawsoni by metabarcoding its stomach contents, in which proportions of its prey were identified with high accuracy (Yoon et al., 2017). However, a single survey could not explain the reason for the variability in the prey species or their compositions in each survey of different geographical regions. A long-term study of the feeding ecology of D. mawsoni using metabarcoding would provide a more comprehensive understanding of its life cycle, migration, food web structure, and the impacts of its fishery on the ecosystem of the Southern Ocean. In fact, the Antarctic toothfish fishery has been prevalent since 1997, and its sustainability remains controversial. Here, we report the results of metabarcoding for the stomach contents of Antarctic toothfish, which was conducted for several years (2016–2020). Based on metabarcoding, D. mawsoni was identified to prey in subareas 88.3 and 58.4, which were compared to determine whether the stomach contents reflected the geographical food web structures. Finally, we used quantitative polymerase chain reaction (qPCR) to accurately quantify individual prey items. These data will contribute to the scientific management and conservation of D. mawsoni, providing a fast and accurate monitoring platform to detect the impact of its fishery on the marine ecosystem in the Southern Ocean.
Antarctic toothfish were collected from subareas 88.3 and 58.4 during the fishing season (from December to April each year) by Korean flagged commercial bottom longline vessels (88.3-Greenstar, 58.4-Kingstar) under the supervision of the Distant Water Fisheries Resources Division, National Institute of Fisheries Science (NIFS) in the Republic of Korea. Antarctic toothfish samples were collected for five years from 2016 to 2020 in subarea 88.3, and for two years (2016 and 2017) in subarea 58.4 (Figure 1). A trotline was used as fishing gear to collect the Antarctic toothfish, and Humboldt squid (Dosidicus Gigas d’Orbigny [–1834-1847], 1835) and Pacific herring (Clupea pallasii Valenciennes, 1847) were used as baits. The fishing depth varied from 591–2,113 m. Before stomach dissection, the total length (cm) and body weight (g) of each specimen was measured at the collection site. The dissected stomachs were individually packaged and immediately frozen at −20°C. On arrival at the port, stomach samples were transferred (frozen in dry ice) to the laboratory and stored at −70°C in a deep freezer until DNA extraction for metabarcoding analysis.
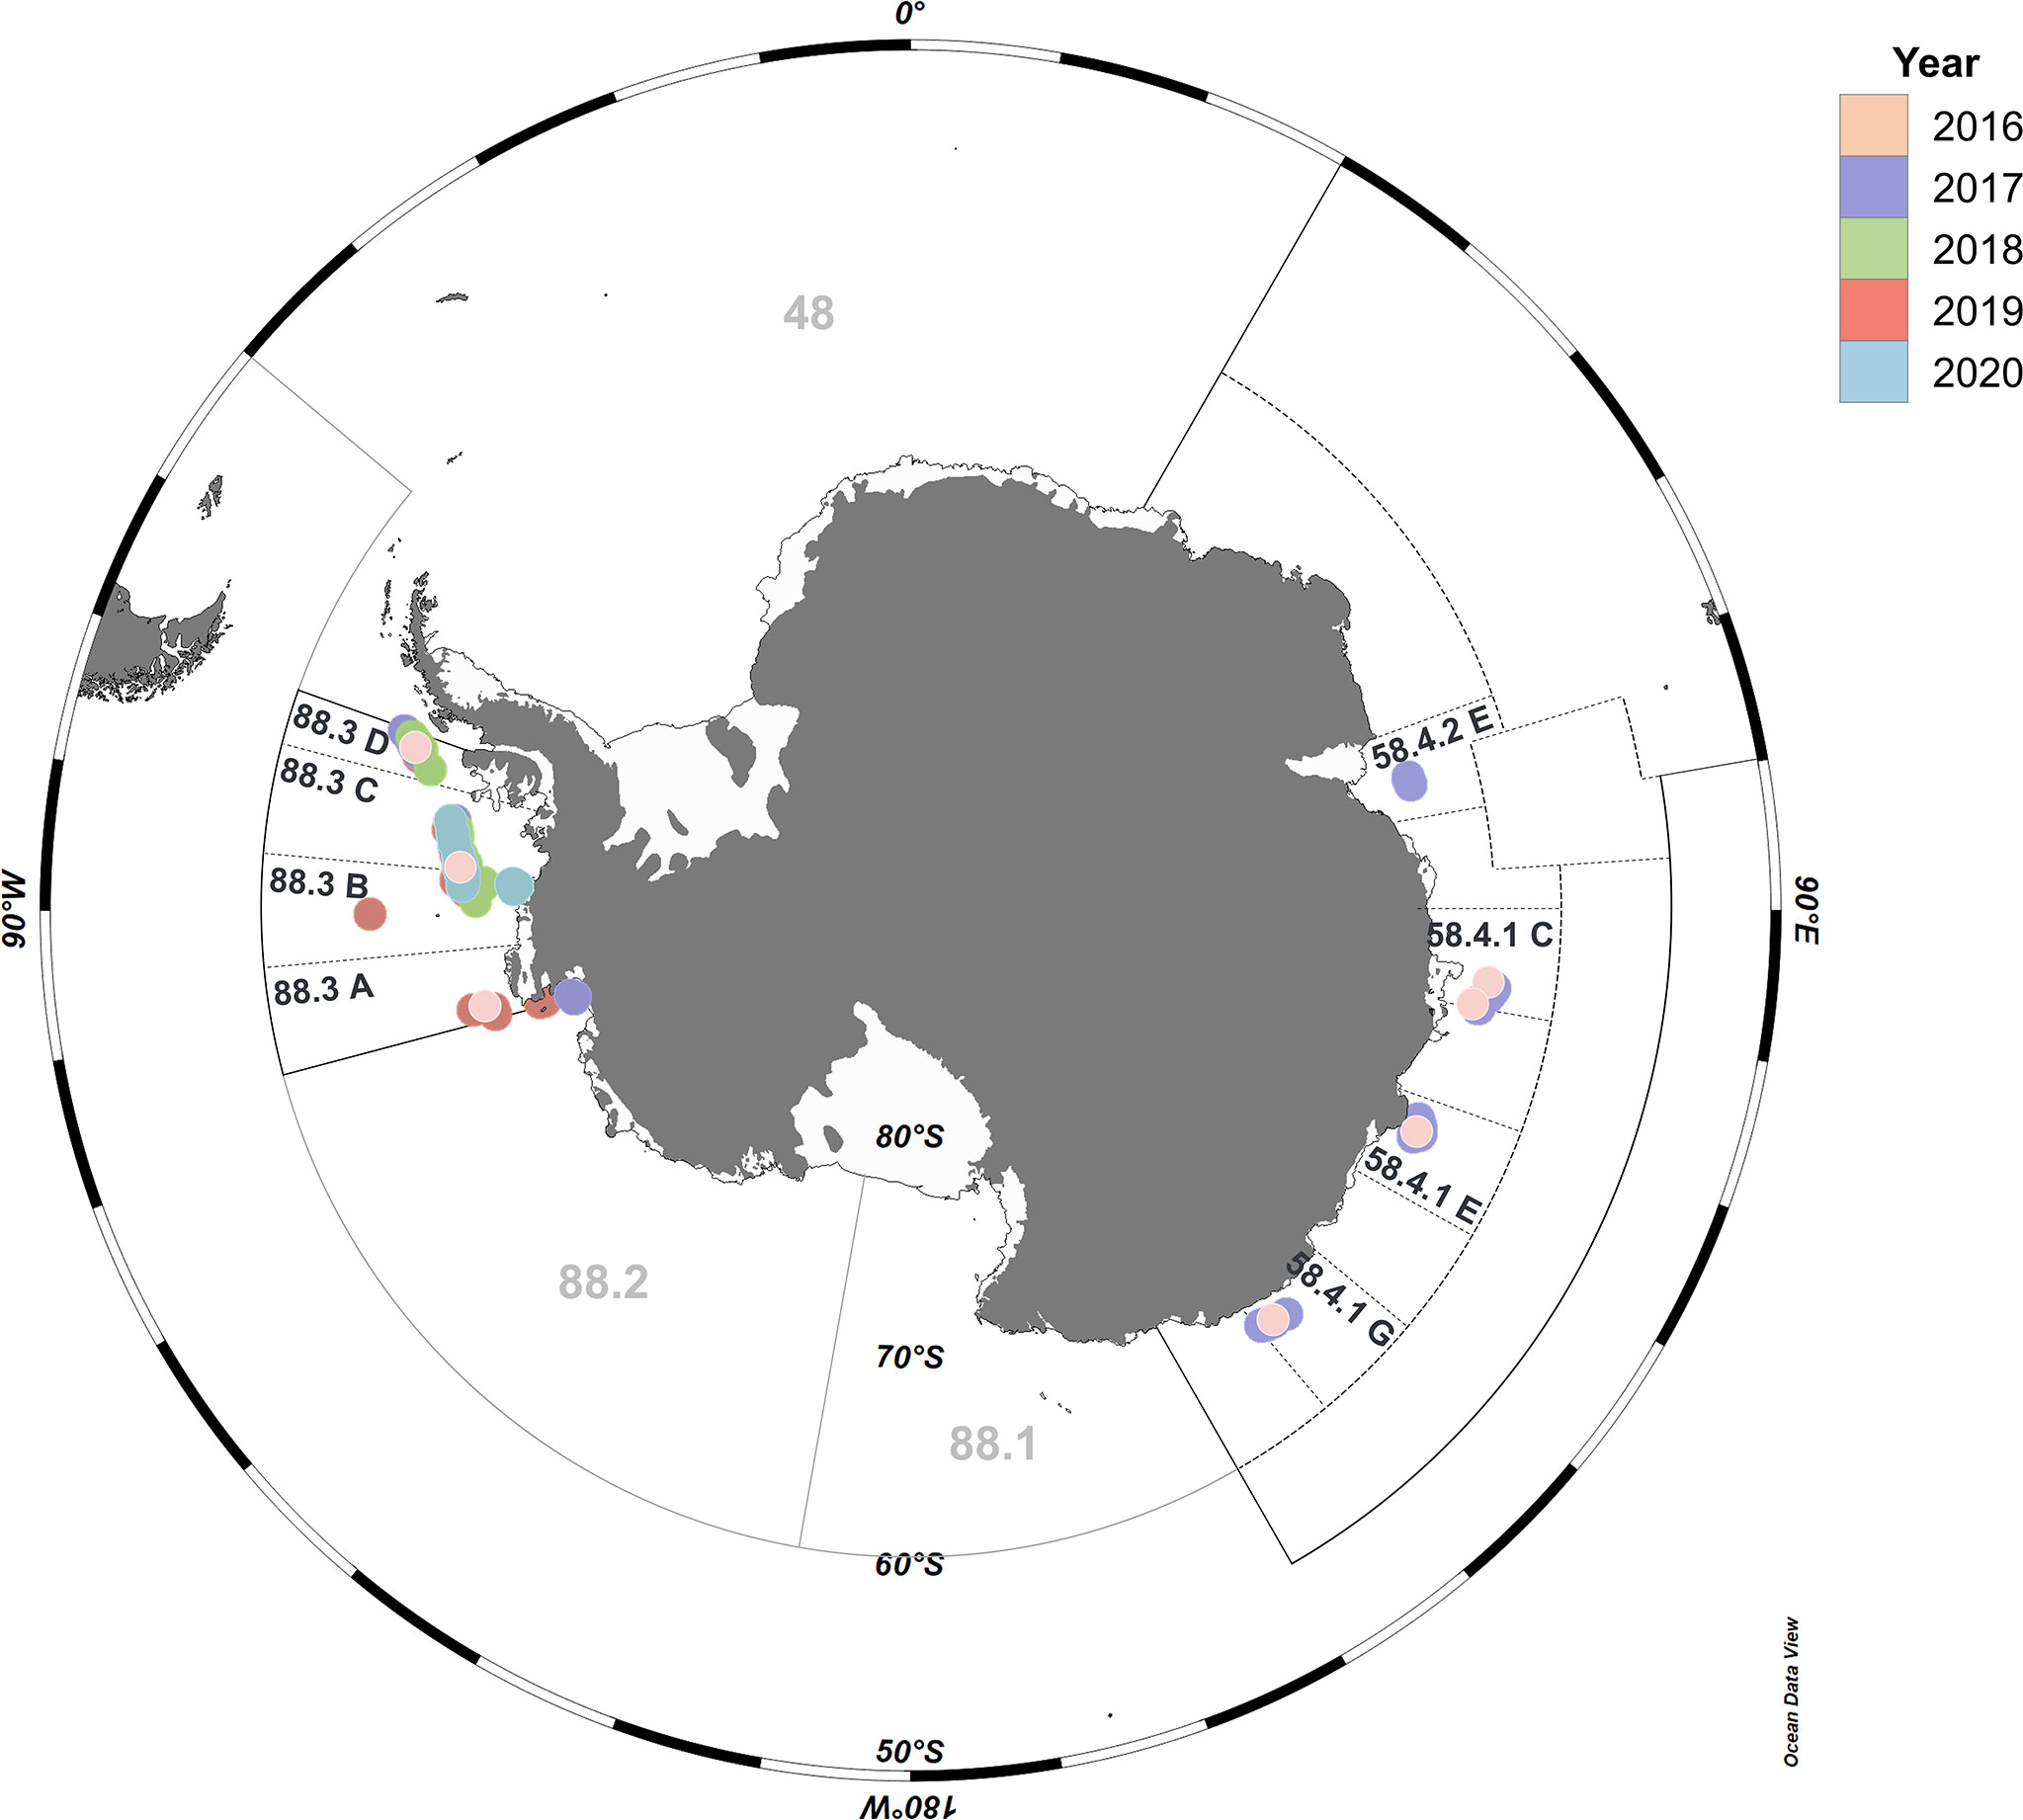
Figure 1 Stomach collection sites for Dissostichus mawsoni.Map showing 1,777 D. mawsoni sampling sites in the Southern Ocean. Color represents each year that sampling was performed. The base map was created using Ocean Data View v.5.5.1 (Schlitzer, Reiner, Ocean Data View, https://odv.awi.de, 2021.).
Before homogenization, abiotic elements, such as hooks and stones, and baits were removed from the individual stomachs. Individual stomach contents were weighed and homogenized using an electric kitchen blender after adding an equal volume of distilled deionized water to the corresponding wet weight of the stomach contents. A blender was used for each individual, which was treated with 10% bleach for 10 min before use. Individual stomach contents from each subarea in each year were pooled into a single sample for DNA extraction in the following manner. From each blender-homogenized stomach content, a volume of homogenate at a proportion of 1 uL to 1 g stomach content wet weight was pooled. Table 1 shows the total wet weights of all stomach contents per subarea per year and the corresponding pooled homogenate volumes. Genomic DNA was extracted using the AccuPrep Genomic DNA Extraction Kit (Bioneer, Republic of Korea) with slight modifications to the manufacturer’s protocol. Six volumes of tissue lysis buffer were added to the pooled samples and homogenized using FastPrep-24 (MP Biomedicals, USA). The extracted genomic DNA was quantified using NanoDrop One (Thermo Scientific, USA) and stored in a freezer at −20 °C until further use. Individual DNA for quantitative analysis of major prey organisms was randomly selected and extracted from 50 individuals according to small-scale research units (SSRUs). Then, 100 uL of the homogenized sample was used for DNA extraction using the AccuPrep Genomic DNA Extraction Kit (Bioneer, Republic of Korea), according to the manufacturer’s protocol. For quantitative analysis, the extracted DNA was stored in a freezer at −20°C.

Table 1 Stomach samples of Dissostichus mawsoni used in this study.
An amplicon library was constructed to analyze the Antarctic toothfish diet by metabarcoding using the universal metazoan cytochrome c oxidase subunit I (COI) primer (barcode size 463bp) (Yoon et al., 2017). The library preparation protocol used was slightly modified from Yoon et al. (2017). First PCR was performed to amplify the target gene. The PCR mixture contained 10 ng of genomic DNA, 100 μM of each primer (COIMISQF1: 5′-ATNGGNGGNTTYGGNAA-3′; COIMISQR1: 5′-TANACYTCNGGRTGNCC-3′), 2 μL of dNTPs (2.5 mM each), 0.2 μL of Ex Taq Hot Start Version (2 U) (TaKaRa Bio Inc., Japan), 2 μL of 10× buffer, and 3% dimethyl sulfoxide, and DNase/RNase-free distilled water was added to a final volume of 20 μL. Each sample was amplified in triplicate. The first PCR began with an initial denaturation at 94°C for 5 min, followed by 12 cycles (18 cycles for the second PCR) at 94°C for 30 s, 48°C for 30 s, and 72°C for 30 s, ending with a final extension at 72°C for 5 min. The first PCR products were purified using the AccuPrep PCR Purification Kit (Bioneer, Republic of Korea) and eluted with 20 μL of TE (Tris-EDTA) buffer at pH 8.0. The second PCR (approximately 570 bp) was performed using an adapter-tagging primer and the Illumina Nextera XT Index Kit (Illumina, Inc., USA). The second PCR (final volume, 20 μL) contained 6 μL of the first PCR amplicons, 100 μM of each primer for adapter-tagging (NXCOIMISQF2: 5′-TCGTCGGCAGCGTCAGATGTGTATAAGAGACAGGGNGGNTTYGGNAAYTG-3′; NXCOIMISQR2: 5′-GTCTCGTGGGCTCGGAGATGTGTATAAGA GACAGGGRTGNCCRAARAAYCA-3′), 2 μL of dNTPs (each 2.5 mM), 0.2 μL of Ex Taq Hot Start Version (2 U) (TaKaRa Bio Inc., Japan), and 2 μL of 10X buffer. The expected amplicons from the second PCR were used as templates for indexing PCR (approximately 630 bp) using the Nextera XT index kit (Illumina, USA). The constructed library was quantified using a Quantus Fluorometer (Promega, USA) and sequenced using the Illumina MiSeq system (2 × 300 bp). For library construction, PCR without template DNA was used as a negative control.
The raw reads were imported into the CLC Genomics Workbench v.8.0 (Qiagen Inc.) for adapter and index trimming using the default algorithm. Quality values < 20 sequences were removed, and under-read lengths of 100 nucleotides were filtered. The primers were removed from the reads using Cutadapt v.2.10 (Martin, 2011). The trimmed reads were inferred as correct amplicon sequence variants (ASV) using the DADA2 v.1.20.0 package in R (Callahan et al., 2016), following the DADA2 Pipeline v.1.16. The reads from which the primer was removed were filtered using ‘filterAndTrim’ according to the command with maxN=0, maxEE (maximum expected errors)=2, truncQ (truncate quality score)=2. After merging paired ends, a sequence other than the target length, 463 bp, were removed from the sequence table through the following command ‘seqtab[,nchar(colnames(seqtab)) %in% 462:464]’. Chimeric sequences were removed with ‘removeBimeraDenovo’, using the default method (consensus). The generated ASVs were used for post-clustering curation using the LULU algorithm v.0.1.0 (Frøslev et al., 2017) to detect erroneous clusters, considering sequence similarity and co-occurrence patterns. The ‘minimum_match’ was modified to 90, and other values were performed as default following the protocol (https://github.com/tobiasgf/lulu). Taxonomic assignments were obtained from the GenBank nucleotide database using BLAST+ v.2.12.0 (https://blast.ncbi.nlm.nih.gov/Blast.cgi). Of these, Representative sequences were assigned to species (at least 99% identity with the first hit) and genus (90%), and sequences with less than 90% identity were classified as “Unknown.” The haplotypes obtained by metabarcoding were built with a maximum likelihood tree of MEGAX using a bootstrap of 1000 and Kimura 2-parameter model (Kumar et al., 2018). Analysis of similarities (ANOSIM) and similarity percentages (SIMPER) were used to show differences between the community structures of prey organisms. A sample similarity matrix was constructed using the Bray–Curtis algorithm in PRIMER v.7, using a data matrix containing square root transformed count data of relative read abundance (Clarke et al., 2014). Heat maps and non-metric multidimensional scaling (nMDS) plots were constructed using PRIMER v.7.
A long COI region of genus Macrourus was amplified using Fish-BCL (5′-TCAACYAATCAYAAAGATATYGGCAC-3′) and Fish-BCH (5′-TAAACTTCAGGGTGACCAAAAAATCA-3′) primers (Baldwin et al., 2009). Amplicons were purified using an AccuPrep Gel Purification Kit (Bioneer, Republic of Korea), according to the manufacturer’s protocol. Amplicons were sequenced using the Sanger method (Macrogen, Republic of Korea). To quantify the copy numbers of M. caml and M. whitsoni in the stomach contents of D. mawsoni, species-specific primers and probes were designed and commercially synthesized (Macrogen, Republic of Korea) (Supplementary Data 3). The mixture for quantitative PCR (qPCR) contained forward and reverse primers (10 pmol/mL each), Taqman probe (5 pmol/mL each), 10 μL Luna Universal Probe qPCR Master Mix (New England Biolabs Inc., UK), and 1 μL of individual stomach content DNA as a template. PCR was conducted using a Mic qPCR Cycler (Bio Molecular Systems, Australia) under the following conditions: denaturation at 95°C for 1 min, followed by 30 cycles of 95°C for 30 s, 67°C for 15 s, and 72°C for 15 s. The standard curves for both M.caml and M.whitsoni were based on the constructed pGEM-T Easy Vector plasmids (Promega, USA) containing the long COI region of each fish. The concentration of the template plasmid was 10-fold serially diluted from 10 ng to 0.01 pg (Supplementary Data 4).
First, 1,777 stomach contents of D. mawsoni were collected for five-years from 2016 to 2020. Among them, 999 and 778 specimens were collected from subareas 88.3 and 58.4, respectively (Table 1 and Supplementary Data 1). The average body length of the collected fish was 135.13 ± 26.87 cm in subarea 88.3, approximately 8.14 cm shorter than the body length of those in subarea 58.4 (143. 40 ± 16.31 cm). As for body length, a 3.29 kg higher average body weight was identified in the fish collected from subarea 58.4 (39.04 ± 13.63 kg) compared with those from subarea 88.3 (35.75 ± 17.11 kg). Furthermore, the average water depths of the sample were similar, which are 1,402.54 ± 305.01 m and 1,378.94 ± 157.43 m in subareas 88.3 and 58.4, respectively.
Metabarcoding of the stomach contents was conducted using seven samples pooled by year and region (Table 2). After bioinformatics analysis of the raw reads generated by MiSeq sequencing, 3,306,207 non-chimeric merged reads were obtained and used for further analysis. The average proportion of those merged reads in each pooled sample was 67.24%, ranging from 46.64–81.39%, indicating a high degree of sequencing quality. As a result of ASV analysis, 105 haplotypes covered 45 genera and 29 families (Figure 2). Among them, 88 haplotypes showed sequence identity higher than 99% with the GenBank database (https://www.ncbi.nlm.nih.gov/genbank), equivalent to 83.81% of the total haplotypes, indicating a sufficient amount of reference sequence data in the region. Eighty-eight haplotypes with high sequence identity to the database were assigned to 50 species (Table 3; Figure 2). Only genus names were assigned for nine haplotypes with identity lower than 99%, and the other eight haplotypes with less than 90% sequence identity were classified as “Unknown” (Table 3). Among eight “unknown” haplotypes, six showed 73%–77% identity with arthropods (Neoalbionella sp., MH748704), whereas the other two “unknown” haplotypes showed 82% and 78% identity with Annelida (Polychaeta gen. sp., KJ736517) and Mollusca (Argopecten ventricosus (G. B. Sowerby II, 1842), KT161261), respectively. Furthermore, 70/76 haplotypes (92.11%) belonging to fish taxa showed a high degree of sequence identity with the database (99%–100%). Among six haplotypes with low sequence identity to the database, one showed 98.69% identity with Anotopterus vorax Regan, 1913 (Southern Ocean daggertooth, EU148072). Because only one species in the genus is known, the haplotypes were assigned to A. vorax (Table 3). Two haplotypes showed 98.92% and 96.54% identity to Magnisudis prionosa Rofen, 1963 (Southern Barracudina, GU805997), and their occurrence was identified in both subareas. Since it was the only species in the genus that was found in the Southern Ocean, these two haplotypes were assigned to M. prionosa (Duhamel et al., 2014; Priede, 2017). Further studies should be conducted to accurately identify this genus. One haplotype in the genus Lycodes, which showed 98.27% identity with Lycodes raridens Taranetz & Andriashev, 1937 Marbled eelpout, NC_053740), was assigned as Lycodes sp. Another haplotype in the genus Cryodraco, which showed 97.64% identity with Cryodraco antarcticus Dollo, 1900 (long-fingered icefish NC_045285), was assigned as Cryodraco sp. (Table 3). However, this occurred only once, with a low proportion (<0.01%) in subarea 58.4. One haplotype in the Elasmobranchii showed 100% sequence identity to Bathyraja n. sp. “dwarf” (P.40900NIWA in BOLD systems, EU119851). Collectively, only 3.95% of fish haplotypes were not assigned to the species level, supporting the accurate diet analysis of D. mawsoni.
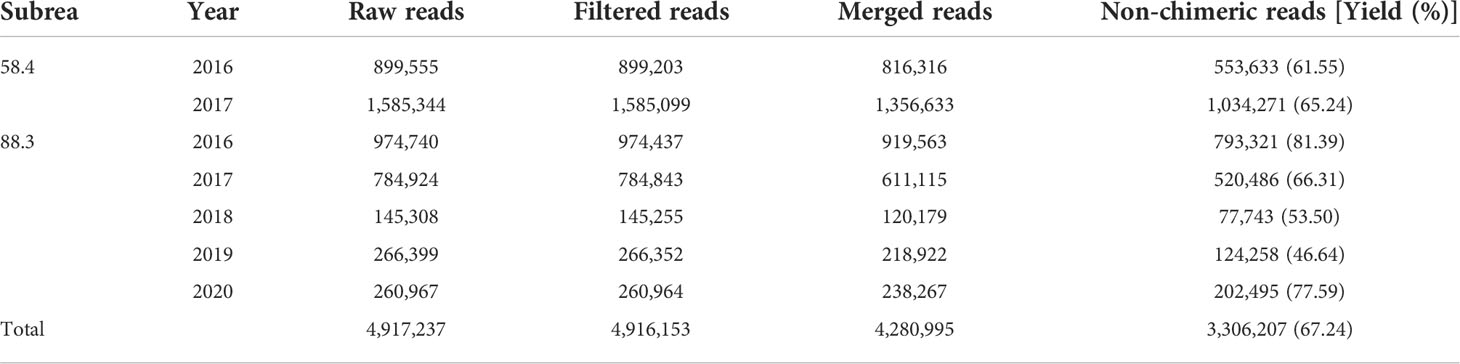
Table 2 Summarized metabarcoding results of the stomach contents of Dissostichus mawsoni.
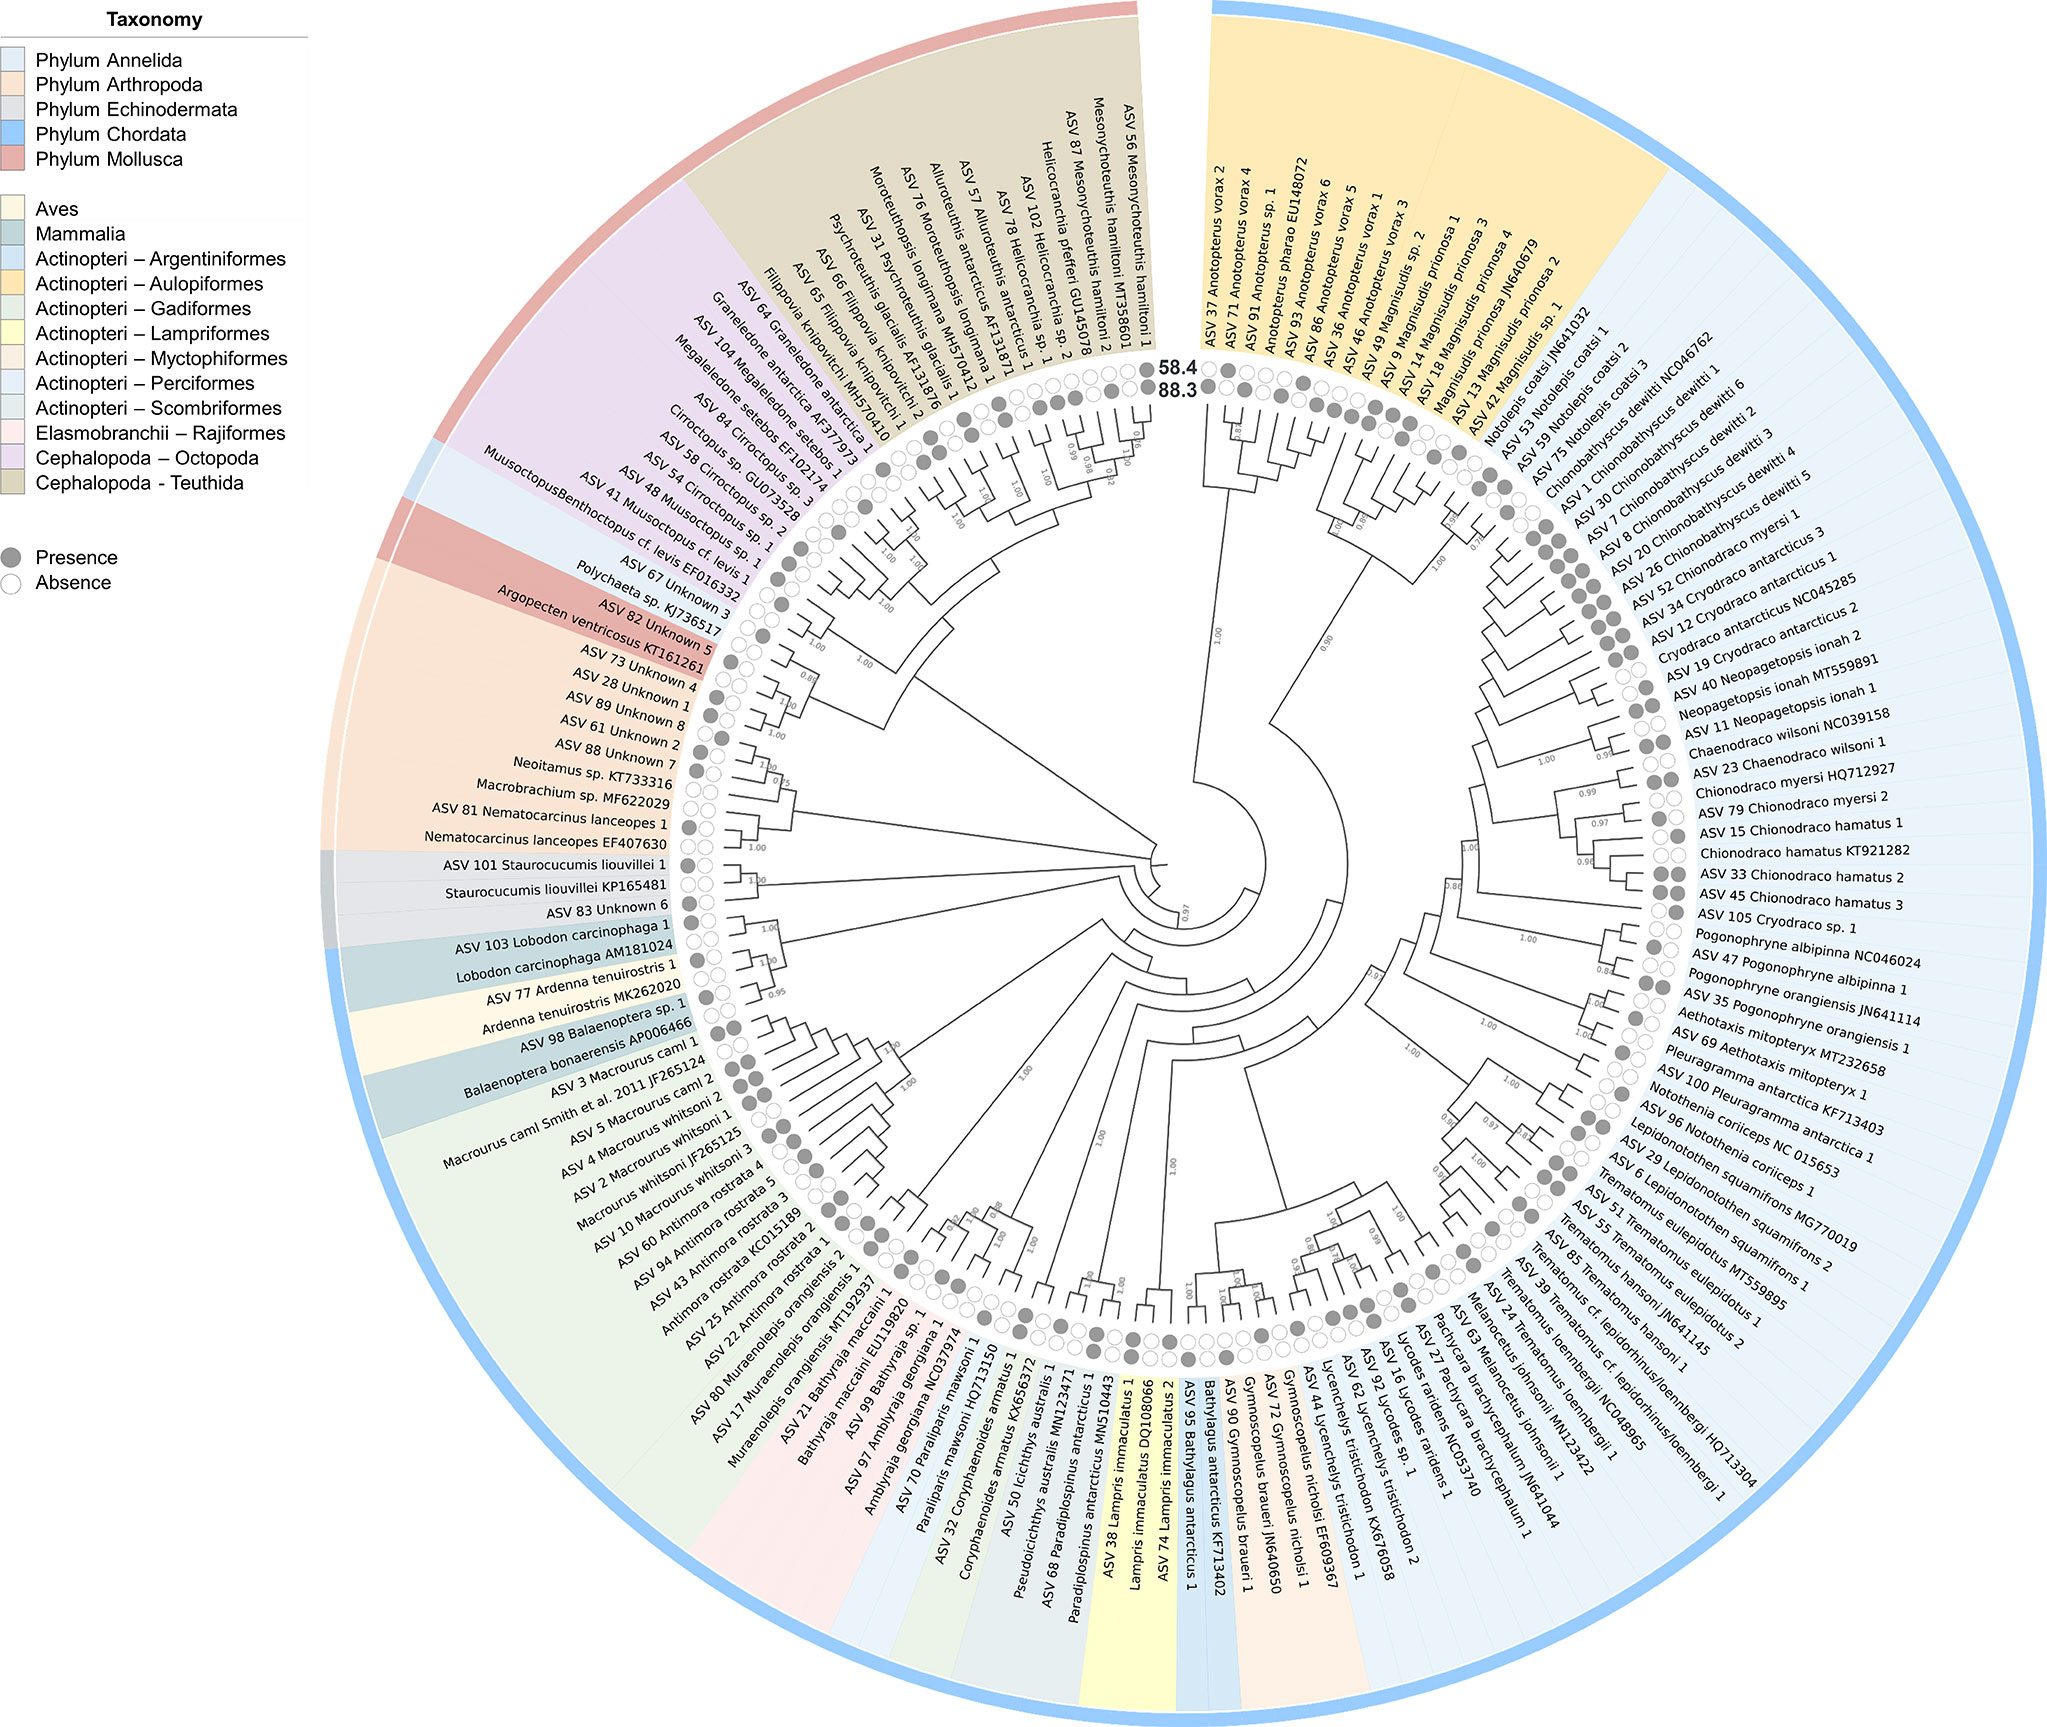
Figure 2 Prey haplotypes of Dissostichus mawsoni determined via metabarcoding analysis. A maximum-likelihood phylogenetic tree was generated using the prey haplotype of D. mawsoni and reference sequences in GenBank. A tree was created using MEGAX with a Kimura 2-parameter model and 1000 bootstrap replication. The tree was annotated in iTOL for taxonomy, haplotype presence, and bootstrap values (Letunic and Bork, 2021). Supplementary Data 2 includes information on the reference sequences used for phylogenetic analysis.
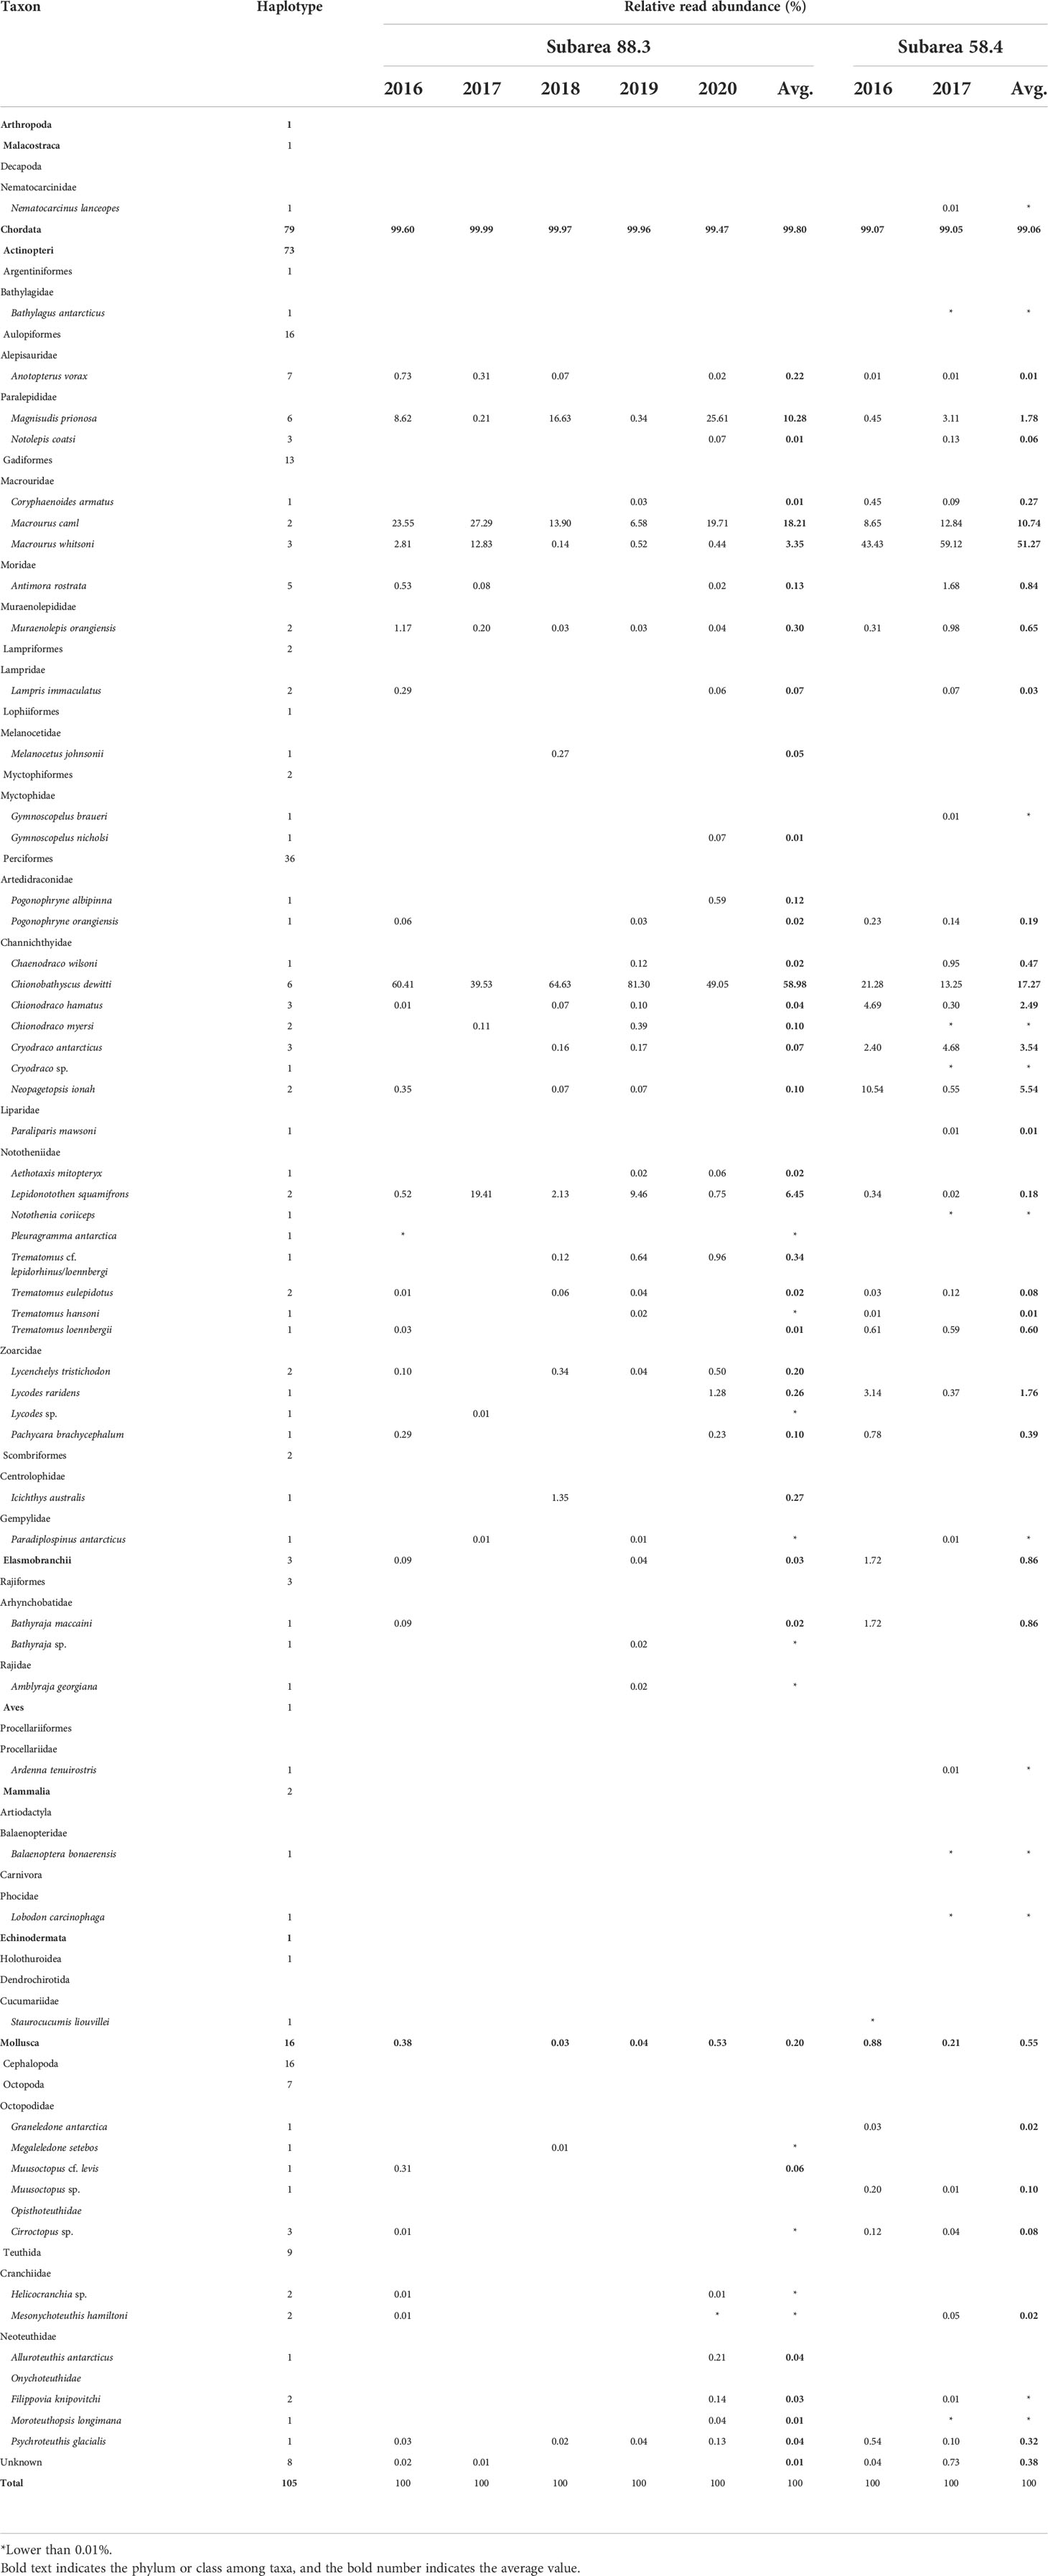
Table 3 Prey organisms of Dissostichus mawsoni in subareas 88.3 and 58.4.
Most prey haplotypes belonged to fish taxa (76), followed by Molluscs (16), “unknown” (8), Arthropod (1), Echinoderm (1), Mammal (2), and Avian (1). Seventy-six piscine haplotypes consisted of two classes: Actinopteri (73) and Elasmobranchii (3). Additionally, 73 haplotypes in the class Actinopteri were further classified into eight orders: Perciformes (36 haplotypes with 20 species), Aulopiformes (16 haplotypes with three species), and Gadiformes (13 haplotypes with five species) (Figure 2). All 16 molluscan haplotypes belonged to cephalopods, and nine and seven belonged to Teutida and Octopoda, respectively (Table 3). One arthropod and one echinoderm haplotype were Nematocarcinus lanceopes (Spence Bate, 1888) (EF407630) and Staurocucumis liouvillei Vaney, 1914 (KP165481), respectively. The avian haplotype was identified as a Ardenna tenuirostris (del Hoyo and Collar 2014) (short-tailed shearwater, MK262020, 100%), whereas two mammalian haplotypes were identified as the Balaenoptera bonaerensis (Burmeister, 1867) (Antarctic minke whale, AP006466, 91.36%) and the Lobodon carcinophaga (Hombron & Jacquinot, 1842), (Crabeater seal, AM181024, 99.35%), respectively.
Averaged proportions of fish preys in all pooled samples were higher than 99%, ranging from 99.05–99.99%. The second most abundant prey belonged to cephalopods, with proportions ranging from 0.03–0.88% (Table 3). Psychroteuthis glacialis (Thiele, 1920) (glacial squid) was the most widely identified prey among the 16 haplotypes in the cephalopods. Among fish prey, those in the Elasmobranchii occupied less than 1%, whereas most fish belonged to Actionpteri (Table 3). In subarea 88.3, Chionobathyscus dewitti Andriashev & Neyelov, 1978 (Antarctic icefish) was the most abundant prey species, occupying 58.98% on average, followed by Macrourus caml (McMillan, Iwamoto, Stewart & Smith, 2012) (Caml grenadier, 18.21%) and M. prionosa (10.24%). In subarea 58.4, Macrourus whitsoni (Regan, 1913) (Whitson’s grenadier) was the most abundant prey, occupying 51.27% on average (Table 3). C. dewitti (17.27%) and M. caml (10.74%) were the second- and third most abundant prey species. Collectively, fish belonging to Macrouridae and Channichthydae were among the main prey items of D. mawsoni (Table 3).
Among the most abundant prey organisms of D. mawsoni, two haplotypes in the genus Macrourus were identified as M. caml and M. whitsoni, which were determined by both bioinformatics sequence similarity and phylogenetic analyses (Table 3; Figure 3A). However, these two species shared 99.35% sequence identity with only three base differences in barcode region, and some of sequences deposited in the GenBank did not correspond to the phylogenetic relationship, which strongly requires reconfirmation of their identification. Therefore, we re-examined the Macrourus haplotypes in all individual stomach contents of D. mawsoni using the longer COI barcodes (Fish-BCL and Fish-BCH, 652 bp) (Figure 3B). After comparing phylogenetic relationships of all the available COI barcodes obtained from the individual stomach samples and GenBank database, we reconfirmed two distinct species, M. caml (JF265124, 100%) and M. whitsoni (JF265125, 100%), respectively, which reconfirmed the previous results (Mcmillan et al., 2012). The primer sets for the two Macrourus species were designed based on their unique sequences, without any intra-species variation.
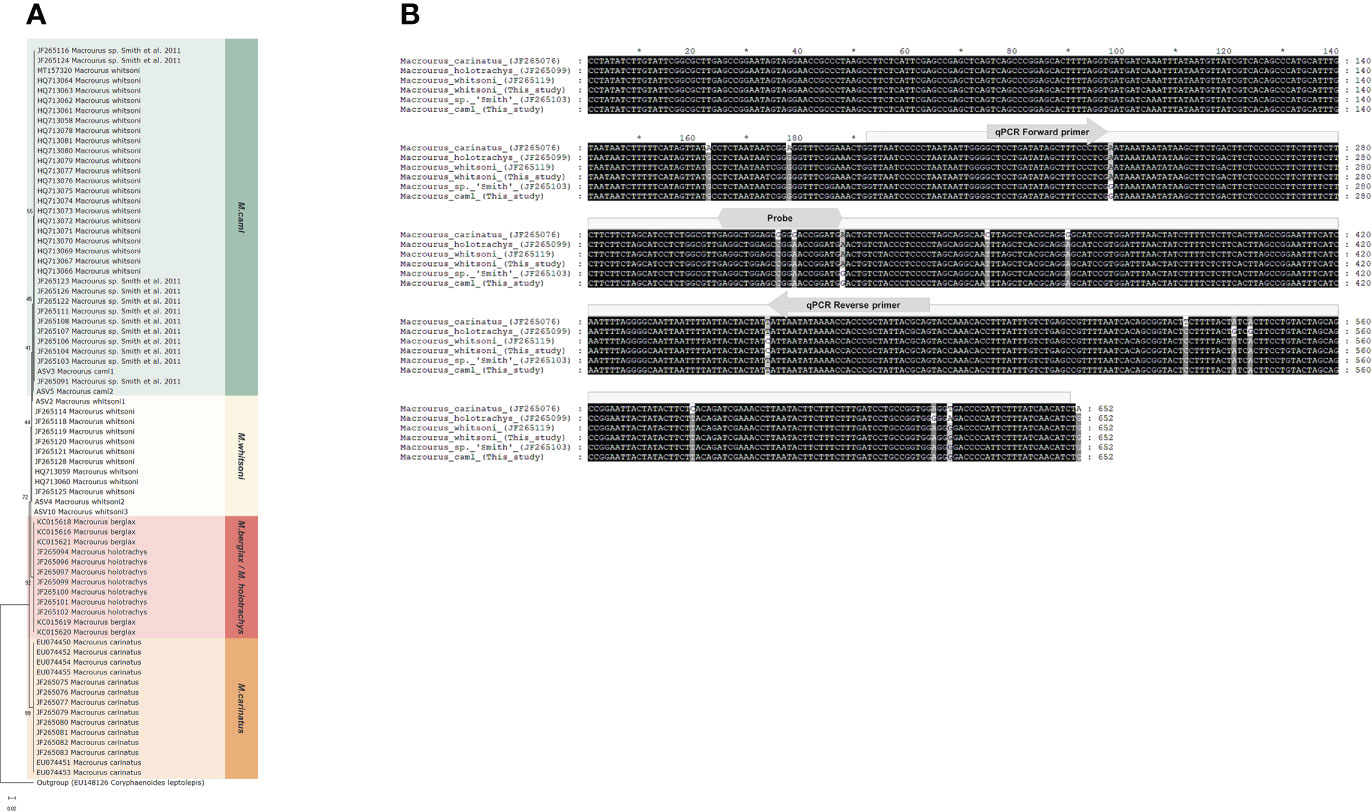
Figure 3 Genetic comparison of five species in the genus Macrourus. (A) Phylogenetic tree of the genus Macrourus based on the cytochrome c oxidase subunit I (COI) barcode region used in this study. COI sequences of genus Macrourus were obtained from the GenBank database. Minimum evolution tree was constructed using Kimura 2-parameter model and 1000 bootstrap replication by MEGAX. The sequence information for the five species of Macrourus is provided in Supplementary Data 2. (B) Multiple sequence alignment of the genus Macrourus COI generated using the universal COI primer set (Fish-BCL, Fish-BCH). The box with diagonal lines represents the metabarcoding regions used in this study. The arrow and hexagon indicate the quantitative polymerase chain reaction (qPCR) primer set and probe regions of Macrourus caml and Macrourus whitsoni. *A mark that separates 10 base pairs.
Quantitative analysis of two Macrourus prey species, D. mawsoni, M. caml and M. whitsoni, was conducted using a quantitative PCR technique with 50 individual stomach contents randomly selected from each SSRUs. The distribution patterns of M. caml and M. whitsoni were significantly different between the subareas (88.3 and 58.4%, respectively; Figure 4). In subarea 88.3, much higher numbers of D. mawsoni ate M. caml than M. whitsoni. However, in subarea 88.3, M. caml was detected in 35% of the individual stomachs on average, ranging from 18% in 88.3D to 52% in 88.3B, whereas only 7.75% of individuals contained M. whitsoni (Figure 4). In contrast, in subarea 58.4, the abundance of the two Macrourus prey species showed a different pattern among the three SSRUs. Furthermore, 82 and 72% of individual D. mawsoni contained M. whitsoni in their stomachs at 58.4.1C and 58.4.1E, respectively, whereas M. caml was detected in only 4 and 6% of them (Figure 4). Unlike the two SSRUs in 58.4, M. caml and M whitsoni were detected with similar occurrence numbers in 58.4.1. G (Figure 4).
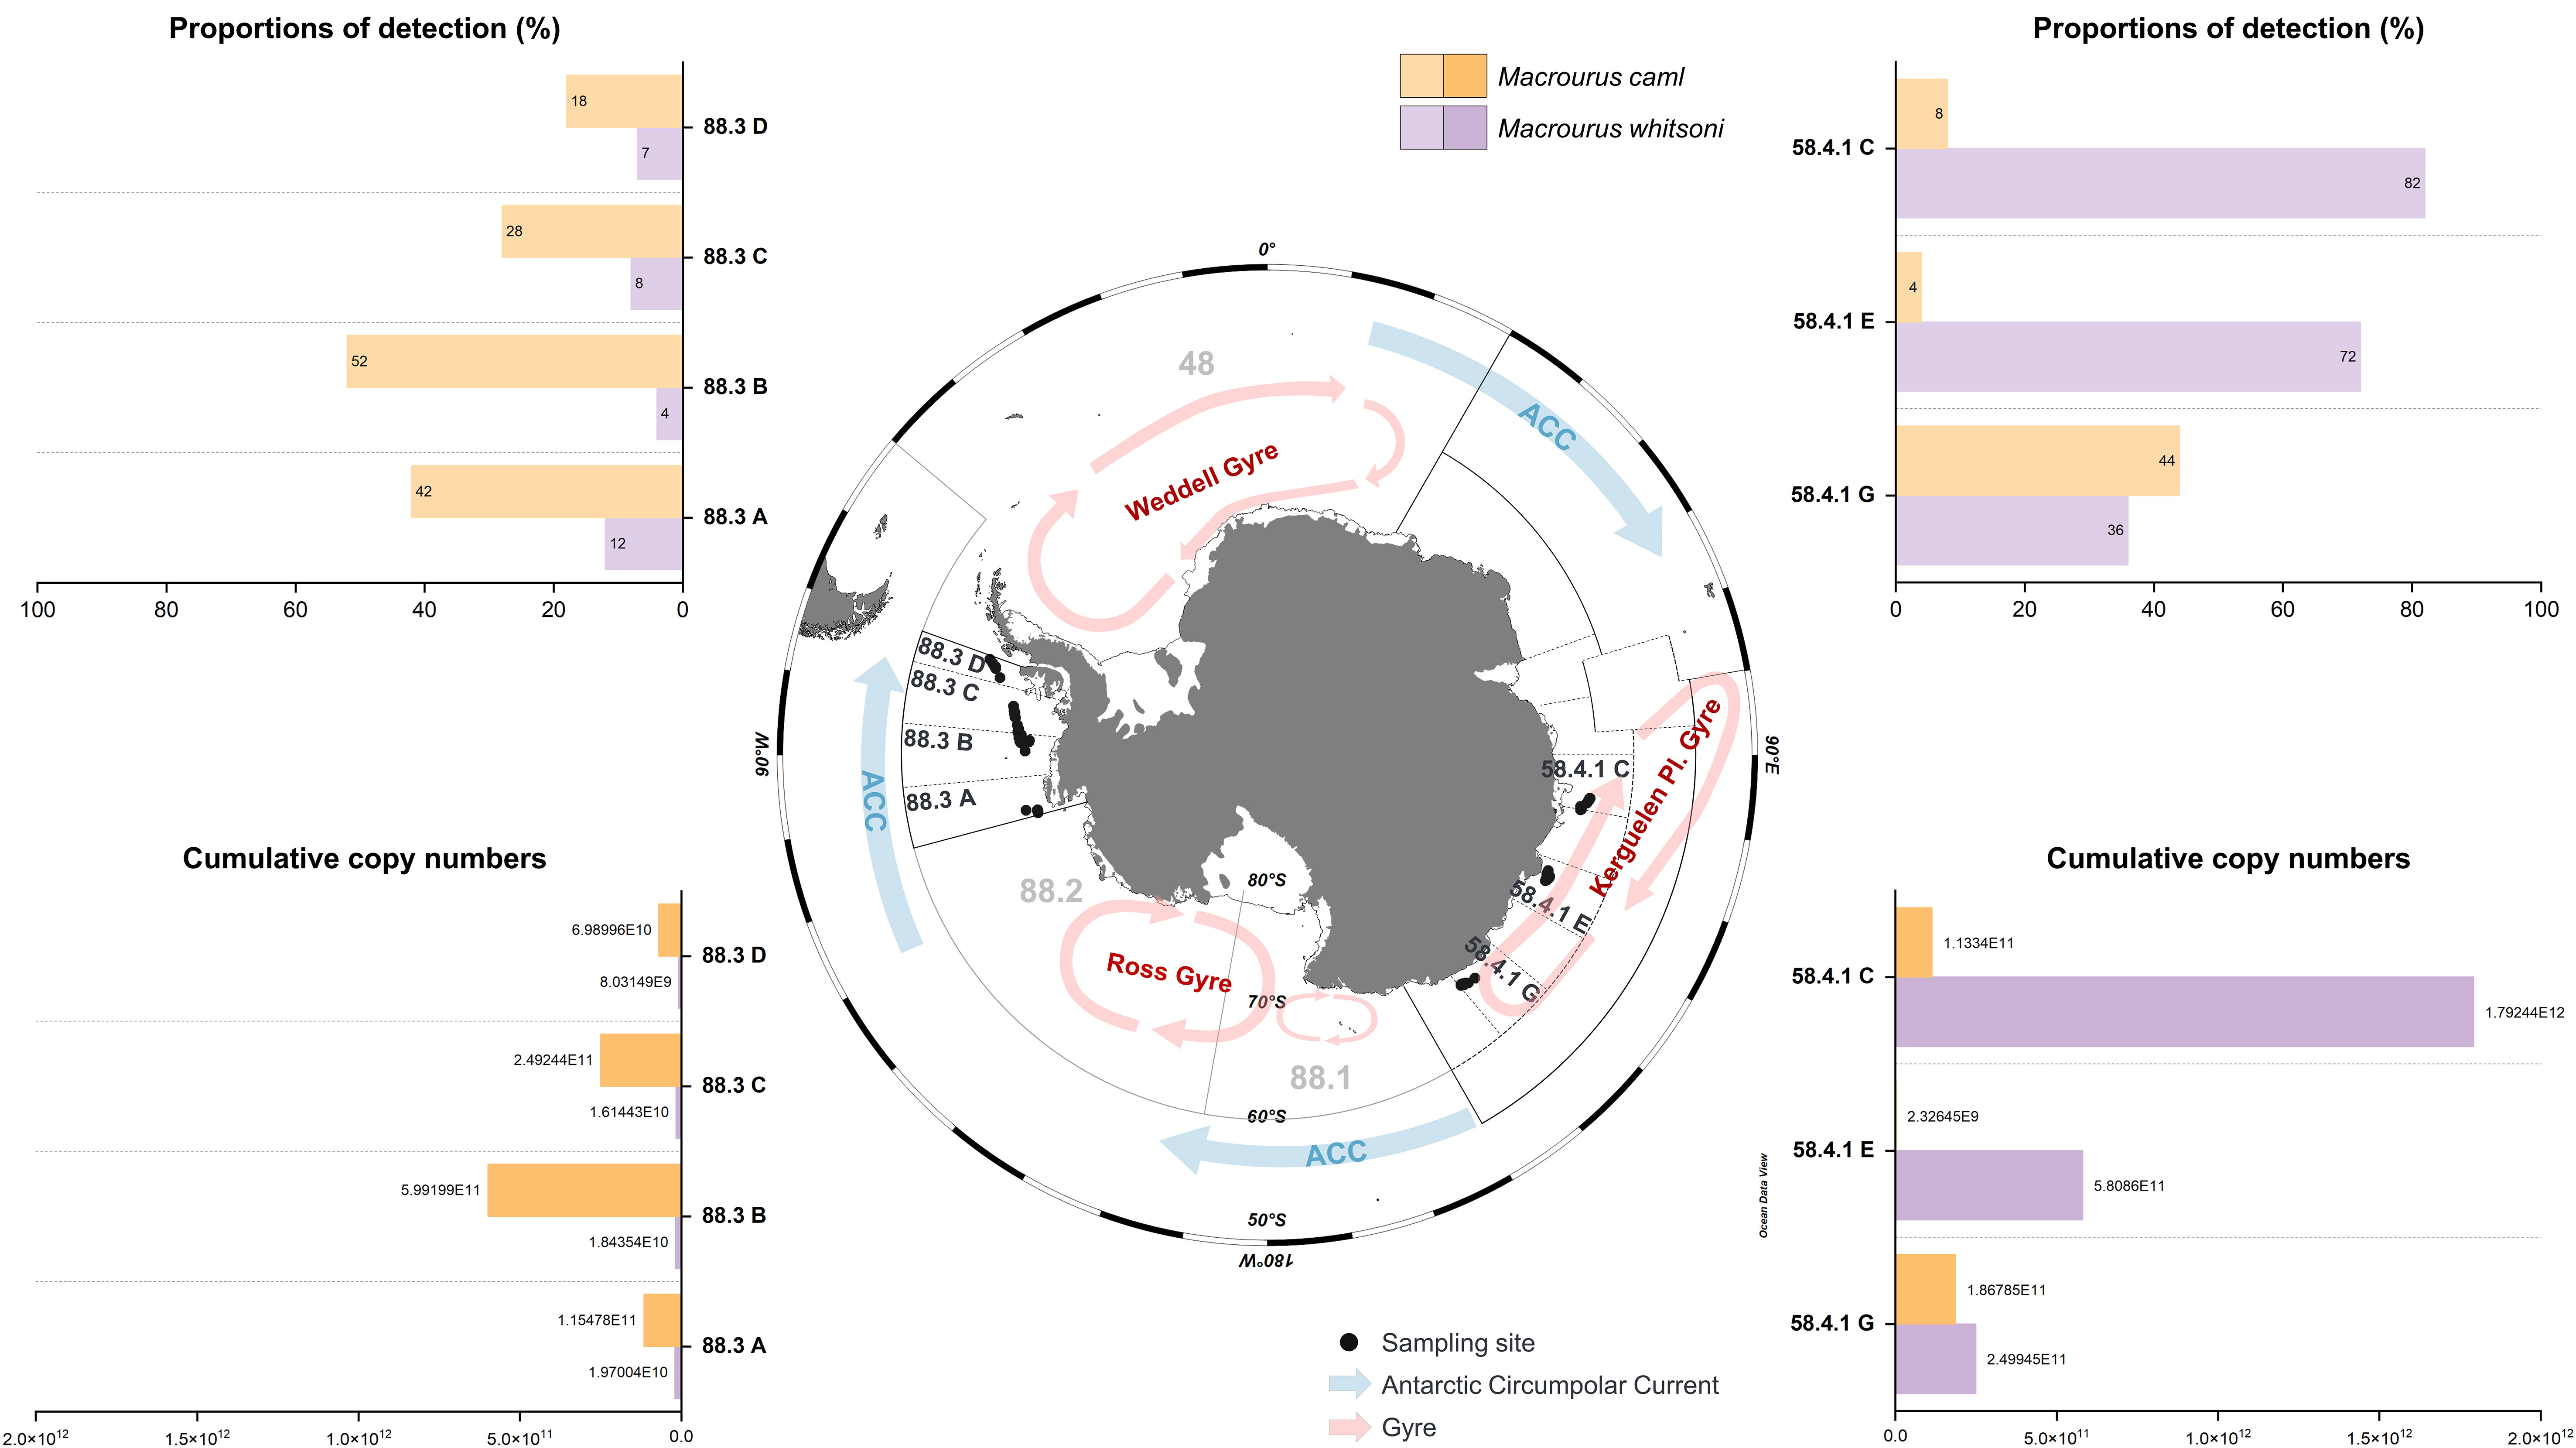
Figure 4 Quantitative analysis of two species of the genus Macrourus as preys of Dissostichus mawsoni. Proportions of detection (%) and cumulative copy numbers were measured using qPCR. Black dots indicate the collection sites in the small-scale research units (SSRUs) of each subarea (58.4.1 and 88.3). Three gyres (red) and the Antarctic Circumpolar Current (ACC, blue) are shown by arrows.
The biomass of each Macrourus species showed a pattern similar to that of its detection number (Figure 4). A high degree of correlation was identified between the detection number and cumulative copy number (M. whitsoni: y = 7.411x − 3.5795, R2 = 0.9996; M. caml: y = 6.9586x − 0.0781, R2 = 0.9939). The highest cumulative copy number of M. caml was identified in 88.3B (59,919,907 copy numbers/104), which was 258-folds higher than that in 58.4.1E (232,644 copy numbers/104) (Figure 4). In contrast, the highest numbers of M. whitsoni were identified at 58.4.1C (179,243,756 copy numbers/104), which was 223-folds higher than that at 88.3D (803,149 copy numbers/104). The copy numbers of M. whitsoni and M. caml in D. mawsoni were 2,441,413 and 1,363,542 copy numbers/104, respectively. This may reflect the higher average biomass of M. whitsoni for each Antarctic toothfish as prey compared with that of M. caml.
In addition to the difference in abundance of the two Macrourus prey species, there was an additional difference in the total Macrourus prey between the two subareas (Figure 4). On average, 81% of individual D. mawsoni in subarea 58.4 ate Macrourus, whose proportion was much higher than that in subarea 88.3 (42% of individuals). Moreover, the lowest Macrourus prey detection numbers were identified in those collected from 88.3C and 88.3D, in which only 22 and 36% of them ate Macrourus, respectively. These proportions were approximately one-third of those in 58.4.1C and 58.4.1E, with proportions of approximately 87% for individual D. mawsoni (Figure 4). Two Macrourus prey species were detected simultaneously in only 3.72% (58.4: eight individuals, 88.3: five individuals) of individual D. mawsoni.
In subarea 88.3, 10 orders, 21 families, and 40 species were identified as prey for D. mawsoni, of which 33 were fish and seven species were cephalopods (Table 3; Figure 5). The most abundant prey was C. dewitti (58.98%), followed by M. caml (18.21%), M. prionosa (10.28%), Lepidonotothen squamifrons Günther, 1880 (grey rockcod, 6.45%), M. whitsoni (3.35%), and Muraenolepis orangiensis Vaillant, 1888 (Patagonian moray cod, 0.30%) (Table 3; Figure 5). Six fish species, C. dewitti, M. caml, M. whitsoni, L. squamifrons, M. prionosa, and M. orangiensis, were identified annually (Figure 5C). These six preys occupied 93.08% of total reads. However, in subarea 58.4, 15 orders, 25 families, and 37 species were identified as prey for D. mawsoni. Among these, 28 and five species were fish and cephalopods, respectively. Additionally, several low-numbered prey, including N. lanceopes (crustaceans), A. tenuirostris (avian), B. bonaerensis and L. carcinophaga (mammals), were also detected in the stomachs of D. mawsoni. Furthermore, M. whitsoni was the most abundant, occupying 51.27% on average, followed by C. dewitti (17.27%), M. caml (10.74%), Neopagetopsis ionah Nybelin, 1947 (Jonah’s icefish, 5.54%), C. antarcticus (3.54%), Chionodraco hamatus Lönnberg, 1905 (Antarctic icefish, 2.49%), and L. raridens (1.76%). The cephalopods P. glacialis, Muusoctopus sp., and Cirroctopus sp. was identified annually (Table 3; Figure 5).
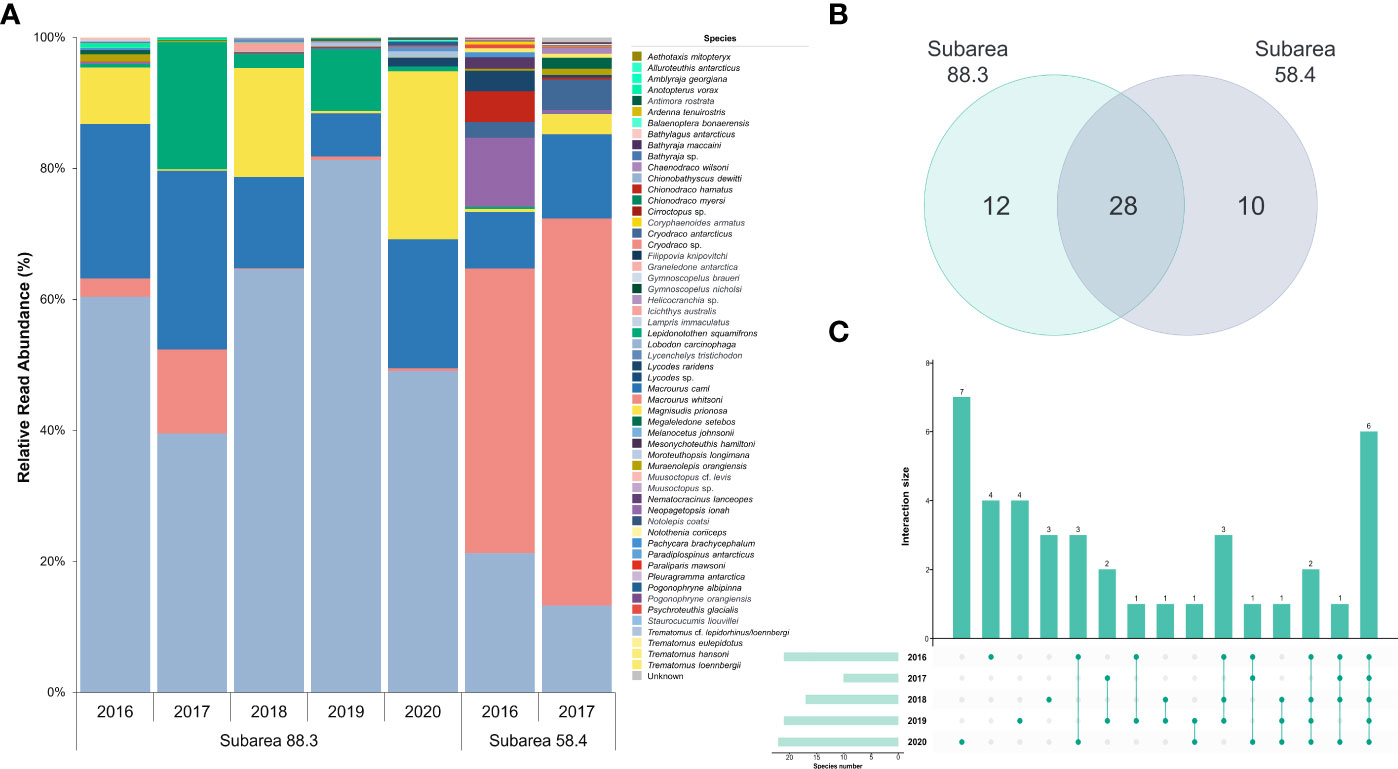
Figure 5 Annual prey composition and shared prey species of Dissostichus mawsoni. (A) Bar graph shows the relative read abundance of all prey species in different years and subareas. (B) Venn diagram shows the number of species identified as well as the shared prey species in both subareas. (C) Upset plot shows the number of shared prey species in subarea 88.3 for five years from 2016 to 2020.
Twenty-eight species (24 in fish and four in cephalopods) were the commonly identified prey taxa, with proportions of 98.85 and 99.39% in subareas 88.3 and 58.4, respectively (Figure 5B). Nine fish species, including Melanocetus johnsonii Günther, 1864 (humpback anglerfish), Gymnoscopelus nicholsi Gilbert, 1911 (Nichol’s lanternfish), Pogonophryne albipinna Eakin, 1981 (Whitefin plunderfish), and three cephalopods Megaleledone Setebos Robson, 1932, Muusoctopus cf. levis, and Alluroteuthis antarcticus Odhner, 1923 (Antarctic neosquid) were exclusively identified in subarea 88.3. In contrast, four fish [Bathylagus antarcticus Günther, 1878 (Antarctic deepsea smelt), Gymnoscopelus braueri Lönnberg, 1905 (Brauer’s lanternfish), Paraliparis mawsoni Andriashev, 1986, and Notothenia coriiceps Richardson, 1844 (Black rockcod)], a cephalopod (Graneledone antarctica Voss, 1976), and a decapod (N. lanceurocucum) were exclusively identified in subarea 58.4. Two mammals (Balaenoptera bonaerensis and L. carcinophagus) were identified exclusively in the 58.4. The exclusively identified prey taxa proportions were 1.12% in subarea 88.3 and 0.10% in subarea 54.4 (Figure 5).
Beta diversity analysis was performed to evaluate the differences and similarities in the structure of the prey community between the subareas. The prey of D. mawsoni were clustered by subarea (ANOSIM, global R = 1.000, p = 0.048) and not by year (ANOSIM global R= −0.263, p = 0.743), indicating that the diets of D. mawsoni are predominantly affected by geographical factors. As a result of the SIMPER analysis, 54.39% of dissimilarity in prey organisms was identified between subareas 58.4 and 88.3 (Table 4). Ten prey species contributed more than 70% to discriminating the diet composition of D. mawsoni between subareas 88.3 and 58.4, and which M. whitsoni showed the highest contribution value (20.17%), followed by C. dewitti (12.30%), M. prionosa (6.76%), L. squamifrons (6.23%), and N. ionah (6.09%). As a result of the nMDS analysis, the subareas were distinguished with 50% similarity. Notably, three surveys in 2016, 2018, and 2020 in subareas 88.3 were clustered together, distinguishing them from the other two in 2017 and 2019, with 70% similarity. According to the Pearson correlation between the physical parameters of each year, the depth of catch contributed to distinguishing them in subarea 88.3 (Figure 6A). The heatmap shows that the prey organisms changed according to the subarea, which is consistent with the nMDS analysis (Figure 6B). Prey organisms are primarily divided into two groups: M. caml and M. whitsoni. The first group, including M. caml, consisted of species that were mainly detected in subarea 88.3. The second group, including M. whitsoni, consisted of the species mainly detected in subarea 58.4 (cophenetic correlation: 0.86716, p < 0.05). In addition, a distinct group of subareas 88.3 identified in nMDS that the proportion of L. squamifrons and M. prionosa contributed to distinguishing annual groups (Figure 6B). These results strongly indicate that the prey species were regionally different, reflecting the fish assemblage of each research site.
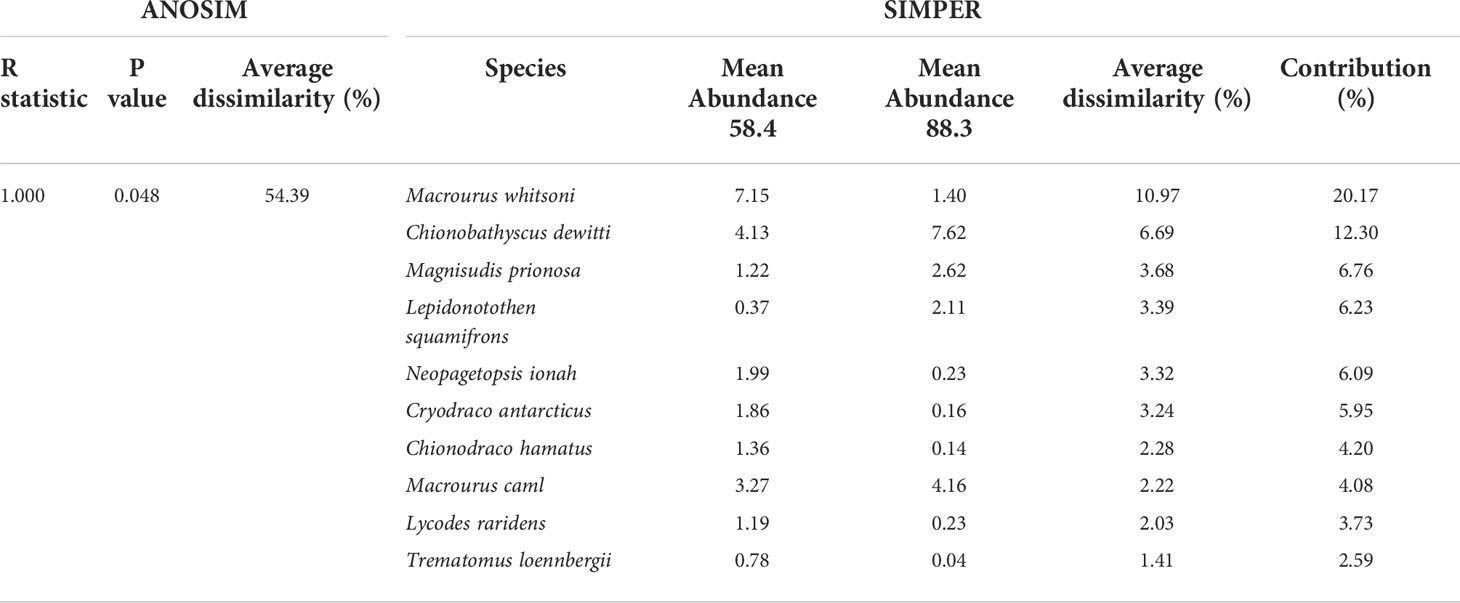
Table 4 Results of the analysis of similarities (ANOSIM) and similarity percentages (SIMPER) analysis of the abundance of discriminating prey items in subareas 88.3 and 58.4.

Figure 6 Non-metric multidimensional scaling (nMDS) plot and heatmap analyses of the prey compositions of Dissostichus mawsoni. (A) nMDS was based on Bray–Curtis similarity for the prey organism community between subareas 88.3 and 58.4. Dots represent each year in the two subareas. Blue dotted and green lines represent the hierarchical clustering similarity in the two subareas. Gray line represents the Pearson correlation between the physical parameters of each subarea. (B) Heatmap was based on the relative read abundance of prey organisms for each year, and a row dendrogram was generated using a hierarchical cluster based on Bray–Curtis similarity. The column dendrogram was based on cluster analysis of each species via cophenetic correlation.
This study analyzed the diet of Antarctic toothfish, D. mawsoni, using metabarcoding, indicating a high degree of reference sequences for Antarctic marine organisms in the database. Among 105 haplotypes, 88 haplotypes (83.81%) showed sequence identity higher than 99% identity in the database. Especially, 92.11% of fish haplotypes were accurately assigned, providing clear information about the diet of the piscivorous D. mawsoni. Compared with those for bony fish species, reference sequences for cartilaginous fish and invertebrate species should be further supplemented for dietary studies of non-piscivorous species. Six of the nine haplotypes assigned to the genus level corresponded to cephalopods. Primarily, molluscan detection should be highly variable by geographical differences, and their reference sequences should provide useful biogeographic information about the diets of Antarctic toothfish. One haplotype was identified as Bathyraja n. sp. “dwarf” in Subarea 88.3. According to the Register of Antarctic Marine Species, seven species are currently reported in the genus Bathyraja. Further studies should be conducted to obtain accurate species identification and biogeographic information. Additionally, we identified 105 haplotypes as the prey of D. mawsoni, covering 29 families and 45 genera in subareas 88.3 and 58.4, respectively, from the five-year survey. Each year, the numbers of newly identified species were five on average, a proportion of only 0.94% of total prey species. This result indicated that the abundant prey species had been identified by metabarcoding for five years in subarea 88.3. However, we also identified that three to seven new species were detected each year for five years, which suggests that more stomach metabarcoding is still worth obtaining more species in each subarea.
The proportion of fish species in all annual samples was higher than 99%, which supports the previous results that D. mawsoni is piscivorous (Fenaughty and Stevens, 2003; Roberts et al., 2011; Stevens et al., 2014; Hanchet et al., 2015; Park et al., 2015; Yoon et al., 2017; Seong et al., 2021). However, metabarcoding analysis of five-year stomach contents provides useful data for accurate species identification by molecular methods. Compared with the three previous studies by morphological identification in the Lazarev Sea (Petrov and Tatarnikov, 2011), South Sandwich Islands (Roberts et al., 2011), and Ross Sea (Stevens et al., 2014), we additionally identified 33 fish prey, including Macrourus caml Magnisudis prionosa, Pogonophryne albipinna, and Trematomus eulepidotus Regan, 1914. In addition to fish species, four molluscan species were identified: Filippovia knipovitchi Filippova, 1972, Graneledone antarctica, Muusoctopus (Benthoctopus) cf. levis, and Megaleledone setebos. Additionally, we separately analyzed two closely related species, M. caml and M. whitsoni. Although M. caml was reported as a new species in 2012 (Mcmillan et al., 2012), it is still challenging to discriminate using morphological analysis. Besides morphological similarities, the two species share 99.54% within the long COI region. After archiving the multiple haplotypes obtained from the five-year stomach contents, we distinguished each species based only on the difference in the nucleotide sequence. Collectively, a long-term metabarcoding analysis of stomach contents would provide genetic information about marine organisms of the habitats of D. mawsoni.
We designed M.caml and M.whitsoni species-specific primers with high efficiency and accuracy based on reliable haplotypes for each species obtained by metabarcoding over five years. Owing to the high degree of similarity in morphological characteristics, it has been challenging to discriminate these two Macrourus species from the stomach contents of Antarctic toothfish by traditional visual observation. In addition, several previously deposited reference sequences in the database were not in accordance with the phylogenetic relationship, which requires additional analysis for accurate identification of the main prey of D. mawsoni. Here, we reconfirmed the previous result of Mcmillan et al. (2012) and found that some of the previously deposited reference sequences may not be correct. The sequence difference between these two macrourus species was 99.35%, and some of incorrect reference sequences may cause misidentification of prey species. Therefore, an accurate reference database is essential for successful metabarcoding analysis of diet studies in Antarctic toothfish. In particular, notothenioid fish, the other main prey of D. mawsoni, have recently evolved as a result of adaptive radiation in stable cold water, exhibiting a high degree of sequence similarity among the species (Kim et al., 2019). Therefore, as shown in Macrourus species, longer barcodes of notothenioid prey should also be examined for more accurate diet analysis of D. mawsoni. qPCR using the two species-specific primer sets designed in this study revealed a significant spatial difference between the two Macrourus species in the Southern Ocean. Although metabarcoding provided quantitative information about each prey species, qPCR was highly accurate for quantitative analysis. Although read numbers obtained by metabarcoding may reflect the abundance of each prey species, it is difficult to use a simple matrix to transform them to quantify each prey species. This is due to various factors during metabarcoding, including the number of target genes, digestibility, quality of DNA, annealing bias for each target gene by universal primers, or more (Deagle et al., 2013; Manzari et al., 2020). Owing to its high feasibility and accuracy, quantitative values obtained by qPCR can be transformed into values used in traditional feeding ecological studies. Although we investigated only two Macrourus species in this study, additional qPCR analyses for more prey species should be conducted. These results provide precise information on the feeding ecology and spatiotemporal distribution or genetic diversity of the prey species of D. mawsoni.
We determined that the stomach contents of D. mawsoni reflected the regional fish assemblage. A previous study also showed that the dispersion range of D. mawsoni was less than 50–100 km, which supports our results (Hanchet and Rickard, 2008; Hanchet et al., 2015). nMDS analysis of five-year metabarcoding results showed that the stomach contents of D. mawsoni were strongly clustered according to each subarea by approximately 70% in similarity. Other physical parameters did not significantly contribute to the difference in the prey composition of D. mawsoni between subareas 88.3 and 58.4. Although slightly higher body lengths and weights were identified for those collected from subarea 58.4, they were negligible. Since its habitat is limited to the floor of the continental shelf before attaining buoyancy at approximately 100 cm in length (Fuiman et al., 2002), the average body lengths of the collected D. mawsoni (138.75 ± 23.22 cm) were larger than the limited stages supporting physical parameters, which may not have affected the results in this study. The water depths between subareas of 58.4 and 88.3°were also similar. Therefore, differences in the prey composition of D. mawsoni between 88.3 and 58.4 may have come from the food availability of each site, supporting the idea that analysis of its stomach contents would be a good indicator to monitor any changes in fish assemblages. In this study, six and eight preys occupied more than 97.57% of subarea 88.3 and 94.40% of subarea 58.4, suggesting that a long-term study of these preys would be useful to evaluate the impact of the Antarctic toothfish fishery on the sustainability of the ecosystem.
Differences in prey composition were identified, even within each subarea. Among the five preys in subarea 88.3, two in 2017 and 2019 showed lower similarity than the other three in 2016, 2018, and 2020. D. mawsoni in 2017 and 2019 were caught at a shallower water depth than those in the other three years. Heatmap analysis showed that L. squamifrons and M. prionosa discriminated between the two groups in subarea 88.3. According to FishBase (www.fishbase.org), the main habitat of L. squamifrons ranged from 195–312 m in depth, whereas M. prionosa was found mainly from 300–800 m. This result suggests that higher proportions of L. squamifrons are due to its higher availability as prey of D. mawsoni caught in 2017 and 2019, whereas those in 2016, 2018, and 2020 had a high chance of preying on M. prionosa, which is relatively abundant in deeper water within subarea 88.3.
QPCR results of the two Macrourus species showed the regional prey availability of D. mawsoni. In addition to their regional differences between subareas 88.3 and 58.4, we identified a unique proportion in 58.4.1G, an SSRU in the subarea where M. caml and M. whitsoni were identified in a similar amount. This result indicates the difference in the distribution of the two Macrourus species; 58.4.1G is located at the edge region of the Kerguelen Plateau Gyre, which is a boundary to discriminate between the two species. Both 88.3C and 88.3D showed lower occurrence numbers than 88.3B, which showed deeper water depths. Long-term surveys are required to obtain reliable data along with collaborations among different research groups. We first showed that metabarcoding analysis of stomach contents can provide useful information about regional prey availability for D. mawsoni. Moreover, the stomach contents of D. mawsoni provide important information about the sustainability of toothfish fisheries in the Southern Ocean, which has been conducted for approximately 25 years since 1997. Due to its highest trophic level, the stomach contents of Antarctic toothfish mirror the fish assemblage of its habitats. Decreased numbers of high-trophic predator bycatch result in a series of knock-on effects throughout all trophic levels in a food web, upsetting the ecological balance by altering the number of different species (Ripple and Beschta, 2006). Therefore, any change in the prey composition of each designated habitat may be an important sign of the adverse impacts of D. mawsoni catch. In addition to the impact of human activities, ecosystems in the Southern Ocean have been facing considerable change for at least the last 30 years due to climate change, which includes increased water temperature, changes in areas, and seasonality of sea ice (Constable et al., 2014). These considerable changes may alter the fish assemblage of the ecosystem, replacing those with low tolerance to high temperatures with lower latitude species in the long term. Therefore, the stomach contents of D. mawsoni are useful indicators of climate change. Moreover, long-term monitoring of the diet of D. mawsoni using metabarcoding analysis established in this study can aid in addressing these issues in the Southern Ocean.
The datasets presented in this study can be found in online repositories. The names of the repository/repositories and accession number(s) can be found below: https://www.ncbi.nlm.nih.gov/, PRJNA809505.
This study does not violate animal ethics, as the stomachs were collected from by-products (i.e., waste - skin, bones, entrails, or flesh) generated the commercial fishing of Antarctic toothfish.
SL designed and performed the experiments and analyzed the data, prepared figures and tables, and drafted the manuscript. S-GC, SC and DK supported fieldwork for Antarctic toothfish sampling. C-KK and H-WK conceived the experiments, analyzed the data, reviewed drafts of the manuscript, and approved the final draft. All authors contributed to the article and approved the submitted manuscript.
This research was supported by the distant-water fisheries resources assessment and management of National Institute of Fisheries Science, South Korea (R2021029).
The authors declare that the research was conducted in the absence of any commercial or financial relationships that could be construed as a potential conflict of interest.
All claims expressed in this article are solely those of the authors and do not necessarily represent those of their affiliated organizations, or those of the publisher, the editors and the reviewers. Any product that may be evaluated in this article, or claim that may be made by its manufacturer, is not guaranteed or endorsed by the publisher.
The Supplementary Material for this article can be found online at: https://www.frontiersin.org/articles/10.3389/fmars.2022.888167/full#supplementary-material
Amundsen P. A., Sánchez-Hernández J. (2019). Feeding studies take guts–critical review and recommendations of methods for stomach contents analysis in fish. J. Fish Biol. 95 (6), 1364–1373. doi: 10.1111/jfb.14151
Baldwin C. C., Mounts J. H., Smith D. G., Weigt L. A. (2009). Genetic identification and color descriptions of early life-history stages of belizean phaeoptyx and astrapogon (Teleostei: Apogonidae) with comments on identification of adult phaeoptyx. Zootaxa. 2008, 1–22. doi: 10.11646/zootaxa.2008.1.1
Calhaem I., Christoffel D. (1969). Some observations of the feeding habits of a weddell seal, and measurements of its prey, Dissostichus mawsoni, at McMurdo sound, Antarctica. New Z. J. Mar. Freshw. Res. 3 (2), 181–190. doi: 10.1080/00288330.1969.9515287
Callahan B. J., McMurdie P. J., Rosen M. J., Han A. W., Johnson A. J. A., Holmes S. P. (2016). DADA2: high-resolution sample inference from illumina amplicon data. Nat. Methods 13 (7), 581–583. doi: 10.1038/nmeth.3869
Clarke K. R., Gorley R., Somerfield P. J., Warwick R. M. (2014). Change in marine communities: an approach to statistical analysis and interpretation. PRIMER-E: Plymouth
Constable A. J., Melbourne-Thomas J., Corney S. P., Arrigo K. R., Barbraud C., Barnes D. K., et al. (2014). Climate change and southern ocean ecosystems I: how changes in physical habitats directly affect marine biota. Global Change Biol. 20 (10), 3004–3025. doi: 10.1111/gcb.12623
Convey P., Peck L. S. (2019). Antarctic Environmental change and biological responses. Sci. Adv. 5 (11), eaaz0888. doi: 10.1126/sciadv.aaz0888
Deagle B. E., Thomas A. C., Shaffer A. K., Trites A. W., Jarman S. N. (2013). Quantifying sequence proportions in a DNA-based diet study using ion torrent amplicon sequencing: which counts count? Mol. Ecol. Resour. 13 (4), 620–633. doi: 10.1111/1755-0998.12103
Duhamel G., Hulley P.-A., Causse R., Koubbi P., Vacchi M., Pruvost P., et al. (2014). “Biogeographic patterns of fish”. in Biogeographic Atlas of the Southern Ocean. Scientific Committee on Antarctic Research), 327–362.
Eastman J. (1985). “The evolution of neutrally buoyant notothenioid fishes: their specializations and potential interactions in the Antarctic marine food web,” in Antarctic Nutrient cycles and food webs (Springer, Berlin, Heidelberg.), 430–436.
Fenaughty J., Stevens D. (2003). Diet of the Antarctic toothfish (Dissostichus mawsoni) from the Ross Sea, Antarctica (subarea 88.1). CCAMLR Sci. 10, 113–123.
Frøslev T. G., Kjøller R., Bruun H. H., Ejrnæs R., Brunbjerg A. K., Pietroni C., et al. (2017). Algorithm for post-clustering curation of DNA amplicon data yields reliable biodiversity estimates. Nat. Commun. 8 (1), 1–11. doi: 10.1038/s41467-017-01312-x
Fuiman L., Davis R., Williams T. (2002). Behavior of midwater fishes under the Antarctic ice: observations by a predator. Mar. Biol. 140 (4), 815–822. doi: 10.1007/s00227-001-0752-y
Grohsler T. (1992). Nahrungsokologische untersuchungen an antarktischen fischen um elephant island unter besonderer berucksichtigung des sudwinters. Mitt. Aus Dem Inst. Fur Seefischerei Der Bundesforschungsanstalt Fur Fischerei. 47, 1–296
Guillerault N., Bouletreau S., Iribar A., Valentini A., Santoul F. (2017). Application of DNA metabarcoding on faeces to identify European catfish silurus glanis diet. J. Fish Biol. 90 (5), 2214–2219. doi: 10.1111/jfb.13294
Hanchet S., Dunn A., Parker S., Horn P., Stevens D., Mormede S. (2015). The Antarctic toothfish (Dissostichus mawsoni): biology, ecology, and life history in the Ross Sea region. Hydrobiologia 761 (1), 397–414. doi: 10.1007/s10750-015-2435-6
Hanchet S., Rickard G. (2008). A hypothetical life cycle for Antarctic toothfish (Dissostichus mawsoni) in the Ross Sea region. CCAMLR Sci. 15, 35–53.
Hashimoto R. (1974). Investigation of feeding habits and variation of inhabiting depths with cod (Gadus macrocephalus) distributed on the northeastern fishing ground in Japan. Bull. Tohoku Reg. Fish. Res. Lab. 33, 51–67.
Kim B.-M., Amores A., Kang S., Ahn D.-H., Kim J.-H., Kim I.-C., et al. (2019). Antarctic Blackfin icefish genome reveals adaptations to extreme environments. Nat. Ecol. Evol. 3 (3), 469–478. doi: 10.1038/s41559-019-0812-7
Kokorin N. (2010). The analysis of activeness and composition of food items of the Antarctic toothfish D. mawsoni (Nototheniidae) in Ross and amundsen seas during the 2006-2007 fishing season. Problems Fisheries 11, 48–59.
Kumar S., Stecher G., Li M., Knyaz C., Tamura K. (20181547). MEGA X: molecular evolutionary genetics analysis across computing platforms. Mol. Biol. Evol. 35(6), 1547. doi: 10.1093/molbev/msy096
Lautredou A.-C., Bonillo C., Denys G., Cruaud C., Ozouf-Costaz C., Lecointre G., et al. (2010). Molecular taxonomy and identification within the Antarctic genus trematomus (Notothenioidei, teleostei): How valuable is barcoding with COI? Polar Sci. 4 (2), 333–352. doi: 10.1016/j.polar.2010.04.006
Manzari C., Oranger A., Fosso B., Piancone E., Pesole G., D’Erchia A. M. (2020). Accurate quantification of bacterial abundance in metagenomic DNAs accounting for variable DNA integrity levels. Microbial Genomics. 6(10).doi: 10.1099/mgen.0.000417
Martin M. (2011). Cutadapt removes adapter sequences from high-throughput sequencing reads. EMBnet. J. 17 (1), 10–12. doi: 10.14806/ej.17.1.200
Mata V. A., Rebelo H., Amorim F., McCracken G. F., Jarman S., Beja P. (2019). How much is enough? effects of technical and biological replication on metabarcoding dietary analysis. Mol. Ecol. 28 (2), 165–175. doi: 10.1111/mec.14779
Mcmillan P., Iwamoto T., Stewart A., Smith P. J. (2012). A new species of grenadier, genus macrourus (Teleostei, gadiformes, macrouridae) from the southern hemisphere and a revision of the genus. Zootaxa 3165 (1), 1–24. doi: 10.11646/zootaxa.3165.1.1
Mychek-Londer J. G., Chaganti S. R., Heath D. D. (2020). Metabarcoding of native and invasive species in stomach contents of great lakes fishes. PloS One 15 (8), e0236077. doi: 10.1371/journal.pone.0236077
Pakhomov Y. A., Tseytlin V. (1993). Diet of seven species of Antarctic fishes and estimation of their daily rations. J. Ichthyology C/c Voprosy Ikhtiologii 32, 31–31.
Park H., Yeon I., Lee Y., Han E. (2015). Diet study of Antarctic toothfish caught in the east Antarctic based on stomach content, fatty acid and stable isotope analyses. CCAMLR Sci. 22, 29–44.
Petrov A. (2011). Distribution and biological characteristics of two species of toothfishes of the genus dissostichus (Fam. nototheniidae) at bouvet island. J.Ichthyology 51 (9), 813–818. doi: 10.1134/S0032945211050158
Petrov A., Gordeev I. (2015). Distribution and biological characteristics of Antarctic toothfish Dissostichus mawsoni in the weddell Sea. J. Ichthyology 55 (2), 210–216. doi: 10.1134/S0032945215020137
Petrov A., Tatarnikov V. (2011). Results of investigation of the diet of Antarctic toothfish Dissostichus mawsoni (Nototheniidae) in the lazarev Sea. J.Ichthyology 51 (1), 131–135. doi: 10.1134/S0032945210051017
Piacentino G. L., Barrera-Oro E. (2009). Phenotypic plasticity in the Antarctic fish trematomus newnesi (Nototheniidae) from the south Shetland islands. Polar Biol. 32 (10), 1407–1413. doi: 10.1007/s00300-009-0651-0
Priede I. G. (2017). “Systematic description of deep-Sea fishes,” in Deep-Sea fishes: Biology, diversity, ecology and fisheries (Cambridge: Cambridge University Press).
Ripple W. J., Beschta R. L. (2006). Linking a cougar decline, trophic cascade, and catastrophic regime shift in Zion national park. Biol. Conserv. 133 (4), 397–408. doi: 10.1016/j.biocon.2006.07.002
Roberts J., Xavier J. C., Agnew D. (2011). The diet of toothfish species dissostichus eleginoides and Dissostichus mawsoni with overlapping distributions. J. Fish Biol. 79 (1), 138–154. doi: 10.1111/j.1095-8649.2011.03005.x
Seong G. C., Choi S.-G., Chung S., An D. H., Kim H.-W., Baeck G. W. (2021). Morphological dietary composition of Antarctic toothfish (Dissostichus mawsoni) along the East Antarctic continental slope. Polar Biol. 44 (3), 499–508. doi: 10.1007/s00300-021-02820-9
Stevens D. W., Dunn M. R., Pinkerton M. H., Forman J. S. (2014). Diet of Antarctic toothfish (Dissostichus mawsoni) from the continental slope and oceanic features of the Ross Sea region, Antarctica. Antarctic Sci. 26 (5), 502. doi: 10.1017/S095410201300093X
Takahashi M., Iwami T. (1997). The summer diet of demersal fish at the south Shetland islands. Antarctic Sci. 9 (4), 407–413. doi: 10.1017/S0954102097000527
Yoon T.-H., Kang H.-E., Lee S. R., Lee J.-B., Baeck G. W., Park H., et al. (2017). Metabarcoding analysis of the stomach contents of the Antarctic toothfish (Dissostichus mawsoni) collected in the Antarctic ocean. PeerJ 5, e3977. doi: 10.7717/peerj.3977
Yukhov V. (1971). The range of Dissostichus mawsoni Norman and some features of its biology. J. Ichthyology 11 (1), 14–25.
Keywords: feeding ecology, Antarctic toothfish, metabarcoding, CCAMLR, Antarctica
Citation: Lee SR, Choi S-G, Chung S, Kim DN, Kang C-K and Kim H-W (2022) Geographical differences in the diet of Dissostichus mawsoni revealed by metabarcoding. Front. Mar. Sci. 9:888167. doi: 10.3389/fmars.2022.888167
Received: 02 March 2022; Accepted: 22 July 2022;
Published: 19 August 2022.
Edited by:
Ciro Rico, Institute of Marine Sciences of Andalusia (CSIC), SpainReviewed by:
Joeselle M. Serrana, University of Ottawa, CanadaCopyright © 2022 Lee, Choi, Chung, Kim, Kang and Kim. This is an open-access article distributed under the terms of the Creative Commons Attribution License (CC BY). The use, distribution or reproduction in other forums is permitted, provided the original author(s) and the copyright owner(s) are credited and that the original publication in this journal is cited, in accordance with accepted academic practice. No use, distribution or reproduction is permitted which does not comply with these terms.
*Correspondence: Chang-Keun Kang, Y2trYW5nQGdpc3QuYWMua3I=; Hyun-Woo Kim, a2ltaHdAcGtudS5hYy5rcg==
Disclaimer: All claims expressed in this article are solely those of the authors and do not necessarily represent those of their affiliated organizations, or those of the publisher, the editors and the reviewers. Any product that may be evaluated in this article or claim that may be made by its manufacturer is not guaranteed or endorsed by the publisher.
Research integrity at Frontiers
Learn more about the work of our research integrity team to safeguard the quality of each article we publish.