 Maria C. Cunha
 João Marques
 Luis C. Dias
 Ignacio Rada Cotera3
 George Triantaphyllidis
94% of researchers rate our articles as excellent or good
Learn more about the work of our research integrity team to safeguard the quality of each article we publish.
Find out more
ORIGINAL RESEARCH article
Front. Mar. Sci., 22 April 2022
Sec. Marine Pollution
Volume 9 - 2022 | https://doi.org/10.3389/fmars.2022.886581
This article is part of the Research TopicCleaning Litter by Developing and Applying Innovative Methods in European SeasView all 19 articles
This work presents the most important aspects that should be considered for assessing new marine litter reduction and processing technologies. The most relevant technology features are highlighted using a Delphi method capable of gathering and handling a large quantity of valuable data in areas where information is lacking. This relies on judgements provided by recognized experts in a particular area of knowledge, through an organized procedure based on a structured questionnaire and its reiterations. The Delphi process developed in this study completed two rounds. In the first round, a questionnaire with 55 statements (potentially important aspects) was shared with experts and stakeholders from different types of institutions (Administrations, Marinas and Ports; Associations; Companies; Universities; and Research Centers). Appropriate statistical analysis of the responses determined the degree of consensus and the level of importance perceived for each aspect. Feedback information based on analysis of the answers provided during the first round was included in a second round of the survey that focused on the statements that did not gather enough consensus, and therefore needed to be reevaluated by the expert group. After checking the stability of the results between rounds, the conclusions are set out and a list of the aspects to be considered in different decision-making contexts is drawn (from technology development, investment to marketing and policy making) taking into account technical, environmental, socio-economic, and political issues.
Marine litter is a worldwide problem and is defined by Williams-Wynn and Naidoo (2020) as “any persistent manufactured or processed solid material that is discarded, disposed of or abandoned in the marine and coastal environment”. Plastic debris is the main contributor to marine litter and the tendency is for it to grow still more following increases in the production of plastic (367 million tonnes in 2020 as mentioned in Plastics Europe, 2020). Plastics are estimated to account for approximately 73% of the total waste in the ocean, while 8 million tonnes of plastic arrive in the oceans every year (Parga Martínez et al., 2020). Hohn et al. (2020) mention future projections according to which the amount of plastic waste could double by 2050 if no strategies to reduce waste are implemented. The pollution of oceans by plastics is severe (Riechers et al., 2021), because they persist for long periods of time. In fact, some plastics incorporate hazardous chemicals that can be released, some that are heavier than water sink to the ocean floor and cannot be recovered, and microplastics from wastewater treatment plants and the macro plastics broken into small particles end up as persistent pollution (Besseling et al., 2017; Lebreton et al., 2017; Thiel et al., 2018). Concern is therefore growing because of the different impacts they can have, such as harming different marine species (which ingest them or become entangled in them, as mentioned in Hohn et al., 2020). They are equally harmful to aquaculture and fishing activities and vessels, as well as ecosystems (both freshwater and marine). Therefore, there is considerable pressure to try to minimize these problems by implementing appropriate reduction technologies at the source, especially technologies that can contribute to the circular economy.
Schmaltz et al. (2020) identified 52 technologies that either prevent plastics from entering waterways (14) or collect marine and riverine plastic pollution (38) and range from household wastewater filters and laundry balls to large-scale skimmers and booms. The list continues to grow and there are more than 400 ideas and solutions listed in the toolbox of the AQUA-LIT project (https://aqua-lit.eu/toolbox) for preventing marine litter from entering the sea. UNEP classified the technical solutions for waste management in four groups: 1) upstream preventive solutions to prevent wastewater contamination at the source (enhancing macroplastic waste management to reduce impacts; plastic recycling (mechanical, chemical and incineration); policy tools and behavioral change campaigns (design of quality textiles, treatment of effluents from household washing machines or laundromats); 2) upstream wastewater treatment (booms, debris fins and deflectors, trash racks/meshes, stormwater retention ponds, gully pots and infiltration basins); 3) wastewater treatment plant (WWTP) interventions (sewage sludge treatment, industrial or leachate wastewater treatment); and 4) downstream water treatment solutions (clean-up boats, debris sweepers, seabins) (Nikiema et al., 2020). Gkanasos et al. (2021) demonstrated that if we do intervene with technologies that retain macroplastics in river estuaries and microplastics in WWTPs, i.e. at the main input sources, a significant reduction can be achieved.
This paper presents a study developed under the Horizon 2020 project CLAIM (Cleaning Litter by developing and Applying Innovative Methods in European seas) funded by the European Union. The main purpose of CLAIM is to develop new technologies to reduce marine plastic pollution and process the collected litter (microplastics and macroplastics). This project encompasses many different perspectives to assemble a range of knowledge sourced from different areas, thus: from research (in chemistry, materials, hydrodynamics, ecosystem functioning, engineering, economy, consumer behaviors and social sciences) to industry, and to the governmental, regulatory, and business worlds.
It is important to explore the diversity of opinion of experts for enriching details and for a deeper understanding of issues at stake. However, this exploration will only be a fruitful exercise if structured knowledge is pursued.
For this purpose, the Delphi method, a systematic approach, can be used to reach expert consensus on different aspects that are relevant to characterizing a new technology.
Delphi was developed in the 1950s by the Rand Corporation and is based on the assumption that “group judgments are more reliable than individual’s” (Giannarou and Zervas, 2014). One of the first published applications of Delphi was the work of Gordon and Helmer-Hirschberg (1964) about the future developments expected over the following 50 years in different contexts, such as war prevention and its probability, future weapon systems, space exploration progress, population growth, and automation. Delphi is an iterative process structured by successive rounds of questionnaires with controlled feedback for collecting information from a panel of informed experts. The experts do not know each other, and their judgements remain anonymous during the development of the survey. The sequential rounds and the reporting from each round with regard to the aggregation of the information collected and feedback to experts is managed by a facilitator. According to Marchau and Linde (2016), the Delphi method can be used not only to reach consensus between experts but also to identify diverging opinions and to estimate the consequences and acceptability of options open to adoption. Marchau and Linde (2016) argue that two essential premises are required for the success of a Delphi study: the quality of the survey questions and the availability of expert respondents to answer questions and share arguments in support of their opinions.
The Delphi method has been applied to a diversity of decision fields, including urban planning, health, business, transportation, education, technologies, and others. The following short review provides some examples that show why the Delphi method is used in widely differing areas, emphasizing which features make it such a versatile tool for research and for practical applications.
In urban planning (Novakowski and Wellar, 2008; Musa et al., 2019) the opportunity offered by the Delphi method to all respondents to share their opinions has been stressed, along with the fact that these opinions are treated in the same manner, thus ensuring a fair contribution of expertise from different backgrounds. Delphi has been increasingly applied in the health area (Santaguida et al., 2018; Mubarak et al., 2019, and Huang et al., 2020) thanks to its interesting features, namely its ability to ensure that respondents from around the world can participate, to guarantee anonymity in controlling the dominant participants and to see that consensus is gained about healthcare aspects where there are limited or conflicting opinions (Taylor, 2020). Delphi has proved to be valuable for dealing with solutions for urban transportation systems (Julsrud and Priya Uteng, 2015; Karakikes and Nathanail, 2020) and to evaluate the most appropriate alternative involving different groups of stakeholders. In the technology area, Delphi has been used as a robust method to provide support for designing a technology strategic plan (Da Silveira et al., 2016) and for identifying the most important performance indicators to evaluate the sustainability of the industry (Ivascu, 2020). Concerning litter reduction and recycling, Kim et al. (2013) considered Delphi to identify equipment that should be disposed of and recovered by a regulated system that extended the producer’s responsibility, according to the impact that its disposal has on the environment. The same type of objective can be found in Singh et al. (2018) for establishing and validating a group of parameters to assess the environmental impacts caused by the product packaging industry.
With regard to marine environments, three studies conducted using a Delphi method were found: Mazarrasa et al. (2019) who studied the impacts of marine litter accumulation in habitats in three estuaries along the Bay of Biscay, according to litter typologies (size and materials); Deshpande et al. (2019) who collected data that could be useful to draft new strategies to prevent the impacts of abandoned, lost or discarded fishing gear; and Hofman et al. (2020) who identified actions to protect marine environments from tourist behaviors on the great barrier reef of Australia.
As far as the authors’ search of the literature was concerned, no Delphi study has yet been applied with respect to technologies aiming to reduce and process marine litter. The structured appraisal of new technologies can provide organizations, market and citizens in general with assurances as to their effectiveness and the positive impacts of different types of technology (environmental and socio-economic, for instance). Therefore, policymakers can be confident that technological solutions capable of contributing to a better marine environment are available and regulatory measures have to be established to fulfil society’s expectations. Delphi methods combined with statistical and decision-support techniques can provide considerable confidence in the development and implementation of new technologies. In fact, Delphi could be seen as an important tool for emerging knowledge fields by helping “to derive foresight on future innovation scenarios” (Birko et al., 2015).
The present study evaluates the most important aspects to be considered when assessing a new marine litter reduction and processing technology using a Delphi method. This can be part of decision-making issues which will be addressed at different points during the application of the technologies (from technical decisions to business and policy decisions).
The study presented is organized into four sections. After this introduction, the second section presents an overview of Delphi method implementation. It introduces the background to the development of a Delphi research approach, the information needed, and the methods used for conducting the statistical analysis. The third section deals with the characterization and exploration of the information gathered as the process takes place, using descriptive statistics as well as inferential statistics. Specific issues relating to the application of the Delphi procedure based on an expert judgement method for each round are explained, and the systematization of the results is described. Finally, a list of the most relevant aspects to be considered is compiled. The fourth and last section presents the conclusions and makes some recommendations for future research.
The above information about the Delphi method shows that it can be valuable in producing support for decision making. In fact, it is considered a flexible method with different modified structures proposed in the literature (Hasson et al., 2000). This is an appropriate method as it enables experts to arrive at a consensus, even though each expert could express a different opinion from the group that is handled anonymously. Furthermore, a Delphi method can gather a large quantity of valuable data in areas where information is lacking.
The implementation of the Delphi method follows the phases summarized in Figure 1, which are detailed in the next sections.
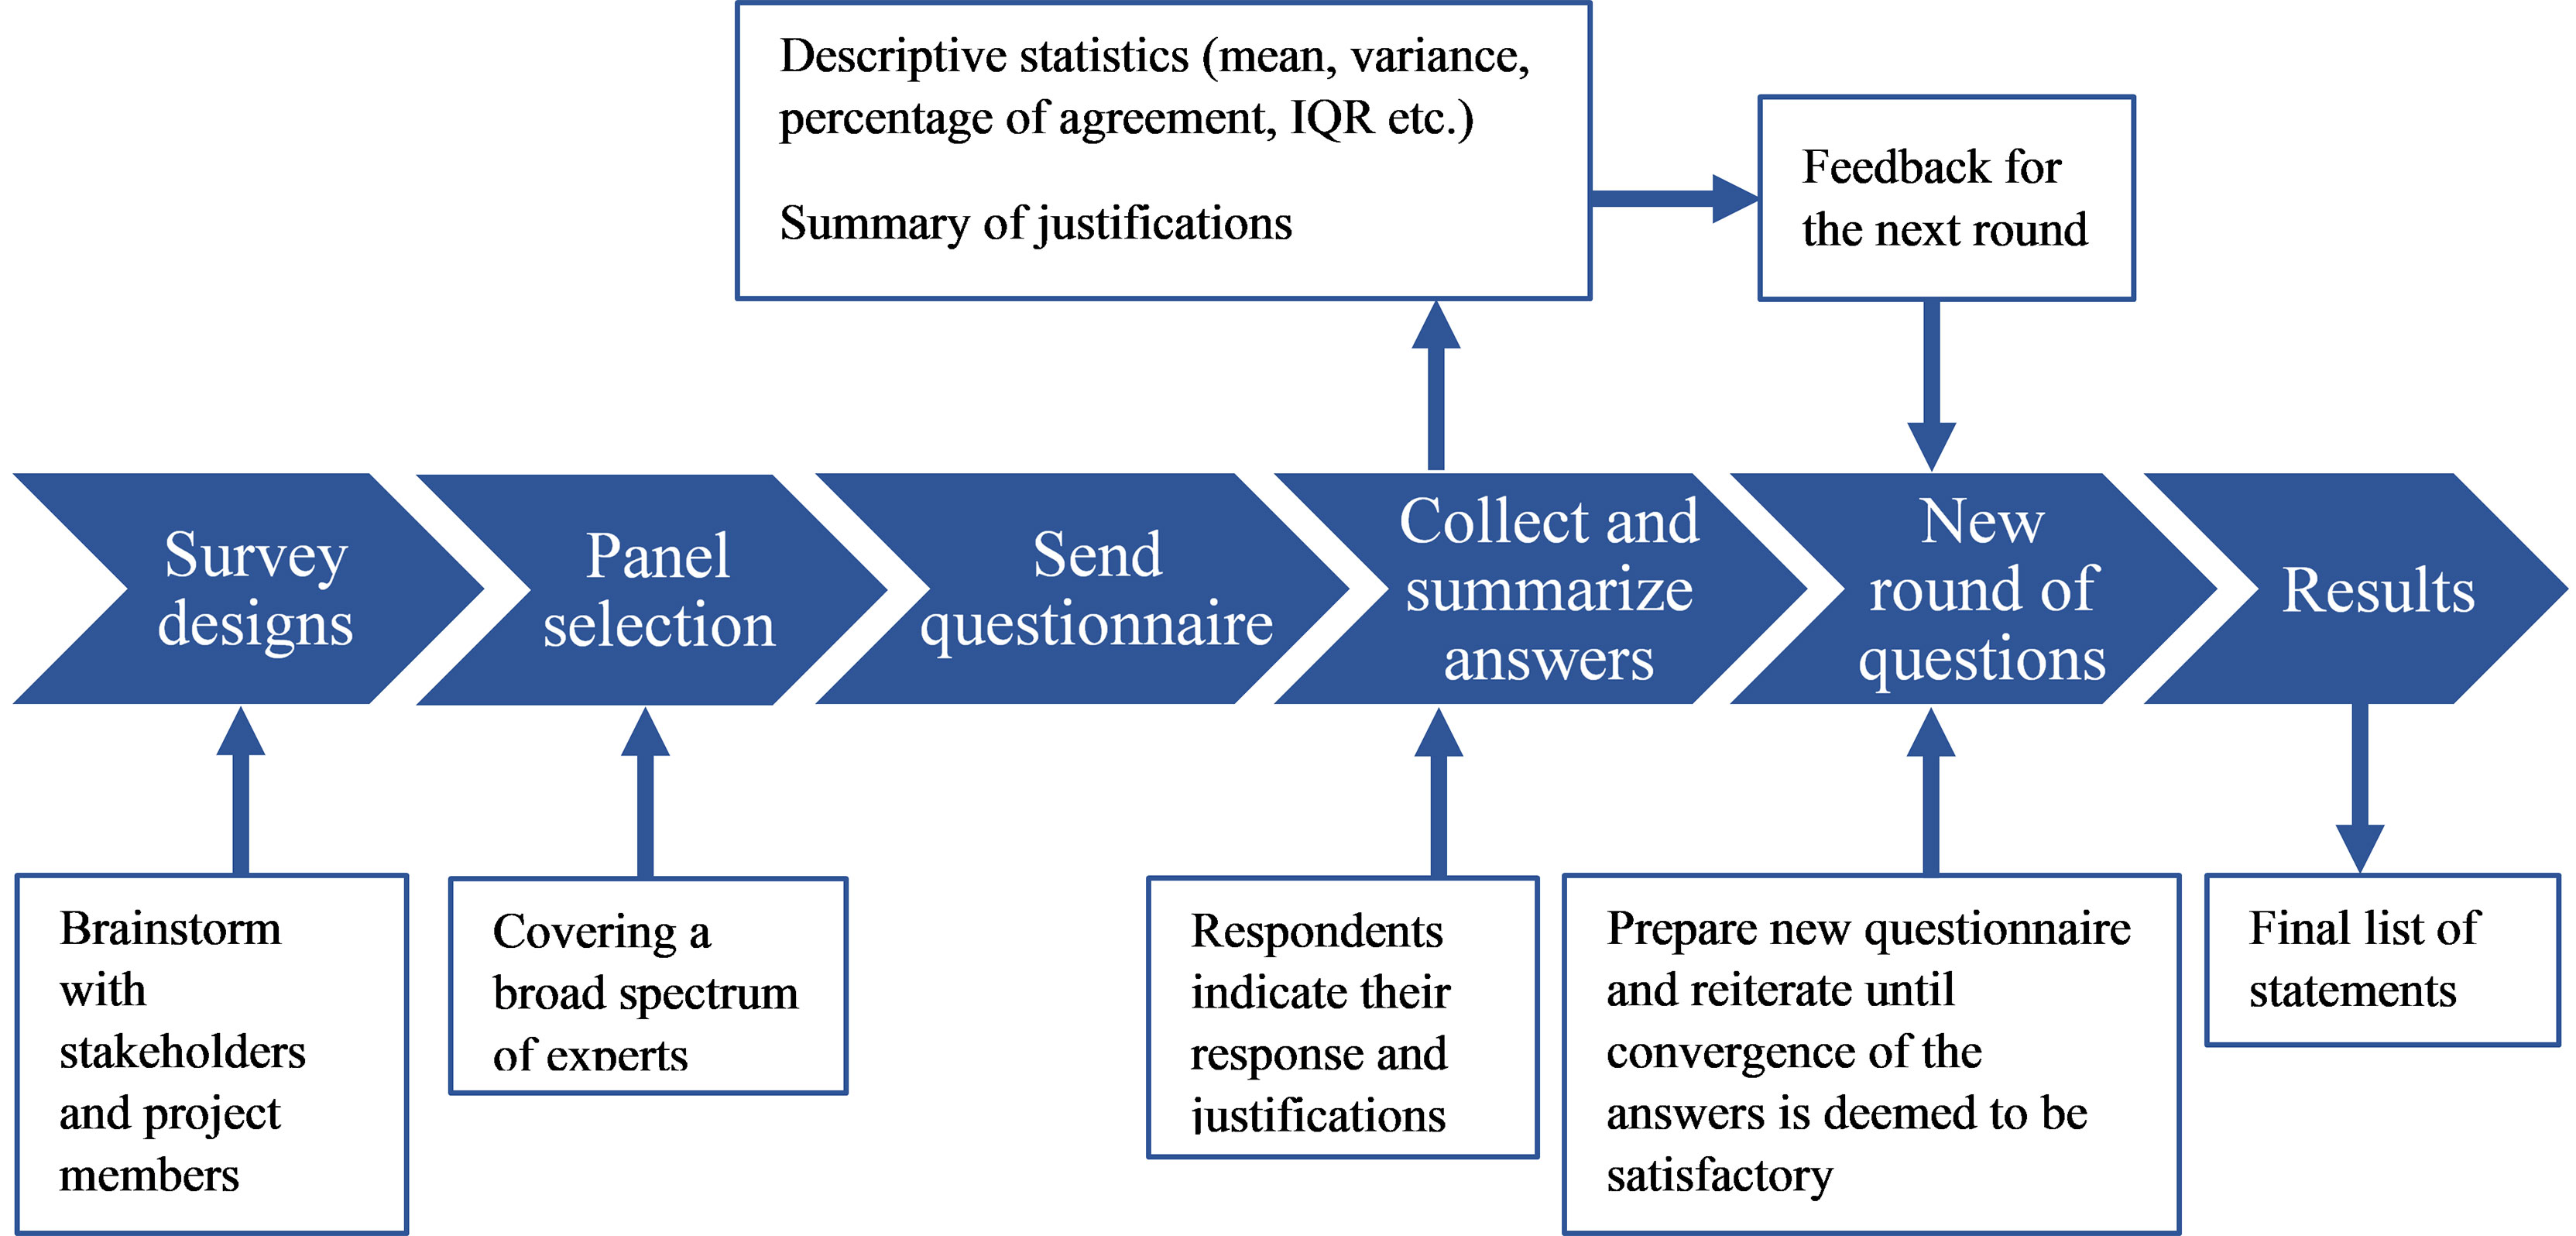
Figure 1 Delphi method overview.
One of the most important phases of the Delphi method is related to drafting the survey questions that could explore the participants’ views about the development of marine litter reduction and processing technologies. These research questions, based on statements about the aspects to be considered, should be concise, clear, and also cover different perspectives of evaluation (physical and operational characteristics of the technologies and their impacts in terms of environmental, economic, social, and political issues). The questions were first developed by the researcher responsible for the survey, who later became the facilitator. To validate and consolidate the questionnaire, the CLAIM members were asked to give their own views about the content of the survey. Some bilateral meetings were also held, involving experts from the administration (including ports and institutions responsible for implementing marine strategies), tourism agency managers, and plastics industry specialists. This brainstorming activity was designed to gather as many ideas as possible and involved different types of stakeholders; it has been very fruitful. The discussions that took place were useful for stabilizing the questionnaire, and the outcome was a set of 55 statements (Table 1), corresponding to potentially important aspects.
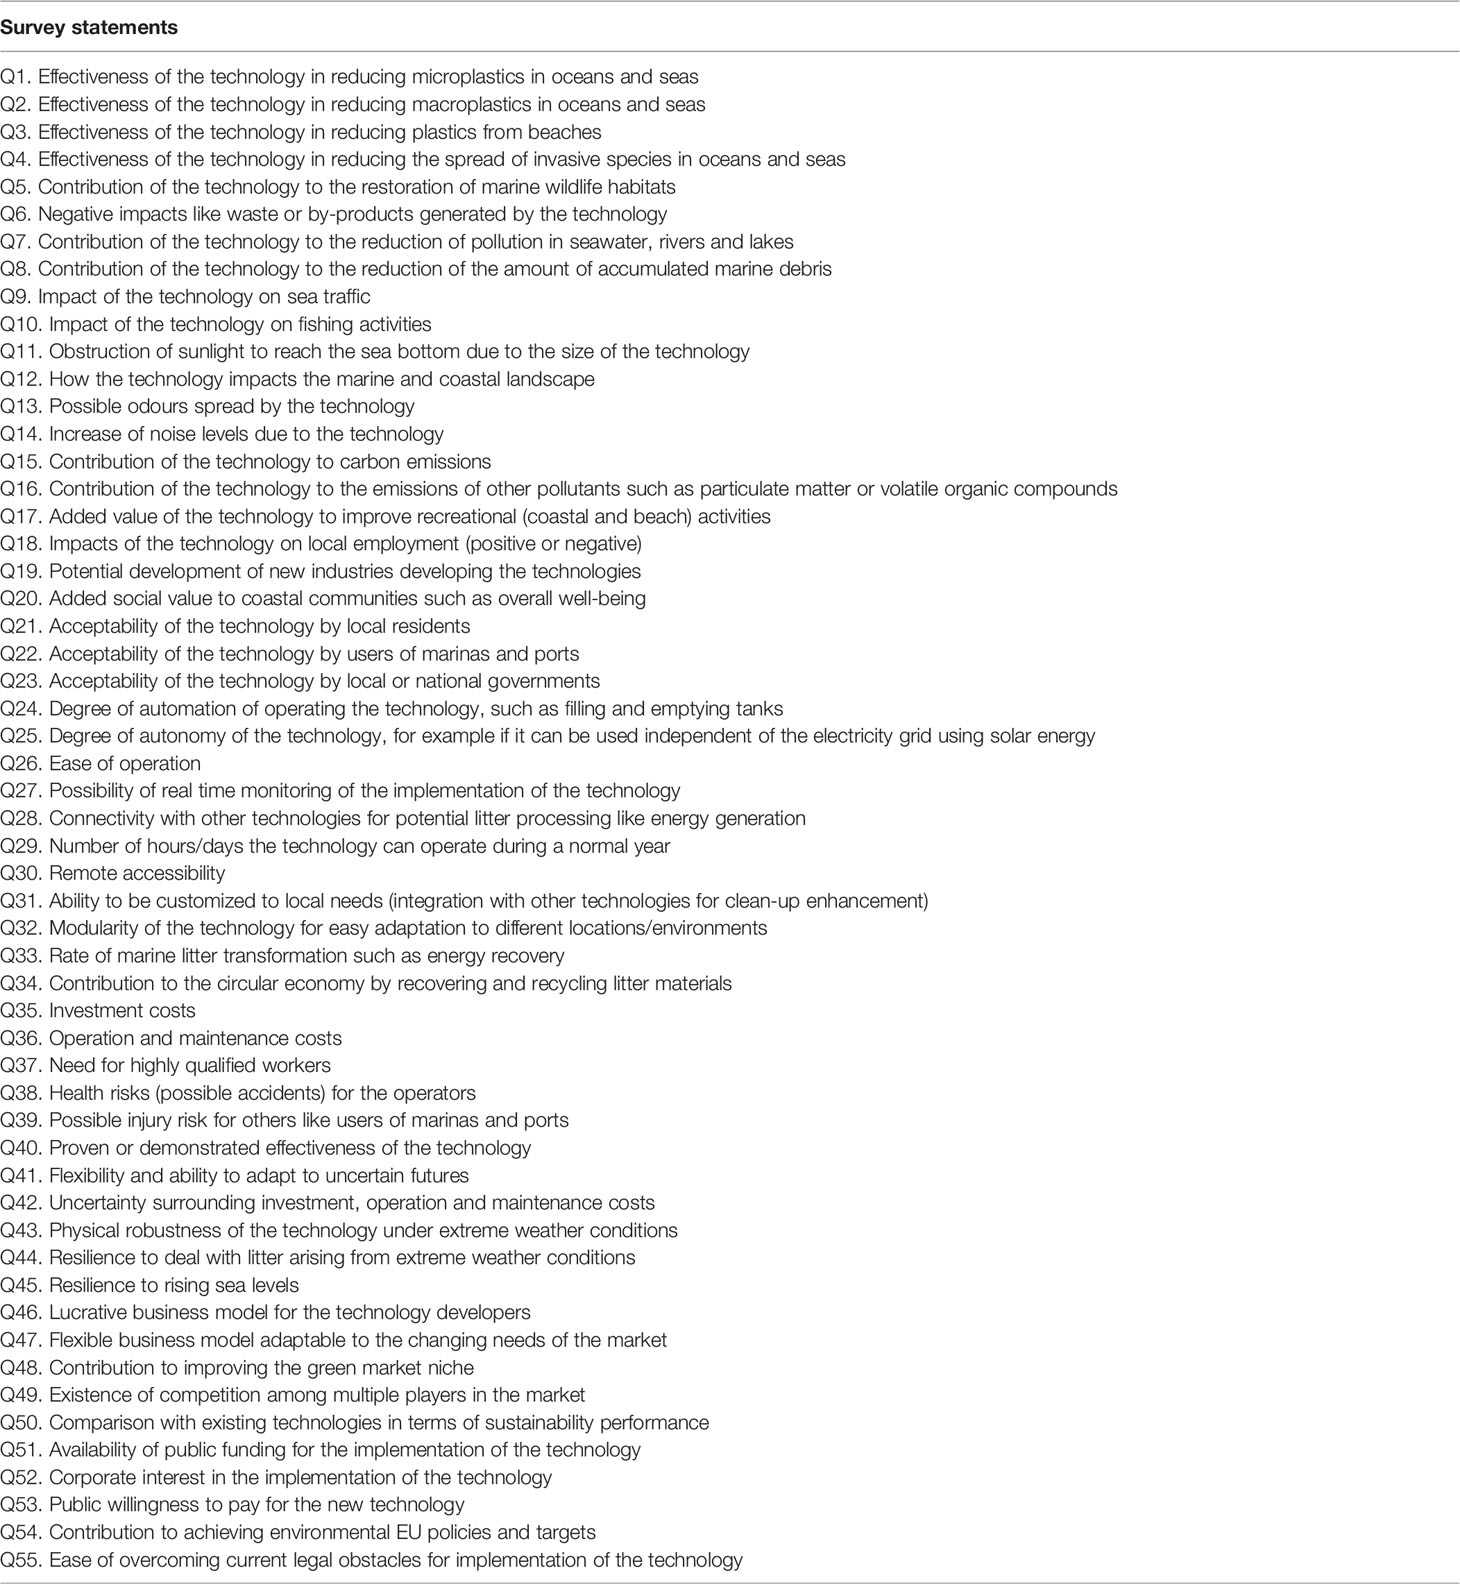
Table 1 Delphi questionnaire.
These 55 statements were classified into groups according to five different areas (Supplementary Materials Table S1):
i) Environmental - core purpose (5 statements), including the features of the technologies most closely related to the objective of their implementation;
ii) Environmental - other effects (10 statements), including other possible environmental effects produced by the implementation of the technologies;
iii) Economic - promoter perspective (7 statements), including the views of those who develop technologies and might be engaged in their commercialization;
iv) Socio-economic and political (21 statements), including the wider impacts of the technologies in these indicators;
v) Technical operation (12 statements), including different aspects related to the operational features of the technology that might make its implementation more or less attractive.
Groups iii) and v) reflect the business concerns of the technology developers and their direct clients: that it does not cost too much and that it allows a smooth technical operation. Groups i), ii) and iv) broaden this perspective by covering the wider environmental and socio-economic concerns of sustainable development. Since a positive impact on the plastics pollution of the seas is the core objective of these technologies, a distinction was made between these impacts (group i) and other environmental externalities (group ii).
Creating these groups made it possible to extract additional information in a field with significant knowledge gaps. In fact, this indicated the way to structure additional information about the importance assigned to the various groups of questions by the various types of experts.
The analysis of literature reviews (Torrecilla-Salinas et al., 2019 and Zartha Sossa et al., 2019) on criteria to size and select expert panel members reveals that there is no clear consolidated framework to deal with these issues. In fact, many sizes are reported between 10 and 20, but a few can be found with 280 (Julsrud and Priya Uteng, 2015) or even 628 (Barrios et al., 2021). In general, it can be said that the number of panel members should be large enough for all angles to be represented, but never losing the idea that the process must be manageable. Expert panel profiles are not clearly defined in the existing literature because this depends very much on the subject and aim of the Delphi method. The expert panel in a Delphi study should be selected so that a group of persons from the practice or research areas with sound knowledge about the topic are involved. The selection of an appropriate panel is essential to ensure the robustness and validity of the results (Stewart et al., 2017). Their willingness to participate is another important aspect. In this work, the respondents were selected from professional networks approached by the CLAIM project’s research team and from experts suggested during the contacts already established for the development of the project. Prominent experts and stakeholders involved in plastic pollution and environmental management from different types of institutions were selected and then an e-mail list was created to be used through-out the development of the application of the Delphi method.
There is no consensus in the literature about the number of rounds that should be performed in a Delphi study. In most cases two or three rounds are used, as reported in the literature review by Zartha Sossa et al. (2019). According to Aghimien et al. (2020), more than three rounds could lead to problems related to the fatigue of experts and a tendency to obtain fewer responses after the second round. Based on these reasons they propose two rounds. The Delphi study presented in this paper also consists of two rounds, although it was planned that more rounds could be performed if necessary. The explanation of the process developed, including the construction of the rounds and the analysis of their results is as follows.
After setting the questions to be included, the first-round questionnaire was constructed, including an introductory letter to welcome the respondents with some information and instructions. The introductory letter can be found in the Supplementary Materials Text S1. This letter specified that the survey, in the round, could only be completed once and that anonymity was ensured as only the facilitator would deal with the answers.
After the introductory letter, the survey asked contributors to share their opinion about the general question/issue: “How important in your opinion are the following aspects when it comes to assessing a new marine litter reduction or processing technology?” The respondents should rate the 55 statements according to a five-point Likert scale with the following options: Not important, Slightly important, Important, Very important, and Extremely important. Respondents had the opportunity to include pertinent comments in each statement along with their answer. An example of the layout of the online survey can be found in Supplementary Materials Figure S1. At the end of each page of the survey (7 in total) there was a button to save the page responses and go to the next page. This allowed respondents to complete the questionnaire at a later time. The last requests of the questionnaire relate to the respondent being able to propose additional aspects that should also be assessed, their contact information and the option of being quoted in the final report of the project. The layout of the survey of these final steps is shown in Supplementary Materials Figure S2. This survey was available online on the SurveyMonkey® platform, following an invitation asking experts to share their opinion. Reminders were sent aiming to increase the number of responses.
After closing the online questionnaire of the first Delphi round, the responses were analyzed. The statements that did not achieve sufficient consensus (explained in the next sections) were reconsidered for a second round. For this additional round, the survey was designed on the same platform and with a new introductory letter giving some information and instructions for participants. It also explained that only the set of questions that did not achieve consensus in the first round were kept in the second round, and mentioned the additional information provided for this new round. This letter is in Supplementary Materials Text S2.
The second-round Delphi questionnaire was shared with the group of respondents who answered the first round and added their contact information. The respondents rated the statements to be considered according to the same five-point Likert scale and again had the opportunity to include comments about each one. In this second round, respondents received feedback information for each question from the first round with a summary of important comments associated with high rated and low rated statements, and also the statistical distribution of ratings for each question. An example of the layout of the online survey of the second-round questionnaire is given in Figure 2.
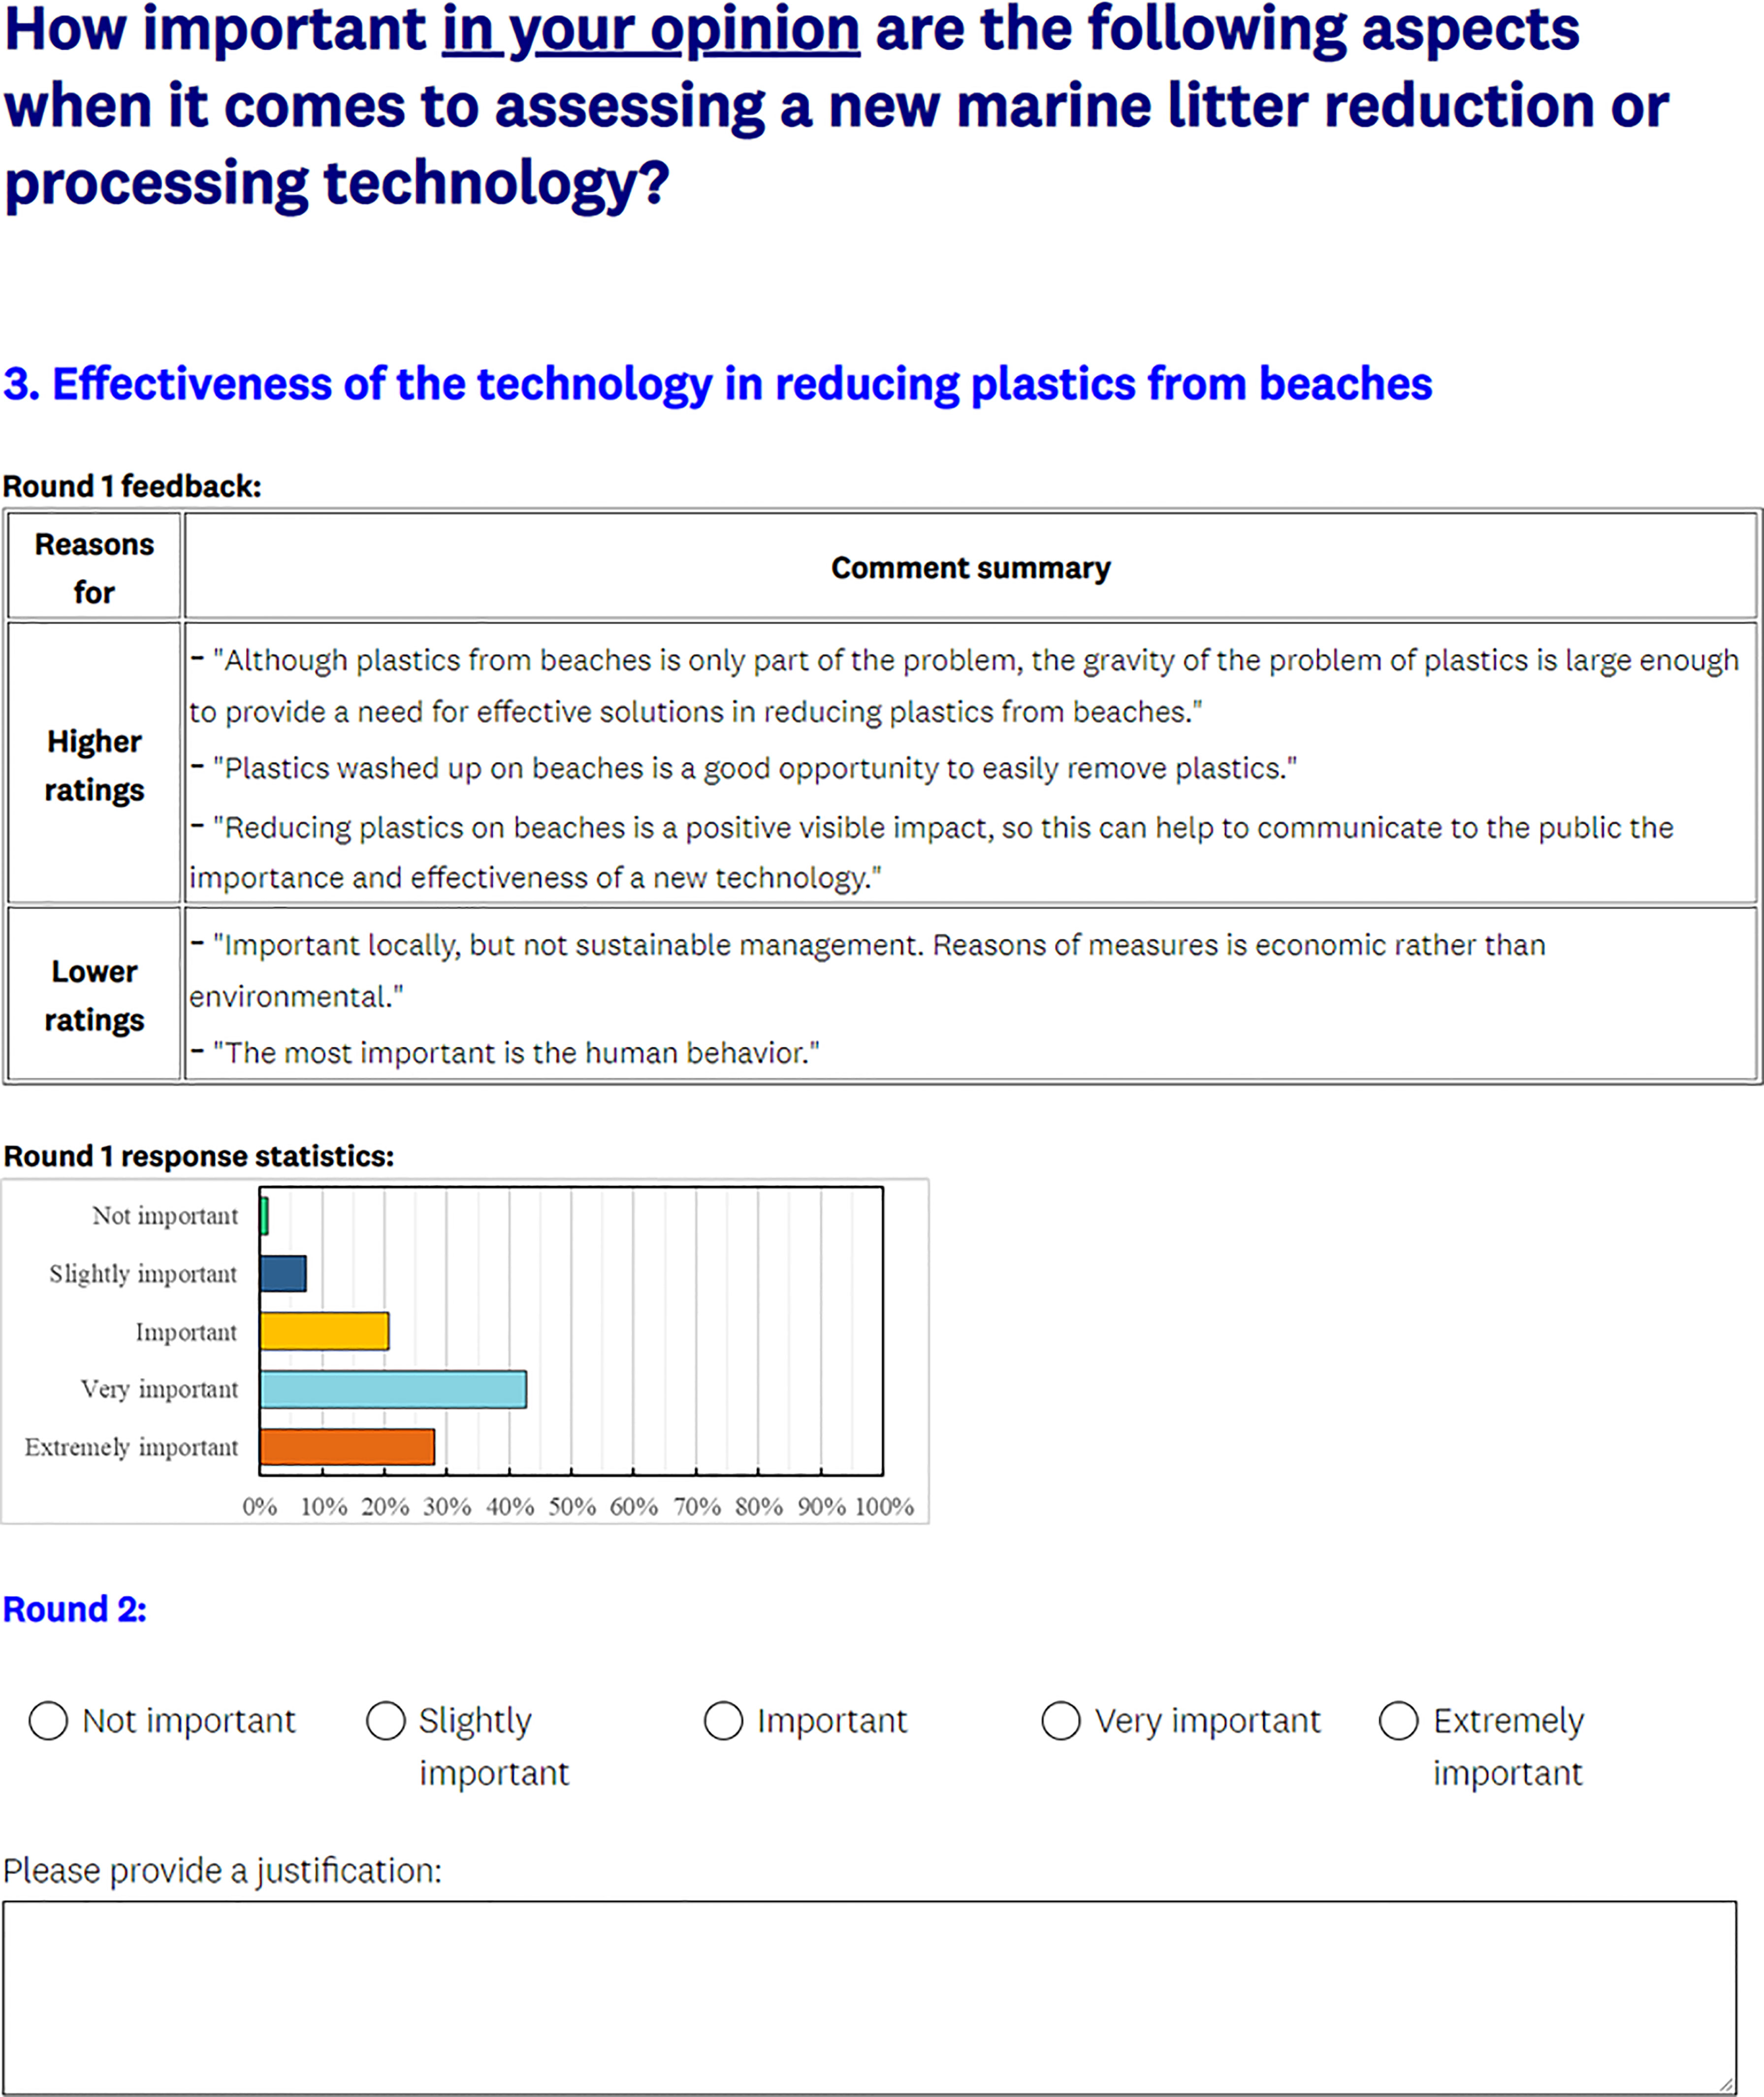
Figure 2 Online questionnaire of the second Delphi round on the SurveyMonkey® platform.
The analysis of data collected from the responses in the survey rounds during the Delphi implementation is of utmost importance for its success. There is a large body of literature which includes many possible measures that can be used to analyze the data. The work by Zartha Sossa et al. (2019) includes a literature review on the Delphi method that systematizes different types of statistical analyses based on descriptive statistics (related to central tendency, dispersion, or percentage of agreement) and inference statistics.
However, in many cases, the types of measures and statistical procedures to be used in the different phases of the analysis of the collected data are misleading and not obvious. With this in mind, it is crucial to clarify two key concepts to analyze gathered data, namely, consensus and stability.
The main objective of Delphi is to achieve consensus and the level of consensus is an important issue that has to be defined (Ju and Jin, 2013). In this work, consensus is used to classify the results obtained by the aggregation of the survey’s individual responses for each round and then to move forward to another round if consensus is not obtained. The literature review shows that consensus measurement includes percentage of agreement and other descriptive statistics, such as mean, median, standard deviation, and interquartile range (IQR). It includes various approaches, considering just one type of measurement or considering an accumulation of information produced by more than one measure. As examples of works using just a single measure, we have the following: percentage of agreement (Mubarak et al., 2019; Bhandari et al., 2020; Nasa et al., 2021; Frew et al., 2021; Shaw et al., 2021); mean (Barzekar et al., 2011). Examples of works using cumulative measures are: IQR and mean (De Brito et al., 2017); IQR and median (Rezapour et al., 2019; Everink et al., 2020); IQR and percentage of agreement (Chen and Jiang, 2020; Guerin et al., 2020); percentage of agreement and median (Ahmed et al., 2021); percentage of agreement and mean (Santos et al., 2018); mean, median and percentage of agreement (Lima-Rodríguez et al., 2013); IQR, median and percentage of agreement (Bentley et al., 2016; Price et al., 2020).
The IQR is a measure of spread for the middle 50% of the observations (Birko et al., 2015; Sekaran and Bougie, 2016). It is given by the difference between the third quartile and the first quartile. For Likert scale data, an IQR value lower than 1 means that more than 50% of the responses fall in the same point of the scale. According to Wagner et al. (2016), IQR can be viewed as a “measuring unit of consensus”. There is a vast body of literature using an IQR value equal to or lower than 1 in a five-point Likert scale as consensus level. Bentley et al. (2016); Huijben et al. (2019); Rezapour et al. (2019), and Everink et al. (2020) are among such studies. Supplementary Materials Figure S3 gives additional insights about the meaning of IQR.
Besides assessing how much respondents agree with each other (degree of consensus), the analysis also assessed how much respondents agree with each statement. The level of agreement or importance assigned to a statement is used to keep or discard statements that already reached consensus. Many different measures have been proposed for defining agreement or disagreement thresholds. One of the most common is the percentage of responses in the Very Important and Extremely Important levels of the Likert scale. Santos et al. (2018) state that, in the literature, the levels of these percentages in a 5-point Likert range from 60% to 80%. The mean of the responses is also a common measure with values typically around more than 3.5 to 4, even though that requires regarding the Likert scale as a cardinal one. The works of Barzekar et al. (2011); Lima-Rodríguez et al. (2013); Kaijser et al. (2018); Santos et al. (2018) and Torrecilla-Salinas et al. (2019), consider mean values in this range. The work of Torrecilla-Salinas et al. (2019) uses two levels for these measures: strong/key statements are those with a mean equal to 3.7 or higher and percentage of agreement equal to 60% or higher; and important ones are those with mean values equal to 3.5 or higher, and percentage of agreement equal to 45% or higher. Van Der Linde et al. (2005) also use threshold levels of percentage of agreement between 60% and 75%, on a five-point Likert scale.
In this work, two levels of important statements are used: those that are key and those that are advisable or worthwhile to recommend. The threshold of the statistical measures to define these levels will be detailed in the sections on the rounds’ results (Figure 3 gives an overview about these issues).
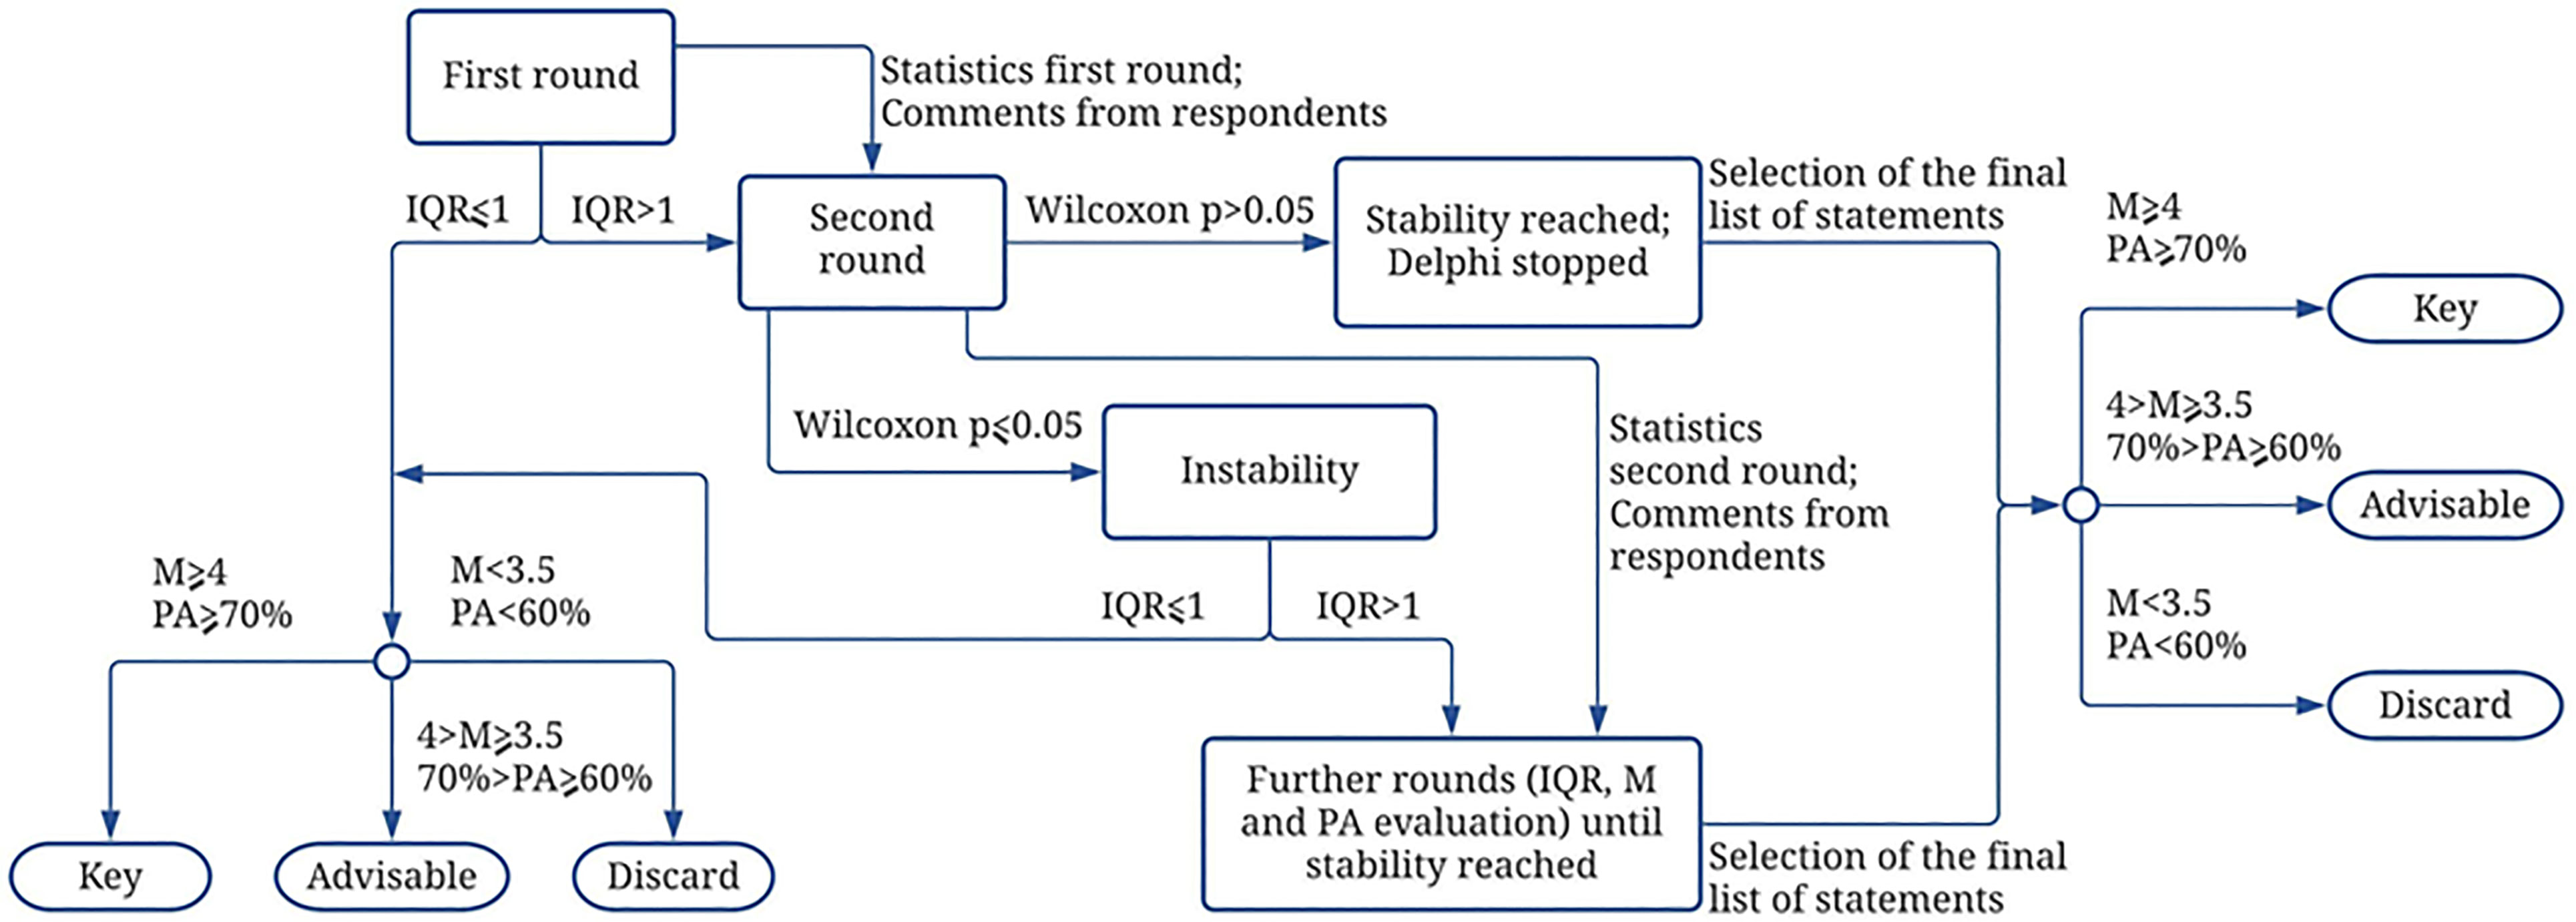
Figure 3 Synthesis of all steps of round data full evaluation (M, Mean; IQR, Inter-quartile range; PA, Percentage of agreement).
In many Delphi studies, the number of rounds is pre-defined without verifying the stability among experts’ responses (Barrios et al., 2021). This may produce cumbersome results. It is important to ascertain whether there is consistency across consecutive rounds. This can only be evaluated after the conclusion of at least two rounds. When statistical evidence shows no relevant change in the responses between consecutive rounds, the Delphi process can end. One of the simplest ways to analyze the stability of the responses across rounds is to compute the difference between statistical measures and check whether the tendency is consensus increase or decrease. However, as Dajani et al. (1979), pointed out through some examples, “These criteria are generally either subject to subjectivity and arbitrariness or are in violation of statistical theory”.
That is why the literature indicates inference statistics (Kalaian & Kasim, 2012) such as Chi-squared (Dajani et al., 1979 and Nasa et al., 2021), Wilcoxon signed-rank (De Vet et al., 2005; De Brito et al., 2017; Brunt et al., 2018; Mubarak et al., 2019; Bhandari et al., 2020; Chen and Jiang, 2020; Guerin et al., 2020; Price et al., 2020), McNemar (Lambat et al., 2019) and Kappa coefficient (Barrios et al., 2021) tests to evaluate the stability of respondent answers between consecutive rounds. If no changes are detected for any statements, the Delphi is stopped. Otherwise, a new round should be promoted. If stability is reached, the rules defined for settling the selection of statements should be applied so that the group of statements to be considered is finally established (Dajani et al., 1979).
This work makes use of the IQR measure to evaluate consensus for the round. This is one of the measures most used to define consensus (Zartha Sossa et al., 2019). Mean and percentage of agreement are applied to keep or discard statements (Figure 4).
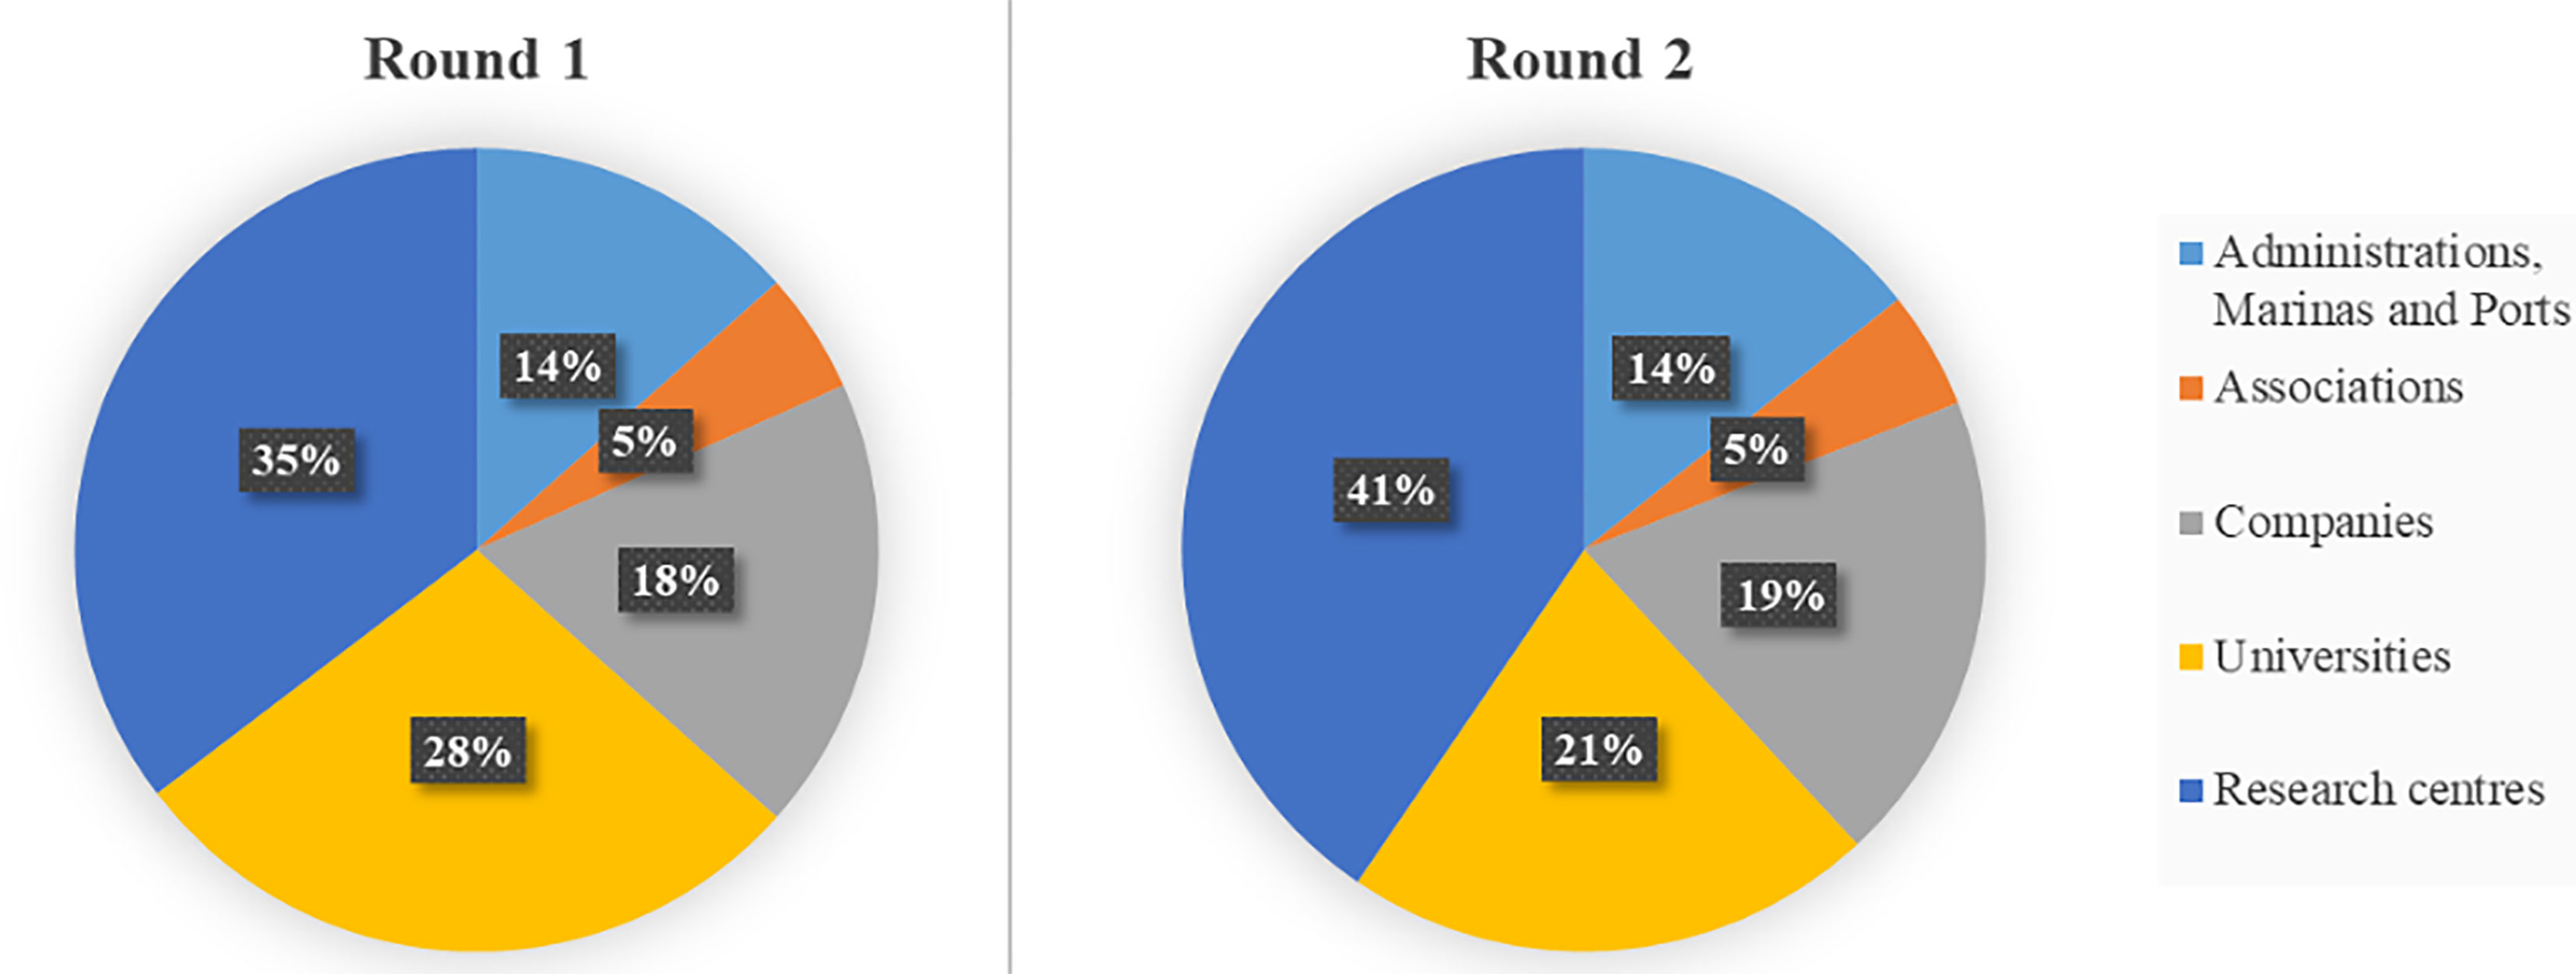
Figure 4 Percentage of responses by institutions in round 1 and round 2.
The Wilcoxon signed-rank paired differences test is used as a measure of consistency between consecutive rounds (Figure 3). It is a reliable procedure to confirm the stability of responses between rounds and to avoid more rounds of questionnaires that would not significantly increase the level of consensus (Mubarak et al., 2019).
A total of 137 experts were invited to participate in this survey. In the first round, the survey was opened by 106 participants (this is discussed in section 3.2). In the second round, the responses were received from 42 participants. The distribution of respondents across countries is shown in Table 2.
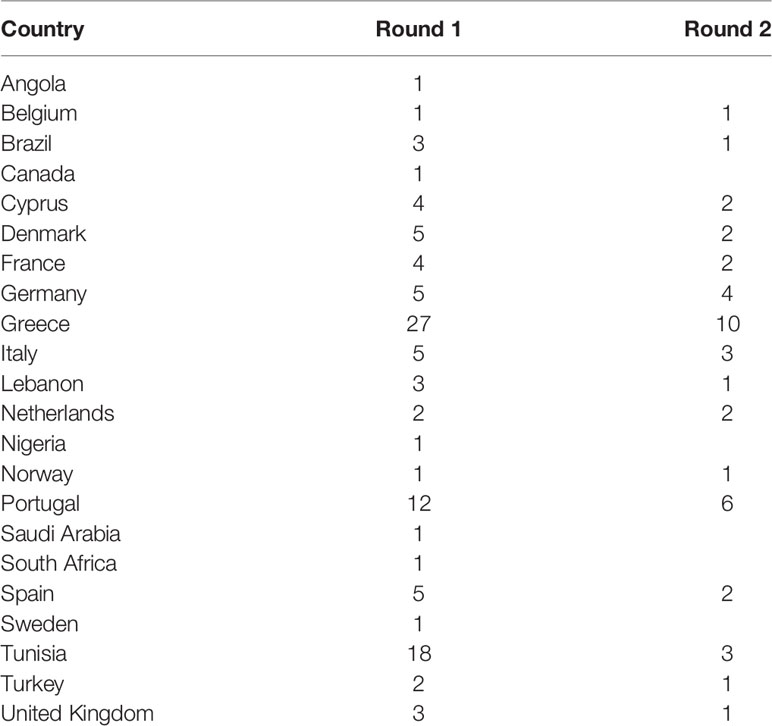
Table 2 Number of responses by country in round 1 and round 2 of the survey.
In the first round, respondents from 22 countries participated in the survey, with Greece, Tunisia and Portugal being the top 3 countries with the largest number of replies. In the second round, respondents from 16 countries participated, and Greece, Portugal and Germany were the most represented countries.
The panel participation by institution type and round is described in Figure 4. The institution types considered were: Administrations, Marinas and Ports; Associations (environmental non-profit); Companies; Universities; and Research Centers. The large proportion of research experts was expected, as we are dealing with a rather new subject that has become an active area of research. Even if plastic in seas and oceans is turning out to be a growing matter of concern, recently appearing often in the media, it is clear that there is still a lack of awareness of and formal legislation for implementing sustainable practices in this domain.
In the first round, the questionnaire was organized into 55 statements and the average time respondents took to complete it was 18 minutes. In the second round, 17 questions were distributed, and the average response time was also 18 minutes. In the first round, 106 respondents started the survey, but 24 of them only responded to one or two questions and were disregarded when computing statistics. Of the responses collected in the first round, 39 questionnaires included comments. In the second round, 56 respondents from the first round were contacted (the number who expressed their availability to participate in this round) and were asked to share their opinions in an additional round. Of those, 42 responded to the survey (75% of the invited respondents) and 26 added comments supporting their opinion.
The responses of Round 1 in the five-point Likert scale with the options “Not Important”, “Slightly Important”, “Important”, “Very Important” and “Extremely Important” are represented by a diverging stacked bar chart in Figure 5 (underlying data available in Supplementary Table S2):
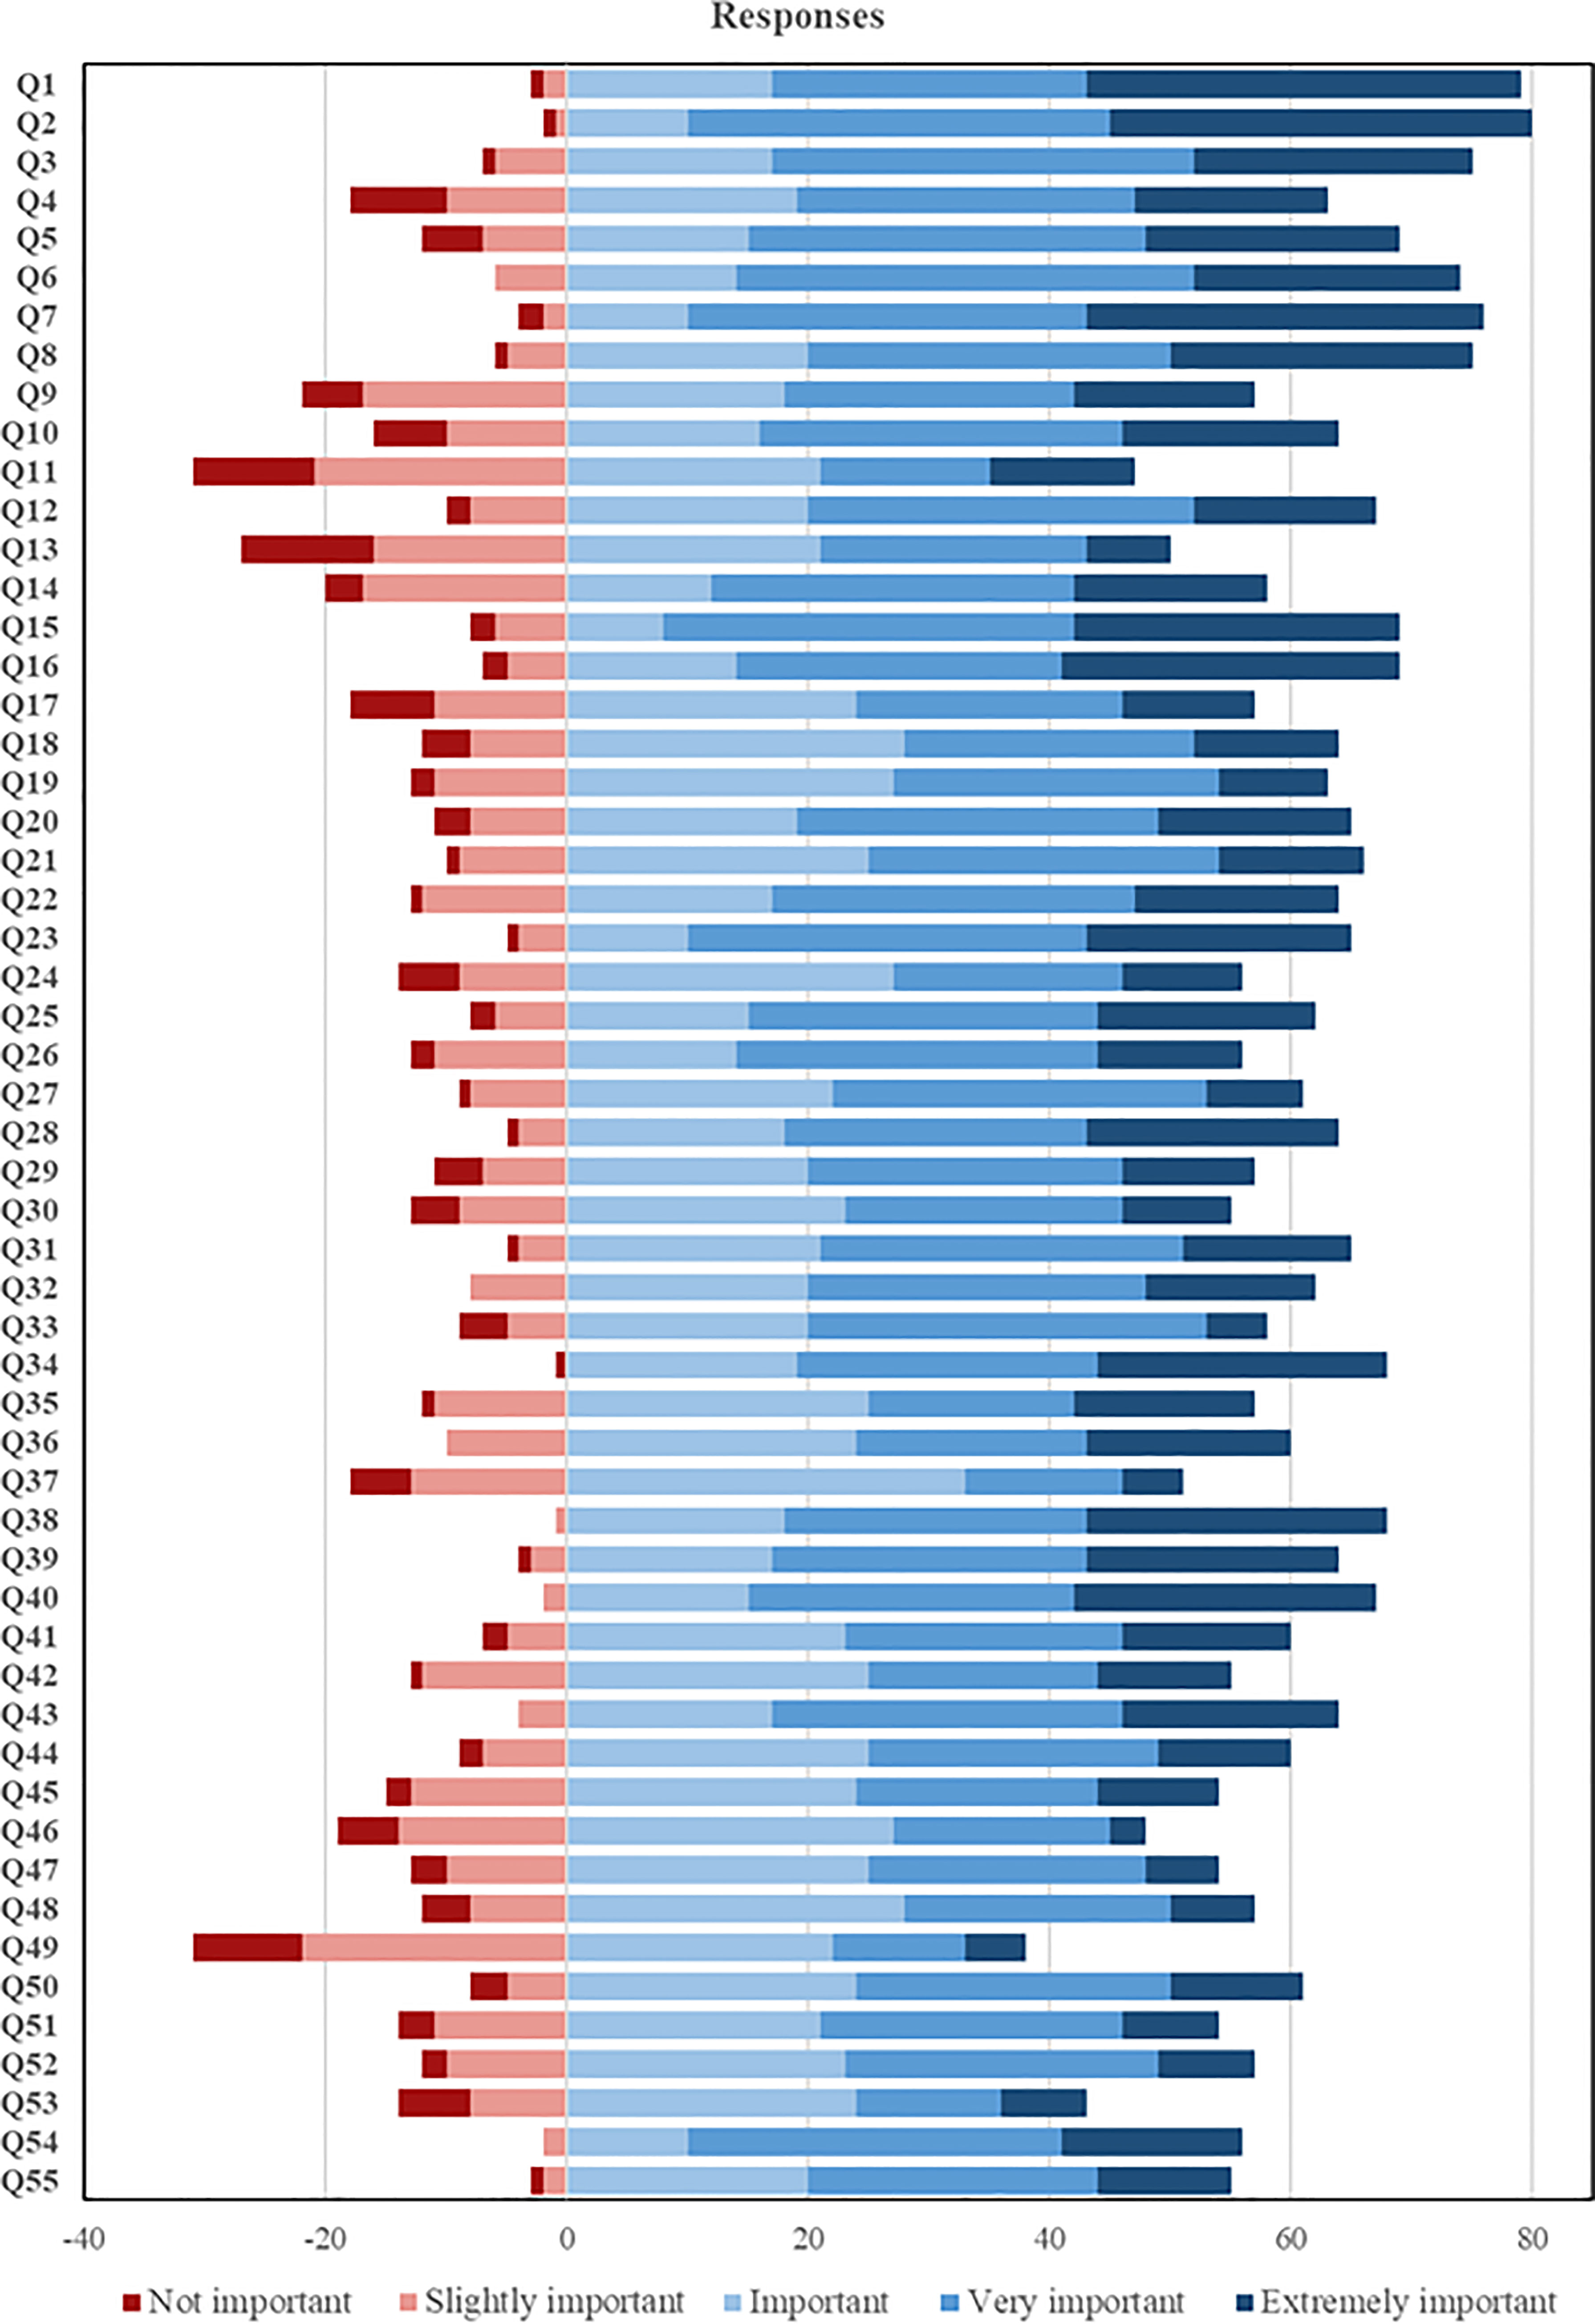
Figure 5 Diverging stacked bar chart for Round 1.
The representation in Figure 5 is recommended for Likert scales by Heiberger and Robbins (2014). From the analysis of the figure, Statements Q1 and Q2 are those with the highest number of responses on the positive side of the scale (blue), which covers the levels “Important”, “Very Important” and “Extremely Important”. On the negative side (red), statements Q11 and Q49 are the ones with a higher number of responses. Statement Q34 has practically all responses on the positive side. This is also true for Q38, Q40 and Q54. In the case of Q37, the responses on the positive side fall mainly in the “Important” level as well those for Q46. Others, like Q54, have a higher number of responses in the “Very Important” level than in the other levels, and for Q1 the largest number of responses fall in the “Extremely Important” level. These response distributions are the basis for the statistical analysis developed below.
The distribution of the responses given by all respondents in the first round according to the five statement groups is illustrated in Figure 6 (Data in Supplementary Table S2). The Very important level is the most common response for almost all groups of statements, except for the Economic – promoter perspective case, where the Important level has the highest percentage. The levels Not Important and Slightly Important are not common responses as low percentages of responses fall in these levels. But for the Economic – promoter perspective group, the percentage of responses in the Slightly Important level is very similar to that in the Extremely Important level. This is not observed in the other statement groups, and it is clearly less important than the other statement groups. The Environmental – core purpose group includes a high percentage of responses in the Extremely important level, higher than the Important level, as is also the case of the Environmental – other effects group. This reflects a high level of importance given to the environmental statements.
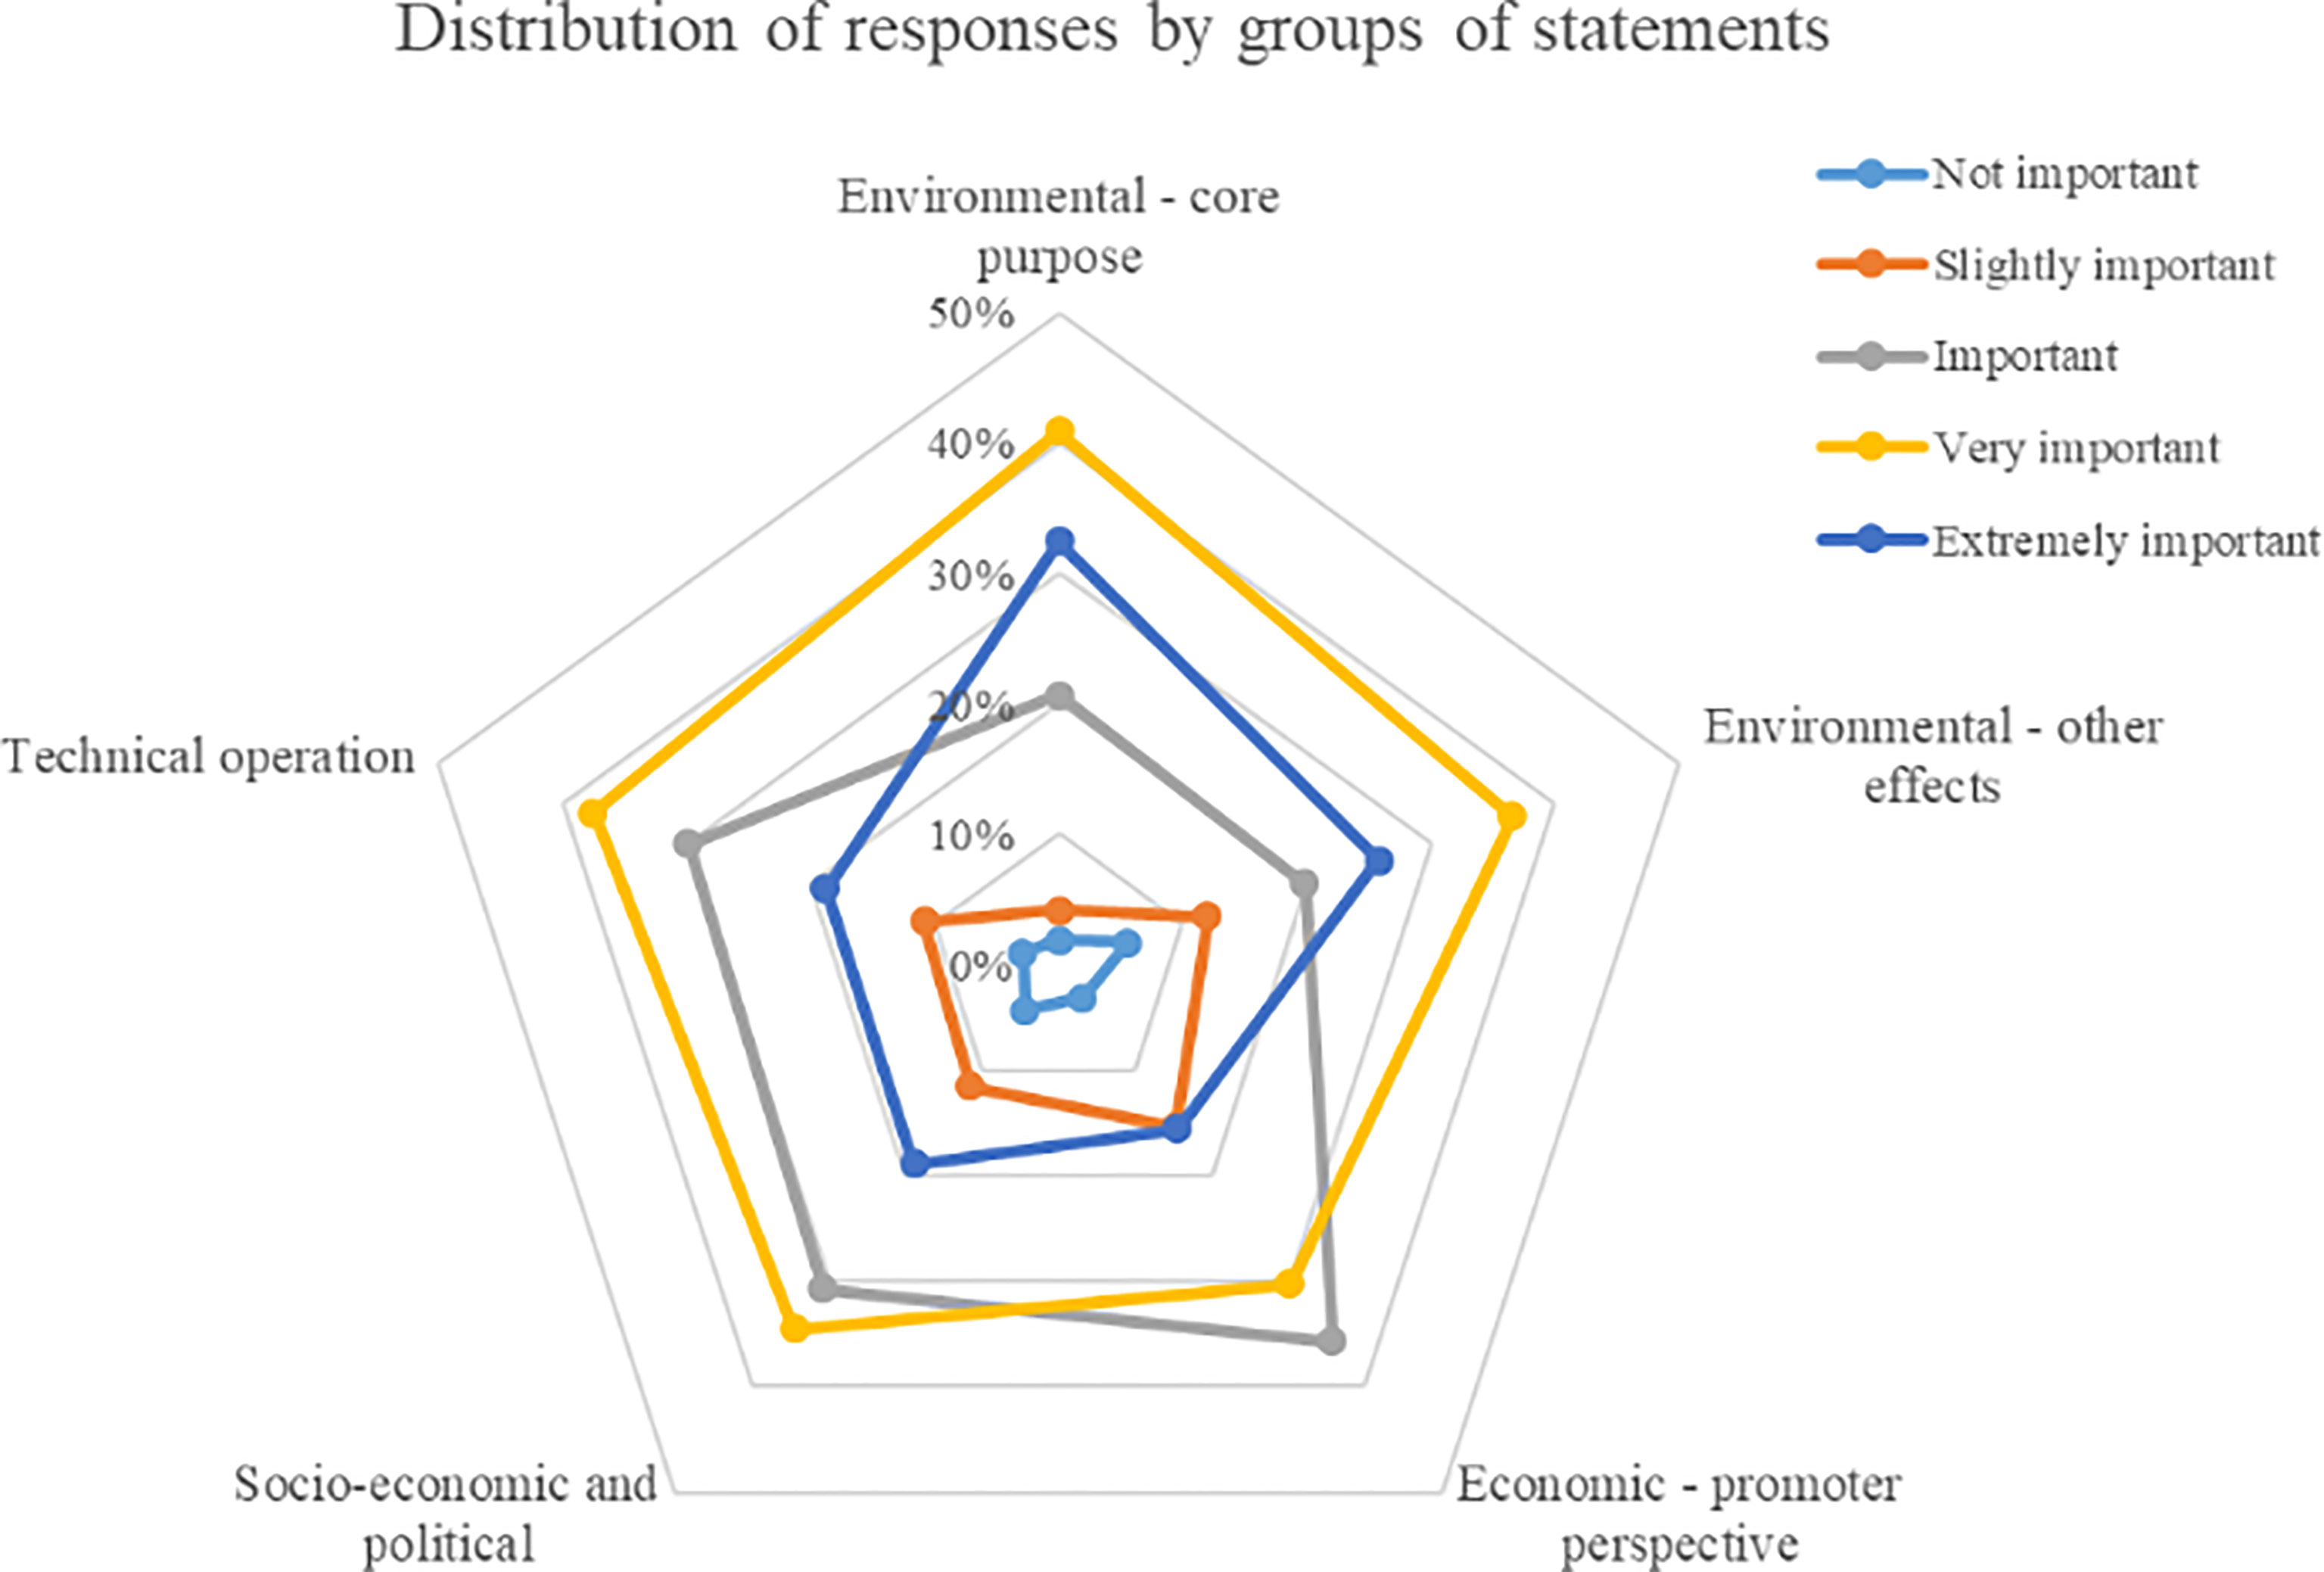
Figure 6 Distribution of the responses according to the groups of statements.
The distribution of responses is also analyzed considering the statement groups and the groups of respondents by institution and illustrated in Figure 7. The boxplots of this figure denote how the responses are well spread out. They refer to six measures for each statement group: minimum, limit of first quartile, mean, limit of third quartile, maximum, and outliers. The crosses inside the rectangles are the mean values and the points outside the rectangles are the outliers. The “whiskers” below and above the rectangle are the minimum and maximum values (excluding outliers) and the rectangle divides the responses into quartiles.
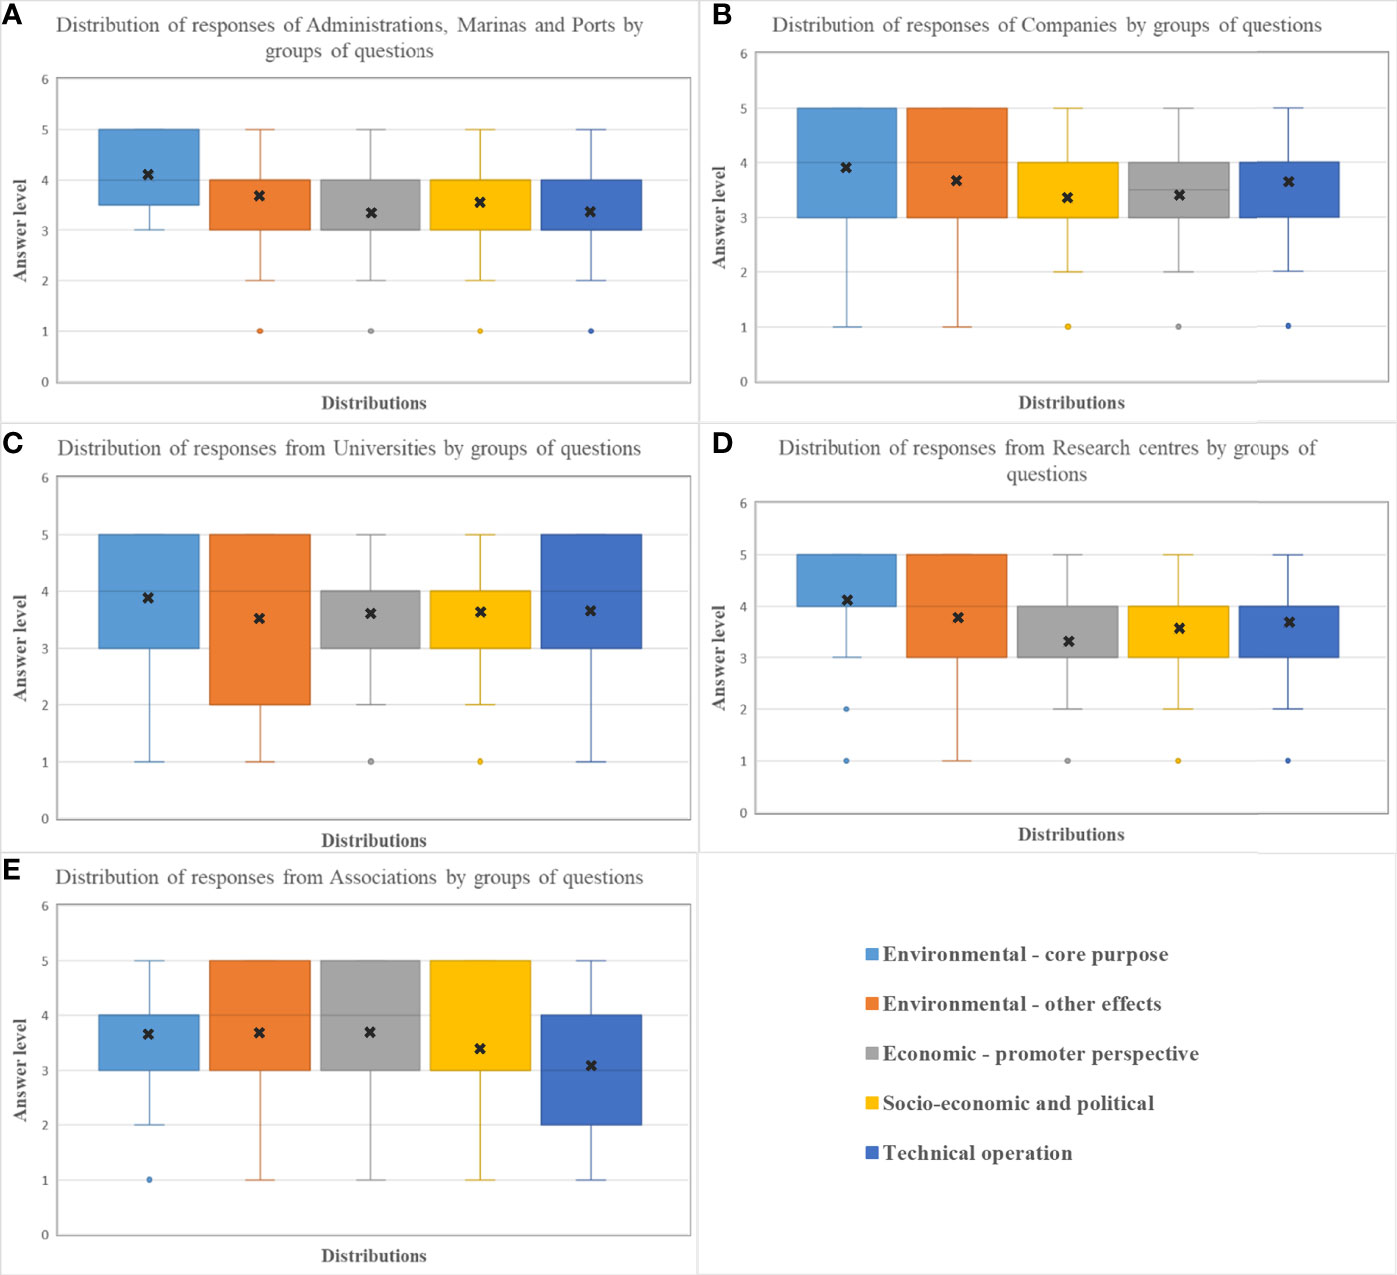
Figure 7 Distribution of the responses according to the institution of the respondents [(A) Administrations, Marinas and Ports; (B) Companies; (C) Universities; (D) Research Centers; (E) Associations] by groups of statements (represented by coloured squares).
The distribution of responses given by Administrations, Marinas and Ports (Figure 7A) indicates that more importance is attributed to the Environmental – core purpose group than to the other areas, since the highest mean is obtained, and the third quartile is equal to 5 (in the other areas it is equal to 4). The boxplots of the other areas are similar (all the responses are equal to or above importance level 3) with the lowest mean value of responses corresponding to the Economic-promoter perspective.
The most important groups of statements for Companies (Figure 7B) are Environmental - core purpose and Environmental - other effects, and the same happens for Universities (Figure 7C) and Research Centers (Figure 7D). This means that these three groups of stakeholders are very concerned with environmental matters. In fact, the research concerning the effects of plastics is mainly carried out in Universities and Research Centers, and Companies are very aware of future requests regarding this issue. However, the distance between quartile 1 and quartile 3 (the height of the box) that measures the variability of data is larger for Universities. For the other statement areas, the values are similar except with respect to Technical Operation. In this case, Universities reach the upper values, and Companies and Research Centers have the highest mean values. For Associations (Figure 7E), the distribution of responses is very different, and the variability of responses is also high for almost all groups of statements. Environmental – core purpose is not the most important group. The third quartile is equal to 5 for Environmental – other effects, Economic – promoter perspective and Socio-economic and political groups. The Technical Operation statements are the least important. This is in line with the objectives of these Associations, which are especially aware of environmental issues and less interested in technical issues related to technologies.
The distribution of responses given to each of the statements organized by areas is shown in Figure 8. The Environmental – core purpose (Figure 8A) includes a single statement (Q3) with an interquartile range higher than 1 (the rectangle of the boxplot goes from level 3 to level 5). The same occurs for Q47, which is the single statement of the Economic – promoter group with an IQR higher than 1 (Figure 8C). These are the statements with the largest variability in these two groups. On the opposite side, most statements in the Environmental – other effects group include an interquartile range greater than 1 (Figure 8B), and only statements Q4, Q7, and Q15 reach an IQR equal to 1. In the Economic-promoter perspective, Socio-economic and political and Technical operation groups, a large number of statements have in common the same whiskers (2 and 5) and boxes (3-4). These are statements with an IQR equal to 1, but with different means, such as the low value close to 3 of Q17 and the high value close to 4 of Q23. Q49 in the Socio-economic and political group is the only statement where the quartile range is at the 2 and 3 levels. Therefore, this is not an important issue for respondents.
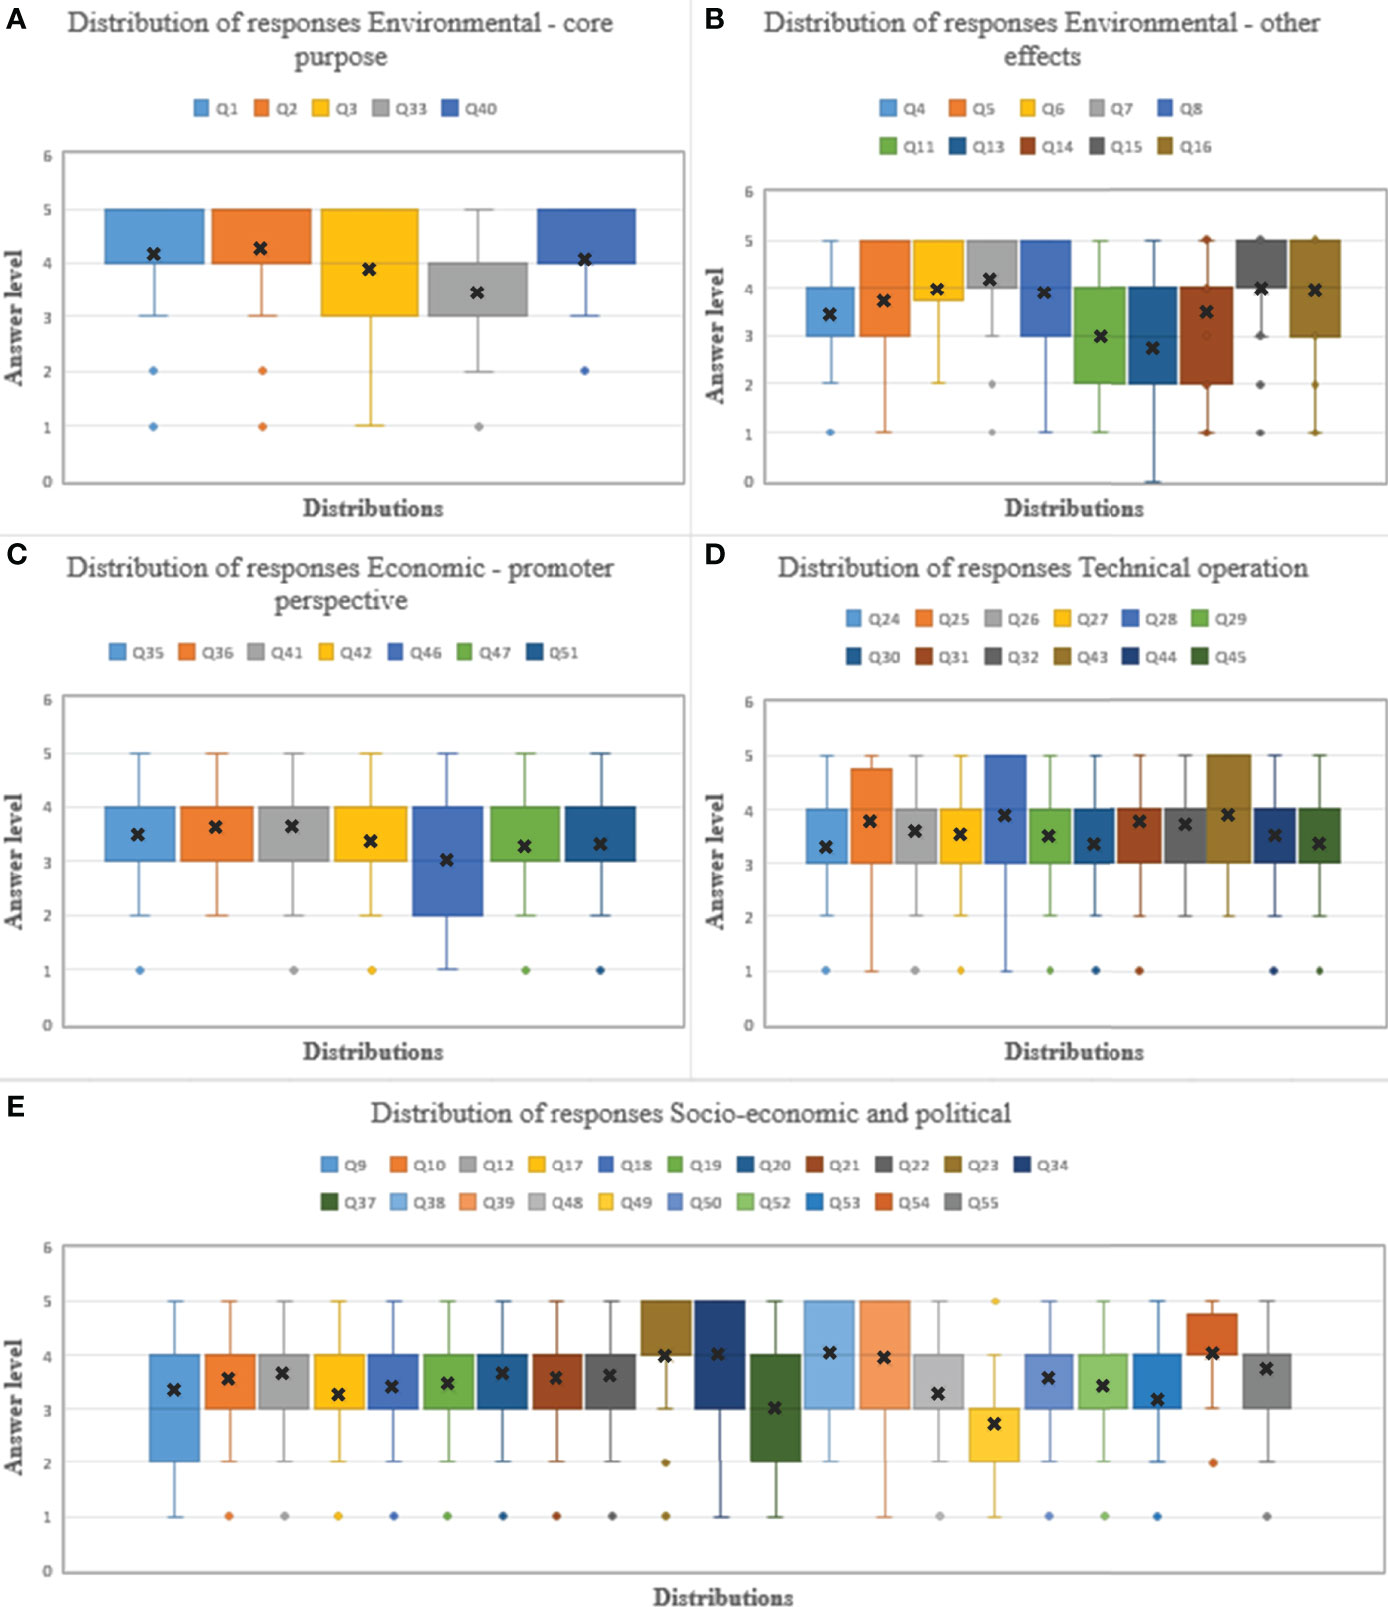
Figure 8 Distribution of the responses per area.
Additional analysis is developed using Mann-Whitney U tests to assess whether respondents from Universities and Research Centers respond statistically differently from all other respondents. In Table 3, the results from these tests include all the groups of statements. A p-value higher than 0.05 means that the responses from Universities and Research Centers are not statistically different from the others, except for Technical Operation (p-value = 0.001). In fact, this group of statements is fundamental to Universities and Research Centers (see Figure 7) and is less important for respondents from Administrations, Marinas and Ports, and Associations.
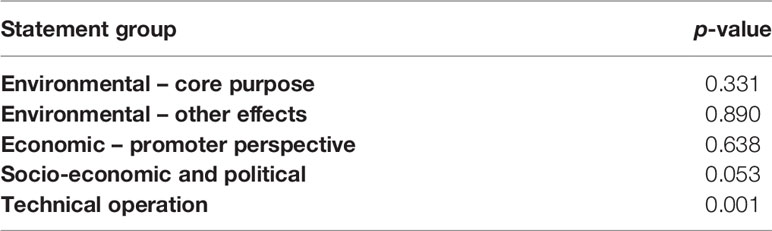
Table 3 p-value of the Mann-Whitney U tests.
The different levels of the Likert scale were converted into numbers between 1 and 5, as for the development of statistical analyses. The IQR consensus measure is evaluated based on the data collected and systematized in Figure 5. Figure 9 includes the value of this measure for Round 1 (Data available in Supplementary Materials Table S3).
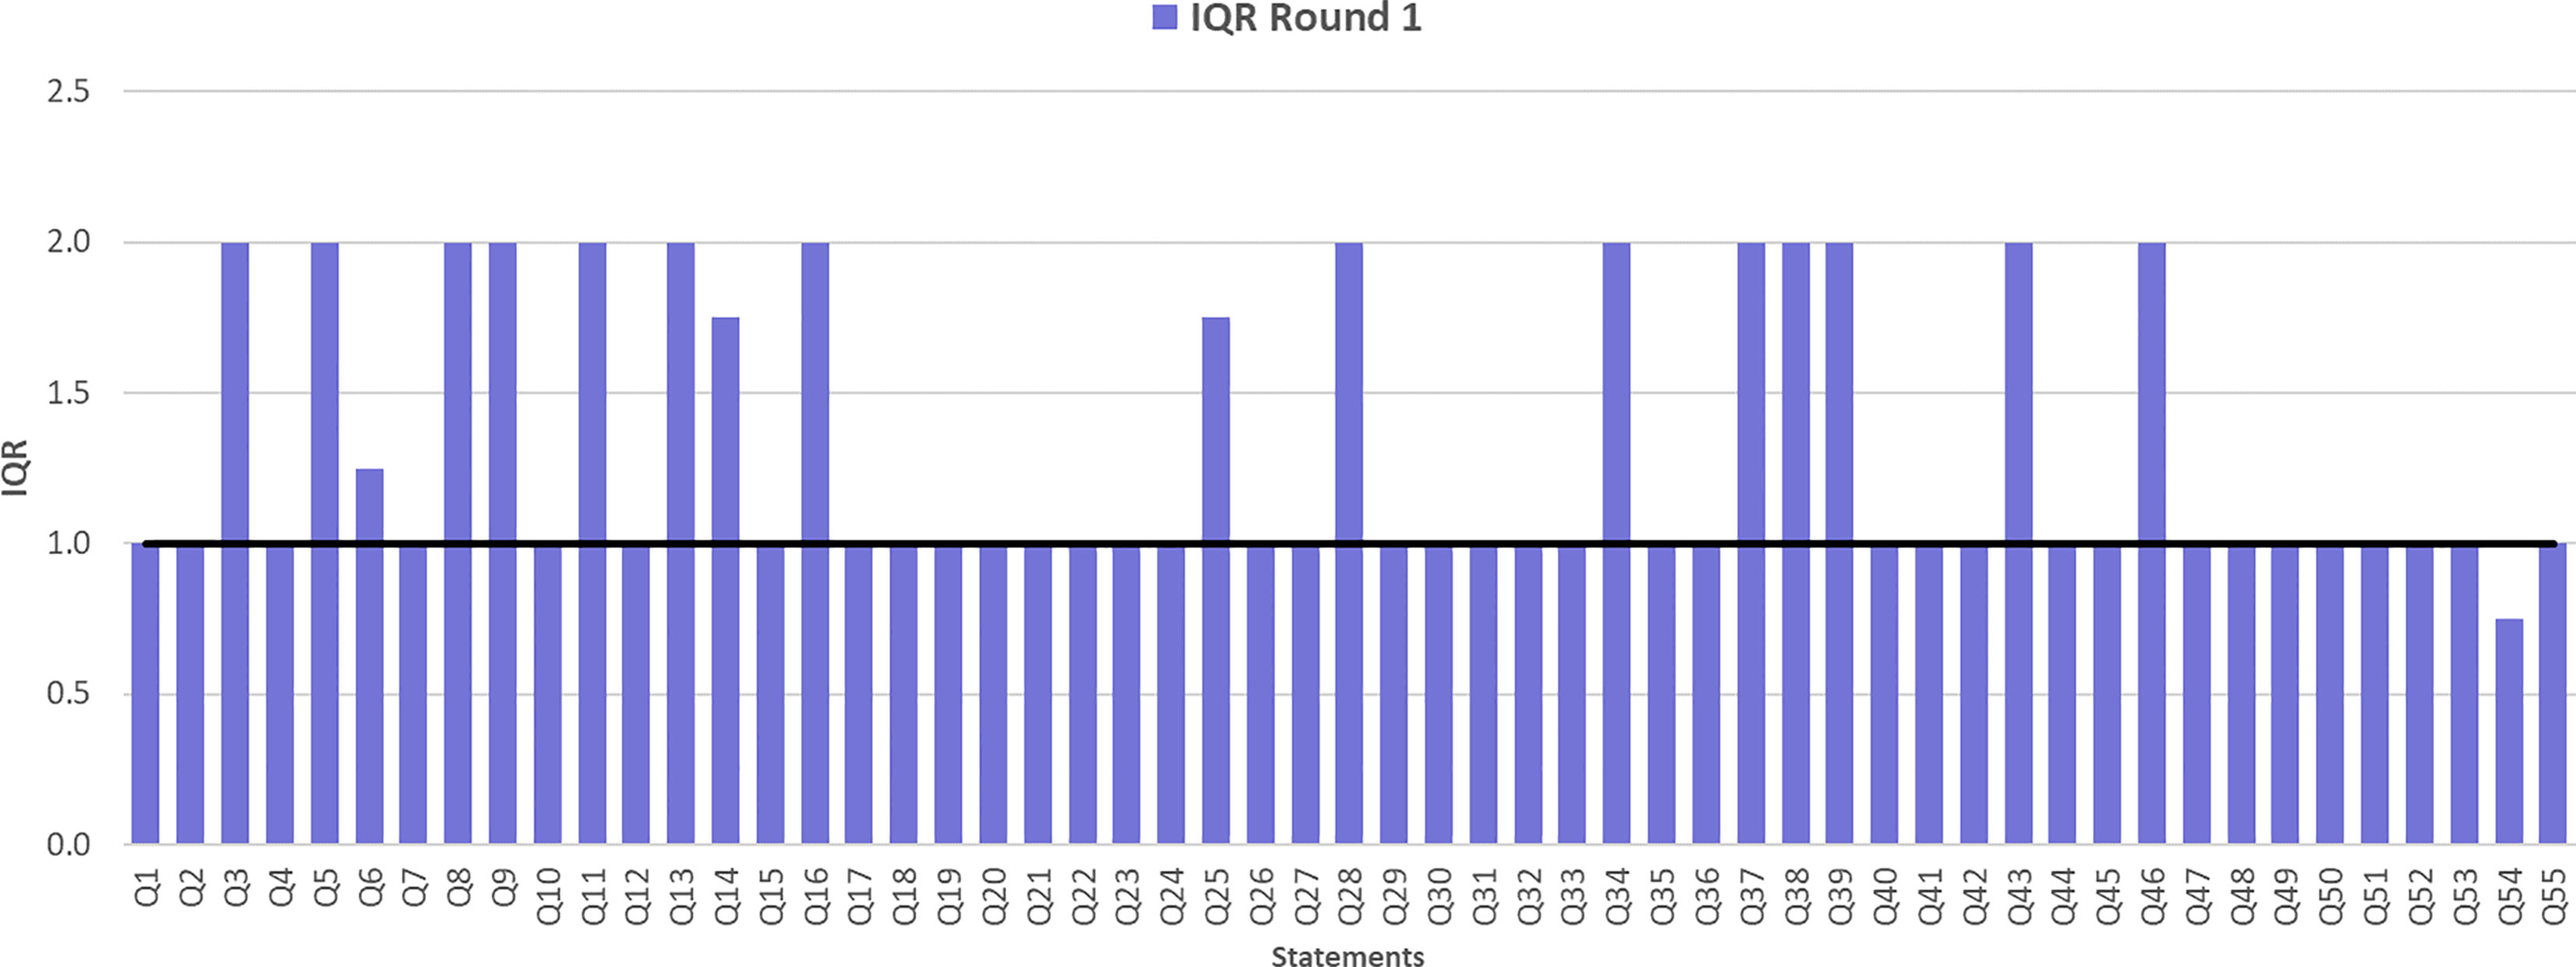
Figure 9 IQR measure for all statements at Round 1.
The statements that achieve consensus in the first round are those with an IQR value equal to 1 or lower (i.e., the horizontal line in the Figure 9). Of the 55 statements, 38 achieved consensus while 17 did not and were considered for a second round. Figure 10 displays the percentage of questions in each area that achieve consensus in the first round (Data available in Supplementary Materials Table S3). Respondents seem to have more similar opinions (as they reach consensus) in areas such as Environmental – core purpose (80%) and Economic – promoter perspective (86%), and different views on Environmental – other effects (30%) statements.
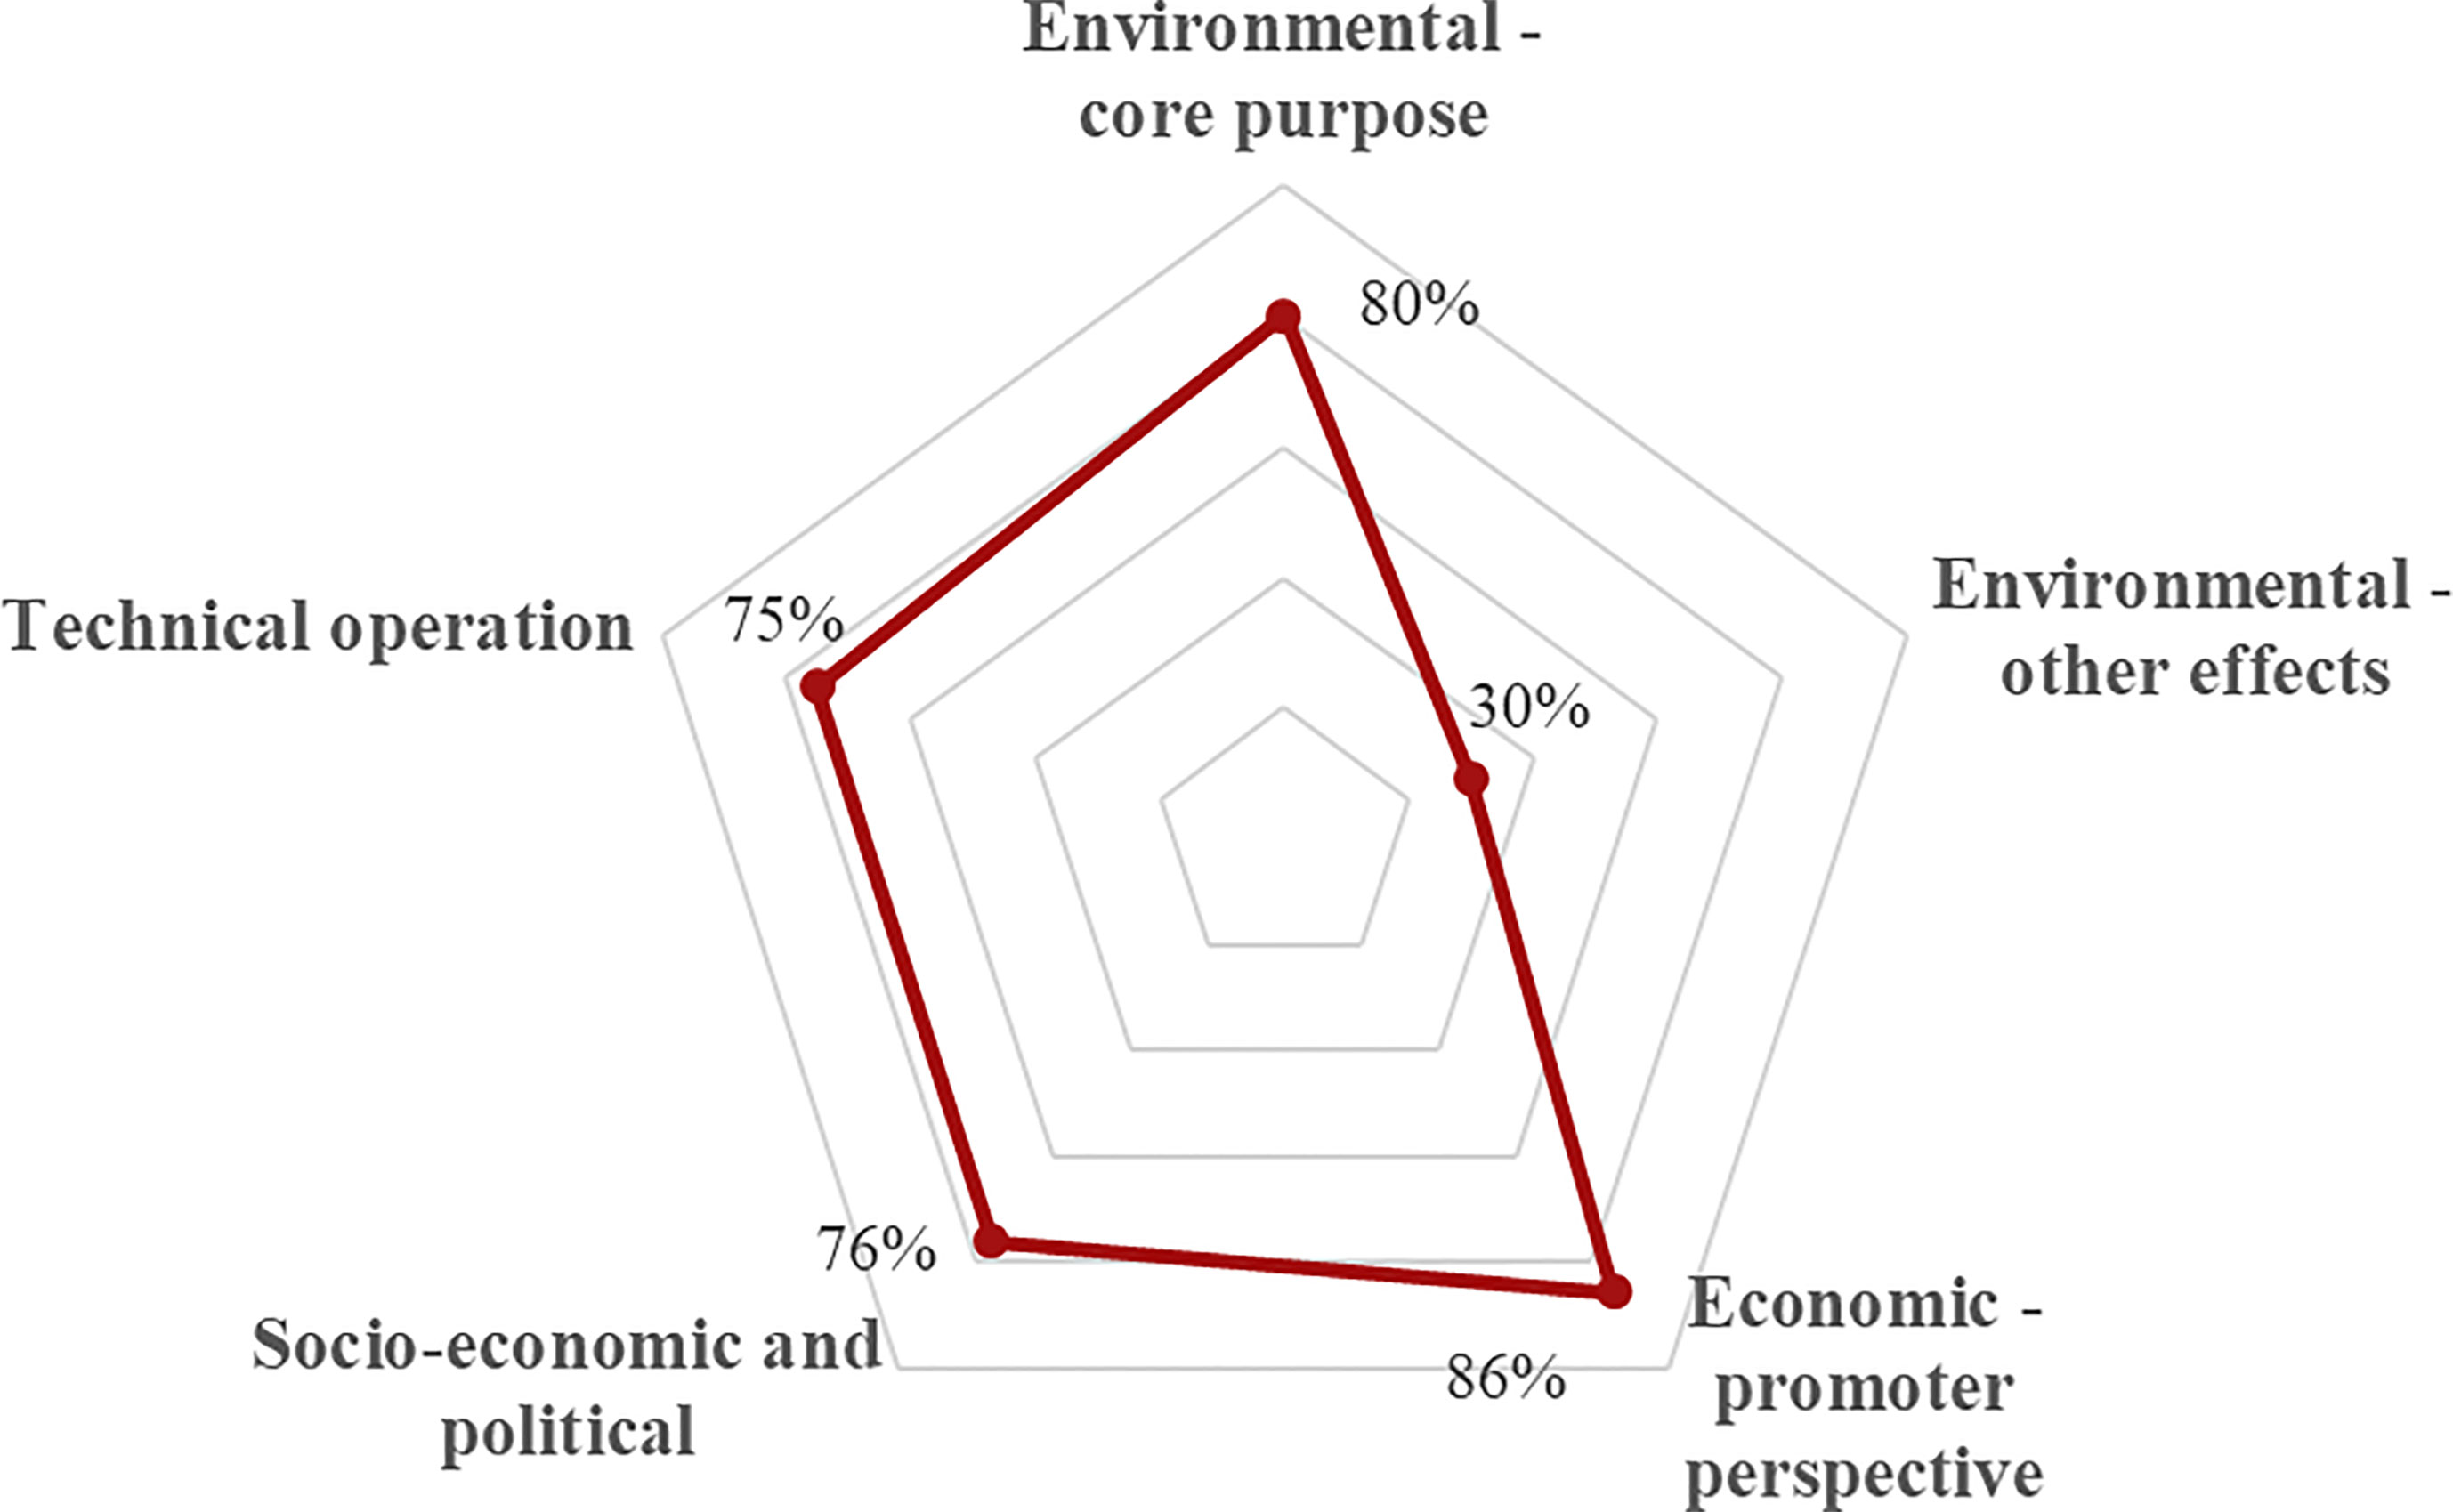
Figure 10 Percentage of consensual statements in each group (IQR equal to 1 or lower) in Round 1.
That is why this is the group with the lowest percentage of statements achieving consensus. As examined by Figure 6, the Environmental-other effects group of statements include a high percentage of responses in the Extremely important and Not important levels relative to the other groups. This kind of response distribution, with high percentages in the extreme levels of the Likert scale, leads to statements without consensus, which are the commonest in this group of questions.
Two levels of agreement are considered to organize the statements: those that are key and those that are advisable. These levels are defined based on threshold levels of the percentage of responses of Very/Extremely important and the mean value of statements. In the Delphi rounds the key statements selected are those with a percentage of responses of Very/Extremely important equal to 70% or higher and mean values equal to 4 or higher. The advisable values are those with a percentage of responses of Very/Extremely important equal to 60% or higher and mean values equal to 3.5 or higher.
The values for these metrics for Round 1 are represented in Figure 11, with dark blue bars for the percentage of acceptance and light orange bars for the mean (Data available in Supplementary Materials Table S3). This figure also includes two horizontal dark blue lines at percentages 60% and 70% and two horizontal light orange lines at means 3.5 and 4. These lines define the threshold values to select the key and the advisable statements. The statements that did not reach consensus in the first round are not included in this figure as they will be reassessed in an additional round.
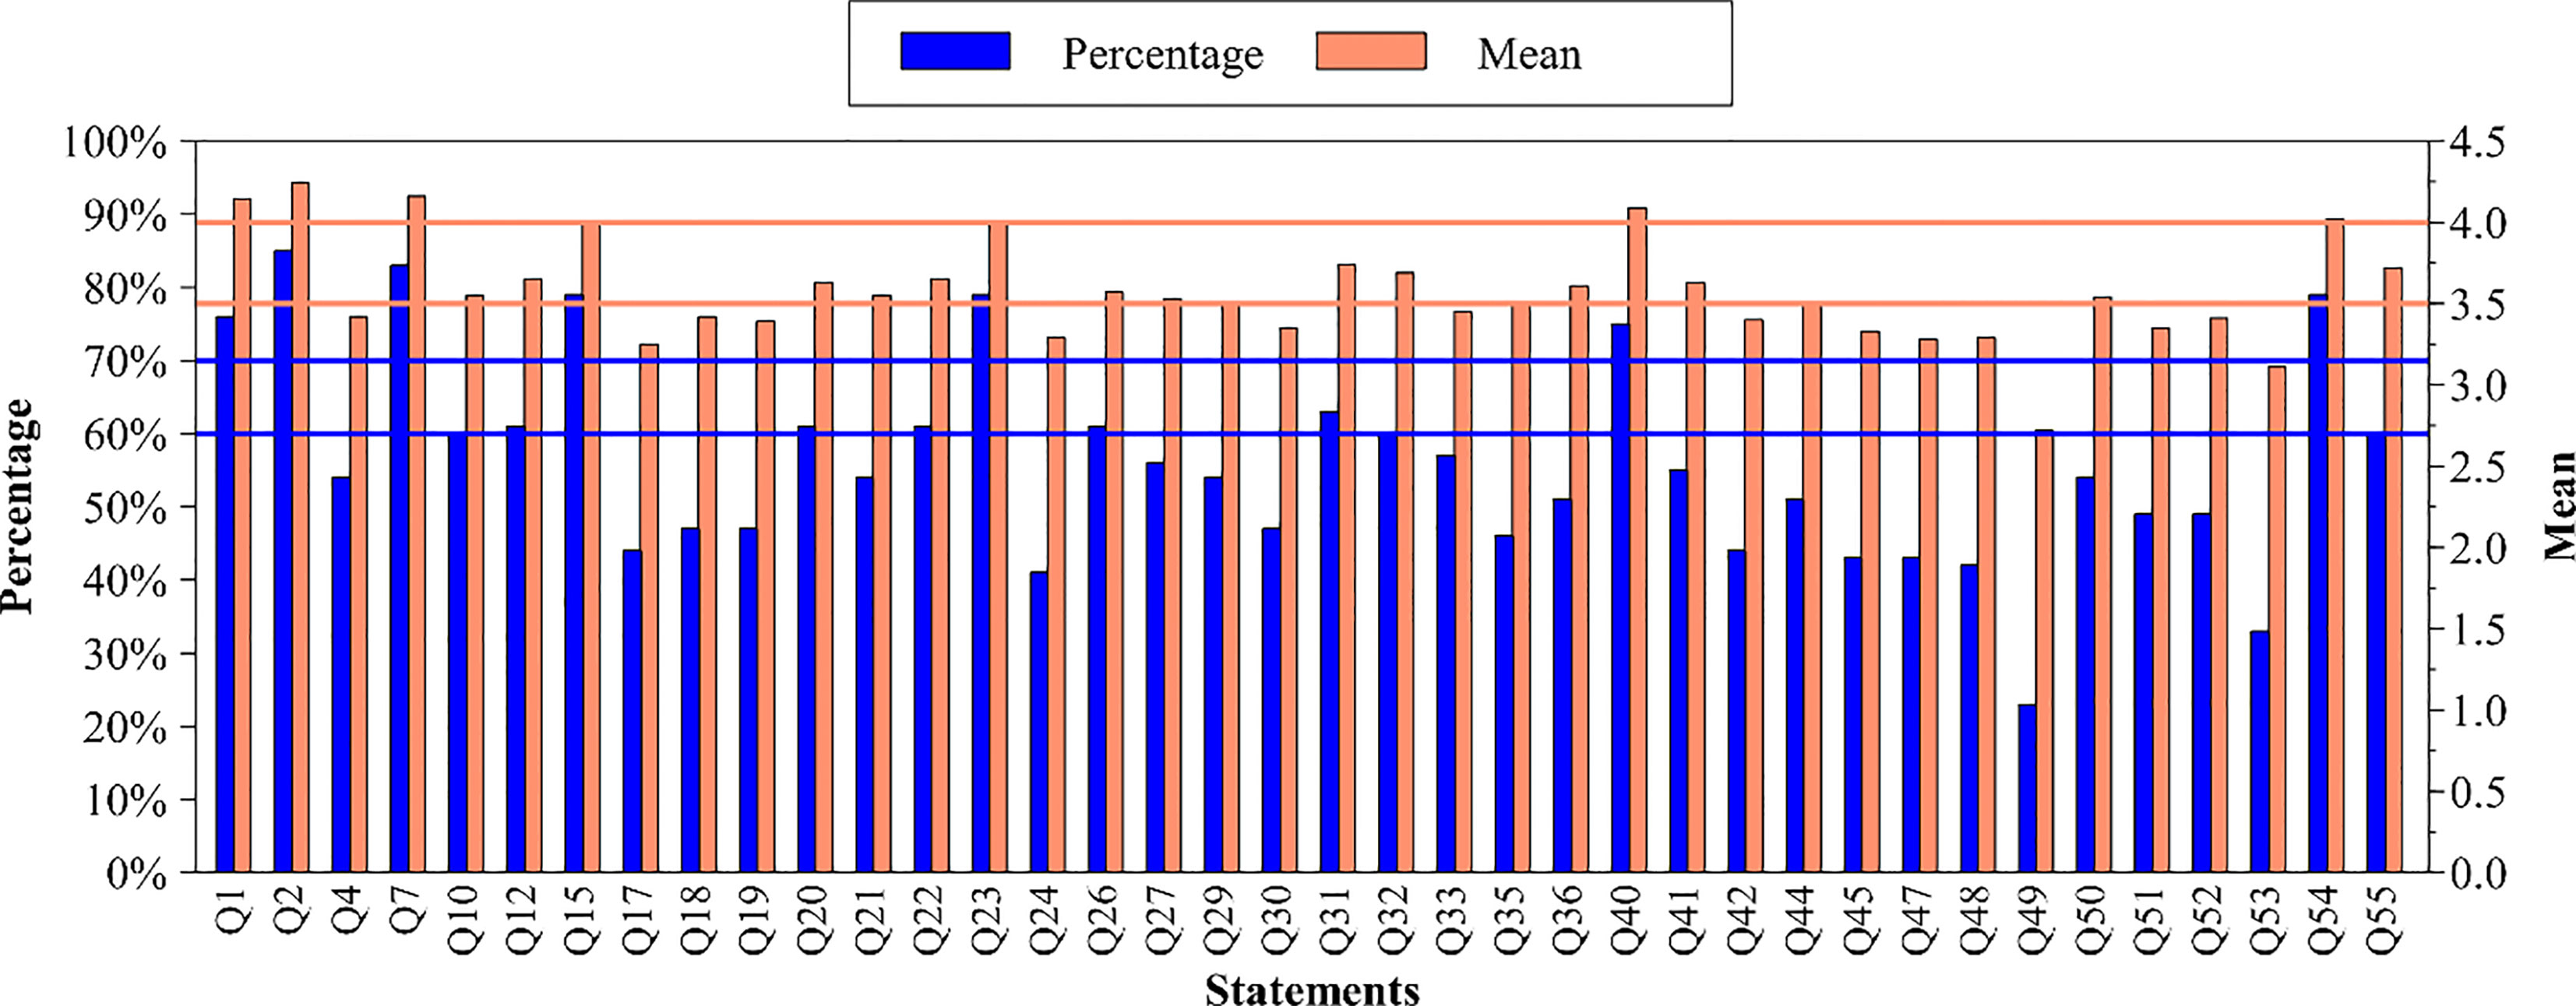
Figure 11 Percentage of responses of Very/Extremely important and mean values of the statements that reach consensus at the first round.
Apart from 17 aspects to be reassessed in a second round, consensus was deemed to be sufficient to classify 38 aspects. According to the guidelines (Figure 3), the key aspects to be evaluated are those represented by Q1, Q2, Q7, Q15, Q23, Q40 and Q54. The advisable aspects are Q10, Q12, Q20, Q22, Q26, Q31, Q32 and Q55. The other 23 statements that show consensus but do not reach these threshold values (Figure 11) can be discarded as respondents did not attribute enough importance to them.
The 17 statements that did not reach consensus in Round 1 (Figure 11) were reevaluated in a second round. The responses of Round 2 are represented in Figure 12 (Data available in Supplementary Materials Table S4). Statements Q16 and Q43 are those with the highest number of responses on the positive side and statements Q11 and Q13 on the negative side. In this round, the Very important level is the commonest for a large group of questions.
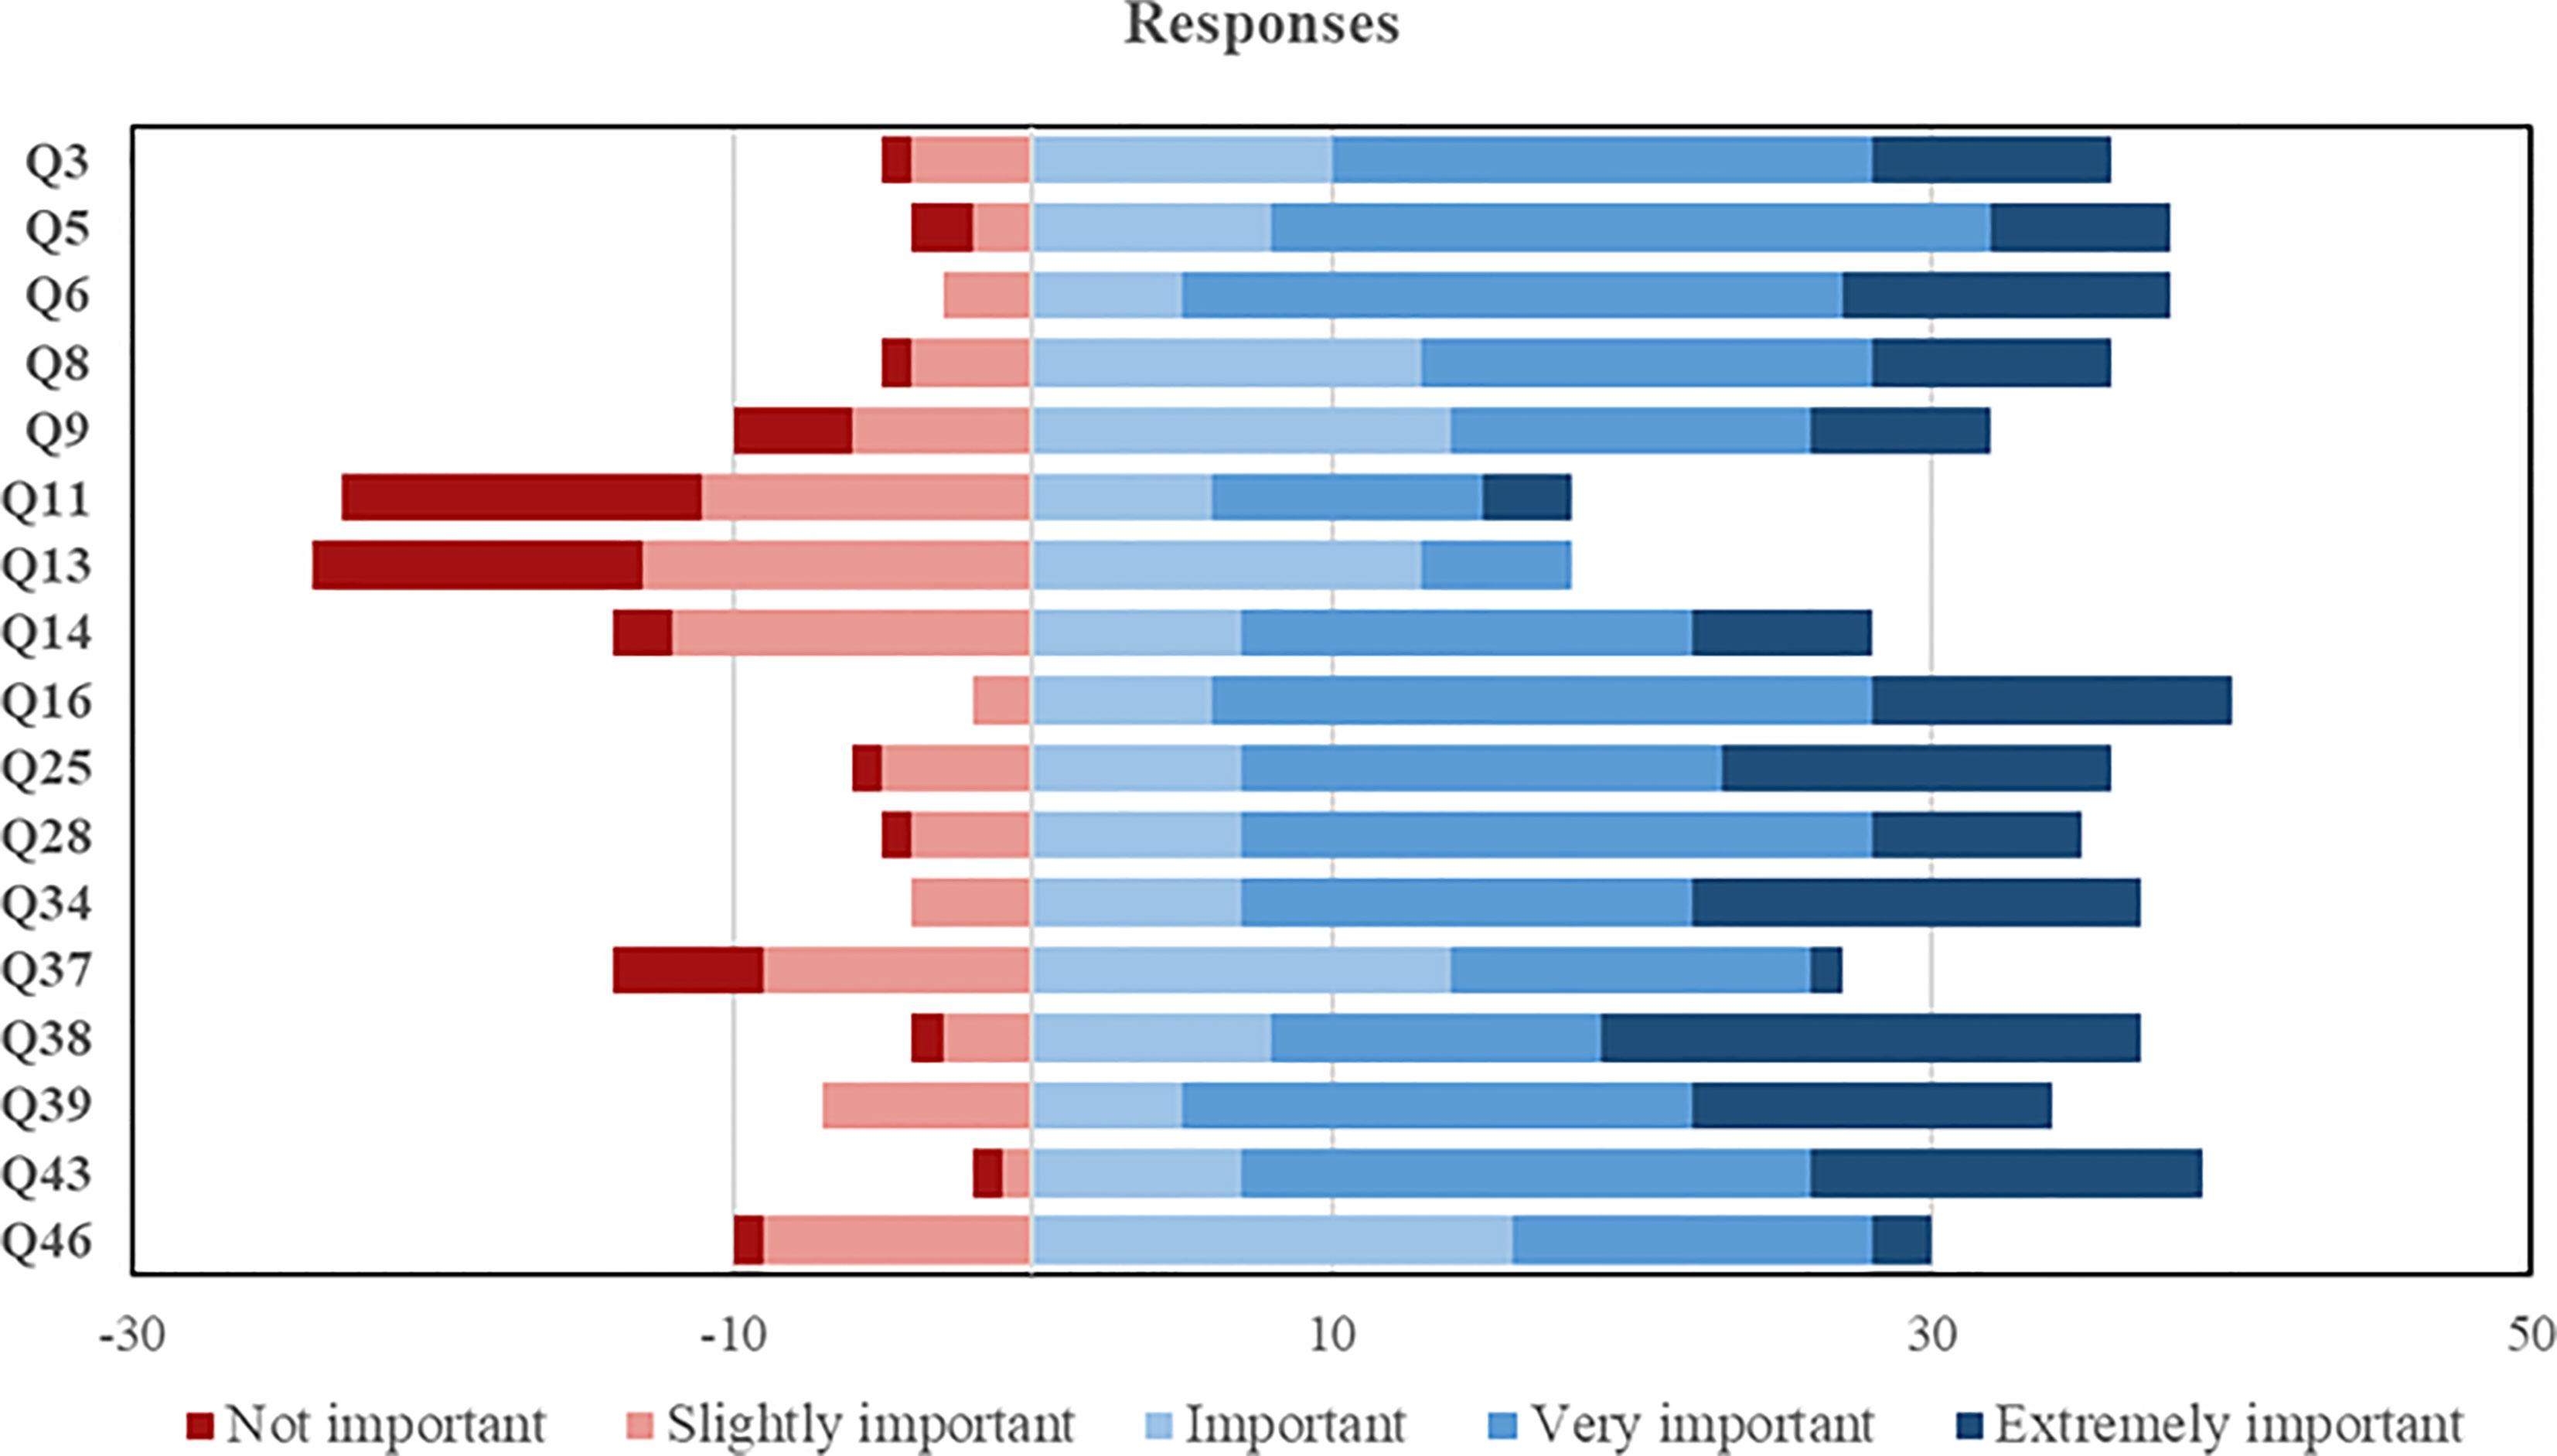
Figure 12 Diverging stacked bar chart for Round 2.
In the second round, the stability of responses between the two rounds is evaluated using Wilcoxon signed-rank test. In this test, the null hypothesis can be accepted if there is no difference in the responses of the experts between Round 1 and Round 2. For each statement of the second round Table 4 includes the p-value of the Wilcoxon test.
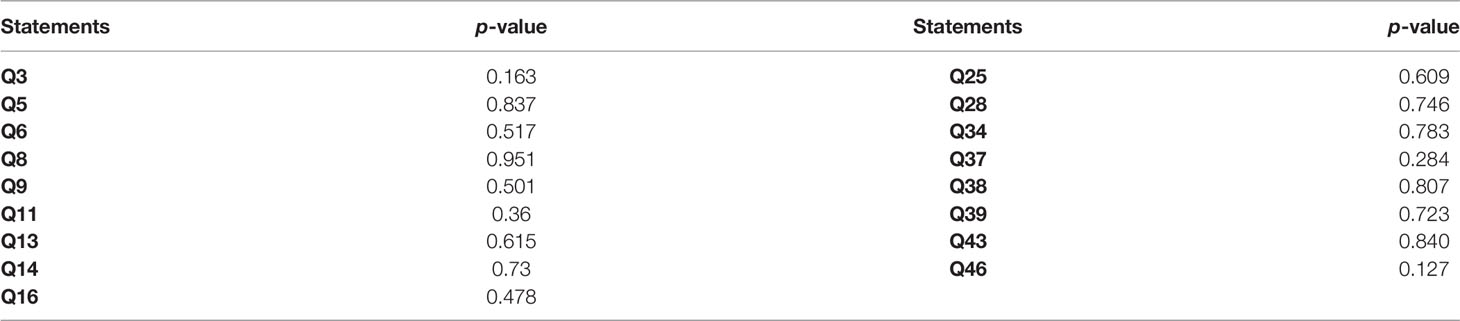
Table 4 p-value of the Wilcoxon signed rank test.
The null hypothesis of the Wilcoxon test is accepted as the p-value is much higher than 0.05 for all the 17 statements. In this circumstance stability was reached and no additional Delphi rounds were necessary. The stability of responses between rounds determines that further rounds will not significantly increase the level of consensus (Mubarak et al., 2019) and the rules for the selection of the final list of statements (Figure 3) can be applied (Dajani et al., 1979).
After reaching stability, we come to the rules for selecting additional key and advisable statements. Figure 13 includes bars with the percentage of response values in green and yellow bars of the mean (Data available in Supplementary Materials Table S5). The two horizontal green lines represent the percentages 60% and 70% and the two horizontal yellow lines, the means 3.5 and 4. From this figure, the key statements selected in the second round are Q6, Q16, Q34, Q38 and Q43 and the advisable statements are Q3, Q5, Q25, Q28 and Q39.
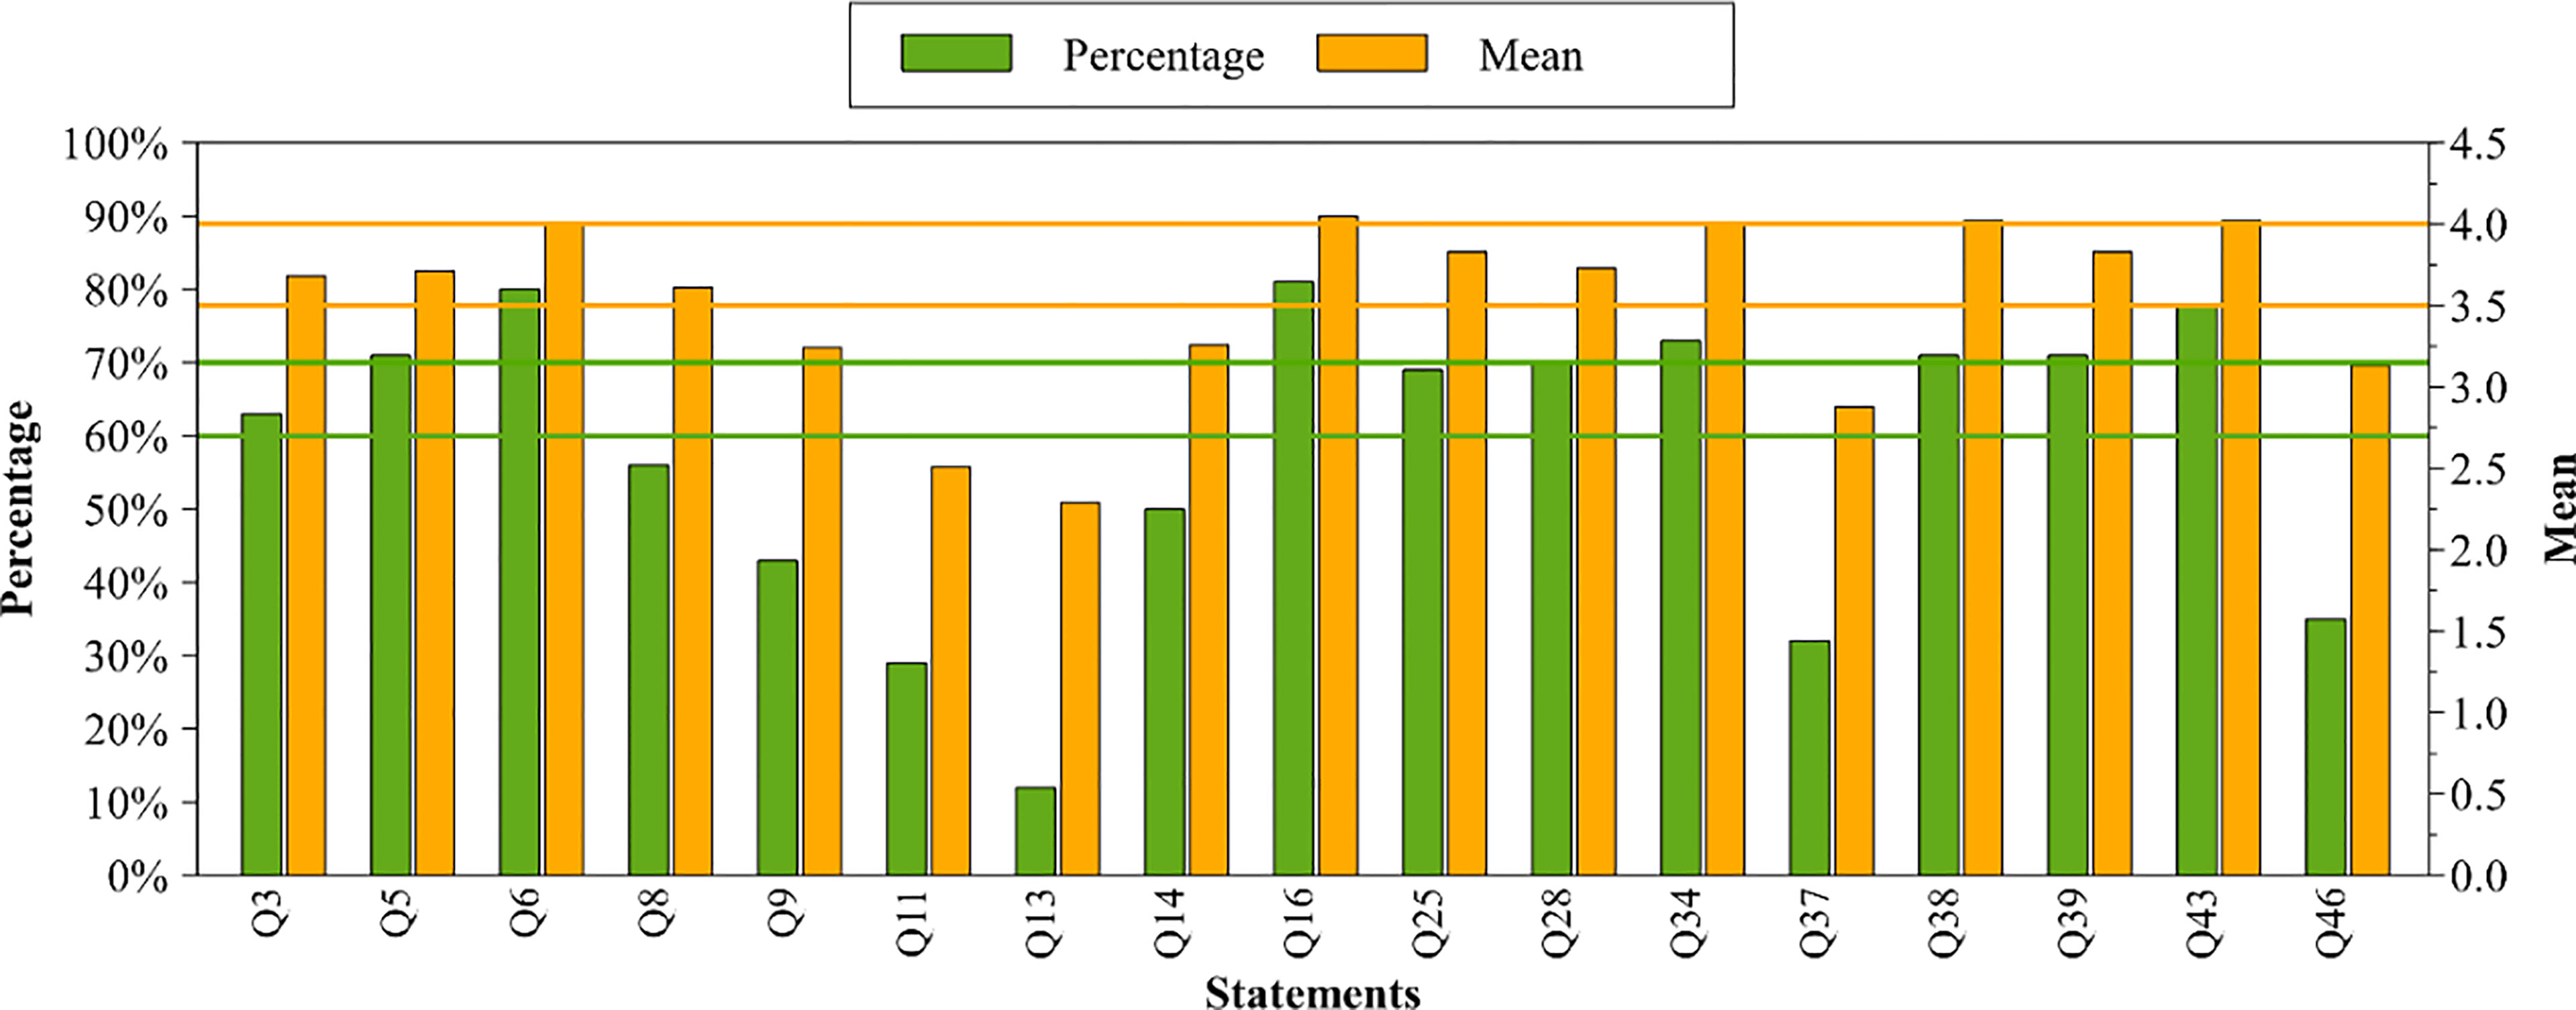
Figure 13 Percentage of responses of Very/Extremely important and mean values of the statements at the second round.
The analysis of the importance of the 55 aspects based on the percentage and mean measures leads to a definition of 12 key aspects and a further 13 are considered advisable. The remaining 30 questionnaire statements can be discarded as respondents did not attribute enough importance to them over the two rounds.
Figure 14 lists the selected statements that can be used in the future in a variety of areas where decision making is the issue. The key aspects as well as the aspects included in the advisable set cover different perspectives grouped in the areas previously defined. However, it is clear that matters related to business aspects did not receive a great deal of consideration from the panel of evaluators. In fact, the Economic-promoters perspective does not include any key or advisable statement.
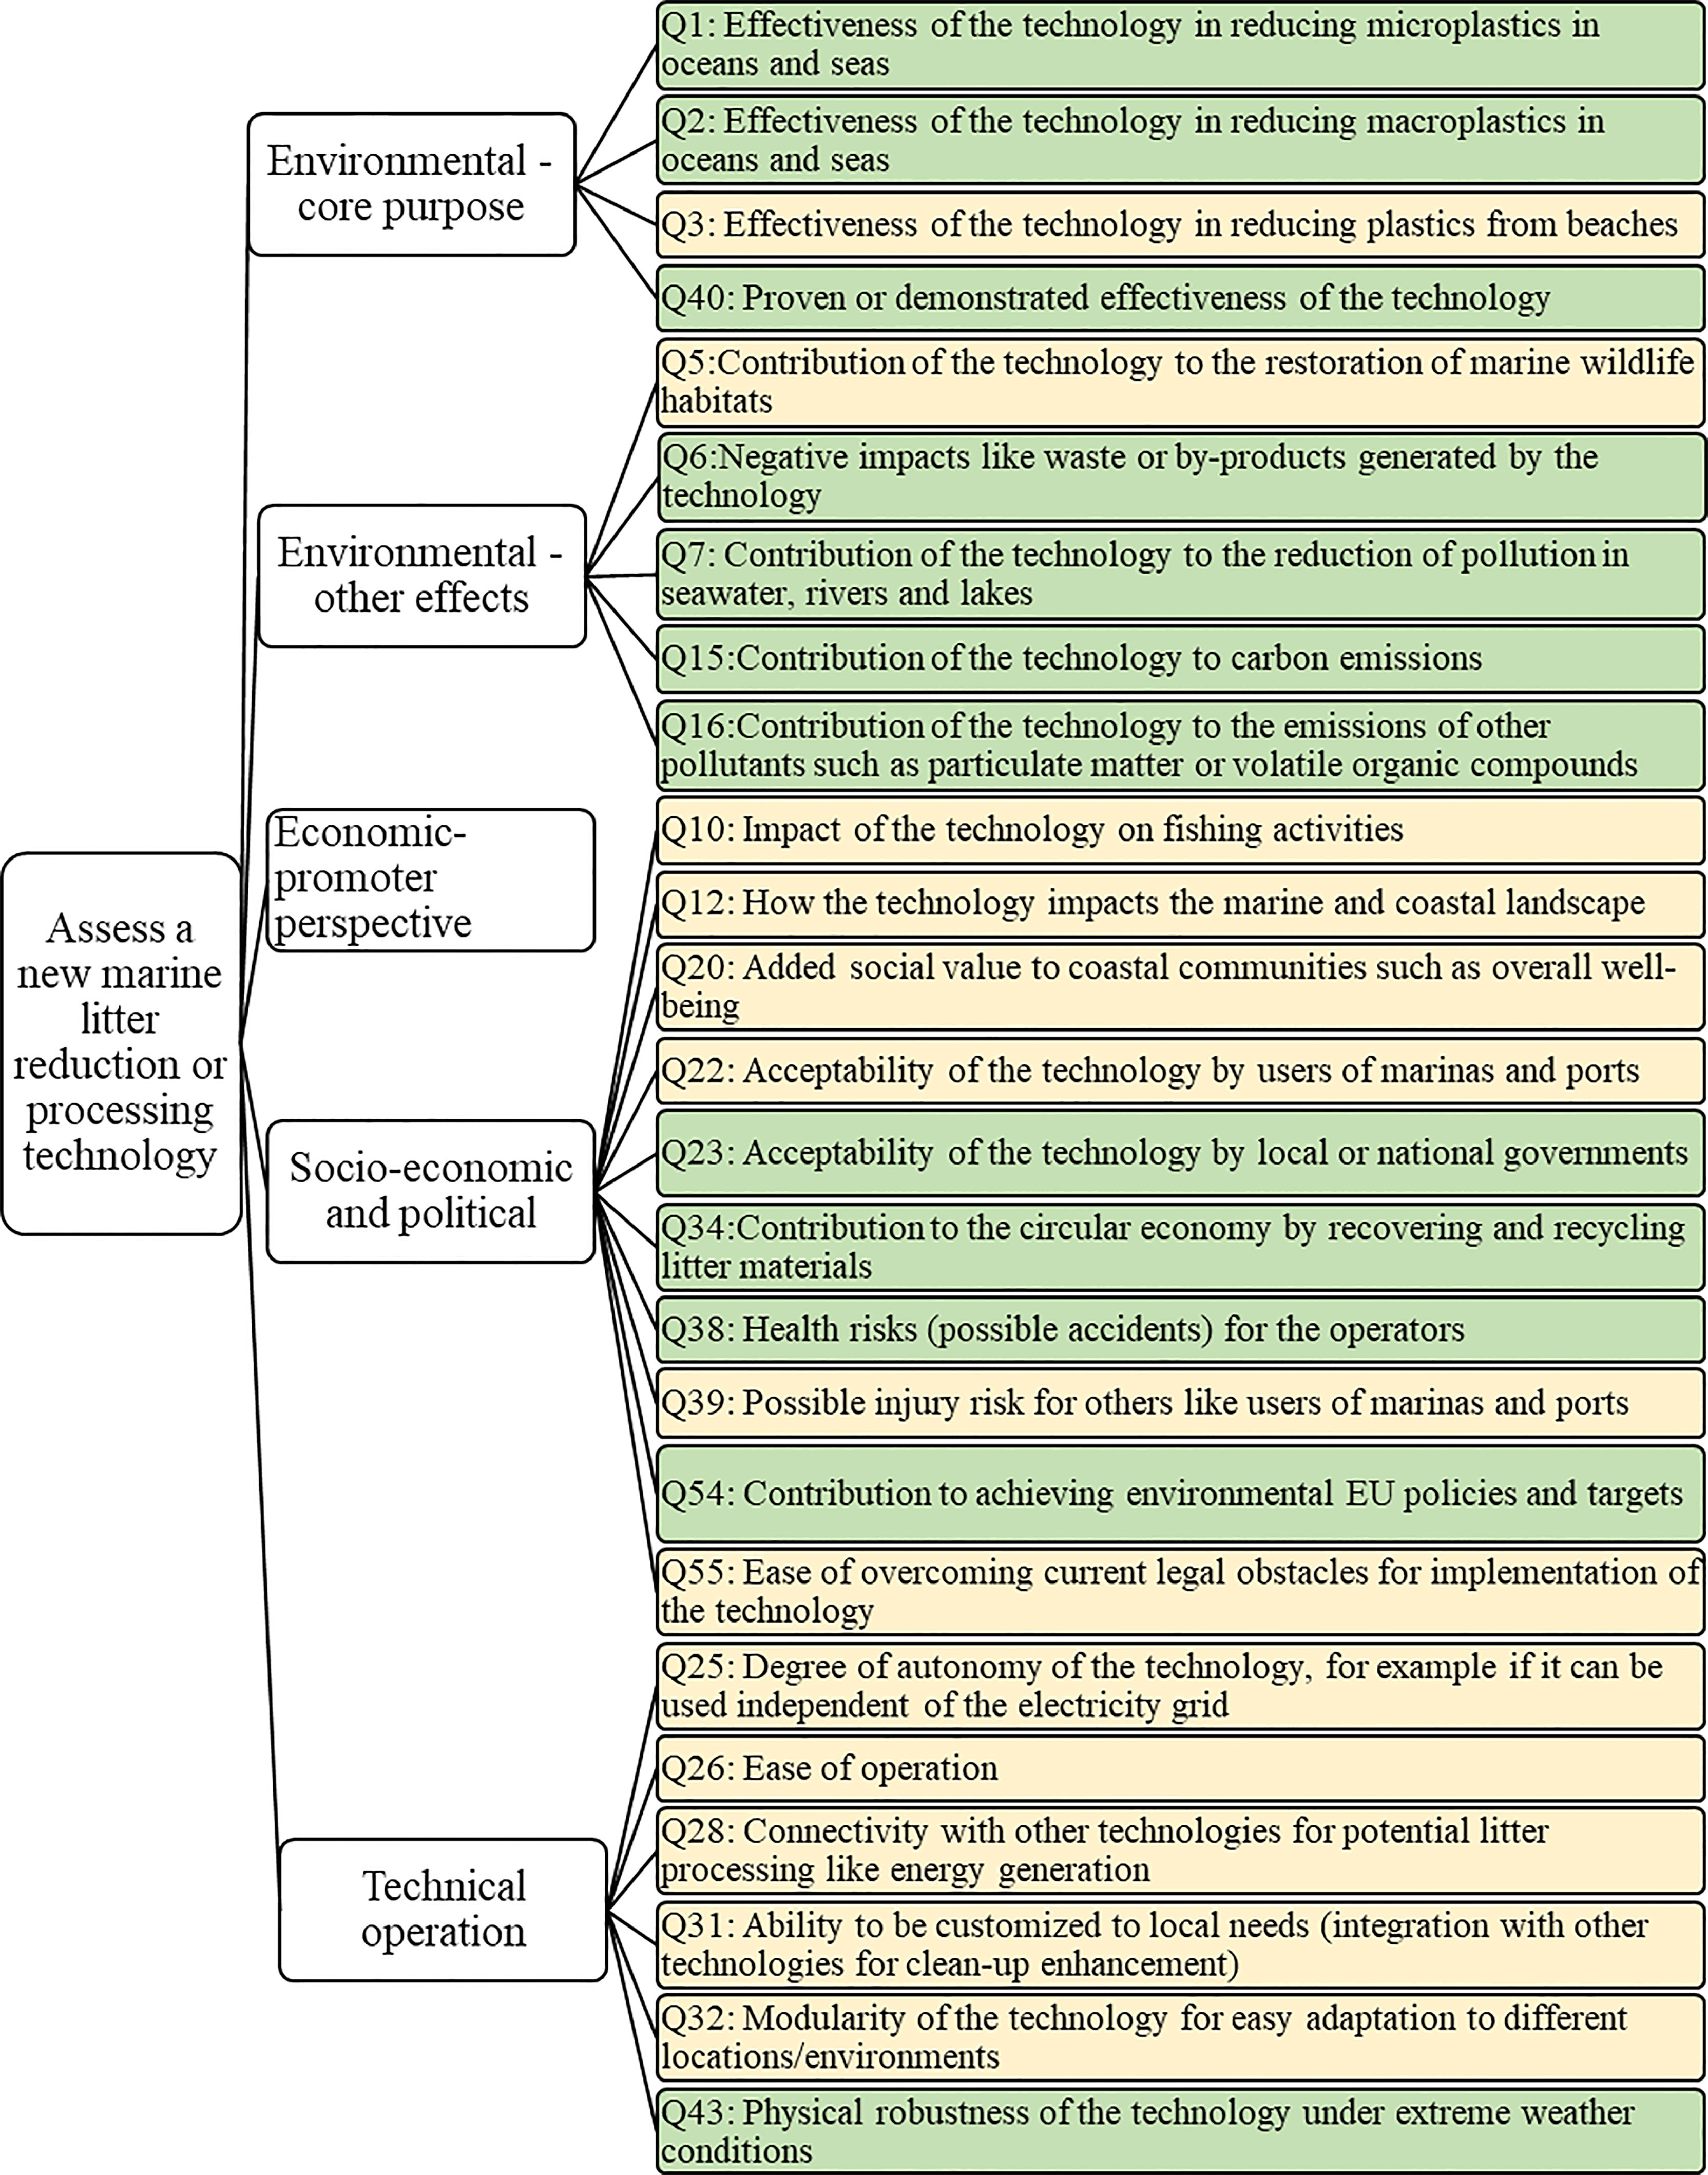
Figure 14 Key (darker) and advisable (lighter) aspects selected according to the groups of statements.
The survey design embraced all the perspectives to collect information on the most important characteristics for new marine litter reduction and processing technologies. However, this is a rather new subject and therefore it has been challenging to draw up an exhaustive list of aspects to be analyzed or to cover the variety of stakeholders with affinity for this topic.
Depending on the objective of the activity that will use this list and the Delphi method, besides the key and advisable questions, other questions can be added to cover specific aspects. Particular attention could be paid to checking the questions that did not complete the thresholds defined for the classification and do not belong to the final list but that did reach a non-negligible level of agreement (Supplementary Materials Table S1).
In this work, a Delphi method is used to gather data and identify the most important aspects that should be considered when planning, designing or evaluating new marine litter reduction and processing technologies. Plastic debris in the oceans is a worldwide problem and the current tendency for it to increase should be reversed by the use of appropriate technologies.
This is a rather new subject, and this work presents an exploratory exercise to create guidelines for future work in the field. A comprehensive list of statements to fully characterize various aspects, that can be grouped as Environmental – core purpose; Environmental – other effects; Economic – promoter perspective; Socio-economic and political; and Technical operation, is proposed.
A large spectrum of respondents from 22 countries has participated in this survey. They were subdivided into five groups, namely, Administrations, Marinas and Ports, Associations, Companies, Universities, and Research Centers. The Research Centers contributed the most and the Associations the least.
The data from the responses in the survey rounds were analyzed using statistical measures according to the groups of respondents and the groups of statements. The Very important level of the Likert scale was the most common response for all groups of statements, except for the Economic-promoter perspective, where the Important level got the highest percentage. The Not important level was the least frequent. The University respondents gave more responses on the Extremely important level than the other groups and fewer responses on the Important and Very important level.
In general terms, it is clear that environmental issues are the most important for all types of stakeholders. Technical operation is also very valuable for Companies, Universities and Research Centers. This is in line with the mandates of research for these two last groups and the requirements for Companies.
The results from the two Delphi rounds reach 12 key and a further 13 advisable statements. It is clear that Universities, Research Centers (units developing proposals for new technologies) and Companies (technology producers) should take effectiveness issues about the new technologies into account, together with environmental impacts on ecosystem services, and the emissions of carbon and other pollutants (particulate matter or volatile organic compounds). The robustness of a technology under extreme weather events should also be a concern for the technology producers. The local application and the operational conditions of technologies should be well thought-out by Marinas and Ports, and the same applies to Companies promoting activities that can be improved or somehow impacted by the new technologies, which might well include tourism, nautical sports, fishing and aquaculture activities. Overall well-being has to be a matter for regulation targeted by the Administration in the context of applying the new technologies. Associations can get involved with social acceptance whenever new technologies go to the market and are planned to be used in specific situations.
This is nevertheless a fairly new subject, and we should be careful about delivering definitive conclusions. The constructed checklist can be very helpful for different types of decision-making processes (from technical decisions to business and policy decisions) and for a variety of stakeholders.
This is why in each application, the questions to be used should be well thought-out and the need for additional specific questions should be analyzed. In fact, the results show that the Economic-promoters perspective did not get a place among the key or advisable questions. In fact, the experts assigned low values to the questions relating to this type of area. It seems that at the moment it is still very challenging to find promoters of the technologies to respond to the questionnaire.
Additionally, choices depend on the thresholds used for the statistical analysis. Thresholds are critical and there are no definitive frameworks for performing the evaluations. This means that the results should be taken in the light of the endeavors that should be pursued in this field. We hope this work is an inspiring contribution to the flow of knowledge that is developing in this emerging area.
The original contributions presented in the study are included in the article/Supplementary Material. Further inquiries can be directed to the corresponding author.
MC: Conceptualization, Methodology, Investigation, Formal analysis, Writing – original draft, Writing – review and editing. JM: Formal analysis, Visualization, Writing - review and editing. LD: Conceptualization, Investigation, Writing - review and editing. IC: Conceptualization, Writing – review and editing. GT: Investigation, Writing – review and editing. All authors read and approved the submitted version.
This work was funded under the EU project CLAIM (Cleaning Litter by developing and Applying Innovative Methods in European seas) H2020 Grant agreement ID: 774586. Authors MC and JM additionally acknowledge the support of national funds through FCT, under the project UID/EMS/00285/2020.
The authors declare that the research was conducted in the absence of any commercial or financial relationships that could be construed as a potential conflict of interest.
All claims expressed in this article are solely those of the authors and do not necessarily represent those of their affiliated organizations, or those of the publisher, the editors and the reviewers. Any product that may be evaluated in this article, or claim that may be made by its manufacturer, is not guaranteed or endorsed by the publisher.
The authors are grateful to all the stakeholders and experts who agreed to participate in this study and set aside time to respond to the Delphi Questionnaire.
The Supplementary Material for this article can be found online at: https://www.frontiersin.org/articles/10.3389/fmars.2022.886581/full#supplementary-material
Aghimien D. O., Aigbavboa C. O., Oke A. E. (2020). Critical Success Factors for Digital Partnering of Construction Organisations – A Delphi Study. Eng. Constr. Archit. Manage. 27 (10), 3171–3188. doi: 10.1108/ECAM-11-2019-0602
Ahmed A., Van Den Muijsenbergh M. E., Vrijhoef H. J. (2021). Consensus on Integrated Care for Older People Among Dutch Experts: A Delphi Study. Int. J. Integr. Care 21 (4), 1–11. doi: 10.5334/ijic.5682
Barrios M., Guilera G., Nuño L., Gómez-Benito J. (2021). Consensus in the Delphi Method: What Makes a Decision Change? Technol. Forecasting Soc. Change 163, 120484. doi: 10.1016/j.techfore.2020.120484
Barzekar G., Aziz A., Mariapan M., Ismail M. H., Hosseni S. M. (2011). Delphi Technique for Generating Criteria and Indicators in Monitoring Ecotourism Sustainability in Northern Forests of Iran: Case Study on Dohezar and Sehezar Watersheds. Folia Forestalia Polonica Ser. A 53 (2), 130–141.
Bentley M., Kerr R., Powell S. (2016). The Use of a Modified Delphi Technique to Inform the Development of Best Practice in Interprofessional Training for Collaborative Primary Healthcare. J. Res. Interprofessional Pract. Educ. 6 (1). doi: 10.22230/jripe.2016v6n1a232
Besseling E., Quik J. T. K., Sun M., Koelmans A. A. (2017). Fate of Nano- and Microplastic in Freshwater Systems: A Modeling Study. Environ. Pollut. 220, 540–548. doi: 10.1016/j.envpol.2016.10.001
Bhandari S., Wahl B., Bennett S., Engineer C. Y., Pandey P., Peters D. H. (2020). Identifying Core Competencies for Practicing Public Health Professionals: Results From a Delphi Exercise in Uttar Pradesh, India. BMC Public Health 20 (1), 1–11. doi: 10.1186/s12889-020-09711-4
Birko S., Dove E. S., Özdemir V., Dalal K. (2015). Evaluation of Nine Consensus Indices in Delphi Foresight Research and Their Dependency on Delphi Survey Characteristics: A Simulation Study and Debate on Delphi Design and Interpretation. PloS One 10 (8). doi: 10.1371/journal.pone.0135162
Brunt H., Barnes J., Longhurst J. W. S., Scally G., Hayes E. (2018). Enhancing Local Air Quality Management to Maximise Public Health Integration, Collaboration and Impact in Wales, UK: A Delphi Study. Environ. Sci. Policy 80, 105–116. doi: 10.1016/j.envsci.2017.11.014
Chen C., Jiang H. (2020). Important Skills for Data Scientists in China: Two Delphi Studies. J. Comput. Inf. Syst. 60 (3), 287–296. doi: 10.1080/08874417.2018.1472047
Dajani J. S., Sincoff M. Z., Talley W. K. (1979). Stability and Agreement Criteria for the Termination of Delphi Studies. Technol. Forecasting Soc. Change 13 (1), 83–90. doi: 10.1016/0040-1625(79)90007-6
Da Silveira L. A. B., De Vasconcellos E. P. G., Guedes L. F. A., Guedes L. V. (2016). “Using Delphi as a Basis to Design a Technology Roadmap,” in Conference: 25th International Conference of the International Association for Management of Technology (IAMOT 2016). [ORLANDO FLORIDA USA: International Association for Management of Technology (IAMOT)]. 220–238).
De Brito M. M., Evers M., Höllermann B. (2017). Prioritization of Flood Vulnerability, Coping Capacity and Exposure Indicators Through the Delphi Technique: A Case Study in Taquari-Antas Basin, Brazil. Int. J. Disaster Risk Reduct. 24, 119–128. doi: 10.1016/j.ijdrr.2017.05.027
Deshpande P. C., Brattebø H., Fet A. M. (2019). A Method to Extract Fishers’ Knowledge (FK) to Generate Evidence for Sustainable Management of Fishing Gears. MethodsX 6, 1044–1053. doi: 10.1016/j.mex.2019.05.008
De Vet E., Brug J., De Nooijer J., Dijkstra A., De Vries N. (2005). Determinants of Forward Stage Transitions: A Delphi Study. Health Educ. Res. 20 (2), 195–205. doi: 10.1093/her/cyg111
Everink I. H. J., van Haastregt J. C. M., Kempen G. I. J. M., Schols J. M. G. A. (2020). Building Consensus on an Integrated Care Pathway in Geriatric Rehabilitation: A Modified Delphi Study Among Professional Experts. J. Appl. Gerontol. 39 (4), 423–434. doi: 10.1177/0733464818774629
Frew J. W., Lowes M. A., Goldfarb N., Butt M., Piguet V., O’Brien E., et al. (2021). Global Harmonization of Morphological Definitions in Hidradenitis Suppurativa for a Proposed Glossary. JAMA Dermatol. 157 (4), 449–455. doi: 10.1001/jamadermatol.2020.5467
Giannarou L., Zervas E. (2014). Using Delphi Technique to Build Consensus in Practice. Int. J. Bus Sci. Appl. Manage. 9 (2), 65–82.
Gkanasos A, Tsiaras K, Triantaphyllidis G, Panagopoulos A, Pantazakos G, Owens T, et al. (2021). Stopping Macroplastic and Microplastic Pollution at Source by Installing Novel Technologies in River Estuaries and Waste Water Treatment Plants: The CLAIM Project. Front. Mar Sci. 8. doi: 10.3389/fmars.2021.738876
Gordon T. J., Helmer-Hirschberg O. (1964). Report on a Long-Range Forecasting Study (Santa Monica, California: RAND Corporation).
Guerin S, Kiernan G, Courtney E, McQuillan R, Ryan K (2020). Integration of Palliative Care in Services for Children With Life-Limiting Neurodevelopmental Disabilities and Their Families: A Delphi Study. BMC Health Serv. Res. 20 (1), 1–10. doi: 10.1186/s12913-020-05754-w
Hasson F., Keeney S., McKenna H. (2000). Research Guidelines for the Delphi Survey Technique. J. Adv. Nurs. 32 (4), 1008–1015. doi: 10.1046/j.1365-2648.2000.t01-1-01567.x
Heiberger R. M., Robbins N. B. (2014). Design of Diverging Stacked Bar Charts for Likert Scales and Other Applications. J. Stat. Software 57 (5), 1–32. doi: 10.18637/jss.v057.i05
Hofman K., Hughes K., Walters G. (2020). Effective Conservation Behaviours for Protecting Marine Environments: The Views of the Experts. J. Sustain. Tourism 28 (10), 1460–1478. doi: 10.1080/09669582.2020.1741597
Hohn S., Acevedo-Trejos E., Abrams J. F., Fulgencio de Moura J., Spranz R., Merico A. (2020). The Long-Term Legacy of Plastic Mass Production. Sci. Total Environ. 746. doi: 10.1016/j.scitotenv.2020.141115
Huang S. W., Lin L. F., Chang K. H., Escorpizo R., Liou T. H. (2020). Development of a Comprehensive Core Set From the International Classification of Functioning, Disability and Health for Return to Work Among Patients With Stroke Through Delphi-Based Consensus. Eur. J. Phys. Rehabil. Med. 56 (3), 257–264. doi: 10.23736/S1973-9087.20.05992-4
Huijben J. A., Wiegers E. J. A., De Keizer N. F., Maas A. I. R., Menon D., Ercole A., et al. (2019). Development of a Quality Indicator Set to Measure and Improve Quality of ICU Care for Patients With Traumatic Brain Injury. Crit. Care 23 (1), 95. doi: 10.1186/s13054-019-2377-x
Ivascu L. (2020). Measuring the Implications of Sustainable Manufacturing in the Context of Industry 4.0. Processes 8 (5), 585. doi: 10.3390/pr8050585
Ju B., Jin T. (2013). Incorporating Nonparametric Statistics Into Delphi Studies in Library and Information Science. Inf. Res. 18 (3), 1–10.
Julsrud T. E., Priya Uteng T. (2015). Technopolis, Shared Resources or Controlled Mobility? A Net-Based Delphi-Study to Explore Visions of Future Urban Daily Mobility in Norway. Eur. J. Futures Res. 3 (1), 1–13. doi: 10.1007/s40309-015-0069-6
Kaijser M. A., van Ramshorst G. H., Emous M., Veeger N. J. G. M., van Wagensveld B. A., Pierie J. P. E. N. (2018). A Delphi Consensus of the Crucial Steps in Gastric Bypass and Sleeve Gastrectomy Procedures in the Netherlands. Obes. Surg. 28 (9), 2634–2643. doi: 10.1007/s11695-018-3219-7
Kalaian S., Kasim R. M. (2012). Terminating Sequential Delphi Survey Data Collection. Pract. Assess. Res Eval. 17 (1), 5. doi: 10.7275/g48q-je05
Karakikes I., Nathanail E. (2020). Using the Delphi Method to Evaluate the Appropriateness of Urban Freight Transport Solutions. Smart Cities 3 (4), 1428–1447. doi: 10.3390/smartcities3040068
Kim M., Jang Y. C., Lee S. (2013). Application of Delphi-AHP Methods to Select the Priorities of WEEE for Recycling in a Waste Management Decision-Making Tool. J. Environ. Manage. 128, 941–948. doi: 10.1016/j.jenvman.2013.06.049
Lambat N., Kapse V., Sabnani C. (2019). Evaluation of the Decision-Making Process for Urban Public Transport in India: A Delphi Approach. Curr. Sci. 116 (10), 1706–1714. doi: 10.18520/cs/v116/i10/1706-1714
Lebreton L. C. M., van der Zwet J., Damsteeg J. W., Slat B., Andrady A., Reisser J. (2017). River Plastic Emissions to the World’s Oceans. Nat. Commun. 8 (1), 1–10. 2017. doi: 10.1038/ncomms15611
Lima-Rodríguez J. S., Lima-Serrano M., Jiménez-Picón N., Domínguez-Sánchez I. (2013). Content Validation of the Self-Perception of Family Health Status Scale Using the Delphi Technique. Rev. Latino-Americana Enfermagem 21 (2), 595–603. doi: 10.1590/S0104-11692013000200017
Marchau V., Linde E.V. (2016). “The Delphi Method,” in Foresight in Organizations, 1st Edition. (New York: Routledge)
Mazarrasa I., Puente A., Núñez P., García A., Abascal A. J., Juanes J. A. (2019). Assessing the Risk of Marine Litter Accumulation in Estuarine Habitats. Mar. Pollut. Bull. 144, 117–128. doi: 10.1016/j.marpolbul.2019.04.060
Mubarak N., Hatah E., Aris M. A. M., Shafie A. A., Zin C. S. (2019). Consensus Among Healthcare Stakeholders on a Collaborative Medication Therapy Management Model for Chronic Diseases in Malaysia; A Delphi Study. PloS One 14 (5), e0216563. doi: 10.1371/journal.pone.0216563
Musa H. D., Yacob M. R., Abdullah A. M. (2019). Delphi Exploration of Subjective Well-Being Indicators for Strategic Urban Planning Towards Sustainable Development in Malaysia. J. Urban Manage. 8 (1), 28–41. doi: 10.1016/j.jum.2018.08.001
Nasa P., Azoulay E., Khanna A. K., Jain R., Gupta S., Javeri Y. (2021). Expert Consensus Statements for the Management of COVID-19-Related Acute Respiratory Failure Using a Delphi Method. Crit. Care 25 (1), 1–17. doi: 10.1186/s13054-021-03491-y
Nikiema J., Mateo-Sagasta J., Asiedu Z., Saad D., Lamizana B. (2020). Water Pollution by Plastics and Microplastics: A Review of Technical Solutions From Source to Sea (Nairobi, Kenya: UNEP), 112 pp. ISBN No: 978-92-807-3820-9.
Novakowski N., Wellar B. (2008). Using the Delphi Technique in Normative Planning Research: Methodological Design Considerations. Environ. Plann. A: Econ. Space 40 (6), 1485–1500. doi: 10.1068/a39267
Parga Martínez K. B., Tekman M. B., Bergmann M. (2020). Temporal Trends in Marine Litter at Three Stations of the HAUSGARTEN Observatory in the Arctic Deep Sea. Front. Mar Sci. 7, 321. doi: 10.3389/fmars.2020.00321
Price J., Rushton A., Tyros V., Heneghan N. R. (2020). Consensus on the Exercise and Dosage Variables of an Exercise Training Programme for Chronic non-Specific Neck Pain: Protocol for an International E-Delphi Study. BMJ Open 10 (5), e037656. doi: 10.1136/bmjopen-2020-037656
Rezapour A., Foroughi Z., Sadeghi N. S., Faraji M., Mazdaki A., Asiabar A. S., et al. (2019). Identification of the Most Appropriate Variables for Measuring the Efficiency of Iranian Public Hospitals: Using Delphi Technique. J. Educ. Health Promotion 8 (1). doi: 10.4103/jehp.jehp_402_18
Riechers M., Fanini L., Apicella A., Galván C. B., Blondel E., Espiña B., et al. (2021). Plastics in Our Ocean as Transdisciplinary Challenge. Mar. Pollut. Bull. 164, 112051. doi: 10.1016/j.marpolbul.2021.112051
Santaguida P., Dolovich L., Oliver D., Lamarche L., Gilsing A., Griffith L. E., et al. (2018). Protocol for a Delphi Consensus Exercise to Identify a Core Set of Criteria for Selecting Health Related Outcome Measures (HROM) to be Used in Primary Health Care. BMC Family Pract. 19 (1). doi: 10.1186/s12875-018-0831-5
Santos O., Lopes E., Virgolino A., Stefanovska-Petkovska M., Dinis A., Ambrósio S., et al. (2018). Defining a Brief Intervention for the Promotion of Psychological Well-Being Among Unemployed Individuals Through Expert Consensus. Front. Psychiatry 9. doi: 10.3389/fpsyt.2018.00013
Schmaltz E., Melvin E. C., Zoie D., Gunady E. F., Rittschof D., Somarelli J. A., et al. (2020). Plastic Pollution Solutions: Emerging Technologies to Prevent and Collect Marine Plastic Pollution. Environ. Int. 144, 106067. doi: 10.1016/j.envint.2020.106067
Sekaran U., Bougie R. (2016). Research Methods for Business: A Skill-Building Approach. 7th ed (New York: John Wiley & Sons).
Shaw J., Kamphuis H., Sharpe L., Lebel S., Smith A.B., Hulbert-Williams N., et al. (2021). Setting an International Research Agenda for Fear of Cancer Recurrence: An Online Delphi Consensus Study. Front. Psychol. 12, 241. doi: 10.3389/fpsyg.2021.596682
Singh S., Kumar J., Rao P. V. M. (2018). Parameters for Environmental Impact Assessment of Product Packaging: A Delphi Study. J. Packag. Technol. Res. 2 (1), 3–15. doi: 10.1007/s41783-018-0027-4
Stewart D., Gibson-Smith K., MacLure K., Mair A., Alonso A., Codina C., et al. (2017). A Modified Delphi Study to Determine the Level of Consensus Across the European Union on the Structures, Processes and Desired Outcomes of the Management of Polypharmacy in Older People. PloS One 12 (11), e0188348. doi: 10.1371/journal.pone.0188348
Taylor E. (2020). We Agree, Don’t We? The Delphi Method for Health Environments Research. Health Environ Res. Design J. 13 (1), 11–23. doi: 10.1177/1937586719887709
Thiel M., Luna-Jorquera G., Álvarez-Varas R., Gallardo C., Hinojosa I. A., Luna N., et al. (2018). Impacts of Marine Plastic Pollution From Continental Coasts to Subtropical Gyres-Fish, Seabirds, and Other Vertebrates in the SE Pacific. Front. Mar Sci. 5, 238. doi: 10.3389/fmars.2018.00238
Torrecilla-Salinas C. J., De Troyer O., Escalona M. J., Mejías M. (2019). A Delphi-Based Expert Judgment Method Applied to the Validation of a Mature Agile Framework for Web Development Projects. Inf. Technol. Manage. 20 (1), 9–40. doi: 10.1007/s10799-018-0290-7
Van Der Linde H., Hofstad C. J., Van Limbeek J., Postema K., Geertzen J. H. B. (2005). Use of the Delphi Technique for Developing National Clinical Guidelines for Prescription of Lower-Limb Prostheses. J. Rehabil. Res. Dev. 42 (5), 693–704. doi: 10.1682/JRRD.2003.11.0172
Wagner S. A., Vogt S., Kabst R. (2016). The Future of Public Participation: Empirical Analysis From the Viewpoint of Policy-Makers. Technol. Forecasting Soc. Change 106, 65–73. doi: 10.1016/j.techfore.2016.02.010
Williams-Wynn M. D., Naidoo P. (2020). A Review of the Treatment Options for Marine Plastic Waste in South Africa. Mar Pollut Bull. 161 (Part B), 111785. doi: 10.1016/j.marpolbul.2020.111785
Keywords: marine litter, plastics, technology, Delphi method, consensus
Citation: Cunha MC, Marques J, Dias LC, Cotera IR and Triantaphyllidis G (2022) A Delphi Based Approach to the Assessment of New Marine Litter Reduction and Processing Technologies. Front. Mar. Sci. 9:886581. doi: 10.3389/fmars.2022.886581
Received: 28 February 2022; Accepted: 29 March 2022;
Published: 22 April 2022.
Edited by:
Carlos Gravato, University of Lisbon, PortugalReviewed by:
Marcus Geoffrey Haward, University of Tasmania, AustraliaCopyright © 2022 Cunha, Marques, Dias, Cotera and Triantaphyllidis. This is an open-access article distributed under the terms of the Creative Commons Attribution License (CC BY). The use, distribution or reproduction in other forums is permitted, provided the original author(s) and the copyright owner(s) are credited and that the original publication in this journal is cited, in accordance with accepted academic practice. No use, distribution or reproduction is permitted which does not comply with these terms.
*Correspondence: Maria C. Cunha, bWNjdW5oYUBkZWMudWMucHQ=
Disclaimer: All claims expressed in this article are solely those of the authors and do not necessarily represent those of their affiliated organizations, or those of the publisher, the editors and the reviewers. Any product that may be evaluated in this article or claim that may be made by its manufacturer is not guaranteed or endorsed by the publisher.
Research integrity at Frontiers
Learn more about the work of our research integrity team to safeguard the quality of each article we publish.