
94% of researchers rate our articles as excellent or good
Learn more about the work of our research integrity team to safeguard the quality of each article we publish.
Find out more
ORIGINAL RESEARCH article
Front. Mar. Sci., 05 September 2022
Sec. Coastal Ocean Processes
Volume 9 - 2022 | https://doi.org/10.3389/fmars.2022.883271
This article is part of the Research TopicMarine and Coastal Environments under Extreme StressView all 9 articles
 Christine M. Little1
 Gang Liu2,3
 Jacqueline L. De La Cour2,3
 C. Mark Eakin3,4
 Derek Manzello2
 Scott F. Heron1,5*
Over the past four decades, coral bleaching events have occurred with increasing frequency and severity, directly linked to increasing ocean temperature due to climate change. For the latter half of that period, satellite monitoring by NOAA Coral Reef Watch in near real-time has provided invaluable insight into bleaching risk. Here, we describe a novel application of those products to develop basin-scale tools for tracking the development of extreme heat events that enable monitoring of global coral bleaching events. Case studies of historical extreme events (1982-2018) across the three tropical ocean basins (Indian, Pacific and Atlantic) were analysed using this basin-scale approach to identify key thresholds of heat stress extent for the definition of global bleaching. Global-scale events are apparent when all three tropical basins experience heat stress in at least 10% of reef-containing locations. An 8-month ‘detection window’ was determined as the optimal period of time through which pixels exposed to heat stress should continue to be counted as part of a basin-scale event to account for seasonal variations across ocean basins. Understanding the broader context of basin-scale conditions can inform management of individual reefs, management networks and other reef stakeholders. Operationalising this product for near real-time delivery will provide an effective communication of the status of coral reefs around the world during an era of unprecedented climate threats.
Coral reefs are remarkable marine ecosystems that have great importance globally, both in ecological and economic terms (Heron et al., 2016a). In addition to providing habitat to vast numbers of marine species, coral reefs are natural barriers providing protection to coastlines and residing communities from erosion and weather damage. Furthermore, coral reefs are prime contributors to cultural, economic, and social facilities for these coastal societies (Heron et al., 2016a).
In recent decades, climate change has increased sea temperature, and consequently heat stress, on coral reef ecosystems around the world (Heron et al., 2016b). Heat stress events can lead to coral bleaching, the loss of endosymbiotic algae from coral tissues; severe heat stress can result in mass coral mortality (Glynn, 1993). Heat-induced coral bleaching events have increased in frequency and severity (Heron et al., 2016c; Hughes et al., 2018; Oliver et al., 2018), and have contributed to the degradation of reef ecosystems around the world (Souter et al., 2021).
Satellite monitoring of heat stress has provided managers with the ability to track the onset and development of events and thereby provide decision support to management. Based on satellite sea-surface temperature (SST) measurements, the operationally-supported product suite of the U.S. National Oceanic and Atmospheric Administration (NOAA) Coral Reef Watch (CRW) program is the only predictor of conditions linked to coral bleaching with global coverage. The Degree Heating Week (DHW) product is a measure of accumulated heat stress based on locally-specific thresholds (Liu et al., 2014; Heron et al., 2016c; Skirving et al., 2020). Ecologically-significant coral bleaching typically occurs when the DHW metric has reached values of 4°C-weeks or greater (Liu et al., 2014; Eakin et al., 2010; Skirving et al., 2019). The satellite monitoring product suite is currently published daily on a 0.05° (~5 km) resolution grid (coralreefwatch.noaa.gov; Skirving et al., 2020).
Global coral bleaching events (GCBE) have been recognised when reefs in all three tropical ocean basins have been impacted in a successive and overlapping fashion – in 1998, 2010 and the three-year period between 2014 and 2017 (Heron et al., 2016c; Eakin et al., 2019). These have each involved significant regional bleaching events, but such regional events have also occurred separate from global events; e.g., 2005 in the Caribbean Sea (Eakin et al., 2010). However, there are currently no criteria defined to classify basin-scale (and therefore global) events and so no capacity for monitoring of such events.
Here, we describe the development of a novel algorithm that analyses reef-containing pixels experiencing heat stress to identify basin-scale coral bleaching events. The key advancement is that the algorithm incorporates seasonal variations in onset timing in different within-basin regions enabling production of a near real-time tool to augment the current CRW product suite. This basin-scale approach is subsequently used to inform the definition of global bleaching events and is validated using historical broad-scale bleaching.
Two satellite DHW records were used to assess past extreme heat stress events in global reef locations: (i) NOAA CRW’s global 5-km satellite coral bleaching DHW product (version 3.1), derived from the CoralTemp version 3.1 dataset; and (ii) DHW derived from NOAA’s OISST version 2 global 25-km dataset. A reef locations dataset was obtained from NOAA CRW and partitioned into tropical ocean basins using international hydrographic definitions. The following subsections describe the DHW, ocean boundary and reef location datasets in detail.
The CoralTemp version 3.1 SST dataset spans from 1985 through to the present and is the concatenation of three related SST datasets (Skirving et al., 2020). The near real-time SST product on which the monitoring products are currently based from 2017 onward is the Geo-Polar Blended (GPB) SST dataset (Maturi et al., 2017), which (as the name suggests) combines temperature data from multiple geostationary- and polar-orbiting satellite platforms to maximise data density (and minimise data gaps). The GPB algorithm was retrospectively applied to produce a re-analysis dataset spanning the years 2002-2016. Prior to December 2002, the Operational SST and Ice Analysis (OSTIA, Roberts-Jones et al., 2012) reanalysis provides data back to 1985. OSTIA combines polar-orbiting satellite and in situ data but does not include geostationary satellite data. Notably, OSTIA reanalysis and near real-time (Donlon et al., 2012) are used to provide a bias-correction for the GPB data.
The daily global 5-km satellite coral bleaching DHW product is a measure of accumulated heat stress through the prior 12-week period (Figure 1). Daily heat stress is defined by CRW’s Coral Bleaching HotSpot metric. The HotSpot is a measure of unusually hot temperature, calculated as the amount by which the SST exceeds the locally-specific climatological maximum temperature – the Maximum Monthly Mean (MMM; Liu et al., 2014). The DHW is the integration through time of HotSpot values greater than or equal to 1°C. DHW values greater than or equal to 4°C-weeks have been linked to significant coral bleaching and some coral mortality. Values of 8°C-weeks or higher indicate that severe, widespread bleaching is likely and significant mortality can be expected (Liu et al., 2014; Skirving et al., 2019).
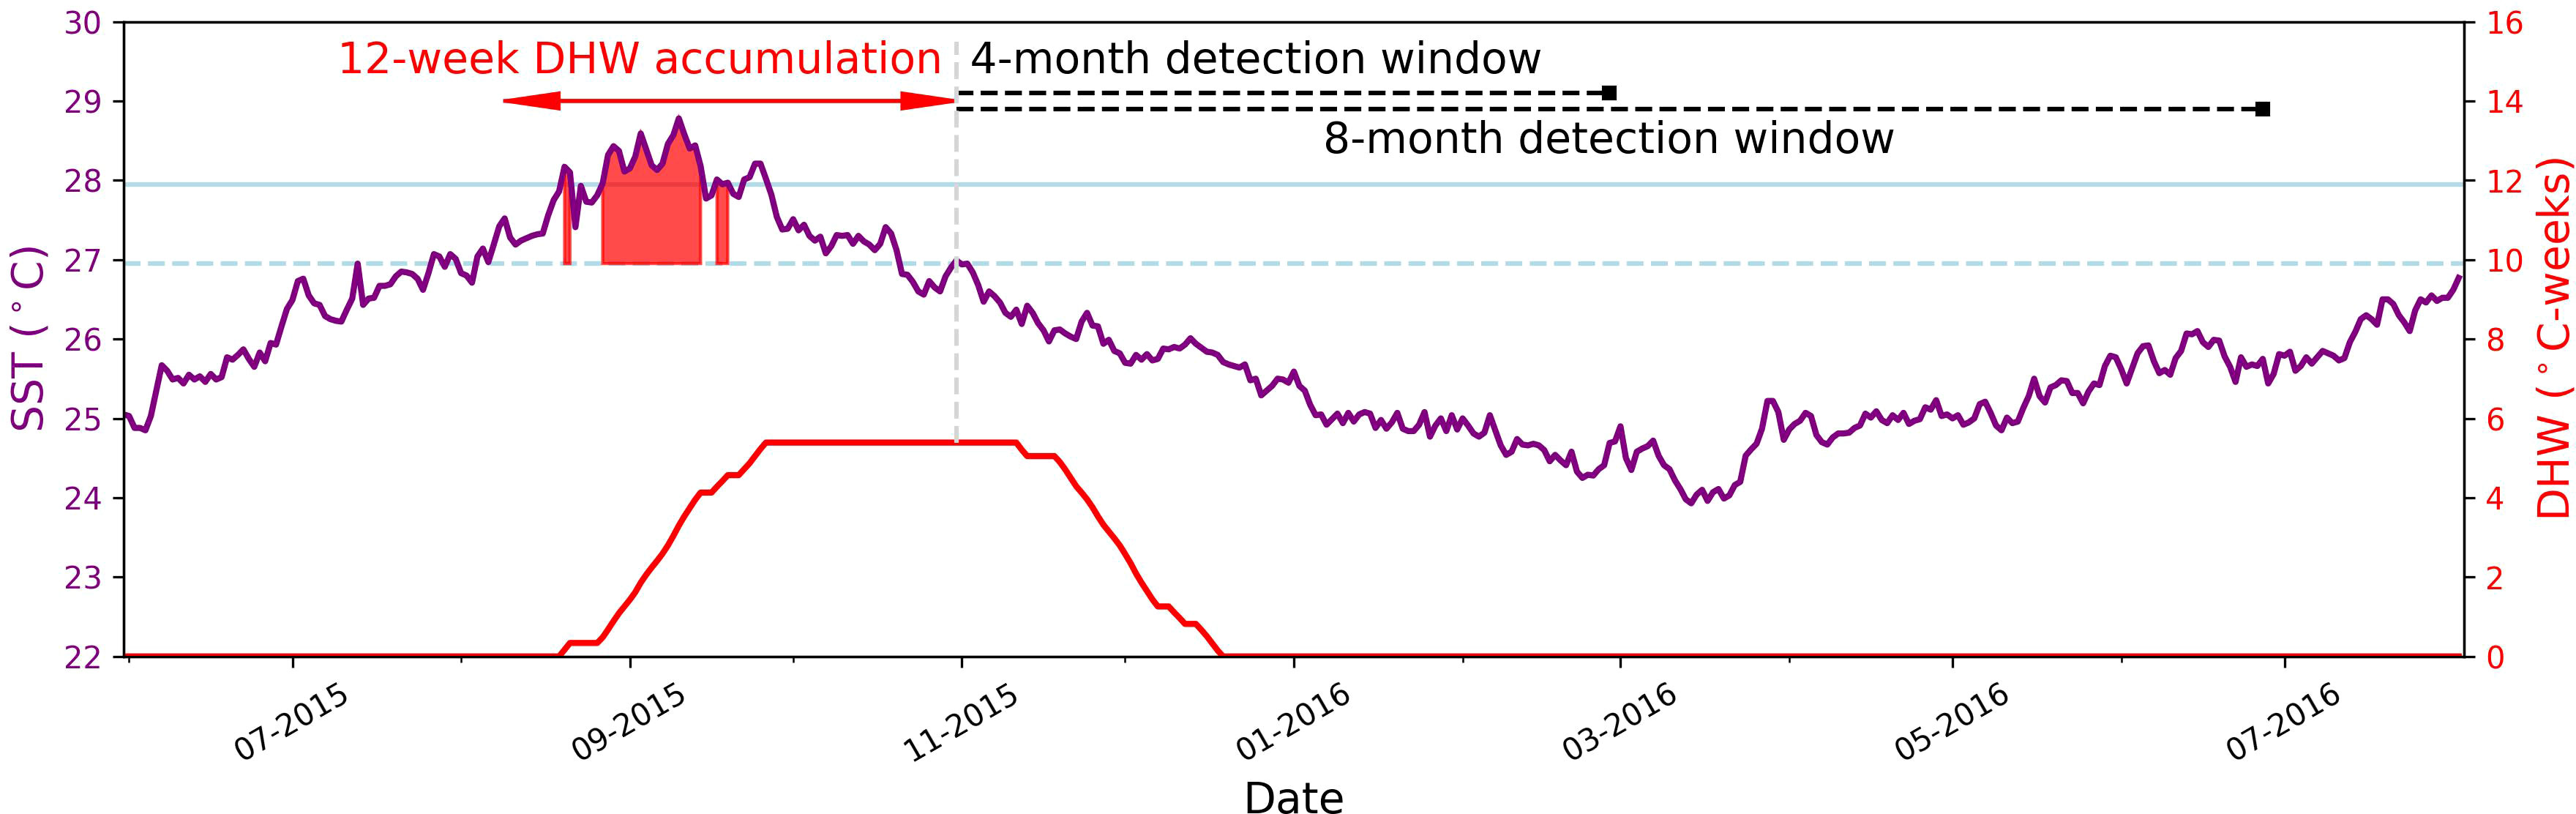
Figure 1 Sea-surface temperature (SST) time-series from the 5-km CoralTemp dataset for Lanikai on the north coast of Oahu, Hawaii (157.725°W, 21.375°N) for June 2015 to July 2016 (purple time-series). A Coral Bleaching HotSpot is a positive anomaly of SST above a locally-specific climatological maximum temperature – the Maximum Monthly Mean (MMM; light blue dashed line), apparent from late-July to October 2015. HotSpot values of 1°C or greater (i.e., SST at or above MMM+1°C, light blue line) within the 12 weeks prior (filled red polygons) are accumulated to give the Degree Heating Week (DHW; red time-series). The ‘detection window’ is defined here as a period of time through which pixels identified as having been exposed to heat stress should continue to be counted as part of a basin-scale event (shown for 4- and 8-month periods from 01 November 2015).
While published daily for near real-time monitoring and historical research applications, monthly maximum DHW values are also calculated and published within NOAA CRW’s Coral Bleaching Heat Stress product suite. It is the monthly-maximum composite DHW data for the period 1985-2018 that were employed in this analysis.
Coarser resolution (0.25°, ~25-km) gridded SST products are generated daily by NOAA from polar-orbiting satellite data and in situ data, using an optimal interpolation procedure (Reynolds et al., 2007). The OISST version 2 dataset was used to generate the MMM climatology and daily DHW spanning the period 1982-2018, following the 5-km methodology (Liu et al., 2014; Heron et al., 2015). As with the 5-km data, monthly maximum DHW values were calculated for this analysis. The earlier start date of the OISST dataset allows examination of the 1982-83 El Niño-Southern Oscillation (ENSO) event in which bleaching was observed (Glynn, 1984; Coffroth et al., 1990), as well as comparison of the two datasets for 1985-2018.
For each of the three tropical ocean basins, the basin boundary was classified using the definitions of the International Hydrographic Organization (IHO; Sieger, 2012). Basin boundaries were defined for the Indian, Pacific, and Atlantic oceans (Figure 2). The Mediterranean Sea is considered separately in the IHO definitions and was not included as part of this study due to the lack of reef-forming corals.
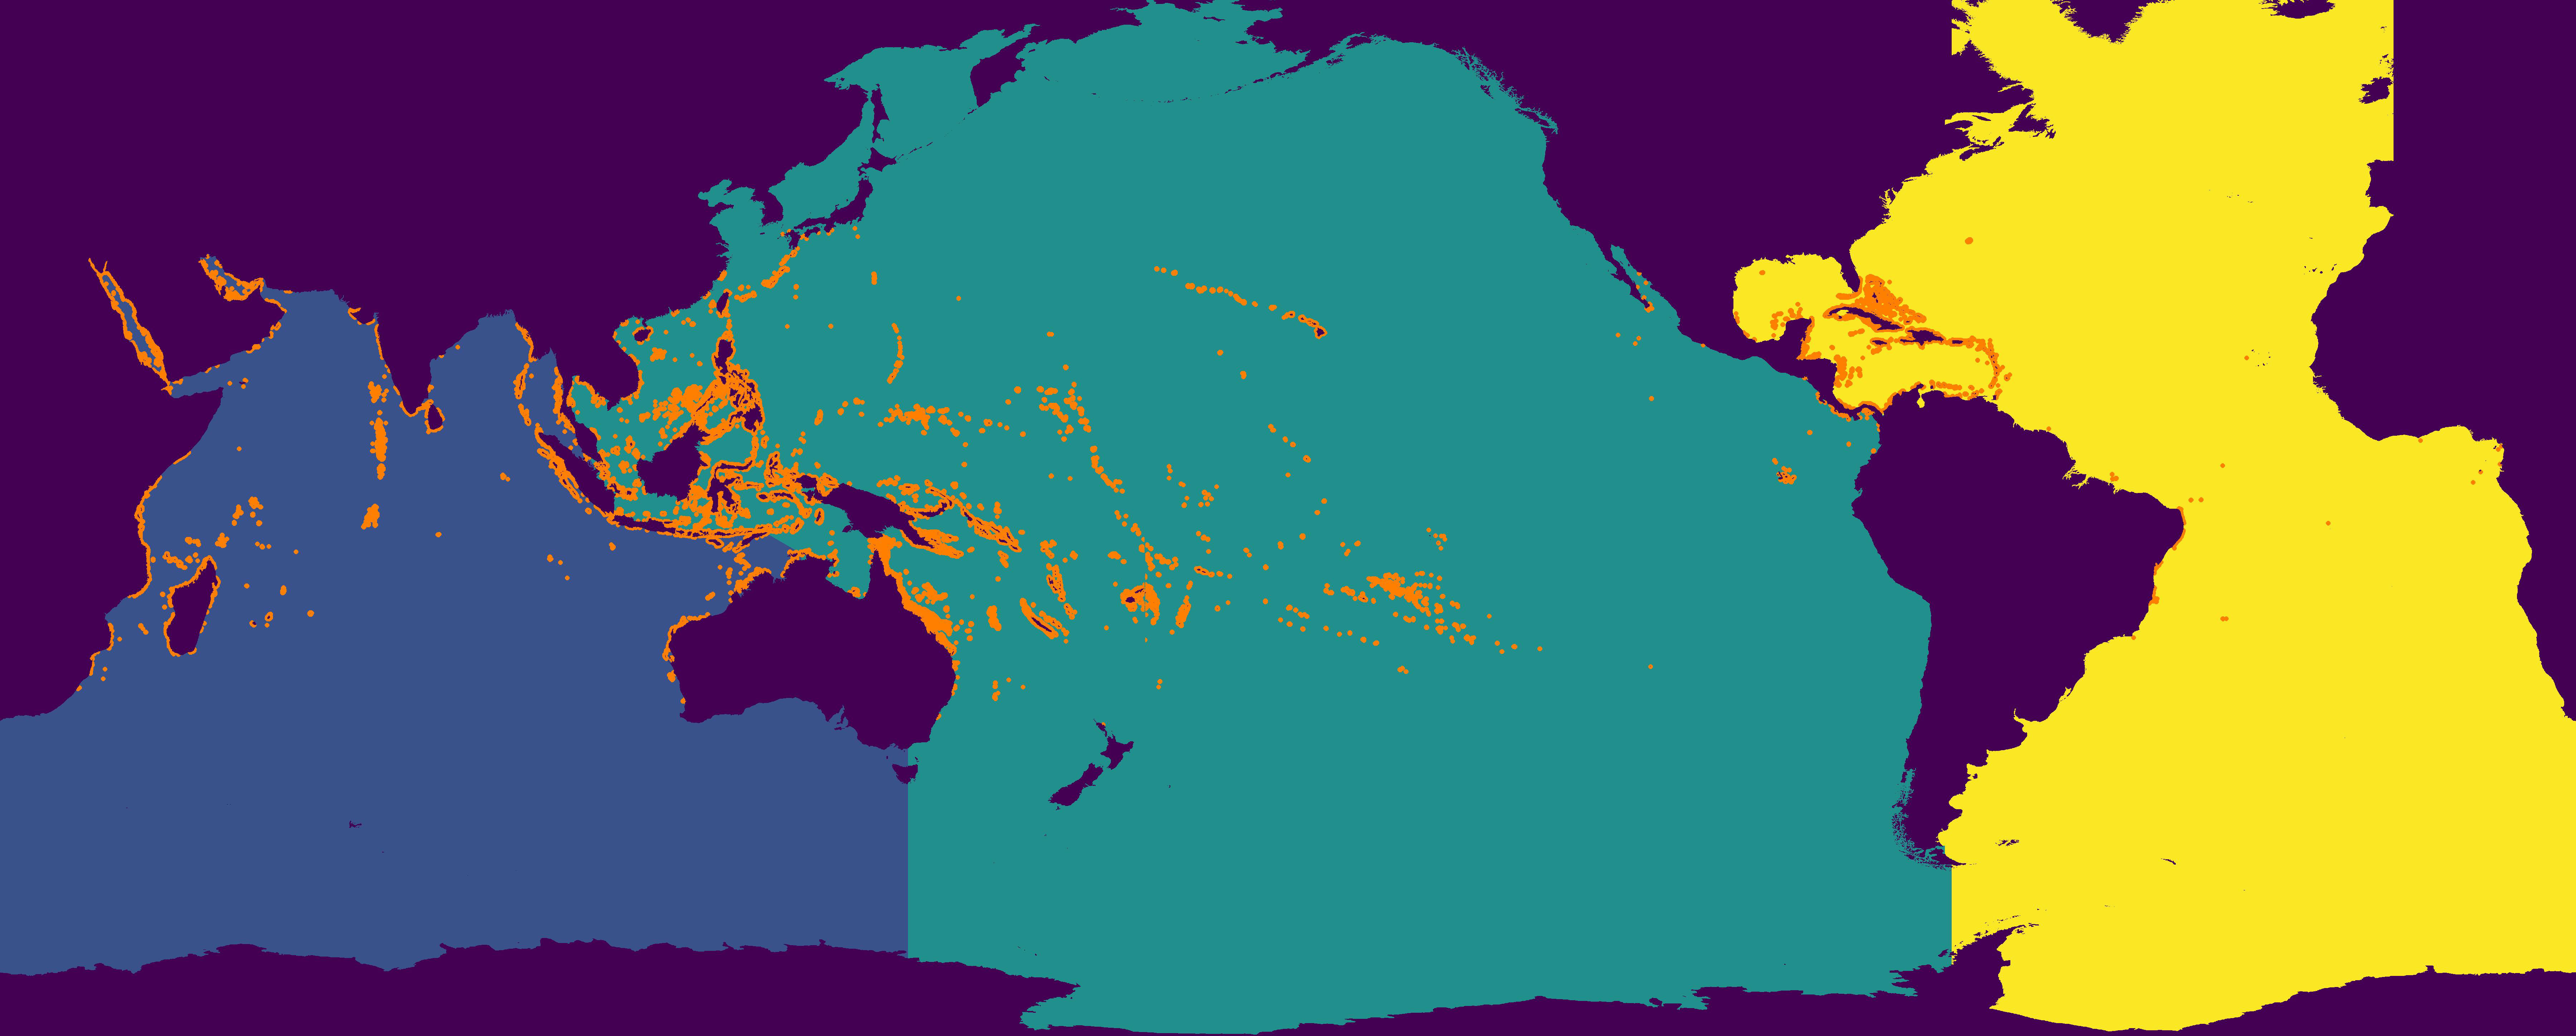
Figure 2 International Hydrographic Organization-defined ocean basin boundaries: Indian (blue); Pacific (green) and Atlantic (yellow). Coral reef areas are shown in orange (for the purpose of visualisation, ocean areas adjacent to reef-containing 5-km pixels are also coloured).
The western limit of the Indian Ocean is defined at 20°E from Cape Agulhas down to Antarctica, while the eastern boundary is at 146°55’E from the south of Tasmania to Antarctica (Sieger, 2012). At its northern extent, the Indian Ocean basin includes both the Red Sea and the Persian Gulf. Within Indonesia, the basin boundary is to the north of the Lesser Sundar Islands, which are included within the Indian Ocean basin. The boundary runs from the easternmost point of the island of Timor to the westernmost point of Garig Gunak Barlu National Park, Australia.
In Southeast Asia, the Pacific Ocean basin includes the Gulf of Thailand, Riau Archipelago, Java Sea, Flores Sea, Banda Sea and Arafura Sea. The southwest Pacific Ocean basin boundary is at 146°55’E, separating it from the Indian Ocean. The southeastern boundary is defined at 67°16’W from Tierra del Fuego south to Antarctica (Sieger, 2012). The northern extent of the Pacific basin is in Bering Strait, far beyond the northern extent of reef-building corals.
The southwestern boundary of the Atlantic basin is south from Tierra del Fuego at 67°16’W, shared with the Pacific basin boundary. In the southeast, the boundary is at 20°E separating the Atlantic Ocean from the Indian Ocean (Sieger, 2012). The Atlantic Ocean basin includes within its boundaries the Gulf of Mexico, and the Caribbean Sea.
Global coral reef locations were compiled by CRW from a variety of data sources (Heron et al., 2016b; Figure 2). Satellite-mapped reef locations, reef atlases and locations of survey observations were gridded at the 5-km resolution of the CRW data products (Heron et al., 2016b).
For the OISST dataset a corresponding 25-km reef locations dataset was created from the CRW 5-km dataset. Each 25-km pixel precisely overlaps twenty-five 5-km pixels. If any of the 5-km pixels was identified as a reef pixel, then the corresponding 25-km pixel was marked as a reef pixel.
The principal element in the development of the basin-scale (and therefore global) assessment for operational production is in linking seasonal timing of heat stress onset across basins within a single basin-scale event. This is undertaken by considering the definition of a period of time through which pixels identified as having been exposed to heat stress should continue to be counted as part of a basin-scale event – defined here as the ‘detection window’. Unless a reef-containing pixel experiences continuous or repeated extreme heat exposure, there is a time after which it should no longer be included in the basin count.
The definition of the detection window should be neither too short nor too long in assessing a basin-scale event. As heat-induced bleaching is a phenomenon occurring during the warmest times of year (thus seasonally in most locations), the detection window needs to be sufficiently long to include variations in onset timing across a basin (e.g., both austral and boreal summertime periods). However, the detection window also needs to be sufficiently short to avoid reef locations being counted as part of a basin-scale event beyond an appropriate post-stress time.
Consideration must also be given to the context of the DHW accumulation period when defining the length of the detection window. Within the 12-week period of accumulation of DHW, periods of heat stress through which accumulations reach the 4°C-week threshold are typically six weeks or more. The 12-week accumulation period of the DHW product may therefore inherently persist stress for potentially longer than it is actually apparent. For example, if a heat stress accumulation occurs within four weeks, the peak DHW value (at the end of those four weeks) will inherently persist for a further eight weeks after stress has abated (a total 12-week accumulation window). Setting the detection window to two months will therefore extend the inclusion of this pixel in a basin-scale event to approximately four months from the last HotSpot date (the inherent eight weeks within the DHW accumulation plus the defined two-month detection window). A demonstration of this is provided for Lanikai (Figure 1), where DHW accumulated over 38 days in August-September 2015. The peak DHW value (5.39°C-weeks) was still apparent in early November (two months of inherent stress persistence). As a result, detection windows of 4- and 8-months end closer to 6- and 10-months after the last HotSpot occurred.
Various durations of detection window were applied to the 5-km CoralTemp and 25-km OISST DHW datasets, ranging from zero to 18 months. The optimal detection windows for basin-scale and global bleaching events were selected by observing the output during past recorded regional and global bleaching events (in 1998, 2005, 2010 and 2014-2017).
Overlaying the gridded, IHO-defined ocean basin boundaries (Figure 2) and the 5- and 25-km reefs datasets enabled a count of reef-containing pixels within each ocean basin (Table 1). At 5-km resolution, approximately 23% of the world’s reef locations are in the Indian Ocean, 65% in the Pacific Ocean and 12% in the Atlantic Ocean.
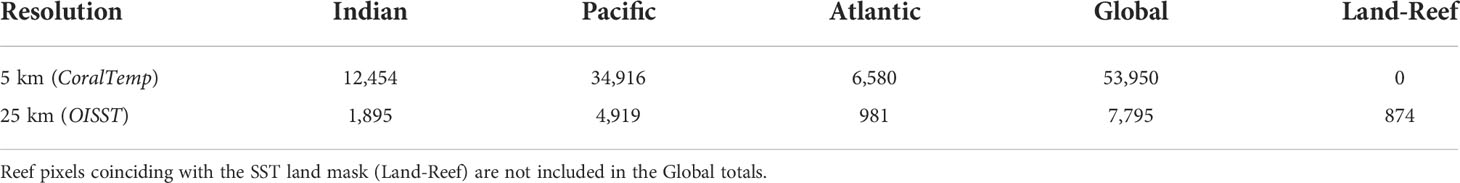
Table 1 Number of coral reef-containing pixels within each ocean basin boundary for the 5-km CoralTemp and 25-km OISST datasets.
For the 25-km gridded reef locations, there were a number of coastal reef pixels for which SST is not provided. These 874 pixels are masked as land in the OISST dataset (“Land-Reef” in Table 1) and could not be included in the analysis. Considering only the global reef-containing water pixels, the 25-km dataset has a very similar proportion of reef locations in each ocean basin to the 5-km dataset (24%, 63% and 13% in the Indian, Pacific and Atlantic basins, respectively).
Having examined historical extreme heat stress events using a wide-range of detection windows (0-18 months), outputs for 8-month and 4-month detection windows were selected for presentation here as being optimal for annual and seasonal assessments, respectively, of basin-scale (and therefore global) bleaching events. The selection of these periods also drew upon the variations in heat stress onset timing within each basin reported by Heron et al. (2016c). Whilst the ideal would be to examine observational data of the development of and recovery from bleaching in multiple locations during each GCBE, such data were infrequently recorded and are not available at the scale of ocean basins. As noted, the span of heat stress given by these detection windows is augmented by a further one to two months due to the inherent accumulation period of the DHW metric. This means the 8-month detection window includes heat stress accumulated within the prior ~10 months and reflects annual variations from both hemispheres. The 4-month detection window reflects seasonal patterns in heat stress from the prior ~6 months and is useful to examine variation in one (northern or southern) hemisphere.
The 8-month detection window illustrates periods of broad-scale heat stress across each of the three tropical ocean basins (Figure 3). Each of the three documented global-scale extreme events are apparent, as is the 2005 Caribbean bleaching (in the Atlantic). Based on exposures during the known global events (1998, 2010 and 2014-17), the percentage of reef pixels defining a basin-scale coral bleaching event was set at 10% (dashed horizontal line) as this was the basin-specific threshold consistent with the first documented global-scale extreme event (in 1998; Wilkinson, 2002). A global coral bleaching event is identified when all three tropical ocean basins (each accounting for the detection window) reach or exceed this percentage (orange bars in Figure 3). A global bleaching warning is defined when only two ocean basins have this level of exposure (yellow bars in Figure 3).
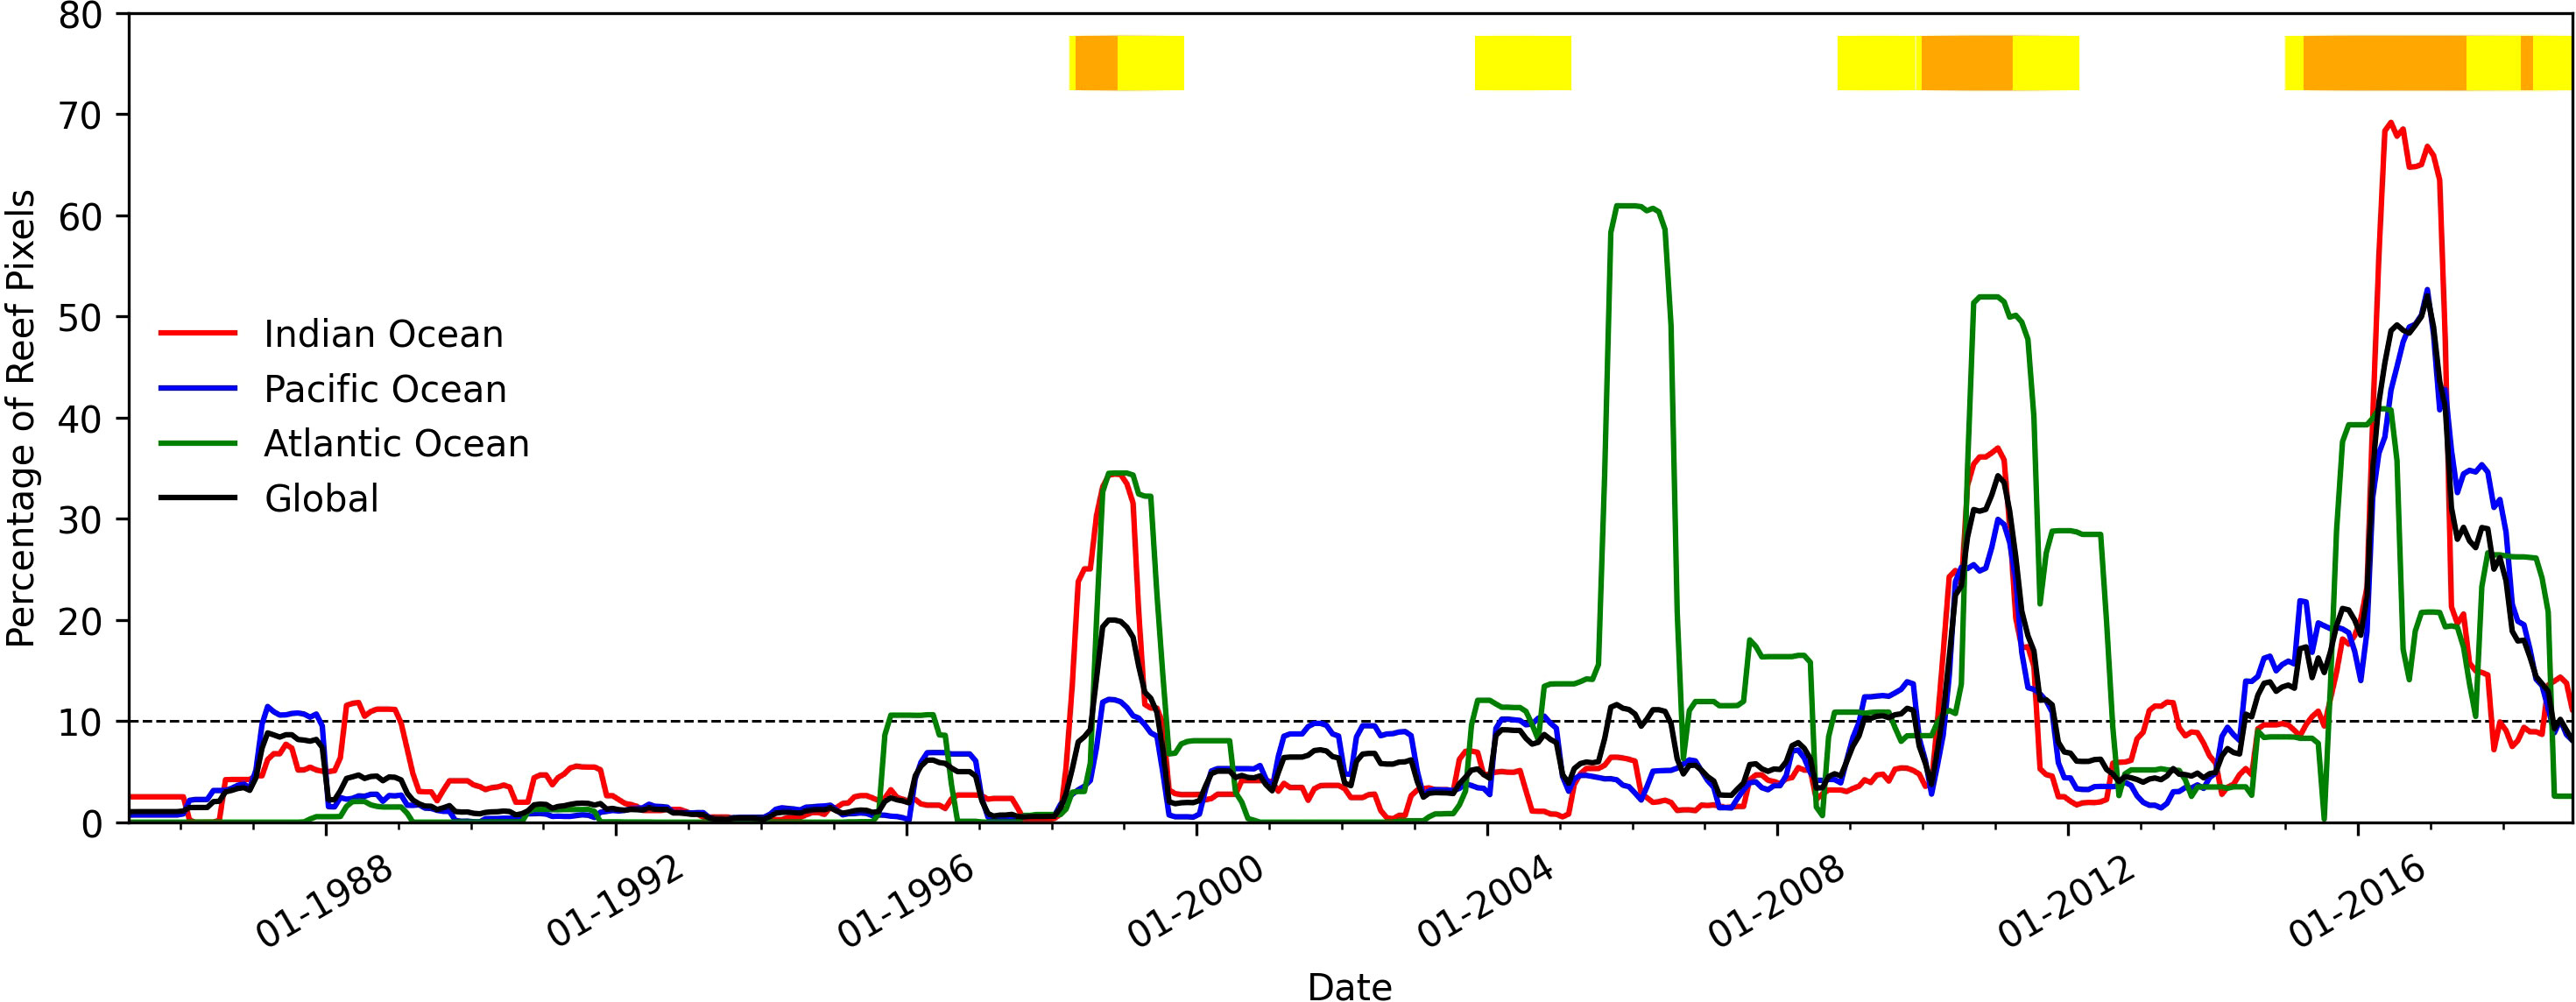
Figure 3 Percentage of reef pixels above or equal to the DHW threshold of 4°C-weeks from 1985 to 2018 using an 8-month detection window obtained from the 5-km CoralTemp dataset. The yellow bars at the top of the figure indicate that at least 10% of reef pixels in two of the three tropical ocean basins have recently been exposed to heat stress; orange bars indicate that the extent of heat stress is at or above 10% of reef pixels in all three tropical ocean basins, signifying a global coral bleaching event.
While the timings of seasonal variations across northern and southern hemispheres within an ocean basin are somewhat apparent in the 8-month detection window (Figure 3), these are seen more clearly by considering the 4-month detection window (Figure 4). This is especially apparent for the Indian Ocean which has a greater number of reef locations in the southern hemisphere than in the northern hemisphere (that are predominantly in the Red Sea and the Persian Gulf). The climatologically warmest months for this ocean basin span from January through to October (Heron et al., 2016c), which is directly associated with the variation in timing of potential heat stress events across the basin. Detection of seasonal variations is demonstrated using the 4-month detection window for the year 1987 that shows two distinct peaks in the Indian Ocean (red line in Figure 4), corresponding with locations in the northern and southern hemispheres; in contrast, the 8-month detection window has a single peak in the observed percentage of reef pixels with heat stress (Figure 3). In the Atlantic basin, the great majority of reef locations are in the northern hemisphere. Because of this, there is little difference between the 4- and 8-month detection window outputs in the maximum extent of reef pixels stressed, only in the width of the peaks. The value of the seasonal analysis appears to be lower for the Pacific Ocean than the other basins as it has reef locations spread across northern and southern hemispheres and across the equatorial regions. Each of the three global events were identified in the 4-month analysis (orange bars in Figure 4), though the 2014-17 event was not continuous, reflecting the seasonal time-scale for this shorter detection window.
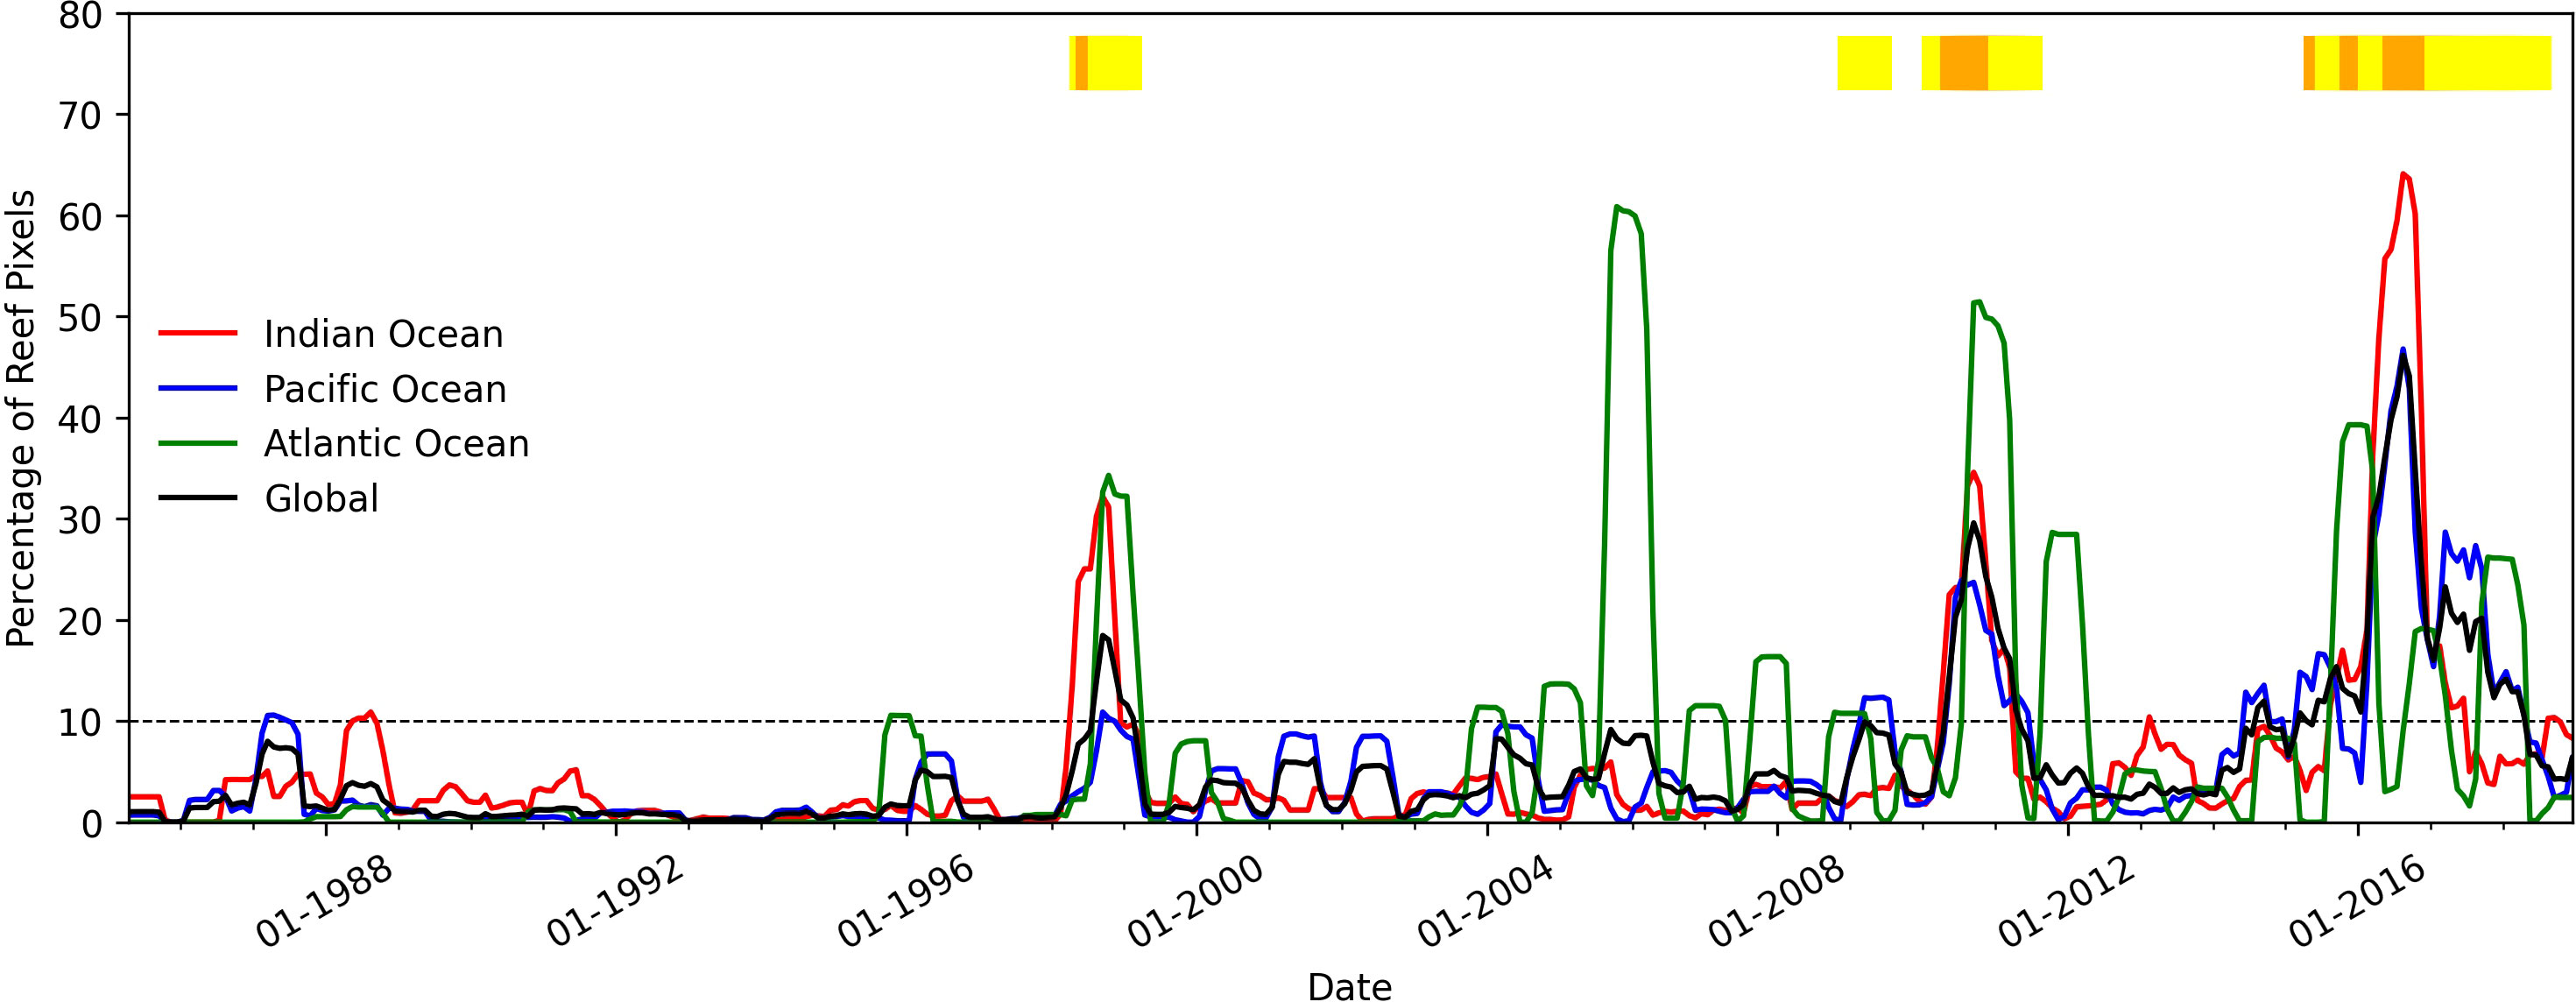
Figure 4 As for Figure 3 using a 4-month detection window applied to the 5-km CoralTemp dataset for the period 1985-2018.
Repeating the analyses using the 25-km OISST data revealed variations in the extent of reef pixels exposed to stress compared with the 5-km CoralTemp analysis. Using an 8-month detection window, maximum percentages of stressed reef pixels during the peak of the 2010 and 2014-17 global events and the 2005 Caribbean event were similar between the two datasets (Figures 3, 5). However, for the 1998 event, the extent of stressed reef pixels in the 25-km OISST analysis (Figure 5) was considerably greater in all three basins than in the 5-km CoralTemp analysis (Figure 3). Furthermore, between these major extreme events, the extent of stressed reefs indicated by the 25-km data is considerably higher in all three basins than in the 5-km analysis. This is reflected in the near-continuous period from 1998 onward for which at least two basins have 10% of reef pixels with recent stress (yellow or orange bar in Figure 5) and in the appearance of new ‘global’ events (orange bar) in which extreme events occur in all three basins.
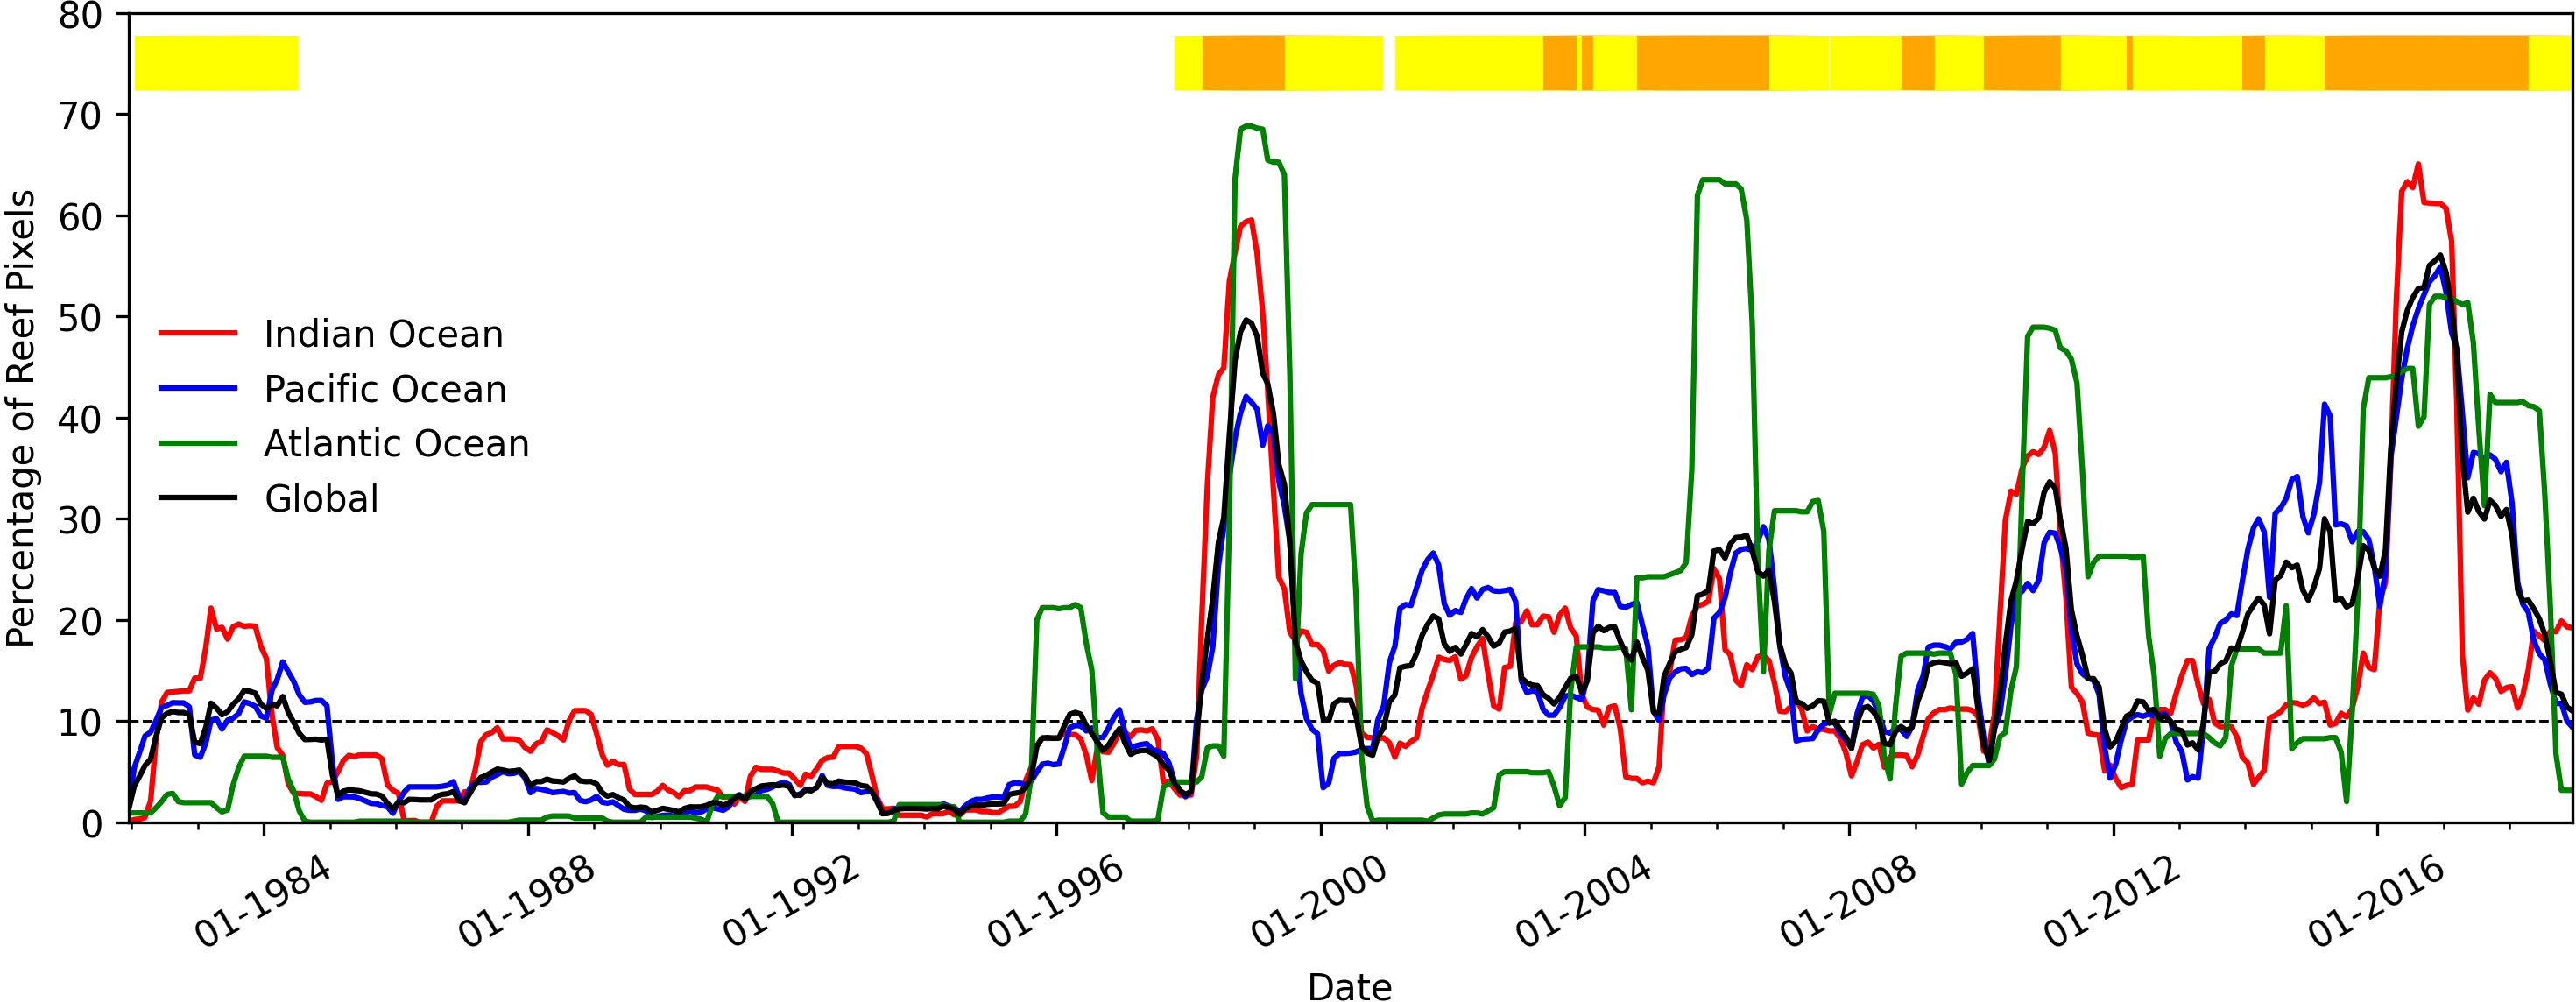
Figure 5 As for Figure 3 using an 8-month detection window applied to the 25-km OISST dataset for the period 1981-2018.
Based on this, it is apparent that a different extent threshold may be required for the OISST-based analysis (from that of the CoralTemp-based analysis); considering the three reported global bleaching events, using a threshold of 25% of reef pixels would identify only these documented global events.
The 25-km OISST analysis for the 1982-1984 period indicates that events with more than 10% of reef pixels recently stressed occurred within the Pacific and Indian Ocean basins, coinciding with a global bleaching warning (yellow bar in Figure 5). While some heat stress was apparent in the Atlantic basin in late-1983, it was not of basin-scale extent. However, none of the three basins experienced heat stress extent using the higher extent threshold (25%).
Consistent with the 5-km analysis, the 25-km 4-month detection window (not shown) had narrower peaks and more-pronounced seasonal variations than the 8-month analysis.
In both 5-km CoralTemp and 25-km OISST datasets (with an 8-month detection window) there is an overall increase in the baseline percentage of reef pixels through time in which higher extents of stressed reef pixels become evident, occurring over longer periods (Figures 3, 5; also evident in Figure 4 using the 4-month detection window). In the early years of the analysis (1985-1997), the basin extent dropped to values close to zero between periods of extreme heat stress; however, in later years (since 1998) the percentages seldom returned to zero – heat stress was apparent every year, and with a generally increasing extent, in each of the basins.
The selection of an 8-month detection window for annual assessments of basin-scale (and therefore global) bleaching events was based on the balance between the need to be long enough to include within-basin variation in the timing of heat stress (which can be six months apart), but also sufficiently short so that reef pixels remain part of an event for only an appropriate post-stress time. In addition, it was determined that a 4-month detection window was useful to consider seasonal basin-scale events.
Using the 8-month detection window for the 5-km CoralTemp dataset, basin-scale events were defined when 10% or more reef-containing pixels within a basin were recently stressed; i.e., at or above the DHW threshold of 4°C-weeks. A global coral bleaching event occurred when basin-scale events were apparent in each of the three tropical ocean basins (Indian, Pacific and Atlantic). This extent threshold is similar to the 12% extent described by Skirving et al. (2019), with the difference attributed to differences in the methodology. In that study, distinct 12-month periods were defined separately for southern (Aug-Jul, peak of stress extent in February) and northern (Feb-Jan, peak of stress extent in August) hemispheres. These were combined to indicate annual extents. However, this fixed-periods approach can include double-counting of individual heat stress events across adjoining 12-month periods (e.g., a northern hemisphere event that reaches a DHW of 4°C-weeks in December or January, for which the DHW value persists into February, would be counted in both years). This would be most apparent in equatorial regions. Here, the use of the ‘detection window’ overcomes this issue ensuring individual heat stress events are included once in a continuous, rolling-window assessment. Furthermore, the new approach is a single method applied consistently across global locations, rather than having distinct rules for each hemisphere. The use of the IHO-defined basin boundaries may have also contributed, in small part, to the slightly lower extent threshold determined here (10% of reef-containing pixels).
The use of coloured bars (top of Figure 3) to indicate periods of global bleaching warning (yellow bar, 2 of 3 tropical basins above the 10% extent threshold) and global bleaching event (orange bar, all three basins affected) provides a simple and direct communication tool for the current (and historical) status of broad-scale extreme heat events. This provides context for reef managers and other stakeholders in understanding the potential risk of bleaching for their locations of interest and points to the value of regular reference to the satellite monitoring products during their locally-specific bleaching season.
The utility of the definition of basin-scale (and thus global) events is investigated using historical extreme heat stress events identified using an 8-month detection window applied to the 5-km CoralTemp dataset. Four periods of trans-basin heat stress occurred during the 1985-2018 time-series (orange and yellow bars in Figure 3). Three of these trans-basin heat stress periods correspond with the recognised global bleaching events of 1998, 2010 and the multi-year event of 2014-17. The fourth coincides with the 2005 regional event in the Atlantic Ocean.
For each of the global events, a four-year subset of the 5-km CoralTemp timeseries of heat stress extent was used to highlight key observations (Figure 6). The first global coral bleaching event (GCBE1) spanned the period September 1998 to March 1999. In early 1998, heat stress began to develop in the Indian Ocean and exceeded 10% extent during April (Figure 6A). Following this, a rapid increase in heat stress extent within the Atlantic basin from July to August, during the northern hemisphere summer, triggered a global bleaching warning (Table 2). The Pacific basin eclipsed the extent threshold in September to define the global event. The period through which all three basins had experienced recent heat stress spanned September 1998 to March 1999 (Table 2). The peak in global extent of heat stress occurred in October and November, each with 10,781 reef pixels (20% of global locations) recently affected by heat stress. This is comparable with an estimated global coral mortality of 16% during this event (Wilkinson, 2002).
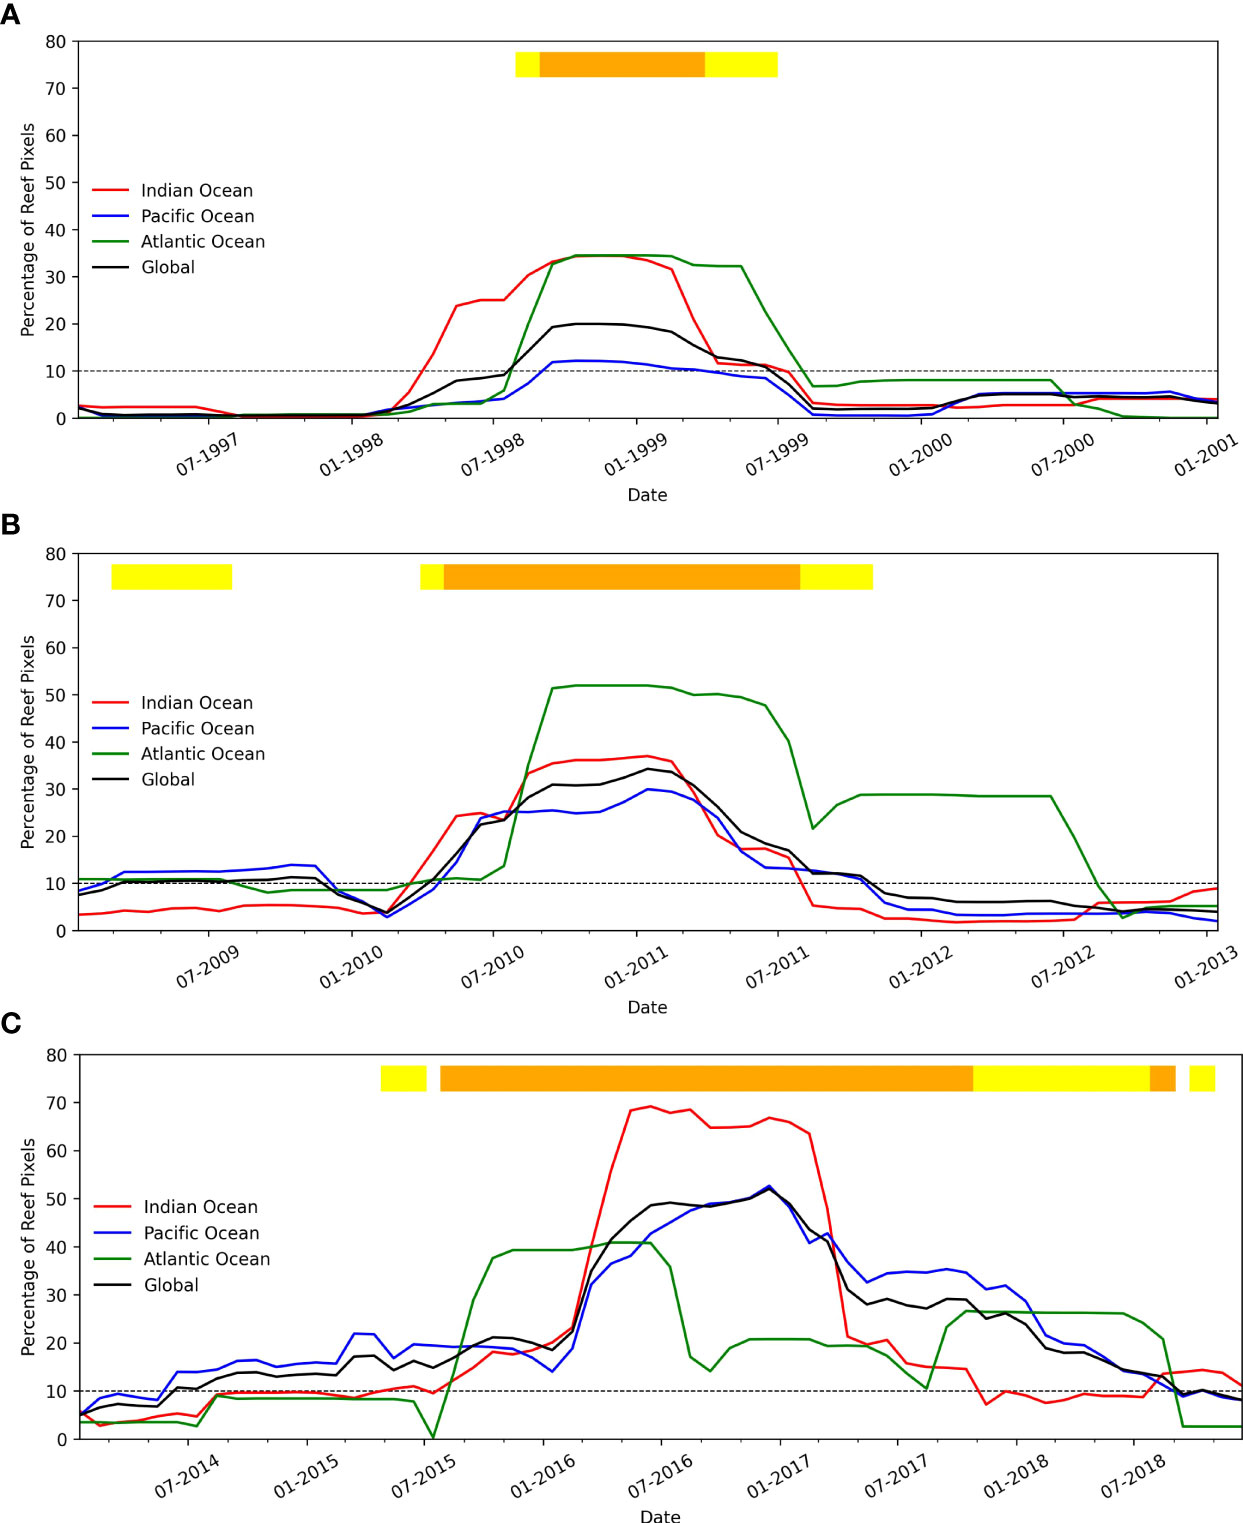
Figure 6 As for Figure 3 using an 8-month detection window applied to the 5-km CoralTemp dataset for the periods encompassing (A) the first global coral bleaching event (GCBE1) in 1998; (B) GCBE2 in 2010; and (C) GCBE3 in 2014-17.
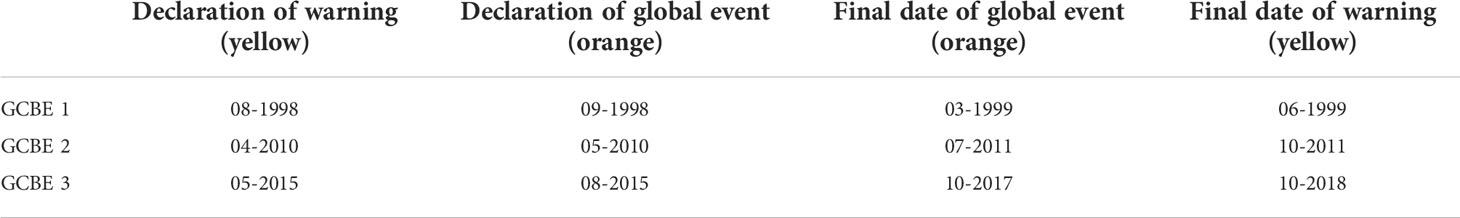
Table 2 Dates for declaration of global coral bleaching warning (yellow bars in Figure 3) and event (orange bars in Figure 3) using the 8-month detection window applied to the 5-km CoralTemp dataset for each Global Coral Bleaching Event.
Mapping the composite DHW from the GCBE1 period reveals the regions affected (Figure 7A-left panel). Severe heat stress was apparent in the north of the Caribbean Sea and south of the Gulf of Mexico contributing to the Atlantic basin extent. In the Pacific basin, severe heat stress occurred in the East and South China Seas, while in the Indian Ocean was mainly on the coast of Western Australia, the east coast of Africa and in the Persian Gulf and Red Sea.
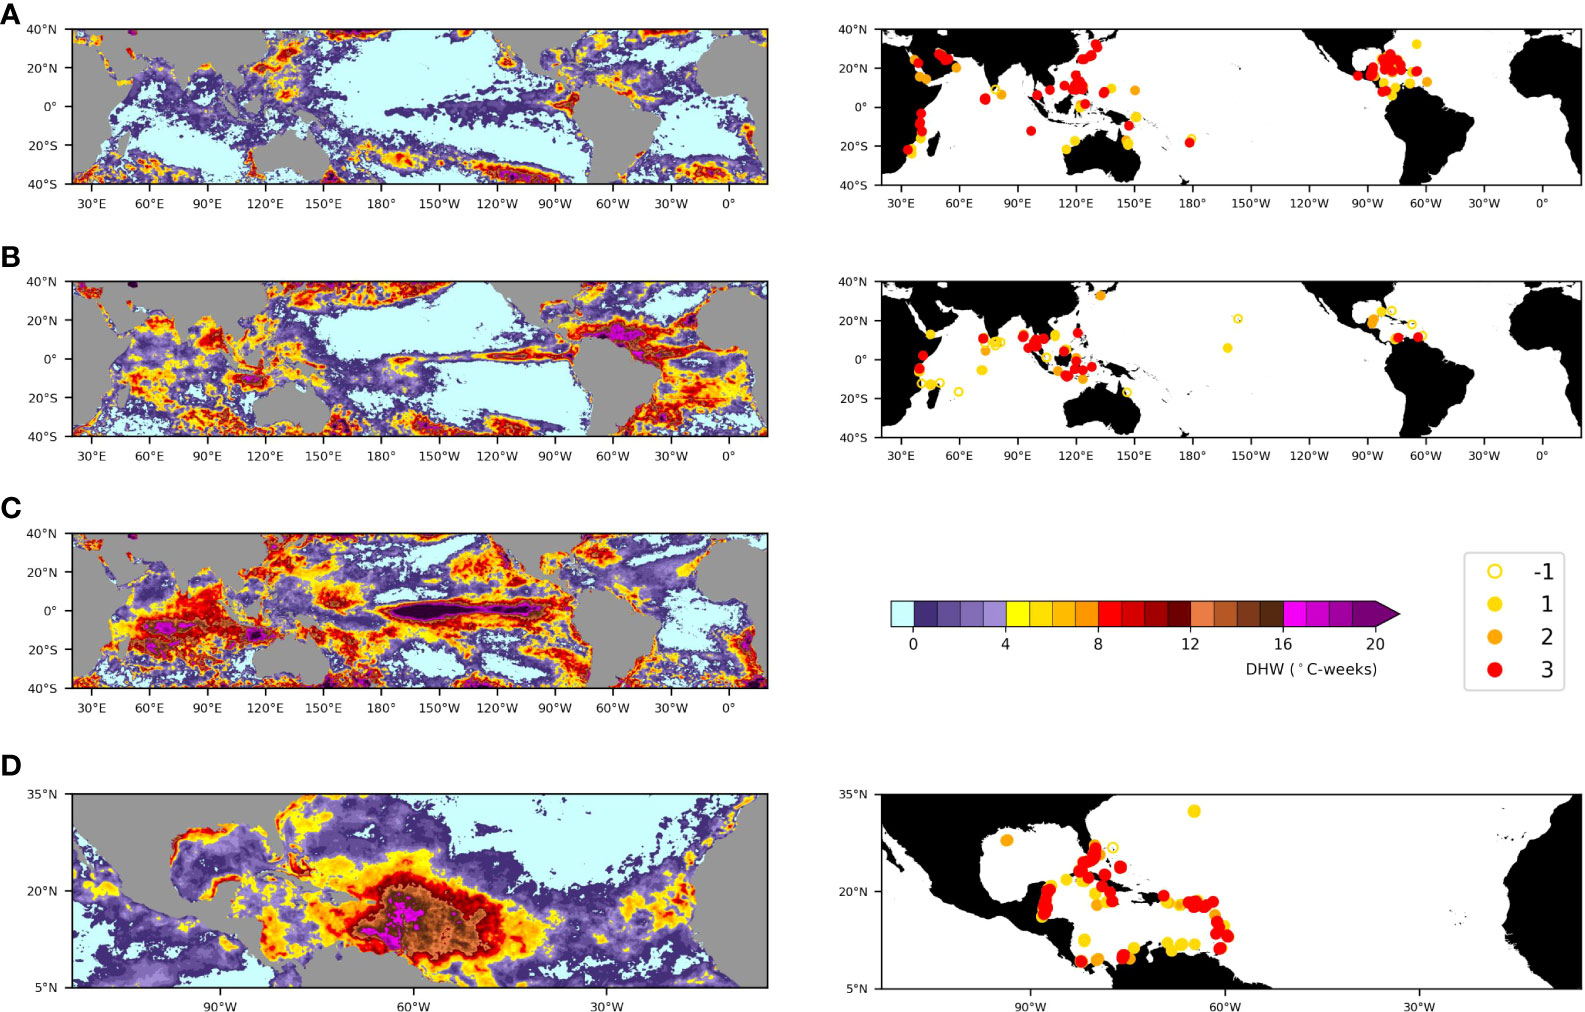
Figure 7 Charts of 5-km CoralTemp maximum DHW (left panels, colourbar in °C-weeks) and bleaching observations (right panels) around the globe (A) from the first global coral bleaching event GCBE1 – August 1998 to April 1999, (B) during GCBE2 – April to December 2010, (C) during GCBE3 – January to September 2016 and (D) spanning the Caribbean regional bleaching event – June to October 2005. The legend indicates bleaching severity codes of Donner et al. (2017) – 3:severe (>50%); 2:moderate (11-50%); 1:mild (1-10%); -1:unknown extent.
A corresponding global map of coral bleaching observations was developed using data from a historical coral bleaching database (Donner et al., 2017). In this database observations date from 1963 to 2011 with severity categories defined by observed local bleaching extent. Category 3 (‘severe’) indicates greater than 50% bleaching, category 2 (‘moderate’) represents 11-50% bleaching and category 1 (‘mild’) reflects 1-10% bleaching, while category “-1” indicates bleaching was observed but that the extent is unknown (Donner et al., 2017). Only observations that included the month of survey, which was within the detection window, are shown. Observations from the GCBE1 period are consistent with the pattern of heat stress during the extreme event (Figure 7A-right panel).
Twelve years after the first global event, the second global coral bleaching event (GCBE2) occurred in 2010. In April 2010, the extent of heat stress in both the Indian and Atlantic basins eclipsed the 10% threshold (Figure 6B) triggering the global bleaching warning (Table 2). The (relatively) earlier declaration in the Atlantic, compared with GCBE1, was driven by heat stress accumulation along the Brazilian coast (Figure 7B-left panel). The declaration of the global event occurred when heat stress extent in the Pacific basin exceeded 10% in May 2010. Heat stress expanded in each of the tropical basins during the second half of 2010, with the peak global extent of recent heat stress (18,477 pixels, 34.2%) occurring in January 2011 (Figure 6B). Over 50% of reef pixels in the Atlantic basin had experienced heat stress in this event by October 2010, corresponding with broad-scale bleaching and subsequent impacts from disease (Muñiz-Castillo et al., 2019). Compared with GCBE1, the extent of heat stress during the second global coral bleaching event was greater and spanned a longer period starting from May 2010 to July 2011 (Table 2).
The composite DHW map for GCBE2 illustrates the greater extent and also intensity of heat stress, compared with the first global event (Figure 7B-left panel). Large proportions of the Caribbean Sea, Southeast Asia and the Indian Ocean were exposed to heat stress. Observations of severe bleaching were recorded in the Andaman Sea (Indian Ocean) and the Java, Flores and Banda Seas (Pacific basin; Figure 7B-right panel). GCBE2 had many observations of unknown bleaching extent (category -1), particularly in the Caribbean and western Indian Ocean.
Four years later the third global coral bleaching event (GCBE3) began with basin-scale heat stress first apparent in the Pacific basin from June 2014 (Figure 6C). The extent of Pacific heat stress (with the 8-month detection window) remained above the 10% threshold until August 2018, with repeated cycles of heat stress in the northern and southern hemispheres. Some of the highest recorded DHW values, greater than 25°C-weeks, occurred in the central Pacific Ocean during this period (Eakin et al., 2017). In late-2014, the heat stress extent in both the Indian and Atlantic basins reached a level just below the 10% threshold (Figure 6C). In May and June 2015, basin-scale heat stress was apparent in the Indian Ocean (briefly triggering a global bleaching warning), subsiding in July before returning in August and persisting until November 2017. August 2015 also saw the start of the basin-scale event in the Atlantic, which remained above the 10% threshold until September 2018. These basin-scale events triggered the declaration of GCBE3 in August 2015, which continued until October 2017 (Table 2). The peak extent of recent heat stress occurred in December 2016, affecting 52% of global reefs (28,071 reef pixels). Basin-scale peak extents for the Indian, Pacific and Atlantic were 69% (8,616 pixels, June 2016), 53% (18,384 pixels, December 2016) and 41% (2,689 pixels, April & May 2016). Cumulatively, 66% of global reefs (35,772 pixels) were exposed to heat stress at some point during GCBE3 and many of these experienced repeated exposure (cf. Eakin et al., 2019). Overall, the extent and duration of the third global event were the greatest within the period analysed (Figure 6C and Table 2).
Heat stress during GCBE3 is illustrated using the maximum DHW for the period January-September 2016. Vast areas of heat stress are apparent, consistent with the calculated proportion of reef pixels affected (Figure 7C). Observed bleaching for this event was not included within the Donner et al. (2017) dataset; however, myriad regional bleaching observations coincide with the spatial patterns in heat stress, including from the Persian Gulf, the remote central Indian Ocean, Western Australia, the Great Barrier Reef, Hawaii, the central equatorial Pacific and the greater Caribbean region (Couch et al., 2017; Hughes et al., 2017; Hughes et al., 2018; Burt et al., 2019; Fox et al., 2019; Gilmour et al., 2019; Head et al., 2019; Johnston et al., 2019; Teixeira et al., 2019). Bleaching observations from GCBE3 are currently being compiled for publication (Eakin et al. in prep.).
A regional case study of the Caribbean in 2005 using a 4-month detection window showcases the seasonal variation (Figure 8). Seasonal heat stress was apparent at over 10% of Atlantic reef pixels from August 2005 to April 2006 (including the 4-month detection window). The extent of recent heat stress in the Atlantic basin peaked in October 2005 with 61% (4,004) of reef pixels affected. Maximum DHW from June to October 2005 shows widespread and severe heat stress across the region (Figure 7D-left panel). Observed bleaching was similarly widespread (Figure 7D-right panel) and coral mortality exceeded 50% at several locations (Eakin et al., 2010).
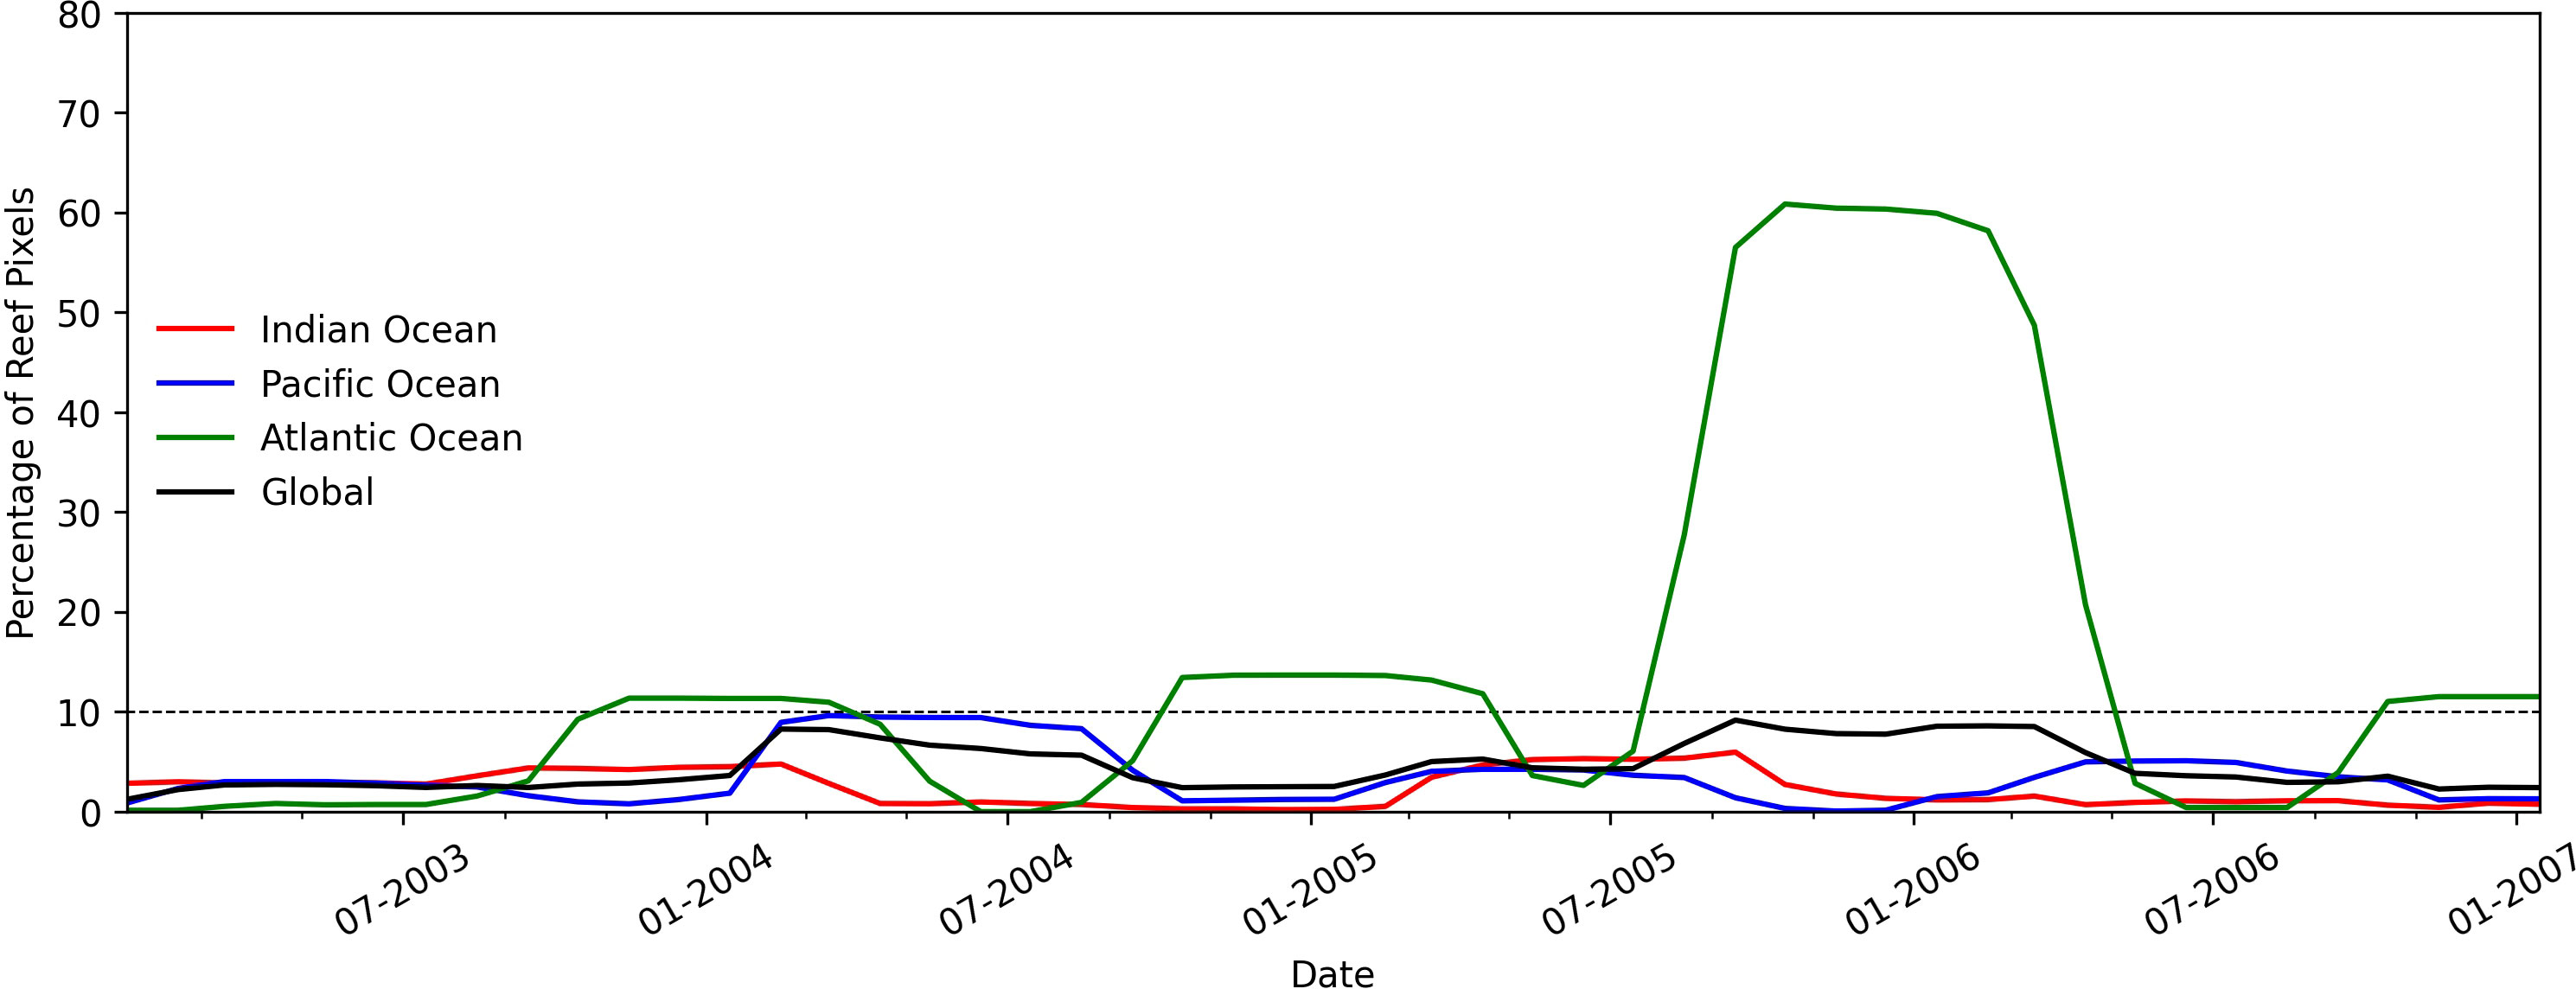
Figure 8 Percentage of reef pixels above or equal to the DHW threshold of 4°C-week from 2003 to 2007 with a four-month detection window showcasing the 2005 Caribbean Regional Bleaching Event.
Based on these four case studies, it is apparent that the detection window methodology has merit in monitoring basin-scale and global bleaching events. The declaration and duration of broad-scale events are consistent with observed bleaching, within individual basins and from a global perspective. This is certainly related to the performance of the CRW satellite products in monitoring heat stress linked to coral bleaching.
It is worth noting that heat stress doesn’t necessarily imply bleaching at all reef locations within each ocean basin. Light is a critical component in the disruption of the photochemical system that leads to coral bleaching (Skirving et al., 2018). As such, bleaching may not occur under low light conditions despite anomalously-high temperatures (e.g., Mumby et al., 2001). Bleaching has been observed in specific events at heat stress levels lower than the standard threshold (4°C-weeks) applied here (e.g., Hughes et al., 2017), which may be associated with event-specific conditions of light and other parameters (e.g., turbidity).
Comparisons of monthly global extent of heat stress from the CoralTemp and OISST datasets for 1985-2018 indicate distinct relationships for the period up to 2002 and from 2003 onward (Figure 9). While both periods demonstrate a good correlation (r2 = 0.763 and 0.842, respectively; Table 3), the ranges of extent values from the datasets are vastly different in the earlier period (CoralTemp 0-20% cf. OISST 0-50%; Figure 9A) but similar in the later period (0-60% for both; Figure 9B). This difference is also apparent in the regression slopes that differ three-fold (0.335 and 0.997 for the earlier and later periods, respectively; Table 3). In the earlier period, each of the SST datasets (CoralTemp and OISST) was derived principally using AVHRR source data and they demonstrate a high degree of overall correlation (Reynolds and Chelton, 2010; Donlon et al., 2012; Banzon et al., 2016). However, large differences have also been observed near the coast and in regions with strong gradients (Reynolds and Chelton, 2010), descriptions that are characteristic of coral reef locations. The analysis presented here for the period up to 2002 indicates that extreme temperature events at coral reef locations are not consistently reported by the two datasets. We note that the distinction between the two time periods coincides with the change of source dataset (from OSTIA to GPB) within the 5-km CoralTemp product (Skirving et al., 2020). As there cannot be certainty regarding which dataset is more reliable in the earlier period, caution should be applied to results from 2002 and earlier.
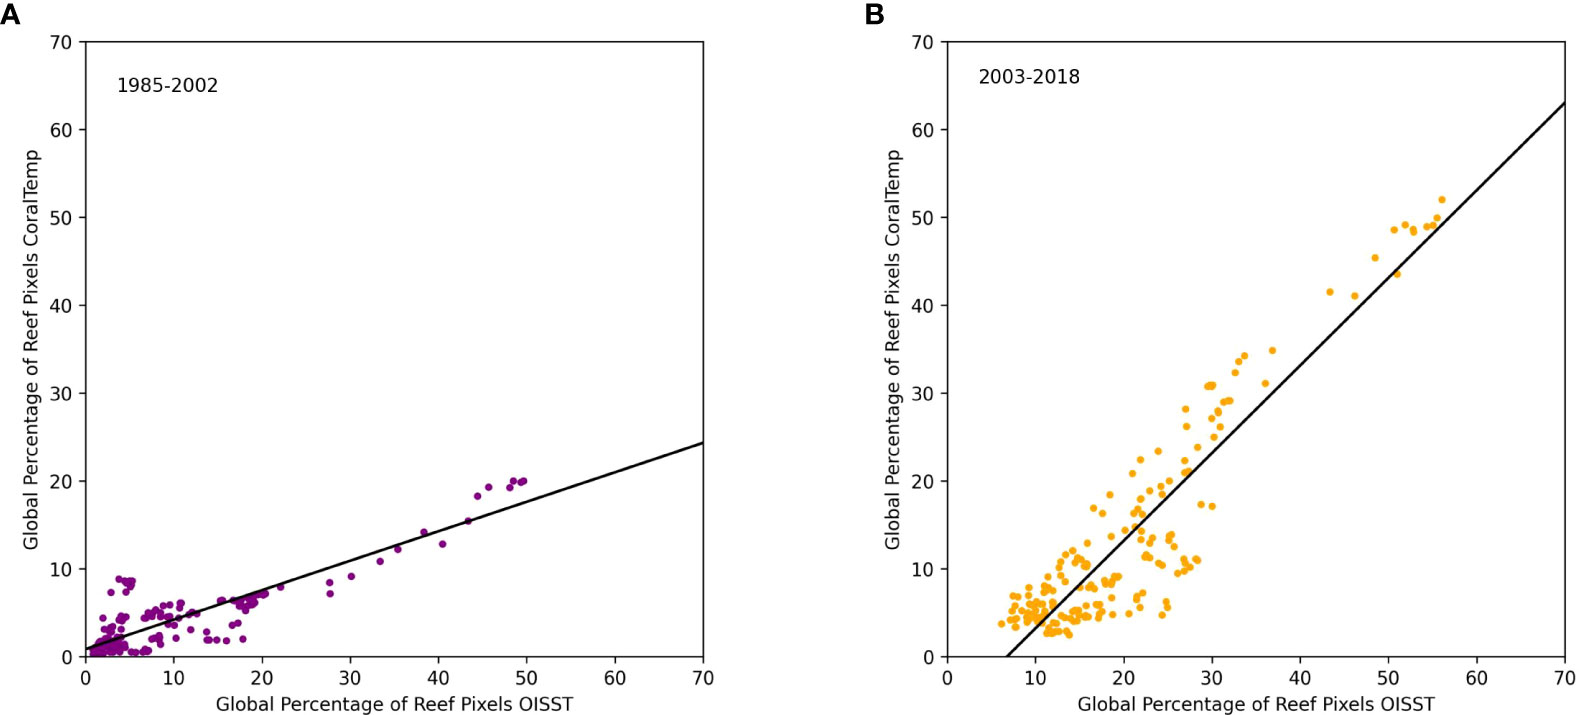
Figure 9 Global extent of heat stress (percentage of reef pixels) in the 5-km CoralTemp dataset and 25-km OISST dataset with an 8-month detection window for (A) 1985-2002; and (B) 2003-2018. Lines of best fit shown.
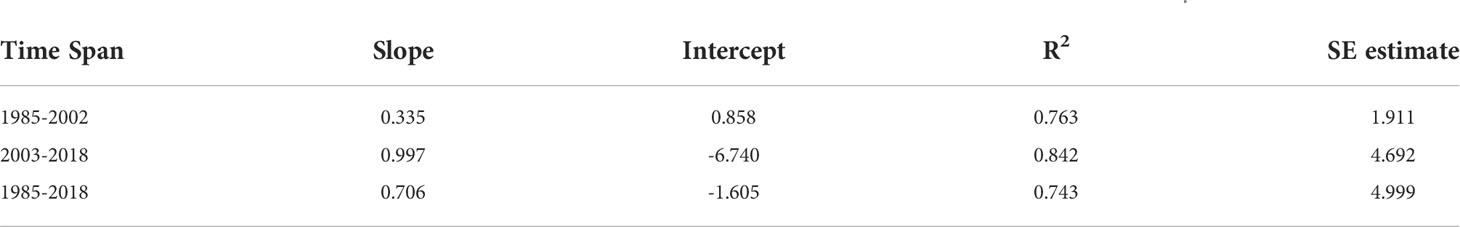
Table 3 Statistical comparisons of monthly global heat stress extent derived from 5-km CoralTemp and 25-km OISST.
Noting this need for caution, but acknowledging that only the OISST dataset includes the years prior to 1985 (the beginning of the 5-km CoralTemp dataset), basin-scale heat stress derived from OISST is considered. There has been some conjecture within the coral reef community as to whether the El Nino event of 1982-1983 may have resulted in a GCBE. Basin-scale events in the Indian and Pacific basins in 1982-1983 are consistent with reported bleaching observations from the southwestern Indian Ocean, Southeast Asia, the Great Barrier Reef and the South Pacific (Coffroth et al., 1990). Observations of bleaching from the southern Caribbean align with the lesser extent of heat stress from the OISST analysis. Based on this, it appears likely that at most two tropical basins were exposed to basin-scale heat stress events and so it is unlikely that a global coral bleaching event occurred in this period (cf. Eakin et al., 2019).
The detection window approach is currently being evaluated for potential implementation by CRW as a new management and communications product. The continuous, rolling-window characteristic of the methodology is amenable to operational delivery with a monthly update.
The detection window approach, developed here, provides an objective and ongoing method to assess the occurrence of basin-scale extreme heat stress and, thus, monitor the occurrence of global coral bleaching events. Historical extreme events in the CoralTemp record were used to define the threshold of heat stress extent required for basin-scale events (10% of reef pixels with DHW recently at or above 4°C-weeks). Global-scale events are apparent when all three tropical basins experience that extent of heat stress. An 8-month detection window was determined to be optimal for assessing basin-scale (and therefore global-scale) bleaching events. Additionally, use of 4-month detection window was informative for seasonal assessments. Having this information can help reef stakeholders understand impacts upon individual reefs within the broader context of basin- and even global-scale events, which can inform management networks. Implementation of the methodology as an operationally-supported product will provide effective and timely communication of the status of coral reefs around the world under increasing threat during the current era of unprecedented climate change.
The original contributions presented in the study are included in the article. Further inquiries can be directed to the corresponding author.
CL and SH designed the study. CL undertook the analyses and initial draft of the manuscript under the guidance of SH, who also wrote sections of the manuscript. All authors contributed to manuscript revision, read, and approved the submitted version. All authors contributed to the article and approved the submitted version.
Coral Reef Watch staff and this study were partially funded by NOAA's Coral Reef Conservation Program, project #915, and supported by NOAA grant NA19NES4320002 (Cooperative Institute for Satellite Earth System Studies) at the University of Maryland/ESSIC. The scientific results and conclusions, as well as any views or opinions expressed herein, are those of the author(s) and do not necessarily reflect the views of NOAA or the Department of Commerce.
The authors declare that the research was conducted in the absence of any commercial or financial relationships that could be construed as a potential conflict of interest.
All claims expressed in this article are solely those of the authors and do not necessarily represent those of their affiliated organizations, or those of the publisher, the editors and the reviewers. Any product that may be evaluated in this article, or claim that may be made by its manufacturer, is not guaranteed or endorsed by the publisher.
Banzon V., Smith T. M., Chin T. M., Liu C., Hankins W. (2016). A long-term record of blended satellite and in situ sea-surface temperature for climate monitoring, modeling and environmental studies. Earth Syst. Sci. Data 8, 165–176. doi: 10.5194/essd-8-165-2016
Burt J. A., Paparella F., Al-Mansoori N., Al-Mansoori A., Al-Jailani H. (2019). Causes and consequences of the 2017 coral bleaching event in the southern Persian/Arabian gulf. Coral Reefs 38, 567–589. doi: 10.1007/s00338-019-01767-y
Coffroth M. A., Lasker H. R., Oliver J. K. (1990). “Coral mortality outside of the eastern Pacific during 1982-1983: Relationship to Pacific El Niño,” in Global ecological consequences of the 1982–83 El Nino–Southern Oscillation, vol. 52 . Ed. Glynn P. W. (Elsevier Oceanography Series), 141–182. Available at: https://www.elsevier.com/books/global-ecological-consequences-of-the-1982-83-el-nino-southern-oscillation/glynn/978-0-444-88303-2.
Couch C. S., Burns J. H. R., Liu G., Steward K., Gutlay T. N., Kenyon J., et al. (2017). Mass coral bleaching due to unprecedented marine heatwave in Papahānaumokuākea Marine National Monument (Northwestern Hawaiian Islands). PLoS One 12:e0185121. doi: 10.1371/journal.pone.0185121
Donlon C., Martin M., Stark J. D., Roberts-Jones J., Fiedler E., Wimmer W. (2012). The operational sea surface temperature and sea ice analysis (OSTIA) system. Remote Sens. Environ. 116, 140–158. doi: 10.1016/j.rse.2010.10.017
Donner S. D., Rickbeil G. J., Heron S. F. (2017). A new, high-resolution global mass coral bleaching database. PLoS One 12 (4), e0175490. doi: 10.1371/journal.pone.0175490
Eakin C. M., Liu G., Gomez A. M., de la Cour J. L., Heron S. F., Skirving W. J., et al. (2017). Ding, dong, the witch is dead (?)–three years of global coral bleaching 2014-2017. Reef Encounter 32, 33–38.
Eakin C. M., Morgan J. A., Heron S. F., Smith T. B., Liu G., Alvarez-Filip L., et al. (2010). Caribbean corals in crisis: Record thermal stress, bleaching, and mortality in 2005. PLoS One 5 (11), e13969. doi: 10.1371/journal.pone.0013969
Eakin C. M., Sweatman H. P., Brainard R. E. (2019). The 2014–2017 global-scale coral bleaching event: insights and impacts. Coral Reefs 38 (4), 539–545. doi: 10.1007/s00338-019-01844-2
Fox M. D., Carter A. L., Edwards C. B., Takeshita Y., Johnson M. D., Petrovic V., et al. (2019). Limited coral mortality following acute thermal stress and widespread bleaching on Palmyra Atoll, central Pacific. Coral Reefs 38, 701–712. doi: 10.1007/s00338-019-01796-7
Gilmour J. P., Cook K. L., Ryan N. M., Puotinen M. L., Green R. H., Shedrawi G., et al. (2019). The state of Western Australia’s coral reefs. Coral Reefs 38, 651–667. doi: 10.1007/s00338-019-01795-8
Glynn P. W. (1984). Widespread coral mortality and the 1982-83 El Niño warming event. Environ. Conserv. 11, 133–146. doi: 10.1017/S0376892900013825
Glynn P. W. (1993). Coral reef bleaching: ecological perspectives. Coral Reefs 12, 1–17. doi: 10.1007/BF00303779
Head C. E. I., Bayley D. T. I., Rowlands G., Roche R. C., Tickler D. M., Rogers A. D., et al. (2019). Coral bleaching impacts from back-to-back 2015–2016 thermal anomalies in the remote central Indian Ocean. Coral Reefs 38, 605–618. doi: 10.1007/s00338-019-01821-9
Heron S. F., Liu G., Eakin C. M., Skirving W. J., Muller-Karger F. E., Vega-Rodriguez M., et al. (2015). “Climatology development for NOAA Coral Reef Watch's 5-km product suite. Technical Report NESDIS 145”. National Oceanic and Atmospheric Administration's National Environmental Satellite, Data, and Information Service. Washington D.C. doi: 10.7289/V59C6VBS
Heron S. F., Eakin C. M., Maynard J. A., van Hooidonk R. (2016a). “Impacts and effects of ocean warming on coral reefs,” in Explaining ocean warming: Causes, scale, effects and consequences, vol. pp . Eds. Laffoley D., Baxter J. M. (Full report. Gland, Switzerland: IUCN), 177–193.
Heron S. F., Johnston L., Liu G., Geiger E. F., Maynard J. A., de la Cour J. L., et al. (2016b). Validation of reef-scale thermal stress satellite products for coral bleaching monitoring. Remote Sens. 8 (1), 59. doi: 10.3390/rs8010059
Heron S. F., Maynard J. A., van Hooidonk R., Eakin C. M. (2016c). Warming trends and bleaching stress of the world’s coral reefs 1985–2012. Sci. Rep. 6, 38402. doi: 10.1038/srep38402
Hughes T. P., Kerry J. T., Álvarez-Noriega M., Álvarez-Romero J. G., Anderson K. D., Baird A. H., et al. (2017). Global warming and recurrent mass bleaching of corals. Nature 543, 373–377. doi: 10.1038/nature21707
Hughes T. P., Anderson K. D., Connolly S. R., Heron S. F., Kerry J. T., Lough J. M., et al. (2018). Spatial and temporal patterns of mass bleaching of corals in the Anthropocene. Science 359, 80–83. doi: 10.1126/science.aan8048
Johnston M. A., Hickerson E. L., Nuttall M. F., Blakeway R. D., Sterne T. K., Eckert R. J., et al. (2019). Coral bleaching and recovery from 2016 to 2017 at East and West Flower Garden Banks, Gulf of Mexico. Coral Reefs 38, 787–799. doi: 10.1007/s00338-019-01788-7
Liu G., Heron S. F., Eakin C. M., Muller-Karger F. E., Vega-Rodriguez M., Guild L. S., et al. (2014). “Reef-scale thermal stress monitoring of coral ecosystems: New 5-km global products from NOAA Coral Reef Watch”. Remote Sens. 6 (11), 11579–11606. doi: 10.3390/rs61111579
Maturi E., Harris A., Mittaz J., Sapper J., Wick G., Zhu X., et al. (2017). A new high-resolution sea surface temperature blended analysis. Bull. Am. Meteorol. Soc 98, 1015–1026. doi: 10.1175/BAMS-D-15-00002.1
Mumby P. J., Chisholm J. R. M., Edwards A. J., Andrefouet S., Jaubert J. (2001). Cloudy weather may have saved Society Island reef corals during the 1998 ENSO event. Mar. Ecol. Prog. Ser. 222, 209–216. doi: 10.3354/meps222209
Muñiz-Castillo A. I., Rivera-Sosa A., Chollett I., Eakin C. M., Andrade-Gómez L., McField M., et al. (2019). Three decades of heat stress exposure in Caribbean coral reefs: a new regional delineation to enhance conservation. Sci. Rep. 9, 11013. doi: 10.1038/s41598-019-47307-0
Oliver E. C.J., Donat M. G., Burrows M. T., Moore P. J., Smale D. A., Alexander L. A., et al. (2018) Longer and more frequent marine heatwaves over the past century. Nature Communications 9, 1324. doi: 10.1038/s41467-018-03732-9
Reynolds R. W., Chelton D. B. (2010). Comparisons of daily sea surface temperature analyses for 2007–08. J. Climate 23, 3545–3562. doi: 10.1175/2010JCLI3294.1
Reynolds R. W., Smith T. M., Liu C., Chelton D. B., Casey K. S., Schlax M. G. (2007). Daily high-resolution-blended analyses for sea surface temperature. J. Climate 20, 5473–5496. doi: 10.1175/2007JCLI1824.1
Roberts-Jones J., Fiedler E. K., Martin M. J. (2012). Daily, global, high-resolution SST and sea ice reanalysis for 1985-2007 using the OSTIA system. J. Climate 25, 6215–6232. doi: 10.1175/JCLI-D-11-00648.1
Sieger R. (2012). Limits of oceans and seas in digitized, machine readableform. Alfred Wegener Institute, Helmholtz Centre for Polar and Marine Research, Bremerhaven. doi: 10.1594/PANGAEA.777975
Skirving W., Enríquez S., Hedley J. D., Dove S., Eakin C. M., Mason R. A. B., et al. (2018). Remote sensing of coral bleaching using temperature and light: Progress towards an operational algorithm. Remote Sens. 10, 18. doi: 10.3390/rs10010018
Skirving W. J., Heron S. F., Marsh B. L., Liu G., de la Cour J. L., Geiger E. F., et al. (2019). The relentless march of mass coral bleaching: a global perspective of changing heat stress. Coral Reefs 38, 547–557. doi: 10.1007/s00338-019-01799-4
Skirving W. J., Marsh B. L., de la Cour J. L., Liu G., Harris A., Maturi E., et al. (2020). CoralTemp and the Coral Reef Watch Coral Bleaching Heat Stress product suite version 3.1. Remote Sens. 12, 3856. doi: 10.3390/rs12233856
Souter D., Planes S., Wicquart J., Logan M., Obura D., Staub F. (2021) Status of coral reefs of the world: 2020. Available at: https://gcrmn.net/2020-report/.
Teixeira C. D., Leitão R. L. L., Ribeiro F. V., Moraes F. C., Neves L. M., Bastos A. C., et al. (2019). Sustained mass coral Bleaching, (2016–2017) in Brazilian turbid-zone reefs: Taxonomic, cross-shelf and habitat-related trends. Coral Reefs 38, 801–813. doi: 10.1007/s00338-019-01789-6
Keywords: coral bleaching, heat stress, satellite monitoring, basin-scale events, detection window
Citation: Little CM, Liu G, De La Cour JL, Eakin CM, Manzello D and Heron SF (2022) Global coral bleaching event detection from satellite monitoring of extreme heat stress. Front. Mar. Sci. 9:883271. doi: 10.3389/fmars.2022.883271
Received: 24 February 2022; Accepted: 02 August 2022;
Published: 05 September 2022.
Edited by:
Geórgenes Hilário Cavalcante, Federal University of Alagoas, BrazilReviewed by:
Pedro C. Gonzalez Espinosa, University of British Columbia, CanadaCopyright © 2022 Little, Liu, De La Cour, Eakin, Manzello and Heron. This is an open-access article distributed under the terms of the Creative Commons Attribution License (CC BY). The use, distribution or reproduction in other forums is permitted, provided the original author(s) and the copyright owner(s) are credited and that the original publication in this journal is cited, in accordance with accepted academic practice. No use, distribution or reproduction is permitted which does not comply with these terms.
*Correspondence: Scott F. Heron, c2NvdHQuaGVyb25AamN1LmVkdS5hdQ==
Disclaimer: All claims expressed in this article are solely those of the authors and do not necessarily represent those of their affiliated organizations, or those of the publisher, the editors and the reviewers. Any product that may be evaluated in this article or claim that may be made by its manufacturer is not guaranteed or endorsed by the publisher.
Research integrity at Frontiers
Learn more about the work of our research integrity team to safeguard the quality of each article we publish.