 Anna Pasternak
 Alexander Drits
 Elena Arashkevich
- Shirshov Institute of Oceanology, Russian Academy of Sciences, Moscow, Russia
The ecosystems of the Arctic Ocean and their expected changes in a context of Global climate processes are crucially dependent on the freshwater input. The freshwater signal is assumed to be the main structuring factor for the marine fauna on the shallow shelf of the Siberian Arctic seas. The Laptev Sea, as a part of the world’s widest continental shelves surrounding the Arctic Ocean, is a key area for understanding the land–ocean interaction in high latitude regions. The largest freshwater input is provided by the deltaic Lena river followed by the estuarine Khatanga river. The plumes of these rivers differ considerably in their hydrophysical characteristics, suggesting differential impacts on ecosystems of the adjacent shelf. The key component of pelagic ecosystems is zooplankton, which transfers energy from primary producers to higher trophic levels and modifies sedimentations processes. This study is focused on the influence of river discharge on zooplankton in the Laptev Sea at the end of productive season. We studied zooplankton biomass, species composition, distribution patterns of the dominant species and assessed herbivorous feeding rates and grazing pressure of these species along a transect from the inner Khatanga Gulf northward to the continental slope, and a transect in the Lena plume influenced area in August-September 2017. Despite large spatial extension of the Khatanga plume, the impact of river discharge on zooplankton species composition was restricted mainly to the inner Gulf where the brackish species shaped the community. Contrary to the Khatanga input, the Lena freshwater inflow was highly variable and under certain conditions (discharge rate, wind forcing) governed the structure of zooplankton community over a vast shelf area. Distribution patterns of zooplankton biomass, ingestion rates and grazing impact of the dominant species on phytoplankton over the shelf influenced by the Khatanga and Lena plumes were similar. Analysis of our results on demographic structure of Calanus glacialis suggests that seasonal development of the population was largely controlled by the time of ice retreat. Observed climatic changes in the Arctic were not reflected in the total zooplankton biomass and composition of the dominant species.
Introduction
The present day condition of the Arctic Ocean and its changes in a context of Global climatic processes are crucially dependent on the freshwater input which is mainly derived from river discharge. Overall freshwater delivery to the Arctic is ~3300 km3 y-1 which makes up 11% of Global river run-off, although Arctic holds only 1% of the global ocean volume (McClelland et al., 2011). Among these 11% of the river discharge, more than 6% is accepted by the Siberian Arctic Seas (Fütterer and Galimov, 2003).
Freshwater discharge in the Arctic strongly influences hydrophysical, hydrochemical and biological processes not only in the estuarine areas, but also over the wide shelf areas (Fütterer and Galimov, 2003; Flint et al., 2018; Flint et al., 2021). The freshening effect and the formed long living freshened “lenses” usually extend as far north as the continental slope (Flint et al., 2018; Flint et al., 2021). River discharge plays a pivotal role in the interaction between terrestrial and marine environments which is a process of Global importance, especially in the Arctic, where it acts as a mechanism of delivery of climatic signal to high latitudes.
The rivers’ inflows create an extremely variable environment for pelagic communities in terms of salinity, temperature, turbidity, and nutrients. The enhanced delivery of nutrients to the phytoplankton populations, the basis of the aquatic trophic webs, could increase the resource for primary production. A spatio-temporally resolved biogeochemical model estimated that river input of carbon and nutrients to the Arctic Ocean fuels 28–51% of the current annual Arctic Ocean net primary production (Terhaar et al., 2021). A vast amount of the allochthonous organic matter is transformed in the shelf areas adjacent to the large rivers’ mouths (Gordeev et al., 1996). In the processes of transformation of organic matter, an essential role belongs to mesozooplankton which transfers energy from primary producers to higher trophic levels and modifies sedimentations processes, either enhancing retention in the upper water layer, or increasing sedimentation rates (Steinberg and Landry, 2017). Freshwater signal was shown to determine the structure (species composition, distribution, biomass) (e.g., Abramova and Tuschling, 2005; Hirche et al., 2006; Flint et al., 2010) and foraging activity (e.g., Drits et al., 2017; Arashkevich et al., 2018; Drits et al., 2020) of zooplankton in the river plume-affected areas. One of the remarkable consequences of the river runoff influence on zooplankton is formation of dense aggregations with extremely high biomass associated with high gradient zones (Vinogradov et al., 1995; Flint et al., 2010; Drits et al., 2017). Such dense aggregations determine high efficiency of the so-called “pelagic biofilter”, where a considerable part of the organic matter discharged by the river is utilized (Flint et al., 2010). Impact of the freshwater discharge on zooplankton may vary depending of the runoff volume and seasonal regime, bathymetry and orography of estuaries, hydrographical structure of the plumes. As annual Arctic river inflow is expected to increase by 10–20% under a doubled CO2 scenario (ACIA, 2005), impact of freshwater discharge on zooplankton could be more pronounced, e.g., expanding over larger shelf areas.
The Laptev Sea, as a part of the world’s widest continental shelves surrounding the Arctic Ocean, is a key area for understanding the land–ocean interaction in high latitude regions.
The Laptev Sea receives annually 820 km3 of the river runoff which is the second (after the Kara Sea) freshwater contribution to the Arctic seas (Gordeev et al., 1996; Williams and Carmack, 2015). The majority of these volumes is provided by discharges from the large deltaic Lena river (590 km3 y-1) which inflows to the southeastern Laptev Sea and estuarine Khatanga river (105 km3 y-1) which inflows to the southwestern Laptev Sea. Plumes of these two rivers do not merge (Fofonova et al., 2015) and have an influencing control over the environment of this Arctic marginal sea, which is ice-covered during most of the year. River runoff noticeably contributes to ice melting in the Siberian Arctic seas (Eicken et al., 1997; Nghiem et al., 2014). In the Laptev Sea, Lena warm water is an important heat source for the early local breakup of ice cover (Bauch et al., 2013), which, in turn, could regulate seasonal phytoplankton bloom and development of pelagic biota.
The results of the studies on zooplankton in the Laptev Sea indicate the importance of the freshwater discharge for composition, distribution and abundance of mesozooplankton communities (Kosobokova et al., 1998; Lischka et al., 2001; Abramova and Tuschling, 2005; Arashkevich et al., 2018). Freshwater discharge forms a salinity gradient along which different zooplankton assemblages change in turn from freshwater/brackish to euryhaline and marine assemblage (Jashnov, 1940; Kosobokova et al., 1998; Lischka et al., 2001). While the western and northeastern Laptev Sea shelf is dominated by a marine–neritic fauna, the central part is inhabited by a transitional brackish–marine assemblage. A brackish–neritic community characterizes the eastern and southeastern regions, where lowest salinities usually prevail. Closer to estuaries, the summer zooplankton consists of both freshwater and brackish-water species, whereas in winter, brackish-water species are dominant (Abramova and Tuschling, 2005). Highest zooplankton biomass was reported in the northern and northeastern parts of the
Laptev Sea, as well as close to the river inflows (Kosobokova et al. 1998; Lischka et al., 2001; Arashkevich et al., 2018). investigated zooplankton composition and biomass in the slope region and the outer Laptev Sea in the direction of the Nansen Basin and concluded that zooplankton standing stock was lower than in the other Arctic seas. It may be, however, connected with the study area, as shallow shelf areas with enhanced zooplankton biomass were not included in this study (Lischka et al., 2001).
The majority of the data on zooplankton in the shallow Laptev Sea shelf were obtained in the eastern and central parts of the sea influenced by the Lena plume. Little is known about pelagic fauna in the Khatanga region. The structure and abundance of zooplankton in the inner Khatanga Gulf was not studied at all. Knowledge on species composition and abundance of the communities in the shelf area influenced by the Khatanga plume is based on only few stations in the cited studies (Kosobokova et al., 1998; Lischka et al., 2001; Abramova and Tuschling, 2005).
To our knowledge, no data exist on grazing rates of zooplankton and grazing impact on phytoplankton in this area. There are only two studies on feeding patterns of zooplankton in the Laptev Sea, and they were performed in the eastern and central parts of the sea. These studies assessed diets of the dominant species on the basis of the analysis of the fatty acid composition (Peters et al., 2004) and estimated herbivorous ingestion rates of zooplankton and grazing impact on phytoplankton (Arashkevich et al., 2018).
Plumes formed by the estuarine Khatanga and deltaic Lena discharges differ by their hydrographical structure (Osadchiev et al., 2020; Osadchiev et al., 2021). The Lena discharge enters the sea undiluted from multiple channels and forms a shallow river plume (5-8 m depth) spreading over extremely large area. Shallow Lena plume is significantly affected by wind forcing conditions, which results in large inter-annual variability of its position and spatial extent (Osadchiev et al., 2021). Freshwater discharge from the Khatanga River, on the other hand, experiences strong tidal mixing in the Khatanga Gulf. As a result, the Khatanga plume is formed by relatively small volume of freshwater mixed with large volume of saline water. The weakly stratified Khatanga plume despite relatively low runoff rate (more than 5 times less than that of Lena) occupies large area (up to a distance of 150–250 km from the Khatanga Gulf) (Osadchiev et al., 2020). We hypothesize that in the Khatanga area strong tidal mixing could prevent propagation of brackish zooplankton over the shelf despite a pronounced plume extension. On the contrary, in the Lena area, the distribution of the different zooplankton assemblages is determined by the plume extension, and, under certain wind forcing conditions, brackish species could occupy a vast shelf area.
To address this hypothesis, we
1. Studied the structure of zooplankton community and distribution of dominant species along the transect from the inner Khatanga Gulf northward to the ice edge at the end of the productive season and compared these features with those obtained in the Lena plume affected area.
2. Followed the influence of temporal variability of the river plume extension on the composition and abundance of zooplankton at the repeated stations at each transect.
3. Estimated herbivorous feeding rates of the dominant zooplankton and grazing impact on phytoplankton biomass and production.
Additionally, the data obtained on the demographic structure of the population of Calanus glacialis allowed us to follow the influence of the timing of ice retreat on seasonal development of the population. This paper fills in the gap in understanding how composition, distribution and grazing of zooplankton communities are modified by river discharge with different hydrographical characteristics. The obtained results contribute to spatial coverage with data on zooplankton in the Laptev Sea and describe the state-of-the-art species composition, distribution and feeding in the river plume affected areas, which could serve as a benchmark in future studies.
Materials and Methods
Zooplankton Sampling
The material was collected during cruise # 69 of the RV “Akademik Mstislav Keldysh” to the Laptev Sea from 31 August to 20 September 2017. In the western part of the Laptev Sea, a transect of 11 stations from the inner Khatanga Gulf northward to the continental slope was performed (Figure 1). The northernmost station 5635 was located at the ice edge. Two of the stations (5591_2 and 5590_2) were sampled at the same locations where the pilot stations 5591 and 5590 have been sampled two weeks earlier to follow a short-term variability in zooplankton composition and abundance. To estimate if there were diel changes in the vertical distribution of zooplankton, day and night sampling was done at the pilot station 5591.
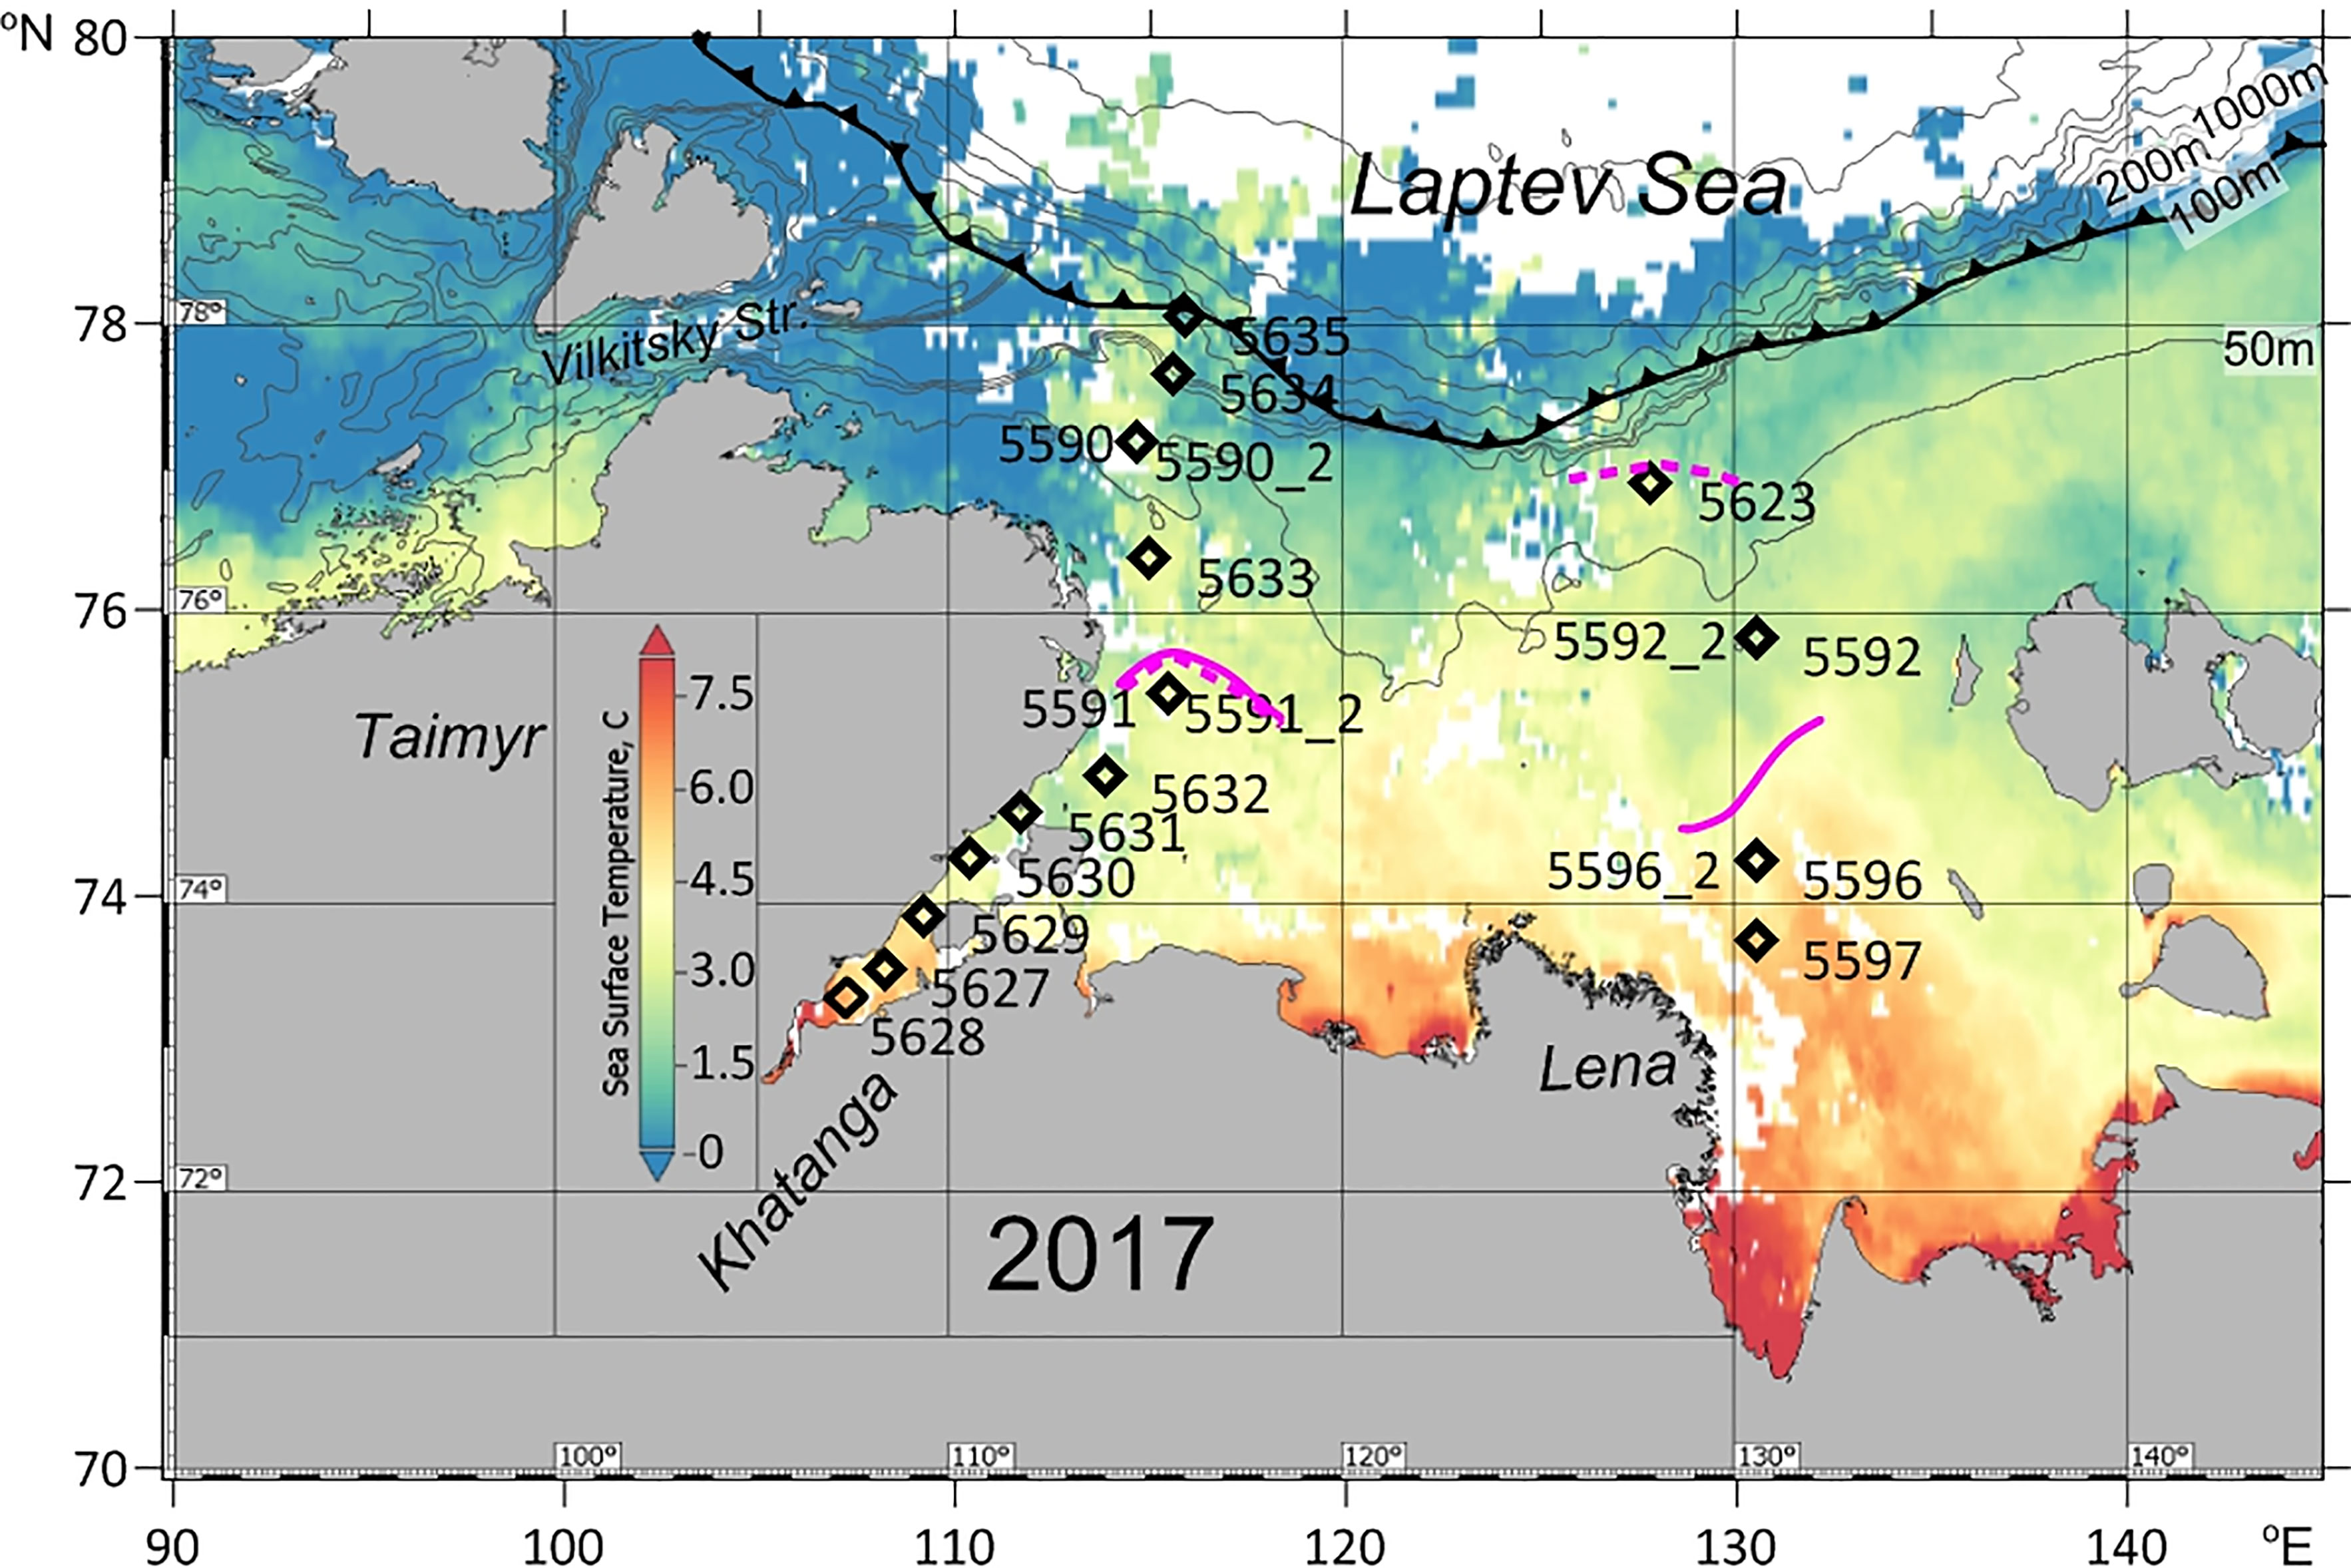
Figure 1 Map of the study area with location of the stations. Sea surface temperature (° C) distribution: average for 29 August – 6 September 2017 (at 11 microns, MODIS-Aqua_L3_SST_8d_4km vR2019.0) (Berrick et al., 2009). Bold lines show the position of the ice boundary (http://www.aari.ru). Magenta lines indicate river plume extension (isohaline of 25): solid line - at the time of first sampling (31.08-3.09. 2017), dashed line - at the time of the repeated sampling (14.09-20.09.2017). Contour depths in meters. When sampling was repeated, the Lena plume considerably extended to the north, while Khatanga plume remained at the same position.
In the eastern part of the Laptev Sea, three stations were carried out in the shelf adjacent to the Lena Delta on 2-3 September. Two of the stations (5596 and 5592) were repeated on 15-16 September, and one more station (5623), furthest from the Lena delta, was sampled on 15 September (Figure 1).
Simultaneously, data on temperature, salinity, and chlorophyll fluorescence were obtained from vertical CTD sounding with the SeaBird 19+ probe at all the stations.
Mesozooplankton was sampled using a Juday closing net (0.1 m2 mouth area, 180 μm mesh size) towed vertically from 2-3 m above the bottom to the surface at all shallow stations. At deeper shelf stations, the layers below and above the pycnocline, which was determined according to the CTD profiles, were usually sampled. Five separate layers were sampled with a MultiNet multiple plankton sampler (mouth area 0.125 m2, mesh size 180 μm) at the deepest station 5635 (Table 1). The volume of filtered water was calculated by multiplying mouth area value by the sampled depth layer. For determination of zooplankton abundance and biomass, samples were preserved in 4% borax-buffered formalin. Zooplankton were identified, staged, measured and counted in the laboratory under a stereomicroscope under x40 magnification. Not numerous large specimens (the older stages of Calanus spp., Oikopleura vanhoeffeni, Limacina helicina, Parasagitta elegans) were counted in the whole samples, while more numerous forms were counted in subsamples so as not less than 50 specimens were recorded. The copepodites of the closely related copepod species Calanus finmarchicus and C. glacialis were distinguished according to morphology and prosome lengths (Kwasniewski et al., 2003). For Calanus spp., all copepodite stages were distinguished, for Pseudocalanus spp. and Drepanopus bungei, copepodite stages CI to CIV were pooled. The wet weight (WW) of each species was calculated using nomograms by Chislenko (1968). These tables (1968; www.twirpx.com/file/1588162/) allow the calculation of biovolume (wet weight, WW) of aquatic organisms on the basis of the body shape and length. Dry weight (DW) of crustacean plankton was estimated as 0.16 WW (Vinogradov and Shushkina, 1987), DW of chaetognaths was calculated according to Matthews and Hestad (1977), larvaceans – to Hopcroft et al. (1998). To compare seasonal development of C.glacialis population at different stations, a mean developmental stage index (DSI) was calculated as abundance weighted average:

Table 1 Sampling details and environmental characteristics at stations in the Khatanga and Lena areas.
where i is copepodite stage number from 1 to 6, ni is abundance of stage i, and summations are for i from 1 to 6 (Skjoldal et al., 2021).
Feeding of Zooplankton
Feeding rates of dominant herbivorous zooplankton (C. glacialis, C. finmarchicus, C. hyperboreus, Limnocalanus macrurus, Senecella siberica, Pseudocalanus spp., Drepanopus bungei, Jaschnovia tolli, Oithona similis, Oikopleura vanhoeffeni, Limacina helicina) were assessed with the gut fluorescence method (Mackas and Bohrer, 1976). This approach was subject to discussion because of the possibility of pigment destruction during the passage through the gut (e.g., Båmstedt et al., 2000). There is no general agreement as to extent of pigment degradation, with values ranging from 0 to 95% (Pasternak, 1994). On the other hand, when different methods to estimate feeding were directly compared, reliable results were obtained with the gut fluorescence (Baars and Franz, 1984; Tiselius, 1988; Peterson et al., 1990; see also Pasternak, 1994). This suggests that high degradation rates are not the rule. Therefore, the gut fluorescence method continues to be a highly valuable tool for studies of zooplankton feeding (e.g., Saiz and Calbet, 2011; Valdés et al., 2017; D’souza and Gauns, 2018), and is still the only method that provides information on the in situ feeding rates and feeding impact of herbivorous zooplankton on phytoplankton assemblage.
Zooplankton for the gut pigment analysis was sampled from the layers above and below the pycnocline similarly to collection for the identification. The content of the cod-end was diluted in a 1L plastic bucket and the zooplankters were immediately anaesthetized with carbonated seawater. Undamaged animals were then sorted under a dissecting microscope and 1 to 50 animals per replicate, depending on size/stage, were picked with forceps and placed in test tubes with 3 ml of 90% acetone. Two to five replicates, if possible, for each species/stage were analyzed. Pigments were extracted for 24 h at 5 °C in the dark. Chl a and phaeopigments were measured by a standard fluorometric procedure (Holm-Hansen et al., 1965) with a Trilogy fluorometer (Turner Designs) before and after acidification with 1 N HCl. Gut content of the animals (G) in units of Chl a equiv. ind- 1 was calculated as G = (Chl a +1.51 x Phaeopigment) (Dagg and Wyman, 1983). The amount of pigment ingested daily (I, ng Chl a ind-1 day-1) was estimated as: I =G*24/GPT, where GPT is the gut passage time (hours). We used the gut passage values obtained in our previous studies and the published data (Table 2). We could not find published data on the gut passage time in Clausocalanidae D. bungei, so the value of 0.9 h obtained for the related Clausocalanus laticeps (Atkinson et al., 1996) was used. All the data on GPT were adjusted to the temperature of the habitat where the animals were collected with the Q10 = 2.2 (Irigoien, 1998). To assess ingestion rates of zooplankton in carbon units, we calculated the phytoplankton carbon (C, mg m-3) to Chl a (mg m-3) ratio of 15 ± 7 (n=11) in the Khatange region and 18 ± 8 (n=6) in the Lena region. Phytoplankton biomass and Chl a concentration were assessed from the same samples. The data on phytoplankton biomass in carbon units calculated according to Menden-Deuer and Lessard (2000) were taken from Sukhanova et al. (2019) for the Khatanga and I.N. Sukhanova (personal communication) for the Lena region. Chl a was assessed fluorometrically by Demidov et al. (2019).
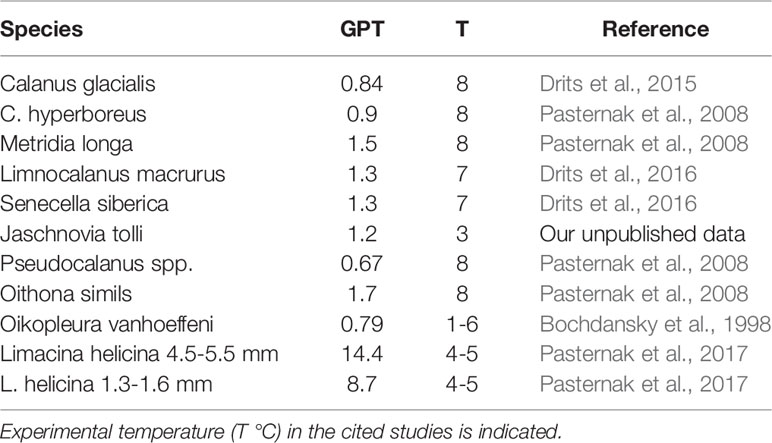
Table 2 Gut passage time (GPT, h) of the dominant zooplankton.
Grazing Impact
Grazing impact of each of the dominant species on the integrated (0-bottom) Chl a content (EChl, mg Chl a m-2) was estimated using the individual ingestion rates (Ii, ng Chl a ind-1 d-1) and the abundance of the given species (Ni, ind m-2):
where i is the layer number, n is the total number of layers. Grazing impact on primary production was assessed with the use of the obtained C: Chl a ratio. We used the data on primary production measured in this cruise using on-deck 14C incubations (Demidov et al., 2020 for the Khatanga region and A.B. Demidov, personal communication, for the Lena region).
Results
Study Area
Detailed description of the hydrography of the studied areas is given in (Flint et al., 2018; Osadchiev, 2020). Here, we present the features of physical environment which are most important for zooplankton.
Khatanga Transect. Hydrography of the studied area was strongly influenced by the river run-off. Variations of surface salinity and temperature along the transect are shown in Figures 2A, B. Salinity and temperature of the upper mixed layer along the Khatanga transect varied from 3.4 and +3.6 оС at st. 5628 (Khatanga Gulf) to 32.2 and -1.3 °C at st. 5635 (slope area). According to the changes in salinity, three zones could be distinguished: inner Khatanga Gulf (st. 5627-5629, surface salinity from 3.4 to 11), shelf zone influenced by the Khatanga plume (st. 5630-5591_2, surface salinity from 17 to 21), shelf-and-slope zone outside the plume (st. 5633-5635, salinity > 27). Chlorophyll a concentration varied from 1-1.9 mg m-3 (inner Gulf) to 0.1-0.9 mg m-3 (plume zone) and 0.2-0.4 (shelf-and-slope zone outside the plume) (Table 1). At the shallow stations in the Khatanga Gulf, there was no pronounced vertical stratification. It was recorded at all stations outside the Gulf (Figures 2A, B). Salinity in the upper mixed layer at stations 5590_2 and 5591_2 was similar to that measured at these locations at the corresponding pilot stations two weeks earlier (32.1 and 31.5, 21.5 and 22.3, respectively).

Figure 2 Distribution of salinity (left) and temperature (right) along the transects. (A, B) – Khatanga transect (17-20 September); (C, D) – Lena transect (2-3 September); (E, F) – Lena transect (14-15 September). Redrawn from: Flint et al., 2018. Considerable changes in the distribution of the freshened upper mixed layer are recognized in the Lena area at the second sampling. The distribution of salinity – temperature parameters in the Khatanga area could not be presented as only two stations were repeated.
Lena Transect. Two zones could be distinguished along the Lena transect, shelf zone influenced by the Lena plume and shelf zone outside the plume. At the first sampling, two of the stations (5597 and 5596) were located inside the Lena plume where salinity and temperature in the upper layer varied from 13.4 and 5.3 °C at the closest to the Lena Delta st. 5597 to 21.8 and 3.9 °C at st. 5596 (Figures 2C, D). Station 5592 with temperature of 2.1 °C and salinity of 25.7 was outside the plume. Two weeks later, salinity of the upper layer at st. 5596 decreased from 21.8 to 6.6 psu, while temperature increased from 3.9 to 4.6 °C. At another repeated station (st. 5592), changes in hydrographical parameters were less pronounced: salinity decreased from 25.8 to 19, while temperature remained almost unchanged (about 2.1 °C, Figures 2E, F). Chlorophyll a concentration increased by almost an order of magnitude at st. 5596 and did not change at st. 5592 (Table 1).
Zooplankton Biomass and Composition
Two peaks of total zooplankton biomass (DW, mg m-3) were recorded along the Khatanga transect: the first, in the inner Khatanga Gulf (st. 5627-5629), and second, at the shelf edge (st. 5590_2). Biomass values were more than 50 mg DW m-3 in both areas. In the plume zone, biomass was much lower, constituting, on average, 17 mg DW m-3 (Figure 3A). Minimum of 2.2 mg DW m-3 was recorded at the most oceanic station 5635.
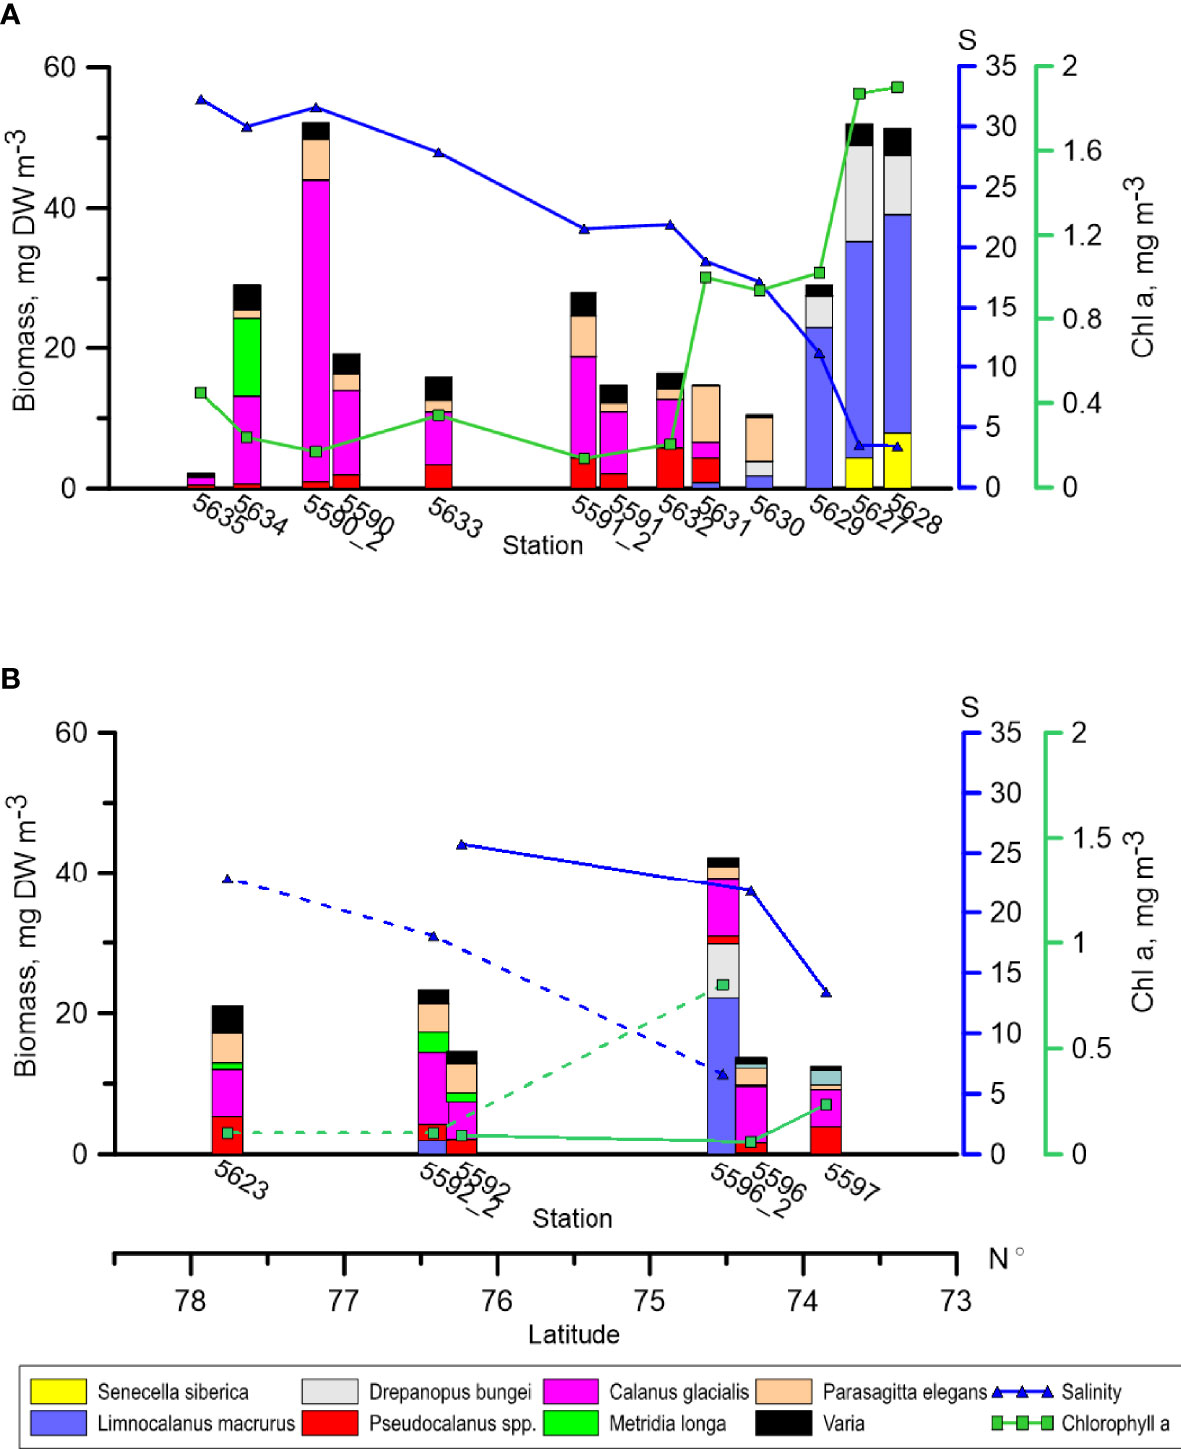
Figure 3 Distribution of zooplankton biomass, surface salinity and Chlorophyll a (0-bottom at the shallow station, 0-50 m at the deep stations) along the transects. (A) – Khatanga transect, (B) – Lena transect. Bars – zooplankton biomass, blue line - salinity (S), green line - chlorophyll ɑ Dashed lines – salinity and chlorophyll a at the repeated stations along the Lena transect. At the repeated stations along the Khatanga transect, the values of salinity and chlorophyll ɑ almost did not change and thus are not shown. Note considerable changes in species composition and biomass at st. 5596_2 compared with st. 5596.
Species composition of zooplankton along the Khatanga transect changed with the distance from the river mouth. Limnocalanus macrurus which was responsible for the first maximum of zooplankton biomass dominated inside the Khatanga Gulf. It was followed by Drepanopus bungei. At the two stations closest to the river, Senecella siberica played a significant role (Figure 3). When moving seaward, Calanus spp. accounted for a larger share of zooplankton biomass (15-60%). In this area, copepods of the genus Pseudocalanus and chaetognaths Parasagitta elegans contributed substantially to zooplankton biomass. Metridia longa made up 27% of zooplankton biomass at the slope stations. Comparison of zooplankton composition and biomass at the repeated stations revealed that composition of the dominant species did not change in two weeks, while biomass increased by a factor of 1.8 to 2.6. Increase of biomass was mostly due to C. glacialis at st. 5590_2 and C. glacialis together with P. elegans at st. 5591_2 (Figure 3).
Zooplankton biomass and composition at the three stations in the Lena area performed on 2-3 September were pretty similar. Calanus glacialis, Pseudocalanus spp. and P. elegans played the most pronounced roles at these stations (Figure 3). Beside them, O. vanhoeffeni were important at the nearest to the delta st. 5597. When sampling was repeated two weeks later, both composition and biomass of zooplankton demonstrated considerable changes. The most striking changes considered st. 5596_2: total biomass there turned out to be three times that at st. 5596. High abundance of L. macrurus at st. 5596_2, which was not found at all at the first sampling, was mostly responsible for this difference. Drepanopus bungei also contributed to biomass increase at this station, although to a lesser extent than L. macrurus. The latter was also found at another repeated station (5592_2), but its biomass was much less than at st. 5596_2.
Vertical Distribution
Vertical distribution of zooplankton biomass at the pilot stations 5591 and 5590 was similar irrespective of the time of the day (Figure 4). This suggests that zooplankton did not ascend into the upper layer at night, at least, at the shelf shallow water stations. Relatively high biomass of C. glacialis in the upper layer at these stations at all times of the day is associated with high abundance of the young development stages (CI-CIII) of this copepod.
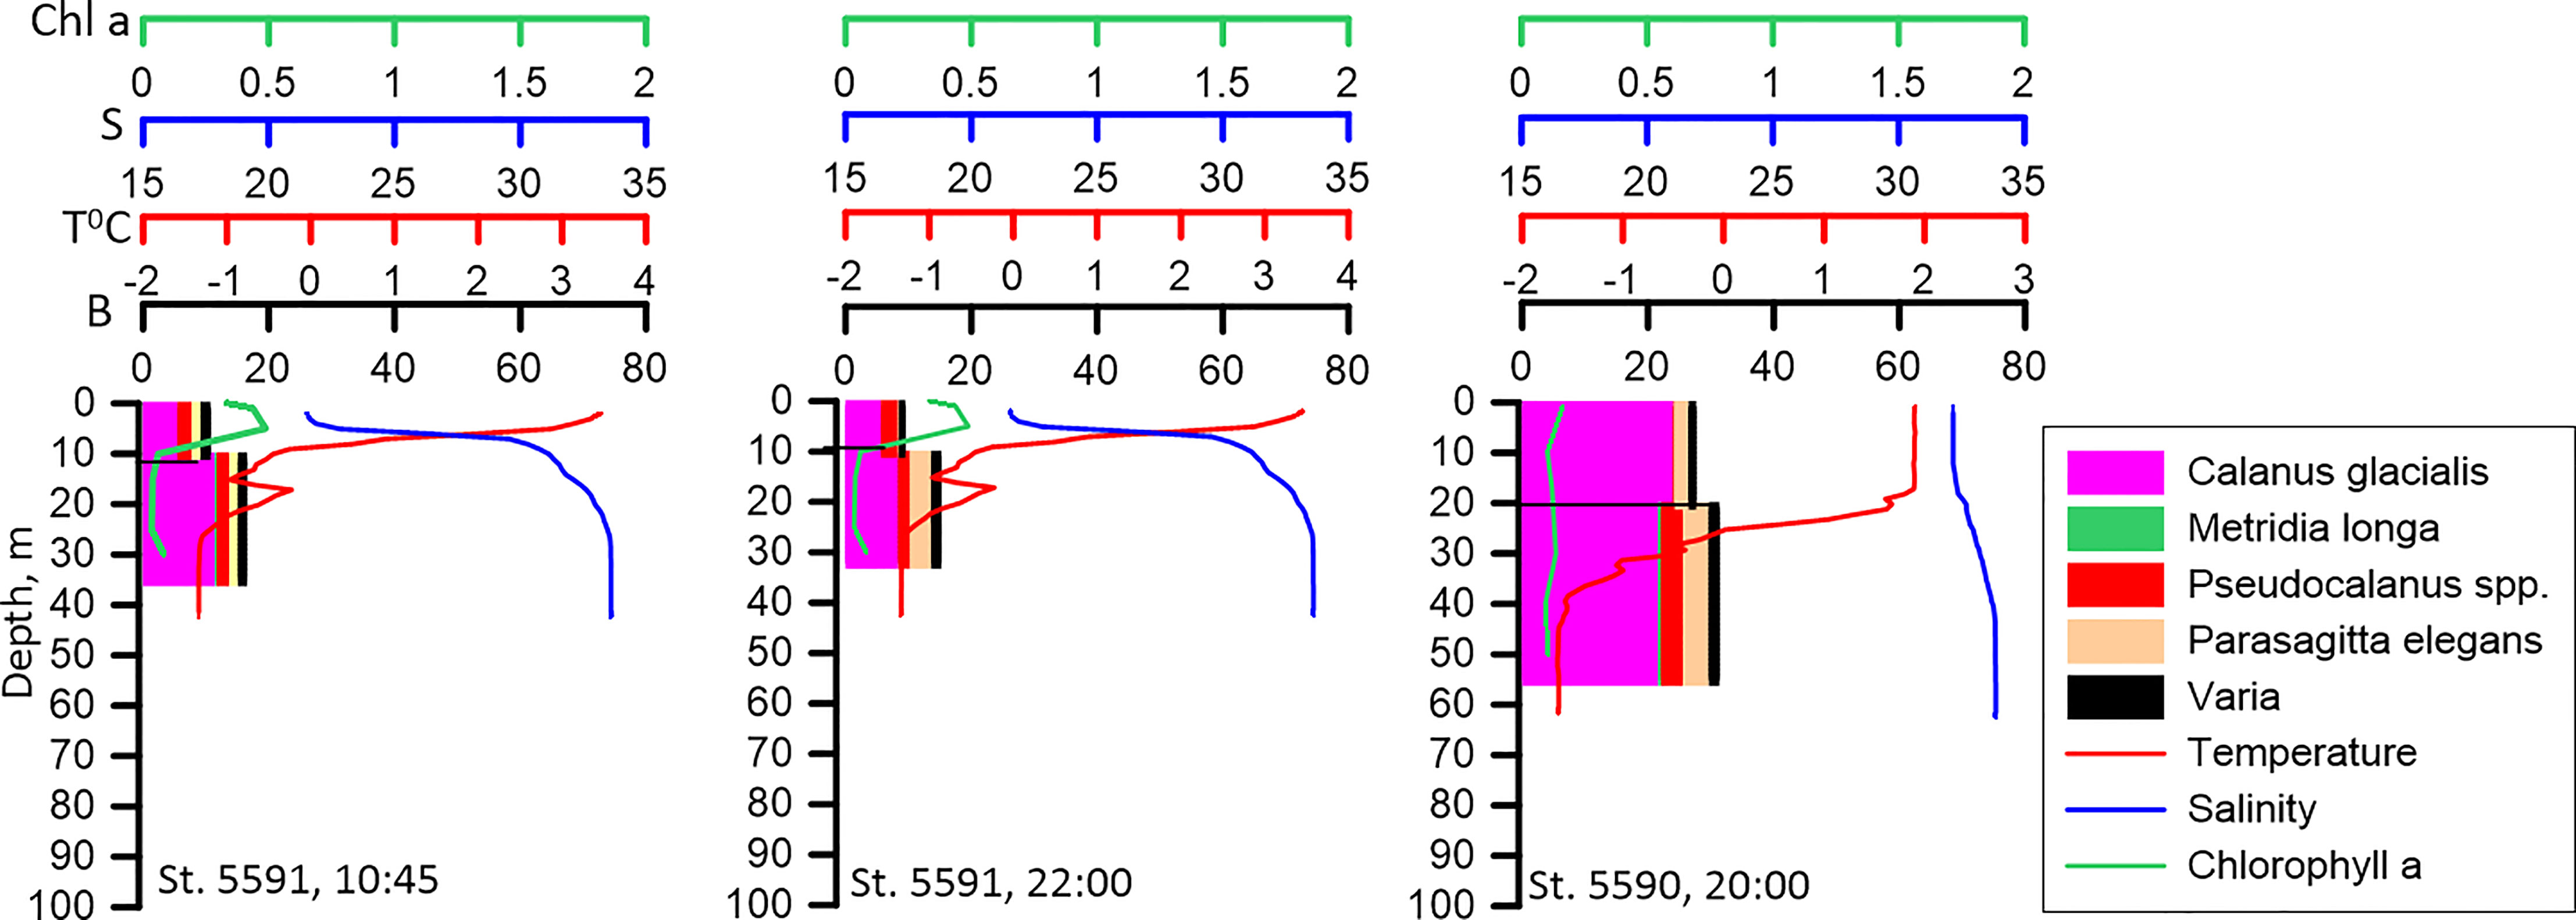
Figure 4 Vertical distribution of biomass of the dominant species (B, mg DW m-3) at different time of the day at the neighboring stations. No diel re-distribution of biomass could be detected. Vertical profiles of temperature (T° C), salinity (S) and Chlorophyll a (Chl, mg m-3) distribution are presented.
Vertical distribution of zooplankton biomass on the shallow shelf depended on the vertical distribution of salinity and temperature. In both of the areas, the bulk of the biomass was concentrated in the layer below the pycnocline regardless of Chl a vertical distribution and time of the day. In the relatively warm freshened upper mixed layer, biomass of zooplankton was lower (Figures 5, 6). The biomass maximum was determined mostly by the vertical distribution of Calanus glacialis, Pseudocalanus spp. and Parasagitta elegans. The only exception was st. 5596_2 in the Lena influenced area where biomass in the upper layer was twice that in the lower layer. Limnocalanus macrurus, which strongly dominated zooplankton biomass at this station, occupied the upper 10-0 m layer inhabited also by the second important species, D. bungei (Figure 6).
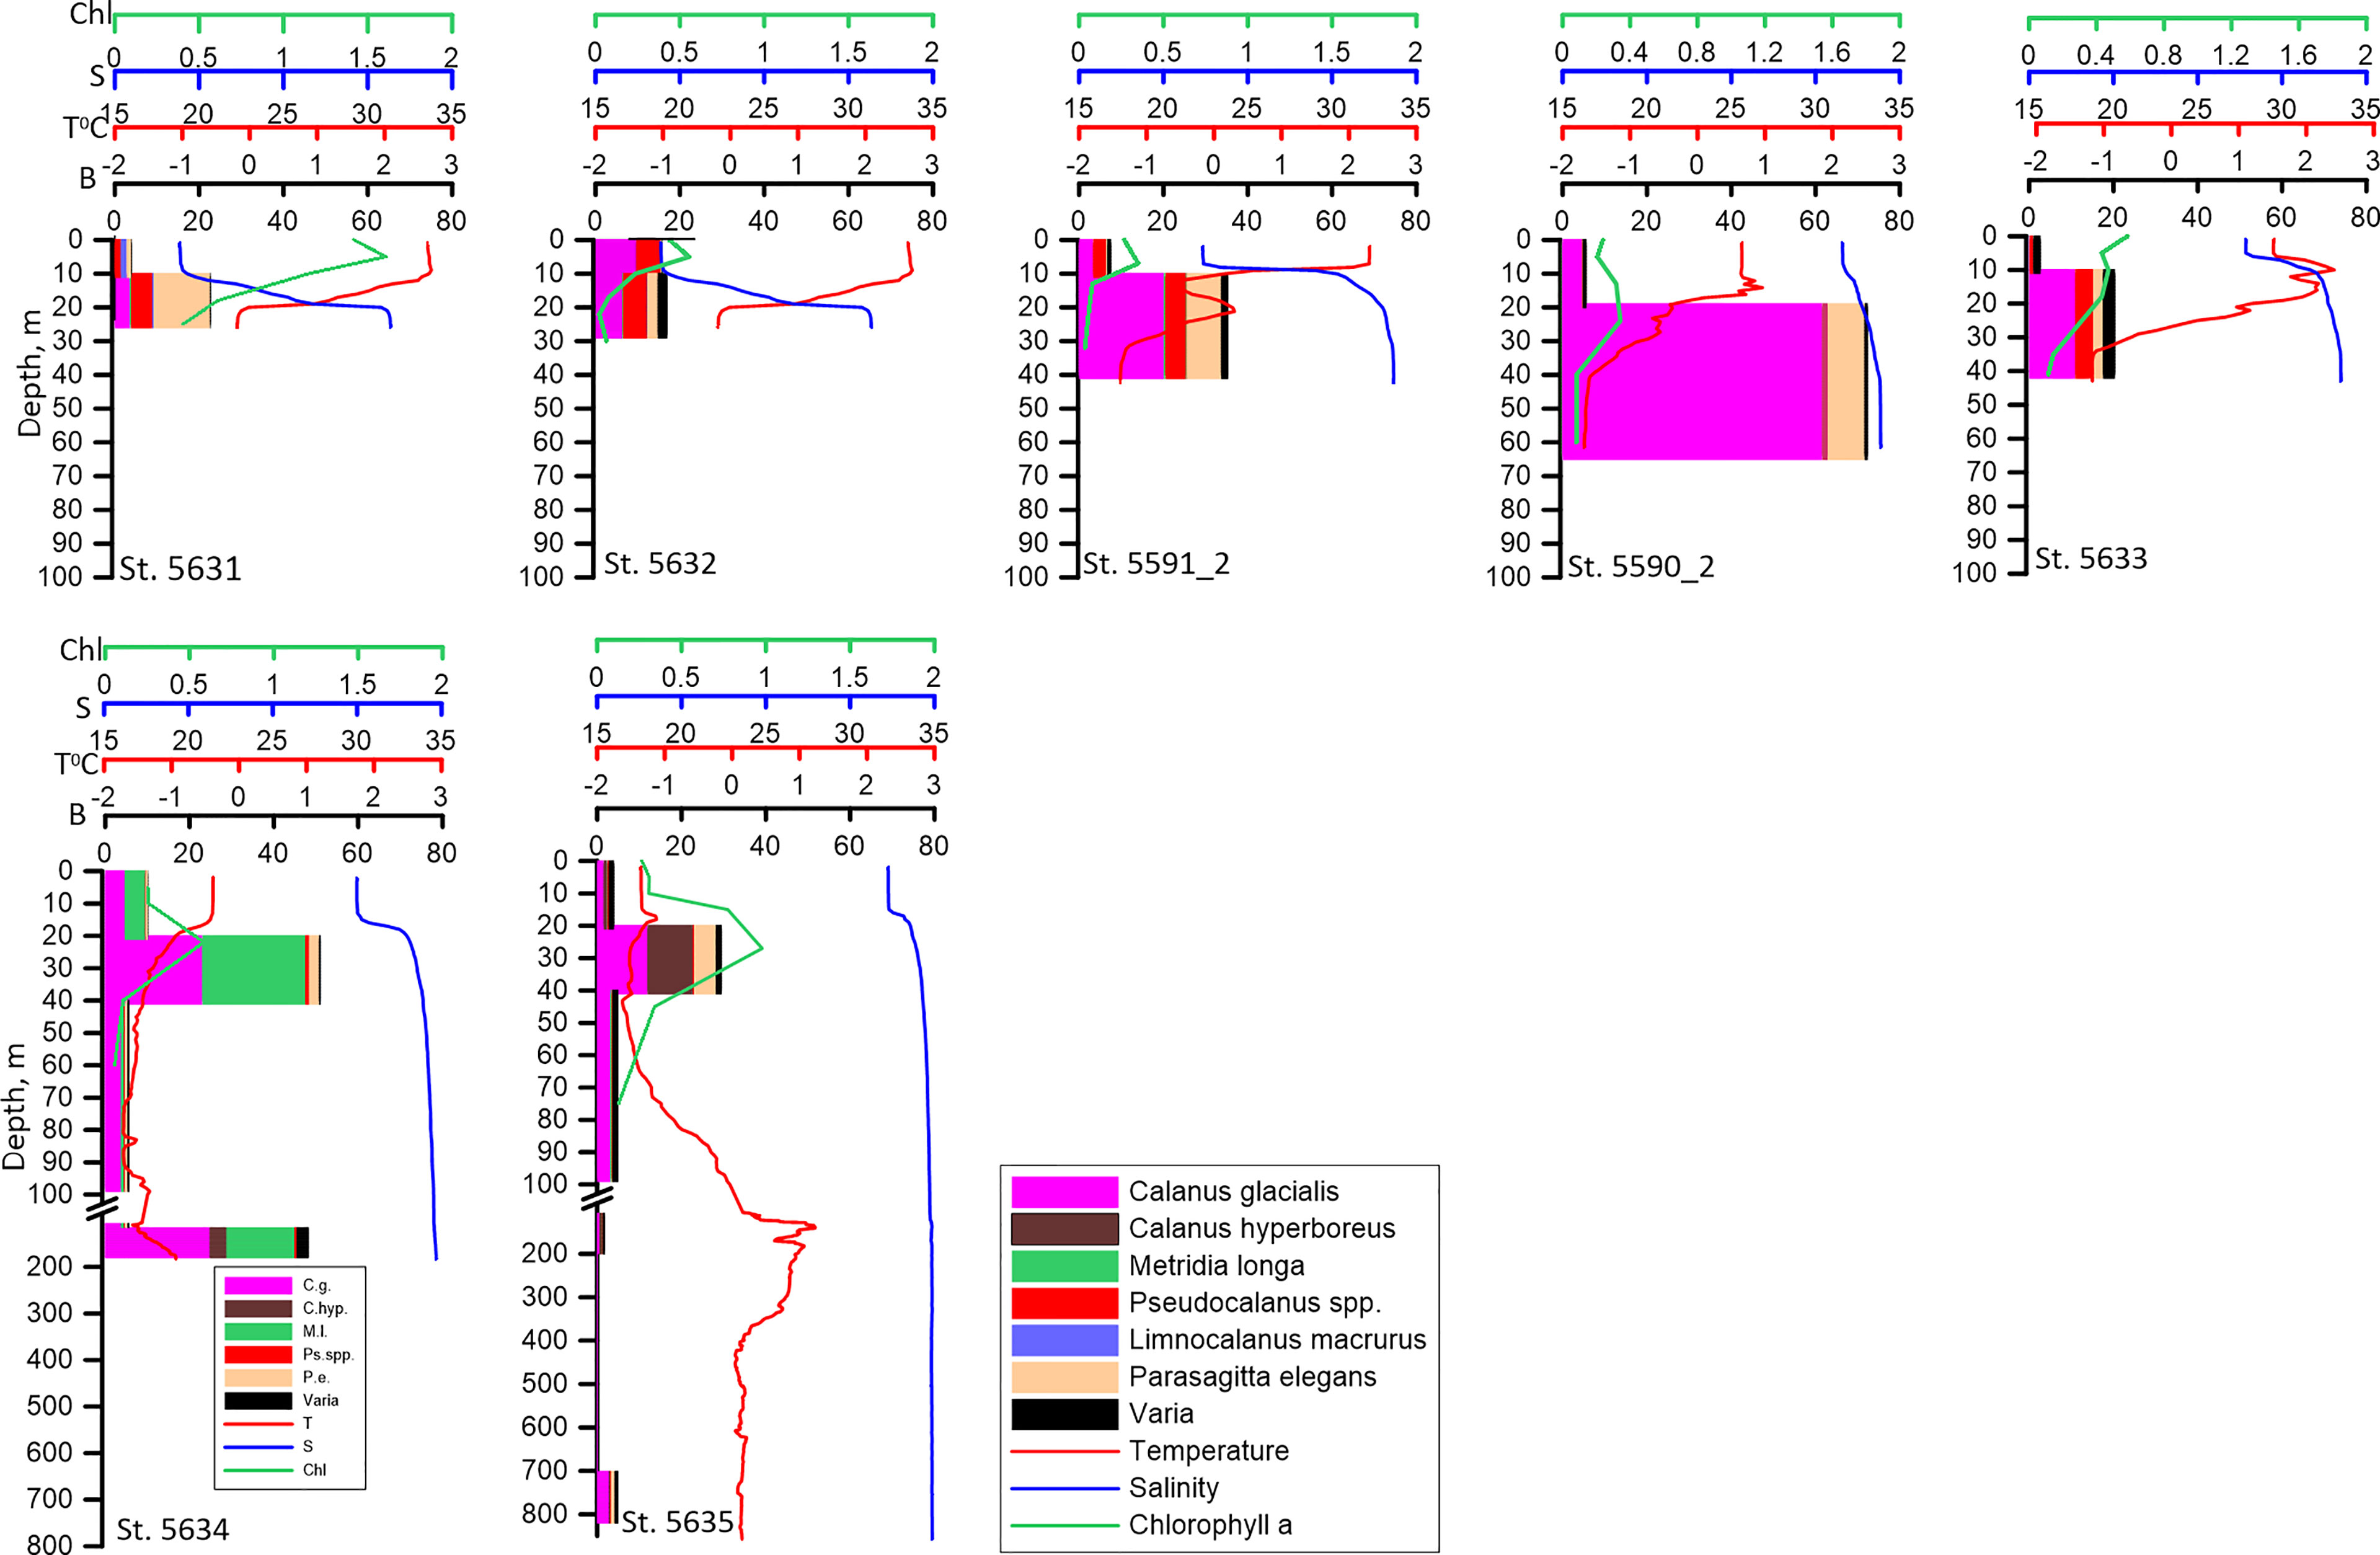
Figure 5 Vertical distribution of biomass of the dominant species (B, mg DW m-3), temperature (T° C), salinity (S) and Chlorophyll a (Chl, mg m-3) along the Khatanga transect. Note that the bulk of the biomass occupies the layer below the pycnocline.
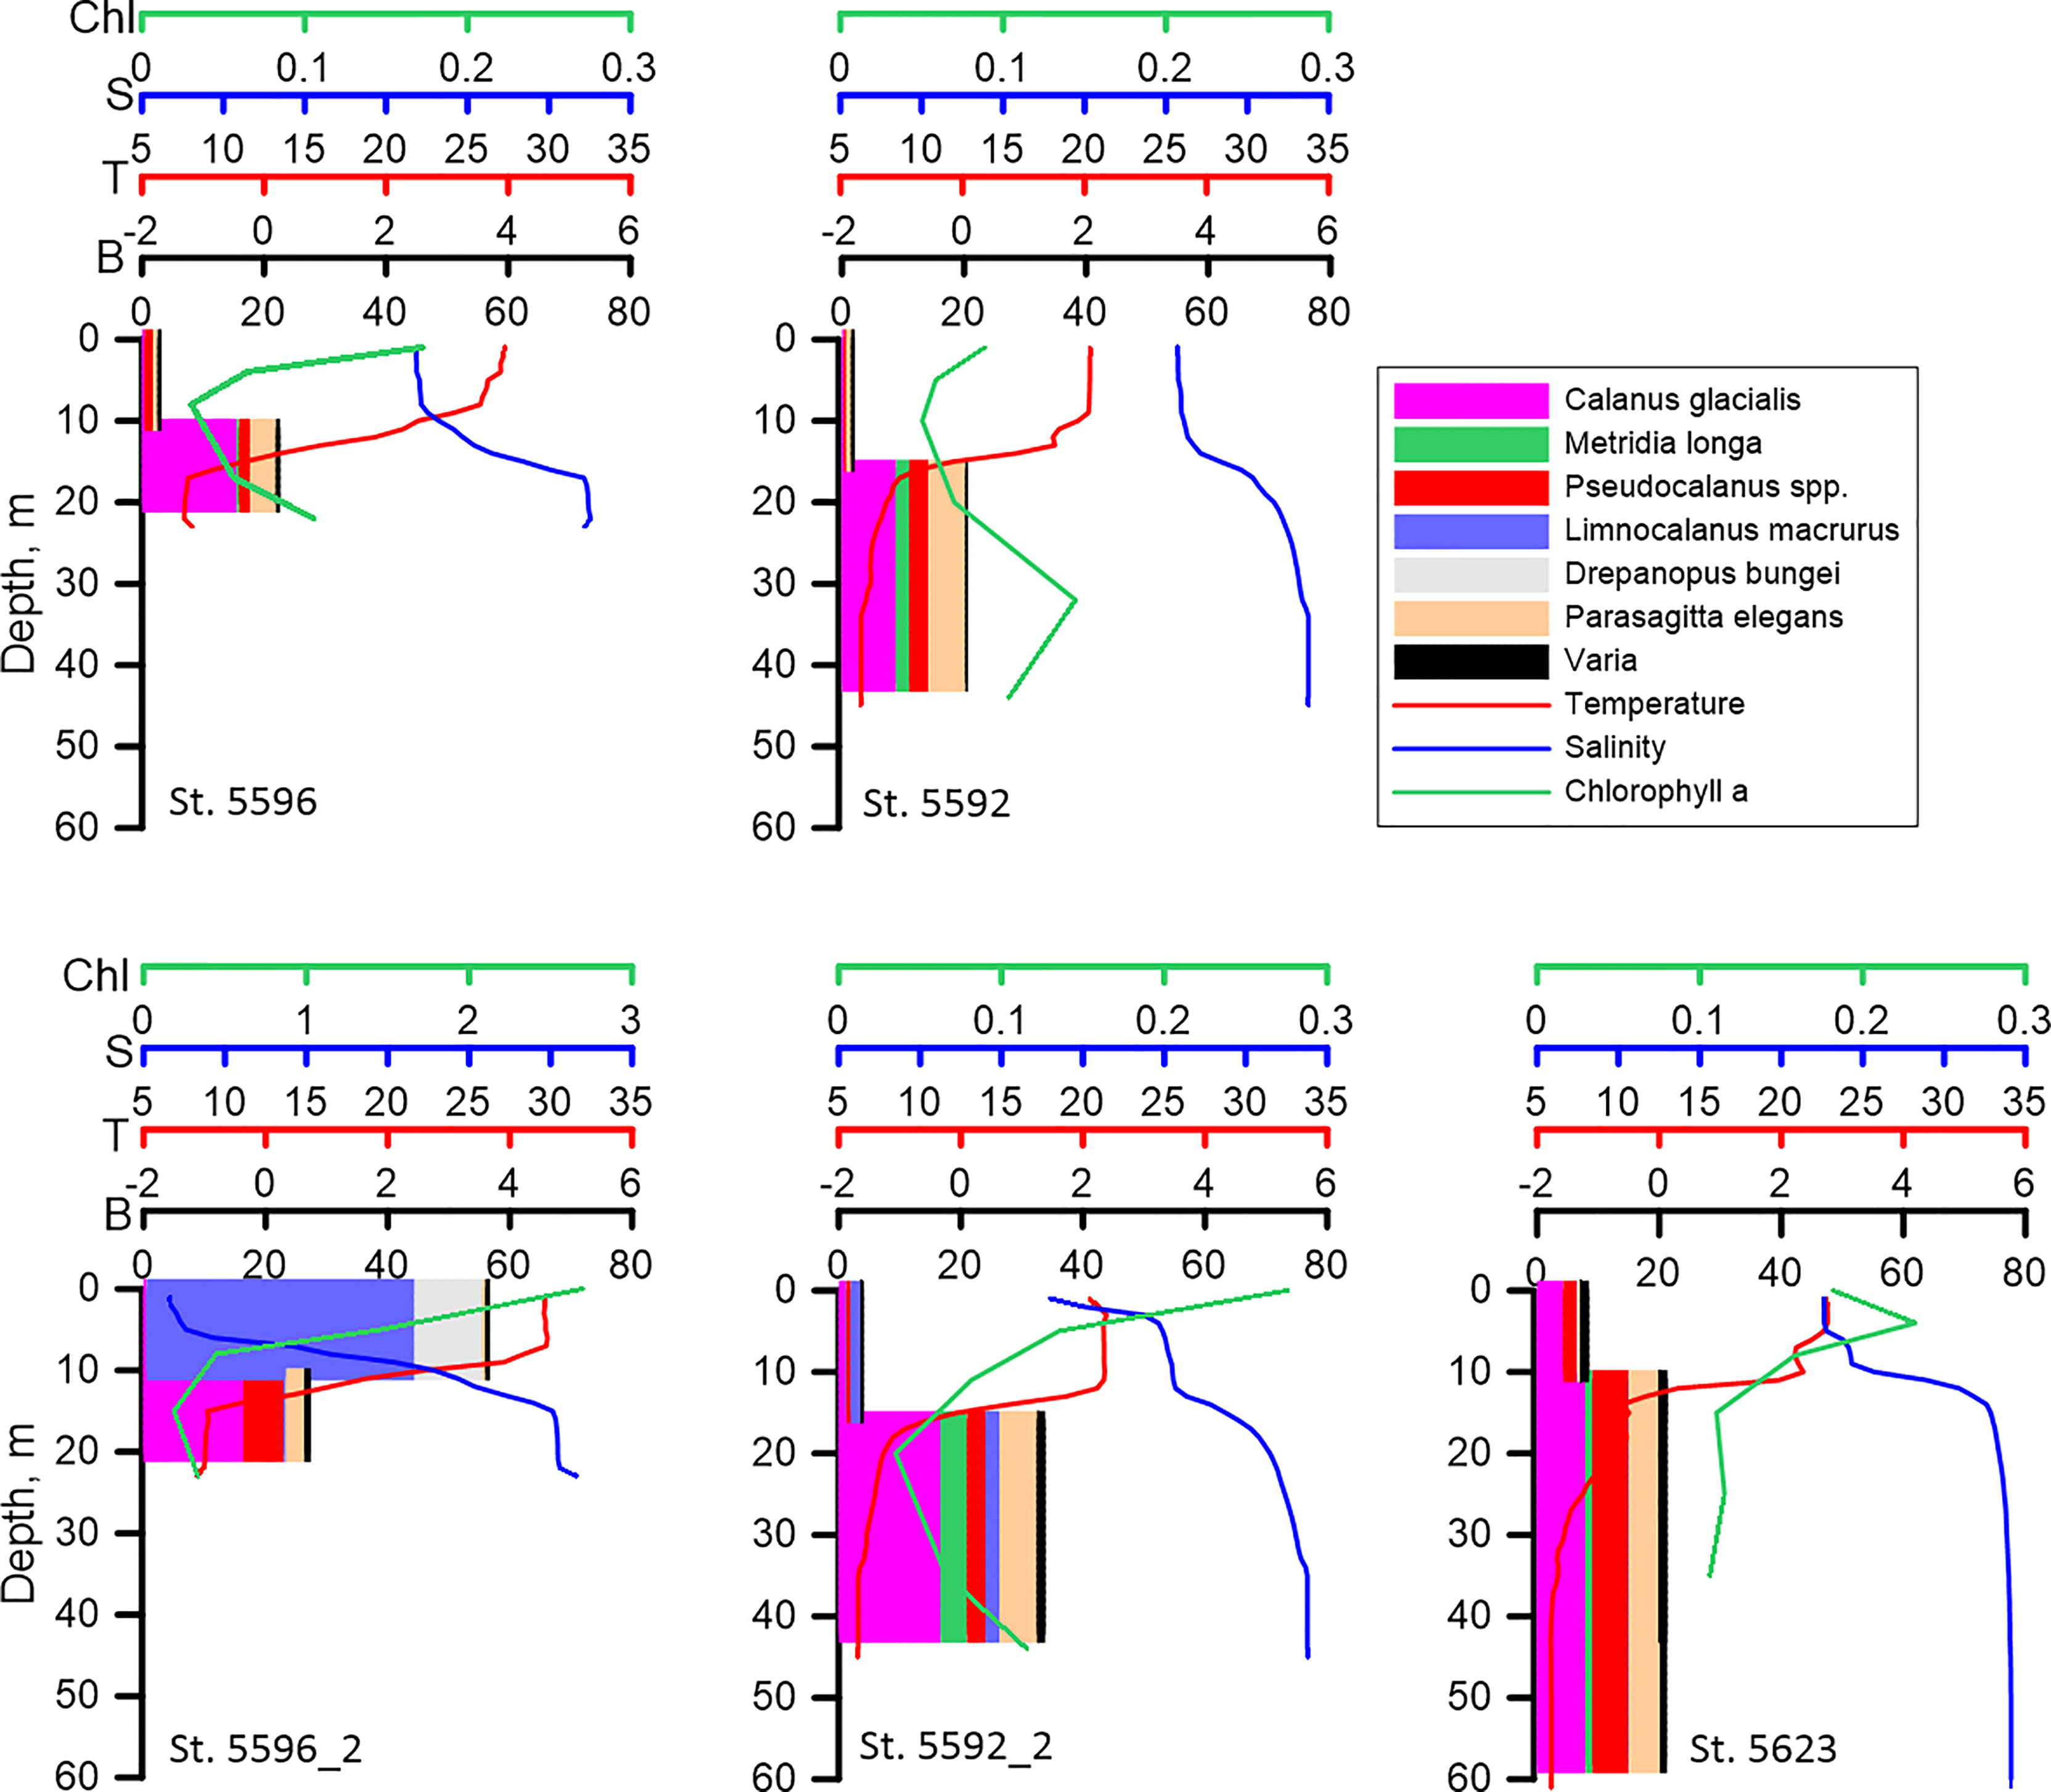
Figure 6 Vertical distribution of biomass of the dominant species (B, mg DW m-3), temperature (T° C), salinity (S) and Chlorophyll a (Chl, mg m-3) along the stations influenced by the Lena plume. Upper panel: sampling on 2-3 September; lower panel: sampling on 14-15 September. Considerable changes in the vertical distribution of zooplankton at the repeated st. 5596_2 are seen.
In the shelf edge and slope region, the biomass in the upper mixed layer was low (Figure 5). The higher values were recorded in the 40-20 m layer below pycnocline. Calanus glacialis, C. hyperboreus and M. longa were responsible for this biomass increase. An increase of zooplankton biomass related to these species was recorded in the near-bottom layer at these stations (Figure 5).
Age Structure of Calanus glacialis
The demographic structure of the population of C. glacialis changed from the south to the north, with similar trends in the both studied regions. At the southernmost stations where C. glacialis was first found (the species did not inhabit strongly freshened regions), the population consisted of only older stages (mainly, CV) (Figures 7A–C). To the north, the share of younger stages gradually increased. The youngest population was observed at the ice edge (st. 5635) where CI and CII comprised more than a half of the population abundance and the role of CV decreased to less than 5% (Figure 7A). Note that at this station a high abundance of Calanus spp. nauplii was recorded, up to 600 ind m-3 in the 0-20 m layer. Distinct demographic changes were also recognized when comparing the population structure at the repeated stations: in two weeks, the share of the younger stages decreased, and the older stages increased. Thus, at st. 5591 the share of CI-CIII decreased from 11 to 3%, at st. 5590 – from 62 to 18%, at st. 5596 – from 37 to 0%, at st. 5592 – from 46 to 10% (Figures 7B–D). To follow the ageing of the population, we calculated the mean developmental stage index (DSI), which varied from 2.2 at the ice edge to 4.5-5.2 at the southernmost stations (Table 3). At the repeated stations 5590, 5592, 5596, DSI in two weeks increased from 3.1-3.8 to 4.4-5.0 and almost did not change (4.7 to 4.9) at st. 5591. At the latter station, abundance of C. glacialis increased by a factor of 2 (from 710 to 1500 ind m-2), while no significant changes in abundance were found at the other three repeated stations (st. 5590: 9500 and 9700 ind m-2, st. 5592: 1000 and 1200 ind m-2, st. 5596: 670 and 440 ind m-2, Table S2) which suggests that the observed demographic changes were related rather to the ageing of the population than to advection. We noted clear positive effect of temperature on the DSI (DSI = 0.344 t + 0.346, R2 = 0.38; n = 14; p = 0.017).
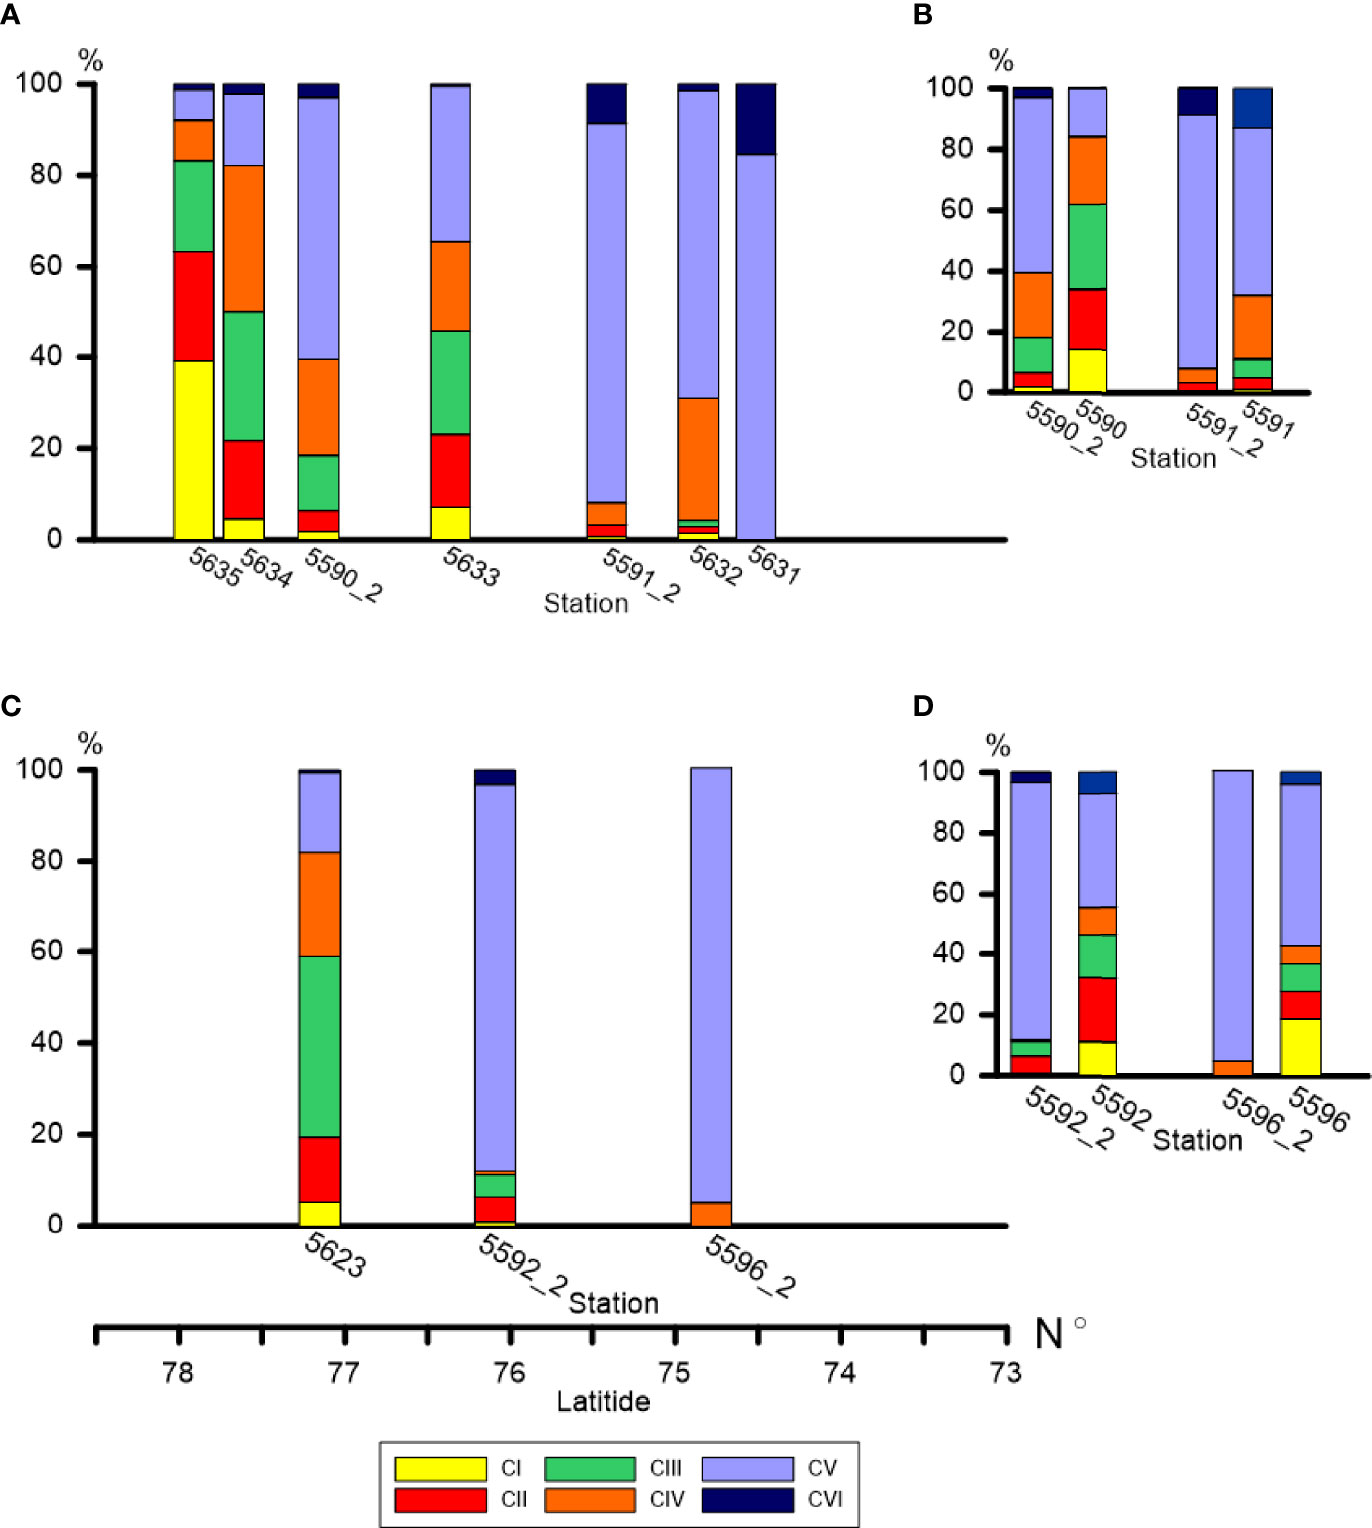
Figure 7 Demographic structure of C. glacialis population (relative abundance of each copepodite stage as percent of total population abundance) along the Khatanga (A) and Lena (C) transects and at the repeated stations in the Khatanga area (B) and in the Lena area (D). Spatial and temporal changes in dominance of consecutive copepodite stages is clearly recognized.
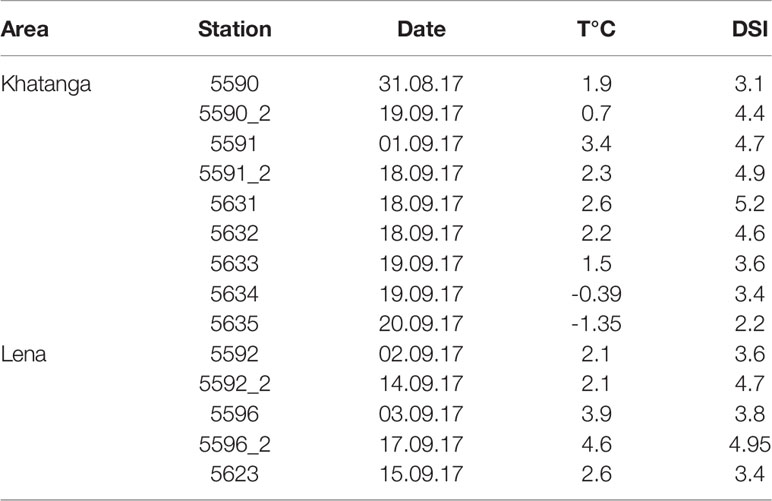
Table 3 Development stage index of Calanus glacialis population (DSI) in the Khatanga and Lena affected areas.
Feeding
Overall, gut pigment content of dominant zooplankters in both regions was not high, usually, not exceeding 3 ng Chl ind-1 (Table S1). Higher gut pigment content (> 10 ng Chl ind-1) was recorded in large copepods C. hyperboreus and in large (> 2 mm) larvaceans O. vanhoeffeni. The maximum values (> 1000 ng Chl ind-1) were measured in large (4-6 mm diameter) specimens of pteropods L. helicina.
Specific daily rations of small-sized copepods (including the young stages of C. glacialis) through herbivory varied from less than 1% to 4% (Table 4). Specific rations of large copepods made up around 1%. Contrary to copepods, both large pteropods and larvaceans demonstrated high values of specific rations: from 24% to 45% and 11% to 20%, respectively (Table 4).
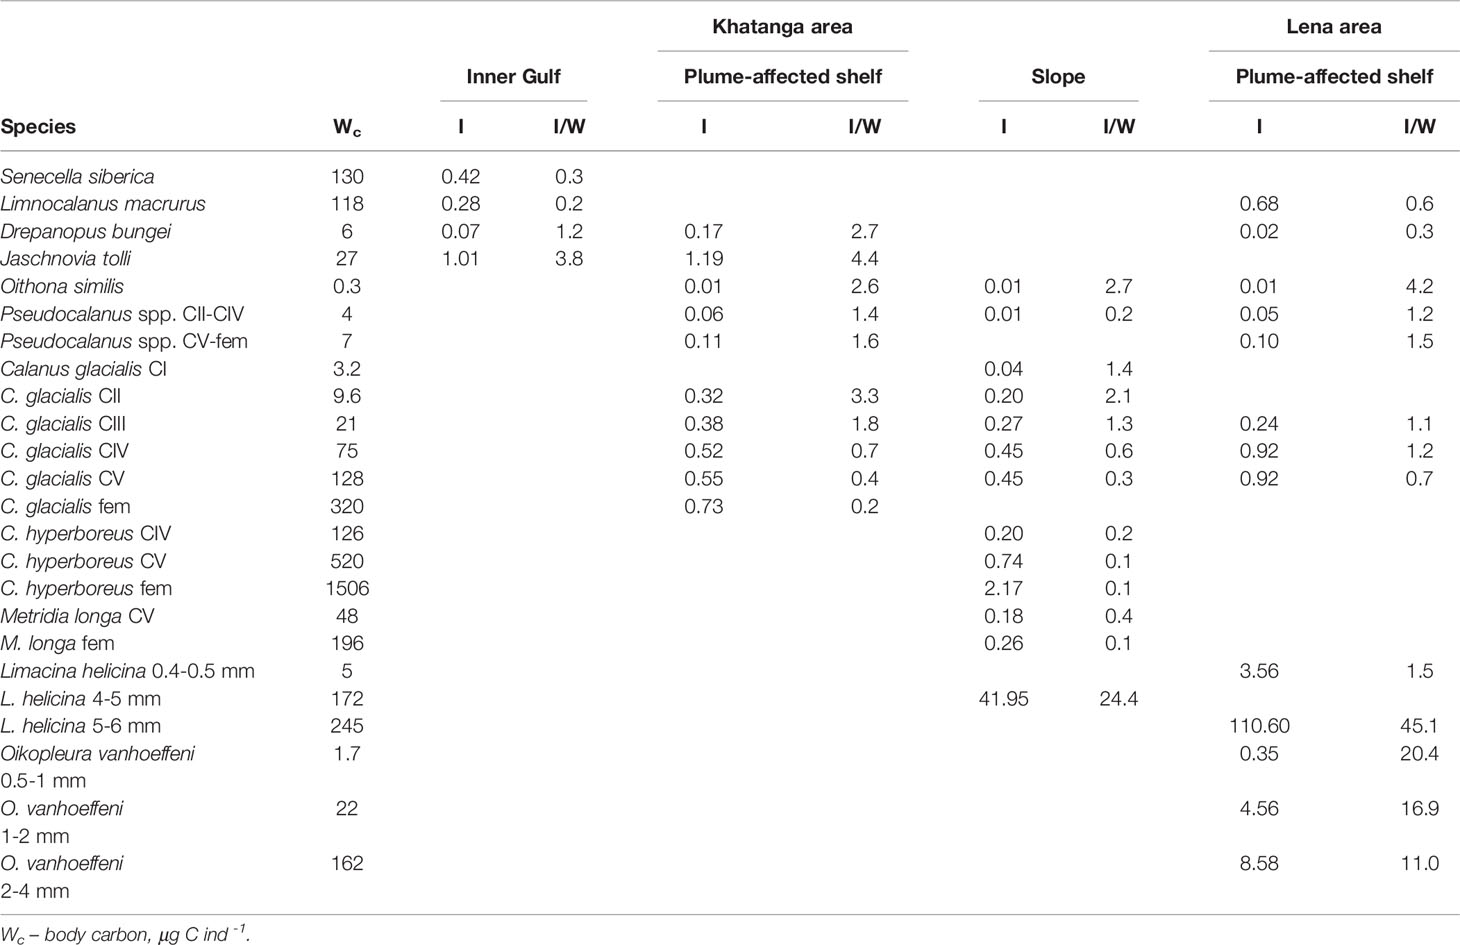
Table 4 Daily ingestion of autotrophic phytoplankton (I, μg C ind-1d -1) and specific daily ration (I/W, % body carbon) of the dominant zooplankters in different habitats.
Given the low feeding activity demonstrated by the main groups of zooplankton grazers and their not very high biomass, it is no surprise that grazing pressure was not high. It was less than 1% of chlorophyll in the inner Khatanga Gulf and at the ice edge, while consistuted about 3% in the plume-affected shelf area. At the pilot st. 5590, grazing impact reached maximum of 8%. In the Lena area, grazing imact was 1.5-2% with one exception of 6% at st. 5623 close to the Lena plume periphery (Figure 8). Grazing impact at the repeated stations decreased by a factor of 2. Grazing pressure on primary production varied from 1.4 to 13% at most of the stations with the maximum of 29% at st. 5590_2 (outer shelf off Khatanga) and 72% at st. 5623. The grazing pressure within the distinguished zones was determined by different consumers. Limnocalanus macrurus and D. bungei were the main grazers in the inner Khatanga Gulf and at st 5596_2 in the Lena plume area. Larvaceans O. vanhoeffeni contributed 99% to total grazing at the southernmost station in the Lena plume. At all of other stations, C. glacialis and Pseudocalanus spp. were the main grazers.
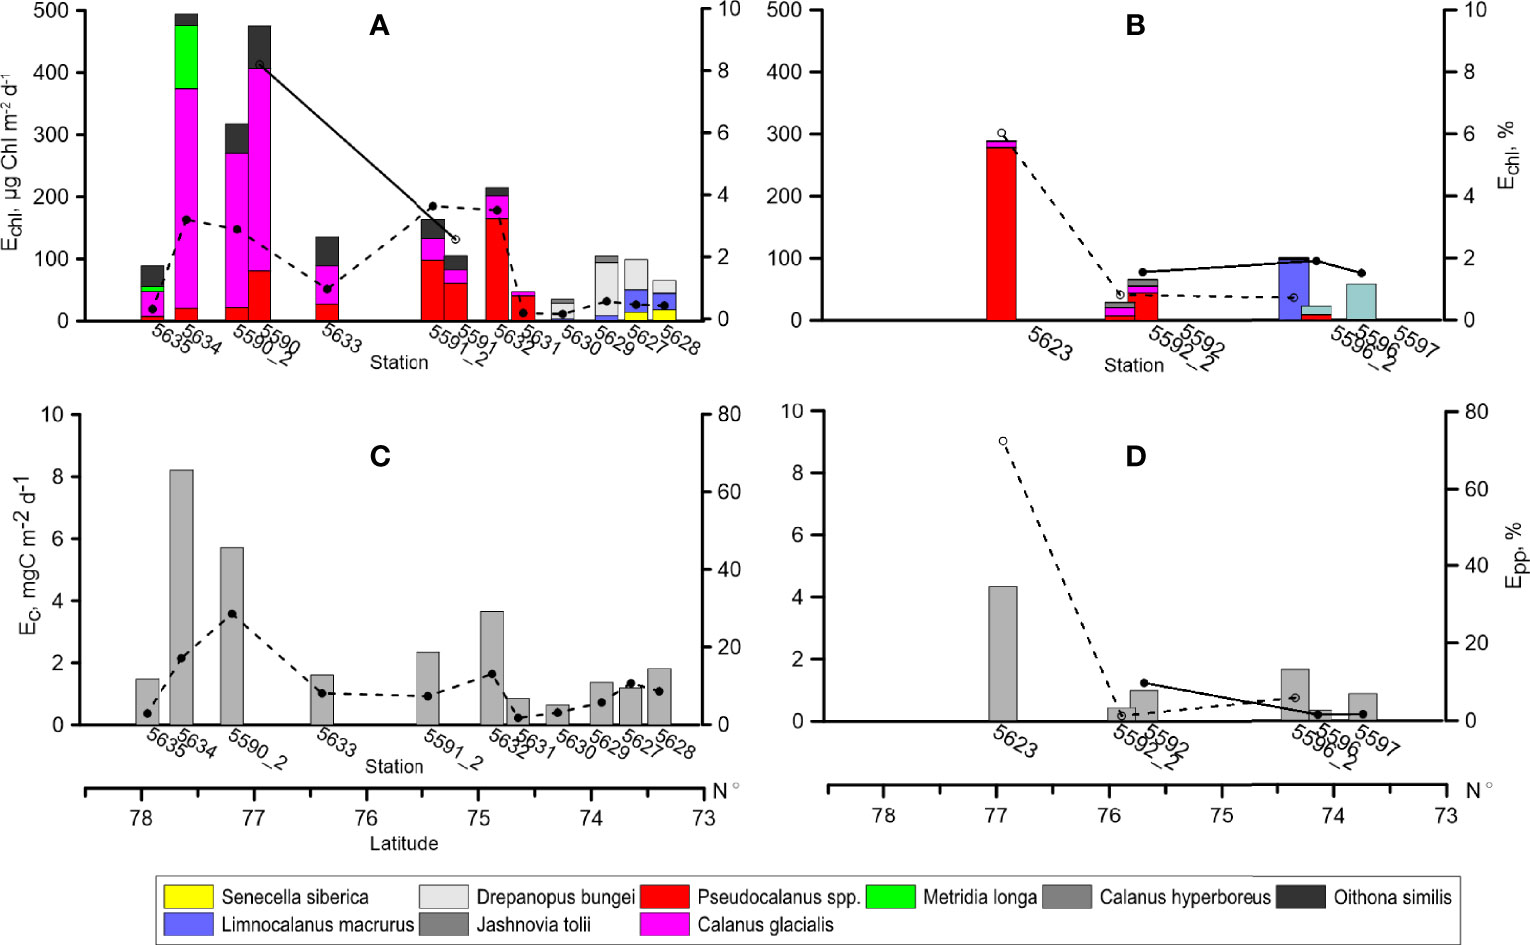
Figure 8 Grazing of dominant zooplankton species in terms of Chl a (Echl), (A, B) and organic carbon (Ec), (C, D), bars. Lines: daily grazing impact on phytoplankton standing stock (Echl, %) and grazing as percentage of primary production (Epp, %). Solid line - first sampling (31.08-3.09. 2017), dashed line - repeated sampling (14.09-20.09.2017). Left: Khatanga area, right: Lena area.
Discussion
Biomass and Composition of Zooplankton.
Several previous studies estimated zooplankton biomass and composition in the Lena influenced area (Jashnov, 1940; Kosobokova et al., 1998; Abramova, 1999; Abramova and Sokolova, 1999; Lischka et al., 2001; Abramova and Tuschling, 2005; Arashkevich et al., 2018) but the data in the Khatanga plume area are scarce (Jashnov, 1940; Kosobokova et al., 1998) and no data, to our knowledge, were so far obtained for the Khatanga Gulf. Our values for zooplankton biomass in the Khatanga plume area (11-28 mg DW m-3) are close to the values (18-36 mg DW m-3) reported by Kosobokova et al. (1998) for the same season. Lower biomass values of 0.3-6 mg DW m-3 reported by Lischka et al. (2001) were probably connected with the later sampling in this study (October). Our estimates of the biomass in the Lena plume area (12-42 mg DW m-3) are similar to those reported for this region by Lischka et al. (2001) in August-September and Arashkevich et al. (2018) in September: 15-60 and 10-30 mg DW m-3, respectively. Similar values of around 23 mg DW m-3 were recalculated from the data by (Sorokin and Sorokin, 1996). Lower values (2-13 mg DW m-3) were obtained for the same season by Kosobokova et al. (1998) which was explained by the scarcity of sampling in the shallow water region (Lischka et al., 2001). In the outer shelf/slope zone outside the Khatanga plume, our estimates (2-52 mg DW m-3) are close to the values of 4-25 mg DW m-3 presented by Kosobokova et al. (1998). Thus, the comparison of the data obtained in 1991, 1993, 1995 and in 2015, 2017 did not reveal considerable trends in changes of the biomass of zooplankton in the studied regions of the Laptev Sea, despite the fast warming of the Arctic and ice cover decrease (e.g., Perovich et al., 2019; Overland et al., 2019; Timofeeva and Sharatunova, 2021).
In general, our results on the species composition and zooplankton assemblages in the distinguished zones are in accordance with the previous studies in the Siberian Arctic seas (e.g., Vinogradov et al., 1995; Lischka et al., 2001; Fetzer et al., 2002; Abramova and Tuschling, 2005; Hirche et al., 2006; Arashkevich et al., 2010; Drits et al., 2020). Brackish species Limnocalanus macrurus, Senecella siberica and Drepanopus bungei made up the bulk of biomass in the most freshened areas closer to the river mouth. Their role decreased in the plume-affected areas where Pseudocalanus spp. and Calanus glacialis contributed significantly to total biomass. In the outer shelf/slope outside the plume, C. glacialis was by far the most important species, followed by M. longa and P. elegans.
Differential Influence of the Khatanga and Lena Runoff on Zooplankton
The freshwater discharge into the Laptev Sea forms a salinity gradient over the shelf and, to a large extent, determines the structure and functioning of zooplankton community (Jashnov, 1940; Kosobokova et al., 1998; Lischka et al., 2001; Abramova and Tuschling, 2005; Arashkevich et al., 2018, and others). Most of the data were obtained close to the Lena Delta and in the shelf plume-affected area. Our results make it possible to track if the influence of the Khatanga discharge on zooplankton community differs from that of the Lena. Despite large spatial extension of the Khatanga plume, the impact of Khatanga discharge on zooplankton species composition was restricted mainly to the inner Gulf where the brackish species (S. siberica, L. macrurus, D. bungei) shaped the community. These species were almost absent in the shelf plume area. The specific feature of the Khatanga estuary is a strong tidal forcing (Osadchiev et al., 2020) which could constitute the base of the mechanism of zooplankton retention (Gagnon and Lacroix, 1983; Morgan et al., 1997; Menéndez et al., 2012) within the Gulf. As an indirect support of this suggestion, results on zooplankton distribution in the not-so-far located Yenisei gulf in the Kara Sea which is similar in size, geomorphology, and climatic conditions to the Khatanga Gulf are considered. Contrary to the latter, the Yenisei Gulf is less affected by tidal mixing due to low tidal velocities (Osadchiev et al., 2020), and the distribution of the brackish zooplankton is not limited to the gulf. Instead, they inhabit the extended area of the shelf affected by the river plume (Vinogradov et al., 1995; Fetzer et al., 2002; Hirche et al., 2006). Similarly, the brackish species are distributed far to the north within the Lena plume area (Lischka et al., 2001; Abramova and Tuschling, 2005; Arashkevich et al., 2018). Our results showed highly variable pattern of spatial distribution of the brackish zooplankton assemblage: at the first sampling (1-2 September), when northern boundary of the plume was located at 75° N, the distribution resembled that in the Khatanga plume area. Neither L. macrurus nor D. bungei were found even at the closest to the Lena Delta station 5597, instead, C. glacialis, Pseudocalanus spp. and O. vanhoeffeni formed the bulk of the biomass. Two weeks later, when the Lena plume extended northward up to 77° N, L. macrurus constituted more than 50% of zooplankton biomass at 100 km distance from the Lena Delta and was found as far as 75.5° N. The wide distribution of brackish zooplankton in the plume area indicates that there are no mechanisms of zooplankton retention in the vicinity of the Lean Delta. Thus, contrary to the Khatanga input, the Lena freshwater discharge governs the structure of zooplankton community over a vast shelf area. Position and area occupied by the Lena plume strongly depend on the local wind forcing conditions (Osadchiev et al., 2021). In particular, meridional extension of the plume at the repeated sampling was related to the prevailing eastern and south-eastern winds in this area at the time of the study (Flint et al., 2018).
Distribution of total zooplankton biomass along the Khatanga transect is similar to that reported in the Lena area in autumn (Arashkevich et al., 2018). In both cases, biomass over the shelf influenced by the river plume was twice lower than in the vicinity of the freshwater inflow. Increased biomass of zooplankton close to the Lena Delta was also noted by Lischka et al. (2001) who explained this by better feeding conditions, increased water temperature and local hydrography. In our study, chlorophyll concentration and temperature were higher in the inner Khatanga Gulf which is in agreement with this explanation. In the Khatanga plume zone, besides lower chlorophyll concentration, its maximum was in the upper layer above pycnocline, the layer avoided by the marine species. This further worsened feeding conditions of herbivores in the plume-affected shelf area.
The vertical distribution pattern of zooplankton biomass in most of the cases resembled the pattern found in the Laptev Sea by Jaschnov (1940) and Kosobokova et al. (1998). They reported that biomass was confined mainly to the layer below pycnocline while the surface layer in the Lena and Khatanga plumes was poor. However, our results show that under increased spreading of freshened upper layer in the Lena plume, the vertical distribution pattern changed: maximum of zooplankton biomass made up by the brackish species, L. macrurus and D. bungei, was found in the layer above pycnocline.
Ice Melting Regime and Development of C. glacialis Population
Timing of ice retreat is among the main factors controlling seasonal development of the dominant copepod populations in the Arctic seas (Kosobokova and Hirche, 2001; Leu et al., 2011; Drits et al., 2020; Rogachev et al., 2021). According to Kosobokova and Hirche (2001), spawning of C. glacialis in the Laptev Sea occurred at the ice edge, and ageing of the population followed ice retreat. These authors noted that reproduction and development of C. glacialis differed between the eastern and western parts of the Laptev Sea in September 1993. In the east, where a large area extending northward from the mouth of Lena was open by the beginning of August 1993, the young stages CI-CIII constituted up to 40-60% of the population. In the western sea, almost completely covered with ice in early September, the older stages CIV- CVI dominated (Kosobokova and Hirche, 2001). The authors assumed that under the ice conditions in the western sea, reproduction and recruitment of C. glacialis has a sporadic character. Delays in C. glacialis reproduction and population developments due to inter-annual/geographical differences in sea ice conditions were recorded both in the Canadian and Eurasian Arctic (Kwasniewski et al., 2003; Søreide et al., 2008; Leu et al., 2011).
In our study, both eastern and western areas of the Laptev Sea were open from the second week of August in 2017 (http://www.aari.ru/). Demographic structure of C. glacialis did not reveal pronounced differences between the Khatanga and Lena areas at the beginning of September. At the southernmost stations, the population consisted totally of the overwintering stages (CIV-CVI). Northward, the contribution of younger stages gradually increased. Our results on demographic structure of C. glacialis along the Khatanga transect enabled us to follow population advancement in relation to timing of ice retreat. At the southernmost stations, the ice breakup occurred at the beginning of August, while at the northernmost ice-edge station, about 30-35 days later (http://www.aari.ru/). The development stage index of the population at these sites was 5.2 and 2.2, respectively. The positive correlation between DSI and temperature of the upper mixed layer agrees with delayed population development under late ice retreat and low temperatures. The question arises whether the population which we observed in the vicinity of the ice at the second half of September would be able to reach an overwintering stage (CV or CIV) before the formation of solid ice. The calculated duration of a copepodite stage (assuming equal development time of each stage) was around 12 days at the repeated stations. Our estimate is in accordance with other studies stating that C. glacialis needs approximately 2 months to develop from CI to their overwintering stages CIV and CV at 3° C (McLaren and Corkett, 1981; Corkett et al., 1986). This means that development from CII to CIV (the overwintering stage) will take about 24 days at surface temperature about 2-4 °C. Since the ontogenetic development of Calanus spp. is strongly temperature dependent (McLaren and Corkett, 1981; Skjoldal et al., 2021), the development of C. glacialis to the overwintering stage in the marginal ice zone (with the surface temperature below -1°C) is likely too slow to succed before the solid ice cover was formed by the midle of October. Suboptimal conditions for C. glacialis in this zone suggest that only a minor portion of the population survives through the winter season.
Feeding and Grazing Pressure
The herbivorous feeding rates of the dominant copepods did not reveal any influence of the river discharge. Specific daily rations on the algal food in the overwhelming majority of cases were less than 2% and did not exceed 4% body carbon. Assuming assimilation of phytoplankton of 0.6 (Mauchline, 1998), energy input through herbivory did not cover the metabolic requirements of these copepods (2-10% body carbon) calculated according to Ikeda (2001) with regard to water temperature and body weight. This pattern is similar to what was described by Arashkevich et al. (2018) in the Lena plume area in September 2015: the lack of pronounced river influence on feeding rates, and low daily rations. The estimated budgets showed that during the post-bloom period, ingestion through herbivory could not provide the necessary carbon to sustain the demands of growth and metabolism. Interestingly, that despite low herbivorous feeding, the population of C. glacialis grew and developed. This means that their energy input was supplemented by other sources, such as ciliates (e.g., Levinsen et al., 2000) and detritus (e.g., van der Jagt et al., 2020). For rough estimation of daily rations of copepods on all these sources (phytoplankton, ciliates and detritus), Arashkevich et al. (2018) calculated C. glacialis ingestion rates using suspended POC/Chl (besides Cphyt/Chl) ratio at the stations along the Lena transect. This resulted in an almost an order of magnitude higher daily energy input which considerably exceeded metabolic requirements. Thus, given the observed development of the C. glacialis population in our study, we suggest that the copepods successfully exploited additional food sources beside phytoplankton.
Contrary to copepods, the two other groups of dominant zooplankton, large size larvaceans and pteropods, demonstrated high rates of phytoplankton consumption (Table 4). We assume that this is related to their specific feeding mechanism – unselected collection of particles from the large water volume with mucous net (L. helicina) or “house” (O. vanhoeffeni). Even under low phytoplankton concentrations in autumn, these groups not only met the metabolic demands calculated as 6-9% and 3-5% of body carbon (after Lombard et al., 2005; Pasternak et al., 2017), but seemed to provide fast growth through solely herbivorous feeding.
The present study is the first attempt to estimate grazing impact on autotrophic phytoplankton in the Khatanga Gulf and adjacent shelf. Influence of the river runoff is manifested in the lowest grazing pressure (mean impact equaled 0.4% of Chl a) in the inner Gulf despite high zooplankton biomass. This is the result of the two main factors: first, an increased phytoplankton biomass (mainly, the freshwater assemblage) carried by the river runoff (Sukhanova et al., 2019), and second, negligible feeding rates of the absolute zooplankton dominant, L. macrurus. Age composition (solely adults) and low feeding rates point to the final phase of seasonal development of the population found in other estuarine arctic regions in September (Hirche et al., 2003; Drits et al., 2016). As the influence of the river discharge weakened, phytoplankton biomass decreased and grazing in the shelf area constituted, on average, 4% of Chl a. The mean consumption of the newly produced organic carbon by zooplankton over the shelf was also higher than in the Gulf (15 and 6% of primary production, accordingly) but the difference was not significant (p=0.07).
Grazing impact of copepods depends on phytoplankton size structure (e.g., Finkel et al., 2010) as the majority of these grazers consume particles <5 μm less efficiently than larger items (Levinsen et al., 2000). Size structure of phytoplankton communities in the Siberian Arctic seas varies depending on the impact of the river discharge, with larger phytoplankton cells (> 3 μm) prevailing under low salinity and relatively high water temperature in the estuaries, and picophytoplankton (< 3 μm) prevailing under high salinity and low water temperature on the shelf (Belevich et al., 2021; Demidov et al., 2021). Specifically, in the Khatnga Gulf, the share of picophytoplankton was about 10% of total Chl a, while on the shelf, the contribution increased to 35% (Belevich et al., 2021). If we re-calculate the estimated grazing pressure considering Chl a content of only the larger phytoplankton, the values will increase to 7% in the shelf area while will remain almost unchanged in the Gulf.
Zooplankton grazing pressure, assessed with the gut fluorescence approach in the Lena area in September 2015 (Arashkevich et al., 2018), followed the same trend: the lowest values (2% of Chl a and 1% of primary production) were found at low salinity and high temperature at closest to the Lena Delta stations. The values gradually increased up to 5% of Chl a and 6% of primary production with increase of salinity and decrease of temperature with the distance from the Delta. Similarly, our estimates showed highest grazing pressure of 4% of Chl a and 72% of primary production at the Lena plume edge (st. 5623) under higher salinity. Within the plume-influenced area, grazing impact did not exceed 1% of Chl a and 10% of primary production. Note that contrary to the negligible role of grazing by L. macrurus in September 2015 (Arashkevich et al., 2018), the species determined the total zooplankton grazing at st. 5596_2, most influenced by an increased freshwater inflow.
Conclusion
The results provide new information on the distribution, herbivorous feeding and grazing impact of the dominant zooplankton species in the poorly studied Khatanga as well as in the better studied Lena regions of the Laptev Sea at the end of the productive season.
We demonstrated that the influence of the Khatanga discharge on zooplankton composition differed from that of Lena. Strong tidal forcing which is a specific feature of the Khatanga estuary assumingly created a retention mechanism that prevented propagation of brackish zooplankton into the adjacent shelf area. As a result, the impact of Khatanga discharge on zooplankton composition was restricted mainly to the inner Gulf and was poorly recognized in the shelf area. On the contrary, Lena freshwater inflow governs the structure of zooplankton community over a vast shelf area. The wide distribution of brackish zooplankton within the shallow undiluted Lena plume indicates that there are no mechanisms of zooplankton retention in the vicinity of the Lena Delta. Distribution pattern of brackish species is highly variable in the Lena area due to variability in the plume extension largerly determined by wind forcing. Contrary to our expectations, zooplankton biomass and distribution of total biomass as well as grazing impact on phytoplankton over the shelf influenced by the Khatanga and Lena plumes were similar.
Analysis of our results on demographic structure of C. glacialis confirmed that timing of ice retreat is among the main factors controlling seasonal development of the population. A late ice breakup significantly impairs the chances of reaching the overwintering stage and surviving through winter. Comparison of our results with those obtained at the end of the previous century did not reveal considerable changes either in the composition of the dominant species or in the biomass of zooplankton under the impact of ongoing Arctic amplification.
Data Availability Statement
The original contributions presented in the study are included in the article/Supplementary Material. Further inquiries can be directed to the corresponding author.
Author Contributions
AP and AD equally contributed to the design of the study. AD, EA and MF performed the field data collection and and samples treatment. AP, AD and EA preapred and analyzed the data. AP and AD wrote the first draft of the manuscript. All authors contributed to manuscript revision, read, and approved the submitted version.
Funding
This work was performed according to State assignment of the Ministry of Science and Higher Education of the Russian Federation # FMWE-2021-0007.
Conflict of Interest
The authors declare that the research was conducted in the absence of any commercial or financial relationships that could be construed as a potential conflict of interest.
Publisher’s Note
All claims expressed in this article are solely those of the authors and do not necessarily represent those of their affiliated organizations, or those of the publisher, the editors and the reviewers. Any product that may be evaluated in this article, or claim that may be made by its manufacturer, is not guaranteed or endorsed by the publisher.
Supplementary Material
The Supplementary Material for this article can be found online at: https://www.frontiersin.org/articles/10.3389/fmars.2022.881383/full#supplementary-material
References
Abramova E. N. (1999). ““Composition, Abundance and Population Structure of Spring-Time Zooplankton in the Shelf Zone of Laptev Sea”,” in Land–Ocean Systems in the Siberian Arctic: Dynamics and History. Eds. Kassens H., Bauch H. A., Dmitrenko I., Eicken H., Hubberten H.-W., Melles M., et al (Berlin: Springer-Verlag), 161–168.
Abramova E. N., Sokolova V. A. (1999). About Findings and Life Cycle of Limnocalanus Johanseni (Copepoda, Calanoida) in the Lena Delta. Zoologicheskii Zhurnal. 78, 1360– 1363.
Abramova E., Tuschling K. (2005). A 12-Year Study of the Seasonal and Interannual Dynamics of Mesozooplankton in the Laptev Sea: Significance of Salinity Regime and Life Cycle Patterns. Global Planet. Change 48, 141–164. doi: 10.1016/j.gloplacha.2004.12.010
ACIA: Arctic Climate Impact Assessment – Scientific Report.(2005). Cambridge University Press, Cambridge
Arashkevich E. G., Drits A. V., Pasternak A. F., Flint M. V., Demidov A. B., Amelina A. B., et al. (2018). Distribution and Feeding of Herbivorous Zooplankton in the Laptev Sea. Oceanology. 58, 381–395. doi: 10.1134/S0001437018030013
Arashkevich E. G., Flint M. V., Nikishina A. B., Pasternak A. F., Timonin A. G., Vasilieva J. V., et al. (2010). The Role of Zooplankton in the Transformation of the Organic Matter in the Ob Estuary, on the Shelf, and in the Deep Regions of the Kara Sea. Oceanology 50, 780–792. doi: 10.1134/S0001437010050140
Atkinson A., Ward P., Murphy E. J. (1996). Diel Periodicity of Subantarctic Copepods: Relationships Between Vertical Migration, Gut Fullness and Gut Evacuation Rate. J. Plank. Res. I8, 1387–1405. doi: 10.1093/plankt/18.8.1387
Baars M. A., Franz H. G. (1984). Grazing Pressure of Copepods on the Phytoplankton Stock of the Central North Sea. Neth. J. Sea Res. 18, 120–142. doi: 10.1016/0077-7579(84)90028-0
Båmstedt U., Gifford D. J., Irigoien A., Atkinson A., Roman M. (2000). ““Feeding”,” in ICES Zooplankton Methodology Manual. Eds. Harris R., Wiebe P., Lenz J., Skjoldal H. R., Huntley M. (Amsterdam: Elsevier), 297–399.
Bauch D., Hölemann J. A., Nikulina A., Wegner C., Janout M. A., Timokhov L. A., et al. (2013). Correlation of River Water and Local Sea-Ice Melting on the Laptev Sea Shelf (Siberian Arctic). J. Geophys. Res. Oceans 118, 550–561. doi: 10.1002/jgrc.20076
Belevich T. A., Demidov A. B., Makkaveev P. N., Shchuka S. A., Flint M. V. (2021). Picophytoplankton Distribution Along Khatanga Bay-Shelf-Continental Slope Environment Gradients in the Western Laptev Sea. Heliyon 7, 1–9, e06224. doi: 10.1016/j.heliyon.2021.e06224
Berrick S. W., Leptoukh G., Farley J. D., Rui H., Hualan R. (2009). Giovanni: A Web service workflow-based data visualization and analysis system.. IEEE Transactions on Geoscience and Remote Sensing 47, 106–113. doi: 10.1109/TGRS.2008.2003183
Bochdansky A. B., Deibel D., Hatfield E. A. (1998). Chlorophyll a Conversion and Gut Passage Time for the Pelagic Tunicate Oikopleura Vanhoeffeni (Appendicularia). J. Plank. Res. 20, 2179–2197. doi: 10.1093/plankt/20.11.2179
Chislenko L. L. (1968). Nomograms for Determination of Weight of Aquatic Organisms by Size and Body Shape (Leningrad: Nauka (in Russian).
Corkett C. J., McLaren I. A., Sevigny J.-M. (1986). The Rearing of the Marine Calanoid Copepods Calanus Finmarchicus (Gunnerus), C. Glacialis Jaschnov and C. Hyperboreus Krøyer, With Comment on the Equiproportional Rule. Sylleogeus 58, 539–546.
Dagg M. J., Wyman K. D. (1983). Natural Ingestion Rates of the Copepods Neocalanus Plumchrus and Neocalanus Cristatus Calculated From Gut Contents. Mar. Ecol. Prog. Ser. 13, 37–46. doi: 10.3354/meps013037
Demidov A. B., Gagarin V. I., Arashkevich E. G., Makkaveev P. N., Konyukhov I. V., Vorobieva O. V., et al. (2019). Spatial Variability of Primary Production and Chlorophyll in the Laptev Sea in August–September. Oceanology 59, 678–691. doi: 10.1134/S0001437019050047
Demidov A. B., Sheberstov S. V., Gagarin V. I. (2020). Interannual Variability of Primary Production in the Laptev Sea. Oceanology 60, 50–61. doi: 10.1134/S0001437020010075
Demidov A. B., Sukhanova I. N., Belevich T. A., Flint M. V., Gagarin V. I., Sergeeva V. M., et al. (2021). Size-Fractionated Surface Phytoplankton in the Kara and Laptev Seas: Environmental Control and Spatial Variability. Mar. Ecol. Prog. Ser. 664, 59–77. doi: 10.3354/meps13652
Drits A. V., Pasternak A. F., Flint M. V.. (2021). Size-Fractionated Surface Phytoplankton in the Kara and Laptev Seas: Environmental Control and Spatial Variability. Mar. Ecol. Prog. Ser. 664, 59–77. doi: 10.3354/meps13652
Drits A. V., Arashkevich E. G., Nikishina A. B., Sergeeva V. M., Solovyev K. A., Flint M. V. (2015). Feeding of Dominant Zooplankton Species and Their Grazing Impact on Autotrophic Phytoplankton in the Yenisei Estuary in Autumn. Oceanology 55, 573–582. doi: 10.1134/S0001437015040049
Drits A. V., Pasternak A. F., Arashkevich E. G., Poyarkov S. G., Flint M. V. (2020). Distribution and Grazing of the Dominant Mesozooplankton Species in the Yenisei Estuary and Adjacent Shelf in Early Summer (July 2016). Cont. Shelf. Res. 201, 104133. doi: 10.1016/j.csr.2020.104133
Drits A. V., Pasternak A. F., Nikishina A. B., Semenova T. N., Sergeeva V. M., Polukhin A. A., et al. (2016). The Dominant Copepods Senecella Siberica and Limnocalanus Macrurus in the Ob Estuary: Ecology in a High-Gradient Environment. Polar Biol. 39, 1527–1538. doi: 10.1007/s00300-015-1878-6
D’souza A., Gauns M. (2018). Temporal Variability in Copepod Gut Pigments Over the Central Western Continental Shelf of India. J. Mar. Biol. Assoc. U. K. 98 (1), 149–159. doi: 10.1017/S0025315416001144
Eicken H., Reimnitz E., Alexandrov V., Martin T., Kassens H., Vieho T. (1997). Sea Ice Processes in the Laptev Sea and Their Importance for Sediment Transport. Cont. Shelf Res. 17, 205–233. doi: 10.1016/S0278-4343(96)00024-6
Fetzer I., Hirche H.-J., Kolosova E. G. (2002). The Influence of Freshwater Discharge on the Distribution of Zooplankton in the Southern Kara Sea. Polar Biol. 25, 404–415. doi: 10.1007/s00300-001-0356-5
Finkel Z. V., Beardall J., Flynn K. J., Quigg A., Rees T. A. V., Raven J. A. (2010). Phytoplankton in a Changing World: Cell Size and Elemental Stoichiometry. J. Plank. Res. 32, 119–137. doi: 10.1093/plankt/fbp098
Flint M. V., Anisimov E. M., Arashkevich E. G., Artemiev V. F., Bezzubova E. M., Belevich T. A., et al. (2021). Ecosystems of the Kara and Laptev Seas (Moscow: Erokhova Publ).
Flint M. V., Arashkevich E. G., Artemiev V. F., Baranov B. V., Bezzubova E. M., Belevich T. A., et al. (2018). Ecosystems of the Siberian Arctic Seas (Moscow: APR).
Flint M. V., Semenova T. N., Arashkevich E. G., Sukhanova I. V., Gagarin V. I., Kremenetskiy V. V., et al. (2010).Structure of the zooplankton communities in the region of the Ob River’s estuarine frontal zone. Oceanology 50;766779doi: 10.1134/S0001437010050139
Fofonova V., Danilov S., Androsov A., Janout M., Bauer M., Overduin P., et al. (2015). Impact of Wind and Tides on the Lena River Freshwater Plume Dynamics in the Summer Sea. Ocean Dyn. 65, 951–968. doi: 10.1007/s10236-015-0847-573
Fütterer D. K., Galimov E. M. (2003). ““Siberian River Run-Off Into the Kara Sea: Characterization, Quantification, Variability and Environmental Significance – an Introduction”,” in Siberian River Run-Off in the Kara Sea. Eds. Stein R., Fahl K., Fütterer D. K., Galimov E. M., Stepanets O. V. (Amsterdam: Elsevier Science), 1-8).
Gagnon M., Lacroix G. (1983). Distribution and grazing of dominant zooplankton species in the Ob Estuary: influence of the runoff regime.. Estuar. Coast. 40, 1082–1095. doi: 10.1007/s12237-016-0201-2
Gordeev V. V., Martin J. M., Sidorov I. S., Sidorova M. V. (1996). A Reassessment of the Eurasian River Input of Water, Sediment, Major Elements, and Nutrients to the Arctic Ocean. Am. J. Sci. 296, 664–691. doi: 10.2475/ajs.296.6.664
Hirche H. J., Fetzer I., Graeve M., Kattner G. (2003). Limnocalanus Macrurus in the Kara Sea (Arctic Ocean): An Opportunistic Copepod as Evident From Distribution and Lipid Patterns. Polar Biol. 26, 720–726. doi: 10.1007/s00300-003-0541-9
Hirche H. J., Kosobokova K. N., Gaye-Haake B., Harms I., Meon B., Nothig E.-M. (2006). Structure and Function of Contemporary Food Webs on Arctic Shelves: A Panarctic Comparison. The Pelagic System of the Kara Sea – Communities and Components of Carbon Flow. Prog. Oceanogr 71, 288–313. doi: 10.1016/j.pocean.2006.09.010
Holm-Hansen O., Lorenzen C. J., Holmes R. W., Strickland J. D. H. (1965). Fluorometric Determination of Chlorophyll. J. Conseil 30, 3–15. doi: 10.1093/icesjms/30.1.3
Hopcroft R. R., Roff J. C., Bouman H. A. (1998). Zooplankton Growth Rates: The Larvaceans Appendicularia, Fritillaria and Oikopleura in Tropical Waters. J. Plank. Res. 20, 539–555. doi: 10.1093/plankt/20.3.539
Ikeda T., Kanno Y., Ozaki K., Shinada A. (2001). Metabolic Rates of Epipelagic Copepods as a Function of Body Mass and Temperature. Mar. Biol. 139, 587–596. doi: 10.1007/s002270100608
Irigoien X. (1998). Gut Clearance Rate Constant, Temperature and Initial Gut Contents: A Review. J. Plank. Res. 20, 997–1003. doi: 10.1093/plankt/20.5.997
Jashnov V. A. (1940). Plankticheskaya Produktivnost’ Severnykh Morei SSSR (Plankton Productivity of the Northern Seas of the USSR) (Moscow: MOIP (in Russian).
Kosobokova K. N., Hanssen H., Hirche H.-J., Knickmeier K. (1998). Composition and Distribution of Zooplankton in the Laptev Sea and Adjacent Nansen Basin During Summer. Polar Biol. 19, 63–76. doi: 10.1007/s003000050216
Kosobokova K., Hirche H. J. (2001). Reproduction of Calanus Glacialis in the Laptev Sea, Arctic Ocean. Polar Biol. 24, 33–43. doi: 10.1007/s003000000171
Kwasniewski S., Hop H., Falk-Petersen S., Pedersen G. (2003). Distribution of Calanus Species in Kongsfjorden, a Glacial Fjord in Svalbard. J. Plank. Res. 25, 1–20. doi: 10.1093/plankt/25.1.1
Leu E., Søreide J. E., Hessen D. O., Falk-Petersen S., Berge J. (2011). Consequences of Changing Sea-Ice Cover for Primary and Secondary Producers in the European Arctic Shelf Seas: Timing, Quantity, and Quality. Prog. Oceanogr 90, 18–32. doi: 10.1016/j.pocean.2011.02.004
Levinsen H., Turner J. T., Nielsen T. G., Hansen B. W. (2000). On the Trophic Coupling Between Protists and Copepods in Arctic Marine Ecosystems. Mar. Ecol. Prog Ser. 204, 65–77. doi: 10.3354/meps204065
Lischka S., Knickmeier K., Hagen W. (2001). Mesozooplankton Assemblages in the Shallow Arctic Laptev Sea in Summer 1993 and Autumn 1995. Polar Biol. 24186–, 199. doi: 10.1007/s003000000195
Lombard F., Sciandra A., Gorsky G. (2005). Influence of Body Mass, Food Concentration, Temperature and Filtering Activity on the Oxygen Uptake of the Appendicularian Oikopleura Dioica. Mar. Ecol. Prog. Ser. 301, 149–158. doi: 10.3354/meps301149
Mackas D. L., Bohrer R. N. (1976). Fluorescence Analysis of Zooplankton Gut Contents and Investigation of Diel Feeding Patterns. J. Exp. Mar. Biol. Ecol. 25, 77–85. doi: 10.1016/0022-0981(76)90077-0
Matthews J. B. L., Hestad L. (1977). Ecological Studies on the Deep-Water Pelagic Community of Korsfjorden, Western Norway. Length/weight Relationships for Some Macroplanktonic Organisms. Sarsia 63, 57–63. doi: 10.1080/00364827.1977.10411322
McClelland J. W., Holmes R. M., Dunton K. H., Macdonald R. W. (2011). The Arctic Ocean Estuary. Estuaries Coasts 35, 353–368. doi: 10.1007/s12237-010-9357-3
McLaren I., Corkett C. (1981). Temperature-Dependent Growth and Production by a Marine Copepod. Can. J. Fish. Aquat. Sci. 38, 77–83. doi: 10.1139/F81-010
Menden-Deuer S., Lessard E. J. (2000). Carbon to Volume Relationships for Dinoflagellates, Diatoms, and Other Protist Plankton. Limnol. Oceanogr 45, 569–579. doi: 10.4319/lo.2000.45.3.0569
Menéndez M. C., Piccolo M. C., Hoffmeyer M. S. (2012). Short-Term Variability on Mesozooplankton Community in a Shallow Mixed Estuary (Bahía Blanca, Argentina): Influence of Tidal Cycles and Local Winds. Est. Coast. Shelf Sci. 112, 11–22. doi: 10.1016/j.ecss.2011.08.014
Morgan C. A., Cordell J. R., Simenstad C. A. (1997). Sink or Swim? Copepod Population Maintenance in the Columbia River Estuarine Turbidity-Maxima Region. Mar. Biol. 129, 309–317. doi: 10.1007/s002270050171
Nghiem S. V., Hall D. K., Rigor I. G., Li P., Neumann G. (2014). Effects of Mackenzie River Discharge and Bathymetry on Sea Ice in the Beaufort Sea. Geophys. Res. Lett. 41, 873–879. doi: 10.1002/2013GL058956
Osadchiev A., Frey D., Spivak E., Shchuka S., Tilinina N., Semiletov I. (2021). Structure and Inter-Annual Variability of the Freshened Surface Layer in the Laptev and East-Siberian Seas During Ice-Free Periods. Front. Mar. Sci. 8. doi: 10.3389/fmars.2021.735011
Osadchiev A. A., Medvedev I. P., Shchuka S. A., Kulikov M. E., Spivak E. A., Pisareva M. N., et al. (2020). Influence of Estuarine Tidal Mixing on Structure and Spatial Scales of Large River Plumes. Ocean Sci. 16, 1–18. doi: 10.5194/os-16-1-2020
Overland J., Hanna E., Hanssen-Bauer I., Kim S.-J., Walsh J., Wang M., et al. (2019). [The Arctic] Surface Air Temperature [in “State of the Climate in 2018”]. Bull. Amer. Meteor. Soc 100 (9), S142– S144. doi: 10.1175/2019BAMSStateoftheClimate.1
Pasternak A. F. (1994). Gut Fluorescence in Herbivorous Copepods: An Attempt to Justify the Method. Hydrobiologia, 292/293 241–248. doi: 10.1007/BF00229947
Pasternak A., Arashkevich E., Reigstad M., Wassmann P., Falk-Petersen S. (2008). Dividing Mesozooplankton Into Upper and Lower Size Groups: Applications to the Grazing Impact in the Marginal Ice Zone of the Barents Sea. Deep-Sea Res. II. 55, 2245–2256. doi: 10.1016/j.dsr2.2008.05.002
Pasternak A. F., Drits A. V., Flint M. V. (2017). Feeding, Egg Production, and Respiration Rate of Pteropods Limacina in Arctic Seas. Oceanology 57, 122–129. doi: 10.1134/S000143701701012X
Perovich D., Meier W., Tschudi M., Farrell S., Hendricks S., Gerland S., et al. (2019). [The Arctic] Sea Ice Cover [in “State of the Climate in 2018”]. Bull. Amer. Meteor. Soc 100 (9), S146– S150. doi: 10.1175/2019BAMSStateoftheClimate.1
Peterson W. T., Painting S., Barlow R. (1990). Feeding Rates of Calanoides Carinatus: A Comparison of Five Methods Including Evaluation of the Gut Fluorescence Method. Mar. Ecol. Prog. Ser. 63, 85–92. doi: 10.3354/meps063085
Peters J., Tuschling K., Brandt A. (2004). Zooplankton in the Arctic Laptev Sea - Feeding Ecology as Indicated by Fatty Acid Composition. J. Plank. Res. 26, 227–234. doi: 10.1093/plankt/fbh017
Rogachev K. A., Pomerleau C., Shlyk N. V., Carmack E. C. (2022). Joint Effects of Sea Ice Melt, Freshwater Discharge and Tidal Currents on Zooplankton Abundance in the Sea of Okhotsk: 2004 and 2013. Polar Sci. 31100781. doi: 10.1016/j.polar.2021.100781
Søreide J. E., Falk-Petersen S., Hegseth E. N., Hop H., Carroll M. L., Hobson K. A., et al. (2008). Seasonal Feeding Strategies of Calanus in the High-Arctic Svalbard Region. Deep-Sea Res. II. 55, 2225–2244. doi: 10.1016/j.dsr2.2008.05.024
Saiz E., Calbet A. (2011). Copepod Feeding in the Ocean: Scaling Patterns, Composition of Their Diet and the Bias of Estimates Due to Microzooplankton Grazing During Incubations. Hydrobiologia 666, 181–196. doi: 10.1007/s10750-010-0421-6
Skjoldal H. R., Aarflot J. M., Bagøien E., Skagseth Ø., Rønning J., Lien V. S. (2021). Seasonal and Interannual Variability in Abundance and Population Development of Calanus Finmarchicus at the Western Entrance to the Barents Se–2019. Prog. Oceanogr 195, 102574. doi: 10.1016/j.pocean.2021.102574
Sorokin Y. I., Sorokin P. Y. (1996). Plankton and Primary Production in the Lena Delta Estuary and in the South-Eastern Laptev Sea. Estuar. Coast. Shelf Sci. 43, 399–418. doi: 10.1006/ecss.1996.0078
Steinberg D. K., Landry M. R. (2017). Zooplankton and the Ocean Carbon Cycle. Annu. Rev. Mar. Sci. 9, 413–444. doi: 10.1146/annurev-marine-010814-015924
Sukhanova I. N., Flint M. V., Fedorov A. V., Sakharova E. G., Artemyev V. A., Makkaveev P. N., et al (2019). Phytoplankton of the Khatanga Bay, Shelf and Continental Slope of the Western Laptev Sea. Oceanology 59, 648–657. doi: 10.1134/S0001437019050205
Terhaar J., Lauerwald R., Regnier P., Gruber N., Bopp L. (2021). Around One Third of Current Arctic Ocean Primary Production Sustained by Rivers and Coastal Erosion. Nat. Commun. 12, 169. doi: 10.1038/s41467-020-20470-z
Timofeeva A. B., Sharatunova M. V. (2021). Multiyear Variability of the Fast Ice Thickness in the Laptev Sea According to the Polar Station Data. Russian Arctic 12, 62–76. doi: 10.24412/2658-4255-2021-1-62-76
Tiselius P. (1988). Effects of Diurnal Feeding Rhythms, Species Composition and Vertical Migration on the Grazing Impact of Calanoid Copepods in the Skagerrak and Kattegat. Ophelia 28 (3), 215–230. doi: 10.1080/00785326.1988.10430814
Valdés V., Escribano R., Vergara O. (2017). Scaling Copepod Grazing in a Coastal Upwelling System: The Importance of Community Size Structure for Phytoplankton C Flux. Lat. Am. J. Aquat. Res. 45 (1), 41–54. doi: 10.3856/vol45-issue1-fulltext-5
van der Jagt H., Wiedmann I., Hildebrandt N., Niehoff B., Iversen M. H. (2020). Aggregate Feeding by the Copepods Calanus and Pseudocalanus Controls Carbon Flux Attenuation in the Arctic Shelf Sea During the Productive Period. Front. Mar. Sci. 7. doi: 10.3389/fmars.2020.543124
Vinogradov M. E., Shushkina E. A. (1987). Functioning of the Plankton Communities in Ocean Pelagic (Moscow: Nauka (in Russian).
Vinogradov M. E., Shushkina E. A., Lebedeva L. P., Gagarin V. I. (1995). Mesoplankton of the East Kara Sea and the Ob and Yenisei River Estuaries. Oceanology 34, 646–652.
Keywords: Laptev sea, zooplankton distribution, Khatanga, Lena, river plume, herbivorous feeding, gazing impact
Citation: Pasternak A, Drits A, Arashkevich E and Flint M (2022) Differential Impact of the Khatanga and Lena (Laptev Sea) Runoff on the Distribution and Grazing of Zooplankton. Front. Mar. Sci. 9:881383. doi: 10.3389/fmars.2022.881383
Received: 22 February 2022; Accepted: 18 March 2022;
Published: 08 April 2022.
Edited by:
Alexander Yankovsky, University of South Carolina, United StatesReviewed by:
Atsushi Yamaguchi, Hokkaido University, JapanJoshua Stone, University of South Carolina, United States
Copyright © 2022 Pasternak, Drits, Arashkevich and Flint. This is an open-access article distributed under the terms of the Creative Commons Attribution License (CC BY). The use, distribution or reproduction in other forums is permitted, provided the original author(s) and the copyright owner(s) are credited and that the original publication in this journal is cited, in accordance with accepted academic practice. No use, distribution or reproduction is permitted which does not comply with these terms.
*Correspondence: Anna Pasternak, cGFzdGVybmFrYW5uYUBob3RtYWlsLmNvbQ==