 Shenglong Yang
 Han Zhang
 Wei Fan1,2
 Sanling Yuan
94% of researchers rate our articles as excellent or good
Learn more about the work of our research integrity team to safeguard the quality of each article we publish.
Find out more
ORIGINAL RESEARCH article
Front. Mar. Sci., 09 June 2022
Sec. Marine Conservation and Sustainability
Volume 9 - 2022 | https://doi.org/10.3389/fmars.2022.881036
This article is part of the Research TopicApplication of Machine Learning in Oceanography and Marine SciencesView all 7 articles
Understanding the spatial pattern of human fishing activity is very important for fisheries resource monitoring and spatial management. To understand the spatial distribution of tuna purse seiner operations in the western and central Pacific Ocean and its relationship with the marine environment, this paper uses the AIS data of the western and central Pacific Tuna purse seiners from 2015 to 2020 to excavate spatial fishing effort information, which is combined with 24 marine environmental factors in the same period, including sea surface and subsurface levels using the boosted regression trees (BRT) model and general additive model (GAM) to construct the nonlinear relationship between the spatial distribution of fishing effort and marine ecological environmental factors and to discuss and analyse the niche of tuna purse seiners in the high seas. The results show that the average score of cv-AUC (cross-validated area under the curve) obtained by the BRT model training reaches 0.93, the average accuracy rate is 0.84, and the explained deviance is 43%; the average score of AUC (area under the curve) obtained by the GAM model training reaches 0.81, the average accuracy rate is 0.77, and the explained deviance is 34%. The results of BRT prior to GAM model. Using the BRT model for prediction, the results show that the average cv-AUC score for forecasting fishing effort in 2020 reaches 0.83, and the average accuracy rate of overall classification reaches 0.77. The results of factor analysis show that the water temperature at 100 m depth and longitude are the most important factors affecting the fishing effort of tuna purse seiners, and their contribution rates to the fishing effort of vessels are 12.38% and 9.76%, respectively, followed by sea surface temperature, latitude and DSH. The contribution to the fishing effort of tuna purse seiners was also large, accounting for 9.57%, 8.75%, and 7.11%, respectively; the 100-meter-deep chlorophyll and temperature gradient value contributed the least, 1.44% and 1.16%, respectively; tuna purse seiners are more likely to operate in the 100-metre water temperature of 25-29°C and sea surface temperature of 29-31°C. In terms of space, tuna purse seiners are more likely to operate in the 5°S-5°N latitudinal region and near the western sea area of 180°E. It is predicted that the modelled fishing effort of fishing vessels in 2020 and the actual fishing effort of fishing vessels have a relatively good spatial distribution. Research helps to understand the environmental impact of changes in the spatial distribution of tuna purse seiners and provides support for the management of tuna purse seine vessels in the western and central Pacific.
As an economically important species in marine fishery resources, tuna (Thunnini) is the most commercially valuable fish in the world. Tuna possess high-speed and deep-water swimming abilities. Field surveys or release data are used to analyse and understand the habitat of tuna and its environmental choices. In fact, tuna populations have declined, on average, by 60% over the past half century (Juan-Jordá et al., 2011). In the context of the global decline of tuna resources (Costello, 2016), protection and sustainable development and utilization of tuna fishery resources are highly valued by countries and organizations around the world.
Marine environmental factors are important external factors that affect tuna activities and distribution. Researchers have carried out a large number of related studies. Studies have shown that the vertical structure of variables such as temperature and dissolved oxygen profoundly influence the swimming distribution and survivability of tuna in the water column (Lan et al., 2017; Abascal et al., 2018; Yang et al., 2021). The salinity, SSH, chlorophyll-a, and primary production also have important effects on the spatial distribution of tuna (Briand et al., 2011; Arrizabalaga et al., 2015; Nataniel et al., 2021). Environmental changes will alter the horizontal and vertical spatial distribution patterns of suitable habitat environment for tuna (Nicol, 2014). But most studies are based on commercial fishing data for research and analysis. The spatial and temporal resolution of regional tuna tissue data is too coarse, and the commercial log data of various countries are not complete enough, and contain errors. There are space limitations and time discontinuities in survey data or sign data, especially in the high seas (Taconet et al., 2019) which limits the results of the research.
Fishermen tracks fish populations based on their experience and the marine environment conditions and catch them. Fishing vessels adjust their fishing space position and fishing method according to the spatial change of tuna resources, in order to obtained the maximum economic benefit. Changes in the distribution patterns of tuna in horizontal space and swimming layers will ultimately affect the spatial distribution and fishing efficiency of surface fishing vessels (Arnaud et al., 2002). Meanwhile, Ecosystem-based fisheries management must understand the impact of fishing activities, such as habitat destruction or ecological community changes related to fishing activities. Monitoring tuna vessels fishing activity and predicting and managing the future are also important to ecosystem-based tuna fisheries management (Guillermo et al., 2018). Therefore, understanding the relationship between tuna fishing vessels operation and environmental could provide more realistic fishery information for fishery fishing intensity and fishery resource management.
The Automatic Identification System (AIS) trajectory information of vessels contains the unique attributes, states and spatial behavior characteristics of vessels. To a certain extent, it reflects the direct interaction between the fishing behavior of vessels and various elements in the environment. Based on the trajectory of the vessel, it is possible to mine the time and space high-precision fishing effort information, which provides a new avenue for fishery analysis (Hsu et al., 2021). In recent years, this information has been used to analyse and understand the characteristics of fishing vessel behaviours and the impact of the marine environment (Wang et al., 2016; Debrah et al., 2018; Guillermo et al., 2018; Megan et al., 2019). The above studies indicate that the distribution of fishing effort (FE) is environmentally structured and can be explained and projected using species distribution models together with information on the environment surrounding the fishing observations (Guillermo et al., 2018).
Two species distribution models, boosted regression trees (BRT) and generalised additive models (GAM), which have been used to explore the distribution of marine species related to environmental factors (Melomerino and Fath, 2020). The GAM model is a semi-parametric extension of the generalized linear model that not only smoothes the predictors independently, but also calculates the magnitude of the response change in an additive way (Wood and Augustin, 2002). The BRT model combines two algorithms in statistics and machine learning, namely classification regression and boosting technology, and makes predictions by establishing and combining a large number of simple decision tree models to avoid overfitting (Elith et al., 2008). Both models can directly handle the nonlinear relationship between the response variable and multiple explanatory variables, have been successfully used for environmental niche analysis of offshore fishing fleets (Wang et al., 2016; Debrah et al., 2018) and pelagic longline tuna fleets (Guillermo et al., 2018; Megan et al., 2019). However, there is evidence that BRT performs better and handles spatial autocorrelation in a better fashion (Susana and Cabral, 2015).
Tuna production mainly comes from tuna purse seiners and tuna longline vessels, of which tuna purse seiners dominate. At present, from the perspective of global tuna purse seine fishing, there are few studies on the utilization of high seas resources by human fishing activities, especially for regional reports. The western and central Pacific are the primary operating areas of tuna purse seiners, the relationship between tuna purse seiners distribution and environmental factors have not been discussed. In this paper, by mining the fishing effort information of tuna purse seiners in the Central and Western Pacific, based on GAM and BRT in deep learning, environmental impact models of the distribution of vessel operations are constructed, and the accuracy are compared and predicted to extract fishery information. Exploring the environmental driving factors of the spatial distribution of tuna purse seine fleets in the Western and Central Pacific, provide support for the management of tuna fishery resources.
According to the literature (Deary et al., 2015; Zhou et al., 2021; Yang et al., 2022), the living environment of tuna is affected by environmental variables such as temperature, sea surface height, salinity, chlorophyll, dissolved oxygen, and primary productivity. The spatial distribution of vertical activities has a certain relationship with subsurface environmental factors. Therefore, this research is based on the official website of the Copernicus Marine Environment Monitoring Service (CMEMS) (https://resources.marine.copernicus.eu/?option=com_csw&task=results%3Foption%3Dcom_csw&task=results) to download marine remote sensing environmental data.
Several geographic variables, such as distance to shore (DSH) and distance to port (DPT), as well as bathymetry (depth), may influence the operation of vessels. The above three variables were selected as model input variables in this paper and downloaded from https://globalfishingwatch.org/data-download/.
Previous research also suggest that the temperature gradient value, the thermocline temperature and the eddy kinetic energy (EKE), have an important influence on tuna activities and fishing by fishing boats (Yang et al., 2012; Hsu et al., 2021). This paper adopted the three variables as input variables. The three variables were calculated based on download remote sensing environmental data (Pratt et al., 1991; Igor and O’Reilly, 2009; Paul, 2010). At last, 25 environmental factors were considered as the model input variables and the symbolic representation and meaning of input variables are shown in Table 1.
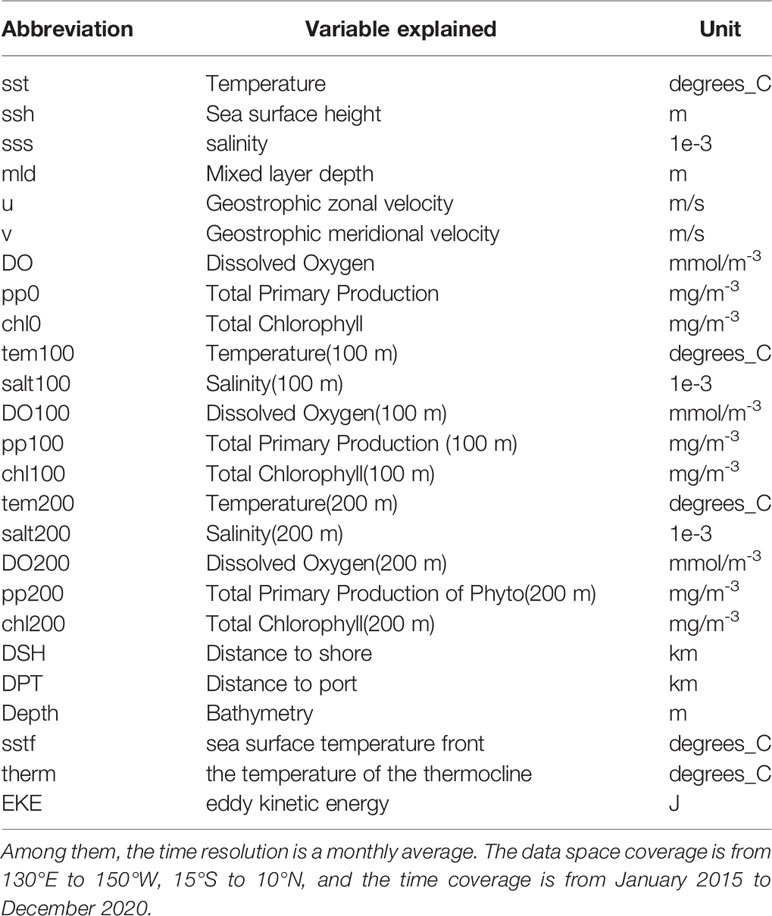
Table 1 List of environmental data.
Use information on the fishing operations of tuna purse seiners in the western and central Pacific was gathered. The vessel fishing types and AIS-based fishing effort information are all from the global fishing watch (https://globalfishingwatch.org/). The data provide the global vessel sailing time and fishing operation time from 2000 to 2020. The fishing effort information in this paper uses the daily operating time data of each Maritime Mobile Service Identify (MMSI) number provided by the organization with a spatial accuracy of 0.1°. The data include date, latitude and longitude, MMSI, sailing time and fishing time. Of these, the fishing operation time data of vessels are recognized by the convolutional neural network model (Kroodsma et al., 2018a). Tuna Seine fishing effort and the number of fishing vessels operating in the central and western Pacific in 2012-2020 are shown in the Figure 1.
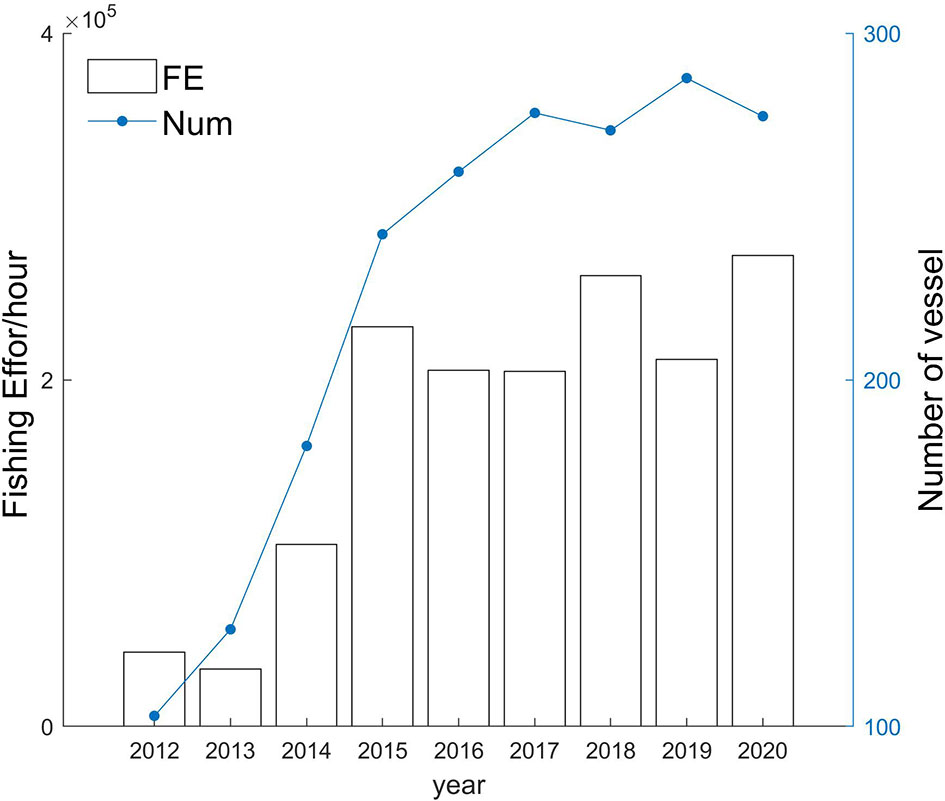
Figure 1 The fishing effort and number of fishing vessels during 2012-2020.(FE, Fishing effort; Num, Number of vessels).
The fishing effort and the number of vessels in operation clearly present two stages, namely, before 2015 and after 2015. After 2015, the spatial distribution of tuna purse seine vessels in the western and central Pacific Oceans is shown in the figure (see Figure 2). The fishing effort information is mainly distributed on both sides of the equator, so the study area in this paper is defined as (130°-210°E; 15°S-10°N). According to (Kroodsma et al., 2018a; Kroodsma et al., 2018b), the spatial resolution is defined as 0.5°×0.5°.We pre-processed environmental data and the fishing effort information with a spatial resolution of 0.5°×0.5°. This article uses fishing effort of vessels after 2015, with a total of 519,676 pieces of data.
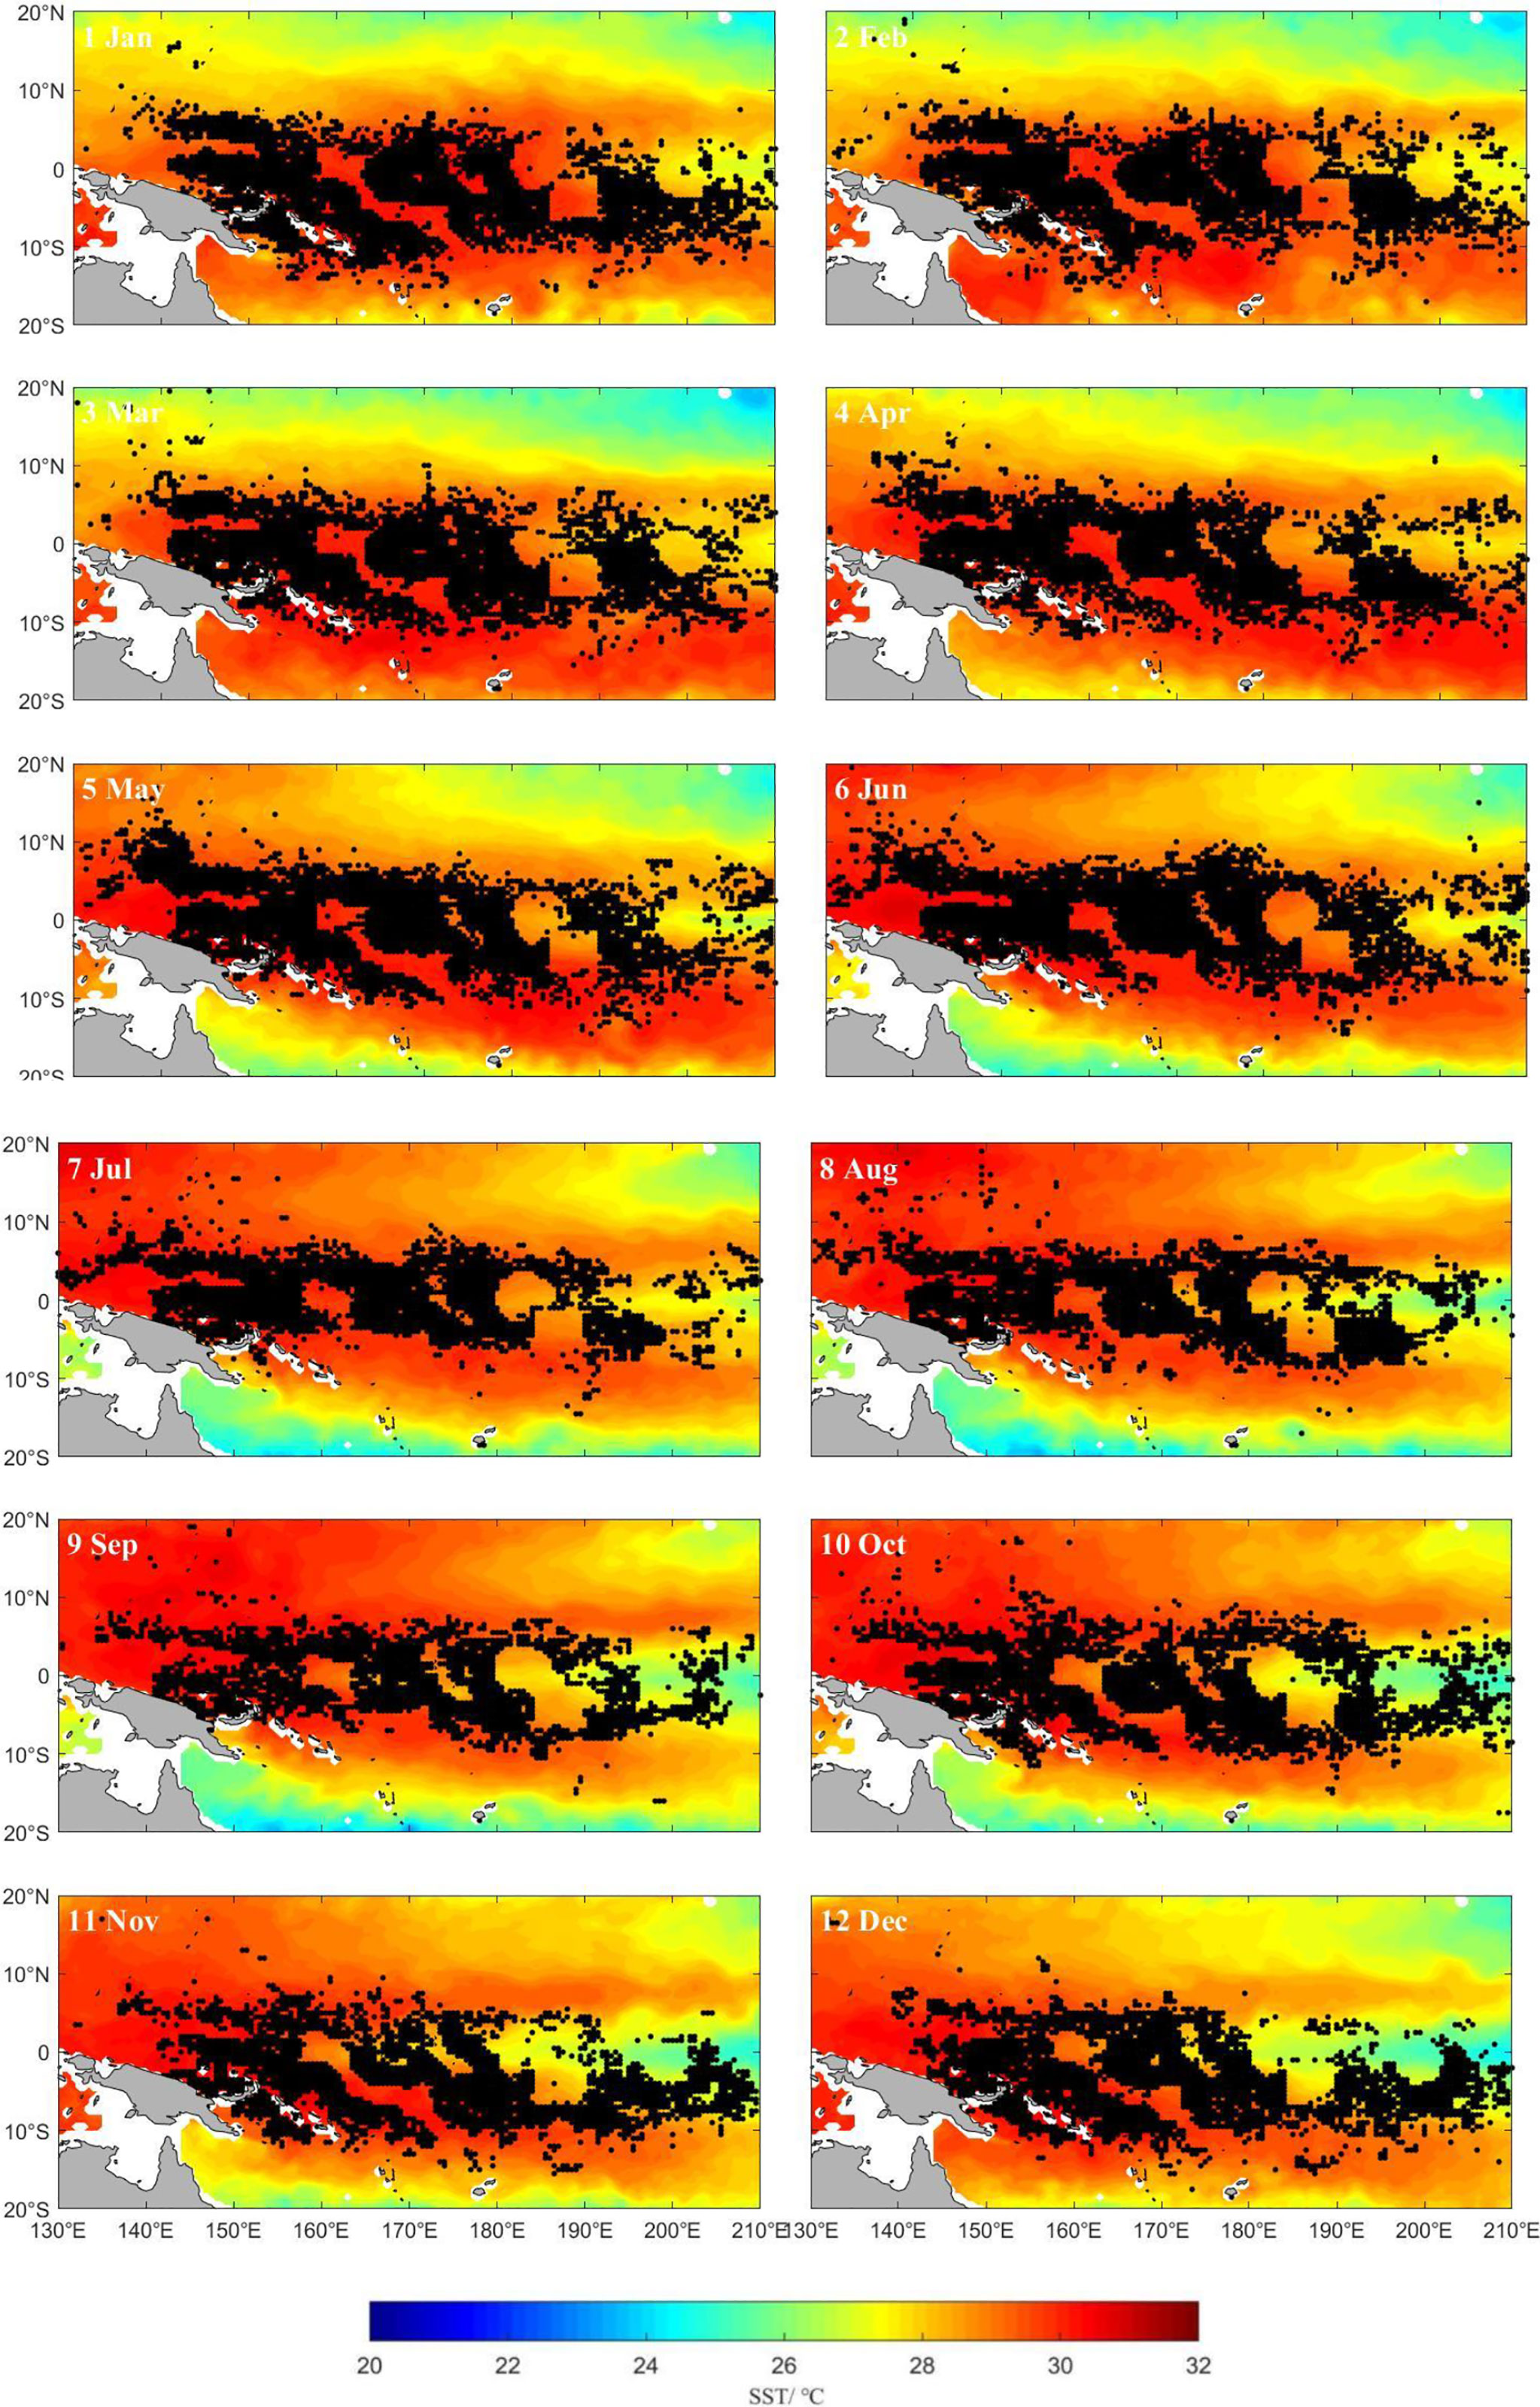
Figure 2 Spatial distribution of tuna purse seiners.
In multiple regression, if two or more independent variables may be correlated with each other, the occurrence of multicollinearity will affect the stability of the model. If the variables have an approximately linear relationship with each other, that is, multicollinearity, the accuracy of the model will be seriously affected. Therefore, we evaluated multicollinearity by calculating the score of the variance inflation factor (VIF). The larger the VIF is, the greater the possibility of collinearity between the independent variables. If the VIF exceeds 10, the regression model has serious multicollinearity. We take the method of deleting related variables to reduce the VIF value, here, one is deleted and the other enters the model.
Boosted regression trees (BRTs) are a tree prediction model that is a hierarchical structure composed of nodes and directed branches. Boosting is a machine learning algorithm that can promote a weak learner to a strong learner and can also be used to reduce the bias in supervised learning. It is an adaptive method used to combine simple linear models to improve prediction performance. Regression trees are a type of decision tree that finds the most reliable branch basis by minimizing variance. The regression decision tree uses the maximum mean square error to divide the nodes, and the mean of each node sample is used as the regression prediction value of the test sample. A boosted regression tree randomly selects a certain amount of data multiple times during the calculation process, analyses the degree of influence of the independent variable on the dependent variable, and uses the remaining data to test the fitting result. Finally, the generated multiple regression is averaged and output. The BRT model can be written as the sum of R classification regression trees:
The training model in this article mainly determines three parameters: tree complexity (tc), learning rate (lr), and bagging fraction. According to the literature (Elith and Leathwick, 2010; Gao, 2016), the complexity of a single tree is set to 3, the learning rate is 0.01, and the bagging fraction is 0.5. We use the Bernoulli Distribution. A grid fishing effort greater than 0 is recorded as “1”, and a fishing effort with a null value is recorded as “0”. The study uses the gbm.step function of the dismo package in R for BRT model training. Return cv-AUC (cross-validated area under the curve) and explained variance to a large extent verify the accuracy of model training. The cross-validation method used to determine the optimal number of trees to select the final BRT model.
The generalized additive model (GAM) is a nonparametric analytical model that describes the nonlinear relationship between response variables and multiple explanatory variables. In this paper, a GAM model is also constructed to discuss the effects of spatiotemporal and environmental variables on fishing effort. The research uses the mgcv program package in R to build a GAM model for calculation. Here, all variables are added to build the model monthly, which is consistent with the BRT model. The GAM model also uses the Bernoulli distribution function to classify all fishing efforts into two categories. The GAM model is selected with the smallest Akaike information criterion (AIC) value, and the optimal function is selected automatically by the model.
The BRT model returns cv-AUC and explained deviance, which to a large extent verifies the accuracy of model training. The GAM model also returns AUC and explained deviance. Different model training results are used for prediction. Here, the predicted response variable values are dichotomized with the mean value as the boundary. Values smaller than the predicted mean are recorded as “0”, and values larger than the predicted mean are recorded as “1”. We establish a two-category confusion matrix between the actual value and the predicted value. The confusion Matrix function of the caret package in R was used to obtain the two classification matrices to determine the accuracy, TPR (true positive rate) and TNR (true negative rate).
The prediction results returned by the model training can be compared with the actual data to calculate the model training accuracy. In this study, predicted presence and absence were separated by the mean probability distribution thresholds. Generally, accuracy is the most commonly used empirical measurement parameter to measure whether a model is effective, and it is an index to measure classification accuracy. A better model was selected according to the accuracy and explained deviance. The research uses the better model trained on the 2015-2019 data to predict the fishing effort in 2020, and the calculated accuracy can directly reflect the overall accuracy of the model’s prediction.
This study processes the 19 dynamic environmental factors and the calculated temperature gradient, thermocline temperature and 22 EKE variables in total to establish a regression model for the fishing effort of the vessel and calculate the score of the variance inflation factor. The results show that the highest score is therm, and the VIF score reached 55. There was a serious multicollinearity problem among the 22 independent variables obtained. The correlation coefficients between 22 independent variables were calculated, and the results are shown in Supplementary Material.
The results show that therm and sst, chl0 and pp0, and tem200 and sss are all highly correlated, and the correlation coefficients are all above 0.9. To avoid the influence of multicollinearity on the model, according to a study of tuna habitat conditions and marine environmental factors by relevant scholars, we deleted chl0 and tem200 for reference and kept pp0 and salt200. Between therm and sst, related studies have shown that sea surface temperature has an important influence on the distribution of purse seine tuna fishing grounds. This article chooses sst.
Figure 2 shows the monthly distribution of the spatial trajectory points of the tuna purse seine from 2015 to 2019. According to the trajectory of the vessel in the image, the space coverage of the vessel is 140°-210°E, 15°S-10°N. There was no significant change in the area covered by vessels from January to June. Starting in July, the concentrated area of vessels decreased and was mainly distributed near the equator, with the lowest number of vessel locations in September. Starting in October, the area of vessels expanded to the south.
The study took the fishing effort of the tuna purse seine vessel as the dependent variable. The 19 environmental variables were finally obtained by correlation analysis, DSH, DPT, depth, and the spatial index longitude and latitude. A total of 24 variables were used as independent variables for BRT modelling using the Bernoulli distribution. The training results are shown in Supplementary Material. The average explained deviance of the training dataset is 43%, the average score of cv-AUC is 0.93, the average training TPR score is 0.93, the TNR score is 0.83, and the overall training accuracy rate is 0.84.
In this study, the same data are trained by the GAM model, and the parameters are shown in Supplementary Material. The average explained deviance of the training dataset is 34%, the average score of AUC is 0.81, the average training TPR score is 0.86, the TNR score is 0.76, and the overall training accuracy rate is 0.77.
The BRT model predicts the accuracy of the new data results, as shown in Supplementary Material. The model trained on the 2015-2019 data is used to predict the fishing effort in 2020. The predicted value and the actual fishing effort in 2020 to establish a two-category confusion matrix to calculate the parameter results from January to December. According to the data in the table, the average cv-AUC score was 0.83, the average predicted TPR score was 0.70, the TNR score was 0.79, and the overall prediction accuracy rate was 0.77. Among them, the average accuracy of forecasts from July to September is above 0.8. The above indicators indicate that the model has good predictive performance.
Figure 3 is a superimposed spatial map of the fishing effort predicted by the model in 2020 and the actual fishing effort of fishing vessels in 2020. The image shows that each month has a good spatial distribution contrast.
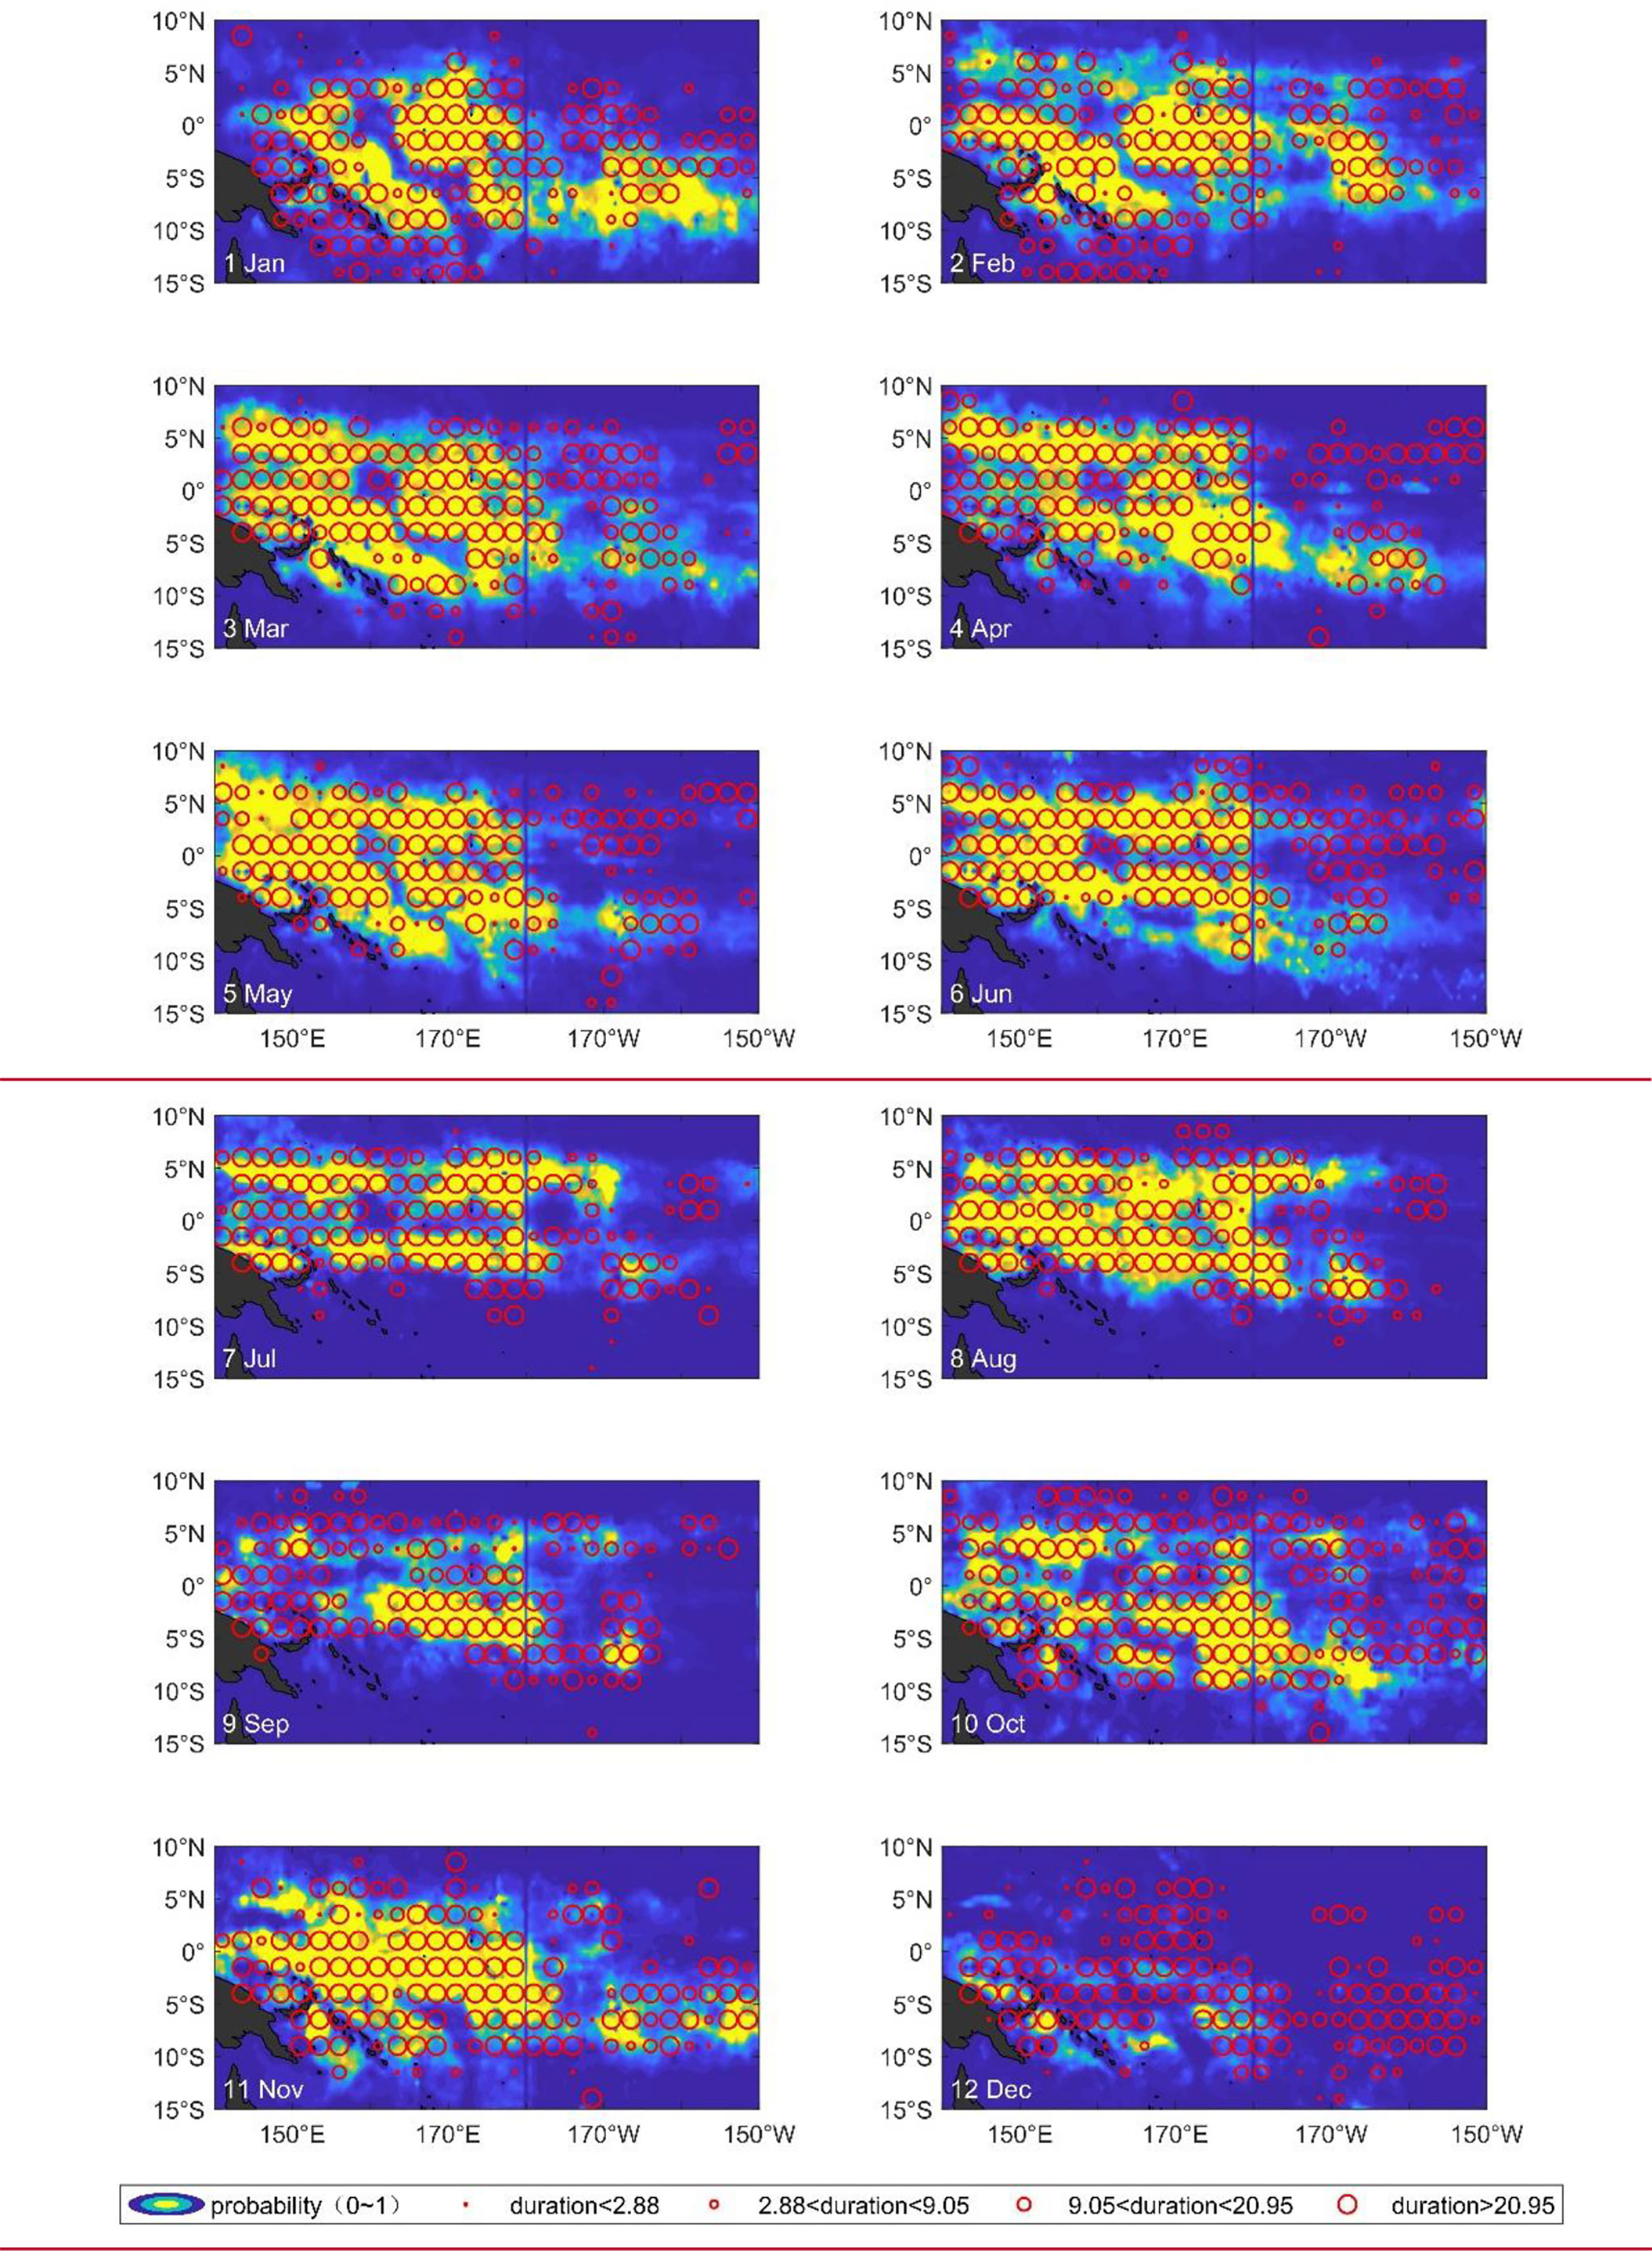
Figure 3 Fishing effort superimposed comparison.
Based on the results of two model, the BRT model was used to assess the effects of key environmental parameters on potential tuna purse seine fisheries. According to the space map from January to June, the areas with the largest amount of fishing effort predicted by vessels are concentrated in 150°E to 160°W and 10°S to 5°N. The images in January and February show that there are three areas with significant fishing effort-intensive forecasts [(1) 150°E to 170°E, south of the equator to 10°S; (2) 165°E to 180°, 5°S to 5°N; and (3) 170°W to 155°W, south of the equator to 10°S]. The actual fishing effort of vessels covers these three dense areas and spreads in these three areas. The images in March and April showed that the third fishing effort intensive area disappeared, but the first two areas expanded and merged and concentrated at 140°E to 180°, 10°S to 5°N, and the actual fishing effort also has the corresponding change trend. Compared with March and April, the images in May and June have no obvious change trend.
From July to December, the concentrated area of the spatial image decreased significantly. The images in July, August, and September show that starting in July, the predicted fishing effort area has decreased and become more discrete, extending eastward as a whole, and the actual fishing effort of vessels has also decreased. Until October, the forecasted fishing effort area of vessels in October and November became larger and concentrated in 140°E to 170°W, 10°S to 5°N, and the actual fishing effort of vessels increased. By December, the image predicts that the fishing effort of vessels will be less spatially distributed mainly in some small areas from the south of the equator to 10°S. The actual fishing effort of the vessels, that is, the staying time of the vessels in the unit grid, is more consistent with the area where the fishing effort of the vessels is concentrated every month.
The average contribution rate of the variable value to the fishing effort of the vessel see Supplementary Material for details. It can be seen from the bar chart as a whole that tem100 and lon are the most important factors affecting the fishing effort of tuna purse seiners, and their contribution rates to the fishing effort of vessels are 12.38% and 9.76%, respectively; second, sst, lat and DSH have an effect on tuna. The fishing effort of purse seine vessels also contributed significantly, accounting for 9.57%, 8.75%, and 7.11%, respectively. The cumulative contribution rate of 5 variables, including tem100, sst, latitude and longitude and DSH, reached 47.56%. Among them, sss, pp0, ssh, salt200, DO, and DO200 also have a certain influence, and the contribution rate is basically approximately 4%. The contribution rate of salt100, DPT, mld, and u is relatively small, basically approximately 3%; the contribution rate of DO100, pp200, pp100, chl200, v to the fishing effort of vessels is approximately 2%; and Depth, EKE, chl100, and sstf have the smallest contribution rates, basically approximately 1%.
Figure 4 is an image of the relationship between important environmental variables and predictive factors in each month. The figure reflects the range of environmental factors corresponding to the most likely fishing effort and the specific contribution rate of environmental factors. The first four important environmental variables in each month explain the contribution rate to the predictive factors. Figures (a) to (l) are, respectively January to December. Among them, the monthly results of Figures (a), (b), (c), (d), (e), (i), (j), (k), (l) show that the contribution of tem100 to the fishing effort of fishing vessels are all between 10% and 20%, tem100 is concentrated at 25-29°C, and the curve fluctuates greatly. Second, the explanation rate of sst and DSH is also high, sst is mainly concentrated in 29-31°C, and DSH is mainly concentrated in 100-300 km; in addition to Figure (i), lon is in the first four important environmental variables of each month, mainly concentrated in the sea west of 180°E. In addition to Figures (a), (j), (k), and (l), lat is also in the first four important environmental variables of each month; it is more concentrated in the 5°S-5°N region, and the contribution rate of lon and lat is relatively large.
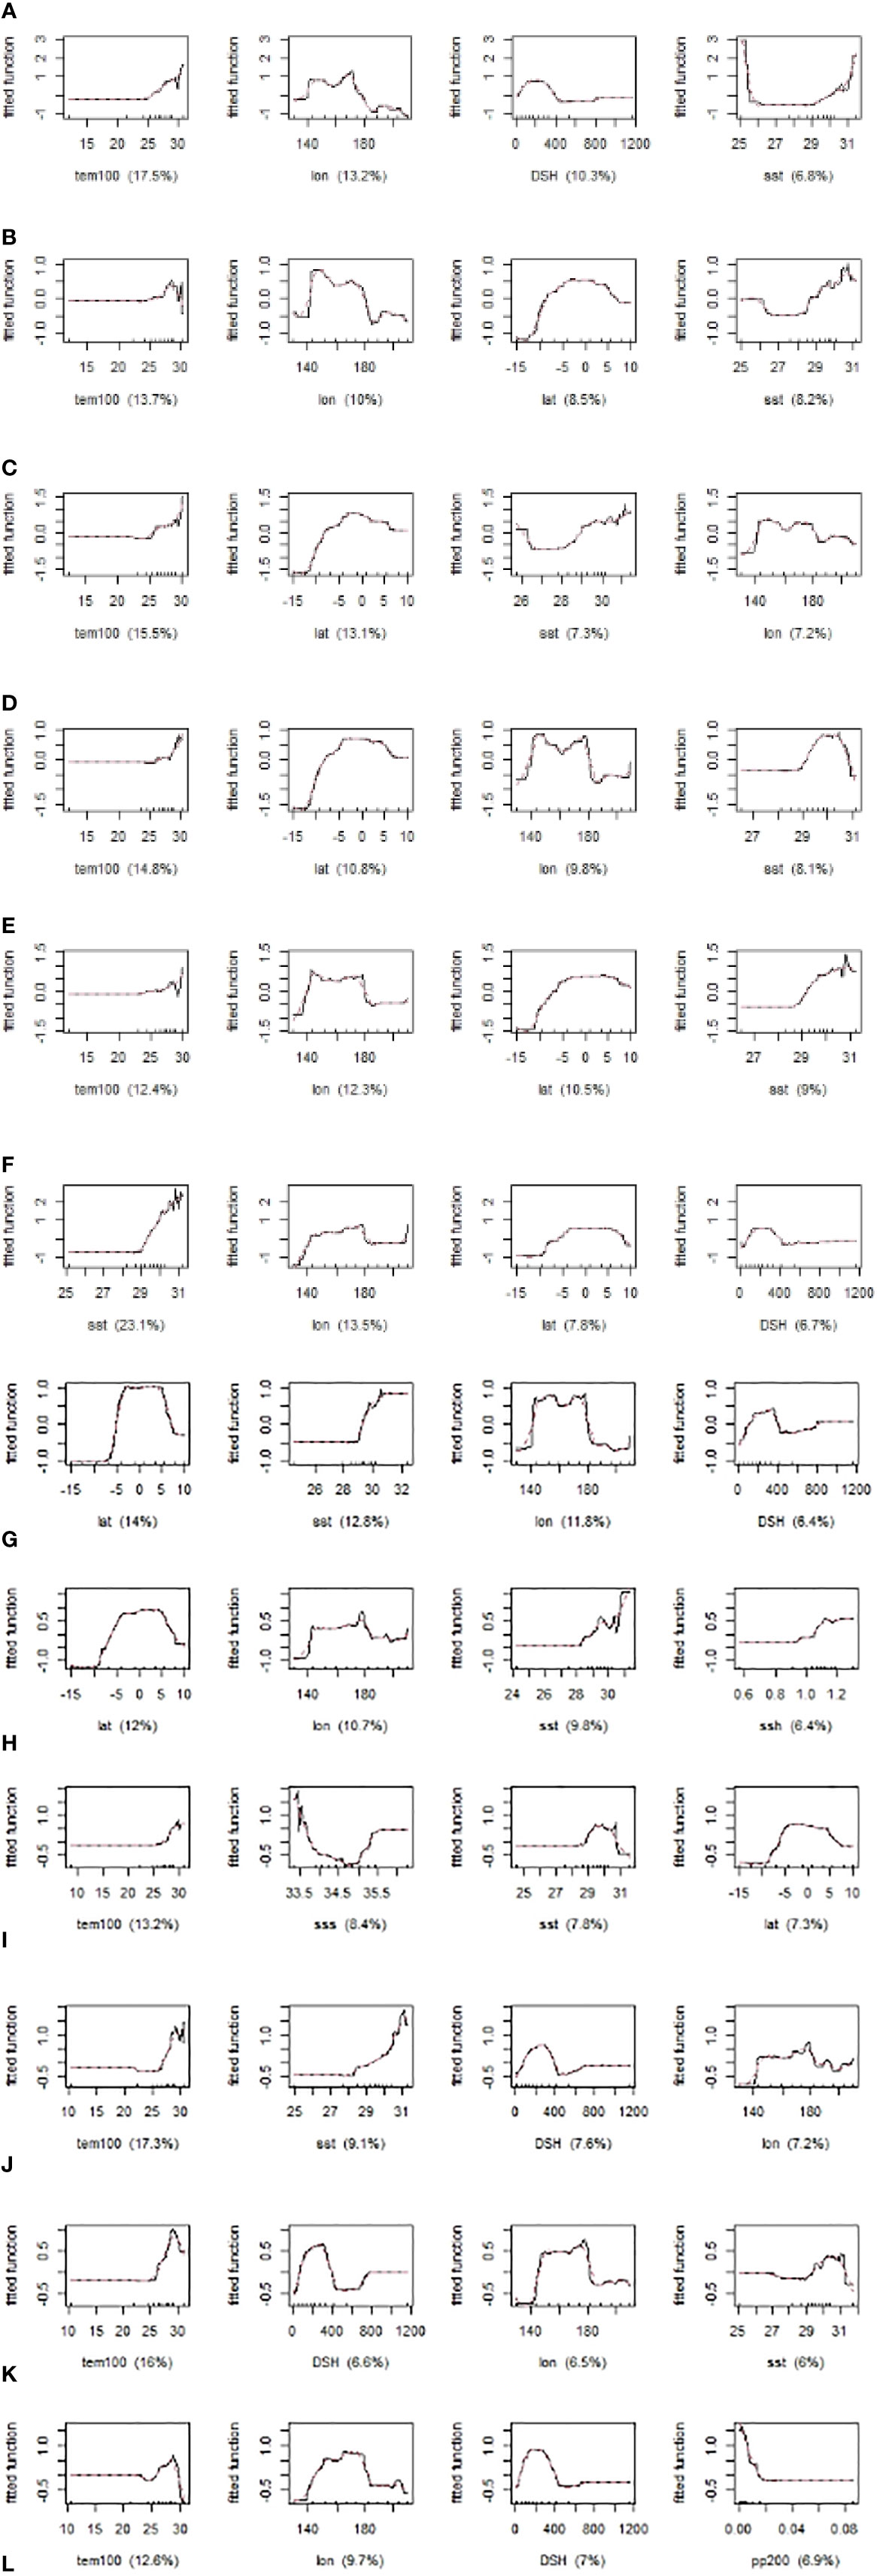
Figure 4 Partial dependence plots showing the relationship between the environmental changes and fishing behaviour. (A–L) here refers to the months from January to December.
Previous studies on purse seine tuna mostly used environmental variables at the surface of the ocean, but studies have shown that bonito, yellowfin tuna and bigeye tuna mostly caught by purse seine tuna live in the water layer of 50-100 m underwater. Purse seine tuna is mostly operated in economic exclusivity, and the distance from the vessel to the coastline has a certain impact on fishing options. This paper uses 24 variables, including dynamic variables of the ocean environment, spatial variables and static variables such as the distance to the coastline, and it uses the BRT model to clarify the impact of different variables on the spatial distribution of fishing operations.
Related research scholars have carried out many studies on the preferred habitat of tuna (Candan et al., 2014; Huang et al., 2020; Wang, 2020). These studies mainly used the collected fishery log data combined with environmental values to describe the tuna habitat. Few analyses of tuna fish habitats are based on satellite AIS data. Therefore, compared with previous work, this study uses AIS data to extract the fishing effort of the vessels as a predictor variable of the BRT model and GAM model, which is a more true and effective response to the behaviour of the vessels than traditional fishery data. The purpose of the tuna purse seiner on the sea is to fish, and every time it stays on the sea for a period of time, it will spend a corresponding or additional cost value.
Nicolas et al. (2011) used vessel monitoring system (VMS) data to study and quantify the spatial dynamics of Seschel tuna purse seine fishing activities in the Indian Ocean. The Bayesian state space model is used to divide movement on the sea into three situations: sailing, tracking and fishing. The spatial trajectory distribution described by the length of stay of the vessel is discussed from a statistical perspective. Zhang et al. (2021) analysed the spatial analysis of the fishing behaviour of tuna purse seiners in the western and central Pacific based on the AIS trajectory data of vessels and used the vessel’s residence time on the sea as the fishing effort, which was correlated with the data of the western and central Pacific tuna purse seine production and net times. The test results show that there is a high degree of positive correlation (r>0.8). Therefore, it is reasonable to define the time spent by vessels on the sea for catching tuna as fishing effort. Fishing effort is a measure of the degree of accumulation of tuna fish stocks and changes in the spatial behaviour of purse seining tuna vessels. Hsu et al. (2021) used the fishing effort of longline vessels to construct a habitat index model and successfully predicted the high-precision spatial and temporal distribution map of skipjack fisheries in the western and central Pacific, and the comparison results showed that fishing effort data were better than catch data. This indicates that the environmental factor response model constructed based on the fishing effort information of vessels can be used to understand the spatial distribution of fishery resources and environmental impacts.
In research on the prediction of marine environmental factors and fishery resource distribution, researchers mostly use the habitat suitability index (HSI), support vector machine (SVM) and other models to conduct research, which easily leads to overfitting, thereby reducing the prediction accuracy of the model. At present, research scholars (Chen et al., 2013; Megan et al., 2019;Hou et al., 2020) have applied methods such as random forests and gradient boosting trees in ensemble learning to fishery forecast research, but these methods are all combined with fishery data. Boosted regression trees (BRTs) are a self-learning method based on the classification and regression tree algorithm (CART) in the ensemble learning method, and the model reduces the risk of overfitting. Megan et al. (2019), in order to understand the temporal and spatial fishing trends of vessels, considered marine environmental factors and used the boosted regression tree model to analyse the internal relationship between vessel fishing behaviour and environmental factors and to identify the fishing behaviour of vessels and their dependence on the environment.
With the gradual increase in the number of training decision trees, the fitting of the boosted regression tree model to the training data will become increasingly better, but if the number of decision trees exceeds a certain number, overfitting may occur, resulting in a decrease in the prediction accuracy of the model. In this study, a 10-fold cross-validation method was used to establish a boosted regression tree model, and the number of decision trees with the smallest average estimation deviation was taken as the optimal number. We used all the training data to build a fishery forecast model that contains the optimal number of decision trees. Binary classification is carried out based on the presence or absence of fishing effort in the unit grid (recorded as “1” and nonrecorded as “0”); the predicted fishing effort ranges between 0 and 1, and the predicted fishing effort is calculated based on the average value. Two categories (≥average value is recorded as “1”, <average value is recorded as “0”), verify the accuracy of the model’s prediction.
Elith and Leathwick (2010) explained that among the parameter results returned by the “dismo” and “gbm” packages of model training, cv-AUC in the model prediction accuracy evaluation index is the most suitable parameter statistic for evaluating the quality of the model. Derville et al. (2016) stated that the explained deviance corresponds to the percentage of deviation shown by the fitted model, which to a large extent verified the accuracy of model training.
The results of the model training parameters all verify the high accuracy of model training. By comparing the parameters obtained from the BRT model and GAM model, a more appropriate BRT model was selected for prediction. The BRT model predicts the fishing effort of vessels in 2020, which is more consistent with the actual fishing effort of vessels in the spatial distribution area. The accuracy of the prediction of the binary classification reaches 77%, and the training and prediction results of the model have been verified.
The habitat of tuna is closely related to the marine environment. Huang et al. (2020) selected latitude, longitude, depth of mixed layer, month and sea surface temperature and used the second-order boosted regression tree model to establish a habitat model of a free-swimming school of bigeye tuna in the East Pacific to explore its temporal and spatial distribution characteristics. The result is that latitude, longitude, depth of the mixed layer, month and sea surface temperature are the main factors that affect the success rate of bigeye tuna. Nataniel et al. (2021) showed that the catchability of tuna biomass accumulation is related to factors such as sea temperature, productivity, sea level height, and geostrophic flow in addition to the interaction of temporal and spatial variables. This corresponds to several of the environmental factors used in this article.
The distribution of fishery resources changes in response to changes in the marine environment, as does the tracking of fish stocks by vessels. Therefore, vessel operating space changes also reveal information about the spatial changes in fishery resources. The research in this paper shows that tem100 and lon are the most important factors affecting the fishing effort of tuna purse seiners. Second, sst, lat and DSH have the greatest impact on tuna purse seine fishing operations. The importance of tem100, sst, latitude and longitude and DSH totalled 47.56%, and five variables contributed nearly half of the impact.
These important results indicate that temperature, spatial factors and the distance from the vessel to the coastline are the key environmental variables that affect the operation of tuna purse seiners in the western and central Pacific. Although tuna has a thermal regulation function, temperature still has an important influence on its distribution. Studies show that the active water layer where the tuna seine are captured is in the shallow area of 200 m underwater, and the daytime swimming depth mode is 100 m (Takayuki et al., 2016), so the shallow water temperature of the 100 m water layer has an important influence on the fish. This may be the reason why the water temperature of 100 metres and the temperature of the surface water have an important influence on the fishing operations of the purse seine.
Longitude and latitude have a high contribution rate, indicating that tuna purse seiner operations are also spatially selective, and fishing vessels tend to operate in certain areas. Zhang et al. (2021) found that the fishing behaviour of tuna purse seiners in the western and central Pacific Oceans showed a clustering pattern and clustered tightly. This spatial clustering of fishing vessels was related to the fishing objects. Yang et al. (2014) found that bonito resources in the western and central Pacific showed a strong aggregation and distribution, with strong local spatial autocorrelation.
The results of labelling tuna with DTs and ATs in the subtropical Pacific Ocean and equatorial regions showed that tuna is active in related areas (Kurt and Fuller, 2013). Most of the time, bonito is within 25 kilometres of favourable foraging habitat (Druon et al., 2017).
The distance from the purse seiner to the coastline also has a greater impact on the choice of fishing operations. The partial distribution map shows that most fishing vessels operate 100-300 km from the coast, indicating that purse seiners mostly operate within economic exclusives. Therefore, the management of purse seiners is of great significance to individual Pacific Island countries.
The primary productivity of the sea surface and the oxygen content at a depth of 200 metres also contribute more than 5%. Primary productivity is an important part of the ecosystem and has an important impact on tuna spawning habitat, survival rate, and supplementary biomass. Tuna has a dissolved oxygen demand. The purse seine catches small tuna fish, which have poor ability to withstand hypoxia. Salinity and sea surface height also have a certain degree of influence on tuna purse seine fishing operations, while ocean currents, chlorophyll, and the depth of the mixed layer have little effect, and temperature gradients have almost no effect on tuna purse seine fishing operations.
The partial distribution diagram of the influence of 100-metre water temperature and sea surface temperature on vessel operations shows that tuna purse seiners appear more in areas where the 100-metre water temperature is 25-29 °C and the sea surface temperature is 29-31 °C. The suitable area for sea surface temperature and 100-metre water temperature is consistent with the results obtained in the literature (Tang et al., 2014). The curve of the latitude and longitude distribution map shows that the tuna purse seiners are more likely to operate in the 5°S-5°N zonal area; in the longitude direction, the vessels are more likely to appear west of 180°E. This result is similar to the statistical results of Tang et al. (2014) and Kurt and Fuller (2013) based on purse seine data.
Changes in the marine environment have a greater impact on the distribution of tuna species and the spatial behaviour of fishing vessels. Tuna purse seine fishing aims to find and track fish stocks. The impact of the above environmental factors on the fishing operations of tuna purse fishing vessels can also reveal its impact on tuna purse seine fishery resources.
Publicly available datasets were analyzed in this study. This data can be found here: https://globalfishingwatch.org//
SYa and HZ contributed to the conception and design of this study, acquisition of data, visualization, software, and writing—original draft. WF contributed to the investigation and resources. HS and YF contributed to writing—review and editing. SYu contributed to the supervision. All authors contributed to the article and approved the submitted version.
This study was funded by the National Key R&D Program of China (2019YFD0901405,2019YFD0901404), the National Natural Science Foundation of China (12071293), the Special Funds of Basic Research of Central Public Welfare Institute (2019T09), Central Public-interest Scientific Institution Basal Research Fund, CAFS (NO.2020TD82), Shanghai Science and Technology Innovation Action Plan (19DZ1207504), Scientific Research Program of Shanghai Science and Technology Commission (18391900800), Jimei University, Fujian Provincial Key Laboratory of Marine Fishery Resources and Eco-environment and Fujian Provincial Key Laboratory of Marine Fishery Resources and Eco-environment Funding (fjmfre2019003).
The authors declare that the research was conducted in the absence of any commercial or financial relationships that could be construed as a potential conflict of interest.
All claims expressed in this article are solely those of the authors and do not necessarily represent those of their affiliated organizations, or those of the publisher, the editors and the reviewers. Any product that may be evaluated in this article, or claim that may be made by its manufacturer, is not guaranteed or endorsed by the publisher.
The authors of this research would like to thank all the researchers who contributed to the research process during our study, and the data provided by Global Fishing Watch Data.
The Supplementary Material for this article can be found online at: https://www.frontiersin.org/articles/10.3389/fmars.2022.881036/full#supplementary-material
Abascal F. J., Peatman T., Leroy B., Nicol S., Schaefer K., Fuller D. W., et al. (2018). Spatiotemporal Variability in Bigeye Vertical Distribution in the Pacific Ocean. Fisheries Res. 204, 371–379. doi: 10.1016/j.fishres.2018.03.013
Arnaud B., Josse E., Bach P., Gros P., Dagorn L. (2002). Hydrological and Trophic Characteristics of Tuna Habitat: Consequences on Tuna Distribution and Longline Catchability[J]. (Ottawa, Canada: NRC Research Press), 59(6), 1002–1013. doi: 10.1139/F02-073
Arrizabalaga H., Dufour F., Kell L., Merino G., Ibaibarriaga L., Chust G., et al. (2015). Global Habitat Preferences of Commercially Valuable Tuna. Deep Sea Res. Part II: Topical Stud. Oceanography 113, 102–112. doi: 10.1016/j.dsr2.2014.07.001
Briand K., Molony B., Lehodey P. (2011). A Study on the Variability of Albacore (Thunnus Alalunga) Longline Catch Rates in the Southwest Pacific Ocean[J]. Fisheries Oceanography. 20 (6), 517–529. doi: 10.1111/j.1365-2419.2011.00599.x
Candan U. S., Tomoharu E., Suzanne K., Heidi D. (2014). Prediction of Fishing Effort Distributions Using Boosted Regression Trees[J]. Ecol. Appl. 24 (1), 71–83. doi: 10.1890/12-0826.1
Chen X. Z., Fan W., Cui X. S. (2013). Prediction of Indian Ocean Albacore Tuna Fishing Grounds Based on Random Forest [J]. J. Oceanography 35 (1), 158–164. doi: 10.3969/j.issn.0253-4193.2013.01.018
Costello M. J. (2016). Marine Reserves: Sustainable Fisheries Need Reserves[J]. Nature 540 (7633), 341–341. doi: 10.1038/540341e
Deary A. L., Moret-Ferguson S., Engels M., Zettler E., Jaroslow G., Sancho G. (2015). Influence of Central Pacific Oceanographic Conditions on the Potential Vertical Habitat Offour Tropical Tuna Species[J]. Pacific Sci. 69 (4), 461–475. doi: 10.2984/69.4.3
Debrah E. A., Wiafe G., Agyekum K. A., Aheto D. W. (2018). An Assessment of the Potential for Mapping Fishing Zones Off the Coast of Ghana Using Ocean Forecast Data and Vessel Movement[J]. West Afr. J. Appl. Ecol. 26 (2), 26–43.
Derville S., Constantine R., Scott B. C., Oremus M., Torres L. G. (2016). Environmental Correlates of Nearshore Habitat Distribution by the Critically Endangered Māui Dolphin[J]. Marine Ecol. Prog. Ser. 551, 261–275. doi: 10.3354/meps11736
Druon J.-N., Chassot E., Chassot E., Murua H., Lopez J., Lopez J. (2017). Skipjack Tuna Availability for Purse Seine Fisheries Is Driven by Suitable Feeding Habitat Dynamics in the Atlantic and Indian Oceans[J]. Front. Marine Sci. 4. doi: 10.3389/fmars.2017.00315
Elith J., Leathwick J. R., Hastie T. (2008). A Working Guide to Boosted Regression Trees. J. Anim. Ecol. 77 (4), 802–813. doi: 10.1111/j.1365-2656.2008.01390.x
Gao F. (2016). Research on the Prediction Model of Mackerel Fishery in the East and Yellow Seas Based on the Boosting Regression Trees [D] (Shanghai: Shanghai Ocean University), 80–91.
Guillermo O. C., Dunn D. C., Reygondeau G., Boerder K., Worm B., Cheung W., et al. (2018). The Environmental Niche of the Global High Seas Pelagic Longline Fleet[J]. Sci. Adv. 4 (8), eaat3681. doi: 10.1126/sciadv.aat3681
Hou J., Zhou W. F., Fan W., Zhang H. (2020). Research on Forecasting Model of South Pacific Albacore Tuna Fishery Based on Ensemble Learning [J]. South Fisheries Sci. 16 (05), 42–50. doi: 10.12131/20200022
Hsu T. Y., Chang Y., Lee M., Wu R. F., Hsiao S. C. (2021). Predicting Skipjack Tuna Fishing Grounds in the Western and Central Pacific Ocean Based on High-Patial-Temporal-Resolution Satellite Data[J]. Remote Sens. 13 (5), 861. doi: 10.3390/rs13050861
Huang J. L., Dai L. B., Wang X. F., Zhou C., Tang H. (2020). Spatial and Temporal Distribution Characteristics of Habitat Preference of Free-Swarming Tuna in the Eastern Pacific Ocean [J]. J. Shanghai Ocean Univ. 29 (06), 889–898. doi: 10.12024/jsou.20191202874
Igor M. B., O’Reilly J. E. (2009). An Algorithm for Oceanic Front Detection in Chlorophyll and SST Satellite Imagery[J]. J. Marine Syst. 78, 319–326. doi: 10.1016/j.jmarsys.2008.11.018
Juan-Jordá M. J., Mosqueira I., Cooper A. B., Freire J., Dulvy N. K. (2011). Global Population Trajectories of Tunas and Their Relatives.[J]. Proc. Natl. Acad. Sci. U. S. A. 108 (51), 20650–20655. doi: 10.1073/pnas.1107743108
Kroodsma D. A., Mayorga J., Hochberg T., Miller N. A., Boerder K., Ferretti F., et al. (2018a). Tracking the Global Footprint of Fisheries[J]. Science 359, 6378. doi: 10.1126/science.aao5646
Kroodsma D. A., Mayorga J., Hochberg T., Miller N. A., Boerder K., Ferretti F., et al. (2018b). Response to Comment on “Tracking the Global Footprint of Fisheries”. [J].Sci 361 (6404), eaat7789. doi: 10.1126/science.aat7789
Kurt M. S., Fuller D. W. (2013). Simultaneous Behavior of Skipjack (Katsuwonus Pelamis), Bigeye (Thunnus Obsesus), and Yellowfin (T. Albacares) Tunas, Within Large Multi-Species Aggregations Associated With Drifting Fish Aggregating Devices (FADs) in the Equatorial Eastern Pacific Ocean[J]. Marine Biol. 160 (11), 3005–3014. doi: 10.1007/s00227-013-2290-9
Lan K. W., Shimada T., Lee M. A. (2017). Using Remote-Sensing Environmental and Fishery Data to Map Potential Yellowfin Tuna Habitats in the Tropical Pacific Ocean[J]. Remote Sensing 9 (5), 1–14. doi: 10.3390/rs9050444
Martiwi Diah S., Abu Bakar S., Fusanori M., Tasuku T., Rahman As-syakur A. (2015). Characterization of Bigeye Tuna Habitat in the Southern Waters Off Java–Bali Using Remote Sensing Data[J]. Adv. Space Res. 55 (2), 732–746. doi: 10.1016/j.asr.2014.10.007
Megan A. C., Anderson M., Schramek T., Merrifield S., Terrill E. J. (2019). Towards a Fishing Pressure Prediction System for a Western Pacific EEZ[J]. Sci. Rep. 9 (1), 461–470. doi: 10.1038/s41598-018-36915-x
Melomerino S. M., Fath B. D. (2020). Ecological Niche Models and Species Distribution Models in Marine Environments: A Literature Review and Spatial Analysis of Evidence[J]. Ecol. Modelling 415, 108837. doi: 10.1016/j.ecolmodel.2019.108837
Nataniel A., Lopez J., Soto M. (2021). Modelling Seasonal Environmental Preferences of Tropical Tuna Purse Seine Fisheries in the Mozambique Channel[J]. Fisheries Res. 243. doi: 10.1016/j.fishres.2021.106073
Nicol S., Menkes C., Jurado-Molina J., Lehodey P., Usu T., Kumasi B, et al. (2014). Oceanographic Characterisation of the Pacific Ocean and the Potential Impact of Climate Variability on Tuna Stocks and Tuna Fisheries[J]. SPC Fisheries Newsletter 145, 37–48.
Nicolas B., Walker E., Gaertner D., Rivoirard J., Gaspar P., et al. (2011). Fishing Activity of Tuna Purse Seinersestimated From Vessel Monitoring System (VMS) Data[J]. Can. J. Fish. Aquat. Sci. 68 (11), 1998–2010. doi: 10.1139/f2011-114
Paul C. F. (2010). Comparison of Objective Descriptions of the Thermocline[J]. Limnol. Oceanogr. Methods 8 (6), 313–325. doi: 10.4319/lom.2010.8.313
Pratt L. J., Earles J., Cornillon P., Cayula J.-F. (1991). The Nonlinear Behavior of Varicose Disturbances in a Simple Model of the Gulf Stream[J]. Deep Sea Res. Part A. Oceanographic Res. Papers 38, S591–S622. doi: 10.1016/S0198-0149(12)80025-2
Susana F., Cabral H. N. (2015). Predicting Fish Species Richness in Estuaries: Which Modelling Technique to Use? [J]. Environ. Modelling Softw. 66, 17–26. doi: 10.1016/j.envsoft.2014.12.010
Taconet M., Kroodsma D., Fernandes J. (2019). A Global Atlas of AIS-Based Fishing Activity Challenges and Opportunities[M]. ResearchGate.
Takayuki M., Keisuke S., Yasuko S., Mikio T. (2016). Comparison of the Behavior of Skipjack (Katsuwonus Pelamis), Yellowfin (Thunnus Albacares) and Bigeye (T. Obesus) Tuna Associated With Drifting FADs in the Equatorial Central Pacific Ocean. Fish. Oceanogr. 25 (6), 565–581. doi: 10.1111/fog.12173.
Tang F. H., Cui X. S., Yang S. L., Zhou W. F., Cheng T. F., Wu Z. L., et al. (2014). GIS Spatiotemporal Analysis of the Impact of Marine Environment on the Western and Central Pacific Ocean Tuna Purse Seine Fishing Grounds[J]. South. Fisheries Sci. 10 (02), 18–26. doi: 10.3969/j.issn.2095-0780.2014.02.003
Wang X. (2020). Research on the Biology and Habitat Distribution of Bigeye Tuna in the High Seas of the Central and Western Pacific Ocean [D]. (Shanghai Ocean University). doi: 10.27314/d.cnki.gsscu.2020.000610
Wang Y. B., Wang Y. (2016). Estimating Catches With Automatic Identification System (AIS) Data: A Case Study of Single Otter Trawl in Zhoushan Fishing Ground, China[J]. Iran J. Fish Sci. 15 (1), 75–90.
Wood S. N., Augustin NH. (2002). GAMs With Integrated Model Selection Using Penalized Regression Splines and Applications to Environmental Modelling. Ecol. Modelling 157, 157−177. doi: 10.1016/S0304-3800(02)00193-X
Yang X. M., Dai X. J., Tian S. Q., Zhu G. P. (2014). Hot Spot Analysis and Spatial Heterogeneity of Bonito Purse Seine Fishery Resources in the Central and Western Pacific [J]. Chin. J. Ecol. 34 (13), 3771–3778. doi: 10.5846/stxb201211101579
Yang S. L., Fan X. M., Wu Z. L., Wu Y. M., Dai Y. (2021). Study on the Effect of Vertical Structure of Water Temperature on the Catch Rate of Yellowfin Tuna in the Tropical Central and Western Pacific Based on GAM Model [J]. Oceanographic Soc. 43 (04), 46–54. doi: 10.12284/hyxb2021040
Yang S. L., Shi H. M., Fan X. M., Cui X. S., Wang F., Zhang H. (2022).Spatial Analysis of the Habitat of Yellowfin Tuna in the Tropical Central and Western Pacific [J/OL]. China Agric. Sci. Technol. Herald.1–9. doi: 10.13304/j.nykjdb.2020.0514
Yang S. L., Zhang Y., Fan W., Dai Y. (2012). Spatial and Temporal Distribution of Bigeye Tuna Fisheries in Tropical Indian Ocean and the Relationship Between Thermocline [J]. China Fisheries Sci. 19 (04), 679–689. doi: 10.3724/SP.J.1118.2012.00679
Zhang C. L., Jiang Y., Wang B. Y., Wang D. Y., Hu S. (2021).Construction and Preliminary Analysis of the Vertical Temperature Structure of the Accompanying Fish School of Yellowfin Tuna in the Central and Western Pacific [J/OL]. J. Shanghai Ocean Univ. 33 (01), 233–241.doi: 10.12024/jsou.20210403401
Zhang H., Yang S.-L., Fan W., Shi H.-M., Yuan S.-L. (2021). Spatial Analysis of the Fishing Behaviour of Tuna Purse Seiners in the Western and Central Pacific Based on Vessel Trajectory Data. J. Mar. Sci. Eng. 9, 322. doi: 10.3390/jmse9030322
Zhou W. F., Chen L. L., Cui X. S., Zhang H. (2021).Influence of Thermocline and Spatiotemporal Factors on the Distribution of Yellowfin Tuna Fishing Grounds in the Central and Western Pacific Under Abnormal Climate [J/OL]. China Agric. Sci. Technol. Rev. 23 (10), 192–201. doi: 10.13304/j.nykjdb.2020.0280
Keywords: tuna purse seiners, BRT model, GAM model, habitats, environmental factors, spatial distribution
Citation: Yang S, Zhang H, Fan W, Shi H, Fei Y and Yuan S (2022) Behaviour Impact Analysis of Tuna Purse Seiners in the Western and Central Pacific Based on the BRT and GAM Models. Front. Mar. Sci. 9:881036. doi: 10.3389/fmars.2022.881036
Received: 22 February 2022; Accepted: 03 May 2022;
Published: 09 June 2022.
Edited by:
Ahmad Salman, National University of Sciences and Technology (NUST), PakistanReviewed by:
Jose Tomas Montero, Pontificia Universidad Católica de Chile, ChileCopyright © 2022 Yang, Zhang, Fan, Shi, Fei and Yuan. This is an open-access article distributed under the terms of the Creative Commons Attribution License (CC BY). The use, distribution or reproduction in other forums is permitted, provided the original author(s) and the copyright owner(s) are credited and that the original publication in this journal is cited, in accordance with accepted academic practice. No use, distribution or reproduction is permitted which does not comply with these terms.
*Correspondence: Sanling Yuan, c2FubGluZ0B1c3N0LmVkdS5jbg==
†These authors have contributed equally to this work and share first authorship
Disclaimer: All claims expressed in this article are solely those of the authors and do not necessarily represent those of their affiliated organizations, or those of the publisher, the editors and the reviewers. Any product that may be evaluated in this article or claim that may be made by its manufacturer is not guaranteed or endorsed by the publisher.
Research integrity at Frontiers
Learn more about the work of our research integrity team to safeguard the quality of each article we publish.