 Iris Delos Santos Orizar
 Aleksandra M. Lewandowska
- Tvärminne Zoological Station, Faculty of Biological and Environmental Sciences, University of Helsinki, Hanko, Finland
The phytoplankton community is a highly diverse group of microscopic, photosynthetic organisms responsible for 50% of the global primary production. The predicted shift in ocean salinity due to climate change threatens phytoplankton, resulting in compositional shifts and changing biodiversity patterns. This study investigates intraspecific multi-trait variability and plasticity of Alexandrium ostenfeldii and Skeletonema marinoi along a salinity gradient. Multiple traits were measured for five strains of each species grown at six salinity levels (0, 5, 15, 20, 30, and 35 psu) and combined in the principal component analysis. Cell size contributed 52% to the total variation in traits composition and significantly differed between species. The trait plasticity of A. ostenfeldii was significantly higher than S. marinoi, and the highest trait plasticity was observed at 15 psu in both species. In addition to morphological traits, A. ostenfeldii was characterized by high plasticity of cellular carbon content and a higher C:P ratio at low salinity levels. Overall, the results suggest a high variation in traits plasticity between phytoplankton strains, emphasizing the importance of intraspecific diversity to maintain ecosystem functions under changing environmental conditions.
Introduction
The phytoplankton community is a taxonomically diverse group composed of microscopic photosynthetic organisms ranging from ~2 to 200 μm (Sieburth et al., 1978; Beardall et al., 2009; Finkel et al., 2010). Phytoplankton contribute ~ 50% to the global primary production (Field et al., 1998), play an essential role in elemental recycling (Arrigo et al., 1999), and energy transfer to higher trophic levels (Striebel et al., 2012). The large diversity of phytoplankton traits allows different species and genotypes to coexist, exploiting various resources and colonizing different aquatic environments from freshwater to marine systems (Hutchinson, 1961). Moreover, community diversity helps maintain ecosystem functions when disturbances occur (Ptacnik et al., 2008; Flöder and Hillebrand, 2012; Vallina et al., 2017). Hence, it is crucial to understand how biodiversity is maintained, regulated, and affected by biotic and abiotic factors.
There are two sources of biodiversity in a community: between species (interspecific) and within species (intraspecific). The interspecific diversity is more significant for direct ecological responses (e.g., primary production and consumption). In contrast, intraspecific diversity has a more indirect ecological meaning, mediated through selection and local adaptation (Des Roches et al., 2018). Despite the importance of both inter-and intraspecific trait variability for species coexistence (MacArthur and Levins, 1967; Abrams, 1983; Violle et al., 2012), most of our understanding of species co-occurrence is based on mean trait values and variances at the species level (Cavender-Bares et al., 2004; Šímová et al., 2015; He et al., 2021), and it has been assumed that traits should vary more between than within species (McGill et al., 2006). However, intraspecific diversity has been the focal point of Darwin’s arguments on how natural selection works in a population (Darwin and Kebler, 1859; Williams, 1966) since interactions with the biotic and abiotic environment occur at an individual level through gene expression.
Intraspecific diversity has been demonstrated to promote species coexistence and affect community dynamics (Menden-Deuer and Rowlett, 2014; Fontana et al., 2018; Menden-Deuer et al., 2021). Changes in the aquatic environment, such as the predicted shift in salinity regime, wherein evaporation-dominated regions are becoming saltier and precipitation-dominated regions are becoming fresher (Durack and Wijffels, 2010; Durack et al., 2012), can potentially reduce phytoplankton diversity by creating a stable but extreme salinity state that is limited to species that can persist. However, intraspecific diversity can facilitate population growth in such an extreme environment by promoting niche complementarity among genotypes (Bolnick et al., 2011; Violle et al., 2012).
Salinity is an important environmental parameter affecting phytoplankton diversity and composition (Kipriyanova et al., 2007; Quinlan and Phlips, 2007). Salinity level strongly varies temporarily and spatially in estuarine and coastal areas, while inland lakes and open oceans have a more stable and narrower salinity range. The Baltic Sea is characterized by strong salinity fluctuations, and salinity is predicted to decline in the future (Meier et al., 2012) due to increased freshwater inflow from the atmosphere and land (Lehmann et al., 2021). Vuorinen et al. (2015) predicted a salinity of less than 7 psu for the entire Baltic Sea by 2060, a bottleneck for many freshwater and marine species, including phytoplankton (Olli et al., 2019).
Salinity affects osmotic regulation (Kirst, 1989; Campbell et al., 2019) and ion transport (Guillard and Ryther, 1962) of phytoplankton cells, as well as their photosynthetic (D’ors et al., 2016) and respiratory rates (Qasim et al., 1972; Mohammed and Shafea, 1992; Flameling and Kromkamp, 1994). Furthermore, osmotic stress has been found to cause oxidative stress to the cells (Hernando et al., 2015), and affects rates of net carbon fixation (Miller and Kamykowski, 1986). Given the effects of salinity on phytoplankton physiology, it is crucial to determine the mechanisms of how the phytoplankton community would respond to the predicted freshening and salinization of aquatic environments. Studies have shown that different taxa have different strategies for responding to salinity change (Brown, 1982; Fuji et al., 1999; Saros and Fritz, 2000; Barron et al., 2002; Moisander et al., 2002; Matsuyama et al., 2004), which affect their distribution (Thessen et al., 2005), and the diversity of phytoplankton communities (Olli et al., 2019). A fresher and a saltier future ocean could put high selection pressure on some traits, such as synthesizing osmoticums and shifts in cell size (Finkel et al., 2010), leading to changes in the composition, functional roles, and services the phytoplankton community provides.
In this study, a multivariate trait-based approach (Argyle et al., 2021) was used to determine intraspecific variation in the distribution of traits among two phytoplankton species: Skeletonema marinoi (diatom) and Alexandrium ostenfeldii (dinoflagellate) at different salinity levels (0, 5, 15, 20, 30, 35 psu). The genus Alexandrium is one of the most ecologically important phytoplankton species, which can cause harmful algal blooms and massive fish kills (Mortensen, 1985; Cembella et al., 2002), morbidity and mortality of marine mammals (Durbin et al., 2002; Doucette et al., 2006). Furthermore, high intraspecific variability was demonstrated by A. ostenfeldii under different environmental conditions such as temperature and elevated pCO2 (Kremp et al., 2012; Brandenburg et al., 2021). Skeletonema is a prominent genus during spring bloom events in the North Atlantic, the Baltic Sea (Wasmund et al., 1998; Spilling et al., 2018), and during upwelling blooms in the tropics. Both species are genetically diverse, known to tolerate a wide range of salinity conditions, and thrive under the brackish conditions of the Baltic Sea. Their responses to salinity change can give insights into the observed shift from diatom to dinoflagellate dominated phytoplankton communities in different Baltic Sea basins during the spring (Klais et al., 2011), and summer season (Suikkanen et al., 2007), which could have implications to the biogeochemical cycling (Spilling et al., 2018).
We tested if the use of a multivariate trait-based approach allows us to uncover different strategies of A. ostenfeldii and S. marinoi in response to salinity stress (H1). The two species are distinct in cell size, carbon content, and nutrient affinity (Menden-Deuer and Lessard, 2000); therefore can have different trade-offs when exposed to salinity change. Extreme salinity levels, especially low salinity conditions, could put intense selection pressure on certain traits, reducing overall trait variation. Therefore, we expected higher trait plasticity at intermediate (15-20 psu) compared to extreme (0 and 35 psu) salinity levels (H2). We also hypothesized that trait plasticity differs between strains (H3). Therefore, the ability of A. ostenfeldii and S. marinoi to grow in a wide range of salinity conditions could be attributed to high intraspecific plasticity in their response to salinity stress.
Materials and Method
Phytoplankton Cultures
We used five strains of Skeletonema marinoi and five strains of Alexandrium ostenfeldii from the FINMARI algae culture collection at the Tvärminne Zoological Station. The strains of S. marinoi (C1406, C1407, C1412, C1418, and C1428) were isolated from different locations in the Bothnian Sea, while the strains of A. ostenfeldii were isolated from different locations in the Åland Sea (AOF0913, AOF0936, AOF0940, and AOK1024) and Gotland (AOVA0930). The Bothnian Sea and Åland Sea are sub-divisions of the Gulf of Bothnia with a 4-5 psu salinity range, while Gotland is located in the Baltic Proper characterized by salinities of 7-8 psu (Meier et al., 2022). All strains were cultivated in F/2 medium (NO3 = 888 μM, PO4 = 36 μM, Si = 106 μM, trace metals and vitamins), and acclimated to the experimental conditions (temperature = 16°C, photosynthetic photon flux density = 150 μmol photon m-2 s-1, light-dark cycle = 16:8 h, sunlight spectrum Aquarius plant LED, AB Aqua Medic GmbH).
Experimental Set-Up
The strains of S. marinoi and A. ostenfeldii were incubated in media (600 mL) with different salinity levels (0, 5, 15, 20, 30, and 35 psu). Three replicates for each treatment (strain x salinity level) were prepared, resulting in 90 experimental units for each species (180 experimental units in total). The set-up was incubated under the same nutrient, temperature, and light conditions as during the acclimation period. The starting algal biomass of the experimental units (day 0) was equally based on the chlorophyll a (chl a) fluorescence of the stock cultures. The first chl a fluorescence measurement was done < 24 hours after the units were prepared and was used as the initial biomass for each treatment.
During the incubation period, chl a fluorescence was used as a proxy to monitor the growth of each experimental unit. This approach allowed us to take samples every other day using only a small aliquot volume (2.5 mL). The samples were analyzed using Varian Cary Eclipse fluorescence spectrophotometer. Treatment was terminated when the stationary phase was reached or when no significant change in chl a fluorescence was observed for several monitoring days after day one.
Final Sampling and Traits Measurements
Different traits were estimated for each strain (Table 1). Samples from each stock culture were collected for the following analyses: chl a content, residual dissolved inorganic nutrients (NO3, NH4, PO4, Si), particulate organic nutrients (POP, POC, PON), microscopic cell counting, and size measurements. The same set of samples was collected when treatments were terminated.

Table 1 Phytoplankton traits estimated in five strains of A. ostenfeldii and S. marinoi.
To estimate chl a content, samples were collected on GF/F filters. The chl a extraction was performed in the dark for 24 h using 94% ethanol. The chl a concentration was estimated by measuring the fluorescence of supernatant (Varian Cary Eclipse fluorescence spectrophotometer, excitation 430 nm, emission 670 nm). Samples were then normalized to total cell count to estimate cellular chl a content.
Samples for POP, POC, and PON were collected on acid-washed and combusted GF/F filters. For POP samples, filters were combusted at 450°C for 4 h and analyzed following Koistinen et al. (2017). To estimate POC and PON content, filters containing organic material were dried at 60°C for 24 h, folded into tin caps, and measured using an elemental analyzer (Thermo Scientific EA Flash 2000).
Samples for residual dissolved inorganic nutrients (NO3, NO2, NH4, and SiO4 for S. marinoi) were filtered through cellulose acetate membrane filters (0.2 μm pore size) and analyzed using a continuous flow autoanalyzer (AAII) after Hansen and Koroleff (2007).
Samples for microscopic cell counting and size measurements were preserved using acidified Lugol’s iodine solution. Cell density was estimated using DM IRB inverted microscope (Leica, Wetzlar, Germany) under 500x magnification, following the Utermöhl’s method (Utermöhl, 1958).
The specific growth rate was calculated based on Chl a fluorescence measurements taken every other day using the following equation:
Equation 1. Specific Growth Rate
Where, f’0 = chl a fluorescence at the start of the exponential phase (a.u.),
f ‘ = chl a fluorescence at the end of the exponential phase (a.u.),
Δt = duration of the exponential phase (day) Negative values were set to 0, assuming no significant growth. Maximum chl a fluorescence (Fmax) was estimated as the highest chl a fluorescence value observed during the incubation period.
Cell width and length were measured with the aid of Leica camera software for at least 50 individual cells. Biovolume and surface area were calculated after Hillebrand et al. (1999), using the equation for prolate spheroid for A. ostenfeldii and cylinder + 2 half-spheres for S. marinoi.
Nutrient uptake rates (NO3, PO4, and Si) were estimated using the final residual inorganic nutrients concentration. The initial concentration of nutrients was based on F/2 media concentrations. The following equation was used:
Equation 2. Nutrient Uptake Rate
Where, Nt1 = F/2 media concentration (µM),
Nt2 = residual nutrient concentration at the termination day (µM),
C = cell density at the day of termination (cell ml-1)
Δt = period of incubation (day) Negative values were converted to 0, assuming no significant uptake.
Statistical Analysis
The difference in traits distribution between the two species was established by performing a principal component analysis (PCA) of common traits measured for both species. After that, the intraspecific trait variability was addressed by performing PCA of the traits for each species, wherein silicate uptake was added to S. marinoi trait matrix. Finally, we calculated Pearson correlation coefficients between pairs of traits for each species.
The plasticity of single traits, which were identified as the most important descriptors of PC 1 and PC 2 for each species based on their eigenvalues, was assessed by calculating the coefficient of variation (CV). CV for each trait was compared using Feltz and Miller (1996) asymptotic test to determine intraspecific trait variability and plasticity. The following comparisons were performed: 1.) CV of every strain across salinity levels, and 2.) CV of all strains at each salinity level. The first comparison describes the plasticity of each strain in response to salinity change, while the second represents salinity-specific trait variability.
All statistical analyses were performed using R version 4.1.0 (R Core Team, 2021). In addition, FactoMineR (Lê et al., 2008) package was used for PCA, cvequality package (Marwick and Krishnamoorthy, 2019) was used for Feltz and Miller’s asymptotic test, and ggplot2 package (Wickham, 2016) was used for figures.
Results
Between Species Comparison
Principal component analysis (PCA) was performed on traits (Table 1) measured for both A. ostenfeldii and S. marinoi. The first three components explained ~ 79% of the total variation in the trait matrix (Table 2). PC1 was highly correlated to all variables related to cell size (cell length and width, biovolume, surface area to volume ratio, cellular carbon, and nitrogen content; Figure 1). As expected (H1), the individual loadings along the PC 1 axis clustered by species (Figure 1A), wherein the strains of A. ostenfeldii were generally characterized by larger cell size (length, width, biovolume, and surface area) and higher cellular carbon content compared to the strains of S. marinoi characterized by high surface area to biovolume ratio (sav, Figure 1A). Together, cell size-related traits explained 52% of the total variation along the PC 1 (Table S1). The density plot of A. ostenfeldii showed wider variation along with the PC 1 than S. marinoi (Figure 1C).
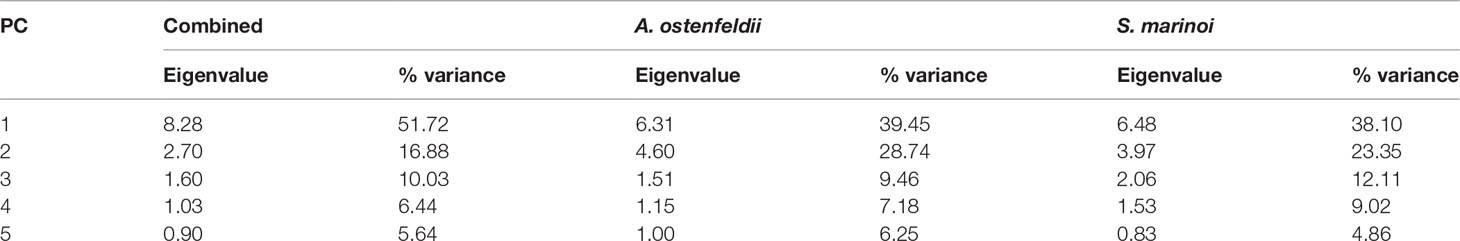
Table 2 Eigenvalue and percent variance explained by the first five principal components from the PCA of the phytoplankton traits for the two species.
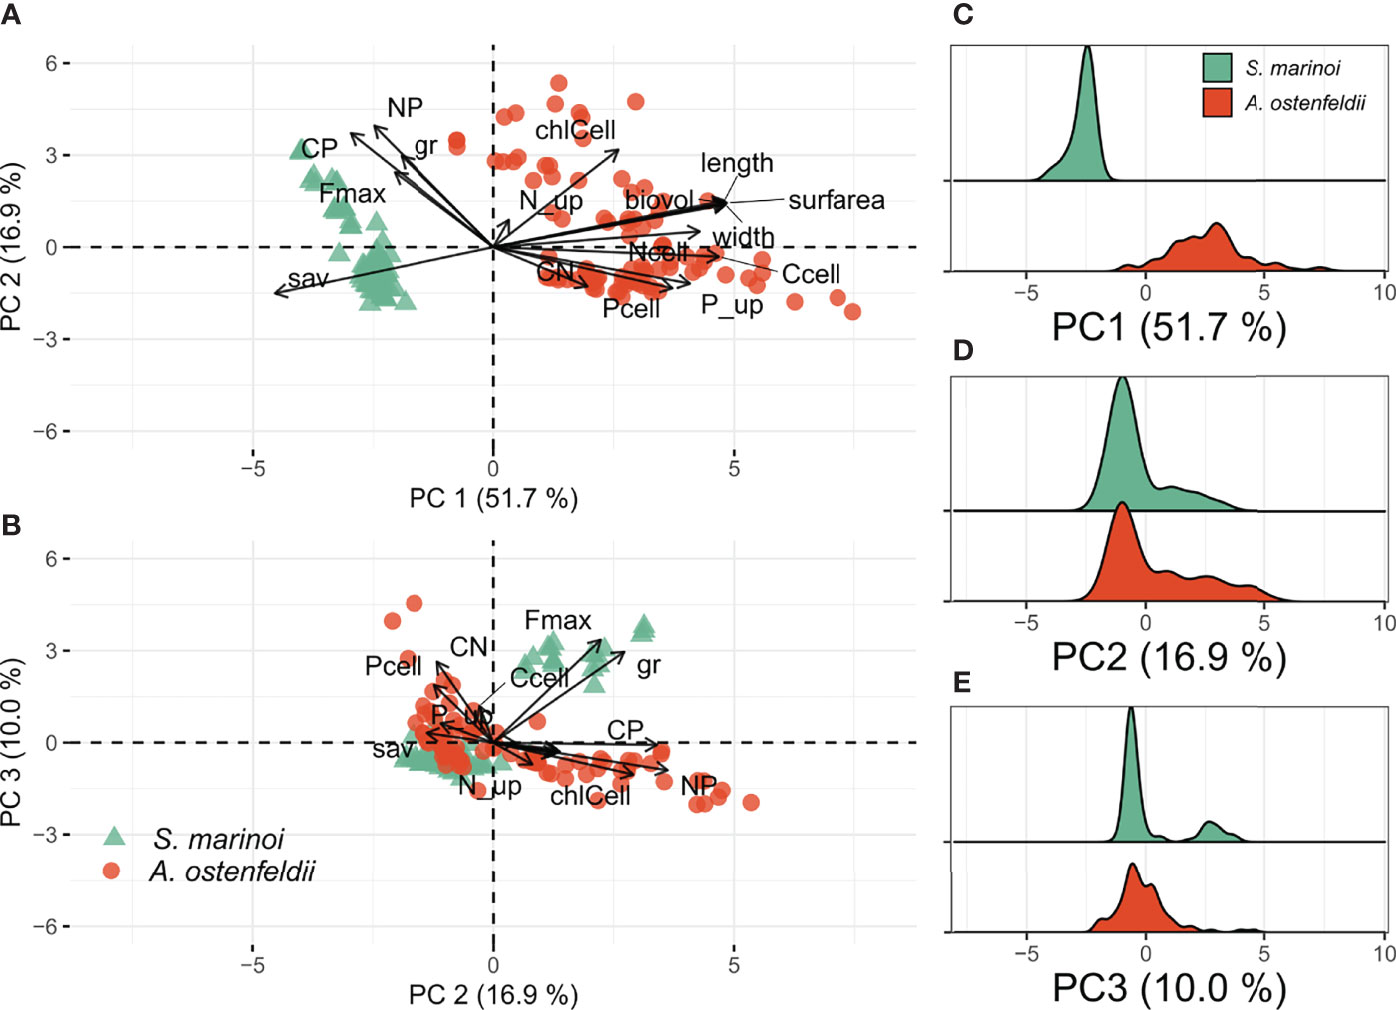
Figure 1 Results of PCA for two species. Ordination plots summarizing traits variation of A. ostenfeldii and S. marinoi strains (A, B). Density plots of individual loadings grouped by species (C–E). Traits abbreviations as in Table 1.
There was no clear clustering between species or salinity levels along the PC 2 axis. The N:P and C:P ratios, cellular chl a content (chl a), and growth rate (μ) together explained 68% of the total variation along the PC 2 (Table S1). The density plots of S. marinoi and A. ostenfeldii along the PC 2 axis had a distinct peak, which is characterized by a high P uptake rate (P_up) and high cellular P content (Pcell) (Figure 1D). In addition, S. marinoi had a minor peak characterized by faster growth rate, while the less distinct second peak in A. ostenfeldii distribution is characterized by high cellular chl a content (Figure 1B).
The distribution of traits along the PC 3 axis was generally similar for both species, with maximum fluorescence (Fmax) and µ contributing the most to the variability (32% and 25%, respectively). In addition, there was a small cluster of S. marinoi with high Fmax and µ (Figure 1E).
Covariation of Traits
Pairwise Pearson correlation coefficients were calculated to test how different traits were interrelated in both species (Figure 2). Traits related to cell morphology and size (length, width, biovolume, surface area, and surface area to volume ratio) were highly correlated with each other in both species, but the correlation between morphological traits with the other traits was species-specific. Interestingly, cellular carbon content (Ccell) was strongly positively correlated with cell size in A. ostenfeldii but not in S. marinoi. Traits related to cell size were strongly correlated to C:P and N:P elemental ratios in S. marinoi but not in A. ostenfeldii. C:N ratio was positively correlated with traits related to growth (Fmax, µ) in S. marinoi but negatively in A. ostenfeldii.
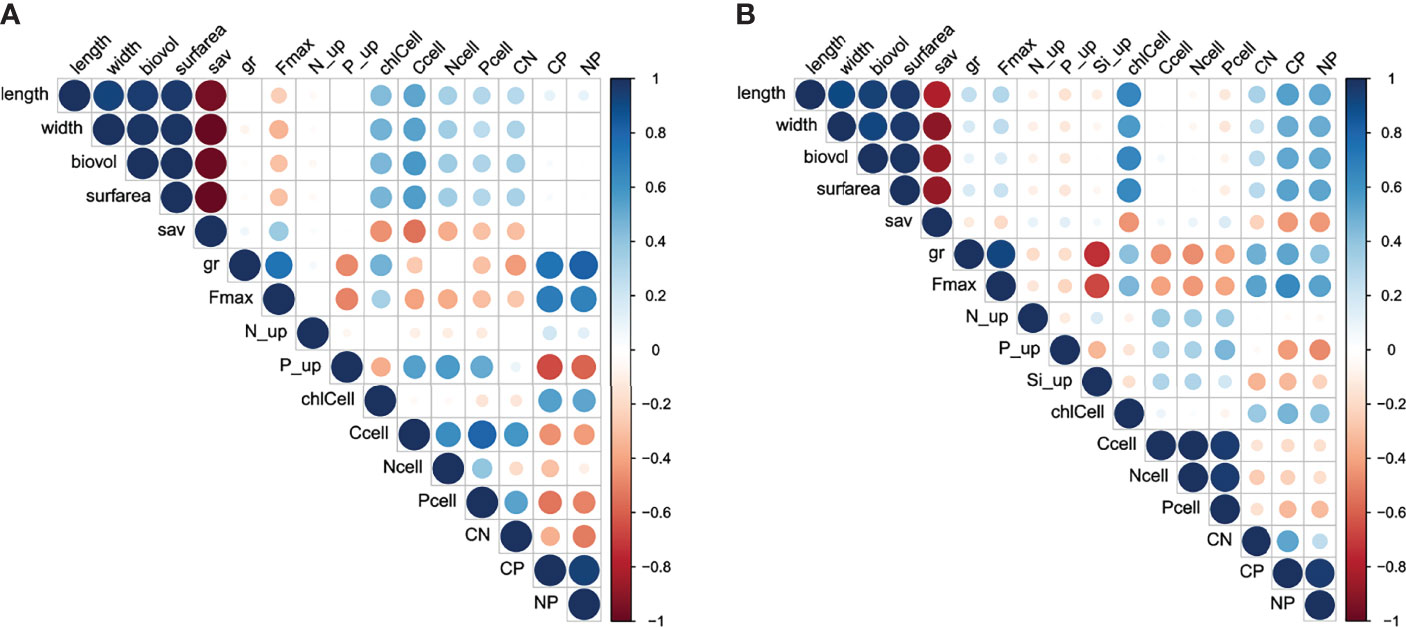
Figure 2 Correlation matrix of the different traits measured from different (A) A. ostenfeldii and (B) S. marinoi strains grown under different salinity conditions.
Within-Species Comparison
The intraspecific traits variability was further explored by performing independent PCA for each species. Results of PCA on traits of A. ostenfeldii strains indicated that the first three components explained 78% of the total variation (Figures 3A, B). Morphological traits (length, width, biovolume, surface area, and surface area to biovolume ratio) explained 59%, and Ccell 11% of the variation in PC 1. The C:P and N:P ratios, and chl a had the highest contributions to PC 2, collectively explaining 44% of the variation. Nitrogen content (Ncell) and C:N ratio were the most important traits for PC 3, explaining 65% of the total variation (Table S2).
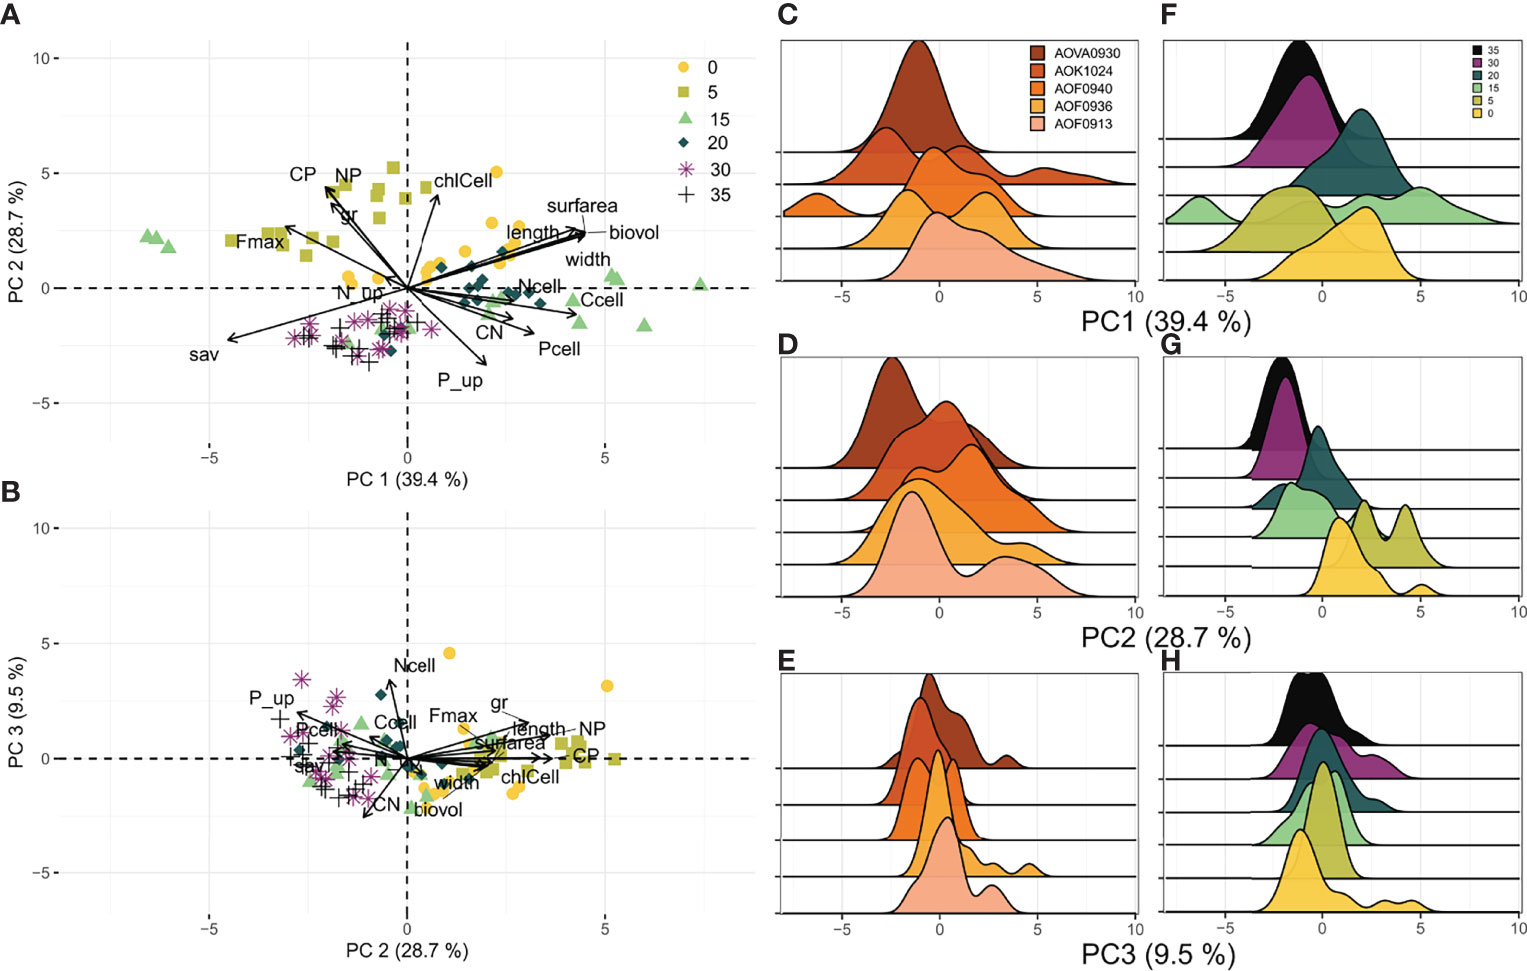
Figure 3 Results of PCA for A. ostenfeldii strains grown under six salinity levels. (A, B) Ordination plots summarizing the variation of traits in all experimental units. (C–E) Individual loading grouped by strain along the first three principal component axes. (F–H) Individual loading grouped by salinity along the first three principal component axes. Traits abbreviations as in Table 1.
High intraspecific trait variability among A. ostenfeldii along PC 1 was observed at 15 psu (Figure 3F). There were two distinct clusters at this salinity level: one characterized by high Fmax and sav, and another characterized by big cells (biovolume, surface area) with high carbon content (Figure S1). Interestingly, strains grown at low salinity levels (0 and 5 psu) showed narrower trait distribution along the PC1 axis than 15 psu. Strains grown in 5 psu were characterized by high growth rate (µ), Fmax, N:P, and C:P ratios (Figure 3A). Strains grown in 0 psu treatment were characterized by large cells. Observations for 30 and 35 psu clustered together, suggesting low intraspecific trait variability at these salinity levels. Strains grown at the highest salinity levels (30 and 35 psu) were characterized by almost nominal growth (low µ) and low C:P and N:P ratios.
The silica uptake rate was included in the PCA of S. marinoi; however, it did not contribute substantially to the PC 1 variation. Instead, morphological traits (length, width, biovolume, surface area, and sav) and C:P ratio were the most important traits, contributing 59% to the total variation along the PC 1 axis (Figure 4). The elemental concentrations of carbon, nitrogen, and phosphorus in S. marinoi cells were the most important traits for PC 2, contributing 47% to the total variation. Finally, the silica uptake rate was the most important trait for PC 3, contributing 18% to the total variation (Table S3).
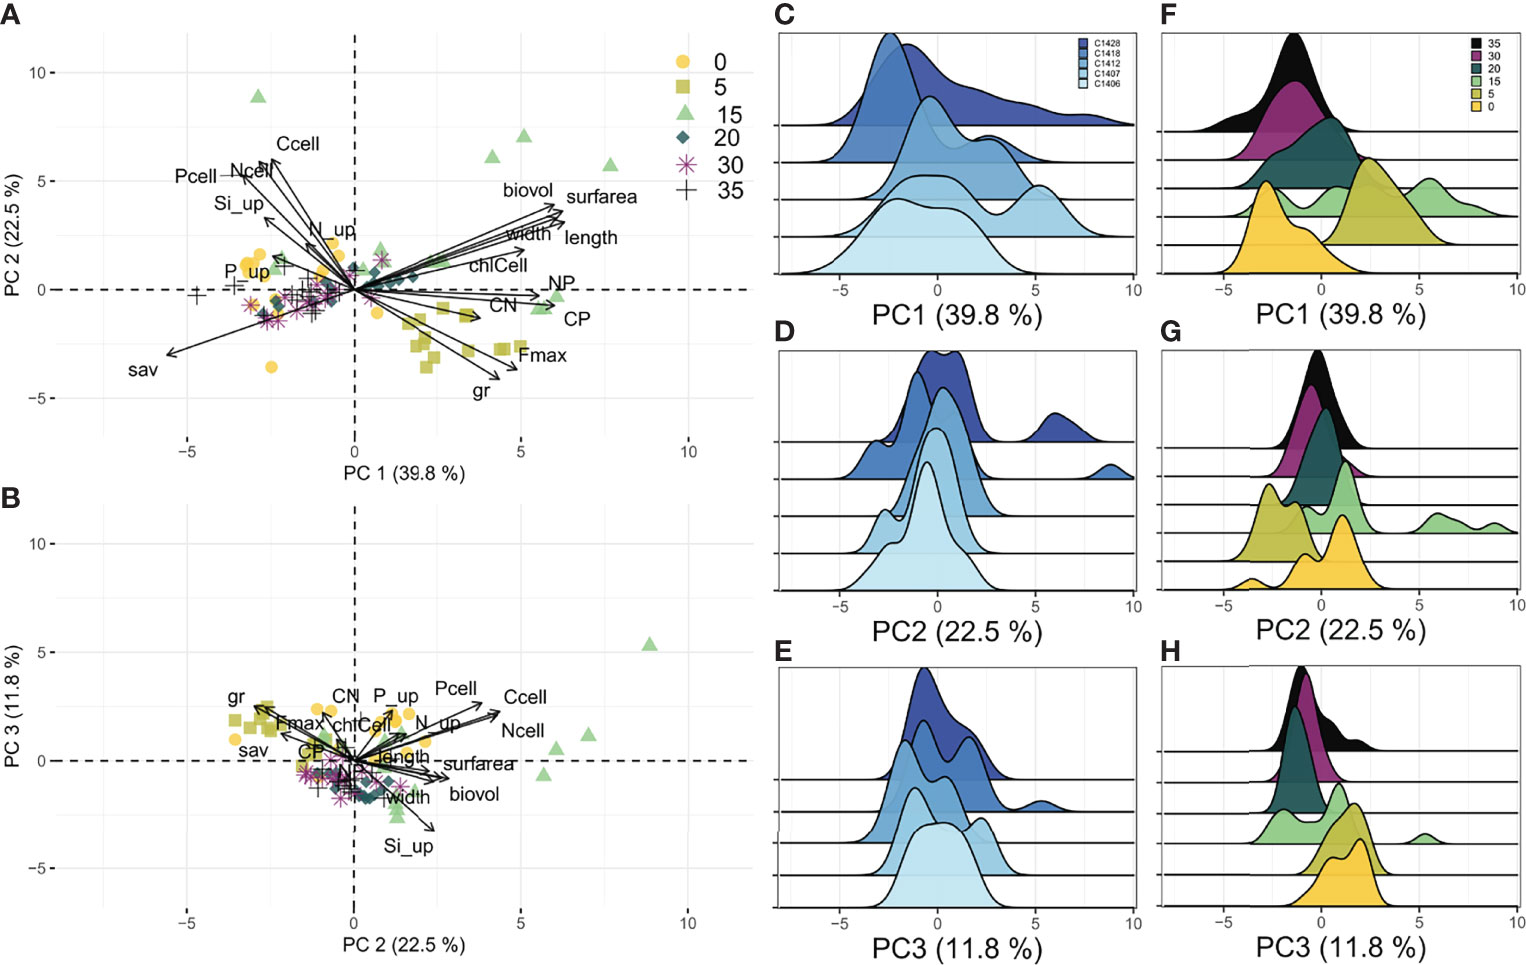
Figure 4 Results of PCA for S. marinoi strains grown under six salinity levels. (A, B) Ordination plots summarizing the variation of traits in all experimental units. (C–E) Individual loading grouped by strain along the first three principal component axes. (F–H) Individual loading grouped by salinity along the first three principal component axes. Traits abbreviations as in Table 1.
The observations of S. marinoi grown in 15 psu are spread along PC 1 axis, indicating high intraspecific trait variability (e.g., high variability in biovolume and C:P ratio). Strains grown at low salinity levels (0 and 5 psu) were less variable. Strains grown in 5 psu were generally -growing and highly productive (high µ and Fmax), while strains in 0 psu showed no signs of growth or biomass production (low µ and Fmax). Finally, strains grown in 30 and 35 psu clustered together and had similar and narrow trait distribution.
Plasticity of Individual Traits
Based on the highest contribution of individual traits to PC 1 variability in both species (Tables S2 and S3), we selected cell length to compare the plasticity of a single trait for different strains of both species (H3). Cell length is one of the simplest morphological traits to measure, is directly related to the metabolism, and provides important information about the ecological niche distribution (Ryabov et al., 2021). It is also strongly correlated to cell biovolume and other morphological traits (Figure 2) and, therefore, a good proxy for cell size and elongation. The plasticity of the additional two traits (Ccell and C:P ratio), which also contributed significantly to PC 2 variation, is presented in the Supplementary Online Material (Figure S3).
There was a significant difference in cell length plasticity (measured as the coefficient of variation) between species, wherein the cell length of S. marinoi was more plastic in response to salinity change than the cell length of A. ostenfeldii (Figure 5 and Table S4). Among S. marinoi, the C1428 strain had the highest cell length plasticity (CV=36.1, Table S4), and among A. ostenfeldii, AOK1024 was the most plastic in cell length (CV = 16, Table S4). Overall, there was no clear pattern in cell length or size along the salinity gradient, and the response of both species to salinity change was strain specific.
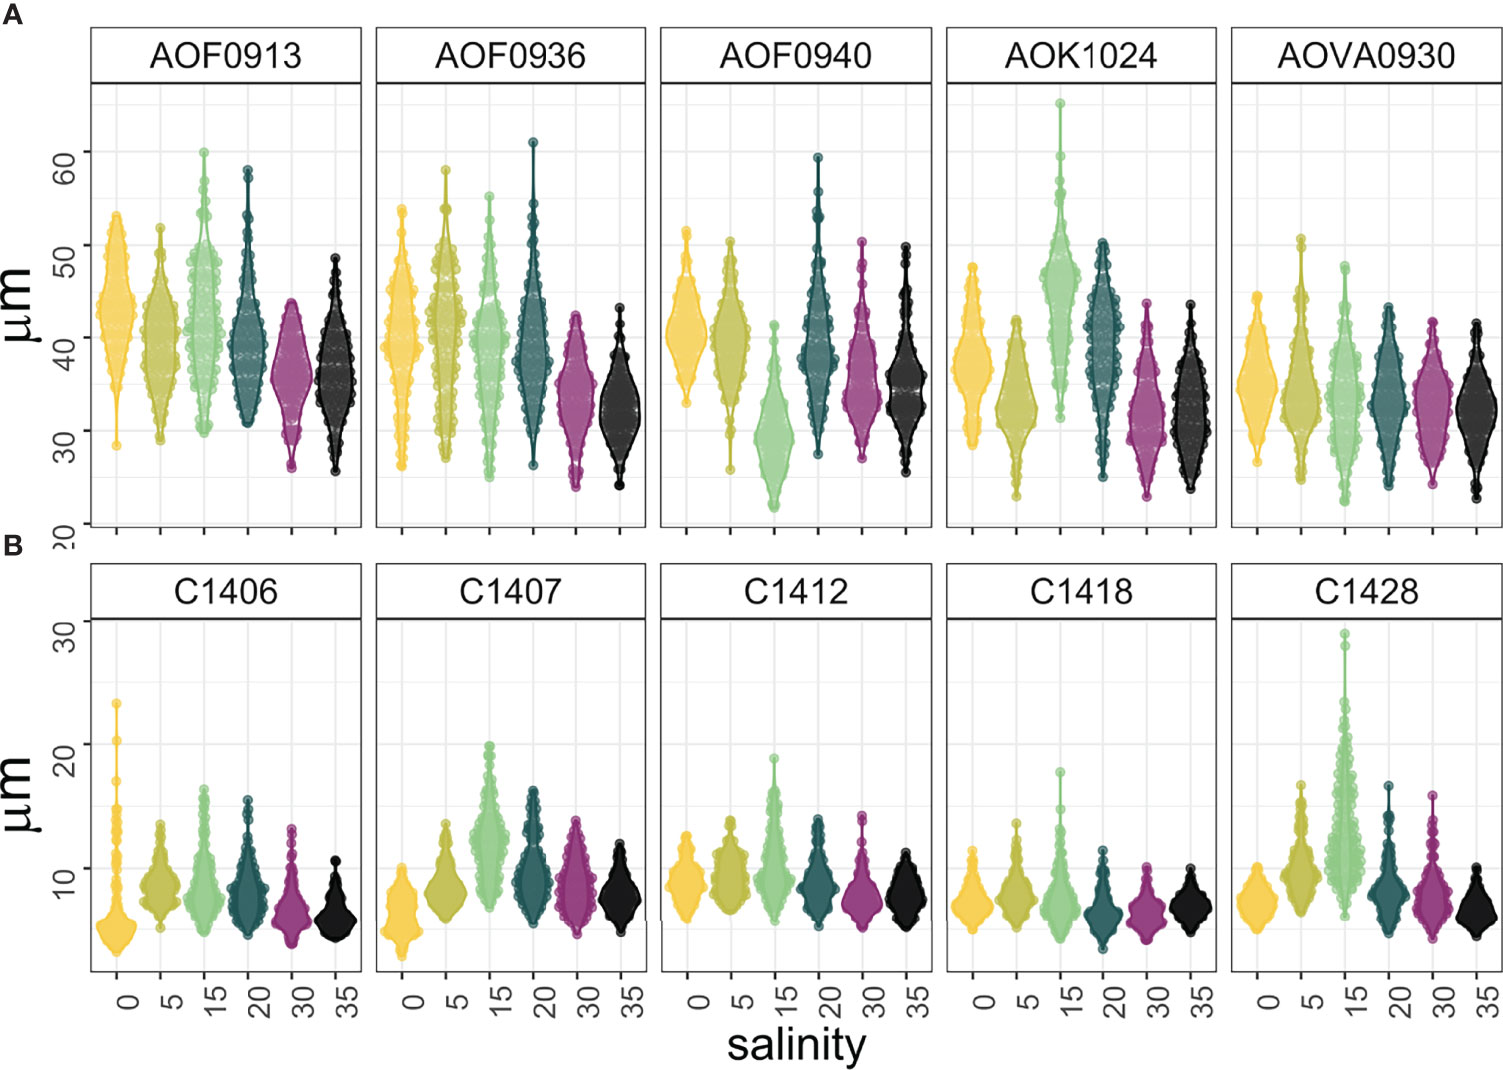
Figure 5 Cell length of (A) A. ostenfeldii and (B) S. marinoi strains along a salinity gradient (n = 150).
Discussion
From the ecological perspective, the predicted shift in salinity caused by climate-induced changes in precipitation (Durack and Wijffels, 2010; Durack et al., 2012) can negatively impact phytoplankton diversity due to the local extinction of sensitive species. Intraspecific traits variability (i.e., within-species trait variability) provides a buffer against biodiversity loss by modulating species responses to changing environments (Reusch et al., 2005; Albert et al., 2010; Sjöqvist and Kremp, 2016). Therefore, we tested intraspecific trait variability and plasticity of two common and well-studied phytoplankton species, a diatom (S. marinoi) and a dinoflagellate (A. ostenfeldii), which are expected to tolerate broad salinity ranges.
First, we asked if we could uncover different strategies of A. ostenfeldii and S. marinoi using the multivariate trait-based approach (H1). The results from PCA comparing both species identified the most important traits which differentiate the two (Figure 1). The analysis provided an expected outcome that the A. ostenfeldii cells were considerably larger and contained more carbon per cell, typical for dinoflagellates (Menden-Deuer and Lessard, 2000), whereas S. marinoi cells had a larger surface area to volume ratio, typical for diatoms. Further investigation of the correlation between different traits unraveled important trade-offs (Figure 2), suggesting different growth strategies of A. ostenfeldii and S. marinoi. Cell size (biovolume, cell length, width, and surface area) of A. ostenfeldii was positively correlated with cellular carbon, nitrogen, and phosphorus content (Ccell, Ncell, and Pcell), but negatively correlated with maximum chl a fluorescence (Fmax) (Figure 2A). This result means that although cells were investing in building up biomass and accumulating nutrients, they did not maximize photosynthesis to a similar extent. This suggests that A. ostenfeldii could cope with changing salinity by producing resting cysts, which contain more C, but less chlorophyll a (chl a) than vegetative cells (Binder and Anderson, 1990; Lirdwitayaprasit et al., 1990). In this study, we did not perform a quantitative analysis of cysts, but resting cysts were observed in all treatments, especially under 30 and 35 psu. Lower C:P ratios under higher salinity conditions (Figure S3) support this conjecture, as P is used up during the encystment process (Anderson and Lindquist, 1985) while C is locked within the cellular structure (Lirdwitayaprasit et al., 1990).
In contrast to the “stayin’ alive” strategy (slow growth, nutrient accumulation, resting cysts) of A. ostenfeldii, the strategy of S. marinoi was focused on maximizing population growth. Cell size and morphology of S. marinoi were not significantly correlated with Ccell, Ncell, and Pcell (Figure 2), but positively correlated with cellular chl a content (chlCell) and Fmax, suggesting that nutrients taken up by S. marinoi were immediately used to produce daughter cells rather than stored in the cell, like in the case of A. ostenfeldii.
Contrasting growth strategies of A. ostenfeldii and S. marinoi could eventually translate into different responses to salinity stress (H2). A. ostenfeldii spreads wider among the multivariate trait space than S. marinoi (Figure 1), suggesting greater trait plasticity and/or greater intraspecific variability. The former explanation is more likely because no clusters corresponding to different strains were detected in the multivariate trait space (Figure S2), despite the AOVA0930 strain being isolated from a different Baltic Sea sub-basin (Baltic Proper) than all other strains (Gulf of Bothnia). However, the greater trait plasticity of A. ostenfeldii was not related to a better tolerance to salinity stress. Both species grew the best in 5 – 15 psu (Figure S3), corresponding to their original local environmental conditions of the Baltic Sea. This result indicates the local adaptation of these strains to brackish conditions.
Regarding particular traits, the genus Skeletonema, considered morphologically plastic and diverse, has been shown to grow well under different salinities (including freshwater), and undergo cell enlargement under high salinity conditions (Balzano et al., 2011). Contrary to these expectations, we did not observe cell elongation at high salinity levels for marinoi strains had a higher C:P ratio at intermediate salinity levels, but with the maximumhe S. marinoi strains. Instead, the biggest and most elongated cells were observed at intermediate salinities, and the S. marinoi size decreased towards extremes for 4 out of 5 strains (Figures 5). This pattern was observed for S. marinoi but not for A. ostenfeldii (Figures 3, 4).
C:P ratio, which defined the traits distribution of A. ostenfeldii along the PC2 axis (Figure 3), was significantly higher at low salinity levels (0-5 psu), although still much lower than the balanced Redfield ratio of 106:1 (Redfield, 1958). Such enhanced C:P ratio can be linked to higher photosynthetic activity of A. ostenfeldii at low salinity levels, indicated by higher growth rate, cellular chl a, and C content (Figure S3). Higher cellular carbon quotas and C:P ratios might suggest higher toxin (e.g., paralytic shellfish toxins, spirolides) production by A. ostenfeldii under low salinity conditions (Martens et al., 2016) with a potentially negative impact on zooplankton caused by toxicity and P-limitation (Van de Waal et al., 2010; Ryderheim et al., 2021).
We finally asked if some strains of the same species are more plastic than the others (H3), i.e., if there are strains characterized by higher trait variability along the salinity gradient. Independent on species, all strains had high size variability at 15 psu (Figure 5), and low morphological plasticity at high salinity levels (30 and 35 psu). However, the latter should be interpreted with caution for A. ostenfeldii, as all strains had low growth rates and notable presence of cysts under the highest salinity conditions (Figure S3). We found that strains of A. ostenfeldii and S. marinoi significantly differ in cell length, carbon content, and C:P ratio plasticity in response to salinity change (Figures 3, 4 and S2). Cell length of A. ostenfeldii was highly variable (Figure 5). One strain (AOF0940) showed a similar response to salinity change as in the study of Martens et al. (2016), where the smallest biovolume of A. ostenfeldii isolated from the creek in the Netherlands, characterized by strong salinity fluctuations, was observed at intermediate salinity levels (15 – 20 psu). A. ostenfeldii strains used in this study, which were isolated from the Baltic Sea (6 – 7.5 psu) showed varying degrees of cell size plasticity (Figure 5), emphasizing the importance of intraspecific diversity for phytoplankton adaptation to salinity change.
The response of S. marinoi strains to salinity change was rather consistent in their morphology (Figure 5), but significantly varied in their elemental composition (Figure S3). Three strains had higher cellular carbon content at higher salinity levels, while two strains accumulated more carbon at 15 psu (Figure S3). All S. marinoi strains had a higher C:P ratio at intermediate salinity levels, but with the maximum value either at 5 psu or 15 psu, depending on the strain (Figure S3).
In conclusion, although both phytoplankton species, the diatom, and the dinoflagellate, significantly differed in trait composition (Figure 1), it did not translate into different performances along the salinity gradient. Both species grew the best under intermediate salinities, to which they were locally adapted. We should, however, emphasize that phytoplankton communities are highly diverse and contain thousands of clonal lineages, and our study represents only a small fraction of natural intraspecific variability. Despite this limitation, we were able to show that the response to salinity change is strain-specific, elucidating the importance of intraspecific trait plasticity to cope with environmental fluctuations.
Data Availability Statement
The raw data supporting the conclusions of this article will be made available by the authors, without undue reservation.
Author Contributions
IO and AL designed the study. IO performed all experiments and data analyses. Both authors contributed to the manuscript writing. All authors contributed to the article and approved the submitted version.
Funding
This study was supported by the Walter and Andrée de Nottbeck Foundation.
Conflict of Interest
The authors declare that the research was conducted in the absence of any commercial or financial relationships that could be construed as a potential conflict of interest.
Publisher’s Note
All claims expressed in this article are solely those of the authors and do not necessarily represent those of their affiliated organizations, or those of the publisher, the editors and the reviewers. Any product that may be evaluated in this article, or claim that may be made by its manufacturer, is not guaranteed or endorsed by the publisher.
Acknowledgments
This study was funded by the Walter and Andrée de Nottbeck Foundation. We used phytoplankton strains from the FINMARI Culture Collection/SYKE Marine Research Centre and Tvärminne Zoological Station (FINMARI CC), and the Tvärminne Zoological Station as a part of the national FINMARI RI.
Supplementary Material
The Supplementary Material for this article can be found online at: https://www.frontiersin.org/articles/10.3389/fmars.2022.880309/full#supplementary-material
References
Abrams P. (1983). The Theory of Limiting Similarity. Ann. Rev. Ecol. Syst. 14, 359–376. doi: 10.1146/annurev.es.14.110183.002043
Albert C. H., Thuiller W., Yoccoz N. G., Soudant A., Boucher F., Saccone P., et al. (2010). Intraspecific Functional Variability: Extent, Structure, and Sources of Variation. J. Ecol. 98, 604–613. doi: 10.1111/j.1365-2745.2010.01651.x
Anderson D. M., Lindquist N. L. (1985). Time-course Measurements Phosphorus Depletion Cyst Formation Dinoflagellate Gonyaulax Tamarensis Lebour. J. Exp. Mar. Biol. Ecol. 86, 1–13. doi: 10.1016/0022-0981(85)90039-5
Argyle P. A., Walworth N. G., Hinners J., Collins S., Levine N. M., Doblin M. A. (2021). Multivariate Trait Analysis Reveals Diatom Plasticity Constrained to a Reduced Set of Biological Axes. ISME 1, 59 doi: 10.1038/s43705-021-00062-8
Arrigo K. R., Robinson D. H., Worthen D. L., Dunbar R. B., Di Tullio G. R., Van Woert M., et al. (1999). Phytoplankton Community Structure and the Drawdown of Nutrients and CO2 in the Southern Ocean. Science 283 (5400), 365–367. doi: 10.1126/science.283.5400.365
Balzano S., Sarno D., Kooistra W. H. C. F. (2011). Effects of Salinity on the Growth Rate and Morphology of Ten Skeletonema Strains. J. Plankton Res. 33, 937–945. doi: 10.1093/plankt/fbq150
Barron S., Weber C., Marino R., Davidson E., Tomasky G., Howarth R. (2002). Effects of Varying Salinity on Phytoplankton Growth in a Low-Salinity Coastal Pond Under Two Nutrient Conditions. Biol. Bull. 203, 260–261. doi: 10.2307/1543430
Beardall J., Allen D., Bragg J., Finkel Z. V., Flynn K. J., Quigg A., et al. (2009). Allometry and Stoichiometry of Unicellular, Colonial, and Multicellular Phytoplankton. New Phytol. Tansley Rev. 181, 295–309. doi: 10.1111/j.1469-8137.2008.02660.x
Binder B. J., Anderson M. (1990). Biochemical Composition and Metabolic Activity of Scrippsiella trochoidea (Dinophyceae) Resting Cysts. J. Phycol. 26, 289–298. doi: 10.1111/j.0022-3646.1990.00289.x
Bolnick D. I., Amarasekare P., Araújo M., Bürger R., Levine J. M., Novak M., et al. (2011). Why Intraspecific Trait Variation Matters in Community Ecology. Trends Ecol. Evol. 26, 183–192. doi: 10.1016/j.tree.2011.01.009
Brandenburg K. M., Krock B., Klip H. C. L., Sluijs A., Garbeva P., Van de Waal D. B. (2021). Intraspecific Variation in Multiple Trait Responses of Alexandrium ostenfeldii Towards Elevated Pco2. Harmful Algae 101. doi: 10.1016/j.hal.2020.101970
Brown L. M. (1982). Photosynthetic and Growth Responses to Salinity in a Marine Isolate of Nannochloris bacillaris (Chlorophyceae). J. Phycol 18, 483–488. doi: 10.1111/j.1529-8817.1982.tb03214.x
Campbell K., Mundy C. J., Juhl A. R., Dalman L. A., Michel C., Galley R. J., et al. (2019). Melt Procedure Affects the Photosynthetic Response of Sea Ice Algae. Front. Earth Sci. 7. doi: 10.3389/feart.2019.00021
Cavender-Bares J., Kitajima K., Bazzaz F. A. (2004). Multiple Trait Associations in Relation to Habitat Differentiation Among 17 Floridian Oak Species. Ecol. Monogr. 74, 635–662. doi: 10.1890/03-4007
Cembella A. D., Quilliam M. A., Lewis N. I., Bauder A. G., Aversano C. D., Thomas K., et al. (2002). The Toxigenic Marine Dinoflagellate Alexandrium tamarense as the Probable Cause of Mortality of Caged Salmon in Nova Scotia. Harmful Algae 1, 313–325. doi: 10.1016/S1568-9883(02)00048-3
Darwin C., Kebler L. (1859). On the Origin of Species by Means of Natural Selection, or, The Preservation of Favoured Races in the Struggle for Life (London: J. Murray).
Des Roches S., Post D. M., Turley N. E., Bailey J. K., Hendry A. P., Kinnison M. T., et al. (2018). The Ecological Importance of Intraspecific Variation. Nat. Ecol. Evol. 2, 57–64. doi: 10.1038/s41559-017-0402-5
D’ors A., Bartolomé M. C., Sánchez-Fortún S. (2016). Repurcussions of Salinity Changes and Osmotic Stress in Marine Phytoplankton Species. Estuar. Coast. Shelf Sci. 175, 169–175. doi: 10.1016/j.ecss.2016.04.004
Doucette G. J., Cembella A. D., Martin J. L., Michaud J., Cole T. V. N., Rolland R. M. (2006). Paralytic Shellfish Poisoning (PSP) Toxins in North Atlantic Right Whales Eubalaena glacialis and Their Zooplankton Prey in the Bay of Fundy. Canada. Mar. Ecol. Prog. Ser. 306, 303–313. doi: 10.3354/meps306303
Durack P. J., Wijffels S. E. (2010). Fifty-year Trends Global ocean salinities their relationship to broad-scale warming. J. Climate 23, 4342–4361. doi: 10.1175/2010JCLI3377.1
Durack P. J., Wijffels S. E., Matear R. J. (2012). Ocean Salinities Reveal Strong Global Water Cycle Intensification During 1950 to 2000. Science 336, 455–458. doi: 10.1126/science.1212222
Durbin E., Teegarden G., Campbell R., Cembella A., Baumgartner M. F., Mate B. R. (2002). North Atlantic Right Whales, Eubalaena glacialis, Exposed to Paralytic Shellfish Poisoning (PSP) Toxins via a Zooplankton Vector, Calanus finmarchicus. Harmful Algae 1, 243–251. doi: 10.1016/S1568-9883(02)00046-X
Feltz G. J., Miller G. E. (1996). An Asymptotic Test for the Equality of Coefficients of Variation From K Normal Populations. Stat. Med. 15, 647–658. doi: 10.1002/(SICI)1097-0258(19960330)15:6<647::AID-SIM184>3.0.CO;2-P
Field C. B., Behrenfeld M. J., Randerson J. T., Falkowski P. (1998). Primary Production of the Biosphere: Integrating Terrestrial and Oceanic Compounds. Science 281, 237–246. doi: 10.1126/science.281.5374.237
Finkel Z. N., Beardall J., Flynn K. J., Quigg A., Rees T. A. V., Raven J. A. (2010). Phytoplankton changing world: Cell size elemental stoichiometry. J. Plankton Res. 32, 119–137. doi: 10.1093/plankt/fbp098
Flameling I. A., Kromkamp J. (1994). Responses of Respiration and Photosynthesis of Scenedesmus protuberans Fritsch to Gradual and Steep Salinity Increases. J. Plank. Res. 16, 1781–1791. doi: 10.1093/plankt/16.12.1781
Flöder S., Hillebrand H. (2012). Species Traits and Species Diversity Affect Community Stability in a Multiple Stressor Framework. Aquat. Biol. 17, 197–209. doi: 10.3354/ab00479
Fontana S., Thomas M. K., Moldoveanu M., Spaak P., Pomati F. (2018). Individual-level trait Diversity predicts phytoplankton Community properties better than species richness evenness. ISME J. 12, 356–366. doi: 10.1038/ismej.2017.160
Fuji S., Yamamoto R., Nakayama S., Yasui S., Broady P. A. (1999). Effects of Salinity on Growth and Content of Intra- Cellular Solutes in Heterococcus sp (Tribonematales, Xanthophyceae) From Antarctica. Phycological Res. 47, 65–69. doi: 10.1111/j.1440-1835.1999.tb00285.x
Guillard R. R. L., Ryther J. H. (1962). Studies of Marine Planktonic Diatoms. I. Cyclotella nana Hustedt, and Detonula confervacea (Cleve) Gran. Can. J. Microbiol. 8, 229–239. doi: 10.1139/m62-029
Hansen H., Koroleff F. (2007). “Determination of Nutrients,” in Methods of Seawater Analysis. Eds. Grasshoff K., Kremling K., Ehrhardt M. (Weinheim: Wiley-VCH), 159–228.
He D., Biswas S. R., Xu M.-S., Yang T.-H., You W.-H., Yan E.-R. (2021). The Importance of Intraspecific Trait Variability in Promoting Functional Niche Dimensionality. Ecography 44, 380–390. doi: 10.1111/ecog.05254
Hernando M., Schloss I. R., Malanga G., Almandoz G. O., Ferreyra G. A., Aguiar M. B., et al. (2015). Effects of Salinity Changes on Coastal Antarctic Phytoplankton Physiology and Assemblage Composition. J. Exp. Mar. Biol. Ecol. 466, 110–119. doi: 10.1016/j.jembe.2015.02.012
Hillebrand H., Durselen C. D., Kirschtel D., Pollingher U., Zohary T. (1999). Biovolume Calculation for Pelagic and Benthic Microalgae. J. Phycol. 35 (2), 403–424. doi: 10.1046/j.1529-8817.1999.3520403.x
Kipriyanova L. M., Yermolaeva N. I., Bezmaternykh D. M., Dvurechenskaya S. Y., Mitrofanova E. Y. (2007). Changes in the Biota of Chany Lake Along Salinity Gradient. Hydrobiologia 576, 83e93. doi: 10.1007/s10750-006-0295-9
Kirst G. O. (1989). Salinity Tolerance of Eukaryotic Marine Algae. Annu. Rev. Physiol. Mol. Biol. 41, 21–53. doi: 10.1146/annurev.pp.41.060190.000321
Klais R., Tamminen T., Kremp A., Spilling K., Olli K. (2011). Decadal-Scale Changes of Dinoflagellates and Diatoms in the Anomalous Baltic Sea Spring Bloom. PLoS One 6 (6), e21567. doi: 10.1371/journal.pone.0021567
Koistinen J, Sjöblom M, Spilling M. (2017). "Determining Inorganic and Organic Phosphorus" in: Biofuels from Algae. Methods in Molecular Biology, vol. 1980. Eds. Spilling K.. (New York, NY: Humana), 89-94.
Kremp A., Godhe A., Egardt J., Dupont S., Suikkanen S., Casabianca S., et al. (2012). Intraspecific Variability in the Response of Bloom-Forming Marine Microalgae to Changed Climate Conditions. Ecol. Evol. 2 (6), 1195–1207. doi: 10.1002/ece3.245
Lehmann A., Myrberg K., Post P., Chubarenko I., Dailidiene I., Hinrichsen H.-H., et al. (2021). Salinity Dynamics of the Baltic Sea. Earth System Dynamics 13, 373–392. doi: 10.5194/esd-13-373-2022
Lê S., Josse J., Husson F. (2008). FactoMineR: A Package for Multivariate Analysis. J. Stat. Software 25(1), 1–18. doi: 10.18637/jss.v025.i01
Lirdwitayaprasit T., Okaichi T., Montani S., Ochi T., Anderson D. M. (1990). Changes in cell chemical composition during the life cycle of Scrippsiella trochoidea (Dinophyceae). J. Phycol. 26, 299–306. doi: 10.1111/j.0022-3646.1990.00299.x
MacArthur R., Levins R. (1967). The Limiting Similarity, Convergence, and Divergence of Coexisting Species. Am. Nat. 101, 377–385. doi: 10.1086/282505
Martens H., Van de Waal D. B., Brandenburg K. M., Krock B., Tillmann U. (2016). Salinity Effects on Growth and Toxin Production in Alexandrium Ostenfeldii From The Netherlands. J. Plankton Res. 0, 1–15. doi: 10.1093/plankt/fbw053
Marwick B., Krishnamoorthy K. (2019). Cvequality: Tests for the Equality of Coefficient of Variation From Multiple Groups. R Package Version 0.2.0.
Matsuyama K., Serisawa Y., Tanaka J. (2004). Growth, Maturation and Photosynthesis of the Brackish Water Alga Rhizoclonium sp (Cladophoraceae, Chlorophyta) in Relation to Salinity. Phycological Res. 52, 204–210. doi: 10.1111/j.1440-183.2004.00341.x
McGill B. J., Enquist B. J., Weiher E., Westoby M. (2006). Rebuilding Community Ecology From Functional Traits. Trends Ecol. Evol. 21, 178–185. doi: 10.1016/j.tree.2006.02.002
Meier M., Andersson H. C., Arheimer B., Blenckner T., Chubarenko B., Donnelly C., et al. (2012). Comparing Reconstructed Past Variations and Future Projections of the Baltic Sea Ecosystem—First Results From Multi-Model Ensemble Simulations. Environ. Res. Lett. 7, 34005. doi: 10.1088/1748-9326/7/3/034005
Meier H. E., Kniebusch M., Dieterich C., Gröger M., Zorita E., Elmgren R., et al. (2022). Climate Change in the Baltic Sea Region: A Summary. Earth Syst. Dyn. 13 (1), 457–593. doi: 10.5194/esd-13-457-2022
Menden-Deuer S., Lessard E. J. (2000). Carbon to Volume Relationships for Dinoflagellates, Diatoms, and of the Protist Plankton. Limnol. Oceanogr. 45, 569–579. doi: 10.4319/lo.2000.45.3.0569
Menden-Deuer S., Rowlett J. (2014). Many Ways to Stay in the Game: Individual Variability Maintains High Biodiversity in Planktonic Microorganisms. J. R. Soc Interface 11, 20140031. doi: 10.1098/rsif.2014.0031
Menden-Deuer S., Rowlett J., Nursultanov M., Collins S., Rynearson T. (2021). Biodiversity of Marine Microbes is Safeguarded by Phenotypic Heterogeneity in Ecological Traits. PLoS One 16 (8), e0254799. doi: 10.1371/journal.pone.0254799
Miller R. L., Kamykowski D. L. (1986). Effects of Temperature, Salinity, Irradiance and Diurnal Periodicity on Growth and Photosynthesis in the Diatom Nitzschia americana: Light-Saturated Growth. J. Phycol. 22, 339–348. doi: 10.1111/j.1529-8817.1986.tb00033.x
Mohammed A. A., Shafea A. A. (1992). Growth and Some Metabolic Activities of Scenedesmus obliquus Cultivated Under Different NaCl Concentrations. Biol. Plantarum 34 (5-6), 423–430. doi: 10.1007/BF02923592
Moisander P. H., McClinton E. III, Paerl H. W. (2002). Salinity Effects on Growth, Photosynthetic Parameters and Nitrogenase Activity in Estuarine Planktonic Cyanobacteria. Microbial Ecol. 43, 432–442. doi: 10.1007/s00248-001-1044-2
Mortensen A. M. (1985). “Massive Fish Mortalities in the Faroe Islands Caused by a Gonyaulax Excavata Red Tide”, in Toxic Dinoflagellates. Eds. Anderson D. M., White A. W., Baden D. G. (New York: Elsevier), 165–170.
Olli K., Ptacnik R., Klais R., Tamminen T. (2019). Phytoplankton Species Richness Along Coastal and Estuarine Salinity Continua. Am. Nat. 194, E41– E51. doi: 10.1086/703657
Ptacnik R., Solimini A. G., Andersen T., Tamminen T., Brettum O., Lepistö L., et al. (2008). Diversity Predicts Stability and Resource Use Efficiency in Natural Phytoplankton Communities. PNAS 105, 5134–5138. doi: 10.1073/pnas.0708328105
Qasim S. Z., Bhattathiri P. M. A., Devassy V. P. (1972). The Influence of Salinity on the Rate of Photosynthesis and Abundance of Some Tropical Phytoplankton. Mar. Biol. 12, 200–206. doi: 10.1007/BF00346767
Quinlan E. L., Phlips E. J. (2007). Phytoplankton Assemblages Across the Marine to Low-Salinity Transition Zone in a Blackwater Dominated Estuary. J. Plankton Res. 29, 401–416. doi: 10.1093/plankt/fbm024
R Core Team (2021). R: A Language and Environment for Statistical Computing. R Foundation for Statistical Computing (Vienna, Austria). Available at: https://www.R-project.org/.
Ryabov A.Kerimoglu O.Litchman E.Olenina I.Roselli L.Basset A. (2021). Shape Matters: The Relationship Between Cell Geometry and Diversity in Phytoplankton. Ecol. Lett. 24, 847–861. doi: 10.1101/2020.02.06.937219
Redfield A. C. (1958). The Biological Control of Chemical Factors in the Environment. Am. Scientist 46, 205–221.
Reusch T. B. H., Ehlers A., Ha A. (2005). Ecosystem Recovery After Climatic Extremes Enhanced by Genotypic Diversity. PNAS 102, 2826–2831. doi: 10.1073/pnas.0500008102
Ryderheim F., Selander E., Kiørboe T. (2021). Predator-Induced Defence in a Dinoflagellate Generates Benefits Without Direct Costs. ISME J. 15, 2107–2116. doi: 10.1038/s41396-021-00908-y
Saros J. E., Fritz S. C. (2000). Changes in the Growth Rates of Saline-Lake Diatoms in Response to Variation in Salinity, Brine Type and Nitrogen Form. J. Plankton Res. 22, 1071–1083. doi: 10.1093/plankt/22.6.1071
Sieburth J. M. C. N., Smetacek V., Lenz J. (1978). Pelagic Ecosystem Structure: Heterotrophic Compartments of the Plankton and Their Relationship to Plankton Size Fractions. Limnol. Oceanogr 23, 1256–1263. doi: 10.4319/lo.1978.23.6.1256
Šímová I., Violle C., Kraft N. J. B., Storch D., Svenning J.-C., Boyle B., et al. (2015). Shifts in Trait Means and Variances in North American Tree Assemblages: Species Richness Patterns are Loosely Related to the Functional Space. Ecography 38, 649–658. doi: 10.1111/ecog.00867
Sjöqvist C. O., Kremp A. (2016). Genetic Diversity Affects Ecological Performance and Stress Response of Marine Diatom Populations. ISME J. 10, 2755–2766. doi: 10.1038/ismej.2016.44
Spilling K., Olli K., Lehtoranta J., Kremp A., Tedesco L., Tamelander T., et al. (2018). Shifting Diatom—Dinoflagellate Dominance During Spring Bloom in the Baltic Sea and its Potential Effects on Biogeochemical Cycling. Front. Mar. Sci. 5. doi: 10.3389/fmars.2018.00327
Striebel M., Singer G., Stibor H., Andersen T. (2012). “Trophic Overyielding”: Phytoplankton Diversity Promotes Zooplankton Productivity. Ecology 93 (12), 2719–2727. doi: 10.1890/12-0003.1
Suikkanen S., Laamanen M., Huttunen M. (2007). Long-Term Changes in Summer Phytoplankton Communities of the Open Northern Baltic Sea. Estuar. Coast. Shelf Sci. 71), 580–592. doi: 10.1016/j.ecss.2006.09.004
Thessen A. E., Dortch Q., Parsons M. L., Morrison W. (2005). Effect of Salinity on Pseudo-Nitzchia Species (Bacillariophyceae) Growth and Distribution. J. Phycology 41, 21–29. doi: 10.1111/j.1529-8817.2005.04077.x
Utermöhl H. (1958). Zur Vervollkommnung Der Quantitativen Phytoplankton-Methodik. Mitt. Int. Ver. Theor. Angew. Limnol. 9, 1–38.
Vallina S., Cermeno P., Dutkiewicz S., Loreau M., Montoya J. (2017). Phytoplankton Functional Diversity Increases Ecosystem Productivity and Stability. M. Ecol. Model. 361, 184–196. doi: 10.1016/j.ecolmodel.2017.06.020
Van de Waal D. B., Verschoor A. M., Verspagen J. M. H., van Donk E., Huisman J. (2010). Climate-Driven Changes in the Ecological Stoichiometry of Aquatic Ecosystems. 8 (3), 145–152. doi: 10.1890/080178
Violle C., Enquist B. J., McGill B. J., Jiang L., Albert C. H., Hulshof C., et al. (2012). The Return of the Variance: Intraspecific Variability in Community Ecology. Trends Ecol. Evol. 27, 244–252. doi: 10.1016/j.tree.2011.11.014
Vuorinen I., Hänninen J., Rajasilta M., Laine P., Eklund J., Montesino-Pouzols F., et al. (2015). Scenario Simulations of Future Salinity and Ecological Consequences in the Baltic Sea and Adjacent North Sea Areas—Implications for Environmental Monitoring. Ecol. Indic. 50, 196–205. doi: 10.1016/j.ecolind.2014.10.019
Wasmund N., Nausch G., Matthäus W. (1998). Phytoplankton Spring Blooms in the Southern Baltic Sea - Spatio-Temporal Development and Long-Term Trends. J. Plankton Res. 20, 1099–1117. doi: 10.1093/plankt/20.6.1099
Keywords: phytoplankton traits, plasticity, cell size, stoichiometry, salinity
Citation: Orizar IDS and Lewandowska AM (2022) Intraspecific Trait Variability of a Diatom and a Dinoflagellate Along a Salinity Gradient. Front. Mar. Sci. 9:880309. doi: 10.3389/fmars.2022.880309
Received: 21 February 2022; Accepted: 06 June 2022;
Published: 13 July 2022.
Edited by:
Susana Agusti, King Abdullah University of Science and Technology, Saudi ArabiaReviewed by:
Dedmer B. Van de Waal, Netherlands Institute of Ecology (NIOO-KNAW), NetherlandsDeana Erdner, University of Texas at Austin, United States
Copyright © 2022 Orizar and Lewandowska. This is an open-access article distributed under the terms of the Creative Commons Attribution License (CC BY). The use, distribution or reproduction in other forums is permitted, provided the original author(s) and the copyright owner(s) are credited and that the original publication in this journal is cited, in accordance with accepted academic practice. No use, distribution or reproduction is permitted which does not comply with these terms.
*Correspondence: Iris Delos Santos Orizar, aXJpcy5vcml6YXJAaGVsc2lua2kuZmk=