 Tamara Cibic*
 Laura Baldassarre
 Federica Cerino
 Cinzia Comici
 Daniela Fornasaro
 Martina Kralj
 Michele Giani
- Oceanography Section, Istituto Nazionale di Oceanografia e di Geofisica Sperimentale – OGS, Trieste, Italy
Although the 14C-method remains one of the most sensitive measures of primary production in marine ecosystems, few data from coastal sublittoral areas are available. We applied an integrated approach to quantify the benthic (PPs) and pelagic (PPw) contributions to total primary production (PPt) in a 17-m deep coastal site. From March 2015 to March 2019, we carried out 16 in situ experiments on a seasonal basis, at the LTER site C1, whereas benthic rates were estimated in the laboratory. To relate PP to seawater physical features and to the water column stability, the Brunt-Väisälä frequency was calculated. We further related our PP rates to the abundance, biomass, main taxonomic groups and diversity of eukaryotic phytoplankton and microphytobenthos (MPB). In November 2018, the maximum PPw (6.71 ± 0.82 µgC L-1 h-1) was estimated at the surface layer, in correspondence to the highest value of dinoflagellates biomass (29.35 µgC L-1), on the account of small (<20 µm) naked and thecate forms. PPi, integrated over the water column, displayed the highest values in July 2017 and July 2018. In sediments, negative PPs values were estimated in late autumn/winter, when minima of MPB abundance occurred. The highest rates were displayed in January 2018 and October 2016 (28.50 and 17.55 mgC m-2 h-1), due to the presence of dominant diatoms Paralia sulcata and Nitzschia sigma var. sigmatella, respectively. The PPs contribution to PPt was negligible (<2%) in 6 out of 16 experiments, with a mean value of 11.3% (excluding negative PPs values) over the study period, while it reached up to 43% in January 2018. The principal component analyses revealed that nutrients availability affected the seasonal development of pelagic and benthic phototrophs and primary production more than the physical variables, except for the surface layer of the water column where temperature and salinity were the main drivers. Our results add on the limited database on primary production in sublittoral areas and represent one of the few attempts, on a global scale, of integrating pelagic and benthic primary production using the 14C method to quantify the overall ecosystem productivity.
Introduction
Shallow coastal photic systems are among the most productive on the planet (Odum, 1983). In these environments, light penetration to the bottom fuels multiple primary producers, including phytoplankton and benthic microalgae that develop on unvegetated soft bottoms (Sundbäck et al., 2000). Primary production measurement in marine waters is one of the most important tools to understand ecosystem functioning and the transport of inorganic/organic matter through the food web (Williams PJB et al., 2002). In shallow oligotrophic systems, pelagic production largely depends on rivers and freshwater-borne nutrient inputs (Mozetič et al., 2012), and internal recycling of nutrients particularly from sediments under seasonally elevated temperatures (Kemp et al., 1997). Aside from nutrients, coastal processes are largely influenced by physical factors such as light, temperature, stratification, winds and local currents that are key parameters regulating pelagic processes. On the other hand, rapid sinking of phytoplankton blooms and an efficient filtration of the water column by benthic fauna can determine a tight benthic-pelagic coupling that leads to a high local benthic production. Further, microbial mediated processes in sediments can enhance nutrient availability for primary production in both benthic and pelagic habitats and become important in regulating the relative magnitude of benthic versus pelagic primary production (Kennish et al., 2014).
Since the introduction of the radiolabelled carbon uptake method (Steemann Nielsen, 1952; Sorokin, 1958), the 14C technique has become the standard method for measuring primary production in seawater and thousands of measurements of pelagic primary production have been made at discrete locations throughout the world’s oceans. In contrast, several methodologies have been applied to estimate the benthic primary production in subtidal ecosystems. Among the 14C methods applied to the sediment matrix, the slurry technique is still largely used (Sundbäck et al., 2011; van der Molen and Perisinotto, 2011; Jacobs et al., 2021). Although the existing microgradients in the sediment are destroyed, if no nutrients are limiting in the surface sediments, the measured potential photosynthetic rates still reflect real rates (Barranguet et al., 1998; Kromkamp and Forster, 2006).
Regardless of the methodology, despite the large body of literature on primary production estimated from intertidal (Barranguet and Kromkamp, 2000; Serodio et al., 2008; Migné et al., 2009) and shallow subtidal/lagoon ecosystems (Blasutto et al., 2005; Murrell et al., 2009; Bartoli et al., 2012), corresponding studies of ecosystems at depths higher than 15 m are limited (Jahnke et al., 2008; Lehrter et al., 2014; Santema and Huettel, 2018; Cesbron et al., 2019). Moreover, very few microphytobenthic primary production estimates, using the 14C uptake, have been carried out in deeper subtidal areas (Sundbäck and Jönsson, 1988; Rogelja et al., 2016; Rubino et al., 2016). The importance of benthic microalgae for ecosystem primary production was first evaluated by Martin et al. (1987) and Longhurst et al. (1995) who estimated that 0.7% of the total oceanic production and 2.4-3.7% of the continental shelf production, respectively, is due to benthic microalgae. However, according to more recent estimates, the microphytobenthos may contribute for more than 50% to the total primary production in shallow coastal systems (Lehrter et al., 2014; Cesbron et al., 2019).
The Gulf of Trieste, located in the northern part of the Adriatic Sea, is a semi-enclosed basin with a maximum depth of 25 m. In this area, the phytoplankton development, in terms of microalgal blooms, community succession (Cabrini et al., 2012; Mozetič et al., 2012) and photosynthetic activity (Fonda Umani et al., 2004; Fonda Umani et al., 2007; Ingrosso et al., 2016; Cibic et al., 2018b; Talaber et al., 2018) is highly dependent on nutrient availability originating from freshwater discharges, and therefore responds to seasonal and interannual variations of riverine fluxes. On a seasonal basis, the pelagic ecosystem of the gulf shifts from a more nutrient enriched condition, typical of the late winter-spring season, when sufficient inorganic nutrients are available to sustain the main diatom bloom of the year, to an oligotrophic condition in summer-autumn, dominated by small-sized photoautotrophs (Fonda Umani et al., 2012). Focusing on the benthic domain, the microphytobenthic community at a 17-m deep site is not photosynthetically active throughout the year. From late summer to early winter, low or negative values are recorded in correspondence with low light and/or high temperature at the bottom (Cibic et al., 2008; Franzo et al., 2016). Although in the Gulf of Trieste primary production has been investigated both in the pelagic (Malej et al., 1995; Fonda-Umani et al., 2004; Fonda-Umani et al., 2007; Talaber et al., 2014; Ingrosso et al., 2016; Cibic et al., 2018b; Talaber et al., 2018) and benthic (Herndl et al., 1989; Cibic et al., 2008; Franzo et al., 2016; Rogelja et al., 2018) ecosystems over the last decades, estimates of the total (pelagic + benthic) rates are still very scarce (Testa et al., 2021).
Also on a global scale, very little information is available on combined benthic-pelagic primary production measurements (Lake and Brush, 2011; Cesbron et al., 2019; Frankenbach et al., 2020), even less considering the 14C incorporation method (Anandraj et al., 2007; van der Molen and Perissinotto, 2011). To the best of our knowledge, excluding the few estimates published in these shallow estuarine or semi-enclosed ecosystems (Cibic et al., 2016), there is no literature on integrated, quasi-synchronous benthic-pelagic primary production from subtidal, not enclosed marine areas using the 14C incubation technique. Therefore, to fill this knowledge gap, the aims of this study were to: i) investigate the pelagic and benthic primary production by performing quasi-synoptic estimates; ii) quantify the benthic contribution to total (pelagic + benthic) PP rates in an oligotrophic open coastal area; iii) highlight the most important physical and chemical drivers of the phototrophs’ development and their photosynthetic rates in both domains. Our guiding questions and hypotheses were: Q1) To what extent is pelagic PP controlled by nutrient conditions and water column stability? H1) We expect pelagic PP to be mostly P-limited during summer, and to obtain the highest rates in stable water column conditions. Q2) To what extent is benthic PP controlled by temperature and light conditions? H2) We expect benthic PP to be mostly inhibited by high temperatures during summer, and light limited during winter months. Q3) What is the relative importance of benthic PP in this system and how does it vary seasonally? H3) We expect total PP to be dominated by pelagic PP given the low light availability at the seafloor, except for clear water periods and during periods when pelagic PP is strongly nutrient depleted. Q4) Do the same abiotic factors equally affect the structure and function of the phototrophic communities along the water column and at the sediment surface? H4) We expect photosynthetic available radiation (PAR) availability to strongly affect the phototrophic development and PP at the lower layers of the water column and sediments, whereas temperature and salinity to be important drivers of the structure and function at the upper part of the water column. To test these hypotheses, between March 2015 and March 2019 we performed 16 in situ experiments on a seasonal basis, at four water depths of the sublittoral LTER site C1, whereas benthic rates were estimated in the laboratory within a few days. To relate PP to the water column stability, we calculated the Brunt-Väisälä frequency. We further computed monthly mean seawater temperature, salinity and PAR during the study period and compared them to climatological (1998 - 2019) mean data. To link our PP rates to phototrophs’ dynamics, we further considered the abundance, biomass, main taxonomic groups and diversity of eukaryotic phytoplankton and microphytobenthos (MPB). Finally, we highlighted which abiotic factors are the most important drivers in influencing the development of the phototrophs and their photosynthetic rates at the four water depths and surface sediments, separately, and comprehensively discussed the integrated results.
Material and Methods
Study Area
The Gulf of Trieste is a small (~ 500 km2) and shallow (maximum depth 25 m) basin in the northern part of the Adriatic Sea. In this area, freshwater inputs and atmospheric forcing greatly influence seawater temperature, salinity and water column stratification (Malačič and Petelin, 2001). The area is characterised by a marked seasonal cycle of seawater temperature (from winter minima of 8°C to summer maxima of 28.4°C) and strong salinity gradients (from 24.0, in spring during high riverine discharge, to 38.3) (Celio et al., 2006; Kralj et al., 2019). Typically, in winter, the water column is well-mixed, whereas during spring, freshwater input and surface heating lead to thermohaline stratification. The period between May and September is characterised by strong density gradients and the prevalence of respiration processes at the bottom layer, which determine low oxygen concentration and occasionally hypoxia events (Faganeli et al., 1985; Malej and Malačič, 1995; Kralj et al., 2019). In autumn, convective and mechanical mixing, induced by water cooling and wind, disrupt the vertical stratification, oxygenate the bottom water and distribute the re-generated nutrients to the entire water column.
The main riverine input in the Gulf of Trieste derives from Isonzo/Soča River on the north-western coast (Cozzi et al., 2012), which controls the salinity and nutrient concentration of the system with a highly variable outflow. On a seasonal scale, however, spring and autumn are generally characterised by the highest river discharges (due to snowmelt and rain, respectively), while drought periods occur during winter and summer (Comici and Bussani, 2007).
The trophic status of the gulf also depends on the prevailing circulation patterns and not only on the intensity of the Isonzo River discharge rate. Circulation in the gulf is mainly cyclonic at the transitional and lower layer (10 m – bottom), while the surface layer (0 – 4 m) is affected by wind conditions (Stravisi, 1983). There are mainly two dominant winds: the SE Scirocco and the NE Bora (Stravisi, 1977; Stravis, 1983). Bora-induced circulation is more frequent in autumn and winter, and it generates a cyclonic gyre at the surface layer, which causes a fast outflow of riverine waters from the gulf. When the Scirocco wind blows, instead, anticyclonic surface circulation favours eastward spreading of nutrient-enriched freshwater, which increases primary production (Cantoni et al., 2003; Querin et al., 2006).
The Gulf of Trieste is also influenced by the Eastern Adriatic Current (EAC), a current flowing northward along the Croatian coast and advecting warmer, saltier, and more oligotrophic waters coming from the Ionian Sea (Poulain et al., 2001). The ingression of EAC is more frequent in the cold seasons, when a cyclonic circulation is present, which can lead to oligotrophic conditions of the gulf.
Sampling and Environmental Data Collection
Sampling was performed at the Long-Term Ecological Research (LTER) station C1 (45°42’2” N and 13°42’36” E, maximum depth 17.5 m) located in the Gulf of Trieste (Figure 1). From March 2015 to March 2019, discrete seawater samples were collected on a seasonal basis with 5-L Niskin bottles at four depths (0.5, 5, 10, 15 m) for nutrient, phytoplankton and primary production analyses.
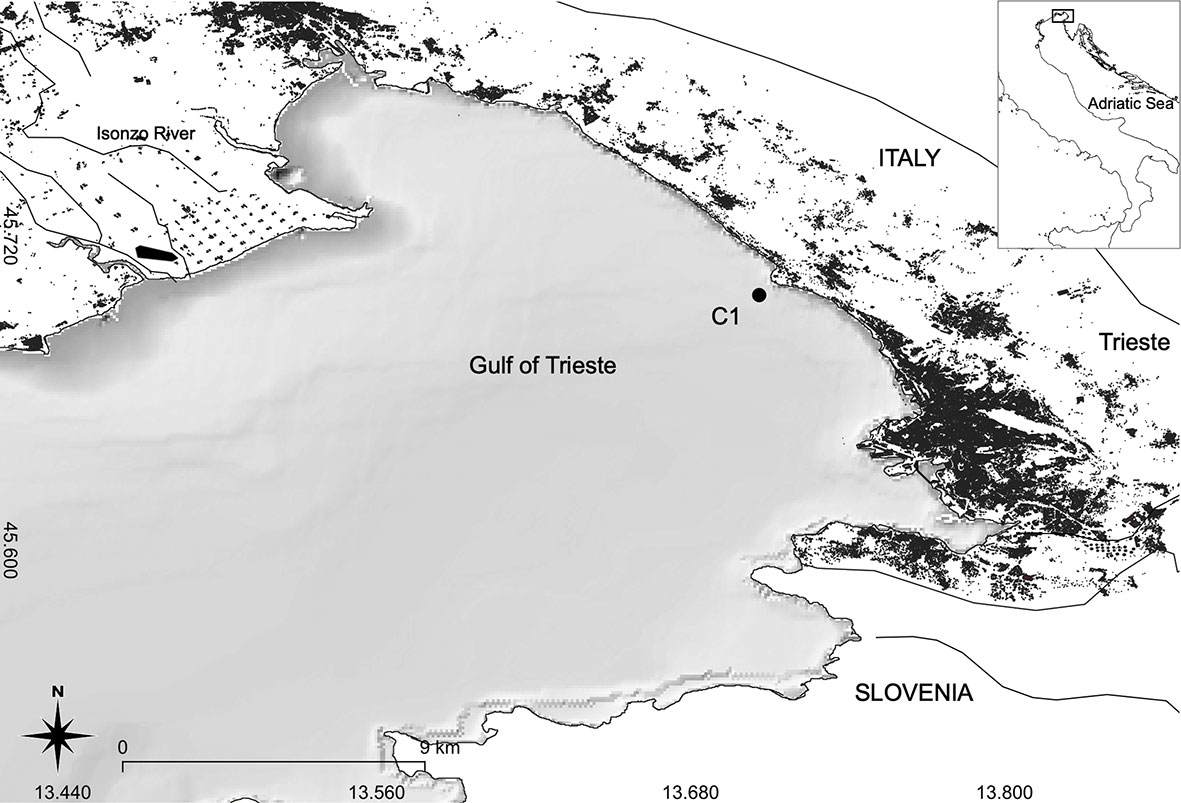
Figure 1 Study area.
Seawater temperature and salinity were recorded monthly by a CTD probe model Sea-Bird Electronics SBE 19plus SeaCAT profiler. These data were compared to the monthly means (1998 - 2019) that were recorded with the following probes: from January 1998 to October 1999 with an Idronaut mod. 401 probe; from November 1999 to September 2003 with an Idronaut mod. 316 probe. These CTD probes were calibrated with an interval of 6 - 12 months. From October 2003 onwards, a Sea Bird Electronics SBE 19 plus SeaCAT was used that was calibrated every year.
To have an indication of the water column stability the Brunt-Väisälä (B-V) frequency was applied. This frequency is a measure of the natural oscillation resulting from vertical displacement of a neutrally buoyant body. Higher values indicate a large density gradient and a strong stratification, while near-zero and negative values indicate unstable conditions. For the calculation, the Matlab routine called sw_bfrq (Revision 1.12, dated 1994/11/15, Copyright CSIRO, Phil Morgan 1993) contained in the SEAWATER package was used. This routine requires as input temperature (ITS-90), salinity and pressure (dbar) data and returns the Brunt-Väisälä square frequency (N2) at mid-latitudes. Results were plotted using ODV (Schlitzer, 2021) and weighted-average gridding (Ocean Data View User’s Guide, Version 5.6.0, 2022).
From March 2015 to September 2016, Photosynthetic available radiation (PAR) was recorded monthly by a PNF-300 Profiling Natural Fluorometer (Biospherical Instruments Inc., San Diego, USA), whereas from October 2016 onwards, a BNF-2102P S/N 1020 was used. These data were compared to the monthly means (November 1999 – September 2019) that were recorded with the above-mentioned probes. In 2015 the probe was sent to the USA for calibration and several monthly PAR data were missing, therefore we chose to exclude the year 2015 from the graphical representation of the monthly data.
Samples for the determination of dissolved inorganic nutrient concentrations (nitrite, N-NO2; nitrate, N-NO3; ammonium, N-NH4; phosphate, P-PO4; and silicate, Si-Si(OH)4) were pre-filtered through glass-fibre filters, pore size 0.7 µm (Whatmann GF/F), stored at -20°C and analysed on a four-channel continuous segmented flow analyser (QuAAtro, Seal Analytical), using standard colorimetric methods (Hansen and Koroleff, 1999). To highlight nutrient limitation for microalgal growth we applied the following inequalities to our ratios: Si:N < 0.80 indicates Si limitation (Brzezinski, 1985), N:P > 22 indicates P limitation and N:P < 13 indicates N limitation (Hillebrand and Sommer, 1999). We also applied the Redfield ratio N:P < 16 to highlight a slight N limitation (Redfield, 1958). With the exception of January 2017, sediment sampling was carried out within a few days (-2/+2) from water sampling. Due to bad weather conditions, in January 2016 and April 2017 up to 9 days passed between the two samplings.
Virtually undisturbed sediment cores were collected by an automatic KC Haps bottom corer (KC-Denmark) using polycarbonate sample tubes (13.3 cm i.d. with a sample area of 127 cm2); from one sediment core, in a N2-filled chamber the overlying water was sampled with a syringe, filtered through Millipore Millex HA 0.45 µm pore size cellulose acetate filters and collected in acid-precleaned vials which were stored at -20°C until nutrient analysis, while from other 3 sediment cores, the uppermost oxic layer (<1 cm) was sampled, pooled, homogenised and subsampled for the analysis of microphytobenthos and benthic primary production. At the moment of sampling, PAR, sea water temperature and salinity were measured as already specified for the water sampling.
Phytoplankton Abundance, Biomass and Community Structure
For phytoplankton (2-200 µm) analysis, samples were collected in 500 mL-dark bottles and preserved with pre-filtered and neutralized 1.6% formaldehyde (Throndsen, 1978). Cell counts were performed following the Utermöhl method (Utermöhl, 1958). A variable volume of seawater (10-50 mL) was settled depending on cell concentrations. Cell counts were performed using an inverted light microscope (Olympus IX71 and LEICA BMI3000B) equipped with phase contrast. Cells (minimum 200) were counted along transects (1–2) at a magnification of 400×. In addition, one half of the Utermöhl chamber was also examined at a magnification of 200×, to obtain a more correct evaluation of less abundant phytoplankton taxa. Phytoplankton specimens were identified to the lowest possible taxonomic level referring to Tomas (1997); Bérard-Therriault et al. (1999); Horner (2002); Young et al. (2003) and Malinverno et al. (2008). Species/genus names were checked for validity against AlgaeBase (Guiry and Guiry, 2022). The biovolume of phytoplankton cells was calculated according to Edler (1979) and Hillebrand et al. (1999). Cell volumes were converted to carbon content using the formula introduced by Menden-Deuer and Lessard (2000).
Cyanobacteria were not included in this study, however on average (over a 12-month study) they accounted for 13.3% of the total phytoplankton biomass in the same site (Cibic et al., 2018a), and their contribution to PP was previously presented and thoroughly discussed (Cibic et al., 2018b). Phytoplankton community loss factors (grazing pressure, viral infection) were not considered in this study.
Abundance, Biomass and Community Structure of Microphytobenthos
In this study, with the term microphytobenthos – MPB, we refer to the microscopic eukaryotic algae (diatoms, dinoflagellates, flagellates, etc.), and prokaryotic photosynthetic organisms, such as filamentous cyanobacteria. For MPB analyses, three aliquots of homogenized sediment (2 cm3) were withdrawn using a syringe and directly fixed with 10 mL of formaldehyde (4% final concentration) buffered solution CaMg(CO3)2, in pre-filtered bottom seawater (0.2 μm filters). After manual stirring, 20 μL aliquots of the sediment suspension were drawn off from the slurries and placed into a counting chamber. Only cells containing pigments and not empty frustules were counted under a Leitz inverted light microscope (Leica Microsystems AG, Wetzlar, Germany) using a 32× or 40× objective (320× or 400× final magnification) (Utermöhl, 1958). When possible, at least 200 cells were counted per sample to evaluate rare species, too. The microalgal taxonomy was based on AlgaeBase (Guiry and Guiry, 2022) and WoRMS (WoRMS Editorial Board, 2022) websites. The qualitative identification of MPB assemblages was carried out using floras listed in Cibic and Blasutto (2011). Quantitative data are reported as cells cm-3 of wet sediment (cells cm-3) and as Relative Abundance (RA). To estimate the biomass (expressed as μg cm-3), the biovolume of MPB cells was calculated according to Hillebrand et al. (1999). Afterwards, the MPB biomass was obtained multiplying the abundance (cells cm-3) by the carbon content of each counted cell using the formulas introduced by Menden-Deuer and Lessard (2000).
Pelagic and Benthic Primary Production
We estimated gross primary production (GPP) in water samples and in surface sediments by the 14C uptake (Steeman Nielsen, 1952). GPP represents the sum of net primary production (NPP) and community respiration (CR). The 14C technique measures values between GPP and NPP, depending on the incubation time: shorter incubation times are closer to GPP whereas incubation times ≥ 6 h are closer to NPP (Gazeau et al., 2004). In our study, the incubation time was about 2 hours for the water samples and 45 minutes for the sediment slurries, therefore in both cases a GPP rate was measured. From March 2015 to March 2019, pelagic primary production (PPw) was estimated in situ. Water samples were poured into three light and one dark 70 mL polycarbonate carboys (Nalgene) per each depth (0.5-5-10-15 m). The samples were kept in the dark for 30 minutes to stop residual photosynthetic activity. Subsequently, 0.22 MBq (6 μCi) of NaH14CO3 (DHI, Denmark) was added to each carboy. The samples were then fixed on a rosette, lowered to the corresponding sampling depth, and incubated for 2 h around noon. At the end of the incubation, the samples were stored in dark and cold conditions, and immediately transferred to the laboratory. From each sample, an aliquot of 25 mL was filtered through 0.2 μm polycarbonate filters (Nuclepore) applying low vacuum pressure (100 mmHg) in order to avoid cell damage. The filters were placed in 6 mL plastic scintillation vials (Perkin Elmer), acidified with 200 μL of HCl 0.5 M (Cibic and Virgilio, 2011) to remove the residual 14C-bicarbonate not assimilated by the phytoplankton, and an aliquot of 5 mL of scintillation cocktail (Filter Count; Perkin-Elmer) was added to each vial.
Benthic primary production (PPs) was estimated in the laboratory from 14C-incubation of slurries. An aliquot of 10 cm3 of homogenised surface sediment was withdrawn with a syringe, resuspended in 190 mL of overlying filtered seawater (0.2 μm filter), withdrawn from undisturbed sediment cores, and inoculated with 20 μCi (0.74 MBq) of NaH14CO3 (DHI, Denmark) (Steemann Nielsen, 1952). After stirring, the slurry was transferred into 21 glass vials containing 9 mL which were divided as follows: 3 replicates to assess the sediment matrix effect, 3 dark replicates and 3 replicates for each of the 5 light intensities used. In a thermostatic chamber the samples were incubated at the in situ temperature under a gradient of light intensities (20–50–100–200–500 μE m-2 s-1) and after 45 min carbon incorporation was stopped by adding 200 μL of HCl 5 N (final HCl concentration 0.11 N) (Cibic and Virgilio, 2010). Subsequently, samples were treated as described by Cibic et al. (2008). In this study only PPs rates, referred to data obtained at in situ light conditions, are presented and discussed.
Disintegrations per minute (DPM) were measured by a QuantaSmart TRI-CARB 2900 TR Liquid Scintillation Analyzer (Packard BioScience, USA) including quenching correction, obtained using internal standards. Assimilation of carbon was calculated as described by Gargas (1975), assuming 5% isotope discrimination. Activities of the added NaH14CO3 and inorganic carbon concentration (tCO2) were calculated on the basis of total alkalinity measured in the same samples. Standard deviation (SD) of three replicate values was below 25% except for rates close to zero for which SD was over 50%.
Volumetric PPw data were converted to areal data using standard trapezoidal integration over the top 15 m of the water column. Total incident photosynthetically active radiation was continuously recorded at the OGS laboratory at S. Croce using the scalar PAR surface reference sensor QSR2100 (Biospherical Instruments). PP hourly rates were then converted into daily rates considering the amount of light during incubation in situ, and the total amount of light during the sampling day computed by integrating the PAR data over the hours of daylight.
Statistical Analyses
Physical data (sea water temperature, salinity and PAR) of the sampling period were compared to the monthly mean climatology. The latter was computed on seawater temperature and salinity data recorded between 1998 and 2019, and on PAR data measured from November 1999 to September 2019. The monthly mean climatology was computed for each parameter at four sampling depths (0.5, 5, 10 and 15 m), except for surface PAR measurements that were carried out at 1 m instead of 0.5 m in order to reduce light scattering in the coastal waters. Whenever CTD and PAR measurements were performed with different sampling frequency (weekly and biweekly), data were averaged to a monthly value.
All statistical analyses, except for the correlations, were performed using PRIMER 7.0.21 (Clarke et al., 2014). To infer the temporal changes, the samples were grouped based on the sampling season considering the meteorological calendar. To highlight seasonal variability in the distribution of the phytoplankton and MPB biomass, a PERMANOVA test was used. “Season” was applied as a fixed factor in a one-way analysis. Unrestricted permutation of raw data, 9999 permutations and Monte Carlo pairwise comparisons were applied. To highlight relationships between abiotic and biotic variables, a Spearman rank correlation analysis (r) was performed using the software Past 4 (Hammer et al., 2001). Only statistically significant (p < 0.05) results are presented and discussed. For each water depth and for the sediment, the biological data were divided into two separated matrices, with the abundances and biomasses of phytoplankton and MPB taxa respectively. For each sampling layer, an additional matrix with the abiotic parameters (temperature, salinity, PAR, inorganic nutrients) was constructed. Univariate diversity analysis was applied to phytoplankton and benthic diatom abundances, after removing undetermined forms, considering richness (d, Margalef, 1986), equitability (J′, Pielou, 1966), diversity (H’(log2), Shannon and Weaver, 1949) and dominance (λ, Simpson, 1949). Before the multivariate analysis, each biotic matrix was log (x + 1) transformed. The data were then analyzed using cluster analysis (performed with the complete linkage clustering algorithm) and for the biotic matrices, a Bray-Curtis similarity was applied.
A Principal Component Analysis (PCA) was carried out on environmental data of each sampling layer (or sediment) in order to visualize the temporal distribution of main abiotic variables (salinity, temperature and nutrients).
To visualize differences in taxa assemblages among the different samplings, a non-metric multidimensional scaling ordination (nMDS) (Kruskal and Wish, 1978) was performed separately on the Bray-Curtis similarity matrix of phytoplankton at each sampled depth (0.5, 5, 10 and 15 m) and of MPB, after log (x + 1) transformation of the data. To highlight which taxa mainly contributed to the temporal variation of the assemblages, the taxa with the highest relative biomass (average ≥ 1% for the phytoplankton and ≥ 2% for the MPB, over the study period), were overlaid on the nMDS plot. The normalized (z-standardization) environmental variables (i.e. temperature, salinity, PAR and dissolved inorganic nutrients: N-NO2, N-NO3, N-NH4, P-PO4 and Si-Si(OH)4; for sediments also TOC and TN data presented in Franzo et al. (2019) were used) were fitted as supplementary variables (vectors) onto ordination spaces to investigate their effects on community structure, using an Euclidean distance matrix for physical-chemical data. The analyses were carried out on biomass values, since is the biomass, over the abundance that drives the primary production rate. On all the communities, we performed multivariate analyses to examine seasonal composition changes in relation to environmental factors. The following abiotic variables were considered for each sampling layer: i) physical parameters (temperature, salinity and light intensity); ii) inorganic nutrients (N-NH4, N-NO2, N-NO3, P-PO4, Si-Si(OH)4); and TOC and TN for sediments only. The significancy of differences among a priori-fixed seasons (winter: December, January, February; spring: March, April, May; summer: June, July, August; autumn: September, October, November) was tested by ANOSIM (ANalysis Of SIMilarity) (Clarke et al., 2014). The resulting pair-wise R-values give an absolute measure of separation among groups with zero (0) indicating no difference among groups, while one (1) indicating that all the samples within groups are more similar to one another than any samples from different groups.
Results
Physical-Chemical Properties of the Water Column
Comparing the seawater temperature to climatological (1998 - 2019) data, much lower values than the monthly means were recorded particularly in August 2015 (up to -4.73°C at the surface) and July 2018 (up to -2.16°C at the surface), and much higher values in May 2018 (up to +6.16°C at the bottom) and July 2015 (up to +4.30°C at the 5-m layer). (Figures S1A–D) In the sediment overlying water, the temperature, measured during seasonal samplings, ranged between a minimum of 9.45°C in January 2016 and a maximum of 22.16°C in July 2016 (Table S1).
The minimum of salinity recorded in May 2016 at the surface was -6.76 lower than the climatological (1998-2019) monthly mean and lower salinity persisted in the water column also in the following month. Higher values than the climatological monthly means were recorded at the surface particularly in spring-summer of 2018 (Figures S1E–H). In the sediment overlying water, the salinity, measured during seasonal samplings, ranged between a minimum of 36.99 in October 2015 and a maximum of 38.06 recorded in March 2019 (Table S1).
The degree of the water column stability was obtained by the Brunt-Väisälä (B-V) frequency that allows to identify the position of the seasonal pycnocline and further determine periods of substantial vertical gradients in water properties. The maximum B-V frequency along the water column was generally observed in late spring-summer, indicating the predominance of the thermal effect (Figure 2). However, marked differences among the investigated years were noticed. In particular, in 2016 a strong water stratification established at the surface in May, while a minimum B-V frequency was recorded in July. In 2017 maxima interested almost the whole water column both in June and July, with a minimum in July at -5m. The year 2018 was characterized by peaks at mid-water column from April to September, while in November 2018 a pycnocline appeared at about 2.5-m depth.
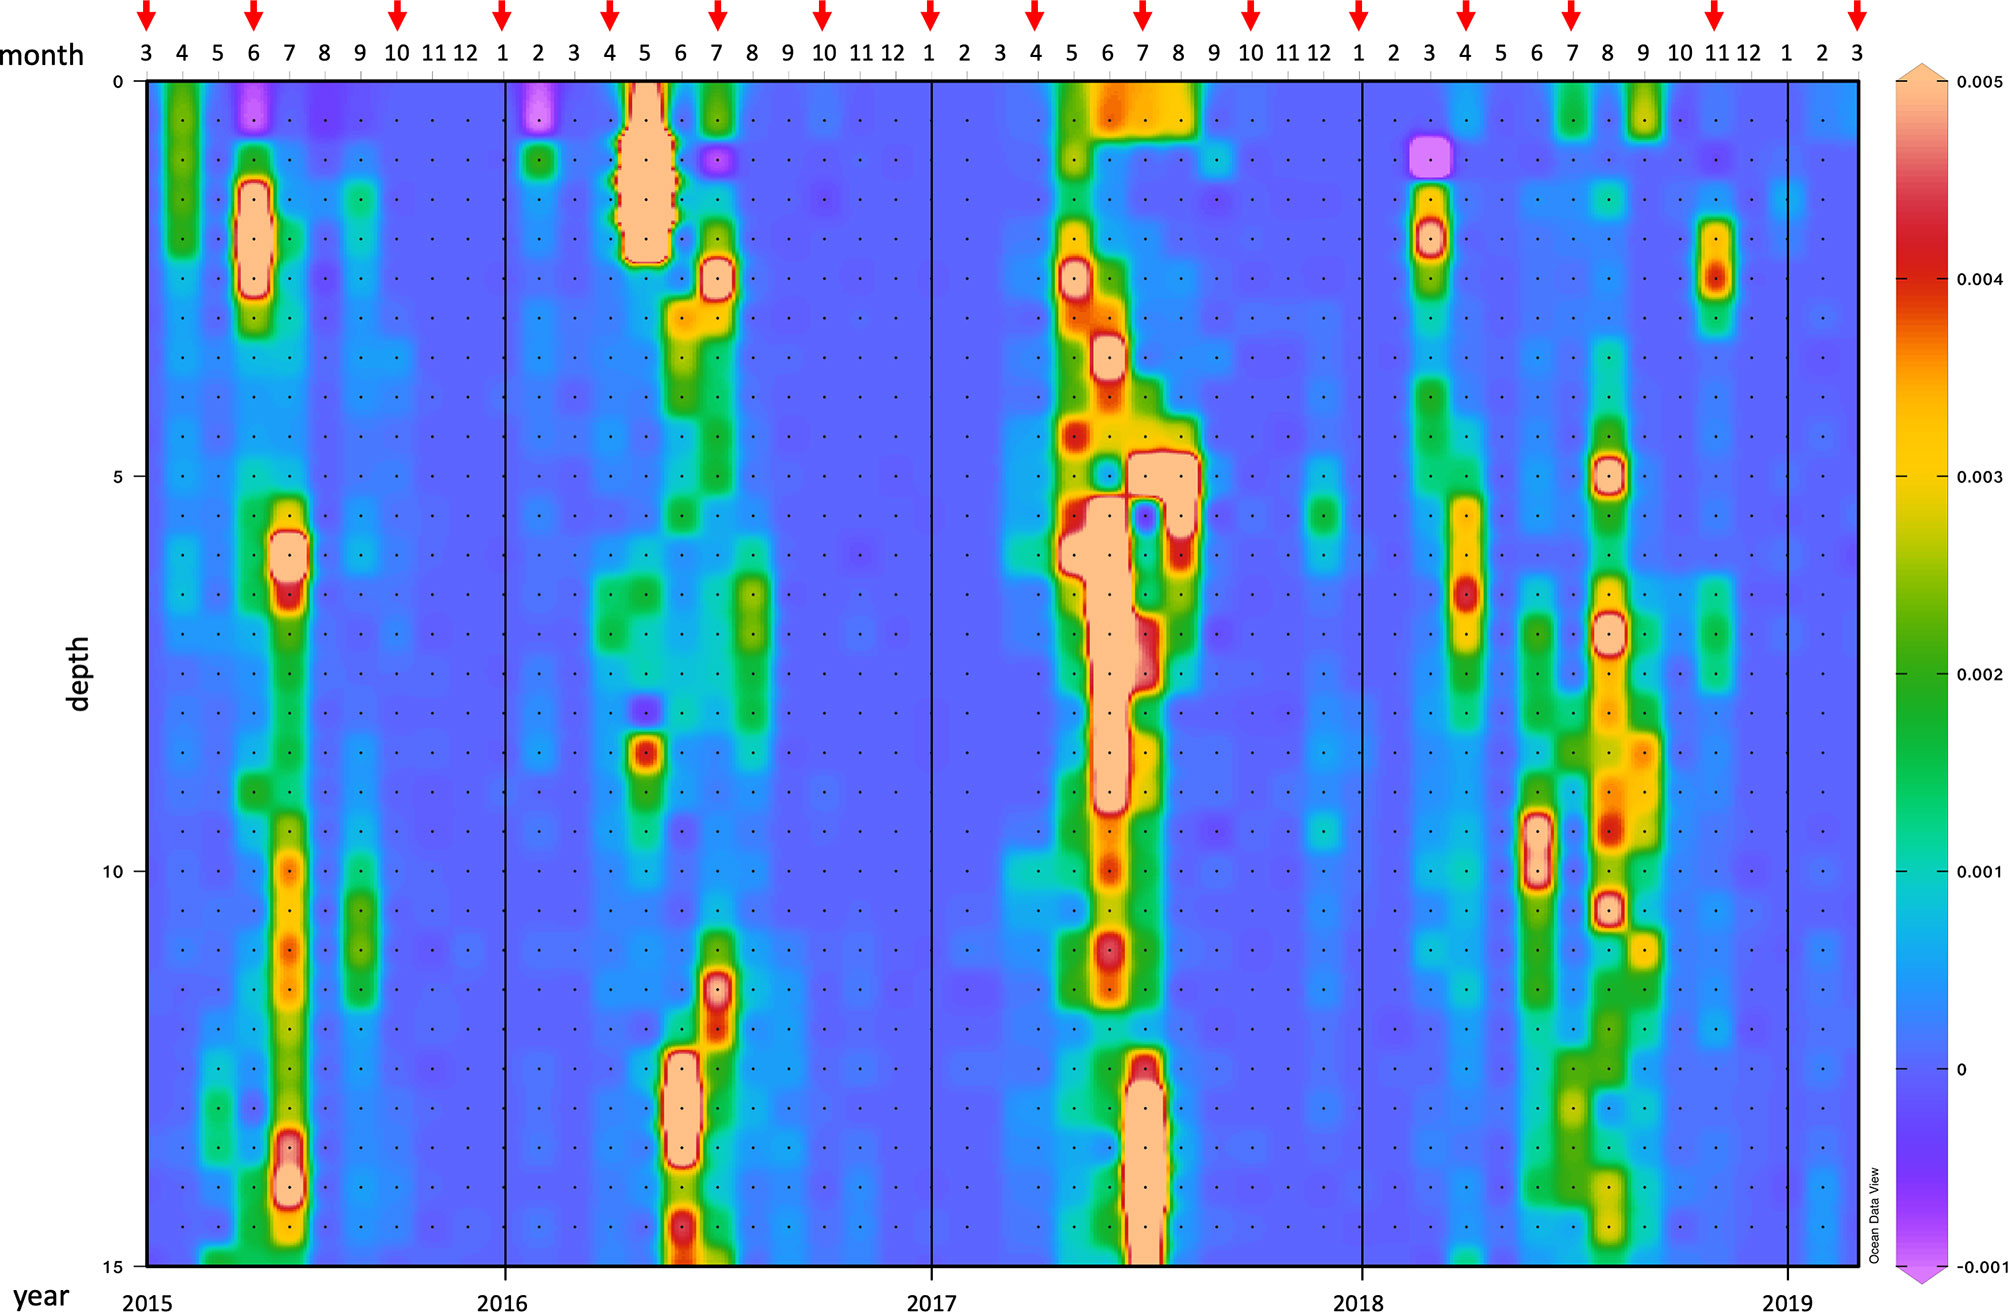
Figure 2 Graphical representation of the Brunt-Väisälä frequency, expressed in units of hertz (Hz), in the water column from March 2015 to March 2019. Red arrows indicate the 16 samplings during the study period. For more details see the text.
PAR reached the maximum (1654.8 µE m-2 s-1) of the study period at the surface in May 2017, while the minimum (2.5 µE m-2 s-1) was recorded at the bottom in January 2019 (Figures S2A–D). Except for the surface, PAR was, on average, lower than the monthly mean at the other sampling depths. In the sediment overlying water, PAR, registered during seasonal samplings, was at its lowest (6.0 µE m-2 s-1) in October 2016, while it reached the maximum (126.3 µE m-2 s-1) in June 2015 (Table S1).
Nutrient concentrations analysed at the four water depths and in the overlying water, and N:P and Si:N ratios are shown in Table S2. N-NH4 displayed two peaks (5.0 and 2.6 µM) in October 2015 at -5 m and in November 2018 at -15 m, respectively, and three peaks (5.6, 4.9 and 5.9 µM) in the overlying water in October 2017, April 2018 and November 2018, respectively (Figure S3A). Also N-NO2 displayed high concentrations along the water column and in the sediment overlying water in January 2016, 2017, and 2018 (Figure S3B) whereas N-NO3 in the overlying water in January 2016, and in November 2018 (Figure S3C). Similarly to N-NH4, P-PO4 reached its maximum (1.1 µM) in October 2015 at -5 m and in July 2017 (0.5 µM) in the overlying water (Figure S3D). Si-Si(OH)4 reached the highest concentrations in November 2018 along the entire water column, while the minimum was recorded at -5 m in October 2015. In the overlying water, Si-Si(OH)4 displayed three major peaks in July and October 2017, and in November 2018 (Figure S3E).
Applying the ratios (Redfield, 1958) as proposed by Hillebrand and Sommer (1999), and the Si:N ratio reported by Brzezinski (1985) to our data, we found Si limitation at the top 10 m-layer in October 2015, in April 2017, at the surface layer in January 2016 and in the overlying water in April 2018. N-depleted conditions were observed particularly in June 2015, April 2017, July 2018 and March 2019, whereas a slight N-limitation occurred in the overlying water in October 2016 and July 2017 (Table S2). When N was not depleted, P became the limiting nutrient for the phytoplankton growth in most of the other samplings or water layers.
Phytoplankton Density and Community Structure
Considering the whole study period, the phytoplankton community was dominated by flagellates in terms of absolute abundance, and by diatoms in terms of biomass. The average abundance of the whole study period was equal to 1.0·106 ± 8.3·105 cells L-1 for flagellates and to 3.0·105 ± 3.8·105 cells L-1 for diatoms. Three peaks in abundance were reached in June 2015 at the surface, when the flagellates accounted for 3.4·106 cells L-1, and in July 2017 and 2018, when this group reached 4.3·106 and 2.9·106 cells L-1, respectively (Figure S4A). In July 2018, a peak was observed also at -10 m when flagellates and diatoms were co-dominant displaying similar abundances (Figure S4C). In addition, diatoms reached other two peaks in July 2018 at -5 m (Figure S4B) and April 2016 at -10 m (Figure S4C). Compared to the other two groups, dinoflagellates and coccolithophores represented a negligible portion of the phytoplankton community (Figures S4A–D).
In terms of biomass, the composition of the phytoplankton community differed substantially compared to what emerged from the abundance data. The diatoms dominated the community with an average biomass (considering the whole study period and all sampling depths) equal to 31.2 ± 45.4 µg C L-1 while that of flagellates was 19.5 ± 14.2 µg C L-1. Diatom maxima were observed over the whole water column in April 2017 and January 2018 (Figures S4E-H), while the maxima of flagellates and dinoflagellates were recorded at the surface in June 2015 and November 2018, respectively (Figure S4E). A significant seasonal variability in the distribution of the phytoplankton biomass was highlighted by PERMANOVA at all depths, except for the 15-m layer (Table 1).
Table 1 Output of the one-way PERMANOVA tests on the phytoplankton and MPB biomass at the investigated layers where season was applied as a fixed factor. The significance values of the Monte Carlo pairwise comparisons are also reported (p-MC).
To have an indication of the community composition over the study period, the phytoplankton abundance and structure at the four depths were integrated over the water column and the relative abundance of taxa was calculated. On average, small flagellates (<10 µm) of uncertain taxonomic identification dominated the phytoplankton community (60.60%), followed by small (< 20 µm) diatom species belonging to the genus Chaetoceros (9.87%), undetermined cryptophyceae (5.89%) and the coccolithophore Emiliania huxleyi (3.47%) (Figure 3A). A very different picture was obtained considering the phytoplankton biomass. When large diatoms occurred in the water column, particularly Lauderia annulata and Leptocylindrus spp., but also Chaetoceros, they prevailed over the other groups in terms of carbon content (Figure 3B).
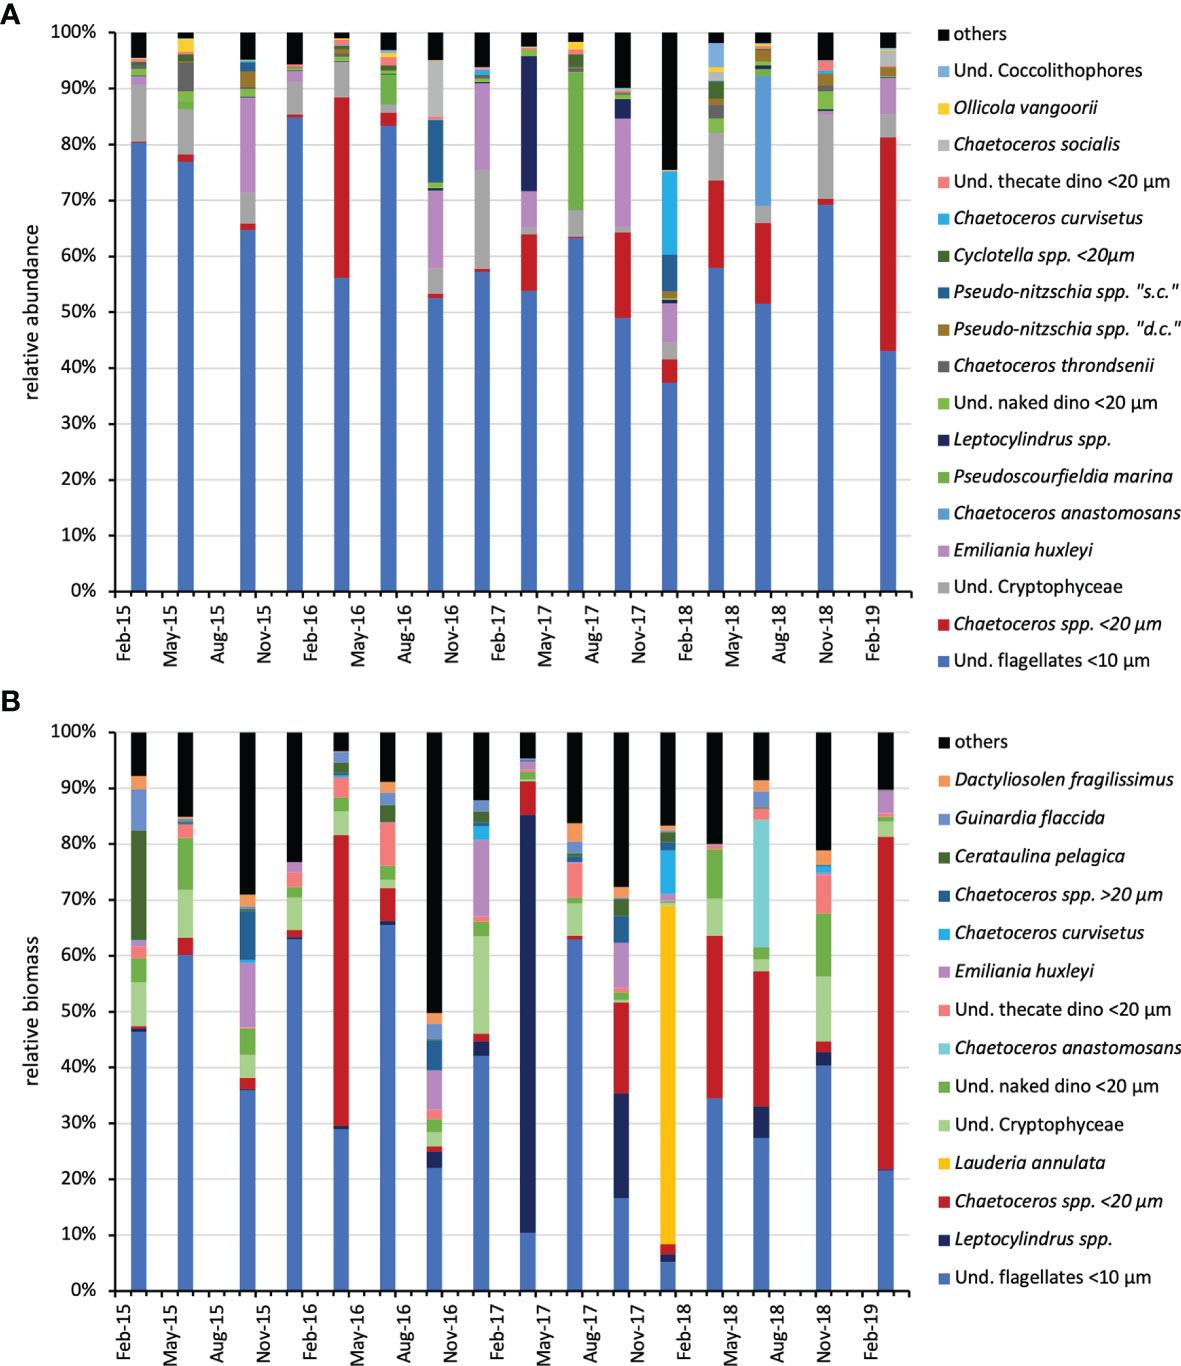
Figure 3 Relative abundance (A) and relative biomass (B) of the main (≥ 1% of the total) phytoplankton taxa over the water column (integrated data) during the study period. dino, Dinoflagellates; und, undetermined; d.c., delicatissima complex; s.c., seriata complex.
Univariate diversity indices applied to the phytoplankton community, integrated over the water column, revealed that the highest value of richness (d = 4.441) was observed in November 2018 when the highest number of species was identified in the water column (S = 78). The second maximum of richness was obtained in October 2016 (d = 4.389, S = 73), while the highest values of diversity and equitability were calculated in January 2018 (H’ = 3.452, J’ = 0.561) in correspondence to the lowest value of dominance (λ = 0.182) (Table 2).
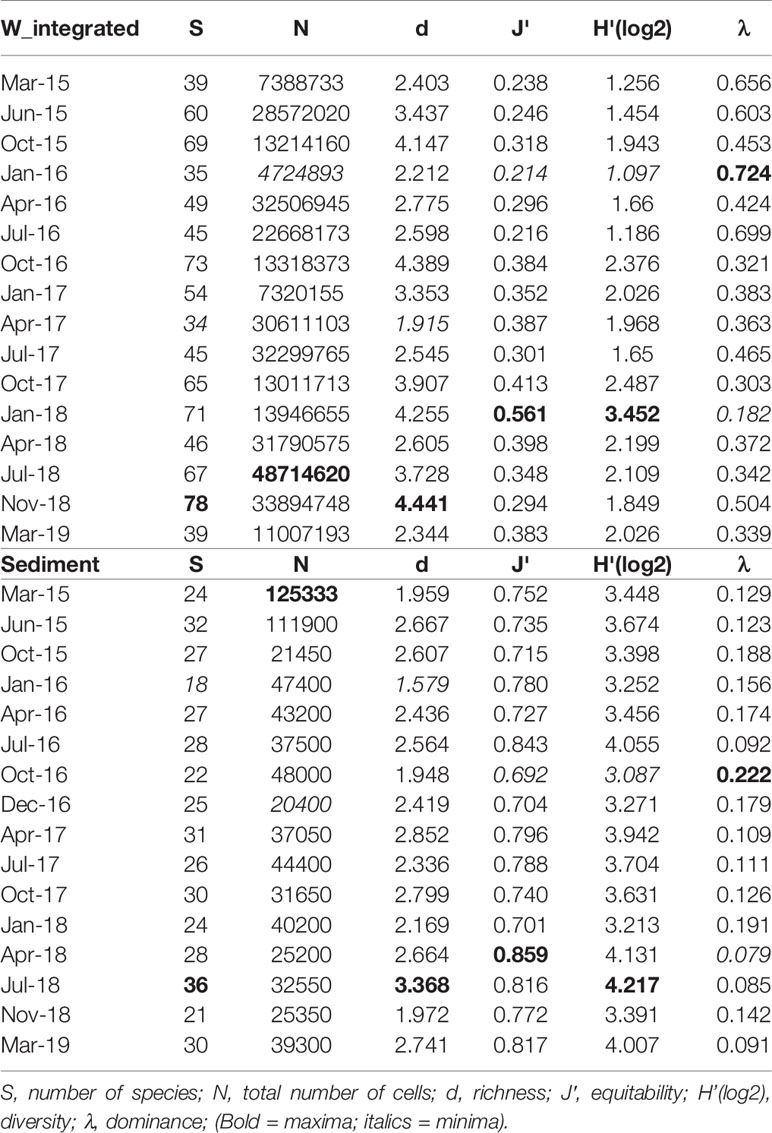
Table 2 Diversity indices applied to the phytoplankton community over the water column (integrated data) and to the microphytobenthic community in the sediments.
Microphytobenthos (MPB) Abundance and Community Structure
Over the study period, MPB displayed two abundance peaks (1.6·105 and 1.4·105 cells cm-3) in March and June 2015, respectively, while two minima (3.0·104 and 2.9·104 cells cm-3) were recorded in October 2015 and December 2016, respectively. In contrast to the phytoplankton community, the MPB biomass dynamics were consistent with those of the abundances (Figure S5A). Two biomass peaks (50.8 and 48.9 µg C cm-3) were reached in March and June 2015, while the minima (9.3 and 8.4 µg C cm-3) were detected in October 2015 and December 2016 (Figure S5B). The MPB biomass significantly differed among seasons but not when the pairwise comparisons were considered (Monte Carlo test, Table 1).
Considering the whole study period, the MPB community was dominated by diatoms (94.78%), whereas diatom spores (2.27%), cyanobacteria (2.02%), undetermined flagellates (0.63%), dinoflagellates and their resting stages (0.30%) represented minor fractions of the benthic microalgal community. Focusing on diatoms only, Nitzschia was the most abundant genus over the study period (29.34%), followed by Paralia (15.49%) and Gyrosigma (11.28%). The tychopelagic diatom species Paralia sulcata was the most represented over the study (15.41%), Nitzschia fasciculata (5.73%) was particularly abundant in summer, other well represented species were Gyrosigma acuminatum (5.40%), G. spencerii (3.32%) and Nitzschia sigma var. sigmatella (3.01%) (Figure 4).
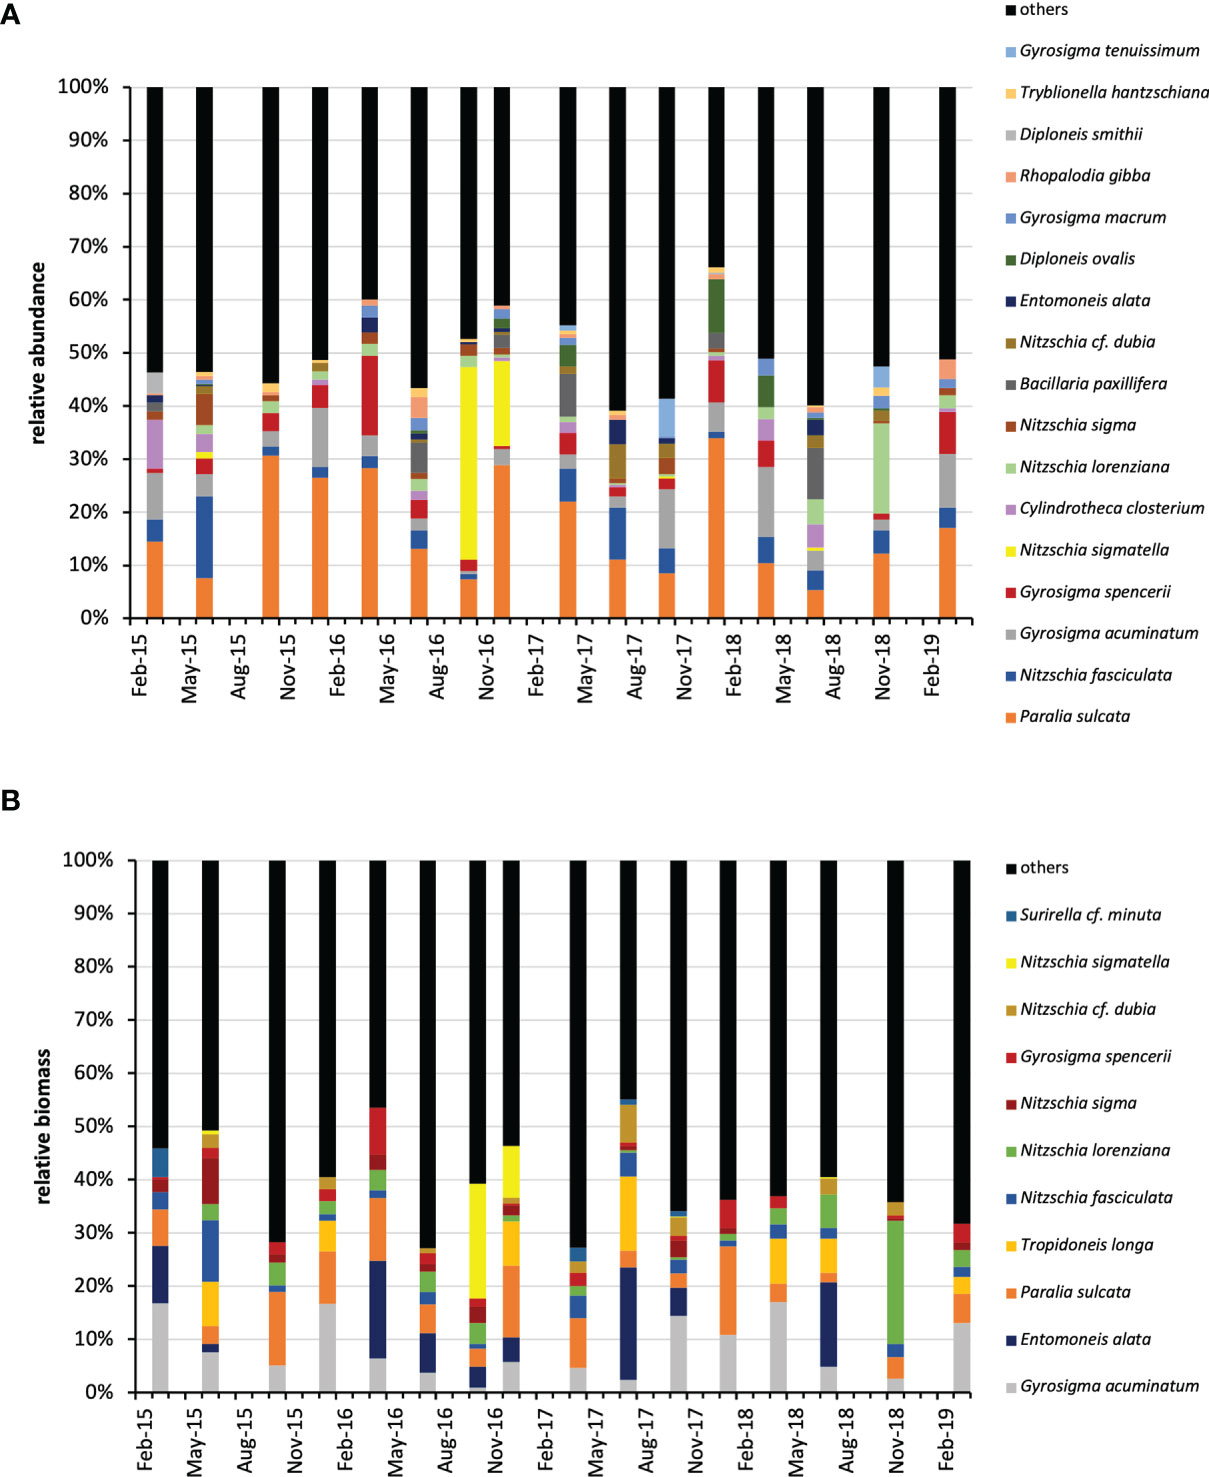
Figure 4 Relative abundance (A) and relative biomass (B) of the main (≥ 0.5% of the total abundance and ≥ 1% of the total biomass) microphytobenthic species during the study period. Nitzschia sigmatella, Nitzschia sigma var. sigmatella.
Univariate diversity indices applied to the benthic diatom community revealed that the highest value of richness (d= 3.368) and diversity (H’=4.217) were observed in July 2018 in correspondence to the highest number of species (S= 36). In October 2016 the highest value of dominance (λ = 0.222) and the lowest equitability (J’ = 0.692) were obtained in correspondence to a major density of Nitzschia sigma var. sigmatella. Similarly, the second maximum of dominance (λ = 0.191) and the second minimum of equitability (J’ = 0.701) were obtained in January 2018 due to a high relative abundance of Paralia sulcata (Table 2).
Primary Production in the Water Column (PPw) and in Surface Sediments (PPs)
The absolute PPw maximum of the study period was estimated at the surface in November 2018 (6.71 ± 0.82 µg C L-1 h-1) (Figure 5A) in low light conditions, while a second maximum was obtained in July 2017 at -5 m (6.46 ± 0.52 µg C L-1 h-1) (Figure 5B). Other three relative maxima were estimated at the surface in January 2018 (5.13 ± 0.07 µg C L-1 h-1) and July 2017 (4.76 ± 0.74 µg C L-1 h-1), and at -5 m in October 2016 (4.74 ± 0.85 µg C L-1 h-1). In general, at the surface and -5 m PP dynamics were uncoupled with the light intensity, whereas at -10 m and -15 m the relative PP peaks were more in line with the PAR availability at these depths (Figures 5C, D, S2). PP minima (<0.2 µg C L-1 h-1) were reached in April 2017 at the surface and in October 2017 at the bottom (Figures 5A, D).
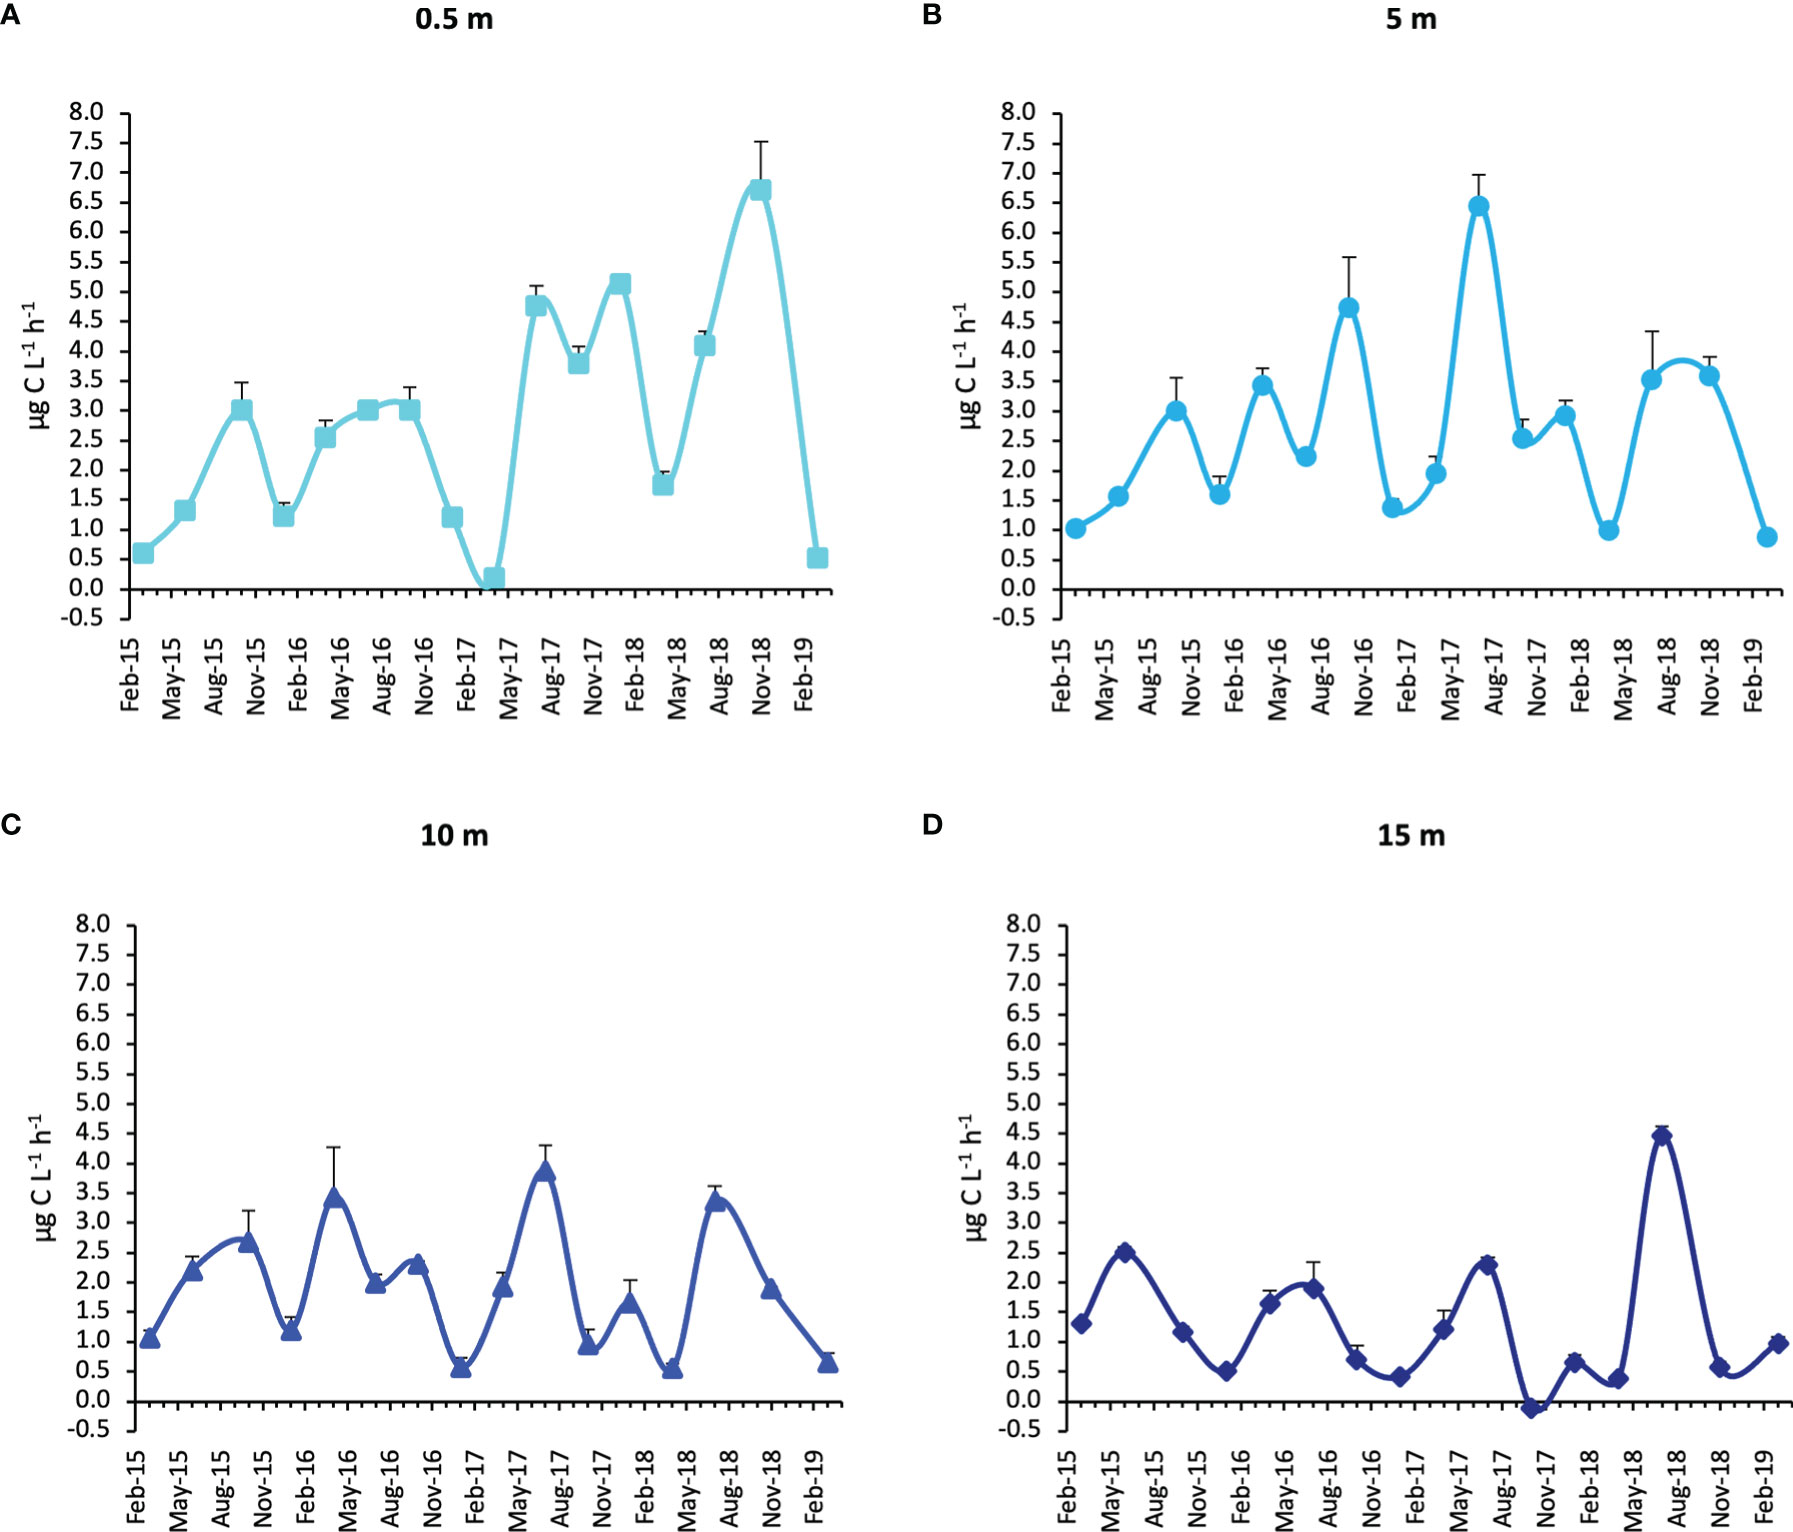
Figure 5 Primary production rates during the study period at the four water column depths. (Whiskers represent SD). (A = 0.5 m; B = 5 m; C = 10 m; D = 15 m).
The primary production depth-integrated rates (PPi) displayed the absolute maximum in July 2017 (69.30 mg C m-2 h-1) and the second highest value in July 2018 (55.89 mg C m-2 h-1), while the minima were obtained in March 2019 and April 2018 (11.47 and 13.17 mg C m-2 h-1, respectively) (Figure 6).
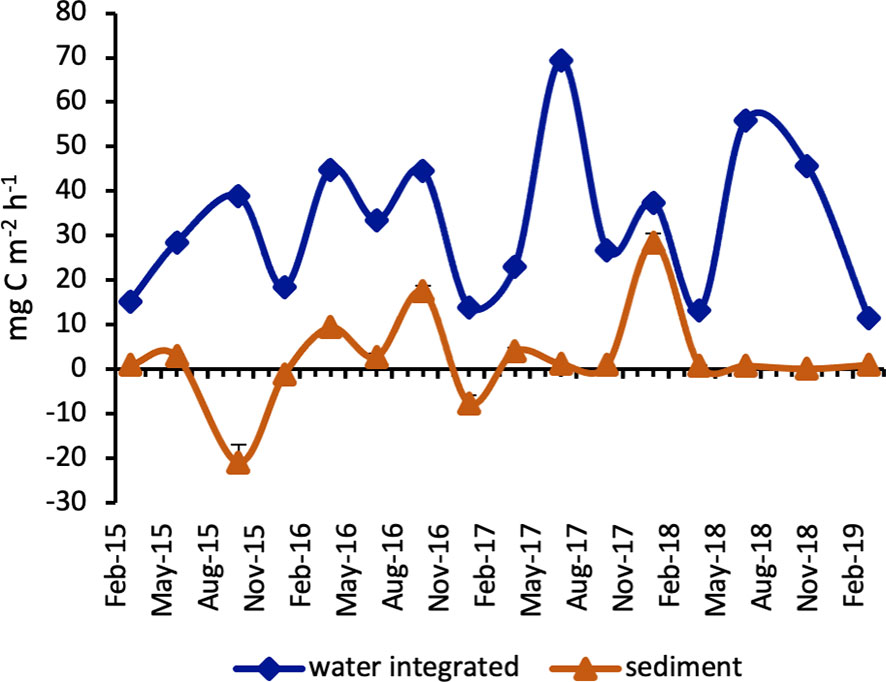
Figure 6 Primary production rates in surface sediments and integrated over the water column. (Whiskers represent SD).
The highest PPs rate was estimated in January 2018 (28.50 ± 2.08 mg C m-2 h-1), a second maximum was reached in October 2016 (17.55 ± 1.17 mg C m-2 h-1) while negative values were obtained in October 2015 (-20.88 ± 3.93 mg C m-2 h-1), December and January 2016 (-7.58 ± 1.67 and -1.20 ± 0.30 mg C m-2 h-1 respectively) in low light conditions (Figure 6).
We made an estimate of the total primary production (PPt) rate per m2. Therefore, PPs rates were added to PPi values. Even when PPs values were highly negative, the sum of PPs + PPi was consistently > 12 mg C m-2 h-1, except for winter 2016 - 17 when the water sampling was much delayed compared to the sediment sampling (Table 3). To obtain an estimate of PPs to PPt rate, we first excluded the 3 negative PPs values then calculated the percentage of the benthic contribution to the overall primary production. The highest benthic contribution was obtained in January 2018 (43.2%) and October 2016 (28.3%), while the mean PPs value over the study period was 11.3% (Table 3).
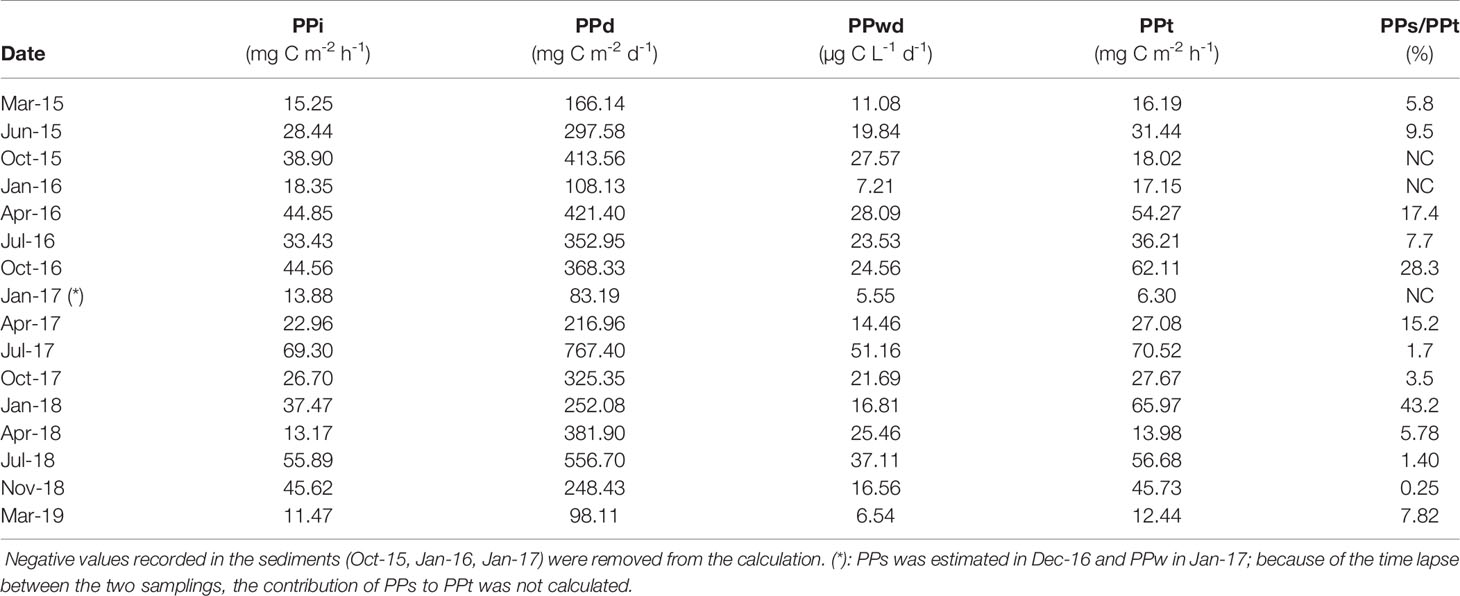
Table 3 Integrated primary production (PPi), primary production daily rates (PPd), primary production volumetric daily rates (PPwd), total primary production (PPt = the sum of primary production estimated in the water column, PPi, and in the sediments, PPs) and contribution of PPs to PPt during the study period.
Influence of Abiotic Variables on the Structure and Function of Phototrophic Communities
To highlight how the physical and chemical features of the water column and surface sediments affected the seasonal development of pelagic and benthic phototrophs and the overall primary production, a Principal Component Analysis (PCA) was first carried out on the five abiotic data matrices, separately. The total variance explained by the first two PC axis displayed increasing values from the surface to the 15-m depth layer, accounting for 64.2%, 69.6%, 70.0% and 73.8% of total variance for the 0.5 m, 5 m, 10 m and 15 m layer, respectively, whereas for the sediment PC1 + PC2 explained 63.3% of the total variance (data not graphically shown). For the PCA performed on the 0.5-m data, temperature (0.60) and salinity (-0.50) were the predominant elements of the first factor, while the major contributors to the second one were N-NO3 (-0.66) and silicates (-0.64). For the PCA performed on the 5-m data, N-NO3 (-0.47) and silicates (-0.46) were the predominant elements of the first factor, while the major contributors to the second one were P-PO4 (-0.53) and N-NH4 (-0.51). For the PCA performed on the 10-m data, N-NO3 (0.53) and N-NO2 (0.48) were the predominant elements of the first factor, while the major contributors to the second one were temperature (-0.56) and salinity (0.54). For the PCA performed on the 15-m data, N-NH4 (0.53) and salinity (-0.43) were the predominant elements of the first factor, while the major contributors to the second one were N-NO2 (0.59) and N-NO3 (0.51). Finally, for the PCA performed on sediment data, silicates (0.47) and P-PO4 (0.44) were the predominant elements of the first factor, while the major contributors to the second one were N-NO2 (0.57) and N-NO3 (0.45). On all PCA plots, the four groups of seasonal samplings significantly differed (RANOSIM varying from 0.366; p = 0.2% for the 5-m layer to R = 0.611; p = 0.1% for the sediment).
The nMDS analysis based on the biomass of either the phytoplankton (separately for each layer) or MPB revealed temporal differences among samplings (Figures 7A–E). The superimposed PP and abiotic variables indicated the main discriminating factors responsible for the separation of samplings. At the surface layer, the phytoplankton assemblages significantly differed among seasons (RANOSIM = 0.571; p = 0.1%) (Figure 7A). During spring, the diatom biomass prevailed in April 2017 but mostly it was co-dominant with that of flagellates, and the measured photosynthetic rates were quite low (1.13 ± 0.99 µg C L-1 h-1). In summer, flagellates were consistently dominant and higher mean PP rates were estimated (3.30 ± 1.50 µg C L-1 h-1). In autumn, diatoms contributed to higher PP (October16 and October17), whereas the absolute maximum PP (6.71 µg C L-1 h-1) obtained in November 2018 was due to the highest biomass of small dinoflagellates which co-occurred with flagellates. In January 2018, the second maximum PP (5.13 µg C L-1 h-1) was estimated on the account of the diatoms Lauderia annulata and several Chaetoceros species. In the other two winter samplings, PP rates were low due to a minor overall phytoplankton biomass and low light availability.
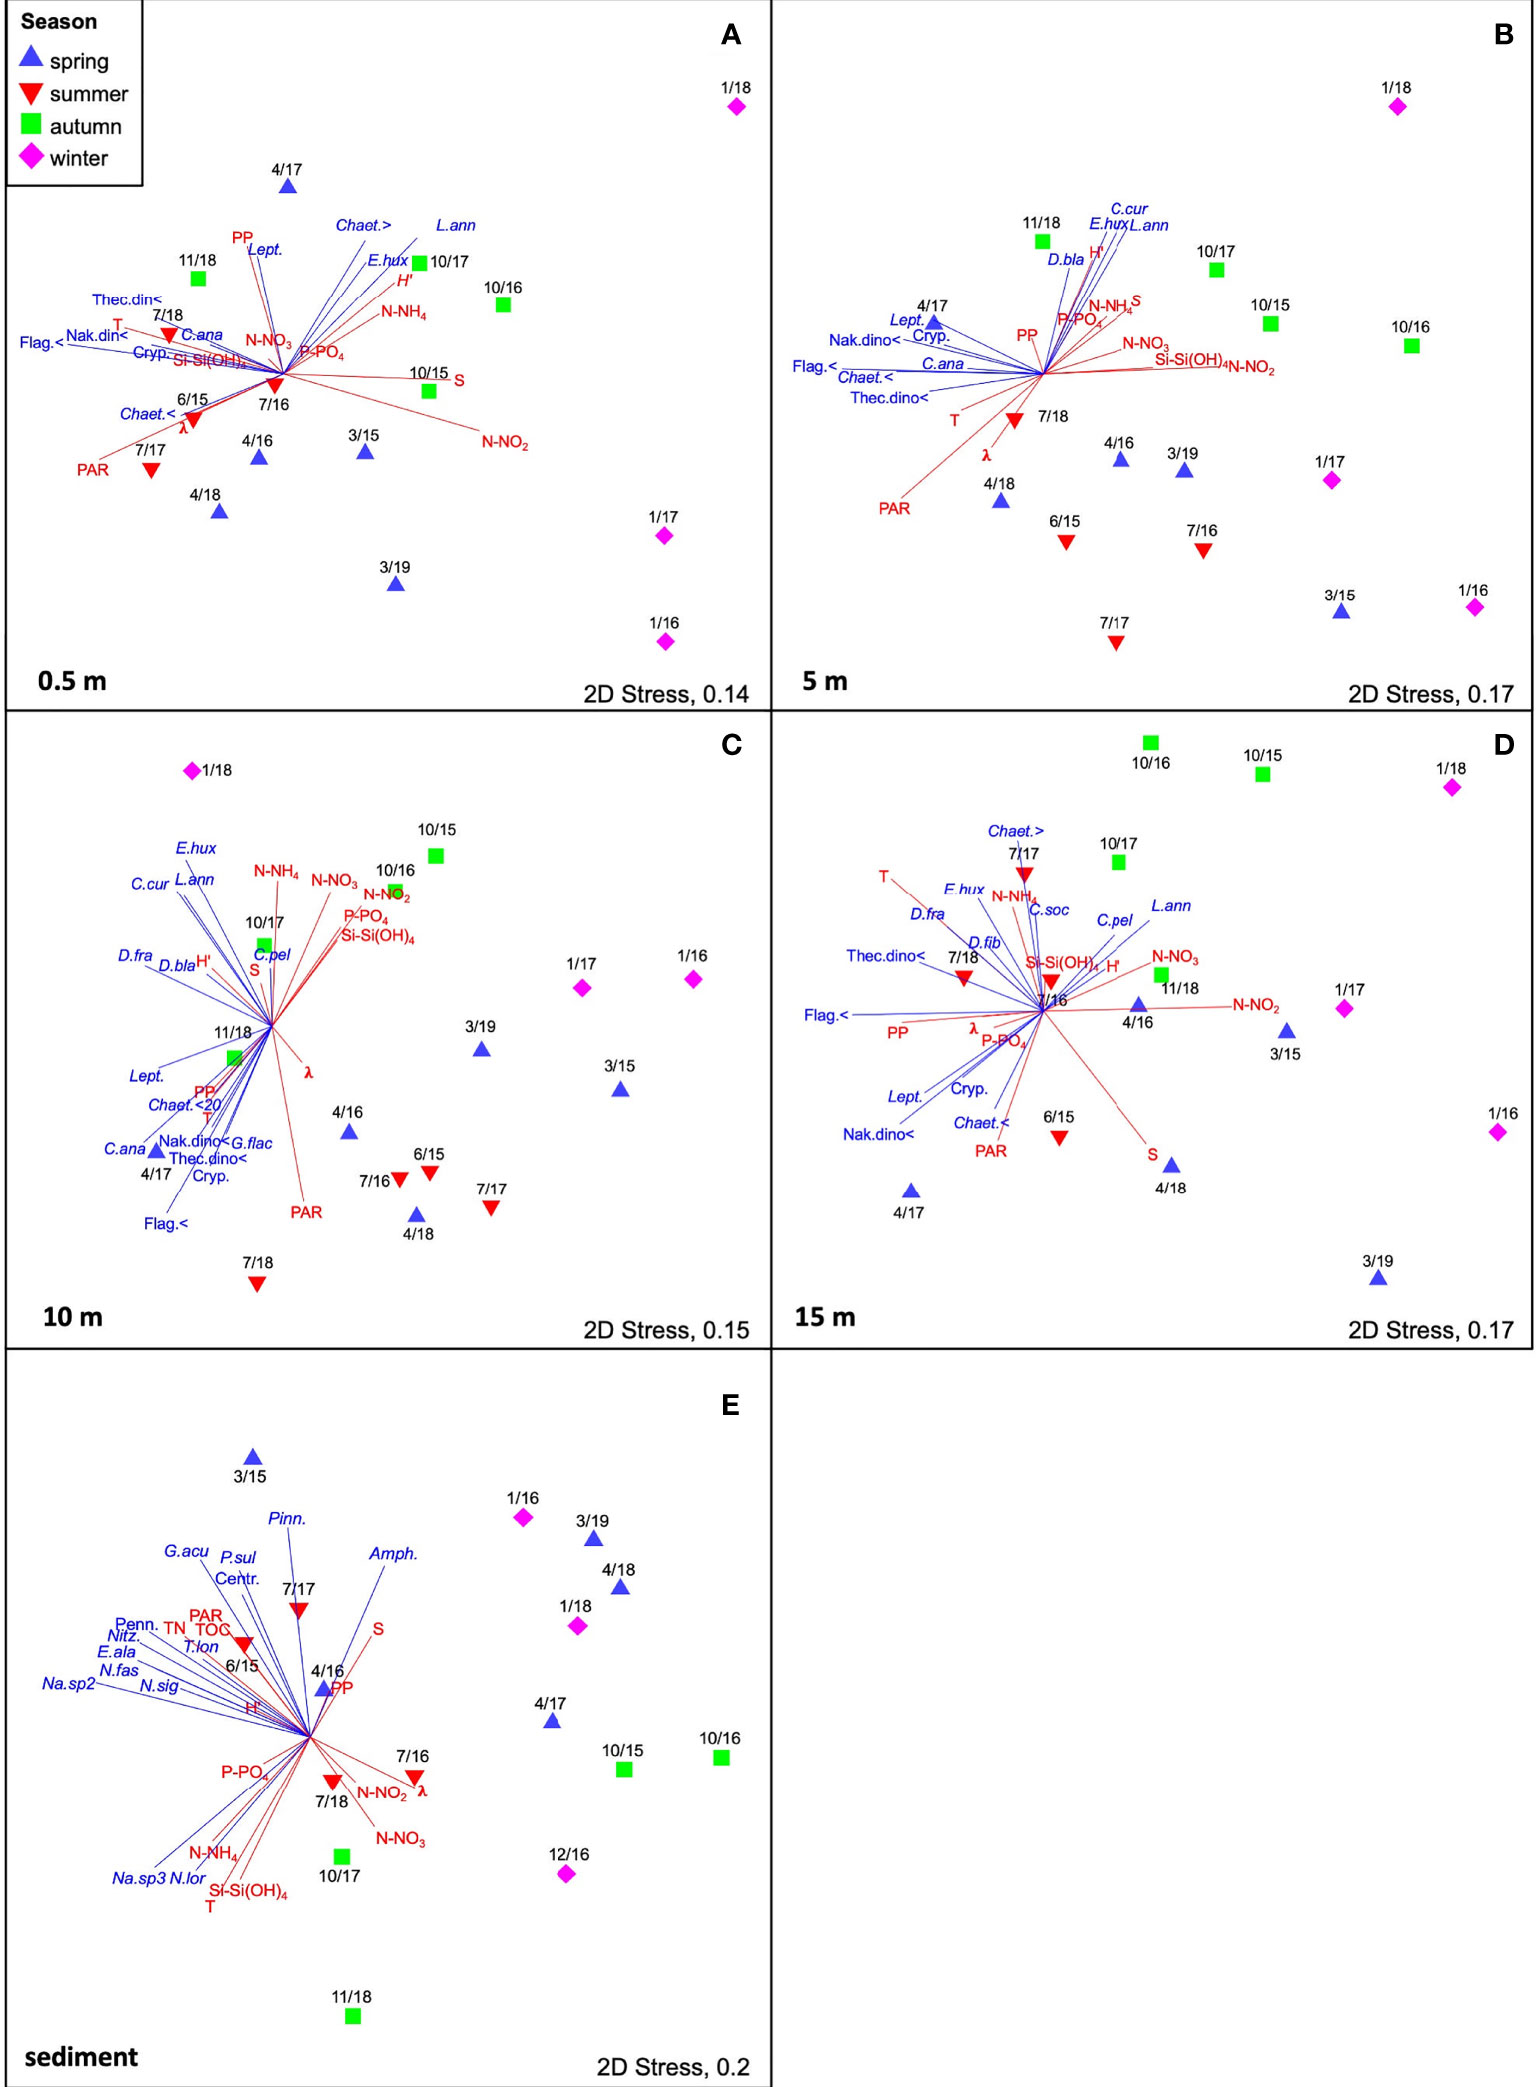
Figure 7 Non-metric multidimensional scaling ordination (nMDS) performed on Bray-Curtis similarity matrices of (A–D) phytoplankton assemblages for each water column layer and (E) of MPB assemblage for the sediments. Data were log (x + 1) transformed before the analysis. Vectors (blue) represent the taxa constituting ≥ 1% of the total biomass for the water samples and ≥ 2% of the total biomass for the sediments. The environmental variables (T, temperature; S, salinity; PAR; TOC, Total Organic C; TN, Total N; N-NH4, ammonium; N-NO2, nitrite; N-NO3, nitrate; P-PO4, phosphate; Si-Si(OH)4, silicate.) and the diversity indices (diversity: H’; dominance: λ) were normalized (z-standardized), ordered in an Euclidean distance matrix and fitted as supplementary vectors (red) onto the ordination space. (Amph., Amphora spp.; C. pel, Ceratulina pelagica; C. ana, Chaetoceros anastomosans; C. cur, Chaetoceros curvisetus; C. soc, Chaetoceros socialis; Chaet., < Chaetoceros spp. < 20μm; Chaet. >, Chaetoceros spp. > 20μm; D. bla, Dactyliosolen blavyanus; D. fra, Dactyliosolen fragilissimus; D. fib, Dictyocha fibula; E. hux, Emiliania huxleyi; E. ala, Entomoneis alata; G. acu, Gyrosigma acuminatum; L.ann, Lauderia annulata; Lept., Leptocylindrus; Na.sp2, Navicula sp.2; Na.sp3, Navicula sp.3; N. fas, Nitzschia fasciculata; N. lor, Nitzschia lorenziana; N. sig, Nitzschia sigma; Nitz., Nitzschia spp.; P. sul, Paralia sulcata; Pinn, Pinnularia spp.; T. lon, Tropidoneis longa; Centr., Undertermined Centrales; Cryp, Undetermined Cryptophycheae. Undetermined flagellates < 10µm, Flag.<; Undetermined naked dinoflagellates < 2µm, Nak.din<; Undetermined Pennales: Penn.; Undetermined thecate dinoflagellates < 20 μm, Thec.din<).
Similarly, at the 5-m layer, the phytoplankton assemblages significantly differed among seasons (RANOSIM=0.443; p=0.2%) (Figure 7B). Except for March 2015, in the other spring samplings the diatom biomass dominated over the other phytoplankton groups, particularly in April 2017 when a remarkable diatom biomass was obtained on the account of Leptocylindrus spp. However, not particularly high PP rates (1.66 ± 1.08 µg C L-1 h-1) were estimated in this season at the 5-m depth layer. With the exception of July 2018, when the diatom biomass prevailed at this depth, in the other summer samplings the flagellates dominated the phytoplankton biomass as for instance in July 2017, when the second maximum PP rate of the study period was estimated (6.46 µg C L-1 h-1). In autumn, diatoms and flagellates equally contributed to the phytoplankton biomass (October15 and October17), whereas in October 2016, when a relative PP maximum was reached (4.74 µg C L-1 h-1) several diatom species co-occurred (Pseudo-nitzschia “seriata complex”, Chaetoceros socialis, Guinardia flaccida and others). Overall, higher PP rates were estimated during the autumn samplings (3.47 ± 0.95 µg C L-1 h-1). In January 2018, the phytoplankton biomass was dominated mostly by Lauderia annulata, but also Chaetoceros curvisetus and other diatom species contributed to PP, while in the other winter samplings a scarce phytoplankton biomass was present at this water depth.
Also at the 10-m layer, the phytoplankton assemblages significantly differed among seasons (RANOSIM = 0.432; p = 0.2%) (Figure 7C). The highest PP values estimated in spring at 10 m depth were observed in April 2016 (3.43 µg C L-1 h-1) and April 2017 (1.93 µg C L-1 h-1) when the phototrophic biomass was dominated by diatoms. In the former sampling, small Chaetoceros forms prevailed whereas in the latter a large Leptocylindrus species contributed to the maximum biomass obtained at this water layer. In summer, the highest PP rates were reached in July 2017 (3.87 µg C L-1 h-1) and July 2018 (3.37 µg C L-1 h-1), in the first case with a dominance of flagellates, in the second case with a major diatom biomass (Chaetoceros anastomosans, Chaetoceros spp. < 20 µm). In autumn, flagellates, diatoms, dinoflagellates and coccolithophores co-occurred at this layer and an average PP rate of 1.96 ± 0.74 µg C L-1 h-1 was obtained. Lauderia annulata was present also at this layer and contributed to PP in January 2018.
At the 15-m layer, the phytoplankton assemblages significantly differed among seasons (RANOSIM = 0.414; p = 0.1%) (Figure 7D). In spring 2015 and 2016, higher PP rates were estimated at this layer compared to spring 2017, although a major diatom biomass, mostly on the account of Leptocylindrus spp. persisted at the bottom layer in April 2017. A remarkable PP rate (4.46 µg C L-1 h-1) was measured at the bottom layer in July 2018, in correspondence to a photosynthetically active phytoplankton assemblage (mostly Leptocylindrus spp., Chaetoceros anastomosans, small flagellates). In the other summer samplings, lower PP rates were obtained (1.91 to 2.50 µg C L-1 h-1) when flagellates were the major contributors to the phototrophic biomass. Low PP rates, often close to zero (0.56 ± 0.38 µg C L-1 h-1) were estimated in autumn and winter due to light depletion at 15 m depth.
At the surface sediment, the MPB biomass did not significantly differ among seasons (RANOSIM = 0.208; p = 5.5%). The maximum PP rate (28.50 µg C L-1 h-1) was estimated in January 2018, in correspondence to a major contribution of Paralia sulcata (16.6%) and Pinnularia spp. (16.4%) to the benthic phototrophic biomass (Figure 7E). The second maximum was obtained in October 2016 mostly on the account of Nitzschia sigma var. sigmatella (21.4%). High PP values were further measured in April 2016 (9.42 mg C m-2 h-1) and April 2017 (4.12 mg C m-2 h-1). The highest benthic PP rates were consistently obtained in late winter-early spring or early autumn, i.e. in not excessively high temperature and light conditions. In contrast, the lowest PP rates were estimated in correspondence to the minima of MPB biomass, in October 2015 and December 2016, and in low light conditions. In each summer sampling, although a major MPB biomass was reached, the photosynthetic rates did not display high values. In June 2015, the benthic community was dominated by several Nitzschia species (N. fasciculata, N. sigma, N. lorenziana) and the large Gyrosigma acuminatum, but an uncoupling between the autotrophic biomass and PP occurred. Some of these taxa, namely N. fasciculata, Nitzschia spp., but also larger Naviculacea, seemed to be driven by higher concentrations of TOC and TN (Spearman R: Nitzschia spp. vs TN, p = 0.001; N. fasciculata vs TN, p = 0.013, and vs TOC, p = 0.007; Navicula sp.2 vs TN, p = 0.010, and vs TOC, p = 0.012). Similarly, in July 2017, the presence of very large diatom species (Tropidoneis longa, Entomoneis alata, Nitzschia dubia) and their high biomass was not mirrored in an equally high PP rate. The same pattern was observed on 30 March 2015, when the highest MPB biomass of the study period, due to the co-occurrence of taxa belonging to both winter (e.g. Pinnularia spp.) and spring (e.g. Gyrosigma acuminatum) assemblages, was uncoupled with the benthic photosynthetic rate.
Discussion
Pelagic Primary Production in Relation to Nutrient Conditions and Water Column Stability
In the oligotrophic Gulf of Trieste, the phytoplankton density and structure are mostly driven by the nutrient availability (Mozetič et al., 2010; Cibic et al., 2018b; Cozzi et al., 2020). This was confirmed by our results that highlighted a persistent P-limitation for the phytoplankton development regardless of the degree of the water column stability. Indeed, the nutrient ratios applied to our data revealed P-limitation indiscriminately during both stratification and mixing of the water column. This was replaced by Si-limitation during a diatom bloom, as occurred in April 2017 (Figure S4), and coupled with N-limitation. N-depleted conditions were further observed in July 2018 and March 2019, when the diatom biomass prevailed over the other phytoplankton groups in the water column (Figures 3, S4). The N/P ratios higher than the Redfield one are a common feature not only for the gulf of Trieste (Lipizer et al., 2012) but also for the northern Adriatic Sea (Giani et al., 2012). However, the anomalous thermohaline conditions of the water column (extreme deviations in temperature and salinity compared to the climatological monthly means, Figure S1), particularly evident at the surface layer, seemed to influence greatly the phytoplankton development, as already observed in the area (Cerino et al., 2019) and in other shallow coastal waters (e.g. Trombetta et al., 2019). This clearly emerged in the PCA built on surface abiotic data, in which temperature and salinity were the predominant elements of the first factor, while in the other PCAs, dissolved inorganic nutrients were the major contributors to the total variance.
Focusing on the photosynthetic rates, we did not find a clear relationship between PPw and the stability of the water column (Spearman test p > 0.05, data not shown), neither considering the integrated rates. Indeed, only the highest PPi values of July 2017 and 2018 were obtained with a strong stratification of the water column, in typical summer conditions, whereas the other relative PPi peaks (November 2018, April and October 2016) were estimated in unstable or weak stratification conditions. During the other two summer samplings (June 2015 and July 2016), abiotic factors other than PAR availability (Figure S2) likely affected the phytoplankton productivity. As a general rule, major autotrophic densities observed in the summer period were not mirrored in exceptionally high PPw rates. Indeed, phytoplankton constantly adjust their photosynthetic output to match environmental constrains and optimize their growth (Talaber et al., 2014). Moreover, the maximum PPw of the study occurred in November 2018, when a pycnocline was observed at -2.5 m depth, established after a freshwater input from the Isonzo River following the autumnal precipitations (flow rate obtained from the hydrometric height provided by: Regione Autonoma FVG, Water resources management service). This freshwater-induced pycnocline, likely triggered the not exceptionally abundant phototrophic community (Figure S4), leading to this major PPw. Our PPw rates were in line with previous results from the same site (Cibic et al., 2018 b). This could suggest that the trophic conditions at this coastal site have not changed after more than a decade. Interestingly, the maximum of the study period (November 2018) was consistent with that observed in November 2006 at the surface, and the high values recorded below 5 m in summer. Our PPi rates also displayed a very similar pattern to those calculated in 2006 - 07, with the highest values recorded in July 2017 and July 2018. Further, they were similar to the values estimated in the middle of the gulf from March 2011 to March 2013 (Ingrosso et al., 2016) and the south-eastern part of the gulf in the period 2010-2011 (Talaber et al., 2018). However, our mean PPi rate was about half of that estimated by Fonda Umani et al. (2007) from January 1999 to December 2001 at the same station (C1). Our daily rates (Table 3) were comparable or slightly lower than those obtained by Pugnetti et al. (2005) using the 14C uptake in the northern Adriatic Sea; lower than those estimated by Decembrini et al. (2009) in the southern Tyrrhenian Sea in December (429 mg C m-2 d-1) but higher than their rates in July (273 mg C m-2 d-1); and much higher than those measured in the Mar Piccolo of Taranto (Ionian Sea) by the same 14C technique (Cibic et al., 2016).
Benthic Primary Production in Relation to Physical-Chemical Features at the Seafloor
The maximum MPB abundances were observed in spring/early summer 2015, in correspondence to the highest light availability at the bottom (Table S1), in accordance with previous results (Cibic et al., 2012). However, the highest PPs rates were obtained in late winter - early spring or early autumn, with MPB abundances close to the average value of the study period. It is widely accepted that not all the viable cells present in sediments are likely to be active at once (Cahoon and Cooke, 1992). In contrast, the lowest or negative PP rates were estimated in correspondence to the minima of MPB density, and in low light conditions. The productivity of the microalgal community inhabiting surface sediments is known to be strongly dependent upon the light availability at the bottom (Miles and Sundbäck, 2000), especially in subtidal areas. Negative PPs values were previously reported, particularly from sublittoral sites worldwide (Meyercordt and Meyer-Reil, 1999; Gillespie et al., 2000; Forster et al., 2006). Overall, our PPs values are comparable to monthly data obtained from the same site in 2003-04 (Cibic et al., 2008), and to seasonal data reported from July 2010 to July 2012 (Franzo et al., 2016) as well as to those estimated in the port of Trieste at similar depths in June 2013 (Rogelja et al., 2018). In all these studies, with a few exceptions, the same pattern in primary production was observed, with higher rates from late winter to early summer, in correspondence with low temperature and increasing light conditions, and low or negative rates from late summer to early winter. As for the water column, the results in this study suggest that the trophic state of the benthic ecosystem has remained unaltered after more than 12 years.
The nutrient ratios applied to our data revealed that the MPB community was mostly P-depleted. When minima of all nutrients occurred in the overlying water (April 2016, 2017, 2018 and March 2019), the MPB abundances were consistently slightly lower, ranging from 4.5·104 to 5.7·104 cells cm-3, than the average value (6.1·104 ± 3.7·104 cells cm-3). Notwithstanding, in those months the MPB community was photosynthetically active (PPs ranging from ~ 1 to 9.42 mg C m-2h-1). Very large diatom cells (length >100 µm: Entomoneis alata, Gyrosigma acuminatum, G. attenuatum, Pinnularia spp., Tropidoneis longa) represented a considerable fraction of the MPB biomass in these sampling months. Large diatoms have relatively larger nutrient storage vacuoles that allow them to achieve a slow but steady growth rate in pulsed-nutrient or nutrient-depleted environments and use the stored nutrients when needed (Finkel et al., 2005).
Benthic Contribution to Total Primary Production
At this sublittoral site, the benthic-pelagic coupling is not so tight as it might be in an estuarine or lagoon environment. The benthic microalgae occasionally enter the pelagic domain, mostly due to sediment resuspension and, on the other hand, the settlement of planktonic forms at the seafloor can increase the microphytobenthic biodiversity and the overall benthic photosynthetic activity. The mean annual contribution of benthic diatoms to the microphytoplankton (cells > 20 µm) was estimated to be 9.9% (Cibic et al., 2018b). Pennate diatoms (mostly Nitzschia, Navicula, Pleurosigma and Diploneis) were temporarily present in the phytoplankton assemblage following strong wind events that resuspended them from the bottom. However, in October 2006 when the microphytoplankton was quite scarce in the water column, Nitzschia alone reached up to 36% of this assemblage. We further calculated the mean benthic contribution to the total eukaryotic phytoplankton (2-200 µm), presented in this study, and in this case, it accounted for less than 1%, therefore it could be considered negligible.
From the benthic point of view, a two-year study focused on the MPB biodiversity carried out in the same site, identified 8 planktonic species out of 103 diatom taxa (Cibic et al., 2007 b) and found that on average 9% of the species in the sediment were planktonic. However, they were mostly in appalling condition and only species with a hardy frustule, e.g. Pseudo-nitzschia seriata, could be recognized (Cibic et al., 2007a), and were likely still photosynthetically active.
Our PPt rate per m2, obtained adding PPs to PPi rates, displayed values varying from 12.44 to 70.52 mg C m-2 h-1, indicating that the Gulf of Trieste, although oligotrophic (Mozetič et al., 2012; Cozzi et al., 2020) is a productive ecosystem throughout the year. When the photosynthetic rates are lower along the water column, i.e. in late winter/early spring, they are compensated, to some extent, by higher rates of an active MPB community, once sufficient light reaches the surface sediments. In contrast, in summer and autumn much higher rates occur along the water column, when the benthic primary production is inhibited by low light or supra-optimal temperatures (Guarini et al., 1997; Kirk, 2000). Of course, to some degree there is an overlapping, particularly when a late winter phytoplankton bloom is triggered by favourable conditions and an abundant and photosynthetically active MPB community has already developed at the seafloor; or in summer when the water column is very clear and high PAR irradiance is available at the sea bottom. In any case, the pelagic contribution to total PP is consistently predominant in this coastal site. Indeed, excluding negative PPs values, the mean PPs contribution to PPt was 11.3%, while it reached up to 43% in January 2018. Although these results were obtained at a 17-m deep sublittoral site, they are in line with the literature, since the microphytobenthos have been reported to contribute up to 50% of the total PP in shallow coastal systems (Perissinotto et al., 2002; Montani et al., 2003). Only a few studies, mostly carried out in estuaries, investigated simultaneously the PPw and PPs (using the 14C method), and calculated the PPs contribution to PPt. Perissinotto et al. (2003) and Anandraj et al. (2007) reported that the pelagic production was much higher than the microphytobenthic one in a river-dominated temporarily open/closed estuary in South Africa (up to 64x in the closed phase) as a direct consequence of the light availability at the bottom. van der Molen and Perissionotto (2011) found that in St. Lucia Estuary (South Africa, average depth about 2 m) the pelagic contribution to the total production varied greatly, from 2% to 100% and was below 15% in 4 out of 20 sampling dates/points. In the shallow (<12 m) semi-enclosed Mar Piccolo of Taranto (Ionian Sea) the PPs contribution to PPt was very low as it varied from 1% to 10% due to high concentration of contaminants (e.g. PCBs, PAHs, Hg) accumulated in the surface sediments (Cibic et al., 2016).
Influence of Abiotic Variables on the Structure and Function of Eukaryotic Phototrophic Communities
To detect which abiotic factors were most related with the occurrence and density of phytoplankton groups and the overall photosynthetic rate, an exploratory approach based on the Spearman rank correlation analysis was applied separately to samples from the four water depths and sediment. Only the significant relationships were extrapolated from the five matrices and shown in Table 4. Salinity and temperature highly affected the abundance of the main phytoplankton groups, i.e. undetermined flagellates and dinoflagellates, at the top 5 m of the water column, whereas their influence was less marked below the 10-m layer and not relevant at the sediment surface. This was also confirmed by the PCA. In contrast, light availability, which was not a limiting factor at the water surface, did not affect the phytoplankton density and photosynthetic rate but became an important driver of species richness below the 5-m layer, and particularly at the sediment surface, where a clear relation between PAR and biodiversity emerged. Among the considered inorganic nutrients, N-NO2 highly influenced the abundance of flagellates along the water column, and of dinoflagellates below the 5-m layer. However, neither N-NO2 nor other nutrients showed to directly affect the MPB total numbers and overall biomass that seemed to be rather influenced by TOC and TC concentrations. Yet, the nutrient availability showed to affect the number of species at the sediment surface. Indeed, changes in the relative availability of N and Si may influence the relative as well as absolute abundance of various diatom species (Gilpin et al., 2004). Interestingly, the significance of N-NH4 on shaping the structure of the phytoplankton community increased particularly at the lower layers of the water column (<10 m) where this nutrient is regenerated from the microbial activity, particularly in summer (Souza et al., 2011; Cossarini et al., 2012), or become available after sediment resuspension. Primary production seemed to be directly influenced by salinity and temperature at the upper 10-m layer of the water column, only. PP was also dependent upon the community richness at the first 5-m layer, but a direct relation between PP and the overall abundance emerged only for the benthic community.
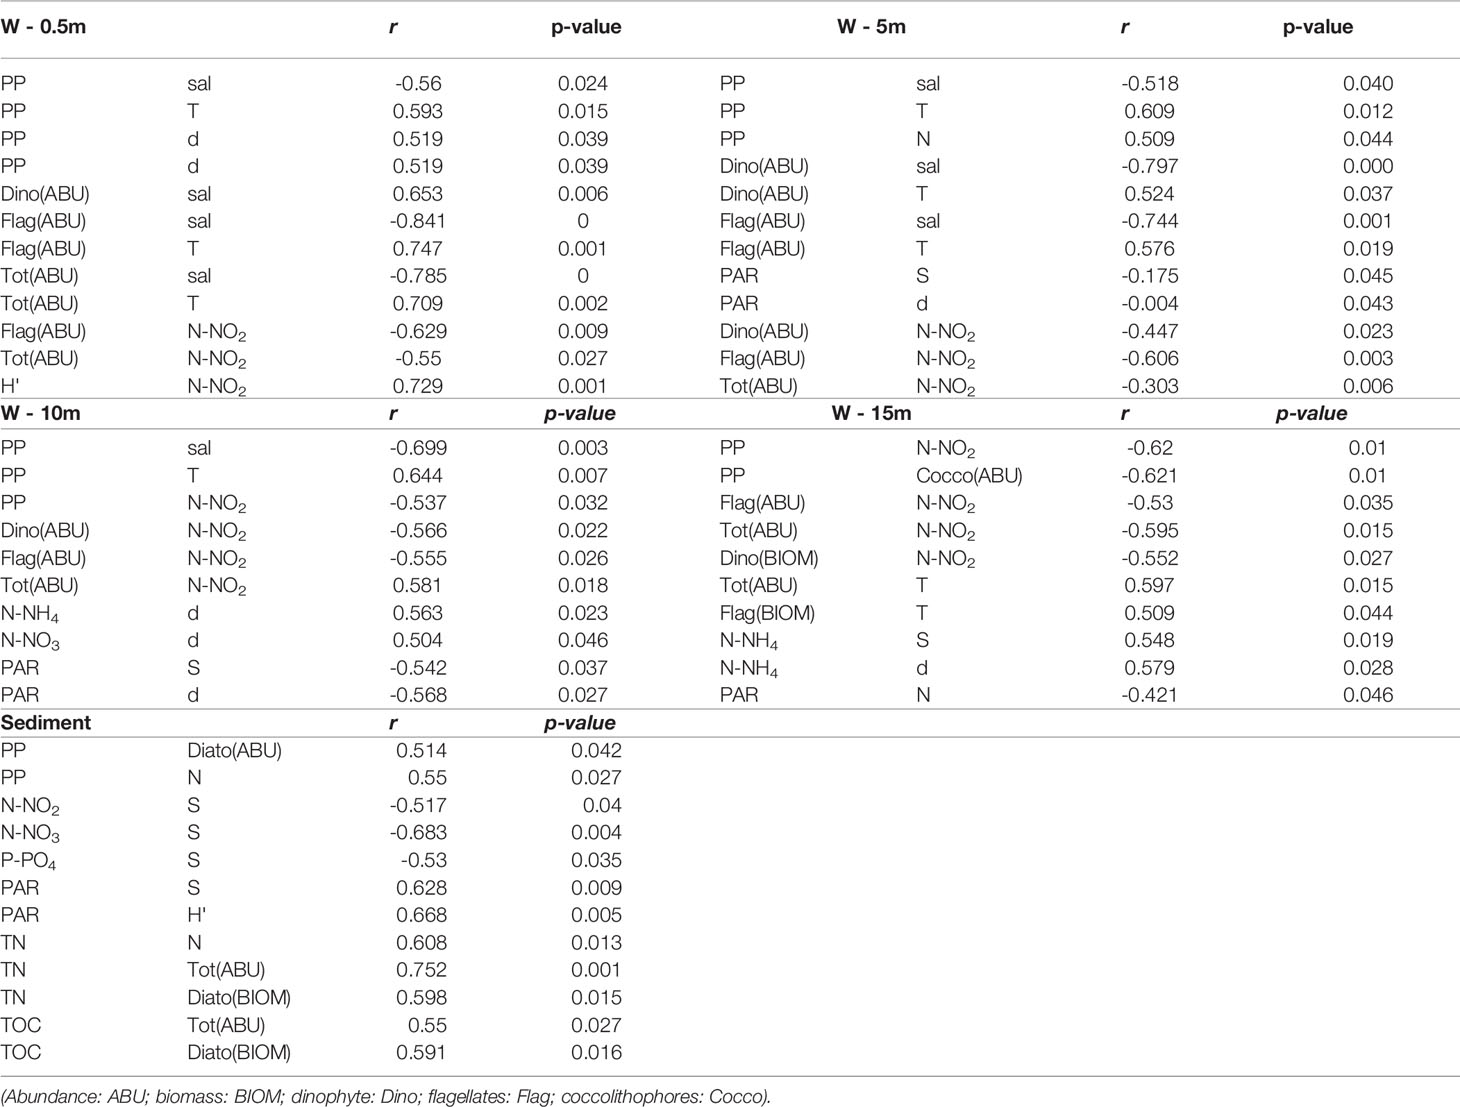
Table 4 Summary of the significant pairwise comparisons performed on the whole dataset applying the Spearman correlation test.
In conclusion, in this study, for the first time, pelagic and benthic primary production were estimated quasi-synchronously in the northern Adriatic Sea. Although the Gulf of Trieste is persistently P-limited, it is still a productive ecosystem throughout the year. We did not find a clear relationship between PP and the water column stability; however, the absolute maximum was obtained in a weak pycnocline at the surface in autumn whereas the highest integrated rates in stratified waters in typical summer conditions. We found higher benthic PP rates from late winter to early summer, in correspondence with low temperature and increasing light conditions, and low or negative rates from late summer, when PP was inhibited by supra-optimal temperature, to early winter when PP was light limited. The benthic contribution to total PP was generally low but it increased in clear water periods and/or when pelagic PP was strongly nutrient-depleted. We found PP to be influenced by salinity and temperature at the upper 10-m layer of the water column, and mostly by the N-NO2-availability at the lower water layers. Light availability influenced the structure of the community at the sediment surface. N-NO2 also emerged as the driving factor of the abundance of flagellates and dinoflagellates along the water column.
On a global scale, this study represents one of the few attempts of integrating pelagic and benthic primary production using the 14C technique to quantify the ecosystem productivity. The main findings, obtained in the Gulf of Trieste, could be extended beyond the geographical limits of this particular ecosystem. Our results add on the limited database on primary production from sublittoral areas and could be used as proxy of ecosystem functioning in future studies on climate change impacts.
Data Availability Statement
The original contributions presented in the study are included in the article/Supplementary Material. Further inquiries can be directed to the corresponding author.
Author Contributions
TC: conceptualization, manuscript preparation, primary production analysis and interpretation. LB: statistical analysis and interpretation, manuscript preparation. FC: Phytoplankton analysis and interpretation, manuscript preparation. CC: physical data acquisition, climatological data production and interpretation. DF: field sampling, phytoplankton, and primary production analyses. MK: nutrients analyses and interpretation, manuscript revision. MG: field sampling, data interpretation, and manuscript critical revision. All authors contributed to the article and approved the submitted version.
Conflict of Interest:
The authors declare that the research was conducted in the absence of any commercial or financial relationships that could be construed as a potential conflict of interest.
Publisher’s Note
All claims expressed in this article are solely those of the authors and do not necessarily represent those of their affiliated organizations, or those of the publisher, the editors and the reviewers. Any product that may be evaluated in this article, or claim that may be made by its manufacturer, is not guaranteed or endorsed by the publisher.
Acknowledgments
The authors thank the crew and all colleagues who participated to the sampling campaigns. We are very grateful to C. De Vittor for nutrient data from the sediment overlying water.
Supplementary Material
The Supplementary Material for this article can be found online at: https://www.frontiersin.org/articles/10.3389/fmars.2022.877935/full#supplementary-material
References
Anandraj A., Perissinotto R., Nozais C. (2007). A Comparative Study of Microalgal Production in a Marine Versus a River-Dominated Temporarily Open/Closed Estuary, South Africa. Estuar. Coast. She.lf Sci. 73, 768–780. doi: 10.1016/j.ecss.2007.03.020
Barranguet C., Kromkamp J. (2000). Estimating Primary Production Rates From Photosynthetic Electron Transport in Estuarine Microphytobenthos. Mar. Ecol. Prog. Ser. 204, 39–52. doi: 10.3354/meps204039
Barranguet C., Kromkamp J., Peene J. (1998). Factors Controlling Primary Production and Photosynthetic Characteristics of Intertidal Microphytobenthos. Mar. Ecol. Prog. Ser. 173, 117–126. doi: 10.3354/meps173117
Bartoli M., Castaldelli G., Nizzoli D., Viaroli P. (2012). Benthic Primary Production and Bacterial Denitrification in a Mediterranean Eutrophic Coastal Lagoon. J. Exp. Mar. Biol. Ecol. 438, 41–51. doi: 10.1016/j.jembe.2012.09.011
Bérard-Therriault L., Poulin M., Bossè L. (1999). “Guide D’identification Du Phyto- Plankton Marin De L’estuarie Et Du Golfe Du Saint-Laurent Incluant Également Certains Protozoaires,” in CNRC-NRC, vol. vol. 128. (Ottawa: Publication spéciale canadienne de sciences halieutiques et aquatiques), 387 pp.
Blasutto O., Cibic T., De Vittor C., Fonda Umani S. (2005). Microphytobenthic Primary Production and Sedimentary Carbohydrates Along Salinity Gradients in the Lagoons of Grado and Marano (Northern Adriatic Sea). Hydrobiologia 550, 47–55. doi: 10.1007/s10750-005-4361-5
Brzezinski M. A. (1985). The Si:C:N Ratio of Marine Diatoms: Interspecific Variability and the Effect of Some Environmental Variables. J. Phycol. 21, 347–357. doi: 10.1111/j.0022-3646.1985.00347.x
Cabrini M., Fornasaro D., Cossarini G., Lipizer M., Virgilio D. (2012). Phytoplankton Temporal Changes in a Coastal Northern Adriatic Site During the Last 25 Years. Estuar. Coast. She.lf Sci. 115, 113–124. doi: 10.1016/j.ecss.2012.07.007
Cahoon L. B., Cooke J. E. (1992). Benthic Microalgal Production in Onslow Bay, North Carolina, USA. Mar. Ecol. Prog. Ser. 84, 185–196. doi: 10.3354/meps084185
Cantoni C., Cozzi S., Pecchiar I., Cabrini M., Mozetič P., Catalano G., et al. (2003). Short-Term Variability of Primary Production and Inorganic Nitrogen Uptake Related to the Environmental Conditions in a Shallow Coastal Area (Gulf of Trieste, N Adriatic Sea). Oceanologica. Acta 26, 565–575. doi: 10.1016/S0399-1784(03)00050-1
Celio M., Malačič V., Bussani A., Čermelj B., Comici C., Petelin B. (2006). The Coastal Scale Observing System Component of ADRICOSM: Gulf of Trieste Network. Acta Adriatica. 47, 65–79.
Cerino F., Fornasaro D., Kralj M., Giani M., Cabrini M. (2019). Phytoplankton Temporal Dynamics in the Coastal Waters of the North-Eastern Adriatic Sea (Mediterranean Sea) From 2010 to 2017. Nat. Conserv. 34, 343–372. doi: 10.3897/natureconservation.34.30720
Cesbron F., Murrell M. C., Ederington Hagy M., Jeffrey W. H., Patterson W. F., Caffrey J. M. (2019). Patterns in Phytoplankton and Benthic Production on the Shallow Continental Shelf in the Northeastern Gulf of Mexico. Continental. She.lf Res. 179, 105–114. doi: 10.1016/j.csr.2019.04.003
Cibic T., Blasutto O. (2011). “Living Marine Benthic Diatoms as Indicators of Nutrient Enrichment: A Case Study in the Gulf of Trieste,” in Diatoms: Classification, Ecology and Life Cycle. Ed. Compton J. C. (New York, USA: Nova Science Publishers, Inc), pp 169–pp 184.
Cibic T., Blasutto O., Burba N., Fonda Umani S. (2008). Microphytobenthic Primary Production as 14C Uptake in Sublittoral Sediments of the Gulf of Trieste (Northern Adriatic Sea): Methodological Aspects and Data Analyses. Estuar. Coast. She.lf Sci. 77, 113–122. doi: 10.1016/j.ecss.2007.09.005
Cibic T., Blasutto O., Falconi C., Fonda Umani S. (2007b). Microphytobenthic Biomass, Species Composition and Nutrient Availability in Sublittoral Sediments of the Gulf of Trieste (Northern Adriatic Sea). Estuar. Coast. She.lf Sci. 75, 50–62. doi: 10.1016/j.ecss.2007.01.020
Cibic T., Blasutto O., Fonda Umani S. (2007a). Biodiversity of Settled Material in a Sediment Trap in the Gulf of Trieste (Northern Adriatic Sea). Hydrobiologia 580, 57–75. doi: 10.1007/s10750-006-0465-9
Cibic T., Bongiorni L., Borfecchia F., Di Leo A., Franzo A., Giandomenico S., et al. (2016). Ecosystem Functioning Approach Applied to a Large Contaminated Coastal Site: The Study Case of the Mar Piccolo of Taranto (Ionian Sea). Environ. Sci. Pollution. Res. 23, 12739–12754. doi: 10.1007/s11356-015-4997-2
Cibic T., Cerino F., Karuza A., Fornasaro D., Comici C., Cabrini M. (2018b). Structural and Functional Response of Phytoplankton to Reduced River Inputs and Anomalous Physical-Chemical Conditions in the Gulf of Trieste (Northern Adriatic Sea). Sci. Total Environ. 636, 838–853. doi: 10.1016/j.scitotenv.2018.04.205
Cibic T., Comici C., Bussani A., Del Negro P. (2012). Benthic Diatom Response to Changing Environmental Conditions. Estuar. Coast. She.lf Sci. 115, 158–169. doi: 10.1016/j.ecss.2012.03.033
Cibic T., Comici C., Falconi C., Fornasaro D., Karuza A., Lipizer M. (2018a). Phytoplankton Community and Physical-Chemical Data Measured in the Gulf of Trieste (Northern Adriatic Sea) Over the Period March 2006-February 2007. Data Brief 19, 586–593. doi: 10.1016/j.dib.2018.05.054
Cibic T., Virgilio D. (2010). Different Fixatives and HCl Concentrations in Microphytobenthic Primary Production Estimates Using Radiolabeled Carbon: Their Use and Misuse. Limnol. Oceanogr.: Methods (New York, USA: NOVA Science Publishers) 8, 453–461. doi: 10.4319/lom.2010.8.453
Cibic T., Virgilio D. (2011). “In Situ Primary Production Measurements as an Analytical Support to Remote Sensing - An Experimental Approach to Standardize the 14C Incorporation Technique,” in Biomass and Remote Sensing of Biomass. Ed. Atazadeh I., pp 249–pp 262.
Clarke K. R., Gorley R. N., Somerfield P. J., Warwick R. M. (2014). “Change in Marine Communities,” in An Approach to Statistical Analysis and Interpretation (Plymouth: PRIMER-E), 260 pp.
Comici C., Bussani A. (2007). Analysis of the River Isonzo Discharge, (1998-2005). Bollettino. di. Geofisica. Teorica. ed. Applicata. 48, 435–454.
Cossarini G., Solidoro C., Fonda Umani S. (2012). Dynamics of Biogeochemical Properties in Temperate Coastal Areas of Freshwater Influence: Lessons From the Northern Adriatic Sea (Gulf of Trieste). Estuar. Coast. She.lf Sci. 115, 63–74. doi: 10.1016/j.ecss.2012.02.006
Cozzi S., Cabrini M., Kralj M., De Vittor C., Celio M., Giani M. (2020). Climatic and Anthropogenic Impacts on Environmental Conditions and Phytoplankton Community in the Gulf of Trieste (Northern Adriatic Sea). Water 12, 2652. doi: 10.3390/w12092652
Cozzi S., Falconi C., Comici C., Čermelj B., Kovac N., Turk V., et al. (2012). Recent Evolution of River Discharges in the Gulf of Trieste and Their Potential Response to Climate Changes and Anthropogenic Pressure. Estuar. Coast. She.lf Sci. 115, 1–11. doi: 10.1016/j.ecss.2012.03.005
Edler L. (1979). Recommendations for Marine Biological Studies in the Baltic Sea. Phytoplankton and Chlorophyll. Baltic. Mar. Biologist. 5, 1–38.
Faganeli J., Avcin A., Fanuko N., Malej A., Turk V., Tusnik P., et al. (1985). Bottom Layer Anoxia in the Central Part of the Gulf of Trieste in the Late Summer 1983. Mar. Pollution. Bull. 16, 75–78. doi: 10.1016/0025-326X(85)90127-4
Finkel Z. V., Katz M. E., Wright J. D., Schofield O. M. E., Falkowski P. G. (2005). Climatically Driven Macroevolutionary Patterns in the Size of Marine Diatoms Over the Cenozoic. Proc. Natl. Acad. Sci. U.S.A. 102, 8927–8932. doi: 10.1073/pnas.0409907102
Fonda Umani S., Beran A., Parlato S., Virgilio D., Zollet A., De Olazabal A., et al. (2004). Noctiluca Scintillans MACARTNEY in the Northern Adriatic Sea: Long-Term Dynamics, Relationships With Temperature and Eutrophication, and Role in the Food Web. J. Plankton. Reserach. 26, 545–561. doi: 10.1093/plankt/fbh045
Fonda Umani S., Del Negro P., Larato C., De Vittor C., Cabrini M., Celio M., et al. (2007). Major Inter-Annual Variations in Microbial Dynamics in the Gulf of Trieste (Northern Adriatic Sea) and Their Ecosystem Implications. Aquat. Microb. Ecol. 46, 163–175. doi: 10.3354/ame046163
Fonda Umani S., Malfatti F., Del Negro P. (2012). Carbon Fluxes in the Pelagic Ecosystem of the Gulf of Trieste. Estuar. Coast. She.lf Sci. 115, 170–185. doi: 10.1016/j.ecss.2012.04.006
Forster R. M., Créach V., Sabbe K., Vyverman W., Stal L. J. (2006). Biodiversity-Ecosystem Function Relationship in Microphytobenthic Diatoms of the Westerschelde Estuary. Mar. Ecol. Prog. Ser. 311, 191–201. doi: 10.3354/meps311191
Frankenbach S., Ezequiel J., Plecha S., Goessling J. W., Vaz L., Kühl M., et al. (2020). Synoptic Spatio-Temporal Variability of the Photosynthetic Productivity of Microphytobenthos and Phytoplankton in a Tidal Estuary. Front. Mar. Sci. 7. doi: 10.3389/fmars.2020.00170
Franzo A., Celussi M., Bazzaro M., Relitti F., Del Negro P. (2019). Microbial Processing of Sedimentary Organic Matter at a Shallow LTER Site in the Northern Adriatic Sea: An 8-Year Case Study. Nat. Conserv. 34, 397–415. doi: 10.3897/natureconservation.34.30099
Franzo A., Cibic T., Del Negro P. (2016). Assessment of the Benthic Ecosystem Functioning in an Integrative Way: The Case Study of a Marine Protected Area in the Northern Adriatic Sea. Continental. She.lf Res. 121, 35–47. doi: 10.1016/j.csr.2015.12.005
Gargas E. (1975). “A Manual for Phytoplankton Primary Production Studies in the Baltic,” in The Baltic Marine Biologist. Ed. Gargas E. (Hørsholm, Denmark: Water Quality Institute), pp 1–pp18.
Gazeau F., Smith S. V., Gentili B., Frankignoulle M., Gattuso J. P. (2004). The European Coastal Zone: Characterization and First Assessment of Ecosystem Metabolism. Estuar. Coast. She.lf Sci. 60, 673–694. doi: 10.1016/j.ecss.2004.03.007
Giani M., Djakovac T., Degobbis D., Cozzi S., Solidoro C., Fonda Umani S. (2012). Recent Changes in the Marine Ecosystems of the Northern Adriatic Sea. Estuar. Coast. She.lf Sci. 115, 1–13. doi: 10.1016/j.ecss.2012.08.023
Gillespie P. A., Maxwell P. D., Rhodes L. L. (2000). Microphytobenthic Communities of Subtidal Locations in New Zealand: Taxonomy, Biomass, Production, and Food-Web Implications. New Z. J. Mar. Freshwater. Res. 34, 41–53. doi: 10.1080/00288330.2000.9516914
Gilpin L. C., Davidson K., Roberts E. (2004). The Influence of Changes in Nitrogen: Silicon Ratios on Diatom Growth Dynamics. J. Sea. Res. 51, 21–35. doi: 10.1016/j.seares.2003.05.005
Guarini J.-M., Blanchard G. F., Gros P., Harrison S. J. (1997). Modelling the Mud Surface Temperature on Intertidal Flats to Investigate the Spatio-Temporal Dynamic of the Benthic Microalgal Photosynthetic Capacity. Mar. Ecol. Prog. Ser. 153, 25–36. doi: 10.3354/meps153025
Guiry M. D., Guiry G. M. (2022)AlgaeBase. In: World-Wide Electronic Publication (Galway: National University of Ireland) (Accessed 15 February 2022).
Hammer Ø, Harper D. A. T., Ryan P. D. (2001). PAST: Paleontological Statistics Software Package for Education and Data Analysis. Palaeontologia. Electronica. 4 (1), 9.
Hansen H. P., Koroleff F. (1999). “Determination of Nutrients,” in Methods of Seawater Analysis. Eds. Grasshof K., Kremling K., Ehrhardt M. (Weilheim: WILEY-VCH), pp 159–pp 228.
Herndl G. J., Peduzzi P., Fanuko N. (1989). Benthic Community Metabolism and Microbial Dynamics in the Gulf of Trieste (Northern Adriatic Sea). Mar. Ecol. Prog. Ser. 53, 169–178. doi: 10.3354/meps053169
Hillebrand H., Dürselen C. D., Kirschtel D., Pollingher U., Zohary T. (1999). Biovolume Calculation for Pelagic and Benthic Microalgae. Jounal. Phycol. 35, 403–424. doi: 10.1046/j.1529-8817.1999.3520403.x
Hillebrand H., Sommer U. (1999). The Nutrient Stoichiometry of Benthic Microalgal Growth: Redfield Proportions are Optimal. Limnol. Oceanogr. 44, 440–446. doi: 10.4319/lo.1999.44.2.0440
Horner R. A. (2002). A Taxonomic Guide to Some Common Marine Phytoplankton (Bristol: Biopress Ltd), 195 pp.
Ingrosso G., Giani M., Cibic T., Karuza A., Kralj M., Del Negro P. (2016). Carbonate Chemistry Dynamics and Biological Processes Along a River-Sea Gradient (Gulf of Trieste, Northern Adriatic Sea). J. Mar. Syst. 155, 35–49. doi: 10.1016/j.jmarsys.2015.10.013
Jacobs P., Pitarch J., Kromkamp J. C., Philippart C. J. M. (2021). Assessing Biomass and Primary Production of Microphytobenthos in Depositional Coastal Systems Using Spectral Information. PloS One 16 (7), e0246012. doi: 10.1371/journal.pone.0246012
Jahnke R. A., Nelson J. R., Richards M. E., Robertson C. Y., Rao A. M. F., Jahnke D. B. (2008). Benthic Primary Productivity on the Georgia Midcontinental Shelf: Benthic Flux Measurements and High-Resolution, Continuous in Situ PAR Records. J. Geophys. Res. 113. doi: 10.1029/2008JC004745
Kemp W. M., Smith E. M., Marvin-DiPasquale M., Boynton W. R. (1997). Organic Carbon Balance and Net Ecosystem Metabolism in Chesapeake Bay. Mar. Ecol. Prog. Ser. 150, 229–248. doi: 10.3354/meps150229
Kennish M., Brush M., Moore K. (2014). Drivers of Change in Shallow Coastal Photic Systems: An Introduction to a Special Issue. Estuar. Coasts. 37, 3–19. doi: 10.1007/s12237-014-9779-4
Kirk J. T. O. (2000). Light & Photosynthesis in Aquatic Ecosystems. Second Edition (UK: Cambridge University Press), 509 pp.
Kralj M., Lipizer M., Čermelj B., Celio M., Fabbro C., Brunetti F., et al. (2019). Hypoxia and Dissolved Oxygen Trends in the Northeastern Adriatic Sea (Gulf of Trieste). Deep. Sea. Res. Part II: Topical. Stud. Oceanogr. 164, 74–88. doi: 10.1016/j.dsr2.2019.06.002
Kromkamp J. C., Forster R. M. (2006). “Estimating Primary Production: Scaling Up From Point Measurements to the Whole Estuary,” in Functioning of Microphytobenthos in Estuaries. Eds. Kromkamp J. C., De Brouwer J. F. C., Blanchard G. F., Forster R. M., Créach V. (Amsterdam: Proceedings of the Colloquium), pp 9–pp 30.
Lake S. J., Brush M. J. (2011). The Contribution of Microphytobenthos to Total Productivity in Upper Narragansett Bay, Rhode Island. Estuar. Coast. She.lf Sci. 95, 289–297. doi: 10.1016/j.ecss.2011.09.005
Lehrter J. C., Fry B., Murrell M. C. (2014). Microphytobenthos Production Potential and Contribution to Bottom Layer Oxygen Dynamics on the Inner Louisiana Continental Shelf. Bull. Mar. Sci. 90, 765. doi: 10.5343/bms.2013.1050
Lipizer M., De Vittor C., Falconi C., Comici C., Tamberlich F., Giani M. (2012). Effects of Intense Meteorological and Biological Forcing Factors on Biogeochemical Properties of Coastal Waters (Gulf of Trieste, Northern Adriatic Sea). Estuar. Coast. She.lf Sci. 115, 40–50. doi: 10.1016/j.ecss.2012.03.024
Longhurst A., Sathyendrenath S., Platt T., Caverhill C. (1995). An Estimate of Global Production in the Ocean From Satellite Radiometer Data. J. Plankton. Res. 17, 1245–1271. doi: 10.1093/plankt/17.6.1245
Malačič V., Petelin B. (2001). “Regional Studies: Gulf of Trieste,” in Physical Oceanography of the Adriatic Sea: Past, Present and Future. Eds. Cushman- Roisin B., Gačić M., Poulain P.-M., Artegiani A. (Dordrecht, Netherlands: Kluwer Academic Publishers), pp 167–pp 181.
Malej A., Malačič V. (1995). Factors Affecting Bottom Layer Oxygen Depletion in the Gulf of Trieste (Adriatic Sea). Ann. Istrian. Mediterranean. Stud. 6, 33–42.
Malej A., Mozetič P., Malačič V., Terzić S., Ahel M. (1995). Phytoplankton Responses to Freshwater Inputs in a Small Semi-Enclosed Gulf (Gulf of Trieste, Adriatic Sea). Mar. Ecol. Prog. Ser. 120, 111–121. doi: 10.3354/meps120111
Malinverno E., Dimiza M. D., Triantaphylou M., Dermitzkis M. D., Corselli C. (2008). “Coccolithophores of the Eastern Mediterranean Sea,” in A Look Into the Marine Microworld (Peristeri: Ion Publishing Group), 188 pp.
Martin J. H., Knauer G. A., Karl D. M., Broenkow W. W. (1987). VERTEX: Carbon Cycling in the Northeast Pacific. Deep-Sea. Res. 34, 267–285. doi: 10.1016/0198-0149(87)90086-0
Menden-Deuer S., Lessard E. J. (2000). Carbon to Volume Relationships for Dinoflagellates, Diatoms and Other Protest Plankton. Limnol. Oceanogr. 45, 569–579. doi: 10.4319/lo.2000.45.3.0569
Meyercordt J., Meyer-Reil L.-A. (1999). Primary Production of Benthic Microalgae in Two Shallow Coastal Lagoons of Different Trophic Status in the Southern Baltic Sea. Mar. Ecol. Prog. Ser. 178, 179–191. doi: 10.3354/meps178179
Migné A., Spilmont N., Boucher G., Denis L., Hubas C., Janquin M. A., et al. (2009). Annual Budget of Benthic Production in Mont Saint-Michel Bay Considering Cloudiness, Microphytobenthos Migration, and Variability of Respiration Rates With Tidal Conditions. Continental. She.lf Res. 29, 2280–2285. doi: 10.1016/j.csr.2009.09.004
Miles A., Sundbäck K. (2000). Diel Variation in Microphytobenthic Productivity in Areas of Different Tidal Amplitude. Mar. Ecol. Prog. Ser. 205, 11–22. doi: 10.3354/meps205011
Montani S., Magni P., Abe N. (2003). Seasonal and Interannual Patterns of Intertidal Microphytobenthos in Combination With Laboratory and Areal Production Estimates. Mar. Ecol. Prog. Ser. 249, 79–91. doi: 10.3354/meps249079
Mozetič P., Solidoro C., Cossarini G., Socal G., Pyrecali R., France J, et al (2010). Recent Trends Towards Oligotrophication of the Northern Adriatic: Evidence from Chlorophyll a Time Series.. Estuaries Coasts 33, 362–375. doi: 10.1007/s12237-009-9191-7
Mozetič P., Francé J., Kogovšek T., Talaber I., Malej A. (2012). Plankton Trends and Community Changes in a Coastal Sea (Northern Adriatic): Bottom-Up vs. Top-Down Control in Relation to Environmental Drivers. Estuar. Coast. She.lf Sci. 115, 138–148. doi: 10.1016/j.ecss.2012.02.009
Murrell M. C., Campbell J. G., Hagy J. D. III, Caffrey J. M. (2009). Effects of Irradiance on Benthic and Water Column Processes in a Gulf of Mexico Estuary: Pensacola Bay, Florida, USA. Estuar. Coast. She.lf Sci. 81, 501–512. doi: 10.1016/j.ecss.2008.12.002
Perissinotto R., Nozais C., Kibirige I. (2002). Spatio-Temporal Dynamics of Phytoplankton and Microphytobenthos in a South African Temporarily Open Estuary. Estuar. Coast. She.lf Sci. 54, 363–374. doi: 10.1006/ecss.2001.0885
Perissinotto R., Nozais C., Kibirige I., Anandraj A. (2003). Planktonic Food Webs and Benthic-Pelagic Coupling in South African Temporarily-Open Estuaries. Acta Oecologica. 24, S307–S316. doi: 10.1016/S1146-609X(03)00028-6
Pielou E. C. (1966). Shannon’s Formula as a Measure of Species Diversity: Its Use and Misuse. Am. Nat. 118, 463–465. doi: 10.1086/282439
Poulain P.-M., Kourafalou V. H., Cushman-Roisin B. (2001). “Northern Adriatic Sea,” in Physical Oceanography of the Adriatic Sea Past, Present and Future. Eds. Cushman-Roisin B., Gačić M., Poulain P.-M., Artegiani A. (Dordrecht, Netherlands: Kluwer Academic Publishers), pp 143–pp 165.
Querin S., Crise A., Deponte D., Solidoro C. (2006). Numerical Study of the Role of Wind Forcing and Freshwater Buoyancy Input on the Circulation in a Shallow Embayment (Gulf of Trieste, Northern Adriatic Sea). J. Geophysical. Res. 111, C03S16. doi: 10.1029/2006JC003611
Redfield A. C. (1958). The Biological Control of the Chemical Factors in the Environment. Am. Sci. 46, 205–221.
Rogelja M., Cibic T., Pennesi C., De Vittor C. (2016). Microphytobenthic Community Composition and Primary Production at Gas and Thermal Vents in the Aeolian Islands (Tyrrhenian Sea, Italy). Mar. Environ. Res. 118, 31–44. doi: 10.1016/j.marenvres.2016.04.009
Rogelja M., Cibic T., Rubino F., Belmonte M., Del Negro P. (2018). Active and Resting Microbenthos in Differently Contaminated Marine Coastal Areas: Insights From the Gulf of Trieste (Northern Adriatic, Mediterranean Sea). Hydrobiologia 806, 283–301. doi: 10.1007/s10750-017-3366-1
Rubino F., Cibic T., Belmonte M., Rogelja M. (2016). Microbenthic Community Structure and Trophic Status of Sediments in the Mar Piccolo of Taranto (Mediterranean, Ionian Sea). Environ. Sci. Pollution. Res. 23, 12624–12644. doi: 10.1007/s11356-015-5526-z
Santema M., Huettel M. (2018). Dynamics of Microphytobenthos Photosynthetic Activity Along a Depth Transect in the Sandy Northeastern Gulf of Mexico Shelf. Estuar. Coast. She.lf Sci. 212, 273–285. doi: 10.1016/j.ecss.2018.07.016
Schlitzer R. (2021). Ocean Data View. Available at: https://odv.awi.de.
Serodio J., Vieira S., Cruz S. (2008). Photosynthetic Activity, Photoprotection and Photoinhibition in Intertidal Microphytobenthos as Studied in Situ Using Variable Chlorophyll Fluorescence. Continental. She.lf Res. 28, 1363–1375. doi: 10.1016/j.csr.2008.03.019
Shannon C. E., Weaver W. (1949). The Mathematical Theory of Communication (Urbana, Illinois: Illinois Press).
Sorokin Y. I. (1958). Results and Prospects of Using Isotopic Carbon for the Investigation of Carbon Cycle in Water Basins. Int. Conf. Radioisotopes. 4, 633–648.
Souza A. C., Pease T. K., Gardner W. S. (2011). The Direct Role of Enzyme Hydrolysis on Ammonium Regeneration Rates in Estuarine Sediments. Aquat. Microb. Ecol. 65, 159–168. doi: 10.3354/ame01541
Steeman Nielsen E. (1952). The Use of Radioactive 14C for Measuring Organic Production in the Sea. J. du. Conseil. Permanent. Int. pour. l’exploitation. la. Mer 18, 117–140. doi: 10.1093/icesjms/18.2.117
Stravisi F. (1977). Bora Driven Circulation in Northern Adriatic. Bollettino. di. Geofisica. Teorica. e Applicata. 19, 73–74.
Stravisi F. (1983). Some Characteristics of the Circulation in the Gulf of Trieste. Thalassia. Jugoslavica. 19, 355–363.
Sundbäck K., Jönsson B. (1988). Microphytobenthic Productivity and Biomass in Sublittoral Sediments of a Stratified Bay, Southeastern Kattegat. J. Exp. Mar. Biol. Ecol. 122, 63–81. doi: 10.1016/0022-0981(88)90212-2
Sundbäck K., Lindehoff E., Graneli E. (2011). Dissolved Organic Nitrogen: An Important Source of Nitrogen for the Microphytobenthos in Sandy Sediment. Aquat. Microb. Ecol. 63, 89–100. doi: 10.3354/ame01479
Sundbäck K., Miles A., Gőrnasson E. (2000). Nitrogen Fluxes, Denitrification and the Role of Microphytobenthos in Microtidal Shallow-Water Sediments: An Annual Study. Mar. Ecol. Prog. Ser. 200, 59–76. doi: 10.3354/meps200059
Talaber I., Francé J., Flander-Putrle V., Mozetič P. (2018). Primary Production and Community Structure of Coastal Phytoplankton in the Adriatic Sea: Insights on Taxon-Specific Productivity. Mar. Ecol. Prog. Ser. 604, 65–81. doi: 10.3354/meps12721
Talaber I., Francé J., Mozetič P. (2014). How Phytoplankton Physiology and Community Structure Adjust to Physical Forcing in a Coastal Ecosystem (Northern Adriatic Sea). Phycologia 53, 74–85. doi: 10.2216/13-196.1
Testa J., Faganeli J., Giani M., Brush M., De Vittor C., Boynton W., et al. (2021). “Advances in Our Understanding of Pelagic-Benthic Coupling,” in Coastal Ecosystems in Transition: A Comparative Analysis of the Northern Adriatic and Chesapeake Bay, Geophysical Monograph, 1st Edition, vol. 256 . Eds. Malone T., Malej A., Faganeli J. (New York, USA: Wiley & Sons Ltd), pp 147–pp 175.
Throndsen J. (1978). “Preservation and Storage,” in Phytoplankton Manual. Ed. Sournia A. (Paris: UNESCO), pp 69–pp 74.
Trombetta T., Vidussi F., Mas S., Parin D., Simier M., Mostajir B. (2019). Water Temperature Drives Phytoplankton Blooms in Coastal Waters. PloS One 14 (4), e0214933. doi: 10.1371/journal.pone.0214933
Utermöhl (1958). Zur Vervollkommnung Der Quantitativen Phytoplankton-Methodik. Mitteilungen. Internationale. Vereiningung. für Theoretische. und Angewandte. Limnologie. 9, 1–38. doi: 10.1080/05384680.1958.11904091
van der Molen J. S., Perissinotto R. (2011). Microalgal Productivity in an Estuarine Lake During a Drought Cycle: The St. Lucia Estuary, South Africa. Estuarine. Coast. She.lf Sci. 92, 1–9. doi: 10.1016/j.ecss.2010.12.002
Williams PJ le B., Thomas D. N., Reynolds C. S. (2002). Phytoplankton Productivity (Oxford, UK: Blackwell Science).
WoRMS Editorial Board (2022) World Register of Marine Species. Available at: https://www.marinespecies.org (Accessed 2022-02-15).
Keywords: primary production, benthic-pelagic coupling, 14C-uptake, phytoplankton, microphytobenthos, nutrient availability
Citation: Cibic T, Baldassarre L, Cerino F, Comici C, Fornasaro D, Kralj M and Giani M (2022) Benthic and Pelagic Contributions to Primary Production: Experimental Insights From the Gulf of Trieste (Northern Adriatic Sea). Front. Mar. Sci. 9:877935. doi: 10.3389/fmars.2022.877935
Received: 17 February 2022; Accepted: 05 May 2022;
Published: 09 June 2022.
Edited by:
Paolo Magni, National Research Council (CNR), ItalyReviewed by:
Peter Anton Upadhyay Staehr, Aarhus University, DenmarkConrad Pilditch, University of Waikato, New Zealand
Copyright © 2022 Cibic, Baldassarre, Cerino, Comici, Fornasaro, Kralj and Giani. This is an open-access article distributed under the terms of the Creative Commons Attribution License (CC BY). The use, distribution or reproduction in other forums is permitted, provided the original author(s) and the copyright owner(s) are credited and that the original publication in this journal is cited, in accordance with accepted academic practice. No use, distribution or reproduction is permitted which does not comply with these terms.
*Correspondence: Tamara Cibic, dGNpYmljQGlub2dzLml0