 Wen Liang
 Lihua Ran
 Zhi Yang
 Martin G. Wiesner
 Yuzhao Liang1,5
 Jianfang Chen
95% of researchers rate our articles as excellent or good
Learn more about the work of our research integrity team to safeguard the quality of each article we publish.
Find out more
ORIGINAL RESEARCH article
Front. Mar. Sci. , 12 August 2022
Sec. Marine Biogeochemistry
Volume 9 - 2022 | https://doi.org/10.3389/fmars.2022.875415
This article is part of the Research Topic Biogeochemistry and Genomics of Silicification and Silicifiers, volume II View all 11 articles
The dissolved silicate concentrations in the supernatant of sediment trap sampling bottles retrieved from deep water (1000-3000 m) at four stations in the South China Sea (SCS) were measured to calculate the underestimated flux of biogenic silica (bSi) in sinking particles due to bSi dissolution. High dissolved silicate concentrations in the supernatant, ranging from 122.6 to 1365.8 μmol/L, indicated significant dissolution of particulate bSi in the sampling bottles. Underestimation of the bSi flux in the SCS by ~2% to ~34% (average: ~10%) due to bSi dissolution was revealed, and the degree of underestimation increased with decreasing total bSi flux. The amount of bSi dissolved within the sampling series at each station was generally positively correlated with dissolution time and to a certain extent influenced by the bSi amount collected by the sampling bottles under a low bSi sinking flux. Apparently stronger bSi dissolution was found at two of the four stations due to relatively high bSi dissolution rates, which were possibly related to a higher reactive surface area of the bSi or bacterial activity. Overall, our results demonstrated that the considerable bSi dissolution in sediment trap sampling bottles should not be ignored, especially in the low-productivity oligotrophic ocean, and bSi flux calibration via measurement of the dissolved silicate in sampling bottles is necessary. To reduce bSi flux underestimation due to the deployment of time-series sediment traps, larger-volume sampling bottles should be avoided in the oligotrophic open ocean, and sinking particle samples should be analyzed as soon as the sediment traps are recovered.
Biogenic silica (bSi), also referred to as biogenic opal, comprises the skeletons or cell walls of siliceous organisms, such as diatoms, silicoflagellates, sponge spicules, siliceous rhizarians and several species of choanoflagellates in marine environments (Biard et al., 2018; Maldonado et al., 2019; Puppe, 2020; Llopis Monferrer et al., 2020; Tréguer et al., 2021). Silicate is an essential nutrient supporting the growth of siliceous organisms and the picocyanobacteria Synechococcus (Baines et al., 2012; Ohnemus et al., 2016). The biogeochemical cycle of silicon, including assimilation by phytoplankton, remineralization from organic organisms, dissolution and burial of siliceous organisms in sediments, controls silicate bioavailability in the global ocean (Struyf et al., 2009; Tréguer et al., 2021). In addition, as one of the main ballast minerals transporting particulate organic carbon to the deep ocean, bSi plays an important role in the global biogeochemical cycles of carbon (Ragueneau et al., 2006; Honjo et al., 2008; Street-Perrott and Barker, 2008; Lampitt et al., 2009; Guidi et al., 2016; Tréguer et al., 2018).
Sediment traps are widely implemented as an effective tool to observe marine biogeochemical processes and marine biological carbon export by collecting sinking particles over time in the deep ocean. The sinking particles are analyzed in the laboratory to obtain detailed information on biogeochemical fluxes, and bSi, as one of the main components in sinking particles, is measured to estimate the silicon export flux and the coupled relation between silicon and carbon (Ran et al., 2015; Li et al., 2017; Tan et al., 2020). The mole ratio of bSi to CaCO3, another major ballast material of particulate organic carbon attributed to coccoliths and foraminifer tests (Schiebel, 2002; Poulton et al., 2007), in sinking particles is an important indicator of different marine biogeochemical provinces (Ragueneau et al., 2002). Oceanic regions with higher bSi/CaCO3 ratios (>1.0) are normally referred to as silica oceans, and regions with ratios<1.0 constitute carbonate oceans (Honjo et al., 2008). Therefore, accurate measurement of bSi in sinking particles is essential for research on marine silicon and carbon cycles.
It is acknowledged that the bSi of dead organisms begins to dissolve in the water column due to the high-undersaturated concentration of silicate in marine environments (Hurd, 1973; Tréguer and Rocha, 2013). It is foreseeable that the dissolution of bSi will also inevitably occur in a sediment trap because the sampling bottles are generally filled with seawater that is highly undersaturated in silicate. Continuous bSi dissolution in sediment trap sampling bottles could result in significant underestimation of the bSi sinking flux by more than 80% under low bSi fluxes and by 60% under the annual average flux in high-latitude seas, such as the Greenland Sea, Norwegian Sea and Baltic Sea (Bauerfeind and Bodungen, 2006). Nevertheless, few follow-up studies on bSi dissolution in sediment traps during the sampling period and the effect on bSi flux measurements have been reported. This may result in substantial underestimation of the silicon biogeochemical flux in the current global marine silicon cycle budget (Tréguer and Rocha, 2013; Tréguer et al., 2021) and corresponding misunderstanding of the marine biogeochemical carbon cycle and marine biological carbon pump (Honjo et al., 2008).
The South China Sea (SCS), as the largest marginal sea in the tropical northwestern Pacific, is under the control of the East Asian monsoon, and therefore has significant seasonal variation in the marine environment and biogeochemical processes in the upper ocean. It is generally considered oligotrophic water with relatively low surface biomass (Du et al., 2013; Du et al., 2017). Nevertheless, diatoms are important contributors to phytoplankton communities in this oligotrophic water, especially during winter monsoon period (Ning et al., 2004). Long-term time-series observations by sediment traps in the SCS since the 1980s have indicated significant seasonal and interannual variations and spatial differences in the bSi export flux to the deep ocean, related to variations in diatom productivity (Wiesner et al., 1996; Lahajnar et al., 2007; Ran et al., 2015; Li et al., 2017; Zhang et al., 2019; Tan et al., 2020; Li et al., 2022). The bSi/CaCO3 ratio in the sinking particles is generally<1.0 in the northern SCS except in the period of highest productivity (Zhang et al., 2019; Tan et al., 2020), and >1.0 in the central SCS except in the period of lowest productivity (Li et al., 2017; Li et al., 2022), indicating a variable export mechanism of POC in this relatively small semienclosed and oligotrophic ocean basin. However, the measurement of the bSi sinking flux in previous works did not consider dissolution of bSi in the sampling bottles of sediment traps and its effect on the bSi flux measurements.
In the present work, the SCS was selected to investigate bSi dissolution in sediment traps and its impact on bSi flux estimation in this low-latitude oligotrophic marginal sea. Both the bSi in sinking particles and the silicate in the supernatant of the sediment trap sampling bottles were analyzed to evaluate the degree of bSi dissolution in the sediment trap bottles during the sampling period and calculate the underestimation of the bSi sinking flux. The results also provide valuable clues for further study of the dissolution kinetics of bSi in dark, cryogenic and high-pressure deep ocean environments.
Time-series sinking particle samples collected at 4 stations in the northern SCS (Figure 1 and Table 1) were used in this study. They were collected from July 2012 to April 2013 at station SCS-NW, from May 2015 to April 2016 at station SCS-N, and from May 2017 to May 2018 at station SCS-B and SCS-C at water depths ranging from 1000 or 3000 m. The sediment traps used in this study were the PARFLUX Mark 78H-21 from Mclane Research Laboratories, Inc. The sea water temperature ranged from 2.4°C to 4°C at the depth of the deployed sediment traps (Chen et al., 2001; Tian and Wei, 2005; Wang et al., 2011).

Figure 1 Site locations of the sediment trap moorings in the SCS.
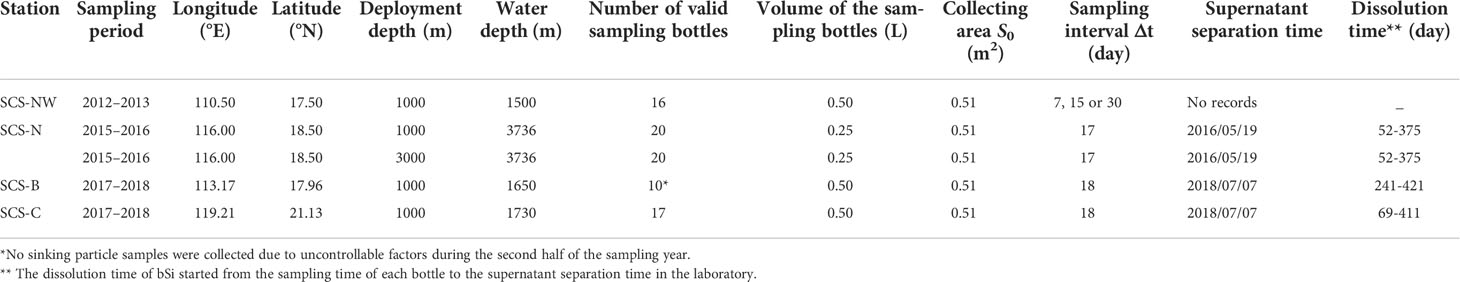
Table 1 Site location and sampling information of the sediment traps deployed in the northern SCS.
Before the sediment traps were deployed, the adopted polyethylene sampling bottles (250 ml for SCS-N and 500 ml for SCS-NW, SCS-B and SCS-C) were filled with a filtered surface seawater-based solution of sodium chloride (NaCl, 35 g·L-1) and mercury chloride (HgCl2, 3.3 g·L-1) to minimize microbial activity and diffusive processes (Wiesner et al., 1996; Li et al., 2017). The surface seawater retrieved from the open ocean where the sediment traps were deployed was nearly depleted in silicate (silicate concentration = 0.8~1.4 μmol·L-1). After recovery of the sediment traps, the collected samples were stored in a refrigerator at 4°C. Approximately 30 mL of the supernatant in each sampling bottle was filtered through a polycarbonate filter (0.45-µm pore size) for silicate analysis. Wet particle samples were passed through a 1-mm mesh nylon sieve to remove zooplankton, and the <1-mm component was divided into ten equal parts with a high-precision rotary splitter (McLane WSD-10). Each subsample for bSi analysis was filtered through preweighed polycarbonate filters and dried at 45°C for 72 h before being precisely weighed.
Each supernatant sample for silicate analysis was diluted 10–30 times with silicate-depleted sea surface water. The diluted sample was then acidified and mixed with an ammonium heptamolybdate solution to form molybdosilicic acid. The resulting acid was reduced with a reducing agent (L (+) ascorbic acid or a mixed reagent of H2SO4, metol and Na2SO3) into a blue dye, which was measured at 810 nm with spectrophotometer. Oxalic acid was added to the reducing agent to avoid phosphate interference. For the supernatant samples from station SCS-N, the silicate concentrations were measured by a Skalar San++ nutrient automatic analyzer, with the chemical treatments of samples embedded in the analyzer.
The silicate concentration in the supernatant was considered to originate from the dissolution of biogenic silica (bSiD), as the filtered surface seawater-based solution used to fill the sampling bottles was generally silicate depleted. The absolute amount of bSiD was calculated with equation (1):
where M(bSiD) is the amount of bSiD (mg), 67.29 is the molar mass (g·mol-1) of bSi [SiO2·0.4 H2O; Mortlock and Froelich (1989)], V is the volume of the sampling bottle (L), and C is the silicate concentration in the supernatant (μmol·L-1).
Then, the underestimated bSi flux due to bSi dissolution was calculated with equation (2):
where F(bSiD) is the bSiD flux (mg·m-2·d-1), S0 is the collecting area of the sediment trap (m2), and Δt is the sampling interval (day).
The flux of particulate bSi (bSiP) was measured following Mortlock and Froelich (1989): 20–50 mg of a dry sinking particle sample was ground and transferred to a 50-mL polypropylene centrifuge tube. Then, 5 mL of 2% H2O2 and 5 mL of 1 mol/L HCl were added to remove impurities such as organics and carbonate, respectively. The sample was centrifuged, and the supernatant was removed with a pipette. Then, Milli-Q water was mixed with the sample and centrifuged again to remove the supernatant. This process was repeated three times to remove the residual reaction liquid. After the resultant sample was dried at 60°C, 40 mL of a 2 M Na2CO3 solution was added, and the obtained sample was heated in a water bath at 85°C for 5 h. The sample was then centrifuged, and 20 mL of the supernatant was employed for silicate measurement with the silicomolybdenum blue method via spectrophotometry.
The amount of bSiP was calculated with equation (3):
where M(bSiP) is the amount of bSiP (mg), 67.29 is the molar mass (g·mol-1) of bSi [SiO2·0.4 H2O; Mortlock and Froelich (1989)], VNa2CO3 is the volume of the Na2CO3 solution (L), Cextract is the silicate concentration in the supernatant of the extraction solution (μmol·L-1), m is the total amount of sinking particles (mg), and M is the amount of sinking particles considered for silicate analysis (mg).
Then, the bSiP flux was calculated with equation (4):
where F(bSiP) is the bSiP flux (mg·m-2·d-1), S0 is the collecting area of the sediment trap (m2), and Δt is the sampling interval (day).
The total bSi (bSiT) flux was revised by adding the bSiD flux and the bSiP flux based on equation (5):
The ratio of bSiD to bSiT (bSiD%) was calculated based on equation (6):
The silicate concentration in the supernatant of the sediment traps deployed in different areas of the SCS is shown in Figure 2 and Table 2. The silicate concentration in the sampling bottles at stations SCS-N and SCS-NW was much higher than that in the sampling bottles at stations SCS-B and SCS-C. At stations SCS-N and SCS-NW, the silicate concentration decreased gradually over time from the beginning to the end of the sampling year. The highest concentration varied within the range of 1200–1400 μmol·L-1, normally found in the first or second sampling bottle. The silicate concentration in the supernatant at stations SCS-B and SCS-C was generally lower than 400 μmol·L-1, which is lower than the lower limit of the silicate concentration (564.7 μmol·L-1) at stations SCS-NW and SCS-N. Nevertheless, a gradual decreasing trend in silicate in the sampling bottles from the beginning to the end of the sampling year was also observed at stations SCS-B and SCS-C.
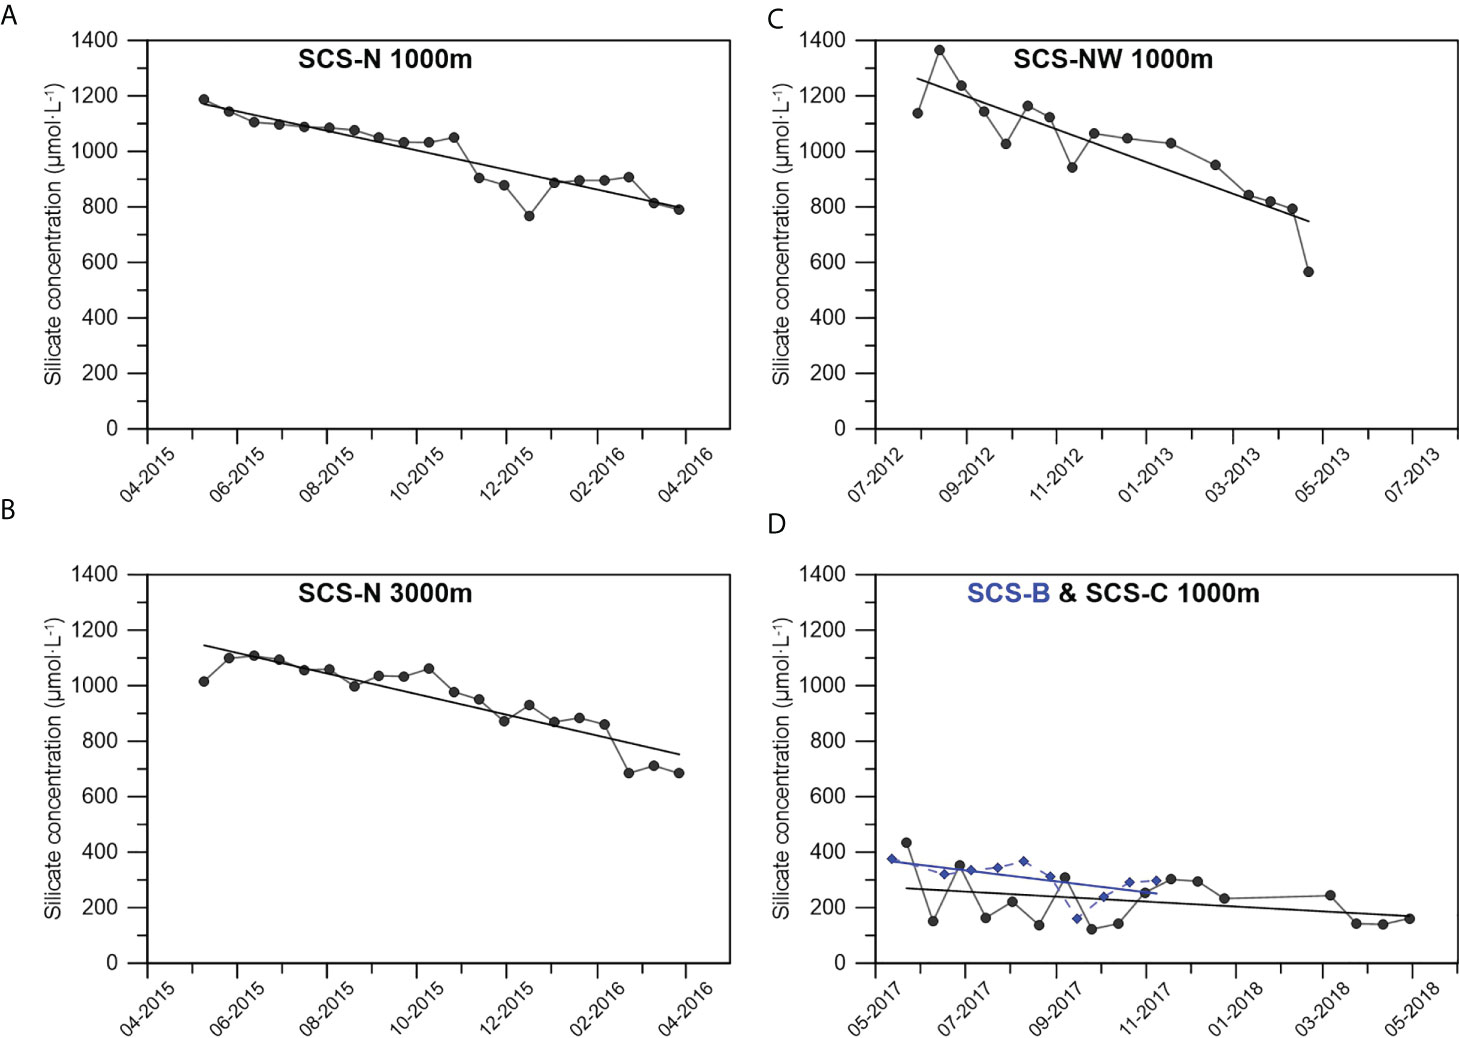
Figure 2 Silicate concentration in the supernatant of the sediment trap sampling bottles at 1000 m of stationSCS-N (A), 3000 m of station SCS-N (B), 1000 m of station SCS-NW (C) and 1000 m of station B & C with the blueish diamonds representing the data of SCS-B (D).
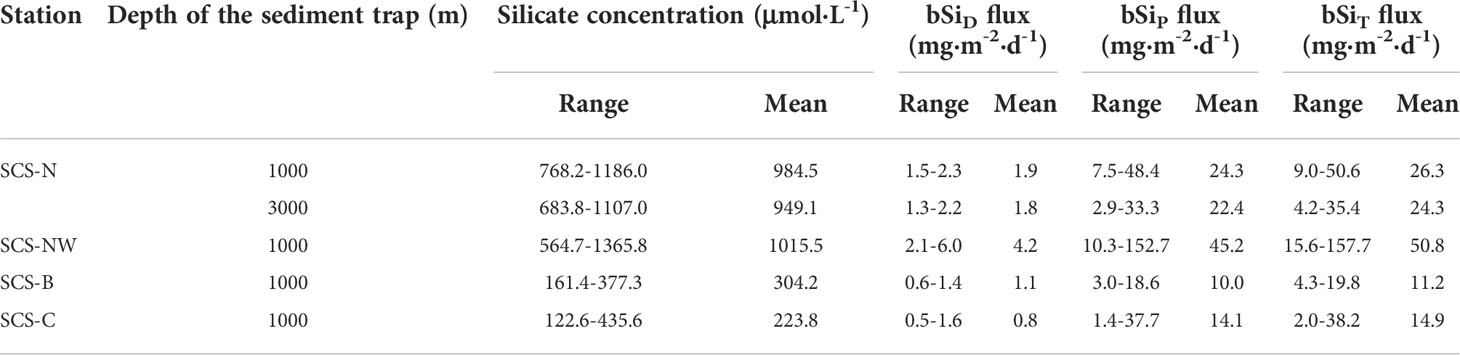
Table 2 Silicate concentration in the supernatant of the sampling bottles, bSiD flux, bSiP flux and bSiT flux at the different sediment trap stations in the SCS.
The amount of bSiD was calculated based on the silicate concentration in the supernatant of each sampling bottle [equation (1)], and the flux of bSiD was further calculated [equation (2)]. The bSiD amount and flux at station SCS-NW were much higher than those at stations SCS-N, SCS-B and SCS-C (Figure 3). Although an apparent higher silicate concentration in the supernatant was found at station SCS-N than at stations SCS-B and SCS-C, the differences in the bSiD amount and flux at these stations were not as significant as the difference in the silicate concentration.
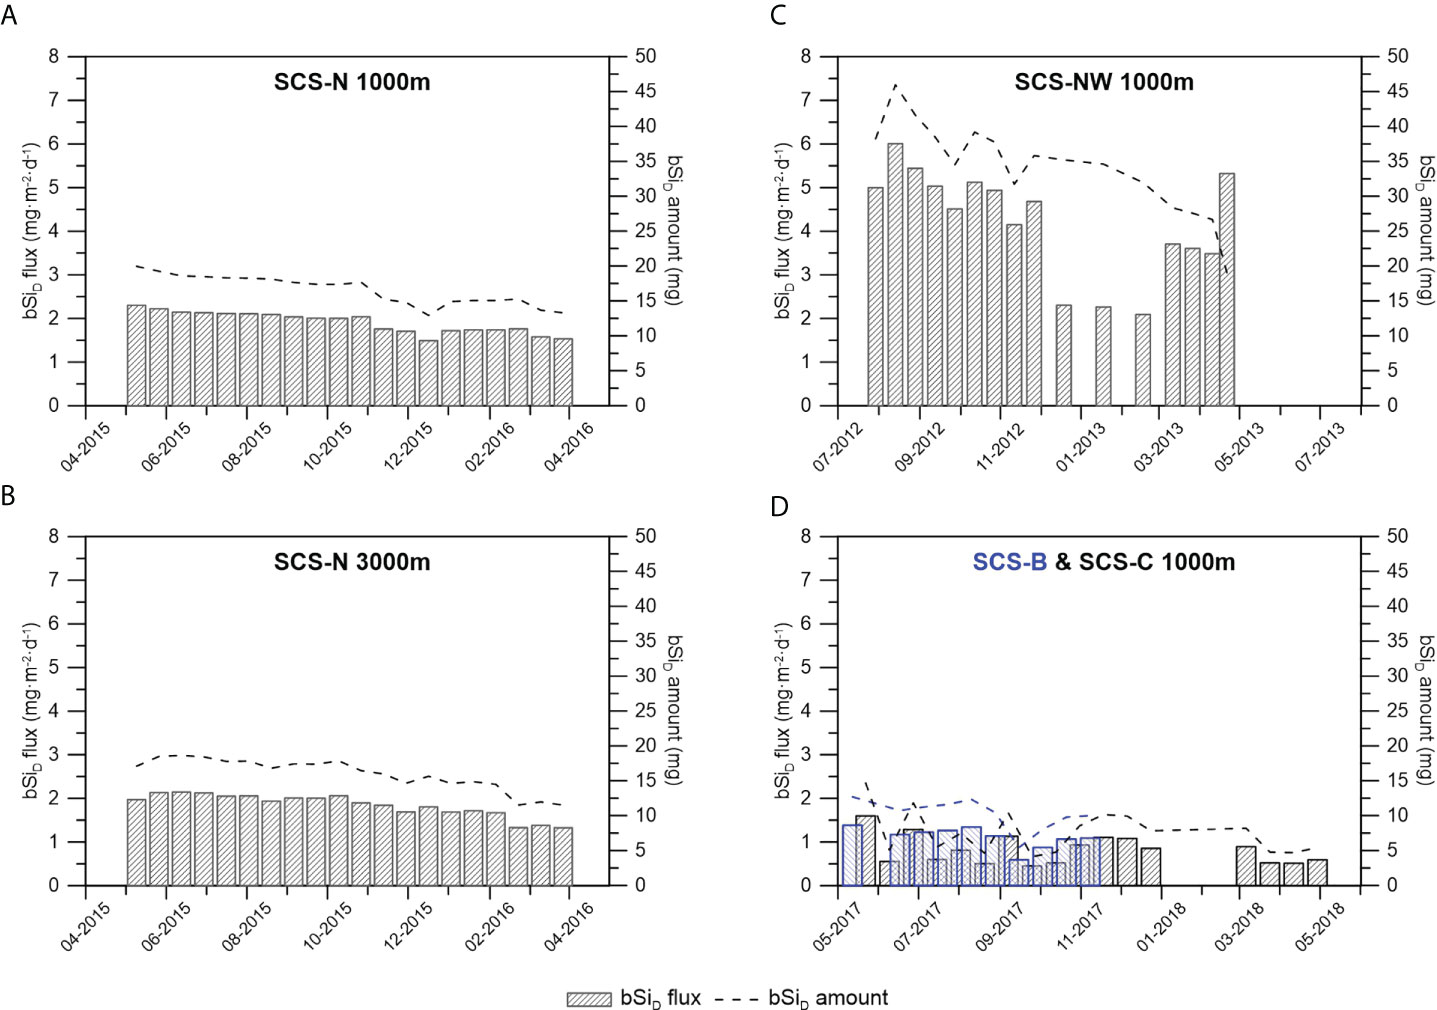
Figure 3 The bSiD flux and amount calculated based on the silicate concentration in the sediment trap sampling bottles at 1000 m of station SCS-N (A), 3000 m of station SCS-N (B), 1000 m of station SCS-NW (C) and 1000 m of station B & C with the blueish bars and blueish dotted line representing the data of SCS-B (D).
Variations in the bSiP flux at the four stations in the deep SCS are shown in Figure 4 and Table 2. The bSiP flux at stations SCS-B and SCS-C from 2017–2018 was slightly lower than that at station SCS-N from 2015-2016 and much lower than that at station SCS-NW from 2012-2013. Seasonal variations in the bSiP flux were found at all stations; for example, a higher bSiP flux was found in winter than in summer at station SCS-C, and three remarkable peaks in the bSiP flux were observed at station SCS-NW. However, no significant correlation was found between the variation in bSiP and the change pattern of bSiD.
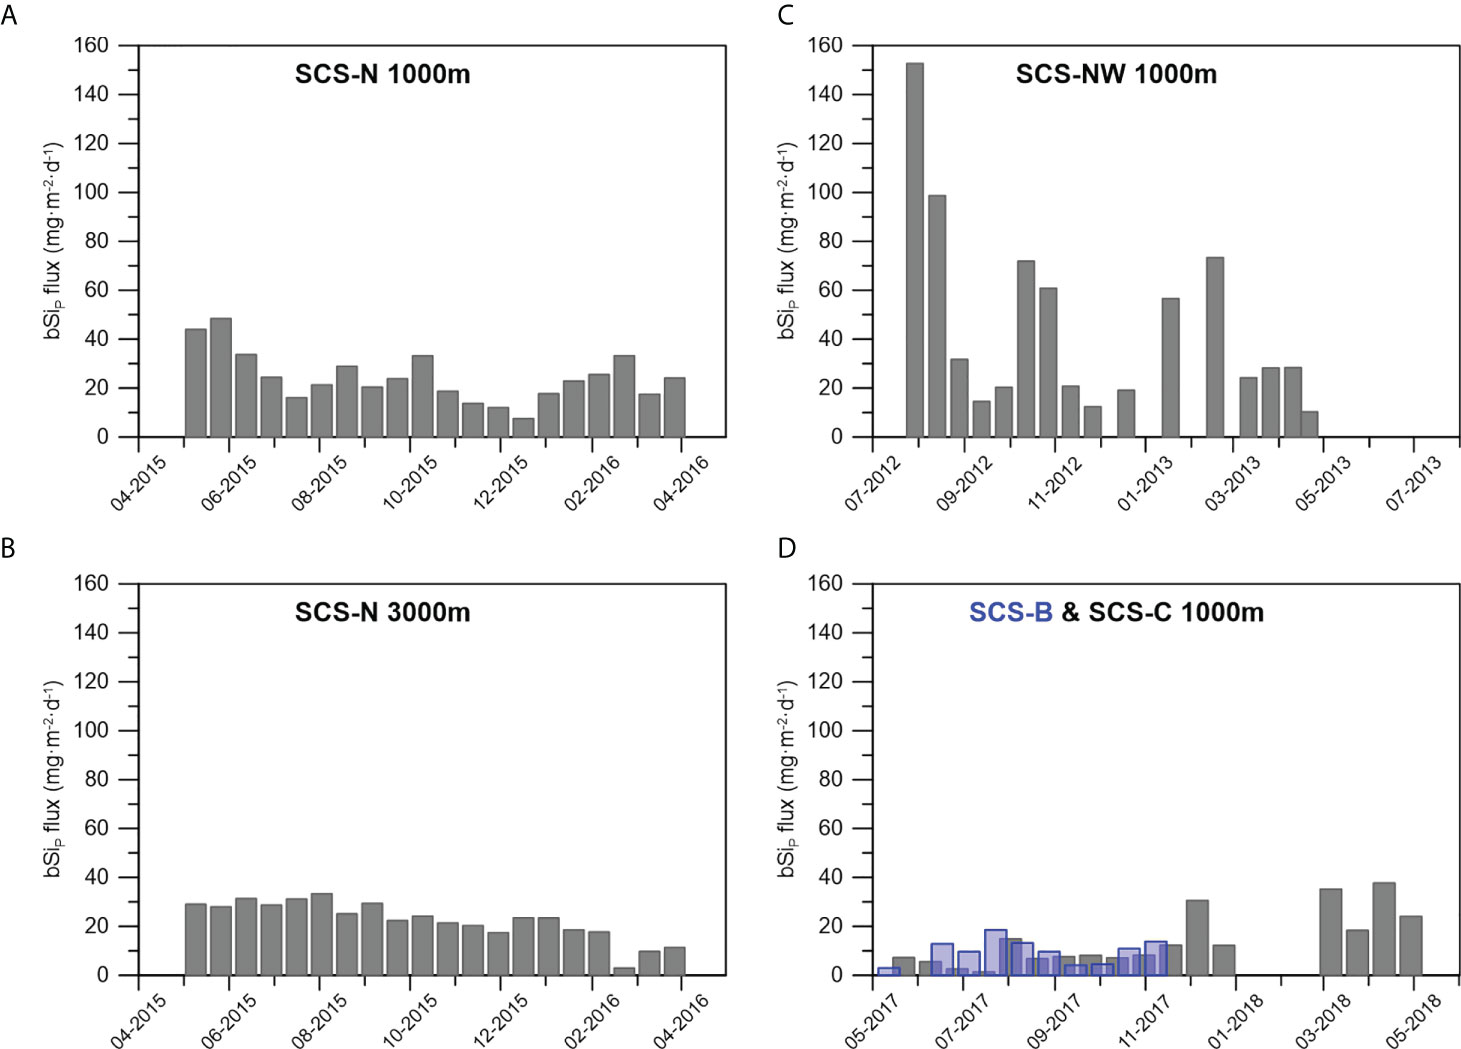
Figure 4 The bSiP flux at different stations at 1000m of station SCS-N (A), 3000 m of station SCS-N (B),1000m of station SCS-NW (C) and 1000 m of station B & C with the blueish bars representing the data of SCS-B (D).
Significant dissolution of bSi, indicated by the high silicate concentrations in the sediment trap sampling bottles at all stations in the SCS (Figure 2), is bound to result in underestimation of the bSi sinking flux. Based on equations (5) and (6), the bSiT flux and bSiD% were calculated and are shown in Figure 5 and Table 2. The variation in the bSiT flux generally followed the variation in the bSiP flux, and the contribution of bSiD to the bSiT was lower than that of bSiP. Nevertheless, an apparent change in bSiD% was found. It ranged from 4.4% to 16.6% (average: 8.3%) at 1000 m at station SCS-N, from 5.8% to 31.2% (average: 8.9%) at 3000 m at station SCS-N, from 2.8% to 34.0% (average: 13.3%) at 1000 m at station SCS-NW, from 6.4% to 31.9% (average: 12.3%) at 1000 m at station SCS-B and from 1.3% to 33.2% (average: 9.7%) at 1000 m at station SCS-C. In general, the bSiD% value at station SCS-N was lower than that at stations SCS-NW, SCS-B and SCS-C, except for one outlier at 3000 m at station SCS-N.
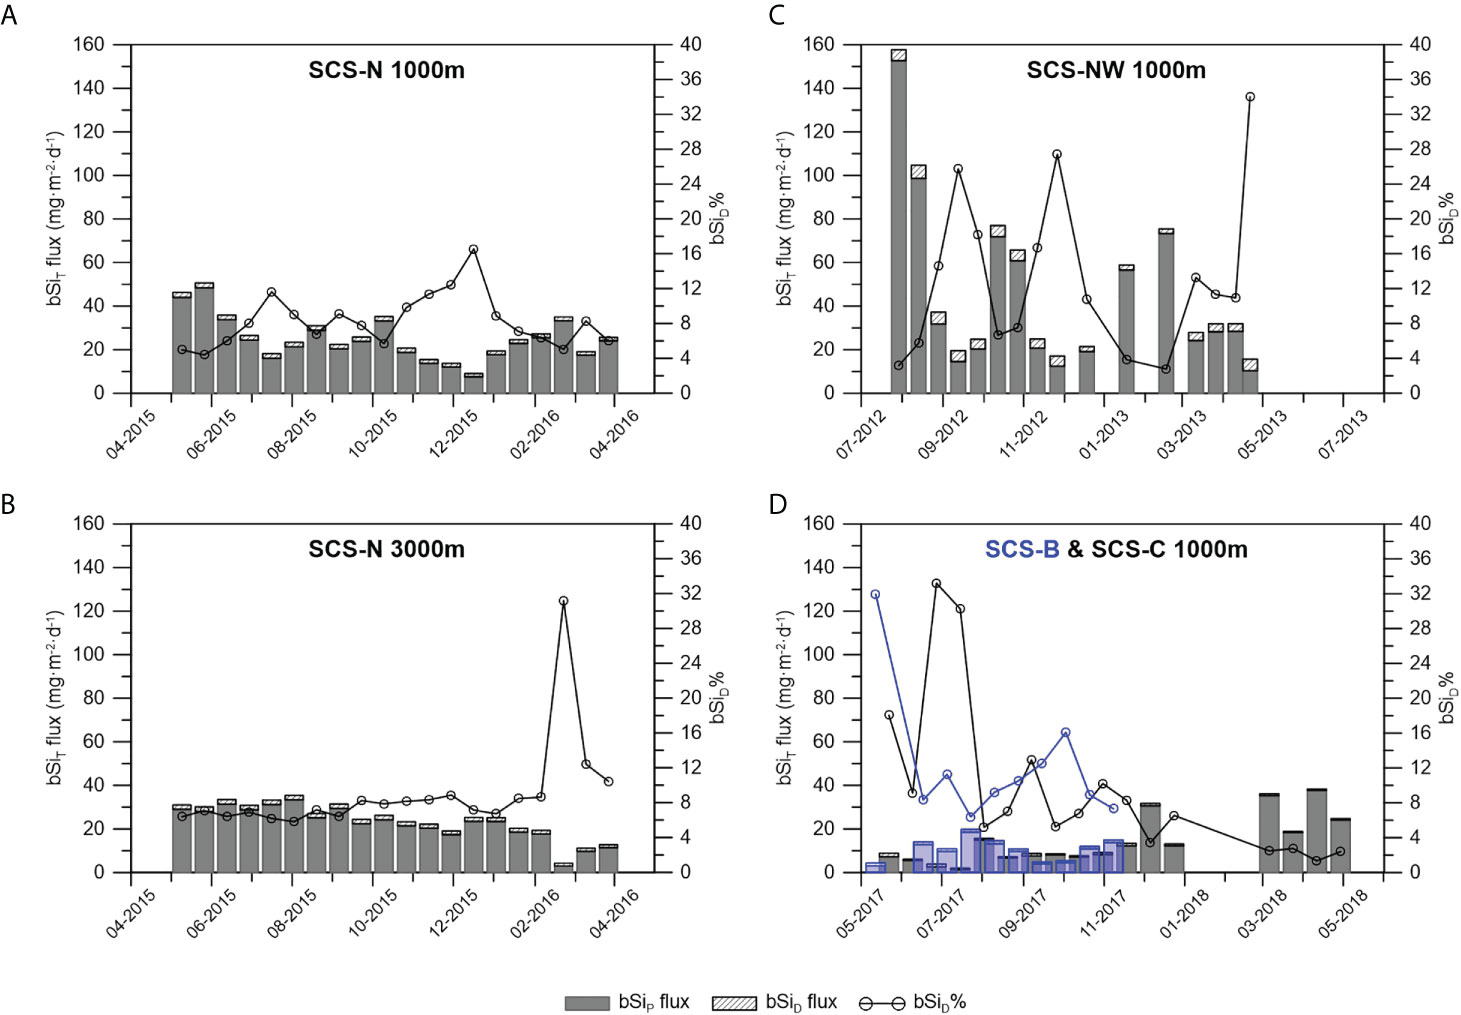
Figure 5 Revision of the bSi flux and contribution of bSiD to bSiT (bSiD%) at 1000m of station SCS-N (A), 3000 m of station SCS-N (B), 1000 m of station SCS-NW (C) and 1000m of station B & C with the blueish bars and blueish circles representing the data of SCS-B (D).
As shown in Figures 2 and 3, a general decreasing trend in silicate concentration and bSiD flux and amount from the beginning of the sampling period to the end was found at all studied stations, implying a positive correlation between the degree of bSi dissolution and the time for bSi dissolution. This is understandable, as the dissolution amount of bSi is determined by the dissolution rate (mol·g-1·h-1), the mass of solute bSi (g), and the time for dissolution (h). As shown in Figure 6, this positive correlation between the bSiD amount and the time for dissolution was significant at stations SCS-NW, SCS-N and SCS-B, with the exception of station SCS-C.
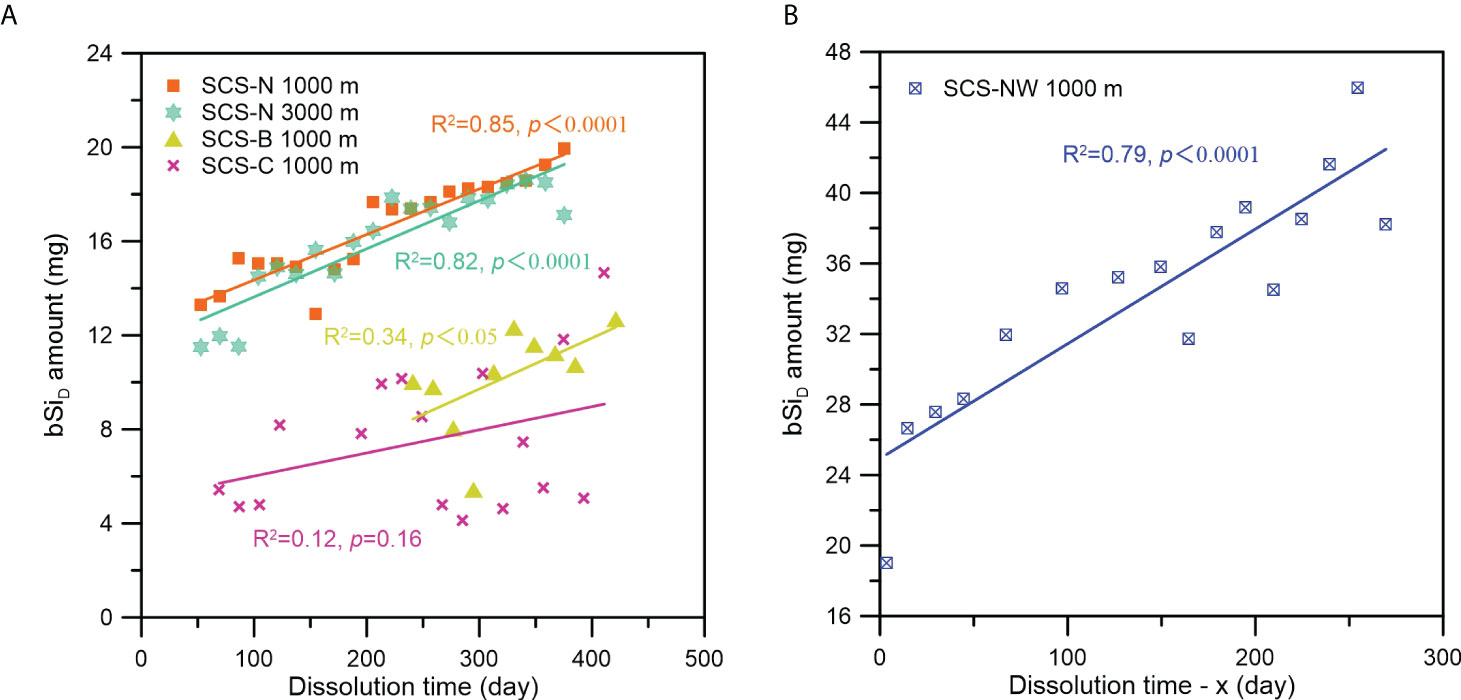
Figure 6 Relationship between the bSiD amount and the dissolution time at the different stations (A. station SCS-N, SCS-B and SCS-C; (B) station SCS-NW) in the SCS. Note: Because the time when the supernatant taken in the laboratory for station SCS-NW samples was not recorded exactly, we defined a constant x as the time period from the recovery time of the sediment trap to the time when the supernatant was taken in the laboratory, and the “Dissolution time - x” is the time period from the sampling time of each bottle to the recovery time of the sediment trap.
Another obvious phenomenon is the remarkably different degrees of bSi dissolution among stations in the study area. Much stronger bSi dissolution occurred at stations SCS-NW and SCS-N, as indicated by the much higher silicate concentrations (Figure 2). Because there was no significant difference in the dissolution time among the stations, the different degrees of dissolution among the stations were either due to different dissolution rates or differences in bSi amounts. As the average bSi flux at stations SCS-NW and SCS-N was higher than that at stations SCS-B and SCS-C, it is easy to conclude that the stronger dissolution of bSi at stations SCS-NW and SCS-N was due to the higher bSi amount. Coincidently, a drop in the silicate concentration from November to December 2015 interrupting the gradually decreasing trend of the silicate concentration at 1000 m at station SCS-N (Figure 2) corresponded well to a decline in the bSi flux (Figures 4, 5). Another sudden decline in the silicate concentration found in the last sampling bottle of station SCS-NW (Figure 2) also corresponded to the lowest bSi amount due to the shortest sampling interval (only 1 week).
However, we also found that the bSiT flux in the sampling bottles from the end of 2017 to 2018 at station SCS-C was comparable to and sometimes even higher than the bSiT flux at the end of station SCS-N (Figures 4, 5), but the silicate concentration and bSiD amount in these sampling bottles from station SCS-C were still apparently lower (Figures 2, 3). As shown in Figure 7, the correlation between the bSiD amount and the bSiT amount was generally poor, except at 3000 m at station SCS-N. It should be noted that this close relationship between the bSiD and the bSiT at 3000 m at station SCS-N is most likely attributable to the general decreasing trend of both the bSiD amount and the bSiT amount over time (Figures 2 and 5, respectively). Therefore, the bSi amount in the sampling bottles was not the determining factor for the different degrees of bSi dissolution among sites, although it could function as a limiting factor under a low bSi amount, and the difference in dissolution rate may explain the different degrees of bSi dissolution among the stations.
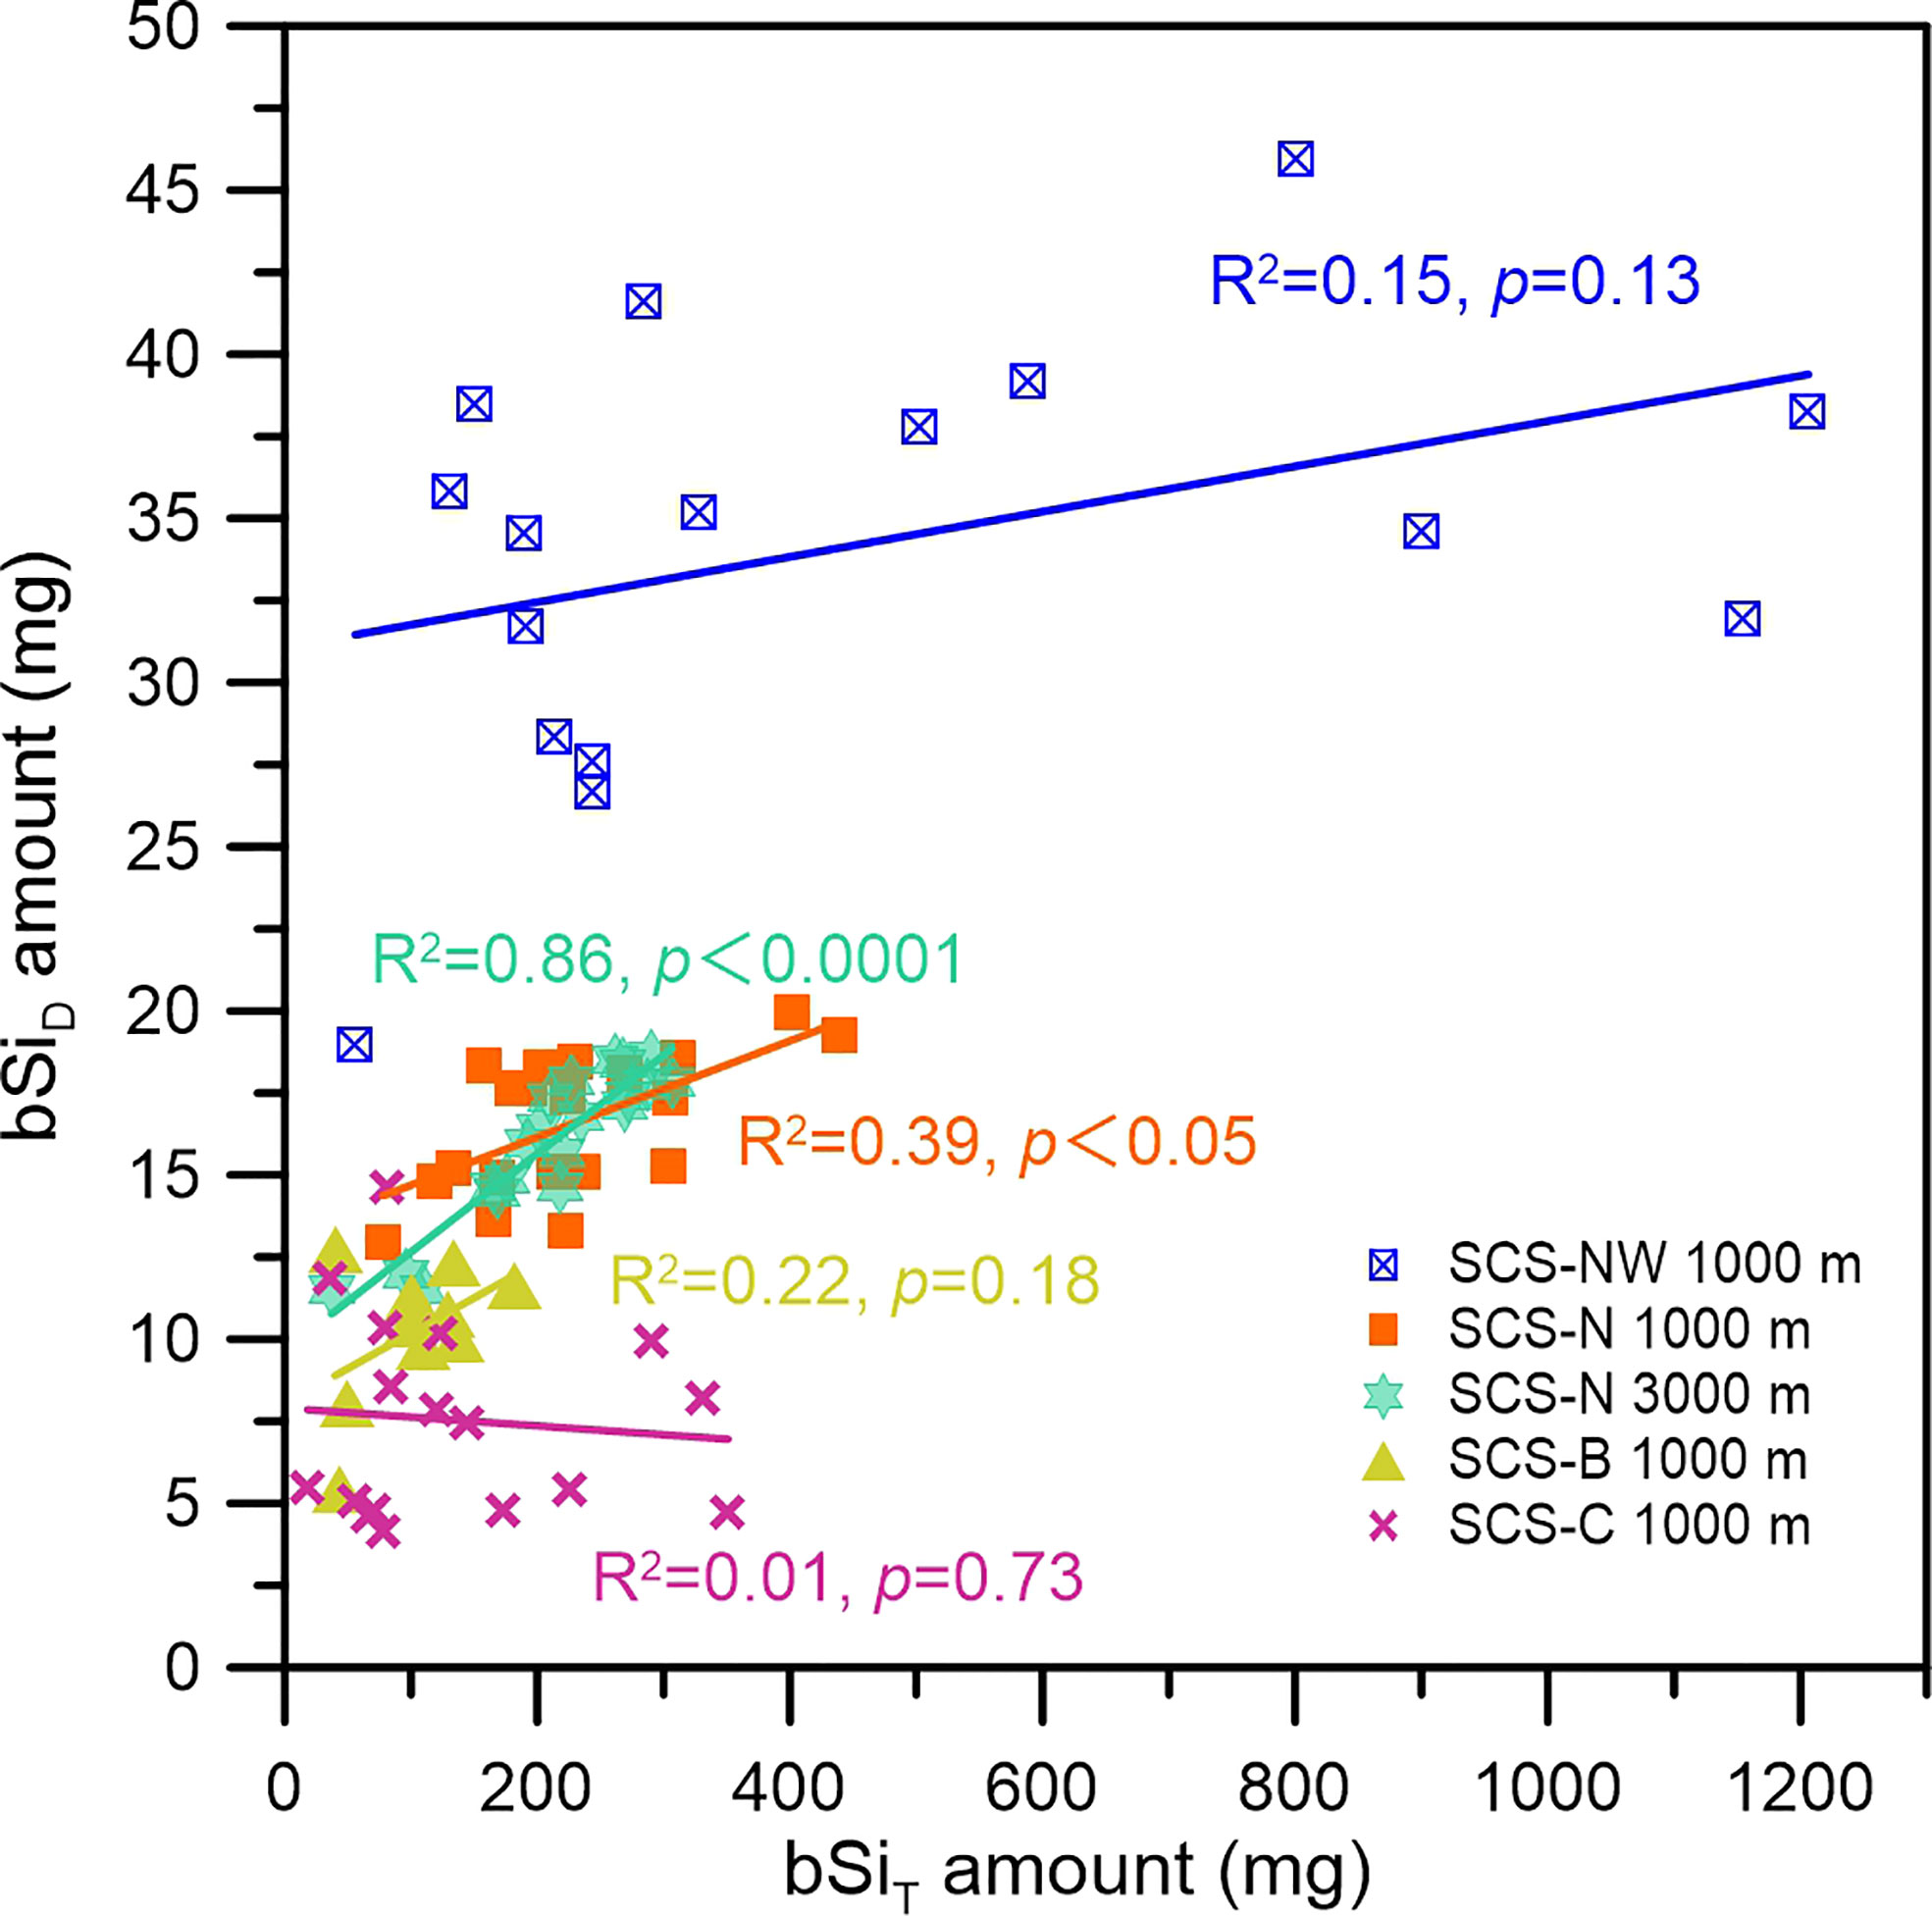
Figure 7 Relationship between the bSiD amount and bSiT amount in the sampling bottles at the different stations in the SCS.
The degree of environmental silicate unsaturation (1-C/Ceq) is one of the key factors determining the dissolution rate of bSi (Loucaides et al., 2012a). As the water prefilled in the sampling bottles was almost entirely depleted in silicate (C≈0), the degree of silicate unsaturation in all sampling bottles was close to 1 at the very beginning of the dissolution process. This inevitably resulted in the highest average bSi dissolution rate in each sampling series occurring in the last sampling bottles of each station (Figure 2). On the other hand, apparent differences in silicate concentrations in the last sampling bottles of each station indicated that significant differences in bSi dissolution rates among stations started from the initial stage of bSi dissolution (Figures 2 and 3). As dissolution proceeded, the degree of silicate unsaturation decreased gradually because the silicate concentration (C) in the sampling bottles increased. It is worth noting that the silicate concentration in the bottles is also determined by the volume of the sampling bottles. As the same amount of bSi dissolved, the silicate concentration increased less in the 500 ml sampling bottle than in the 250 ml sampling bottle, which in turn influenced the silicate unsaturation and the bSi dissolution rate. However, the difference in the volume of sampling bottles between SCS-NW, SCS-B, SCS-C (500 ml) and SCS-N (250 ml) could not explain the apparent lower bSi dissolution rate at stations SCS-B and SCS-C.
In addition to the environmental silicate concentration (C), the equilibrium solubility of bSi (Ceq) is another determining factor of the degree of environmental silicate unsaturation (1-C/Ceq). The apparently higher bSi dissolution rate at stations SCS-NW and SCS-N than at stations SCS-B and SCS-C might be due to the higher bSi solubility of bSi particles at stations SCS-NW and SCS-N. The highest silicate concentration in the supernatant at the beginning of the sampling period reached ~1300 μmol·L-1 at station SCS-NW and ~1100 μmol·L-1 at station SCS-N (Figure 2). This value was comparable to the solubility of bSi at 2°C measured in stirred flow-through experiments (1000~1200 μmol·L-1) by Rickert et al. (2002) and higher than that observed in the field (800~1000 μmol/L) via batch reactors in the deep (> 1000 m) Mozambique Channel (Loucaides et al., 2012b). However, we are not sure whether the silicate in the sampling bottle with the highest silicate concentration reached saturation. Therefore, we could only approximately estimate that the equilibrium solubility of the sinking bSi particles in the deep northern SCS was at least 1100 μmol·L-1. On the other hand, the highest silicate concentration in the supernatant at stations SCS-B and SCS-C was ~400 μmol·L-1 (Figure 2), which is much lower than 1100 μmol·L-1. Whether it is limited by bSi solubility or attributed to other factors determining a low dissolution rate remains unknown.
Previous works have demonstrated that water temperature, pressure, and pH are potential environmental factors determining bSi solubility (Hurd, 1973; Lawson et al., 1978; Kamatani et al., 1980; Van Cappellen and Qiu, 1997; Rickert et al., 2002), in which a higher water temperature usually yields enhanced solubility. However, the sea water temperature at the depths of the deployed sediment traps, both at 1000 and 3000 m, in the deep SCS generally remained constant, ranging from 2.4°C to 4°C (Tian and Wei, 2005; Wang et al., 2011), and the samples were stored in a refrigerator at 4°C after recovery, indicating that the environmental temperature could not result in a large difference in bSi solubility among stations. The bSi solubility has been estimated to increase with pressure based on experiments with synthetic amorphous silica (Loucaides et al., 2012a and references therein), but there was no large difference between the silicate concentration at 3000 m at station SCS-N and that at 1000 m, indicating that pressure was not the key factor influencing bSi solubility in the deep SCS. The pH of the supernatant in the sampling bottles was approximately measured with a pH meter (Mettler Toledo S210K) before sample splitting via a McLane WSD-10 rotary splitter, which revealed that the pH ranged from 7.4 to 7.8 at room temperature for the supernatant at stations SCS-B and SCS-C and reached approximately 6.0 for that at station SCS-NW. The relatively high pH at stations SCS-B and SCS-C could result in lower resistance of bSi and higher bSi solubility (Hurd, 1973; Van Cappellen and Qiu, 1997; Taucher et al., 2022), which is against our assumption that the lower bSi dissolution rate at stations SCS-B and SCS-C was due to lower bSi solubility. Therefore, the possibly different bSi solubilities as a result of differences in ambient physical and chemical conditions cannot explain the notably different bSi dissolution rates among the stations.
In addition to ambient physical and chemical conditions, some of the internal characteristics of bSi, e.g., reactive surface area (As), degree of aging and diagenesis, are other important controlling factors for bSi solubility (Loucaides et al., 2012a). As the settling velocity of sinking particles in the open ocean is dozens to hundreds of meters per day (Giering et al., 2020) and the settling velocity of sinking particles in the northern SCS was estimated to be 30-50 m per day (Ran et al., 2015), the degree of aging and diagenesis of bSi in sinking particles at 1000 m may not be a key factor in differentiating bSi solubility among sites. The difference in the As of the bSi seems to be the only possibility to explain the possible difference in bSi solubility and bSi dissolution rate among sites. However, this speculation needs more detailed study, including research on the siliceous organism compositions and the nanostructure of different bSi components at each station.
Another possible explanation of the difference in the bSi dissolution rate among stations could be the effect of bacterial activity. The silica cell walls of diatoms while alive are protected from dissolution by an organic film (Hecky et al., 1973), but bacteria can decompose this organic matter after diatom death (Bidle and Azam, 1999), thus accelerating bSi dissolution (Bidle and Azam, 2001). The relatively low pH value at station SCS-NW could probably be attributed to the notable degradation of sinking organic matter, which was indicated by the high concentrations of dissolved organic carbon and dissolved inorganic nitrogen in the sediment trap (Sun et al., 2015). The relatively high pH value of the supernatant at stations SCS-B and SCS-C could indicate lower degradation of organic matter and lower microbial activity, which could probably result in less bSi exposure in the solution. However, this possibility should be confirmed or modified through further research, and more microbiological work should be involved.
In summary, except for the decreasing trend in the bSi dissolution amount in the sampling bottles over time, a significant difference in bSi dissolution among stations was found in the study area. This significant difference could not be explained by the difference in bSi flux among stations, although the bSiD amount is influenced by the total bSi amount in the sampling bottles. The main reason for the difference in the degree of bSi dissolution at the different stations was likely due to the difference in the dissolution rate, which was presumably related to the different As of bSi or bacterial activity. Studying the dissolution kinetics of bSi from different stations with flow-through experiments (Van Cappellen and Qiu, 1997; Rickert et al., 2002), together with microbiological analysis, siliceous organism identification and measurement of the bSi nanostructure, will help identify the exact controlling factor causing the differences in dissolution rates in future work. It should be noted that the volume of the sampling bottle not only influences the silicate concentration in the bottles but also modifies the dissolution rate by impacting the silicate unsaturation and eventually influencing the degree of bSi dissolution.
As shown in Figures 2 and 3, although the silicate concentration at stations SCS-B and SCS-C, respectively, were much lower than that at station SCS-N, the discrepancy in the calculated bSiD flux between these stations was not as significant as that in the silicate concentration (Figure 3), mainly because the volume of the sampling bottles deployed at stations SCS-B and SCS-C (500 ml) was twice that of the sampling bottles deployed at station SCS-N (250 ml) (Table 1). On the one hand, the high silicate concentration in the supernatant and the large-volume sampling bottles employed at station SCS-NW resulted in much higher bSiD fluxes (Figure 3 and Table 2). It should also be noted that the bSiD flux in several samples collected from November 2012 to February 2013 at station SCS-NW decreased suddenly (Figure 3), which was likely due to the longer sampling interval (1 month) during this period. On the other hand, the sudden increase in the bSiD flux and bSiD% for the last SCS-NW sample occurred due to the shorter sampling interval (only 1 week, Figure 3). This indicated that the bSiD flux was determined not only by the bSiD amount in the sampling bottles but also by the volume of the sampling bottles and the preset sampling intervals.
A clear negative correlation between bSiD% and the bSiT flux was found at all stations (Figure 8). In some of the samples, the bSiD% value was higher than 30%, suggesting that approximately 1/3 of the contained bSi was dissolved in the sampling bottles. This negative relationship between bSiD% and the bSiT flux has also been reported in similar work in the North Atlantic Ocean (Gallinari et al., 2002), but a much higher bSiD% (4.6–66.1%) has been found in the deep North Atlantic Ocean (Figure 8). This result indicated that bSi could be significantly underestimated when the bSiT flux was relatively low, which normally occurs when the productivity of siliceous organisms, e.g., diatoms, is relatively low in the oligotrophic open ocean or in the ocean with a notable seasonal variation in primary productivity. Generally, the underestimation could exceed 10% when the bSiT flux was lower than 40 mg·m-2·d-1 (Figure 8), which suggests that the global export flux of bSi to the deep ocean has generally been underestimated, probably by more than 10%, and correspondingly, bSi recycling in the deep ocean might be overestimated (Tréguer et al., 2021). It is therefore strongly suggested that the bSiD fraction in sediment trap sampling bottles should be measured to better understand sinking particles of bSi, which is important for quantitative research on the biogeochemical process of silicon in the ocean and the global marine silicon cycle.
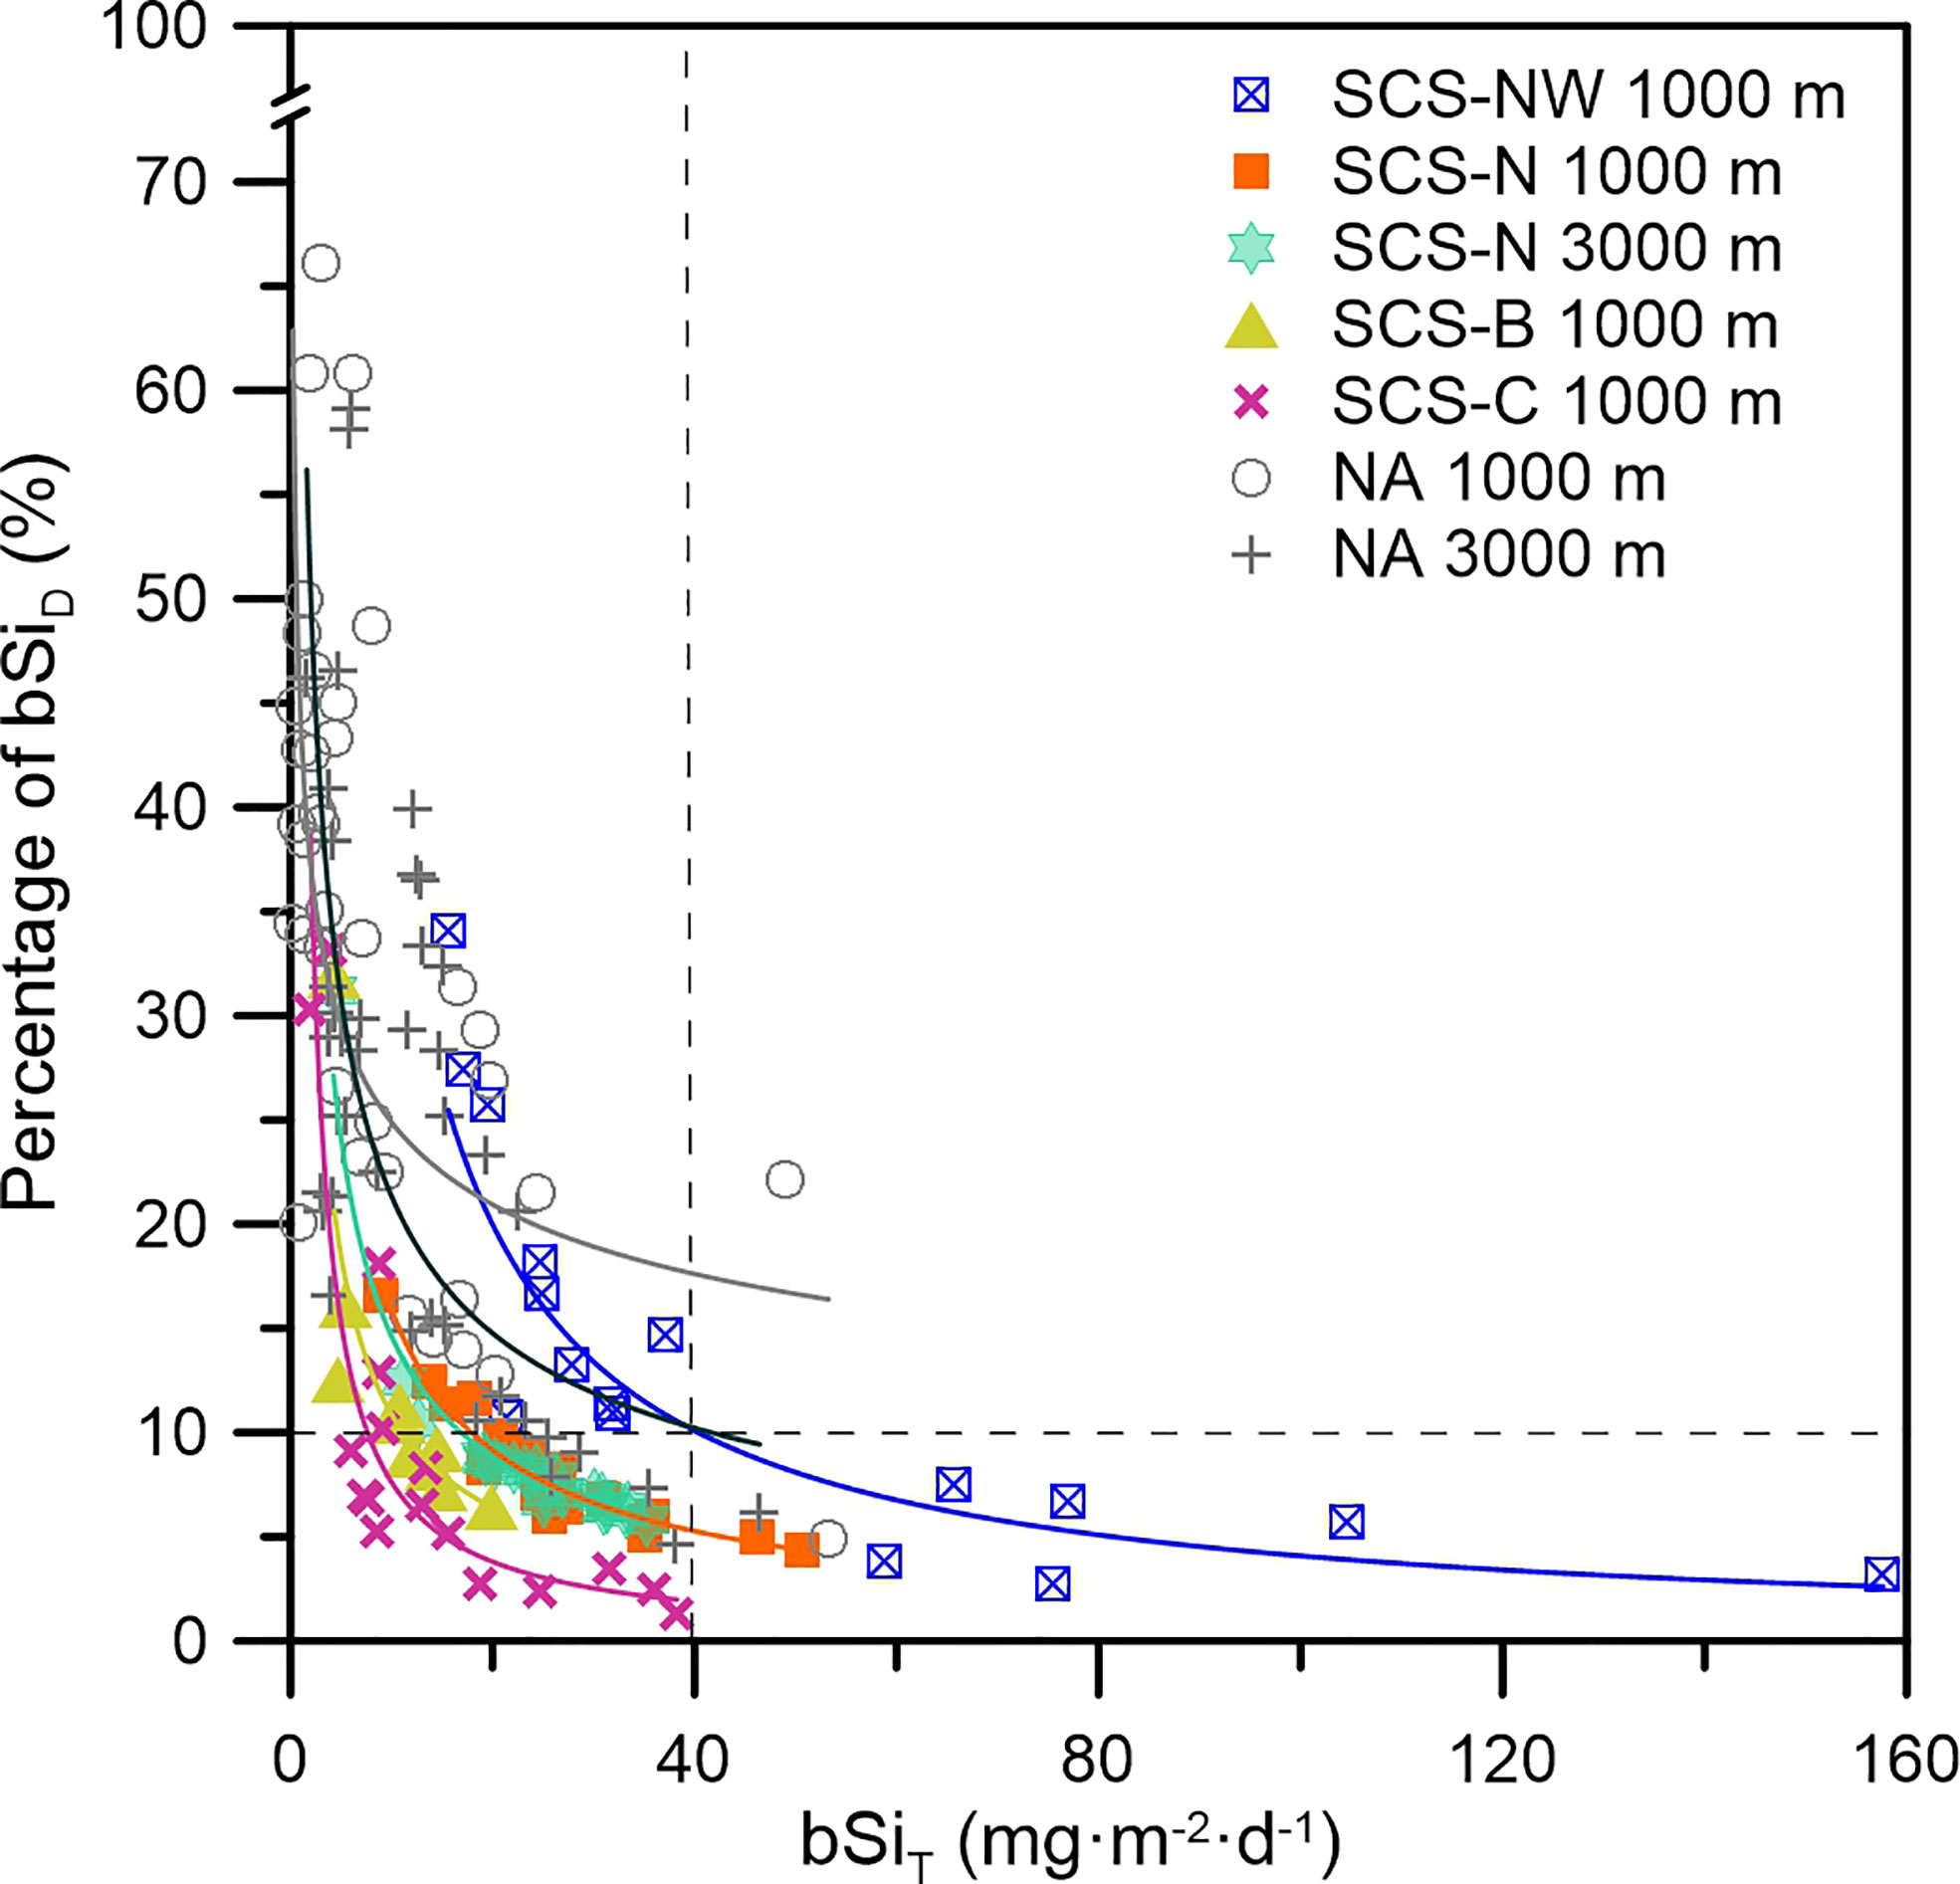
Figure 8 Percentage of the bSiD as a function of the bSiT flux at the different stations in the SCS and North Atlantic Ocean [NA, North Atlantic; data retrieved from Gallinari et al. (2002)].
In this work, we studied the influence of bSi dissolution on bSi sinking flux estimation via sediment traps in the northern SCS. The results indicated apparent bSi dissolution in the sediment trap sampling bottles, which resulted in an underestimation of the bSi sinking flux of 2~34% (average: ~10%) in the northern SCS. The impact of bSi dissolution on bSi flux estimation became increasingly notable with decreasing total bSi flux, especially when the total bSi flux was lower than 40 mg·m-2·d-1. Therefore, to better quantify the biogeochemical flux of silicon in the deep ocean, the collected samples should be split and analyzed in the laboratory as soon as possible after trap recovery, and it is necessary to measure the dissolved bSi in the supernatant to revise the particulate bSi flux, especially when the bSi flux is inherently low. The degree of bSi dissolution in the sediment trap sampling bottles at each station was mainly controlled by the dissolution time but influenced by the total bSi amount in the sampling bottles if the bSi sinking flux was extremely low. Apparent differences in the degree of bSi dissolution in the sampling bottles among stations were found. However, neither the dissolution time difference nor the bSi amount difference could explain such a large discrepancy in the degree of bSi dissolution, and the difference in the bSi dissolution rate might be the only possible reason, but more experiments are needed to better understand the controlling factors of the bSi dissolution rate in sediment traps in the future. It is worth noting that the volume of the sampling bottles adopted could influence the dissolution amount of bSi and result in greater underestimation of the bSi flux. Thus, smaller-volume sampling bottles are recommended for application in sediment traps, especially in oligotrophic open ocean settings.
The raw data supporting the conclusions of this article will be made available by the authors, without undue reservation.
WL and LR: conception and design of study. JC: financial support. WL: drafting the manuscript. LR, ZY and MW: revising the manuscript. WL, YL and LS: acquisition of data. WL, MW, YL and LS: interpretation of data. All authors contributed to the article and approved the submitted version.
This work was funded by the State Key R&D Project of China (2016YFC0304105), the Project of the State Key Laboratory of Satellite Ocean Environment Dynamics, Second Institute of Oceanography, MNR (SOEDZZ2104), and the National Natural Science Foundation of China (91128212, 41006034, and 41876123). We acknowledge the support of SML311019006/311020006.
The authors declare that the research was conducted in the absence of any commercial or financial relationships that could be construed as a potential conflict of interest.
All claims expressed in this article are solely those of the authors and do not necessarily represent those of their affiliated organizations, or those of the publisher, the editors and the reviewers. Any product that may be evaluated in this article, or claim that may be made by its manufacturer, is not guaranteed or endorsed by the publisher.
Baines S. B., Twining B. S., Brzezinski M. A., Krause J. W., Vogt S., Assael D., et al. (2012). Significant silicon accumulation by marine picocyanobacteria. Nat. Geosci. 5, 886–891. doi: 10.1038/ngeo1641
Bauerfeind E., Bodungen B. V. (2006). Underestimation of biogenic silicon flux due to dissolution in sediment trap samples. Mar. Geol. 226, 297–306. doi: 10.1016/j.margeo.2005.11.001
Biard T., Krause J. W., Stukel M. R., Ohman M. D. (2018). The significance of giant phaeodarians (Rhizaria) to biogenic silica export in the California current ecosystem. Glob. Biogeochem Cycle 32, 987–1004. doi: 10.1029/2018GB005877
Bidle K. D., Azam F. (1999). Accelerated dissolution of diatom silica by marine bacterial assemblages. Nature 397, 508–512. doi: 10.1038/17351
Bidle K. D., Azam F. (2001). Bacterial control of silicon regeneration from diatom detritus: Significance of bacterial ectohydrolases and species identity. Limnol Oceanogr 46, 1606–1623. doi: 10.2307/3069085
Chen C., Wang S., Wang B., Pai S. (2001). Nutrient budgets for the south China Sea basin. Mar. Chem. 75, 281–300. doi: 10.1016/S0304-4203(01)00041-X
Du C., Liu Z., Dai M., Kao S., Cao Z., Zhang Y., et al. (2013). Impact of the kuroshio intrusion on the nutrient inventory in the upper Northern South China Sea: insights from an isopycnal mixing model. Biogeosciences 10, 6419–6432. doi: 10.5194/bg-10-6419-2013
Du C., Liu Z., Kao S., Dai M. (2017). Diapycnal fluxes of nutrients in an oligotrophic oceanic regime: The south China Sea. Geophys. Res. Lett. 44, 11510–11518. doi: 10.1002/2017GL074921
Gallinari M., Ragueneau O., Corrin L., Demaster D., Tréguer P. (2002). The importance of water column processes on the dissolution properties of biogenic silica in deep-sea sediments i. solubility. Geochim Cosmochim Acta 66, 2701–2717. doi: 10.1016/S0016-7037(02)00874-8
Giering S., Cavan E. L., Basedow S. L., Briggs N., Burd A. B., Darroch L. J., et al. (2020). Sinking organic particles in the ocean–flux estimates from in situ optical devices. Front. Mar. Sci. 6. doi: 10.3389/fmars.2019.00834
Guidi L., Chaffron S., Bittner L., Eveillard D., Larhlimi A., Roux S., et al. (2016). Plankton networks driving carbon export in the oligotrophic ocean. Nature 532, 465–470. doi: 10.1038/nature16942
Hecky R. E., Mopper K., Kilham P., Degens E. T. (1973). The amino acid and sugar composition of diatom cell-walls. Mar. Biol. 19, 323–331. doi: 10.1007/BF00348902
Honjo S., Manganini S. J., Krishfield R. A., Francois R. (2008). Particulate organic carbon fluxes to the ocean interior and factors controlling the biological pump: A synthesis of global sediment trap programs since 1983. Prog. Oceanogr 76, 217–285. doi: 10.1016/j.pocean.2007.11.003
Hurd D. C. (1973). Interactions of biogenic opal, sediment and seawater in the central equatorial pacific. Geochim Cosmochim Acta 37, 2257–2282. doi: 10.1016/0016-7037(73)90103-8
Kamatani A., Riley J. P., Skirrow G. (1980). The dissolution of opaline silica of diatom tests in sea water. J. Oceanogr 36, 201–208. doi: 10.1007/BF02070333
Lahajnar N., Wiesner M. G., Gaye B. (2007). Fluxes of amino acids and hexosamines to the deep South China Sea. Deep Sea Res. Part I 54, 2120–2144. doi: 10.1016/j.dsr.2007.08.009
Lampitt R. S., Salter I., Johns D. (2009). Radiolaria: major exporters of organic carbon to the deep ocean. Glob. Biogeochem Cycle 23, GB1010. doi: 10.1029/2008GB003221
Lawson D. S., Hurd D. C., Pankratz H. S. (1978). Silica dissolution rates of decomposing phytoplankton assemblages at various temperatures. Am. J. Sci. 278, 1373–1393. doi: 10.2475/ajs.278.10.1373
Li H., Wiesner M. G., Chen J., Zheng L., Zhang J., Ran L. (2017). Long term variation of mesopelagic biogenic flux in the central South China Sea: Impact of monsoonal seasonality and mesoscale eddy. Deep Sea Res. Part I 126, 62–72. doi: 10.1016/j.dsr.2017.05.012
Li H., Zhang J., Xuan J., Wu Z., Ran L., Wiesner M. G., et al. (2022). Asymmetric response of the biological carbon pump to the ENSO in the south China Sea. Geophys. Res. Lett. 49, e2021GL095254. doi: 10.1029/2021GL095254
Llopis Monferrer N., Boltovskoy D., Tréguer P., Sandin M., Not F., Leynaert A. (2020). Estimating biogenic silica production of rhizaria in the global ocean. Glob. Biogeochem Cycle 34, e2019GB006286. doi: 10.1029/2019GB006286
Loucaides S., Koningc E., Van Cappellen P. (2012b). Effect of pressure on silica solubility of diatom frustules in the oceans: Results from long-term laboratory and field incubations. Mar. Chem.. 136, 1–6. doi: 10.1016/j.marchem.2012.04.003
Loucaides S., Van Cappellen P., Roubeix V., Moriceau B., Ragueneau O. (2012a). Controls on the recycling and preservation of biogenic silica from biomineralization to burial. Silicon 4, 7–22. doi: 10.1007/s12633-011-9092-9
Maldonado M., López-Acosta M., Sitjà C., García-Puig M., Galobart C., Ercilla G. (2019). Sponge skeletons as an important sink of silicon in the global oceans. Nat. Geosci. 12, 815–822. doi: 10.1038/s41561-019-0430-7
Mortlock R. A., Froelich P. N. (1989). A simple method for the rapid determination of biogenic opal in pelagic marine sediments. Deep Sea Res. 36, 1415–1426. doi: 10.1016/0198-0149(89)90092-7
Ning X., Chai F., Xue H., Cai Y., Liu C., Shi J. (2004). Physical-biological oceanographic coupling influencing phytoplankton and primary production in the south China Sea. J. Geophys. Res. 109, C10. doi: 10.1029/2004JC002365
Ohnemus D. C., Rauschenberg S., Krause J. W., Brzezinski M. A., Collier J. L., Geraci-Yee S., et al. (2016). Silicon content of individual cells of synechococcus from the north Atlantic ocean. Mar. Chem. 187, 16–24. doi: 10.1016/j.marchem.2016.10.003
Poulton A. J., Adey T. R., Balch W. M., Holligan P. M. (2007). Relating coccolithophore calcification rates to phytoplankton community dynamics: regional differences and implications for carbon export. Deep Sea Res. Part II 54, 538–557. doi: 10.1016/j.dsr2.2006.12.003
Puppe D. (2020). Review on protozoic silica and its role in silicon cycling. Geoderma 365, 114224. doi: 10.1016/j.geoderma.2020.114224
Ragueneau O., Dittert N., Pondaven P., Tréguer P., Corrin L. (2002). Si/C decoupling in the southern ocean different? Deep Sea Res. Part II 49, 3127–3154. doi: 10.1016/s0967-0645(02)00075-9
Ragueneau O., Schultes S., Bidle K., Claquin P., Moriceau B. (2006). Si And c interactions in the world ocean: importance of ecological processes and implications for the role of diatoms in the biological pump. Glob. Biogeochem Cycle 20, GB4S02. doi: 10.1029/2006GB002688
Ran L., Chen J., Wiesner M. G., Ling Z., Lahajnar N., Yang Z., et al. (2015). Variability in the abundance and species composition of diatoms in sinking particles in the northern south China Sea: Results from time-series moored sediment traps. Deep Sea Res. Part II 122, 15–24. doi: 10.1016/j.dsr2.2015.07.004
Rickert D., Schlüter M., Wallmann K. (2002). Dissolution kinetics of biogenic silica from the water column to the sediments. Geochim Cosmochim Acta 66, 439–455. doi: 10.1016/S0016-7037(01)00757-8
Schiebel R. (2002). Planktic foraminiferal sedimentation and the marine calcite budget. Glob. Biogeochem Cycle 16, 1065. doi: 10.1029/2001gb001459
Street-Perrott F. A., Barker P. A. (2008). Biogenic silica: a neglected component of the coupled global continental biogeochemical cycles of carbon and silicon. Earth Surf Process Landf: J. Br. Geomorphological Res. Group 33, 1436–1457. doi: 10.1002/esp.1712
Struyf E., Smis A., Damme S. V., Meire P., Conley D. J. (2009). The global biogeochemical silicon cycle. Silicon 1, 207–213. doi: 10.1007/s12633-010-9035-x
Sun L., Li H., Jennerjahn T., Ran L., Jin H., Zhang J., et al. (2015). Underestimation of C and N flux in the Northern South China Sea due to dissolution in sediment trap samples. Acta Oceanol Sin. 37, 19–26. doi: 10.3969/j.issn.0253-4193.2015.12.003
Tan S., Zhang J., Li H., Sun L., Wu Z., Wiesner M. G., et al. (2020). Deep ocean particle flux in the northern south China Sea: Variability on intra-seasonal to seasonal timescales. Front. Earth Sci. 8. doi: 10.3389/feart.2020.00074
Taucher J., Bach L. T., Prowe A. E. F., Boxhammer T., Kvale K., Riebesell U. (2022). Enhanced silica export in a future ocean triggers global diatom decline. Nature 605, 696–700. doi: 10.1038/s41586-022-04687-0
Tian T., Wei H. (2005). Analysis of water masses in the northern south China Sea and bashi channel. Periodical Ocean Univ. China 35, 9–12. doi: 10.16441/j.cnki.hdxb.2005.01.002
Tréguer P. J., Bowler C., Moriceau B., Dutkiewicz S., Gehlen M., Aumont O., et al. (2018). Influence of diatom diversity on the ocean biological carbon pump. Nat. Geosci. 11, 27–37. doi: 10.1038/s41561-017-0028-x
Tréguer P. J., Rocha C. (2013). The world ocean silica cycle. Annu. Rev. Mar. Sci. 5, 477–501. doi: 10.1146/annurev-marine-121211-172346
Tréguer P. J., Sutton J. N., Brzezinski M., Charette M. A., Devries T., Dutkiewicz S., et al. (2021). Reviews and syntheses: the biogeochemical cycle of silicon in the modern ocean. Biogeosciences 18, 1269–1289. doi: 10.5194/bg-18-1269-2021
Van Cappellen P., Qiu L. (1997). Biogenic silica dissolution in sediments of the southern ocean. i. solubility. Deep Sea Res. Part II 44, 1129–1149. doi: 10.1016/S0967-0645(96)00113-0
Wang G., Xie S., Qu T., Hang R. (2011). Deep south China Sea circulation. Geophys. Res. Lett. 38, L05601. doi: 10.1029/2010gl046626
Wiesner M. G., Zheng L., Wong H. K., Wang Y., Chen W. (1996). “Fluxes of particulate matter in the South China sea,” in Particle Flux in the Ocean. Eds. Ittekkot V., Schäfer P., Depetris P., Honjo S. (Chichester: John Wiley & Sons Ltd), 293–299.
Keywords: sediment trap, biogenic silica, dissolution, underestimation, South China Sea
Citation: Liang W, Ran L, Yang Z, Wiesner MG, Liang Y, Sun L and Chen J (2022) Underestimation of biogenic silica sinking flux due to dissolution in sediment traps: A case study in the South China Sea. Front. Mar. Sci. 9:875415. doi: 10.3389/fmars.2022.875415
Received: 14 February 2022; Accepted: 28 July 2022;
Published: 12 August 2022.
Edited by:
Ludvig Löwemark, National Taiwan University, TaiwanReviewed by:
Zhifei Liu, Tongji University, ChinaCopyright © 2022 Liang, Ran, Yang, Wiesner, Liang, Sun and Chen. This is an open-access article distributed under the terms of the Creative Commons Attribution License (CC BY). The use, distribution or reproduction in other forums is permitted, provided the original author(s) and the copyright owner(s) are credited and that the original publication in this journal is cited, in accordance with accepted academic practice. No use, distribution or reproduction is permitted which does not comply with these terms.
*Correspondence: Lihua Ran, bGlodWFyYW5Ac2lvLm9yZy5jbg==; Jianfang Chen, amZjaGVuQHNpby5vcmcuY24=
Disclaimer: All claims expressed in this article are solely those of the authors and do not necessarily represent those of their affiliated organizations, or those of the publisher, the editors and the reviewers. Any product that may be evaluated in this article or claim that may be made by its manufacturer is not guaranteed or endorsed by the publisher.
Research integrity at Frontiers
Learn more about the work of our research integrity team to safeguard the quality of each article we publish.