 Hideki Fukuda
 Kiyotaka Hidaka
 Takashi Setou2
 Daisuke Ambe
 Hiroaki Saito
- 1Atmosphere and Ocean Research Institute, University of Tokyo, Chiba, Japan
- 2Fisheries Resources Institute, Japan Fisheries Research and Education Agency, Kanagawa, Japan
The biological pump that transports carbon from the surface ocean to the ocean interior is an important determinant of ocean carbon absorption from the atmosphere, and of biological activity beneath the euphotic zone. Various factors influence the magnitude and efficiency of this biological pump, such as primary production, particle size, and the composition of consumers of particulate organic carbon (POC). The complex factors influencing the biological pump induce high regional and temporal variability; however, the mechanisms of this variability are not understood and its causes remain unclear. The size of sinking particles has been hypothesized to affect the attenuation of POC flux via reduction of residence time within the water column. Here, we conducted sediment trap experiments in slope and subtropical gyre areas along the Kuroshio in the subtropical North Pacific. The ratio of POC flux at a depth 100 m below the base of the euphotic zone to that at the base of the euphotic zone (T100) varied from 0.307 to 0.646 and from 0.090 to 0.958 in the slope and subtropical gyre areas, respectively, and was positively correlated with variations in the volume-weighted mean particle diameter (Spearman rank order correlation coefficient: 0.700, p< 0.05, n = 9). However, the variation in T100 was not correlated with ambient water temperature (p > 0.05). The results support the hypothesis that attenuation of POC flux is influenced by the size of sinking particles in oligotrophic oceanic areas.
Introduction
The biological pump is the combined processes of the biological fixation of carbon dioxide and its subsequent transport into the ocean interior. The transport of fixed carbon occurs through multiple processes, including 1) the gravitational settling of particles, 2) physical injection, and 3) vertical migration of organisms, with sinking of particulate carbon accounting for the largest portion of transported carbon in three processes (Boyd et al., 2019). The amount of carbon sinking from the euphotic zone depends primarily on the amount of net primary production and partly on the size and taxonomic composition of phytoplankton and heterotrophic activities (Boyd and Newton, 1999; Armstrong et al., 2002; Guidi et al., 2009; Turner, 2015). Most particulate organic carbon (POC) settling out of the euphotic zone is remineralized within the upper part of the mesopelagic zone (depths below the euphotic zone down to 1000m), and the attenuation of sinking flux shows large seasonal and regional variabilities (Guidi et al., 2015; Puigcorbé et al., 2015; Buesseler et al., 2020). Understanding the mechanisms regulating particle production and attenuation of sinking flux is essential to predicting future changes in ocean carbon uptake and food web dynamics below the euphotic zone as well as oceanic carbon dioxide influx from the atmosphere.
The vertical attenuation of POC flux has been examined from the perspective of the relationship between particle residence time within the water column and the remineralization rate of POC. Analyses of field data have indicated a close relationship between the attenuation depth scale of POC flux and the size structure of phytoplankton in the euphotic zone (Guidi et al., 2015; Puigcorbé et al., 2015). Numerical models have demonstrated that the size of sinking particles could be a major factor determining the mineralization depth of sinking POC because the sinking velocity increases with particle size (Cram et al., 2018; Omand et al., 2020). Marsay et al. (2015) showed a strong relationship between the attenuation depth of POC flux and ambient water temperature, which can affect the activities of heterotrophs including prokaryotes, protozoans, and metazoans.
In the subtropical offshore area, vertical attenuation of POC flux is thought to be greater than that at higher latitudes, as small phytoplankton (pico- and nanophytoplankton) are a major component of the primary producer assemblage and have a slow sinking rate due to their small size (Guidi et al., 2015; Puigcorbé et al., 2015; Cram et al., 2018). However, these small phytoplankton are actively incorporated into fast-sinking materials such as large aggregates and fecal materials in oligotrophic environments (Gorsky et al., 1999; Lomas and Moran, 2011; Lundgreen et al., 2019). Several studies in subtropical areas have reported that the particle size distribution (PSD) in the mixed layer exhibits spatial and temporal variations (Buonassissi and Dierssen, 2010; White et al., 2015; Fender et al., 2019). Yamada et al. (2021) reported that the contribution of larger particles increased with the concentration of transparent exopolymer (TEP) particles in an oligotrophic area along the Kuroshio Current in the subtropical Pacific Ocean. The porous structure and sticky nature of TEP stimulate rapid accumulation of large aggregates (Passow, 2002; Mari et al., 2017; Nagata et al., 2021). These results imply that high variability in the PSD in a subtropical area may affect attenuation of POC flux in combination with various factors, including temperature, the community structure of organisms, their physiological state, and the physicochemical properties of the particles.
We collected data on the sinking flux of POC and its vertical attenuation between the base of the euphotic zone (Zeu; notations are listed in Table 1) and a depth 100 m below Zeu during a sediment trap experiment along the Kuroshio Current. The Kuroshio Current is the western boundary current in the North Pacific Ocean, and it flows through an oligotrophic area where pico- and nanophytoplankton are dominant (Endo and Suzuki, 2019). However, strong diapycnal mixing processes induce upward nutrient supply along the inshore side of the current, supporting high phytoplankton productivity in this region (Kaneko et al., 2013; Nagai et al., 2019). The trap experiments were conducted in two areas along a productivity gradient across the current (Yokouchi et al., 2006). To compare the depth scale of the attenuation of POC flux among our observations and those in other environments, T100 can be used an index of attenuation of POC flux; it represents the ratio of POC flux at 100 m below Zeu to flux at Zeu (Buesseler and Boyd, 2009; Buesseler et al., 2020). Simultaneously, PSD data were collected using a laser diffraction analyzer in the euphotic zone to examine the relationship between T100 and PSD. We hypothesized that T100 is influenced by multiple environmental factors, including the shape of the PSD and the physicochemical properties of the particles.
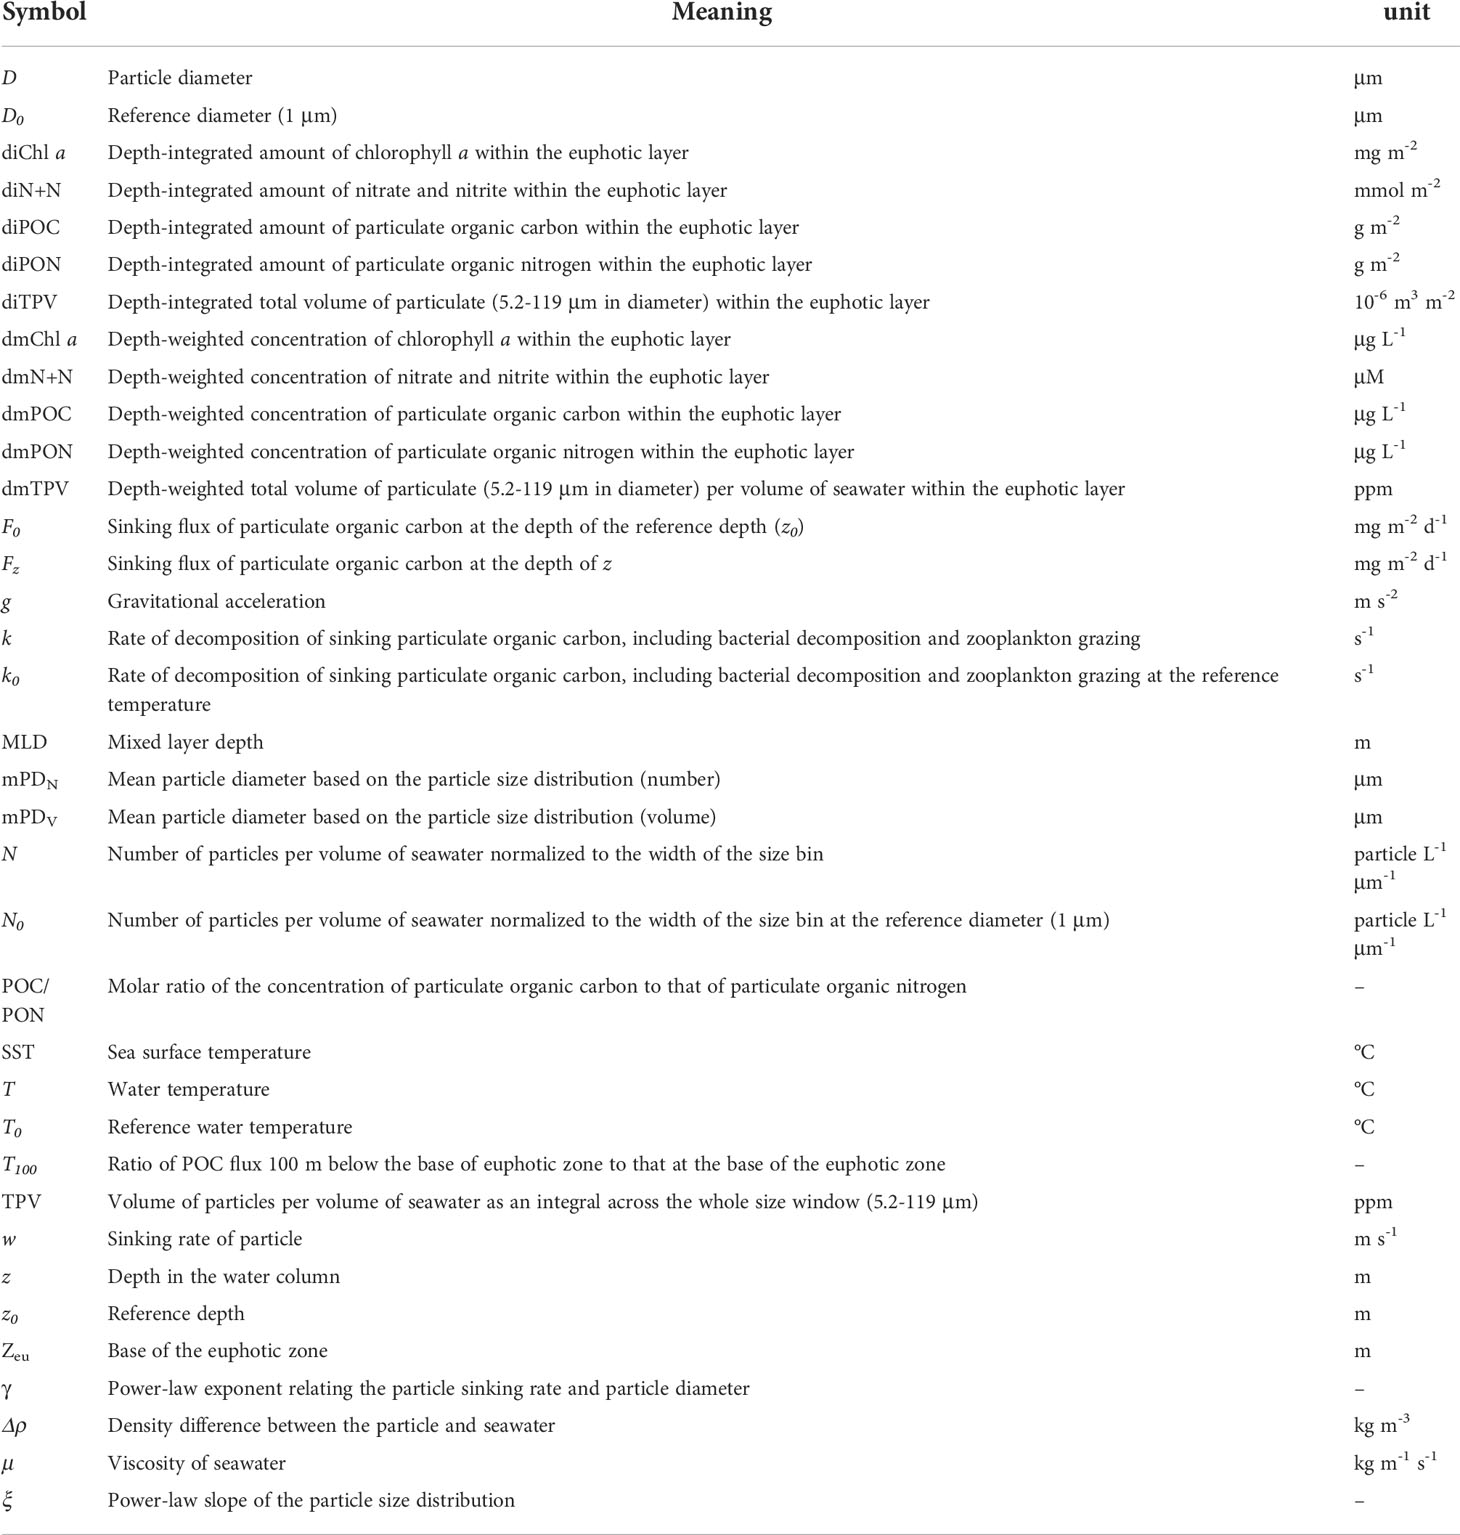
Table 1 Notations.
Materials and methods
Study area and sampling period
Sediment trap experiments were conducted in two areas across the Kuroshio Current along 138°E (Figure 1), designated the slope (34.0°N 138.0°E) and subtropical gyre (28.0–31.5°N 138°E), located on the offshore side of the Kuroshio Current. Experiments were conducted at 10 time points during seven cruises aboard the FRV Soyo-Maru (Japan Fisheries Research and Education Agency) from August 2013 to November 2019 as part of the O-line Ocean monitoring program at 138°E off Japan (Sugisaki et al., 2010) (Table 2). Because the axis of the Kuroshio Current was at different locations on different cruises, the sampling site on the offshore side of the axis was placed depending on the location of the axis position (Table 2). Experiments on the slope were conducted in January, March, August, and November, but no sample was collected in January in the subtropical gyre due to bad weather during the SY1601 and SY1801 cruises.
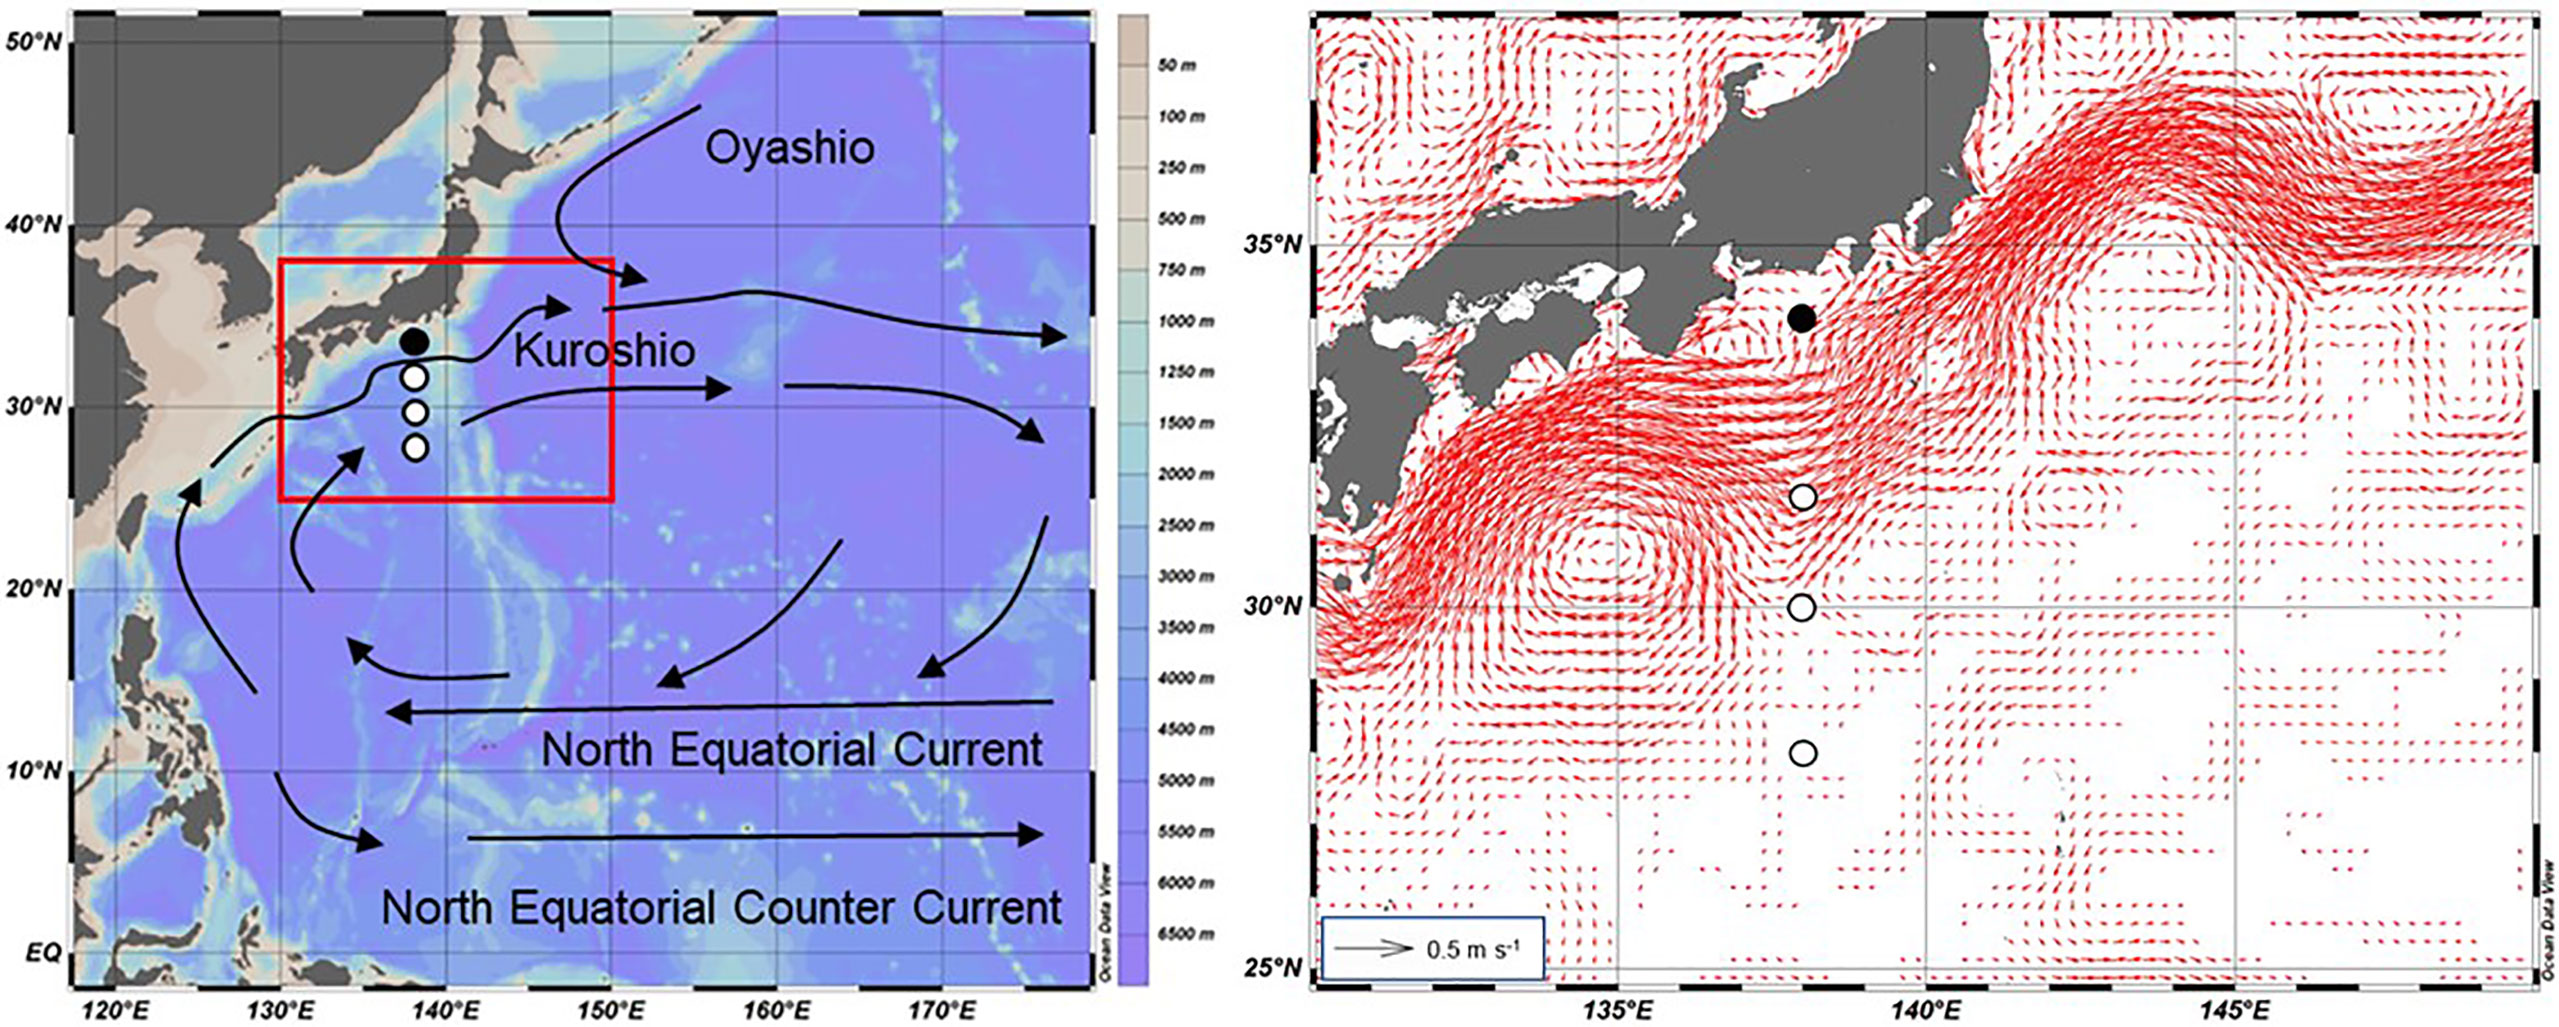
Figure 1 Sampling locations and main ocean currents in the western North Pacific (left). Sediment trap experiments were conducted shoreward (slope: closed circle) and on the oceanic side (subtropical gyre: open circles) of the Kuroshio Current. Right panel corresponds to the area indicated with red square in the left panel. Red arrows in the right panel indicate the mean surface geostrophic current calculated from daily surface geostrophic current data with a horizontal resolution of 0.25° from 1 August 2013 to 30 November 2019 (EU Copernicus Marine Service: https://www.marine.copernicus.eu). Detailed information about each station and the location of the Kuroshio Current axis relative to 138°E during each sampling period are provided in Table 2. The map was drawn using Ocean Data View (http://odv.awi.de/).
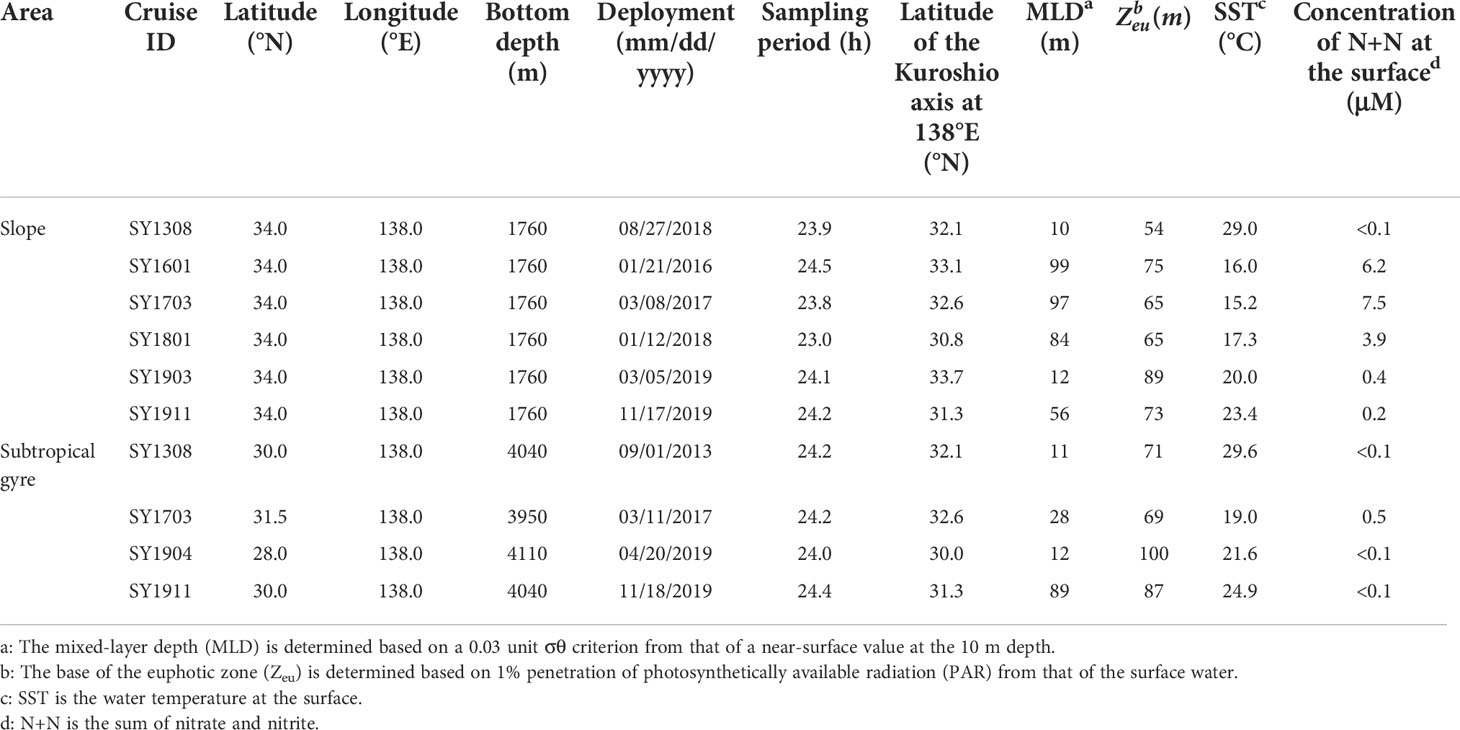
Table 2 Locations of sampling sites and oceanographic settling during the drifting sediment trap experiment.
Sediment trap
The sediment traps used in this study were Knauer type, surface-tethered drifting sediment traps (Knauer et al., 1979). The trap array included surface floats to dampen vertical displacement caused by waves and sediment trap cross-pieces holding eight transparent acrylic cylinders at two depths. The collection area and aspect ratio of the cylinder were approximately 0.0037 m2 and 8.27 (length, 620 mm; width 75 mm), respectively, except for the SY1308 cruise in which wider cylinders were used (0.0048 m2 and 6.18 [length, 618 mm; width 100 mm]). The volume of the collection cup was 295 and 548 mL for the narrow and wide cylinders, respectively. The shallower depth was at Zeu, and the deeper depth was at 100 m below Zeu. Zeu was determined as the depth of 1% photosynthetically active radiation based on direct measurement using the PRR-2600 Profiling Reflectance Radiometer (Biospherical Instruments) during each deployment (Table 2). In several cases, the upper sediment trap was deployed within the surface mixed layer (Table 2). Sediment traps within the surface mixed layer have been reported to under- and over-collect sinking particles (White, 1990; Gardner, 2000; Owens et al., 2013). In those cases, the sinking flux of particles and T100 value should be treated with caution.
Before deployment, each cylinder was filled with 0.2-μm-filtered seawater collected from the surface after adding of 5 g L-1 pre-combusted NaCl (450°C, 3 h). The trap array was deployed for approximately 24 h beginning at 12 PM or 4 PM. After recovery, the sediment traps were left undisturbed onboard for 1–2 h to allow particles to settle to the bottom of the cylinder. The settling time was to allow most sinking particles to settle to the bottom and to minimize biological decomposition of sinking particles especially for small particles with high surface-to-volume ratio after recovery. Before removing the collection cup at the bottom of the cylinder, supernatant seawater in the cylinder was siphoned off. A portion of the slow-sinking-particles, which were resuspended above the collecting cup during the trap recovery, might be removed with the supernatant seawater resulting in underestimation of sinking flux. Sinking particles in the collection cup were collected on pre-combusted (3 h at 450°C) GF/F filters (Whatman). The GF/F filters were wrapped in aluminum foil and stored in a freezer (<-20°C) until analysis of POC and particulate organic nitrogen (PON) in a land-based facility.
Water sampling and determination of environmental variables
Seawater samples were collected using 2.5- or 12- L Niskin bottles (GO-1010X; General Oceanics) mounted on a conductivity–temperature–depth carousel multi-sampling system (SBE 911plus, Sea-bird Scientific). Surface water (0 m) was collected using a plastic bucket. The depth of the surface mixed layer (MLD) was determined based on a density threshold value relative to the near-surface value at 10 m depth (Δσθ = 0.03 kg m−3) (de Boyer Montegut et al., 2004).
Samples collected for obtaining discrete vertical profiles of the concentrations of summed nitrate and nitrite (N+N), chlorophyll a (Chl a), POC, and PON were collected from the water column within the euphotic zone. Samples for determination of N+N were stored at< −20°C until measurement in a land-based facility. Suspended particles in 200 mL and 10 L seawater were collected on a GF/F filter for determination of the concentrations of Chl a and particulate organic matter, respectively. GF/F filters for determination of the Chl a concentration were immersed in N, N-dimethylformamide (Suzuki and Ishimaru, 1990) immediately after filtration and then stored at< −20°C in the dark until measurement on land. GF/F filters for POC and PON were treated using the same method as for the trap samples.
In situ observation of the particle size distribution and calculation of its slope
The particle volume and PSD were measured at depths of 10 and 50 m using an in situ laser diffraction sizer (LISST-100X, Sequoia Scientific), except on the SY1904 cruise. The LISST-100X measures light scattered by particles using 32 concentric, logarithmically spaced ring detectors. The volumetric particle concentration in each size class is estimated by inversion modeling based on Mie theory (Agrawal and Pottsmith, 2000). To minimize overestimation in the upper size bins driven by salinity fluctuation (Styles, 2006) and underestimation in the lower size bins due to low particulate concentrations or high ambient light conditions (Andrews et al., 2011), we used a size class range of 5.2–119 μm (20 LISST bins) (Yamada et al., 2015; Yamada et al., 2021). The LISST-100X was mounted on a winch wire with a protective frame, and the volume of particles at a given depth was measured for 10 min at a 1-s measurement interval (totaling 600 counts).
Total particle volume (TPV, ppm) was calculated as an integral across the whole size window (5.2–119 μm). Volumetric size distribution data were used to calculate the PSD in numerical terms, assuming that particles are spheres. Then, the numerical PSD was determined using the following power-law equation (Bader, 1970; Kostadinov et al., 2009; Buonassissi and Dierssen, 2010; Yamada et al., 2015; Yamada et al., 2021):
where N(D) is the number of particles per volume of seawater normalized to the width of the size bin (particles L-1 μm-1). D is the particle diameter (μm). D0 is the reference diameter (here 1 μm). N0 is the particle differential number concentration at D0 (particles L-1 μm-1), and ξ is the power-law slope of the PSD. We conducted linear regression of log-transformed data for calculation of ξ and N0.
Chemical analysis
The concentration of N+N was determined using a flow injection analyzer (TrAAcs 2000, Bran+Luebbe) (details in Kodama et al., 2014). The detection limit for determination was 0.1 μM. The reproducibility of seawater measurements had a coefficient of variation of< 3% at an N+N concentration of 15.25 μM (n = 19). The nutrient concentrations were determined using commercially available nutrient standards: the CSK nutrient standard (Wako) and the Reference Material for Nutrients in Seawater (KANSO). Any concentration below the detection limit was set to 0.1 μM for statistical analysis.
The Chl a concentration was measured using a fluorometer (10-AU, Turner Designs) (Welschmeyer, 1994). For measurements of POC and PON, particles retained on GF/F filters were fumed with HCl mist for at least 24 h in a plastic container to remove CaCO3. The total amounts of organic carbon and nitrogen were determined using an elemental analyzer (Elemental Analyzer-IRMS (FLASH 2000, Thermo Fisher Scientific).
Mathematical processing and statistical analysis
Depth-integrated values of Chl a, POC, PON, and TPV were calculated from discrete vertical profiles using the trapezoidal integration method. The resolution of discrete vertical profile data differed among variables (Tables S1–S3). Depth-weighted mean values of variables within the euphotic zone were calculated via division of the depth-integrated value by the thickness of the euphotic zone.
To examine correlations between variables, Spearman rank order correlation analysis was performed, as the normality assumption was not fulfilled for some variables. For the same reason, the Mann–Whitney rank sum test was used to compare outcomes between two groups. These statistical analyses and linear and non-linear regression analyses were performed using SigmaPlot 14.0 (Systat Software).
Results
As the scope of this study is to examine the mechanisms controlling temporal- and spatial-variations in the sinking flux of POC at Zeu and T100, depth-integration and averaging within the euphotic zone were conducted for data on chemical and biological variables to capture the major features of the euphotic zone by vertically homogenizing the variable ranges and differences among seasons (Tables S1–S3). Differences in vertical resolution among variables may introduce biases to the analysis of relationships among variables, and therefore we assumed that depth-integrated and depth-weighted mean values within the euphotic zone capture the regional and temporal variabilities of the features of the euphotic zone.
Physical environment and nutrient concentrations
Table 2 summarizes sea surface temperature (SST), MLD, Zeu, and the surface (0 m) concentration of N+N, while the depth profiles of salinity, temperature, and density (σθ) are shown in Figures S1, S2. SST varied from 15.2°C to 29.0°C and from 19.0°C to 29.6°C in the slope and subtropical gyre areas, respectively, and SST tended to be higher in the subtropical gyre than on the slope during a given cruise. MLD increased with decreasing SST in both areas. N+N in the slope area became high during the mixing period, whereas N+N in the subtropical gyre was below the detection limit except in March 2017. Zeu was less variable than MLD and showed no apparent coupling with variation in MLD, SST, or N+N. In three cases of trap deployment (01/21/2016, 03/08/2017 and 01/12/2018), the sediment trap at Zeu was moored in the mixed layer (Table 2).
Depth-integrated values and concentrations of the sum of nitrate and nitrite, chlorophyll a, particulate organic carbon, and particulate organic nitrogen within the euphotic zone
The depth-integrated N+N within the euphotic zone (diN+N) varied from 100 to 490 mmol m-2 and 8.7 to 73 mmol m-2 in the slope and subtropical gyre areas, respectively (Table 3). diN+N and depth-weighted mean N+N (dmN+N) in the slope area were significantly higher than in the subtropical gyre (Mann–Whitney rank sum test, p< 0.05). The diN+N variation in the slope area showed a negative correlation with SST (rs = − 0.886, p< 0.05, n = 6), but there was no significant correlation between diN+N and SST in the subtropical gyre (p > 0.05, n = 4). Depth-integrated Chl a within the euphotic zone (diChl a) varied from 27.4 to 48.5 mg Chl a m-2 and from 12.1 to 28.0 mg Chl a m-2 in the slope and subtropical gyre areas, respectively (Table 3). The variation in diChl a in each area showed no significant correlation (p > 0.05) with SST or N+N, whereas the variation in diChl a in the entire dataset showed a negative correlation with that in SST (rs = −0.661, p< 0.05, n = 10) and a positive correlation with that in N+N (rs = 0.806, p< 0.05, n = 10), suggesting that the biomass of phytoplankton along 138°E was regulated by the availability of nutrients transported from the cold deeper layer (Table S5). diChl a was significantly higher on the slope than in the subtropical gyre (Mann–Whitney rank sum test, p< 0.05), and diChl a in the subtropical gyre showed greater variability than on the slope. The depth-weighted mean Chl a concentration within the euphotic zone (dmChl a) ranged from 0.403 to 0.647 μg Chl a L-1 and from 0.165 to 0.387 μg Chl a L-1 in the slope and subtropical gyre areas, respectively (Table 3). The variability in dmChl a was similar in magnitude to that in diChl a, and dmChl a was significantly higher on the slope than in the subtropical gyre (Mann–Whitney rank sum test, p< 0.05).
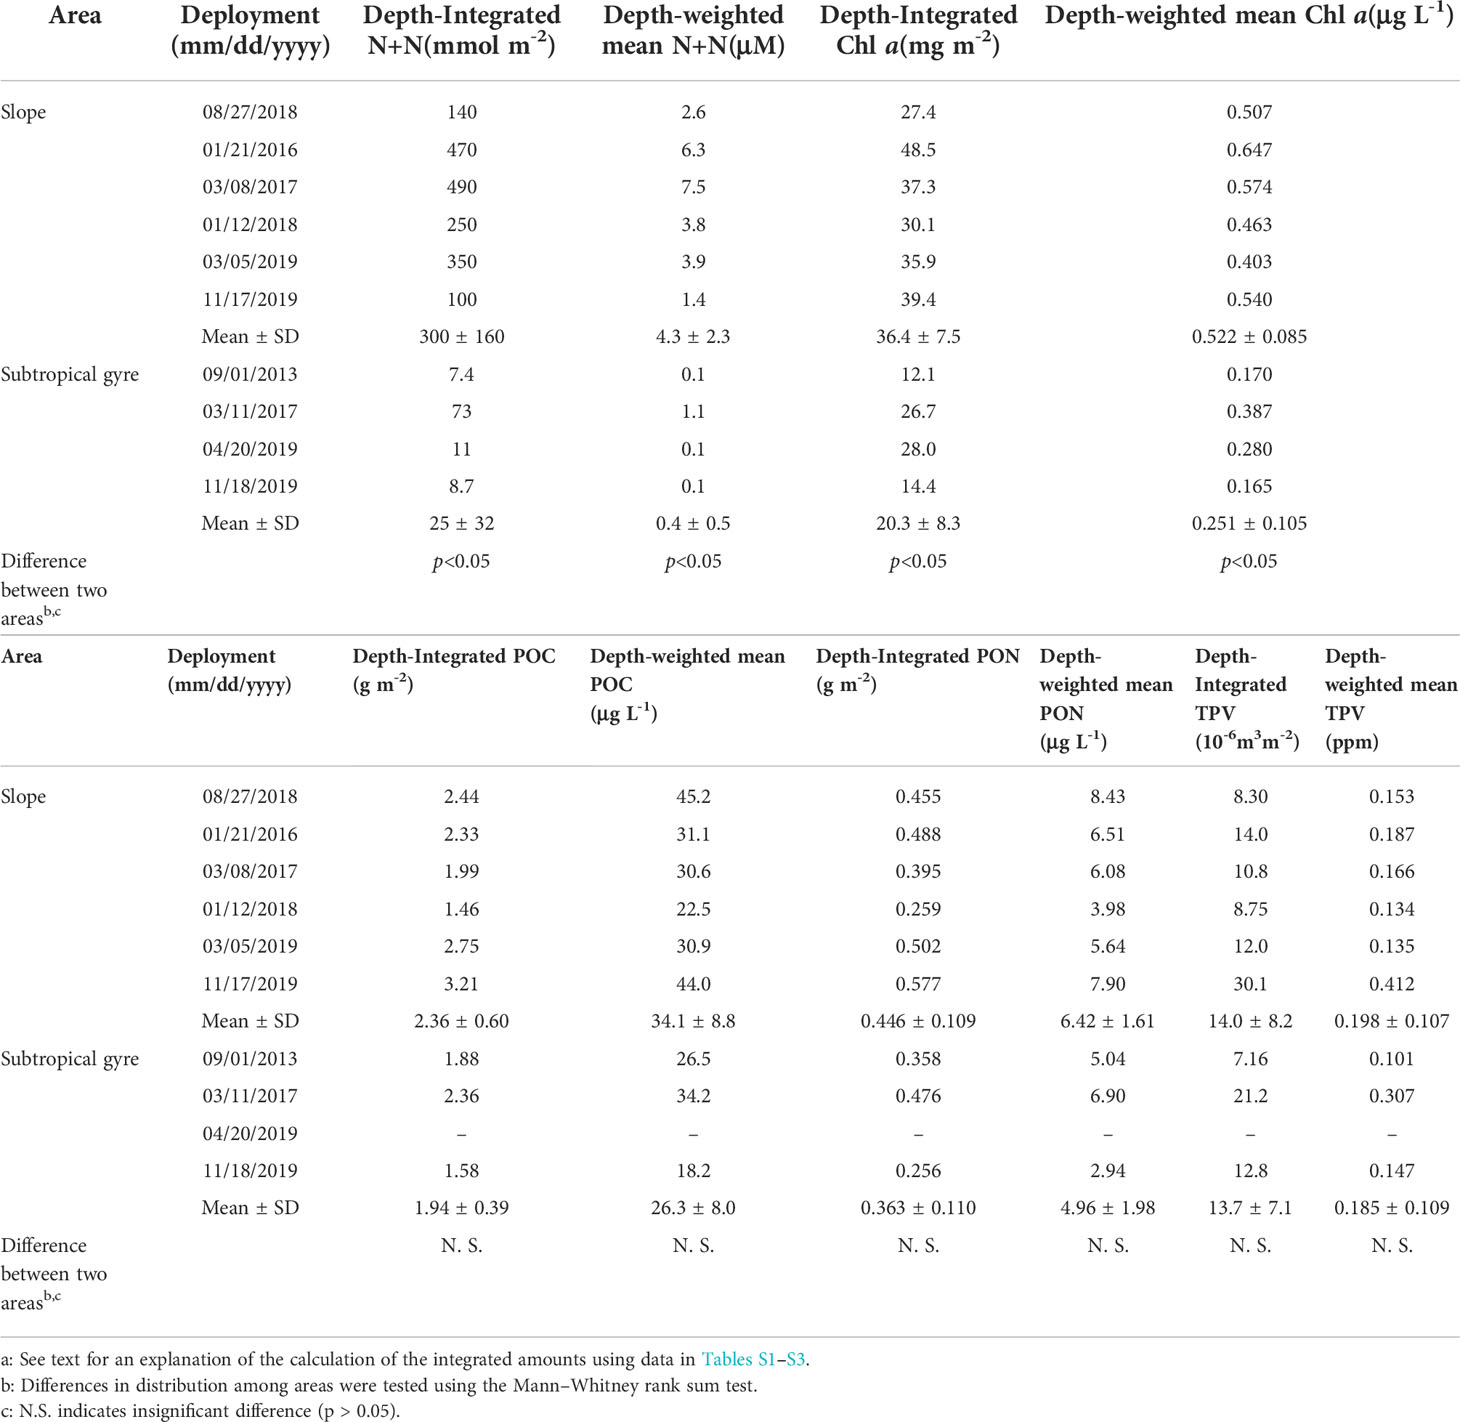
Table 3 Depth-integrated amounts and depth-weighted mean concentrations of sum of nitrate and nitrite (N+N), chlorophyll a (Chl a), particulate organic carbon (POC) and nitrogen (PON), and total particle volume (TPV: 5.12 -119 μm in diameter) within the euphotic layera.
Contrasting Chl a, no significant difference in POC and PON between the slope and subtropical gyre were observed from depth-integrated values (diPOC and diPON, respectively) or depth-weighted mean values (dmPOC and dmPON, respectively) in the euphotic zone (Mann–Whitney rank sum test, p > 0.05; Table 3). Moreover, no significant correlations of diChl a with diPOC or diPON were observed within each area or in the entire dataset (Table S5). However, the mean ratios of POC/PON in the slope and subtropical gyre areas were comparable with the Redfield ratio (C:N = 106:16), suggesting that plankton were a major component of the sampled particulate organic matter (Table 4).
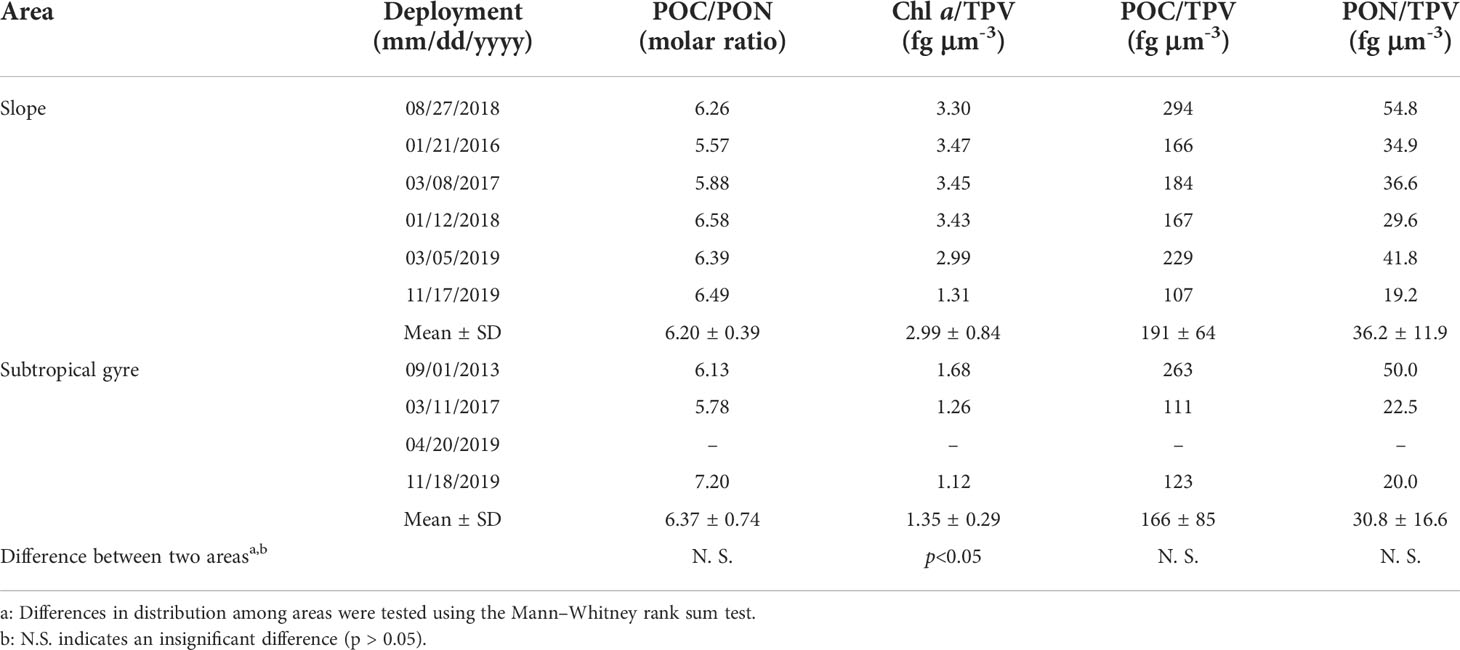
Table 4 Particle properties within the euphotic layer.
Total particle volume, mean particle diameter, and slope of the particle size distribution
PSDs in terms of number and volume within the euphotic zone show temporal variabilities in both the slope and subtropical gyre areas (Figures 2, 3, S3, S4). In both areas, the PSD in number fitted well to Eq. (1), with determination coefficient values of 0.95–1.00 (Table 5). The slope (ξ) of PSD in number varied from −3.5 to −4.1 and from −3.5 and −4.8 in the slope and subtropical gyre areas, respectively, with no significant difference between two areas (Mann–Whitney rank sum test, p > 0.05). The variation in ξ is not reflected in the mean particle diameter based on the PSD in number (mPDN), but rather in the mean particle diameter based on the volumetric PSD (mPDV) (Tables 5, S5). mPDV shows greater variability than mPDN (Table 5), ranging from 37.2 to 56.7 μm and from 23.0 to 58.0 μm in the slope and subtropical gyre areas, respectively. Similar to ξ, no significant difference in mPDV between two areas was observed (Table 5). Depth-integrated TPV (diTPV) varied from 8.75 to 30.1 10-6 m3 m-2 and from 7.16 to 21.2 10-6 m3 m-2 in the slope and subtropical gyre areas, respectively, showing greater variability than diChl a, diPOC and diPON (Table 3).
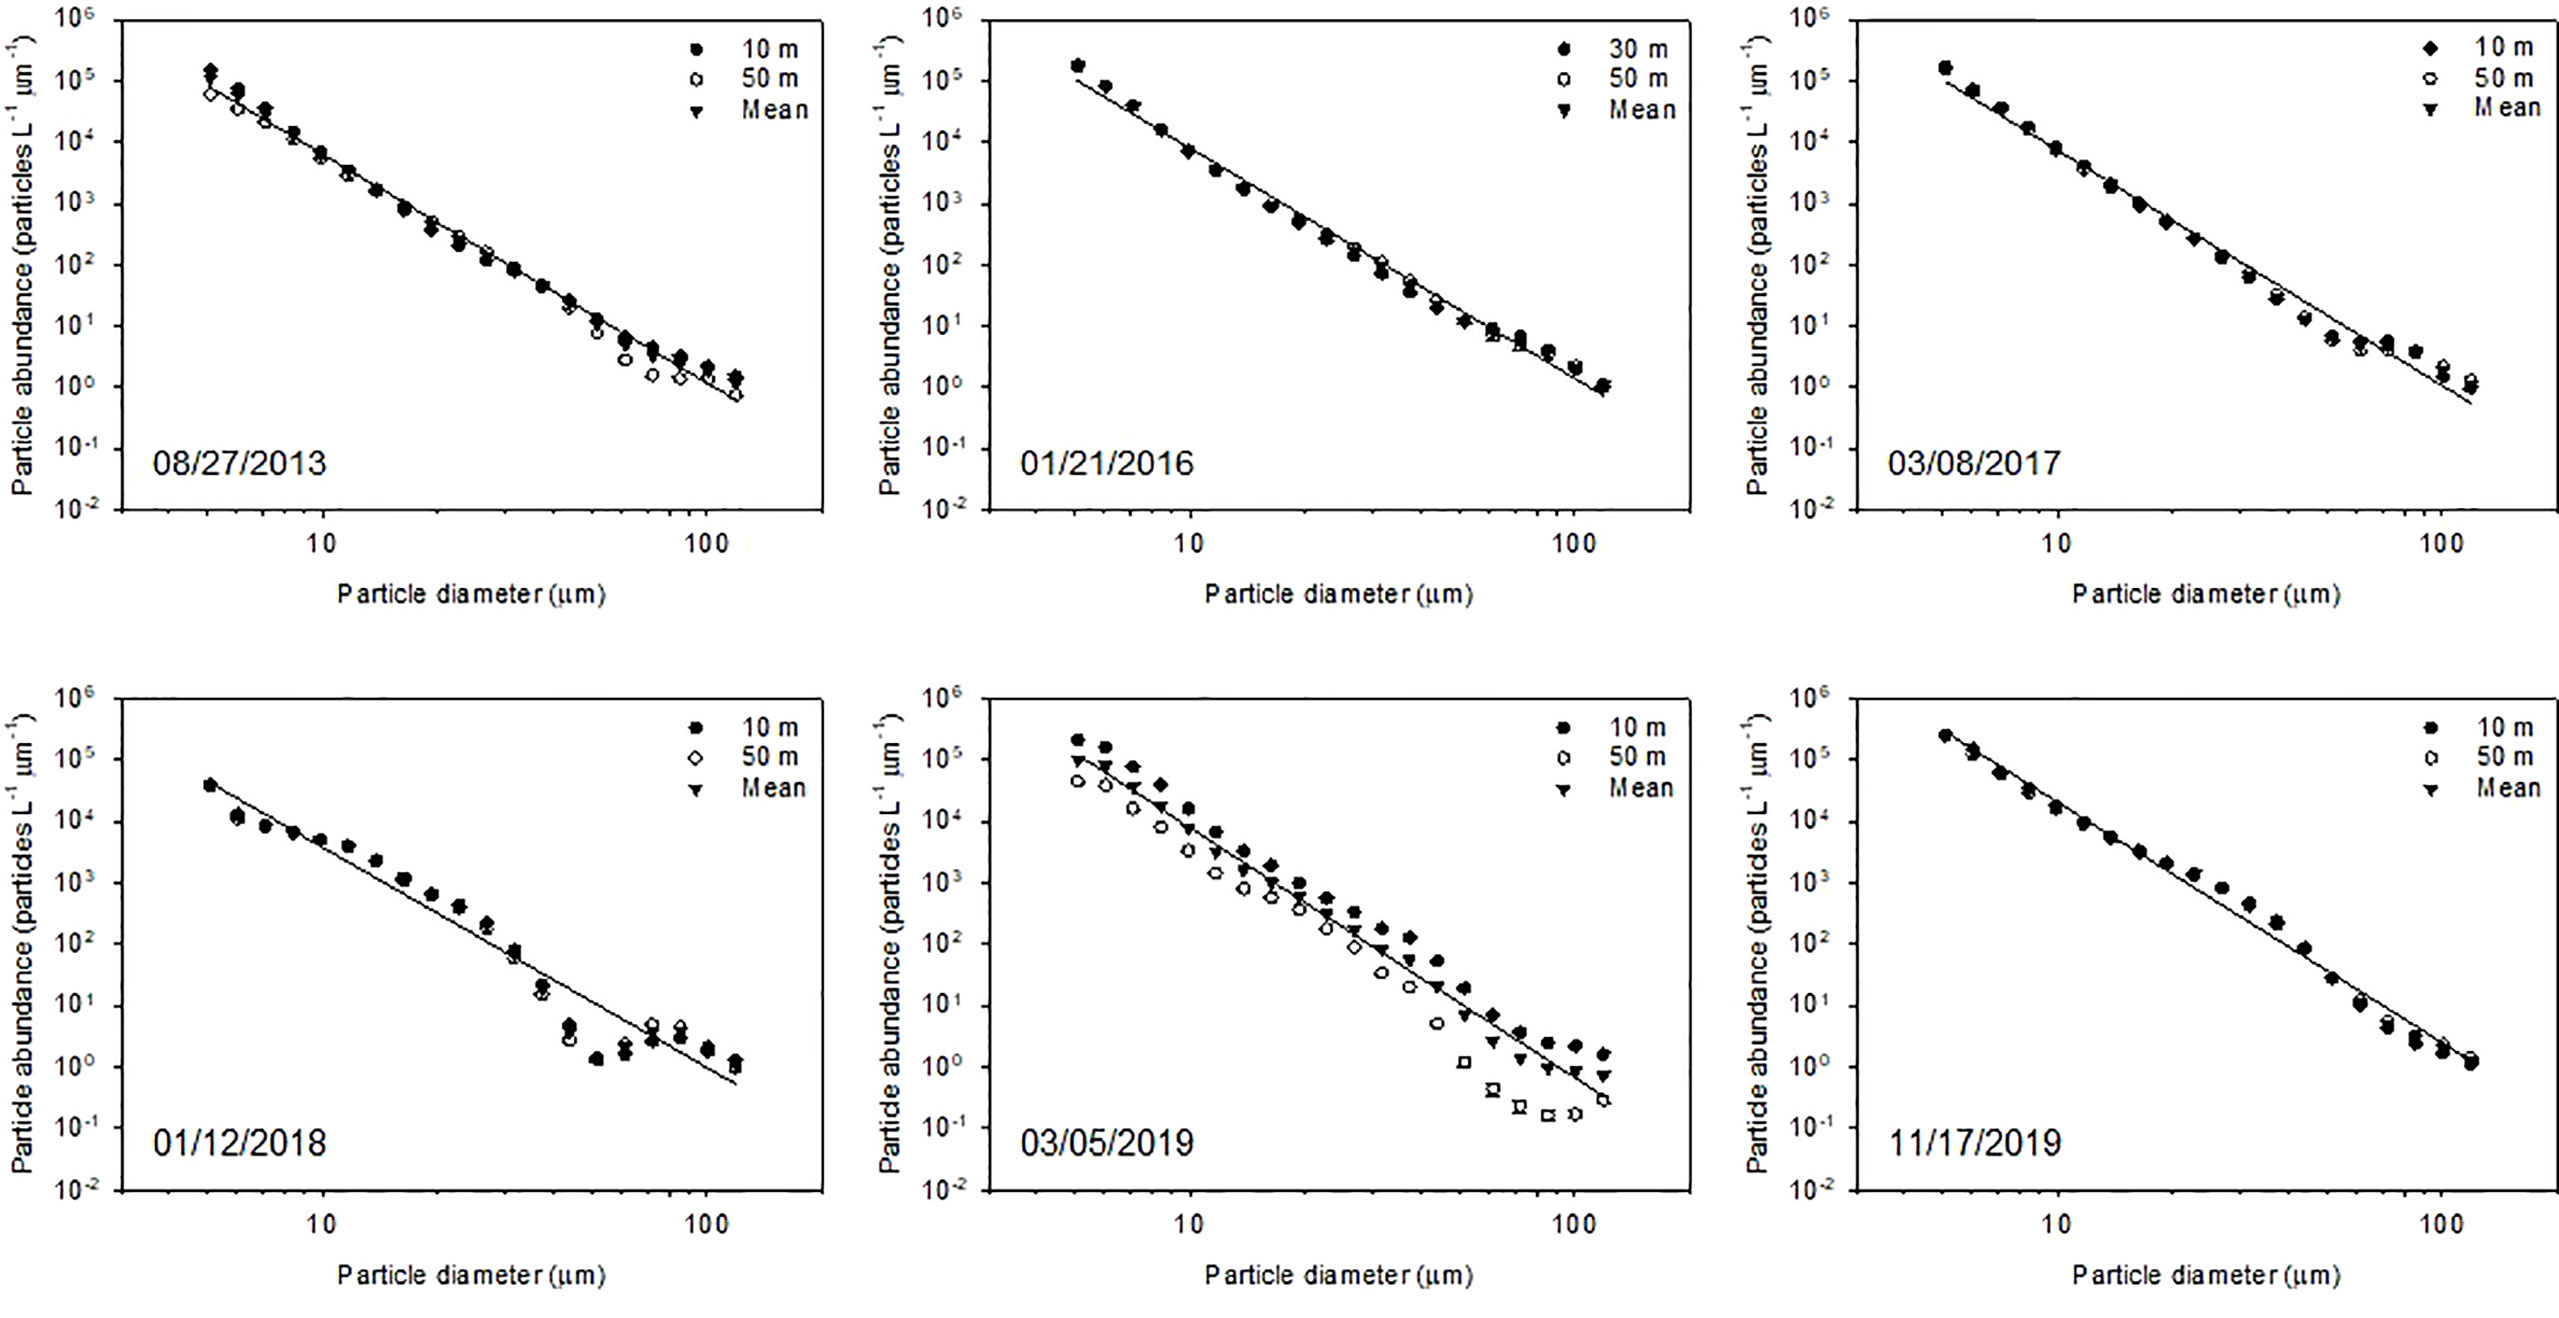
Figure 2 Particle size number distribution following the power-law model (Eq. 1) using double logarithmic transformation in the size range of 5.2–119 μm at depths of 10 and 50 m and averaged across the euphotic zone (see details in the main text) in the slope area. Error bars indicate standard error. The regression line was obtained using the ordinary least squares method for each sampling period. The statistical parameters of the regression are listed in Table 5.
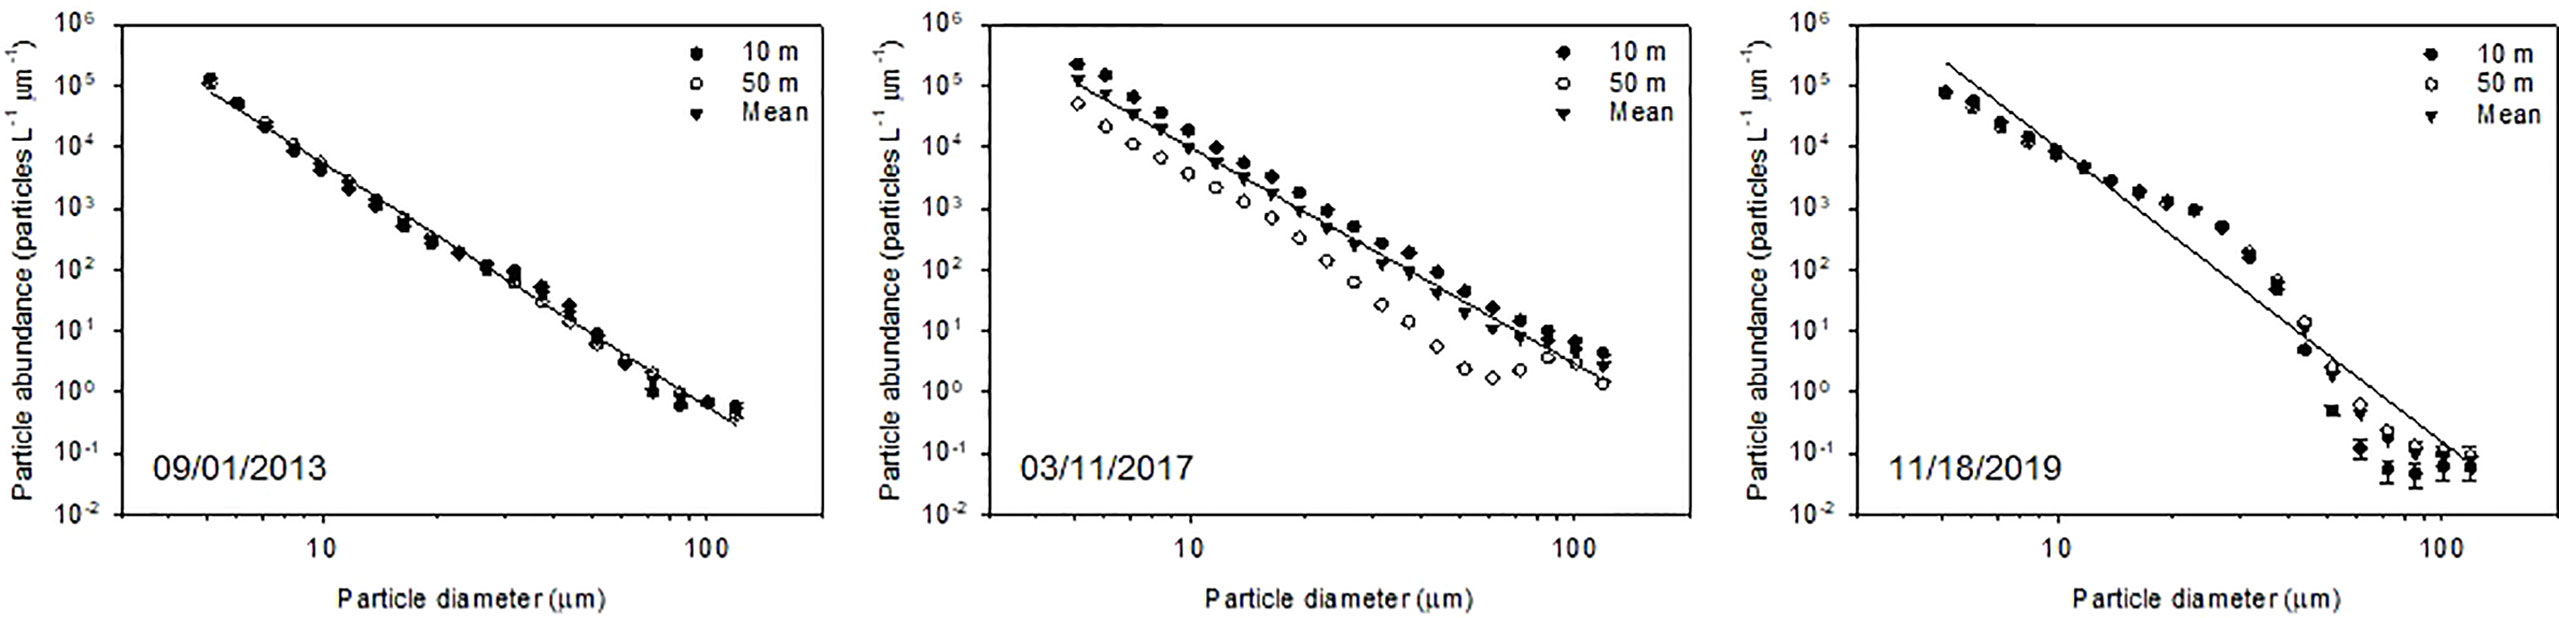
Figure 3 Particle size number distribution following the power-law model (Eq. 1) using double logarithmic transformation in the size range of 5.2–119 μm at depths of 10 and 50 m and averaged across the euphotic zone (see details in the main text) in the subtropical gyre area. Error bars indicate standard error. The regression line was obtained using the ordinary least squares method for each sampling period. The statistical parameters of the regression are listed in Table 5.
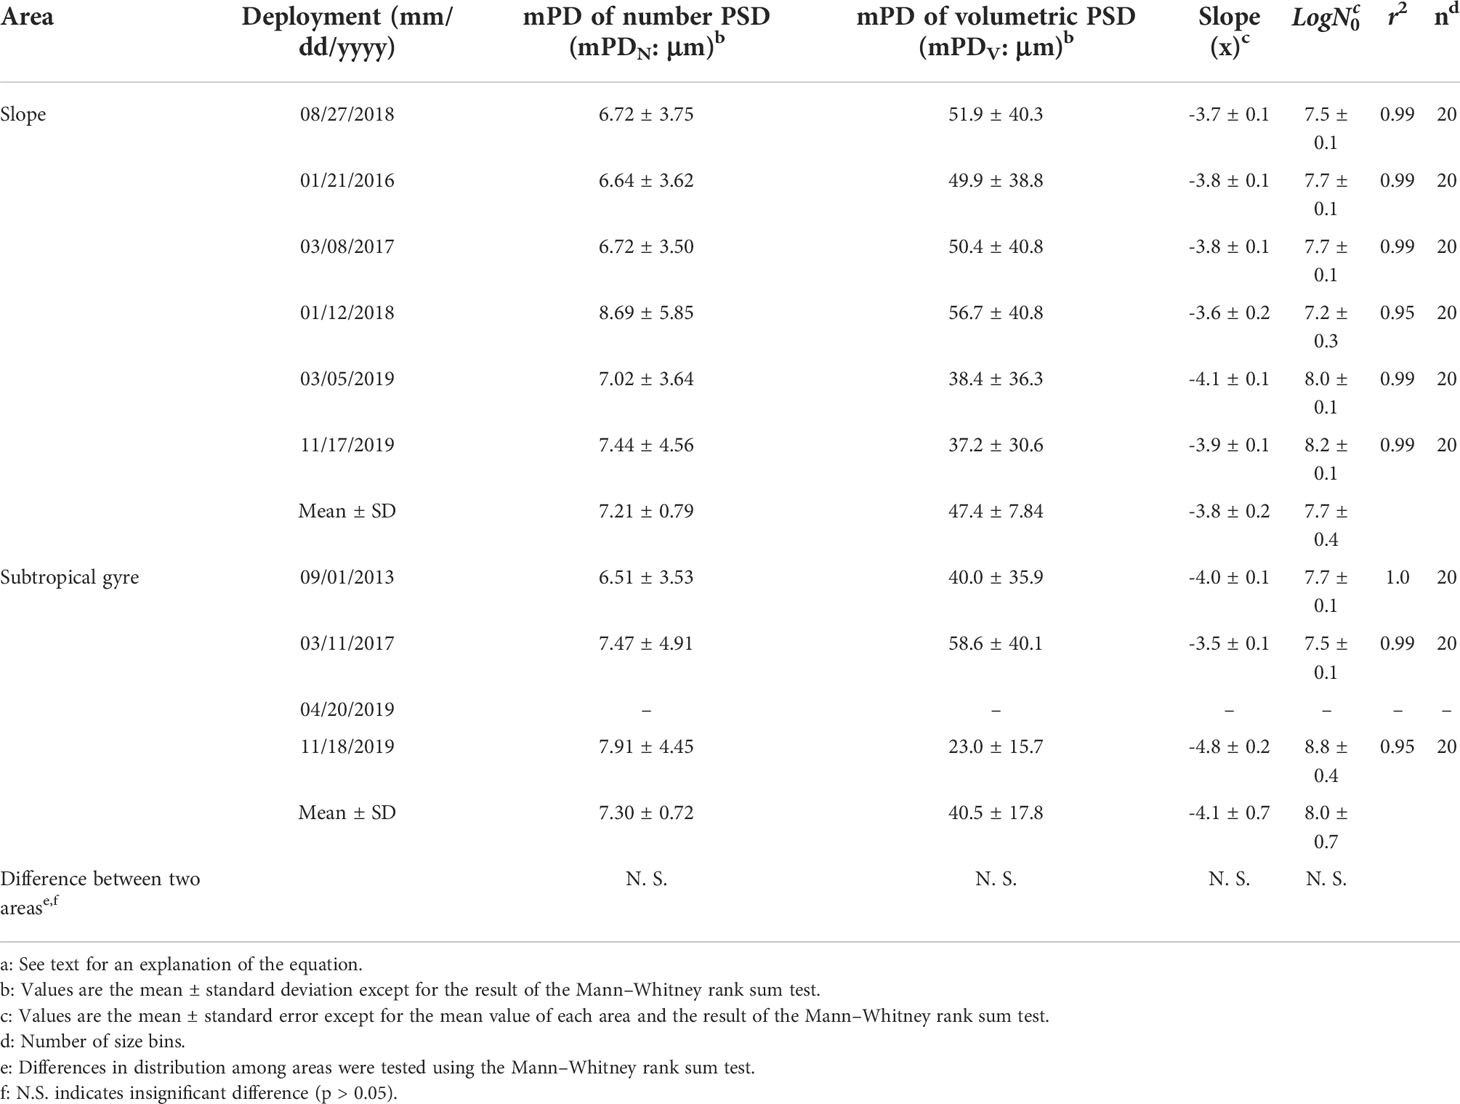
Table 5 Mean diameters of particles between 5.12 and 119 μm in diameter (mPD) and parameters of each regression line for the mean particle size distribution (PSD) in the euphotic layera.
Sinking fluxes of particulate organic carbon, particulate organic nitrogen, and T100
The sinking flux of POC at Zeu ranged from 51.9 to 235 mg m-2 d-1 and from 43.7 to 92.0 mg m-2 d-1 in the slope and subtropical gyre areas, respectively (Figure 4), with no significant difference between areas (Table 6). At Zeu, the variation in sinking flux of POC in the entire dataset was closely related to the sinking flux of PON (Figures 5A, S5; rs= 0.648, p< 0.05, n = 10; Table S5) and showed increases during the cold period (Figure 5B; rs= −0.624, p< 0.05, n = 10; Table S5) and with increasing diChl a (Figure 5C; rs= 0.648, p< 0.05, n = 10; Table S5). However, the three correlations with the sinking flux of POC at Zeu were not significant (p< 0.05) within each region, except for the correlation between the sinking flux of POC and that of PON in the slope area. The variations in sinking flux of POC at Zeu and diN+N were not correlated within each area and in the entire dataset (Table S5), despite a significant correlation between the sinking flux of PON at Zeu and N+N in the entire dataset (Table S5).
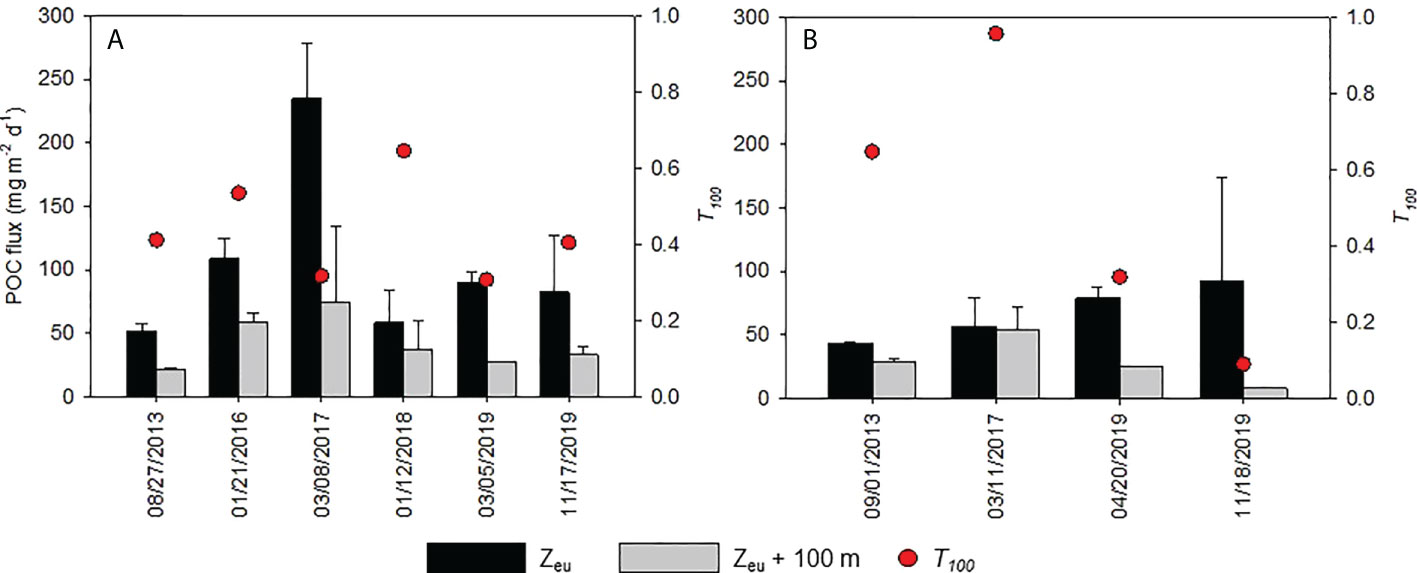
Figure 4 Fluxes of particulate organic carbon (POC) at the base of the euphotic zone (Zeu) and at a depth of 100 m below Zeu, as well as T100 during deployments in (A) the slope area and (B) the subtropical gyre area. Error bars indicate ranges or standard deviations (n = 2–3; see details in Table 6).
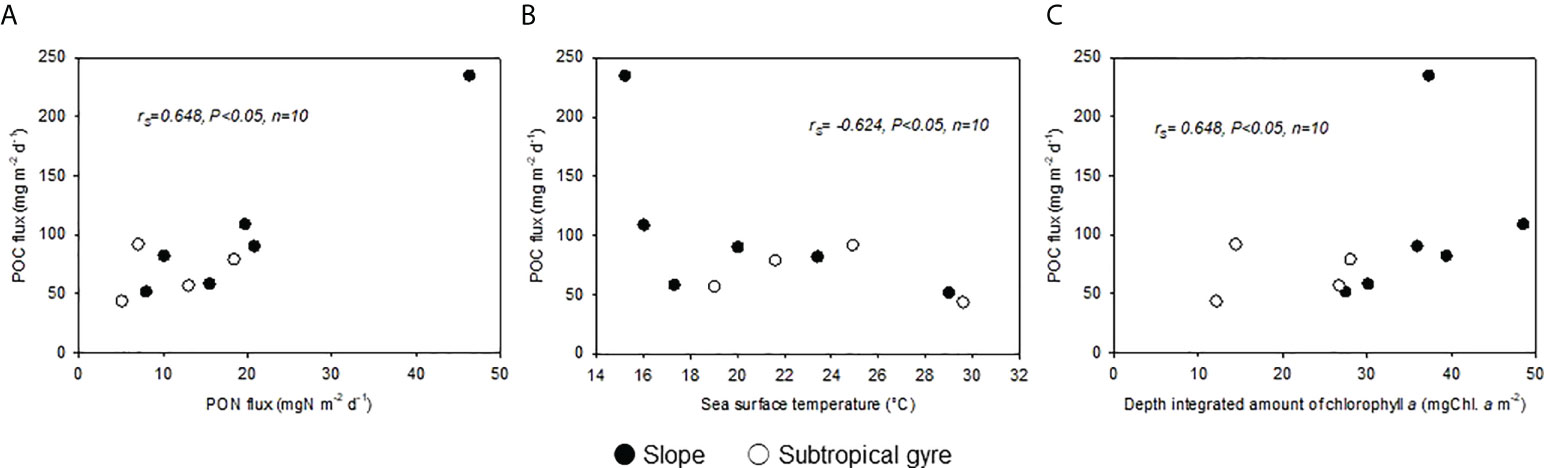
Figure 5 Relationships of POC flux with (A) PON flux, (B) sea surface temperature, and (C) the depth-integrated amount of chlorophyll aSpearman rank order correlations (rs) are presented.
The fluctuation in the sinking flux of POC at a depth of 100 m below Zeu was not similar to that of sinking flux of POC at Zeu, with T100 ranging from 0.307 to 0.646 and from 0.090 to 0.958 in the slope and subtropical gyre areas, respectively. Similar to the areal distribution of sinking flux of POC at Zeu, the areal distribution of T100 showed no significant difference between areas (Table 6). Despite the significant correlation between the sinking flux of POC at Zeu and SST, no significant correlation between T100 and SST was observed within each area or in the entire dataset (Figure 6A). In the entire dataset, T100 tended to decrease with increasing sinking flux of POC at Zeu (Figure 6B; rs= −0.661, p< 0.05, n = 10; Table S6), while it increased with increasing mPDV (Figure 6B; rs= 0.700, p< 0.05, n = 9; Table S6) and ξ (Figure 6C; rs= 0.695, p< 0.05, n = 9; Table S6). These three correlations with T100 were not significant (p< 0.05) within each region.
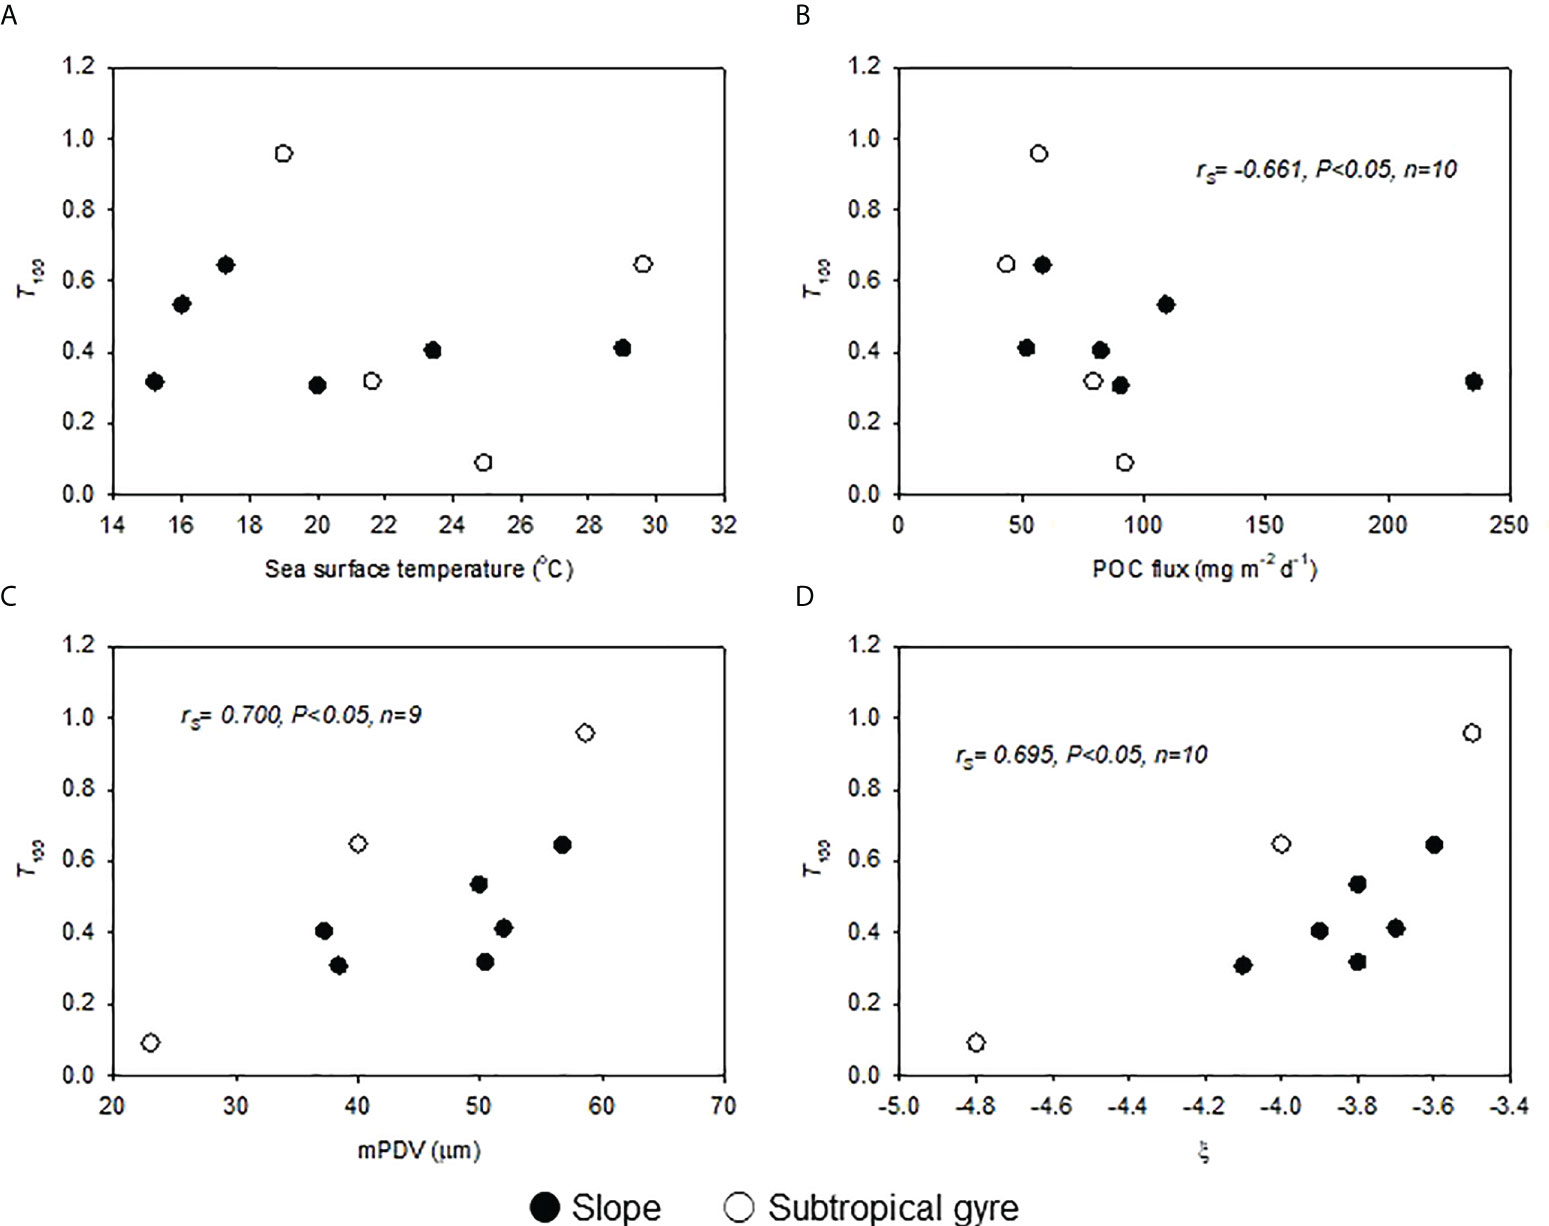
Figure 6 Relationships of T100 with (A) sea surface temperature, (B) sinking flux of POC, (C) mean particle diameter of the volumetric particle size distribution (mPDV), and (D) slope of the regression line of the particle size number distribution. Spearman rank order correlations (rs) are presented.
Discussion
Oceanographic settling and particle properties on the slope and in the subtropical gyre
The study sites on the slope and in the subtropical gyre were located on different sides of the eastward Kuroshio Current, and their physicochemical environments were affected by the current (Figure 1). The mean surface geostrophic current from 1 August 2013 to 30 November 2019 indicated that Kuroshio water was transported laterally into the surface of the slope area, and that a cyclonic eddy was located on the downstream side of the Kuroshio Current from the sampling sites in the subtropical gyre (28°N–32°N, 133°E–137°E). Because the location of the axis of the Kuroshio Current is unstable (Table 2), it is difficult to generalize the positional relation between sampling sites and the Kuroshio Current or eddies. The seasonal variation of Zeu in the subtropical gyre is not obvious (Table 2). However, the deeper Zeu in the subtropical gyre than on the slope is consistent with the difference in dmChl a between the two areas (Table 3). Zeu in the slope area showed no apparent coupling with the variations in MLD, SST, or N+N at the surface (Table 2), even though the molar ratio of nutrients in the study area indicates that N+N is the potential limiting factor of primary production rather than phosphate or silicic acid (Kodama et al., 2014). The lower variability in diChl a and dmChl a than dmN+N on the slope implies that grazing on phytoplankton or diapycnal mixing with deeper water suppressed the accumulation of diChl a and dmChl a, resulting in low variability in Zeu (Kaneko et al., 2013; Nagai et al., 2019).
Differences in the areal distributions of particle properties between the two areas were not statistically significant, except for Chl a/TPV (Table 4). Therefore, subsequent analyses of particle properties, sinking POC flux, and T100 were conducted using the entire dataset, followed by the evaluation of trends within each area. No significant correlation of diTPV with diChl a, diPOC, or diPON was observed (Table S5), implying that the chemical properties of particles (Chl a/TPV, POC/TPV, and PON/TPV) exhibited short-term fluctuations. Only Chl a/TPV showed a regional difference between the slope and subtropical gyre (Table 4). The variations in Chl a/TPV had significant positive correlations with Chl a (rs = 0.783, p< 0.05, n = 9; Table S6), indicating that the volumetric contribution of non-phytoplankton particles to total particles increases in an oligotrophic environment. Furthermore, POC/TPV was negatively correlated with dmTPV (rs = −0.667, p< 0.05, n = 9; Table S6), whereas the mean ratios of POC/PON in the slope and subtropical gyre areas suggest that plankton were a major component of the particulate organic matter (Table 4). These results imply that the change in the POC/TPV was the results in the difference in porous structures, which made a smaller contribution to the total organic matter of each particle than did planktonic organisms. This is consistent with the accumulation of larger particles detectable by LISST-100X in the presence of a high concentration of TEP, which has a porous, gel-like structure, in the subtropical northwest Pacific along the Kuroshio Current (Yamada et al., 2021). Therefore, porous gel-like materials may be a determinant of particle dynamics in subtropical environments.
Comparison of the sinking flux of particulate organic carbon at the base of the euphotic zone and transfer efficiency to the deeper layer
In marine environments, the sinking flux of POC shows large regional and temporal variability (Buesseler and Boyd, 2009; Cavan et al., 2019). The sinking POC at Zeu in the entire dataset showed temporal variability correlated with SST and diChl a (Figures 5B, C). However, seasonal variability in the subtropical gyre was modest (Figure 5B). The range of the sinking flux of POC at Zeu in the subtropical gyre exceeds values in the subtropical North Pacific Ocean near Hawaii (station ALOHA) and is comparable with the range in the Gulf of Mexico (Table S7), but the range of of the sinking flux of POC at Zeu on the slope, where NPP is greater than in the subtropical gyre (Yokouchi et al., 2006), is comparable with those in mid-latitude areas (Iberian basin, Spanish coast, and Gulf of Mexico) and in high-latitude areas (Table S7). It is worth comparing the sinking flux of POC and T100 in the Kuroshio region to those in the Gulf of Mexico. In the Gulf of Mexico, mesoscale activities driven by the Loop Current and the eddies affects hydrography and biogeochemistry in the oligotrophic environments (Green et al., 2014; Stukel et al., 2021; Lee-Sánchez et al., 2022). Similarly, diverse routes of nutrient supply along the Kuroshio Current, including diapycnal turbulent mixing, wind- or tide-induced near-inertial internal waves, and double-diffusive convection, support higher primary productivity in the Kuroshio Current area relative to the subtropical gyre (Nagai et al., 2019).
T100 in marine environments varies and may exceed 1 in areas where particle production or lateral transport of particles occurs below the euphotic zone (Table S7), but it shows no marked regional trend. The range of T100 in this study was within the range of previous studies shown in Table S7, except for the lowest value (0.090). The areal averages of T100 on the slope (0.437 ± 0.130) and in the subtropical gyre (0.504 ± 0.0380) are comparable with the range in the Gulf of Mexico (0.437–0.657; Table S7). However, no seasonal trend was observed (Figure 6A). In the following section, we test the hypothesis that particle size affects the attenuation of sinking POC by altering sinking speed in slope and subtropical gyre areas along the Kuroshio Current.
Relationship between variation in T100 and particle size
Using numerical models, Cram et al. (2018) and Omand et al. (2020) demonstrated that increasing the sinking speed of particles enhances the transfer efficiency of sinking organic matter to deeper layers by reducing residence time within the water column. The positive correlation between T100 and mPDV (Figure 6B) and the positive correlation between T100 and ξ (i.e., lower ξ indicates a greater contribution of smaller particles) (Figure 6C) are consistent with the results obtained by Cram et al. (2018) and Omand et al. (2020). However, T100 decreased during the period of high sinking flux of POC at Zeu, suggesting that active biological decomposition enhanced vertical attenuation of sinking flux of POC (Figure 6A). Honda et al. (2016) reported close coupling between the attenuation of POC flux and zooplankton carbon demand. Active decomposition of zooplankton might alter the shape of the PSD via size-selective consumption of particles (Fuchs and Franks, 2010; Stamieszkin et al., 2017).
To conduct a more process-oriented comparison, we assumed that attenuation of POC flux can be expressed using first-order kinetics from the flux and time, t:
where Fz and F0 are the sinking fluxes of POC at the depth of z and the reference depth z0, respectively (Suess, 1980; Armstrong et al., 2002; Lutz et al., 2002). k is the rate of decomposition including bacterial decomposition and zooplankton grazing. Time can be reformulated based on the sinking rate, w, and the distance between the reference depth and z:
k/w in Eq. (3) corresponds to z* in previous studies (Boyd and Trull, 2007; Marsay et al., 2015). For spherical particles, Stokes law predicts that
where D is the particle diameter, Δρ is the density difference between the particle and seawater; μ is seawater viscosity, and g is gravitational acceleration. For marine particles, Δρ tends to decrease with increasing D, as w ~ Dγ with γ< 2 (Alldredge and Gotschalk, 1988). If z0 is Zeu, T100 can be simplified to
where a is the constant defining the empirical power-law relationship between w and D. Thus, the logarithmic value of T100 (−ln T100) is proportional to k/aDγ. Figure 7 shows the relationship between −ln T100 and mPDV. The exponent of the non-linear regression is −1.74 (95% confidence interval: −2.57 to −0.89) and −1.98 (95% confidence interval: −3.43 to −0.53) for the entire dataset and in cases in which the sediment trap at Zeu was deployed below MLD, respectively. The exponent of the non-linear regression is consistent with γ< 2, suggesting that T100 is controlled primarily by w in the study area.
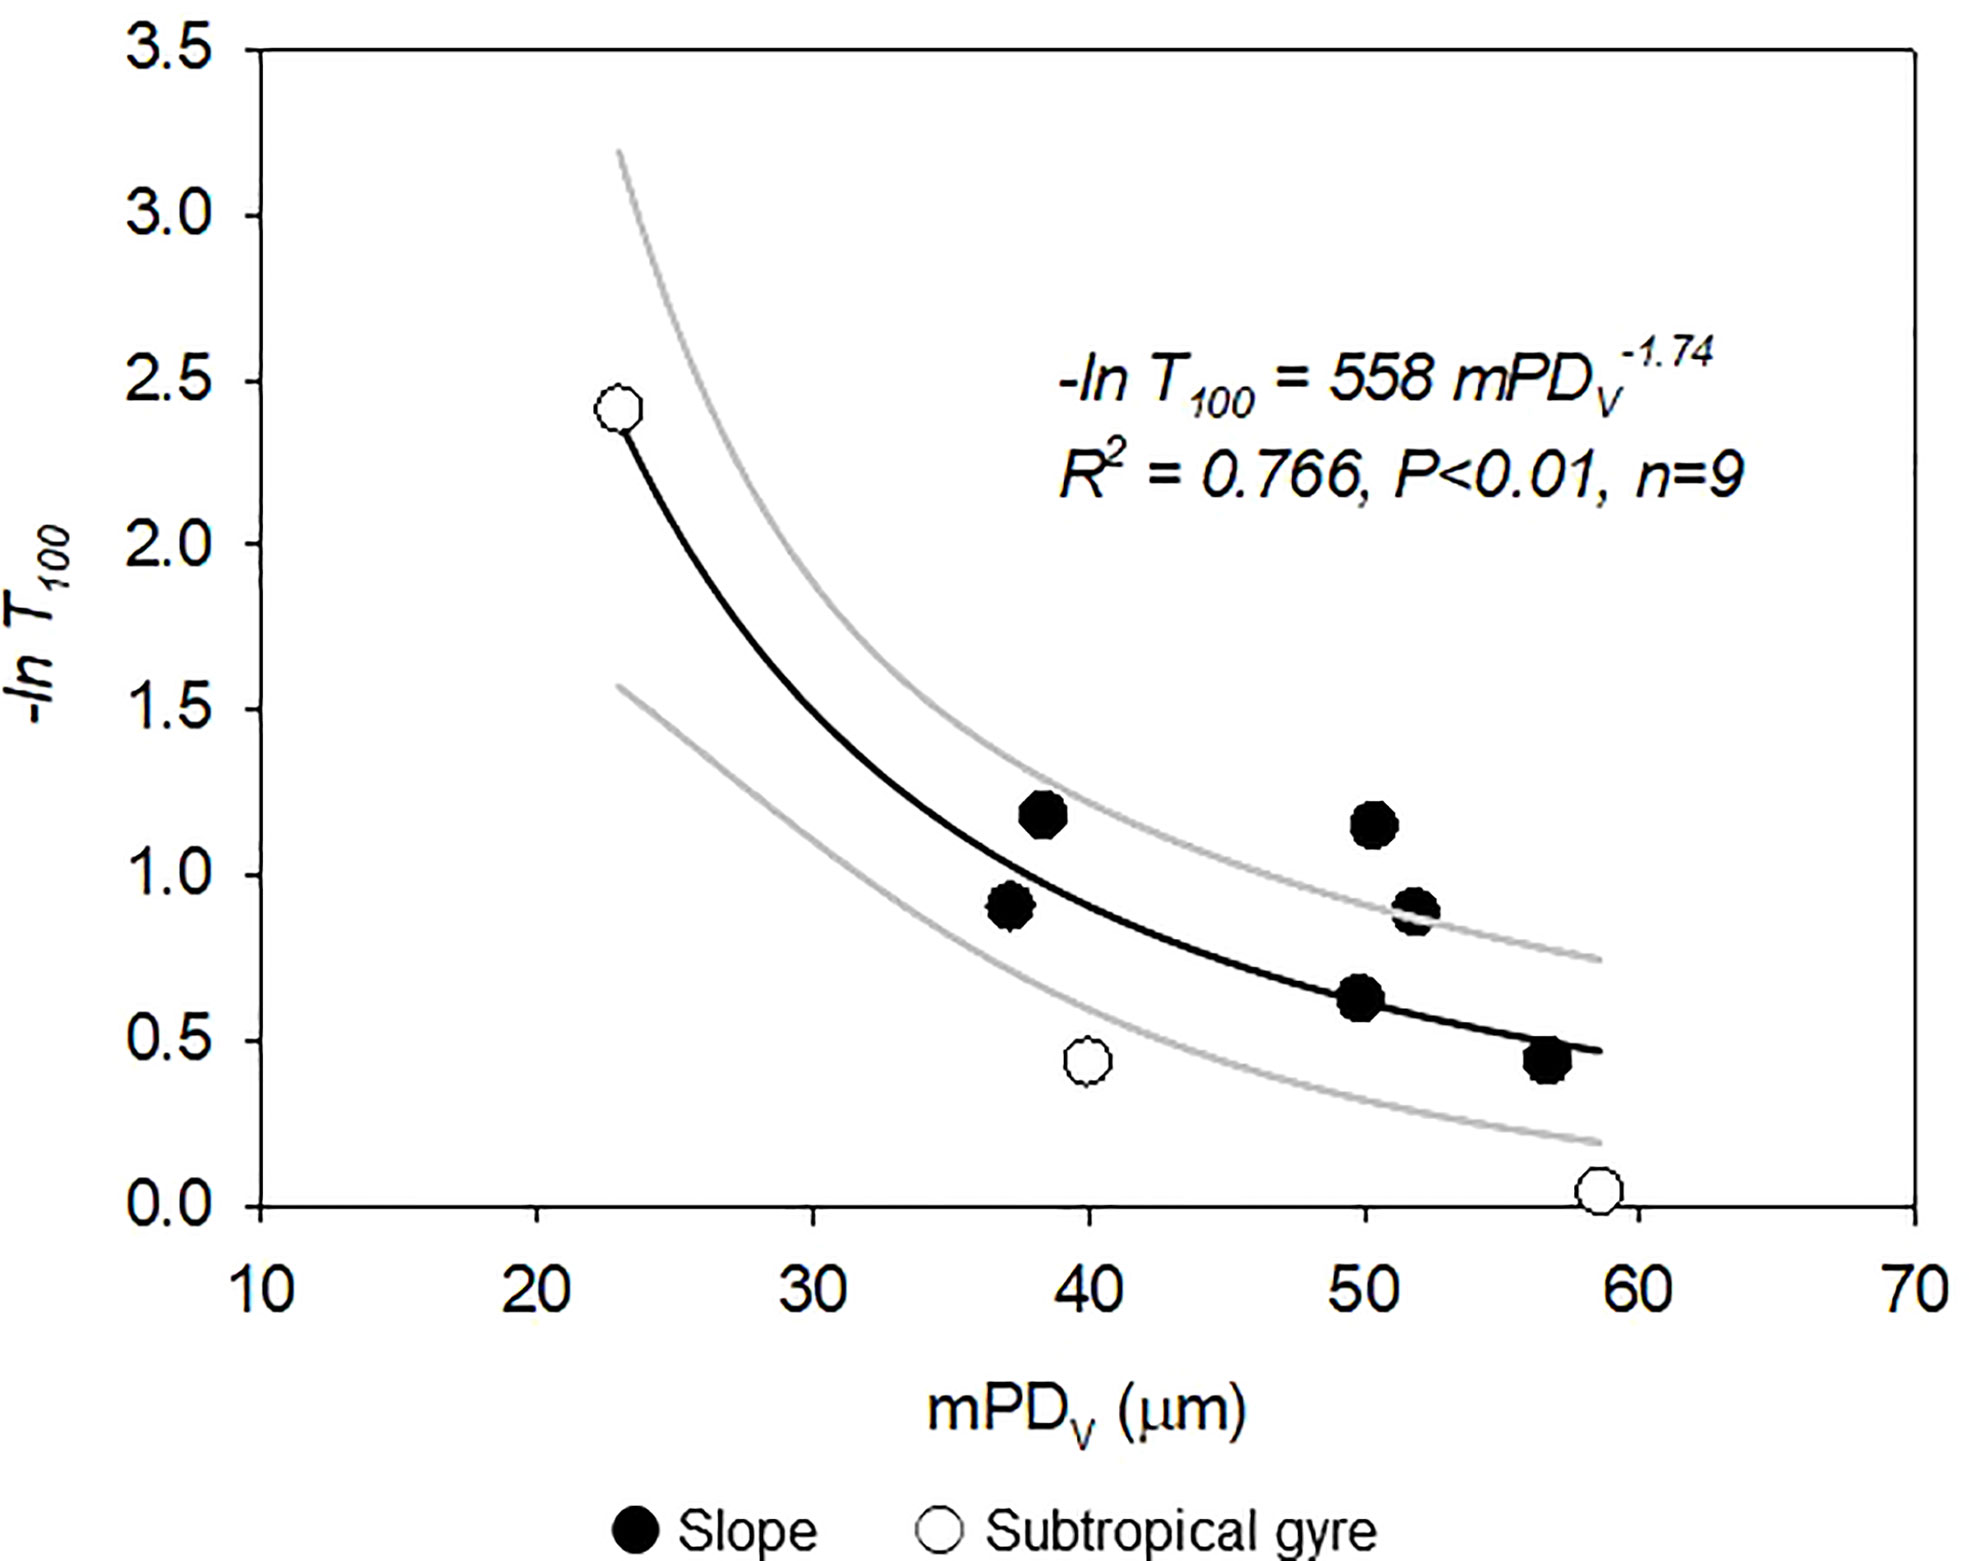
Figure 7 Relationship between −ln T100 and the mean particle diameter of the volumetric particle size distribution (mPDV). Black line indicates non-linear regression following the power-law model (Eq. 5) using the ordinary least squares method for each sampling period. Gray lines indicate the 95% confidence interval.
Figures 6C and 7 show that T100 tended to be greater in the subtropical gyre than in the slope area based on its relationship with mPDV. Among particle properties (POC/PON, Chl a/TPV, POC/TPV, and PON/TPV) within the euphotic layer, only Chl a/TPV showed a significant difference between the two areas (Table 4). Yamada et al. (2021) reported that the ratio of TEP concentration, which has a porous gel like structure, to Chl a concentration was elevated in oligotrophic areas along the Kuroshio Current. Low Chl a/TPV in the subtropical gyre may indicate a smaller contribution of phytoplankton to TPV and lower food quality relative to the slope. In addition, the species composition of planktonic copepods differs between the slope and the subtropical gyre along 138°E with large taxa abundant on the slope (Hirai et al., 2015 and Hirai et al., 2021). Large copepod species (Calanidae and Eucalanidae) were abundant in the copepod community of the slope water and may actively consume sinking particles in the area. These differences in both particle properties and species composition of copepods may affect the dynamics of T100.
Another factor that may affect attenuation of sinking POC flux is water temperature. Marsay et al. (2015) showed that the geographical pattern of flux attenuation is correlated with water temperature, suggesting that the temperature dependence of the biological consumption rate of sinking POC controls flux attenuation. In this study, no significant correlation was found between T100 and mean temperature between Zeu and 100 m below Zeu, which varied from 14.2°C to 22.5°C (Table 6). The Q10 coefficient enables quantification of the temperature sensitivity of bacterial decomposition and zooplankton grazing (Ducklow et al., 2010; Ikeda, 2014). The rate of decomposition, k, at water temperature T can be expressed using Q10:
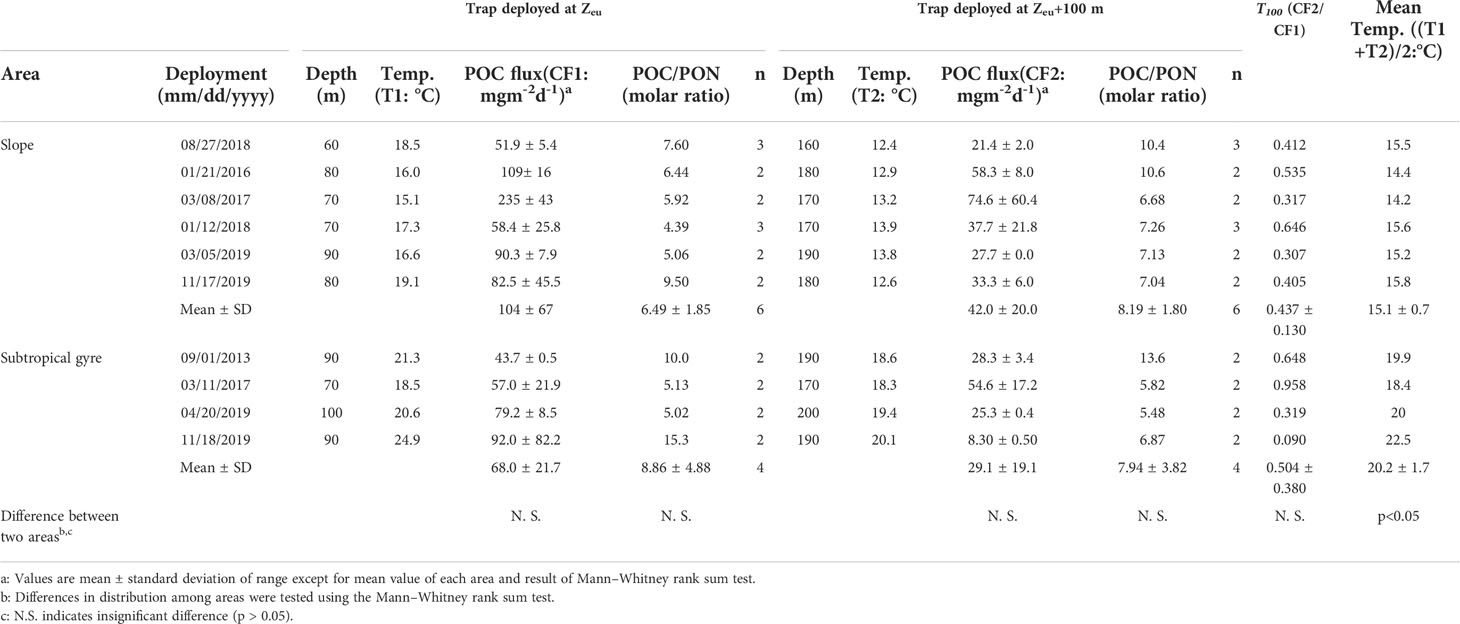
Table 6 The fluxes of particulate organic carbon (POC) and water temperature for each depth, T100 and mean water temperature.
where k0 is the rate of decomposition at the reference water temperature, T0. Typical Q10 values of respiration are 2 and 1.9 for marine bacteria and meso- and microzooplankton, respectively (Ducklow et al., 2010; Ikeda, 2014). If the Q10 temperature coefficient of k is assumed to be 2, k will increase at 1.78 times at the observed temperature increase from 14.2°C to 22.5°C. Thus, the observed range of −ln T100 (0.0429–2.401) was greater than the expected variation in k with increasing temperature.
The LISST instrument observes particles only within a limited size range of 5.2 to 119 μm, which excludes large sinking particles such as marine snow (> 0.5 mm). Furthermore, particles detected using LISST within the euphotic zone could include suspended particles that do not sink. Thus, PSD measured by LISST is not an accurate representation of that of sinking particles. Cael and White (2020) reported that the PSD measured using LISST for particles collected in sediment traps showed a flatter shape than the PSD for suspended particles within the euphotic zone at station ALOHA, indicating that the mean size of sinking particles is greater than that of suspended particles in the euphotic zone. However, Puigcorbé et al. (2015) presented compiled data from the literature showing that flux attenuation tends to be greater for small particles (< 53 μm in diameter) than for large particles (> 53 μm in diameter) in low and mid-latitude areas where pico- and nano-phytoplankton are dominant. Along the Kuroshio Current, pico- and nano-phytoplankton account for a greater proportion than that of diatoms near the axis and on the offshore side of the axis (Endo and Suzuki, 2019). Furthermore, the particle dynamics of the observed size range may propagate to larger particles through aggregation and disaggregation processes (Li et al., 2004; Burd and Jackson, 2009). The relatively rapid attenuation of sinking POC in small particles (< 53 μm diameter) and dynamic changes in particle size may tighten the coupling of PSD measured using LISST with the variability in T100.
However, the mechanism that controls PSD in the slope and subtropical gyre region along the Kuroshio Current remains unclear. No significant correlations were found between either mPDV or ξ and the tested variables (Tables S5, S6). Buonassissi and Dierssen (2010) reported that ξ determined using LISST varied from −4.1 to −2.9, exhibiting a gradual decrease from the shelf, across the Gulf Stream, and into the Sargasso Sea, and had a positive correlation with the Chl a concentration. Yamada et al. (2021) reported a similar range of ξ obtained using LISST (−4.2 to −3.2) along the Kuroshio Current but found a negative correlation between ξ and the Chl a concentration. Those authors also found that the PSD became flatter in the oligotrophic area, with a positive correlation between ξ and the TEP concentration (i.e., at higher TEP concentrations, larger particles make a greater contribution). In this study, ξ showed temporal variability with similar ranges on the onshore and offshore sides of the current along a N+N concentration gradient, although the correlations between Chl a/POC and Chl a concentration and between POC/TPV and TPV (Table S6) suggest that the contribution of phytoplankton to particle volume is lower in the oligotrophic environment. Further research is needed to elucidate PSD dynamics, particle properties (density, stickiness, carbon content and biological availability), and the mechanisms regulating the sinking flux of materials into the deep ocean.
Conclusion
Sediment trap experiments conducted in slope and subtropical gyre areas along the Kuroshio Current, revealed a high variability in the attenuation of sinking POC (T100). The variation in T100 correlated negatively with the magnitude of the sinking flux of POC and positively with mPDV and the slope of PSD (ξ), whereas no significant correlation was found between T100 and water temperature. The power-law relationship between T100 and mPDV suggests that T100 in the vicinity of the Kuroshio Current is regulated by the sinking velocity of particles, although the mechanism controlling mPDV remains unclear. To predict the change in transfer efficiency of the sinking flux of POC in response to future anthropogenic warming, further exploration of PSD dynamics as well as the physicochemical and biological properties of particles is needed.
Data availability statement
The original contributions presented in the study are included in the article/Supplementary Material. Further inquiries can be directed to the corresponding author.
Author contributions
HF, KH, and HS contributed to the conception and design of the study. HF, KH, TS, AK, DA, and HS collected the seawater samples and measured the parameters. HF wrote the first draft of the manuscript. All authors contributed to the article and approved the submitted version.
Funding
This research was supported by SKED and funded by MEXT (Grant Number JPMXD0511102330) and JSPS KAKENHI (Grant Numbers JP19H05667, JP21H03586).
Acknowledgments
We would like to thank the captains and crews of the FRV Soyo-Maru (Fisheries Research Agency) for their support with the sampling. The observations in the program have been conducted under Marine Fisheries Stock Assessment and Evaluation for Japanese Waters, the Fisheries Agency of Japan. We would like to thank the reviewers for their constructive comments and the editor for review of the manuscript.
Conflict of interest
The authors declare that the research was conducted in the absence of any commercial or financial relationships that could be construed as a potential conflict of interest.
Publisher’s note
All claims expressed in this article are solely those of the authors and do not necessarily represent those of their affiliated organizations, or those of the publisher, the editors and the reviewers. Any product that may be evaluated in this article, or claim that may be made by its manufacturer, is not guaranteed or endorsed by the publisher.
Supplementary material
The Supplementary Material for this article can be found online at: https://www.frontiersin.org/articles/10.3389/fmars.2022.875362/full#supplementary-material
References
Agrawal Y. C., Pottsmith H. C. (2000). Instruments for particle size and settling velocity observations in sediment transport. Mar. Geol. 168, 89–114. doi: 10.1016/S0025-3227(00)00044-X
Alldredge A. L., Gotschalk C. (1988). In situ settling behavior of marine snow. Limnol. Oceanogr. 33, 339–351. doi: 10.4319/lo.1988.33.3.0339
Andrews S. W., Nover D. M., Reardon K., Reuter J. E., Schladow S. G. (2011). The influence of ambient light intensity on in situ laser diffractometers. Water Resour. Res. 47, W06509. doi: 10.1029/2010wr009841
Armstrong R. A., Lee C., Hedges J. I., Honjo S., Wakeham S. G. (2002). A new, mechanistic model for organic carbon fluxes in the ocean based on the quantitative association of POC with ballast minerals. Deep Sea. Res. Part II 489, 219–236.
Bader H. (1970). The hyperbolic distribution of particle sizes. J. Geophys. Res. 75, 2822–2830. doi: 10.1029/JC075i015p02822
Boyd P. W., Claustre H., Levy M., Siegel A. A., Weber T. (2019). Multi-faceted particle pumps drive carbon sequestration in the ocean. Nature 568, 327–335. doi: 10.1038/s41586-019-1098-2
Boyd P. W., Newton P. P. (1999). Does planktonic community structure determine downward particulate organic carbon flux in different oceanic provinces? Deep Sea Res. Part I 46, 63–91.
Boyd P. W., Trull T. (2007). Understanding the export of marine biogenic particles: Is there consensus? Prog. Oceanogr. 72, 276–312.
Buesseler K. O., Boyd P. W. (2009). Shedding light on processes that control particle export and flux attenuation in the twilight zone of the open ocean. Limnol. Oceanogr. 54, 1210–1232. doi: 10.4319/lo.2009.54.4.1210
Buesseler K. O., Boyd P. W., Black E. E., Siegel D. A. (2020). Metrics that matter for assessing the ocean biological carbon pump. Proc. Natl. Acad. Sci. U S A. 117, 9679–9687. doi: 10.1073/pnas.1918114117
Buonassissi C. J., Dierssen H. M. (2010). A regional comparison of particle size distributions and the power law approximation in oceanic and estuarine surface waters. J. Geophys. Res. 115, C10028. doi: 10.1029/2010jc006256
Burd A. B., Jackson G. A. (2009). Particle aggregation. Ann. Rev. Mar. Sci. 1, 65–90. doi: 10.1146/annurev.marine.010908.163904
Cael B. B., White A. E. (2020). Sinking versus suspended particle size distributions in the north pacific subtropical gyre. Geophys. Res. Lett. 47, e2020GL087825. doi: 10.1029/2020gl087825
Cavan E. L., Laurenceau-Corneca E. C., Bressaca M., Boyda P. W. (2019). Exploring the ecology of the mesopelagic biological pump. Prog. Oceanogr. 176, 102125. doi: 10.1016/j.pocean.2019.102125
Cram J. A., Weber T., Leung S. W., McDonnell A. M. P., Liang J.-H., Deutsch C. (2018). The role of particle size, ballast, temperature, and oxygen in the sinking flux to the deep sea. Global Biogeochem. Cycles 32, 858–876. doi: 10.1029/2017GB005710
de Boyer Montegut C., Madec G., Fischer A. S., Lazar A., Iudicone D. (2004). Mixed layer depth over the global ocean: An examination of profile data and a profile-based climatology. J. Geophys. Rese. Oceans 109, C12003. doi: 10.1029/2004JC002378
Ducklow H. W., Morán X. A. G., Murray A. E. (2010). “Bacteria in the greenhouse: Marine microbes and climate change,” in Environmental microbiology, 2nd ed. Eds. Mitchell R., Gu J.-D. (Hoboken, NJ: John Wiley & Sons, Inc), 1–31.
Endo H., Suzuki K. (2019). “Spatial variations in community structure of haptophytes across the kuroshio front in the tokara strait,” in Kuroshio current. Eds. Nagai T., Saito H., Suzuki K., Takahashi M. (Washington, DC: JohnWiley & Sons), 207–221.
Fender C. K., Kelly T. B., Guidi L., Ohman M. D., Smith M. C., Stukel M. R. (2019). Investigating particle size-flux relationships and the biological pump across a range of plankton ecosystem states from coastal to oligotrophic. Front. Mar. Sci. 6, 603. doi: 10.3389/fmars.2019.00603
Fuchs H. L., Franks P. J. S. (2010). Plankton community properties determined by nutrients and size-selective feeding. Mar. Ecol. Prog. Ser. 413, 1–15. doi: 10.3354/meps08716
Gardner W. D. (2000). “Sediment trap sampling in surface waters,” in The changing ocean carbon cycle: A midterm synthesis of the joint global ocean flux study. Eds. Hanson R. B., Ducklow H. W., Field J. G. (Cambridge: Cambridge University Press), 240–281.
Gorsky G., Chrétiennot-Dinet M. J., Blanchot J., Palazzoli I. (1999). Picoplankton and nanoplankton aggregation by appendicularians: Fecal pellet contents of megalocercus huxleyi in the equatorial pacific. J. Geophys. Res. 104, 3381–3390. doi: 10.1029/98JC01850
Green R. E., Bower A. S., Lugo-Fernández A. (2014). First autonomous bio-optical profiling float in the gulf of Mexico reveals dynamic biogeochemistry in deep waters. PloS One 9, e101658. doi: 10.1371/journal.pone.0101658
Guidi L., Legendre L., Reygondeau G., Uitz J., Stemmann L., Henson S. A. (2015). A new look at ocean carbon remineralization for estimating deep water sequestration. Global Biogeo. Chem. Cycles 29, 1044–1059. doi: 10.1002/2014GB005063
Guidi L., Stemmann L., Jackson G. A., Ibanez F., Claustre H., Legendre L., et al. (2009). Effects of phytoplankton community on production, size, and export of large aggregates: A world-ocean analysis. Limnol. Oceanogr. 54, 1951–1963. doi: 10.4319/lo.2009.54.6.1951
Hirai J., Kuriyama M., Ichikawa T., Hidaka K., Tsuda A. (2015). A metagenetic approach for revealing community structure of marine planktonic copepods. Mol. Ecol. Resour. 15, 68–80. doi: 10.1111/1755-0998.12294
Hirai J., Yamazaki K., Hidaka K., Nagai S., Shimizu Y., Ichikawa T. (2021). Characterization of diversity and community structure of small planktonic copepods in the kuroshio region off Japan using a metabarcoding approach. Mar. Eco. Prog. Ser. 657, 25–41. doi: 10.3354/meps13539
Honda M. H., Kawakami H., Matsumoto K., Wakita M., Fujiki T., Mino Y., et al. (2016). Comparison of sinking particles in the upper 200 m between subarctic station K2 and subtropical station S1 based on drifting sediment trap experiments. J. Oceanogr. 72, 373–386. doi: 10.1007/s10872-015-0280-x
Ikeda T. (2014). Respiration and ammonia excretion by marine metazooplankton taxa: synthesis toward a global-bathymetric model. Mar. Biol. 161, 2753–2766. doi: 10.1007/s00227-014-2540-5
Kaneko H., Yasuda I., Komatsu K., Itoh S. (2013). Observations of vertical turbulent nitrate flux across the kuroshio. Geophys. Res. Lett. 40, 3123–3127. doi: 10.1002/grl.50613
Knauer G. A., Martin J. H., Bruland K. W. (1979). Fluxes of particulate carbon, nitrogen, and phosphorus in the upper water column of the northeast pacific. Deep-Sea Res. 26, 97–108. doi: 10.1016/0198-0149(79)90089-X
Kodama T., Shimizu Y., Ichikawa T., Hiroe Y., Kusaka A., Morita H., et al. (2014). Seasonal and spatial contrast in the surface layer nutrient content around the kuroshio along 138oE, observed between 2002 and 2013. J. Oceanogr. 70, 489–503. doi: 10.1007/s10872-014-0245-5
Kostadinov T. S., Siegel D. A., Maritorena S. (2009). Retrieval of the particle size distribution from satellite ocean color observations. J. Geophys. Res. 114, C09015. doi: 10.1029/2009jc005303
Lee-Sánchez E., Camacho-Ibar V. F., Velásquez-Aristizábal J. A., Valencia-Gasti J. A., Samperio-Ramos G. (2022). Impacts of mesoscale eddies on the nitrate distribution in the deep-water region of the gulf of Mexico. J. Mar. Syst. 229, 103721. doi: 10.1016/j.jmarsys.2022.103721
Li X. Y., Zhang J. J., Lee J. H. (2004). Modelling particle size distribution dynamics in marine waters. Water Res. 38, 1305–1317. doi: 10.1016/j.watres.2003.11.010
Lomas M. W., Moran S. B. (2011). Evidence for aggregation and export of cyanobacteria and nano-eukaryotes from the Sargasso Sea euphotic zone. Biogeosciences 8, 203–216. doi: 10.5194/bg-8-203-2011
Lundgreen R. B. C., Jaspers C., Traving S. J., Ayala D. J., Lombard F., Grossart H., et al. (2019). Eukaryotic and cyanobacterial communities associated with marine snow particles in the oligotrophic Sargasso Sea. Sci. Rep. 9, 8891. doi: 10.1038/s41598-019-45146-7
Lutz M., Dunbar R., Caldeira K. (2002). Regional variability in the vertical flux of particulate organic carbon in the ocean interior. Global Biogeochem. Cycles 16, 1037. doi: 10.1029/2000GB001383
Mari X., Passow U., Migon C., Burd A. B., Legendre L. (2017). Transparent exopolymer particles: effects on carbon cycling in the ocean. Prog. Oceanogr. 151, 13–37. doi: 10.1016/j.pocean.2016.11.002
Marsay C. M., Sanders R. J., Henson S. A., Pabortsava K., Achterberg E. P., Lampitt R. S. (2015). Attenuation of sinking particulate organic carbon flux through the mesopelagic ocean. Proc. Natl. Acad. Sci. U S A. 112, 1089–1094. doi: 10.1073/pnas.1415311112
Nagai T., Durán G. S., Otero D. A., Mori Y., Yoshie N., Ohgi K., et al. (2019). How the kuroshio current delivers nutrients to sunlit layers on the continental shelves with aid of near-inertial waves and turbulence. Geophys. Res. Lett. 46, 6726–6735. doi: 10.1029/2019gl082680
Nagata T., Yamada Y., Fukuda H. (2021). Transparent exopolymer particles in deep oceans: synthesis and future challenges. Gels 7, 75. doi: 10.3390/gels7030075
Omand M. M., Govindarajan R., Jing H., Mahadevan A. (2020). Sinking flux of particulate organic matter in the oceans: Sensitivity to particle characteristics. Sci. Rep. 10, 5582. doi: 10.1038/s41598-020-60424-5
Owens S. A., Buesseler K. O., Lamborg C. H., Valdes J., Lomas M. W., Johnson R. J., et al. (2013). A new time series of particle export from neutrally buoyant sediments traps at the Bermuda Atlantic time-series study site. Deep-Sea Res. I 72, 34–47. doi: 10.1016/j.dsr.2012.10.011
Passow U. (2002). Transparent exopolymer particles (TEP) in aquatic environments. Prog. Oceanogr. 55, 287–333. doi: 10.1016/S0079-6611(02)00138-6
Puigcorbé V., Benitez-Nelson C. R., Masqué P., Verdeny E., White A. E., Popp B. N., et al. (2015). Small phytoplankton drive high summer time carbon and nutrient export in the gulf of California and Eastern tropical north pacific. Global Biogeochem. Cycles 29, 1309–1332. doi: 10.1002/2015GB005134
Stamieszkin K., Poulton N. J., Pershing A. J. (2017). Zooplankton grazing and egestion shifts particle size distribution in natural communities. Mar. Ecol. Prog. Ser. 575, 43–56. doi: 10.3354/meps12212
Stukel M. R., Kelly T., Landry M. R., Selph K. E., Swalethorp R. (2021). Sinking carbon, nitrogen, and pigment flux within and beneath the euphotic zone in the oligotrophic, open-ocean gulf of Mexico. J. Plankton Res., fbab001. doi: 10.1093/plankt/fbab001
Styles R. (2006). Laboratory evaluation of the LISST in a stratified fluid. Mar. Geol. 227, 151–162. doi: 10.1016/j.margeo.2005.11.011
Suess E. (1980). Particulate organic carbon flux in the oceans — surface productivity and oxygen utilization. Nature 288, 260–263. doi: 10.1038/288260a0
Sugisaki H., Nonaka M., Ishizaki S., Hidaka K., Kameda T., Hirota Y., et al. (2010). “Status and trends of the kuroshio region 2003–2008,” in Marine ecosystems of the north pacific ocean 2003–2008. Eds. McKinnell S. M., Dagg M. J. (Sidney, British Columbia: North Pacific Marine Science Organization), 330–359.
Suzuki R., Ishimaru T. (1990). An improved method for the determination of phytoplankton chlorophyll using n, n-dimethylformamide. J. Oceanogr. Soc Japan 46, 190–194. doi: 10.1007/BF02125580
Turner T. (2015). Zooplankton fecal pellets, marine snow, phytodetritus and the ocean’s biological pump. Prog. Oceanogr. 130, 205–248. doi: 10.1016/j.pocean.2014.08.005
Welschmeyer N. A. (1994). Fluorometric analysis of chlorophyll-a in the presence of chlorophyll-b and pheopigments. Limnol. Oceanogr. 39, 1985–1992. doi: 10.4319/lo.1994.39.8.198
White J. (1990). The use of sediment traps in high-energy environments. Mar. Geophys. Res. 12, 145–152. doi: 10.1007/BF00310569
White A. E., Letelier R. M., Whitmire A. L., Barone B., Bidigare R. R., Church M. J., et al. (2015). Phenology of particle size distributions and primary productivity in the north pacific subtropical gyre (Station ALOHA). J. Geophys. Res. Oceans 120, 7381–7399. doi: 10.1002/2015JC010897
Yamada Y., Fukuda H., Uchimiya M., Motegi C., Nishino S., Kikuchi T., et al. (2015). Localized accumulation and a shelf-basin gradient of particles in the chukchi Sea and Canada basin, western Arctic. J. Geophys. Res. Oceans 120, 4638–4653. doi: 10.1002/2015jc010794
Yamada Y., Fukuda H., Umezawa Y., Nagata T. (2021). Geographic variation of particle size distribution in the kuroshio region: Possible causes in the upper water column. Front. Mar. Sci. 8, 768766. doi: 10.3389/fmars.2021.768766
Yokouchi K., Tsuda A., Kuwata A., Kasai H., Ichikawa T., Hirota Y., et al. (2006). “Simulated in situ measurements of primary production in Japanese waters,” in Global climate change and response of carbon cycle in the equatorial pacific and Indian oceans and adjacent land masses. Eds. Kawahata H., Awata Y. (Oxford: Elsevier), 65–83.
Keywords: ocean carbon cycling, biological pump, sinking POC flux, sediment trap, slope of particle size distribution, Kuroshio
Citation: Fukuda H, Hidaka K, Setou T, Kusaka A, Ambe D and Saito H (2022) Temporal and regional variabilities in the attenuation of sinking particulate organic carbon in the Kuroshio region. Front. Mar. Sci. 9:875362. doi: 10.3389/fmars.2022.875362
Received: 14 February 2022; Accepted: 19 August 2022;
Published: 13 September 2022.
Edited by:
Wei-Jen Chen, National Taiwan University, TaiwanReviewed by:
Stella Psarra, Hellenic Centre for Marine Research (HCMR), GreeceMonique Messié, Monterey Bay Aquarium Research Institute (MBARI), United States
Copyright © 2022 Fukuda, Hidaka, Setou, Kusaka, Ambe and Saito. This is an open-access article distributed under the terms of the Creative Commons Attribution License (CC BY). The use, distribution or reproduction in other forums is permitted, provided the original author(s) and the copyright owner(s) are credited and that the original publication in this journal is cited, in accordance with accepted academic practice. No use, distribution or reproduction is permitted which does not comply with these terms.
*Correspondence: Hideki Fukuda, aGZ1a3VkYUBhb3JpLnUtdG9reW8uYWMuanA=