 Kui-Ching Hsu1†
 Mu-Rong Yi1,2†
 Sui Gu1
 Xiong-Bo He1,2
 Zhi-Sen Luo1
 Bin Kang3
 Hung-Du Lin4*Yun-Rong Yan1,2,5,6*
- 1College of Fisheries, Guangdong Ocean University, Zhanjiang, China
- 2Marine Resources Big Data Center of South China Sea, Southern Marine Science and Engineering Guangdong Laboratory, Zhanjiang, China
- 3Fisheries College, Ocean University of China, Qingdao, China
- 4Department of Biology, The Affiliated School of National Tainan First Senior High School, Tainan, Taiwan
- 5Guangdong Provincial Engineering and Technology Research Center of Far Sea Fisheries Management and Fishing of South China Sea, Guangdong Ocean University, Zhanjiang, China
- 6Center of Marine Fisheries Information Technology, Shenzhen Institute of Guangdong Ocean University, Shenzhen, China
Sequences of the complete mitochondrial cytochrome oxidase subunit I gene were used to identify Trichiurus species and examine their population genetic structure and demographic history along the coast of China. Three Trichiurus species were found. Trichiurus japonicus lives in colder waters along the continental shelves in the China Seas, while Trichiurus nanhaiensis lives warmer waters along continental slopes in the South China Sea, and Trichiurus brevis lives in shallow and warmer waters in the South China Sea. The migrations of these species were mainly associated with feeding and spawning preferences. Two major wintering and spawning grounds in the East China Sea and South China Sea were found. All species showed a lack of population genetic structure resulting from their oceanodromous life cycle (the degree of population substructure index NST = 0.000–0.149), but the results of approximate Bayesian computational approaches suggested population declines or stabilization and differentiation. The results of the TMRCA (time to the most recent common ancestor) showed that during glaciations, the Yellow Sea and the East China Sea were completely exposed, and the South China Sea acted as a refugium. Thus, the populations of these three species experienced differentiation during glaciations. This study also examined the limitations of Bayesian skyline plot analysis.
Introduction
Marine fisheries, namely, capture fisheries and aquacultural operations, are sources of nutrients for improving human health and play a critical role in sustaining marine ecosystem function (FAO, 2016). China has the largest fishing production in the world. After the mid-1990s, the estimated total annual production of its fisheries accounted for 30% of global fisheries production, and currently, its aquaculture accounts for more than 60% of global aquaculture production (FAO, 2012; FAO, 2016). Hairtail fish, belonging to the genus Trichiurus (Dai-yu in Chinese), are the largest component of Chinese marine fisheries, but production of this species dramatically declined from 118.68 MT (million ton) in 2010 to 90.85 MT in 2019, with the economic value decreasing from 41.80 billion yuan to 36.93 billion yuan in 2019 (Kang et al., 2018; http://baogao.chinabaogao.com/shuichangqilei/425619425619.html). Thus, it is important to understand the population genetic diversity, structure, and demography of the genus Trichiurus to implement resource management policies.
Because hairtail fish are an essential commercial fish in the China Seas, many studies on the systematics, growth, genetic diversity, and demographic history of Trichiurus species in the China Seas have been conducted (e.g., Tzeng et al., 2007; Hsu et al., 2009; Shih et al., 2010; He et al., 2014), but some questions about Trichiurus species in the China Seas are still unresolved. First, how many species of the genus Trichiurus inhabit the China Seas? Trichiurus species have similar body appearances and silvery coloration, as well as unresolved taxonomy. There are 31 nominal species in the genus Trichiurus, but only nine are valid species (Froese and Pauly, 2021). Many studies have suggested that Clupea haumela Fabricius, 1775 is a synonym of T. lepturus (e.g., Nakamura and Parin, 1993; Golani and Fricke, 2018; Nakamura and Parin, 2001; Froese and Pauly, 2021). However, a recently published study (Zheng et al., 2019) mentioned this species as a valid Trichiurus species without taxonomic evidence and presented its complete mitochondrial genome. Additionally, many studies (e.g., Tucker, 1956; Nakamura and Parin, 1993; Nelson, 1994; Froese and Pauly, 2021) have suggested that T. japonicus Temminck and Schlegel, 1844 is synonymous with T. lepturus, but other studies (e.g., Lee et al., 1977; Nakabo, 2000; Chakraborty et al., 2006; Tzeng et al., 2007; Hsu et al., 2009; Eschmeyer, 2014; He et al., 2014) have suggested that T. japonicus is a valid species. There are thus several outstanding questions regarding the systematics and distributional patterns of Trichiurus species. Clear species identification for fishing has been the subject of a major FAO program since the 1960s. Thus, this study surveyed Trichiurus species in the China Seas by using morphology and DNA barcoding.
Second, one of the major questions addressed in this study is the population genetic structure and diversity of each Trichiurus species along the coastline of China. In contrast to results reported in other allopatric species, many previous studies have proposed genetic differentiation among the Yellow Sea (YS), East China Sea (ECS), and South China Sea (SCS) (Liu et al., 2007; Xu et al., 2009; Zhong et al., 2009). Previous phylogeographic studies have proposed that the population differentiation and speciation in the China Seas were shaped by landform changes during Pliocene and Pleistocene glacial cycles (Kizaki and Oshiro, 1980; Ota, 1994; Wang, 1999; Voris, 2000; Yang et al., 2017; Qu et al., 2018), although some studies found no significant genetic differentiation among the seas (He et al., 2015; Wang X. et al., 2017). Moreover, Jaureguizar et al. (2004) proposed that the major aims of fish migrations are related to seasonal (e.g., Trichiurus lepturus and Discopyge tschudii) and reproductive needs (e.g., Micropogonias furnieri, Mustelus schmitti, and Cynoscion guatucupa). Previous studies have suggested that temperature and salinity have the strongest influence on the seasonal structure of species composition (Jaureguizar et al., 2004; Liu et al., 2020; Hou et al., 2021). Thus, our study will investigate the migration patterns of each Trichiurus species along the coastline of China and whether these migrations are shaped by environmental factors, including ocean currents. Additionally, He et al. (2014) suggested that cyclic climate changes have shaped the demographic history of two Trichiurus species in the China Seas and found that for T. japonicus as a whole, a Bayesian skyline plot (BSP) revealed two episodes of population growth, and for T. nanahaiensis in the northern SCS, a BSP revealed a steady population decline. However, Kang et al. (2018) proposed that the production of the Trichiurus hairtail fish has dramatically declined. Thus, our study examines whether demography has changed and whether some populations are exposed to more pressure based on genetic evidence.
To address the above problems, the mitochondrial DNA (mtDNA) cytochrome c oxidase subunit I (COI) gene was used to identify species and investigate the genetic diversity and structure of Trichiurus species in the China Seas. Sequences of mtDNA are often analyzed in studies of animal phylogeography (Yang et al., 2016; Chiu et al., 2017; Han et al., 2019). Among all the mtDNA genes, the COI gene is the most widely accepted marker for evaluating the levels of genetic diversity and differentiation (Chiu et al., 2017; Wang X. et al., 2017; Liao et al., 2021). Additionally, Hebert et al. (2004) proposed “DNA barcoding” as a way to identify species. The COI gene has proven highly effective in identifying birds, butterflies, fishes, and many other animal groups (Hebert et al., 2004). The major questions addressed in our study are as follows: (1) How many Trichiurus species are there along the coast of China? (2) What is the current population structure and demography of Trichiurus species in the China Seas? The study informed conservation management policies for Trichiurus species in the China Seas.
Materials and Methods
Sampling and Data Collection
A total of 1,224 specimens of the genus Trichiurus were collected from 17 fishing ports in the China Seas in the fall (September and October) of 2018 with longline, gill, and trawl nets by fishermen (Figure 1A; Table 1). The localities were classified into three seas. Six sampling localities were established off the coast of the YS: (1) Dondog, DD; (2) Dalian, DL; (3) Weihai, WH; (4) Qingdao, QD; (5) Lianyungang, LY; and (6) Nantong, NT. Four sampling localities were established off the coast of the ECS: (7) Zhoushan, ZS; (8) Wenzhou, WZ; (9) Ningde, ND; and (10) Quanzhou, QZ. Seven sampling localities were established off the coast of the SCS: (11) Shantou, ST; (12) Shenzhen, SZ; (13) Yangjiang, YJ; (14) Zhanjiang; ZJ; (15) Beihai, BH; (16) Wenchang, WC; and (17) Sanya, SY (Table 1; Figure 1A). The COI gene was amplified by polymerase chain reaction (PCR) using the primers Fish-F2 (5’-ACCTCTGTGTGTGGGGCTAC-3’) and Fish-R2 (5’-GTGATGCATTGGCTTGAAA-3’) (Gu et al., 2021). Each 50 µl PCR mixture contained 5 ng of template DNA, 5 µl of 10× reaction buffer, 4 µl of dNTP mix (10 mM), 5 pmol of each primer and 2 U of Taq polymerase (TaKaRa Biomedical Technology, Beijing). PCR was carried out on an MJ Thermal Cycler with one cycle of denaturation at 94°C for 3 min and 40 cycles of denaturation at 94°C for 30 s, annealing at 51°C for 30 s, and extension at 72°C for 1 min 30 s, followed by a 72°C extension for 10 min and storage at 4°C. The purified PCR products were sequenced using an ABI 377 automated sequencer (Applied Biosystems, Foster City, CA, USA). The chromatograms were checked with Chromas software (Technelysium), and the sequences were manually edited using BioEdit 6.0.7 (Hall, 1999).
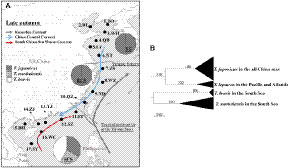
Figure 1 (A) The 17 sampling localities of the genus Trichiurus along the coastal areas of the China Seas are indicated by •. See Table 1 for the site names. The dashed lines represent the boundaries between the Yellow Sea (YS) and the East China Sea (ECS) (Yangtze Estuary), and between the ECS and the South China Sea (SCS). The pie charts represent the species composition of hairtail (T. japonicus in dark gray, T. nanhaiensis in light gray, and T. brevis in white) in three seas. (B) The neighbor-joining (NJ) tree of these four Trichiurus species is based on the COI gene. The numbers at the nodes are bootstrap values. The sampling size (n) is indicated in parentheses.

Table 1 Genetic diversity in the species of the genus Trichiurus along China Seas.
Genetic Variability and Structure
The nucleotide sequences were aligned with Clustal X 1.81 (Thompson et al., 1997). The selection of the best-fitting nucleotide substitution models was performed using the Bayesian information criterion (BIC) in jModelTest 2.0 (Darriba et al., 2012). The most appropriate nucleotide substitution model was GTR + I + G. Phylogenetic analysis was used to identify the species in MEGA-X (Kumar et al., 2018). The intrapopulation genetic diversity levels were estimated using haplotype diversity (h) (Nei and Tajima, 1983) and nucleotide diversity (θπ) indices (Jukes and Cantor, 1969) in DnaSP v5 (Librado and Rozas, 2009). The existence of a phylogeographic structure was examined following the method of Pons and Petit (1996) by calculating the two genetic differentiation indices (GST and NST) in DnaSP. GST, or genetic differentiation among populations, depends only on the frequencies of the haplotypes. NST, the degree of substructure, is influenced by both haplotype frequencies and the distances between haplotypes.
Demographic History
The demographic histories of hairtail fish were reconstructed using four different approaches. First, we performed Tajima’s D and Fu’s FS neutrality tests (Tajima, 1989; Fu, 1997) in DnaSP. Under a population expansion model, significant negative values for Tajima’s D and Fu’s FS neutrality tests were expected. Statistical significance was tested using 10,000 permutations. Second, the mismatch distribution (Rogers and Harpending, 1992) was estimated under the assumption of sudden expansion as implemented in Arlequin. The sum of squared deviations (SSD) between observed and expected mismatched distributions, the raggedness index (Rg), and the Ramos-Onsins and Rozas (R2) statistic were used as test statistics with 1,000 bootstrap replicates. In the third approach, we reconstructed historical demography using the coalescent-based Bayesian skyline plot (BSP) approach implemented in BEAST (Drummond et al., 2013). A stick clock model with a Bayesian skyline tree was used. We ran 106 generations. The time to the most recent common ancestor (TMRCA) was also calculated using BEAST. A mutation rate of 0.55% per million years (myr) has been estimated for the mtDNA COI gene in electric fish (Picq et al., 2014). This rate falls within the range of values previously reported for other freshwater fishes (Webb et al., 2004). The burn-in and plots for each analysis were visualized using Tracer v1.6 (Rambaut et al., 2013) to determine whether the convergence and suitable effective sample sizes were achieved for all parameters. This software was also used to generate skyline plots.
Finally, we performed an approximate Bayesian computation (ABC) with DIYABC v.2.0 software (Cornuet et al., 2014) to detect population size changes and then infer demographic parameters. To examine past transitions in effective population size, our study tested six population demographic scenarios. The scenarios were as follows:
In scenario A (the constant model), the effective population size was constant at N1 from the present to the past.
In scenario B (the decline model), the effective population size changed from Na to N1 at t, and Na was larger than N1.
In scenario C (the expansion model), the effective population size changed from Na to N1 at t, and Na was smaller than N1.
In scenario D (the isolation and constant model), the populations were isolated, and the effective population size was constant at N1 from the present to the past.
In scenario E (the isolation and decline model), the populations were isolated, the effective population size changed from Na to N1 at t, and Na was larger than N1.
In scenario F (the isolation and expansion model), the populations were isolated, the effective population size changed from Na to N1 at t, and Na was smaller than N1.
For all analyses, the reference table was built with 1,000,000 simulated datasets per scenario using the following summary statistics: one-sample statistics for the number of haplotypes, Tajima’s D, the mean number of pairwise differences, the variance of pairwise differences, and the number of segregating sites; and two-sample statistics for the mean of within-sample pairwise differences, the mean of between-sample pairwise differences, the number of segregating sites, and FST between samples. The posterior probabilities were compared by logistic regression. Additionally, the DIYABC program was used to estimate the population size of the ancestral populations of each species or metapopulation.
Migrations
Population genetic connectivity was assessed using the Bayesian MCMC method implemented in MIGRATE-N 4.4.3 (Beerli, 2016). MIGRATE-N calculates the mutation-scaled population size (θ = 2Neμ for haploid mtDNA) and immigration rate (M = m/μ) for each area. Within T. japonicus, all sampling populations were separated into three metapopulations based on three oceanographic areas: the YS, ECS, and SCS. Four models of dispersal were first evaluated:
M1 is a full migration model with three population sizes and six immigration rates.
M2 is a source–sink model with three population sizes and three directional north-to-south immigration rates.
M3 is a source–sink model with three population sizes and three directional south-to-north immigration rates.
M4 is an island model where all areas share a single mean estimate of θ and exchange genes with all other areas at the same mean rate.
The models were ranked by log Bayes factors (LBFs), which compare the marginal likelihoods of models calculated using the thermodynamic integration method. The most useful information is found in the model ranked first. The effective number of immigrants per generation was calculated for haploid data with female transmission following the equation Nm = θ × M. The MIGRATE-N program was also used to estimate the emigration and immigration of each population to better understand migration among populations. In these analyses, we ignored some populations that included too few samples, for example, population ZJ of T. nanhaiensis, population BH of T. brevis, and populations ST, ZJ, and WC of T. japonicus (Table 1). Finally, to examine whether the migrations of T. japonicus corresponded to feeding, our study also checked whether the stomach was empty and estimated the ratio of empty stomachs in each population.
Results
Species Identification
A total of 1,224 hairtail fish were collected from 17 fishing ports along the China Seas (Figure 1A). Species were first identified by morphology. Two species groups were recognized: the T. lepturus complex, which has an anal opening positioned vertically at the 38th to 41st dorsal fin rays, and the T. russelli complex, which has an anal opening positioned vertically at the 34th to 35th dorsal fin rays (Table 2) (Burhanuddin et al., 2002). Within the T. lepturus complex, T. japonicus has a longer tail, and T. lepturus has a whitish dorsal fin when fresh; in contrast, T. nanhaiensis has a yellowish-green dorsal fin (Hsu et al., 2009); the frontal bone of T. nanhaiensis is very smooth, the frontal bone of T. japonicus is slightly inverted, and the frontal bone of T. lepturus is obviously inverted and bulges in the upper part of the orbit and is accompanied by indentation (Figures S1, S2; Yi et al., 2022). A total of 1,551 bp of the COI gene was sequenced. The nucleotide sequences were A+T rich (53.3%). To identify species, these sequences were analyzed by phylogenetic analysis and BLAST of the National Center for Biotechnology Information (NCBI, https://www.ncbi.nlm.nih.gov). The neighbor-joining (NJ) tree showed that these 1,224 COI sequences in the China Seas fell into three phylogroups (Figure 1B). Compared with the sequences in GenBank, these three phylogroups were identified as three species belonging to two species complexes: T. nanhaiensis and T. japonicus in the T. lepturus complex and T. brevis in the T. russelli complex. Trichiurus nanhaiensis and T. brevis are found only in the SCS, and the China Seas harbor T. japonicus (Figure 1A; Table 1).
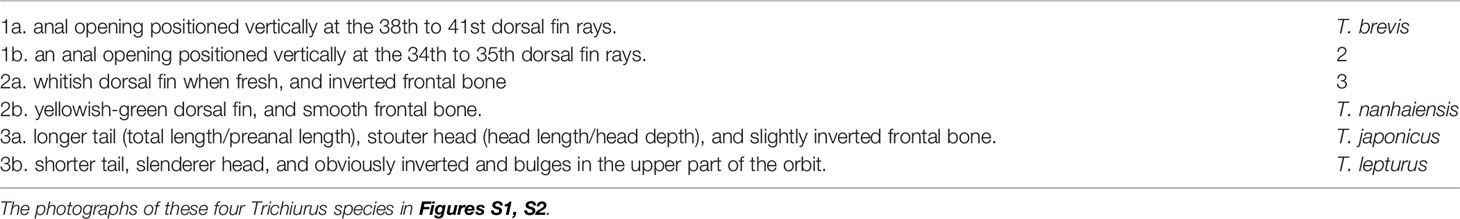
Table 2 The identification keys of four Trichiurus species in Northwest Pacific.
Population Genetic Diversity and Structure
In total, 127 COI haplotypes from 203 specimens of T. brevis were sampled from six populations in the SCS (Figure 1A; Table 1). Among the 127 haplotypes, ten were shared by two or more populations. Population SY had the most shared haplotypes (Table 1). The most widespread haplotype was distributed among all six populations. According to NST (0.099) and GST (0.031), T. brevis displayed no significant phylogeographic structure or population differentiation (Table 3).
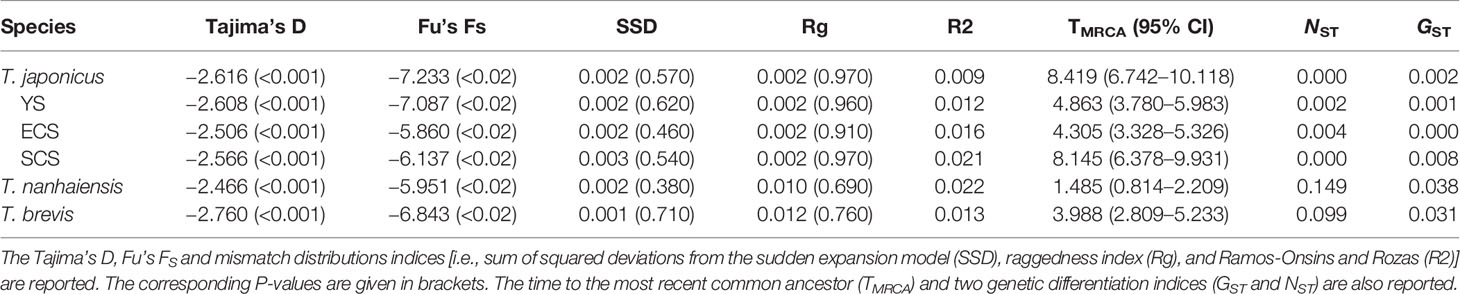
Table 3 Results of dynamic tests and molecular clock analyses for T. japonicus, T. nanhaiensis and T. brevis.
In total, 66 COI haplotypes from 119 specimens of T. nanhaiensis were sampled from three populations in the SCS (Figure 1A; Table 1). Although the sample size and the number of haplotypes of T. nanhaiensis were smaller than those of T. brevis, the nucleotide diversity (θπ) was larger than that of T. brevis (Table 1). According to NST (0.149) and GST (0.038), T. nanhaiensis also displayed no significant phylogeographic structure or population differentiation (Table 3). Among the 66 haplotypes, only six were shared by two or more populations. ST and SZ populations shared the most haplotypes (five shared haplotypes).
In total, 521 COI haplotypes from 902 specimens of T. japonicus were sampled from 16 populations in the YS, ECS, and SCS (Figure 1A; Table 1). Among the 17 sampling populations, only SZ did not contain T. japonicus. The haplotype and nucleotide diversities of T. japonicus were larger than those of the other species (Table 1). Among the 521 haplotypes, 96 were shared by two or more populations. Population QD in the YS had the most private haplotypes, while population ZS in the ECS had the most shared haplotypes (Table 1). The northernmost population (DD) and the southernmost population (SY) had nine shared haplotypes. Two shared haplotypes were distributed widely in twelve and fourteen populations. The populations in the YS, ECS, and SCS had 85, 73, and 45 shared haplotypes, respectively. A total of 60, 39, and 32 haplotypes were shared by the YS and ECS, YS and SCS, and ECS and SCS, respectively. There were 26 haplotypes distributed in the China Seas. According to NST (0.000) and GST (0.002), T. japonicus displayed no phylogeographic structure or population differentiation (Table 3).
Population Demography and History
The significant negative values of Tajima’s D and Fu’s FS supported a population expansion model for these three species (Table 3). The results of the mismatch distribution analysis showed that T. japonicus, T. nanhaiensis, and T. brevis all underwent population expansions, although the distributions of pairwise differences seemed bimodal (Figure 2; Table 3). The BSPs showed that all species displayed population expansion at approximately 0.2–0.4 mya (Figure 3A). Trichiurus japonicus first slightly expanded at approximately 3.0 mya (data not shown); its population size was stable at 3.0–0.4 mya, and then it expanded again. At approximately 0.25 mya, the population size declined, and then it expanded again to 0.22 mya. Finally, at approximately 0.08 mya, the rate of population expansion declined (Figure 3A). Trichiurus nanhaiensis and T. brevis displayed a similar pattern. The populations of these two species both expanded at 0.20 and 0.24 mya, and the rate of population expansion declined at 0.15 and 0.18 mya (Figure 3A). Additionally, the population size of T. nanhaiensis has declined recently (Figure 3A).
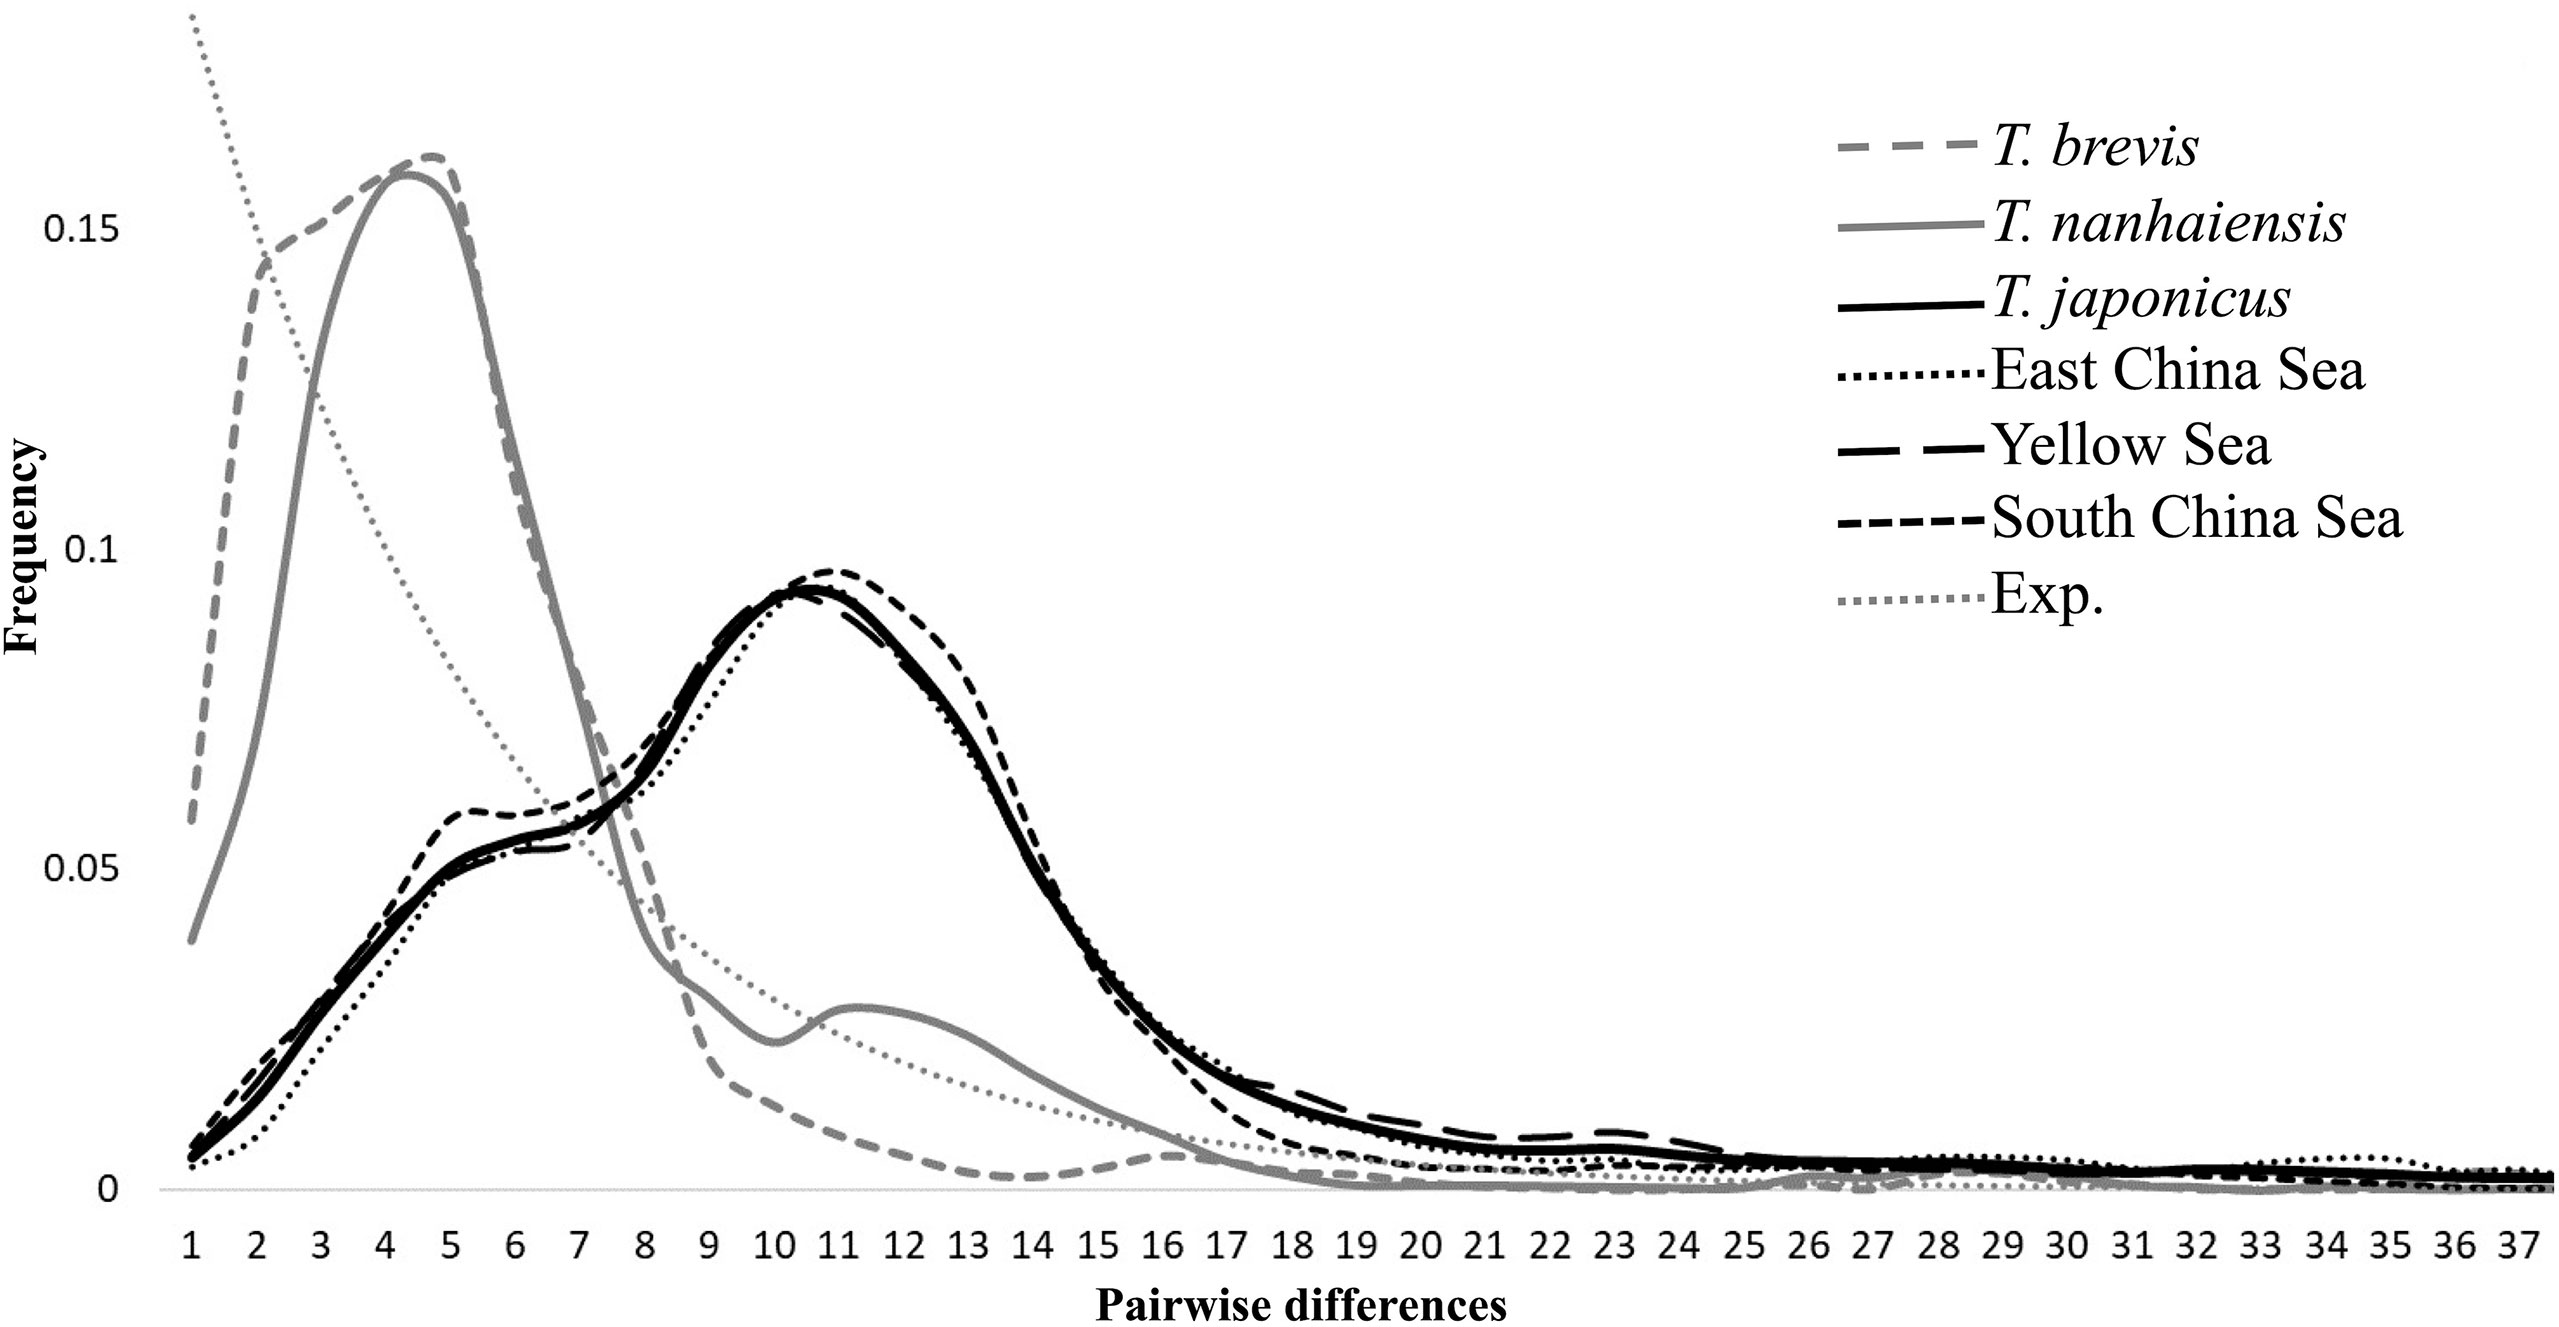
Figure 2 Mismatched distributions of three Trishiurus species and three metapopulations (Yellow Sea, East China Sea, and South China Sea) of T. japonicus.
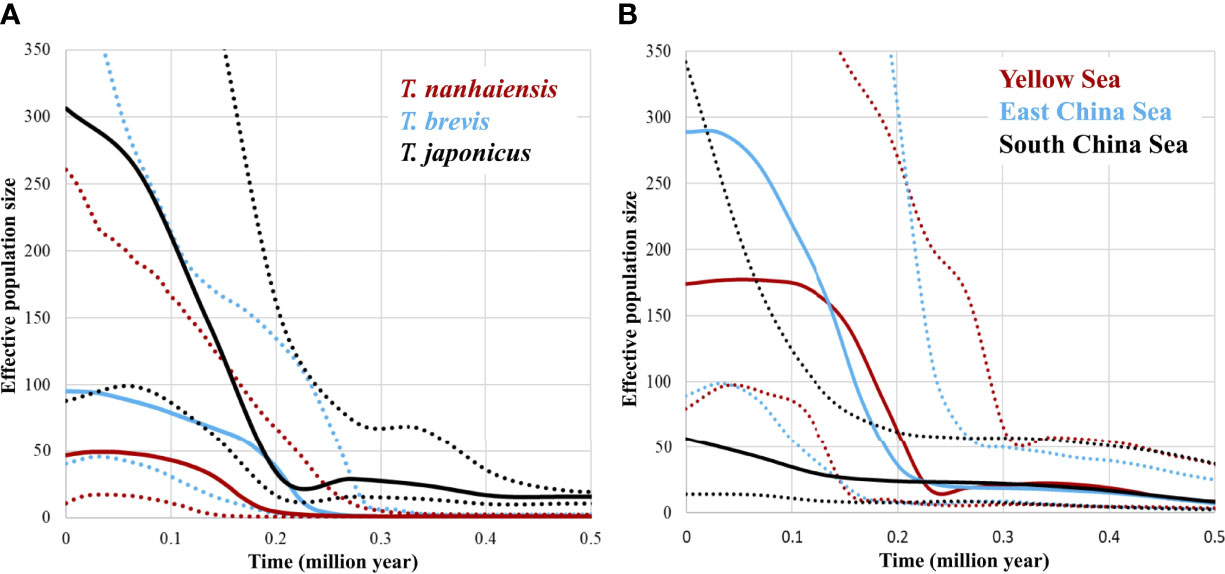
Figure 3 Bayesian skyline plots of the effective population sizes through time in (A) Trichiurus japonicus, T. nanhaiensis, and T. brevis, and (B) three metapopulations (Yellow Sea, East China Sea, and South China Sea) of T. japonicus.
Assigning the populations of T. japonicus to three metapopulations, YS, ECS, and SCS, the significant negative values of Tajima’s D and Fu’s FS supported a population expansion model for these three metapopulations (Table 3). The results of the mismatch distribution analysis indicated a population expansion, and the distributions of pairwise differences seemed bimodal (Figure 2; Table 3). The patterns shown in the BSP among these three seas were slightly different, but still showed similarities (Figure 3B). The population underwent two expansion events. First, the population sizes in the YS, ECS, and SCS all expanded by 0.50 mya. Second, the population sizes in the YS, ECS, and SCS all expanded by 0.15–0.23 mya. Finally, the rate of population expansion in the YS and ECS declined by 0.15 and 0.07 mya, respectively, but the rate in the SCS did not decline (Figure 3B). Additionally, before the second population expansion event, the YS suffered from declining pattern.
The results of a BEAST analysis suggested that the times to coalescence for T. japonicus, T. nanhaiensis, and T. brevis were sometime in the Late Miocene (TMRCA = 8.419), Middle Pleistocene (TMRCA = 1.485), and Middle Pliocene (TMRCA = 3.988) (Table 3). The times to coalescence for the three metapopulations of T. japonicus were 4.863 (YS), 4.305 (ECS), and 8.145 (SCS).
The DIYABC results differed among these three species. In T. nanhaiensis, the highest posterior probability was found for the isolation and constant scenario (Scenario D). Its posterior probability (0.8908, 95% CI: 0.6205–1.0000) was higher than that of other scenarios (Table 4). In T. brevis, the highest posterior probability was also found for Scenario D. Its posterior probability was the highest (0.9976, 95% CI: 0.9791–1.0000). In T. japonicus, the highest posterior probability was found for the isolation and expansion scenario (Scenario F). Its posterior probability was the highest (1.0000, 95% CI: 0.9999–1.0000) (Table 4). In metapopulations of T. japonicus, the YS and ECS displayed the highest posterior probabilities for the isolation and constant scenarios (Scenario D, 1.0000 and 0.9931, respectively), and the highest posterior probability in the SCS was observed for the isolation and decline scenario (Scenario E; 0.9992, 0.9947–1.000; Table 4).
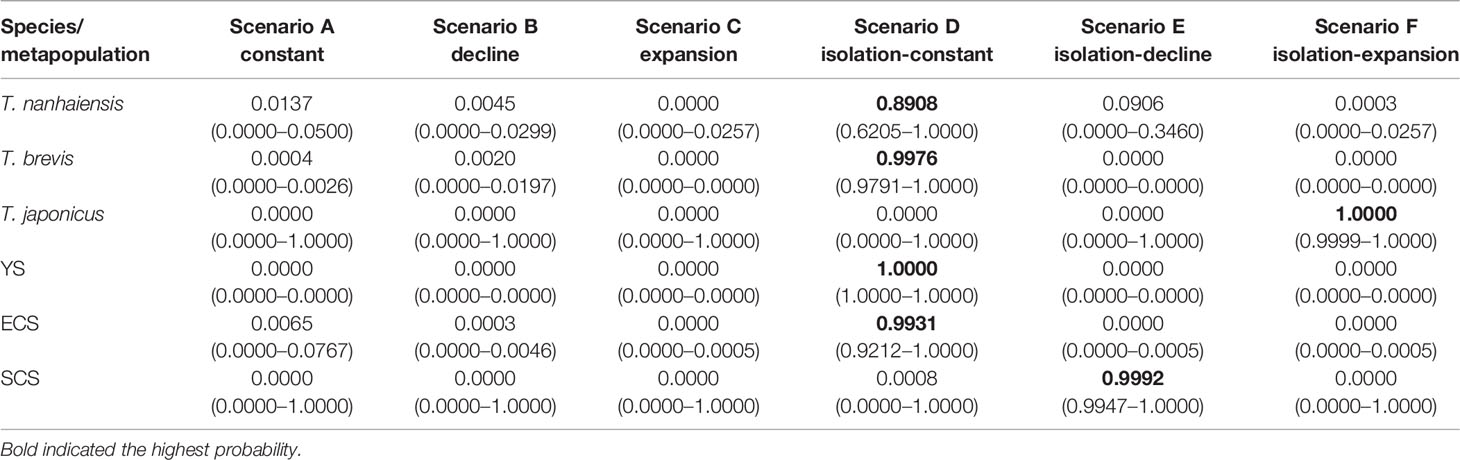
Table 4 Relative posterior probabilities for each scenario and their 95% confidence intervals in parentheses the based on the logistic estimate by DIYABC.
Population Genetic Connectivity
Migration estimates suggest that T. japonicus complies with a full migration model among the China Seas (M1; Figure 4A). M1 had the lowest log marginal likelihood of the four gene flow models tested (LBF = 0.00). Migrations among populations were also estimated (Table S1). The results of the regression analysis displayed no significant relationship between immigration and emigration in each population (y = 0.1186x + 6.2647, R2 = 0.0064, where x = emigration and y = immigration; Figure 4B). In each population, populations WZ, ZS, and SY had the most immigration, and populations WH, ZS, and ND had the most emigrations (Figure 5). The values of emigration minus immigration in each population showed that most individuals did not stay in populations WH, ND, and YJ, and most individuals tended to stay in populations WZ, QZ, and SY (Figure 5).
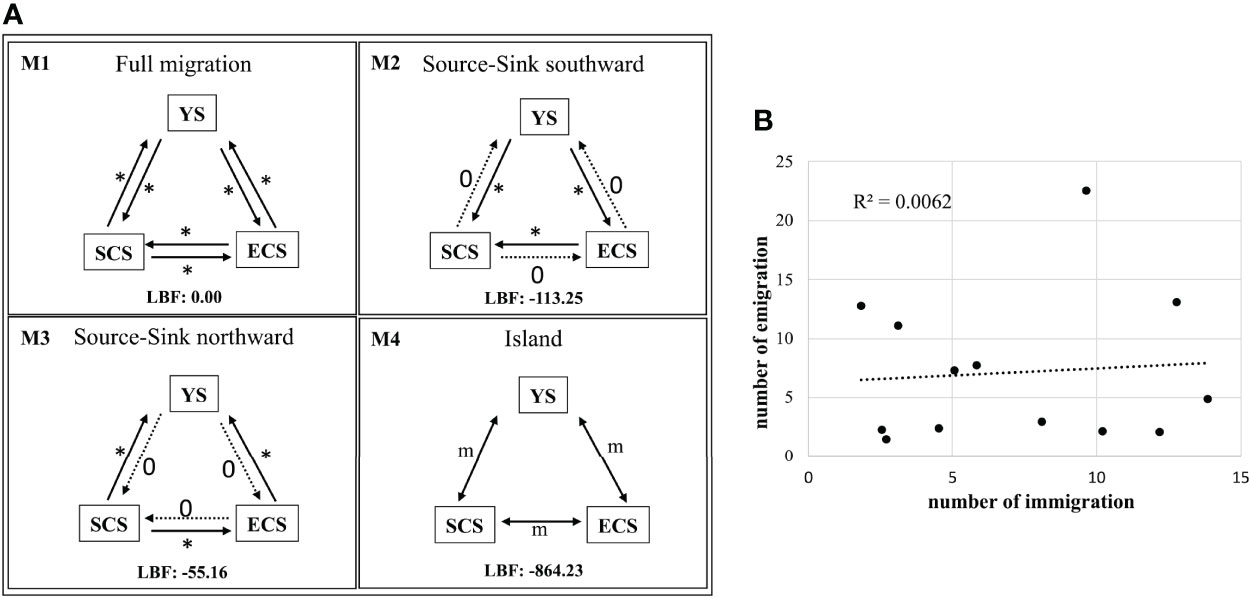
Figure 4 The results of the analysis of the MIGRATE-N of Trichiurus japonicus. (A) Migration model diagrams. Arrows represent directions of gene flow among the three oceanographic groups, YS (Yellow Sea), ECS (East China Sea) and SCS (South China Sea). (B) The linear regression between total emigrations and total immigrations in each population inferred from model M1 provide0073 directions of gene flow (Nem). *, number of migrations.
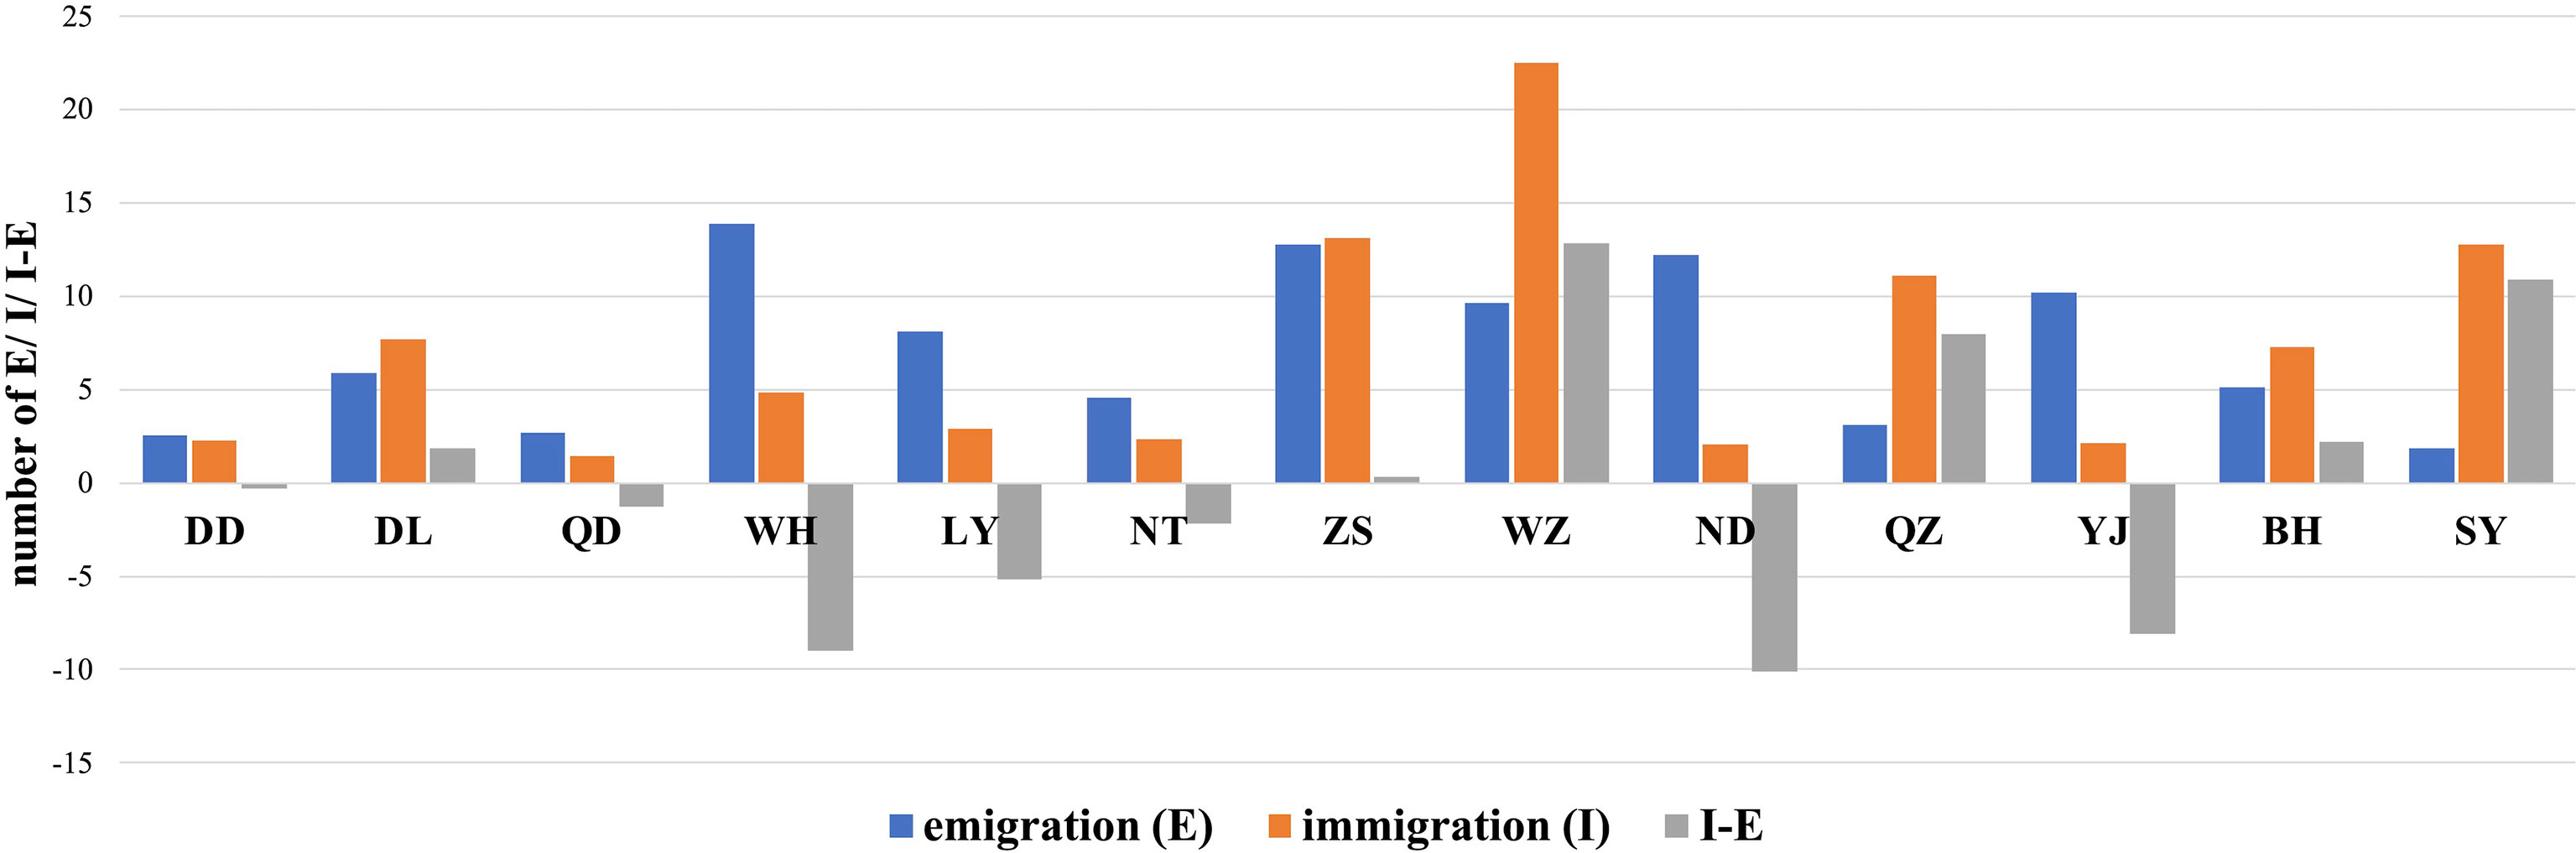
Figure 5 The bar graphs indicated the total emigrations and immigrations, and the values of emigrations minus immigrations in each population of Trichiurus japonicus. See Table 1 and Figure 1 for the population names and locations.
In total, our study found that T. japonicus in the YS migrated southward to the ECS, and a few specimens migrated southward to the SCS (Figure 6; Table S1). Additionally, our study also found that some specimens of T. japonicus migrated from the SCS northward to the ECS (Figure 6). Furthermore, the results of the MIGRATE analysis showed that most specimens of T. nanhaiensis and T. brevis migrated northward from the SCS to the Taiwan Strait (population ST), but few specimens migrated southward along the coast (Figure 6).
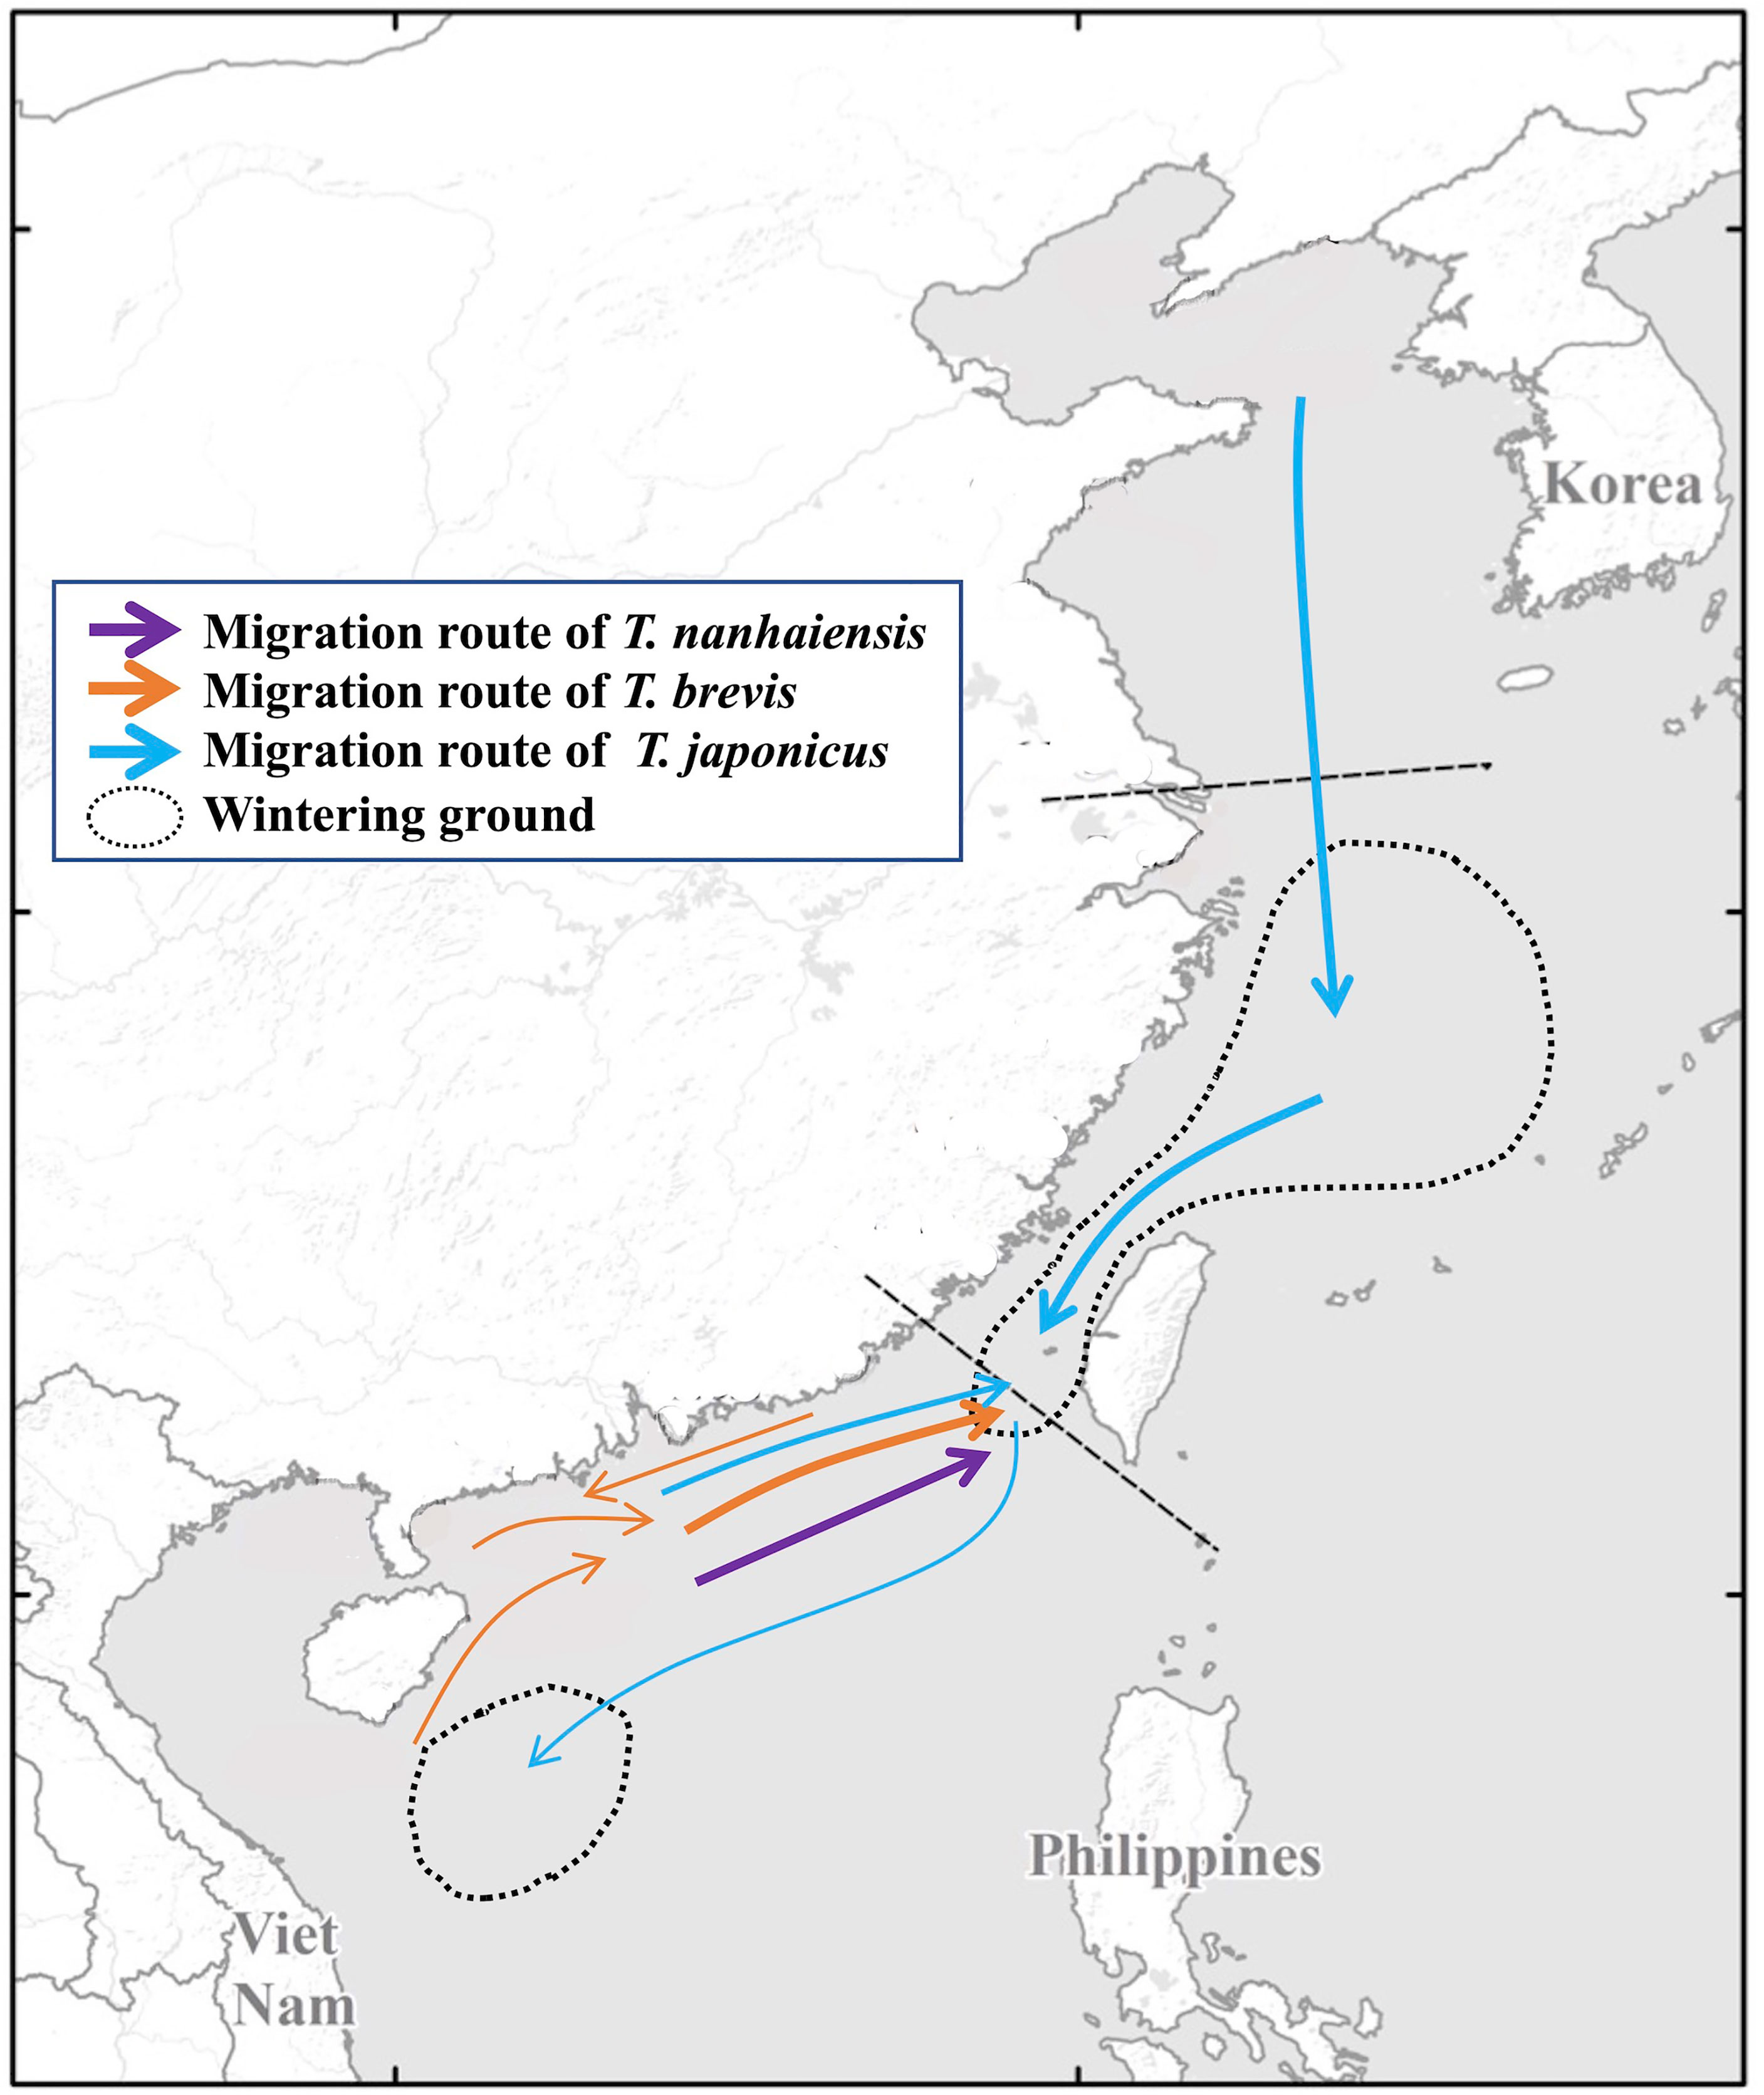
Figure 6 A map showing the migration routes of the Trichiurus species and wintering grounds along the China Seas.
To determine whether the migrations of T. japonicus corresponded to feeding, our study also estimated the ratio of empty stomachs in each population (Table 1). Our study found that the empty stomach ratio in most populations is less than 0.50. The population DL in YS displayed the highest empty stomach ratio (0.82), and the population QZ in ECS displayed the lowest empty stomach ratio (0.17). The mean empty stomach ratios in the three seas were 0.52 (YS), 0.36 (ECS), and 0.53 (SCS). The regression analysis displayed no significant relationship between immigration and emigration and the ratio of empty stomachs (R2 = 0.0067 and 0.0038, data not shown). These results might be because we only determined whether the stomach was empty in each specimen. Moreover, our study divided that data into two groups, with ratios of empty stomachs of more than 0.50 and less than 0.50. In the group with empty stomach ratios of less than 0.50, the regression analysis displayed no significant relationship between immigration and emigration and the ratio of empty stomachs (R2 = 0.0934 and 0.0056, Figure 7). In the group with a ratio of empty stomachs greater than 0.50, the regression analysis displayed a slightly significant relationship between immigration and emigration and the ratio of empty stomachs (R2 = 0.1182 and 0.3449, Figure 7). When our study estimated immigration, emigration, and the ratio of empty stomachs in three seas, the regression analysis displayed a strong significant relationship between immigration and emigration and the ratio of empty stomachs (R2 = 0.5207 and 0.9710, data not shown), although the sample size was only three (YS, ECS, and SCS).
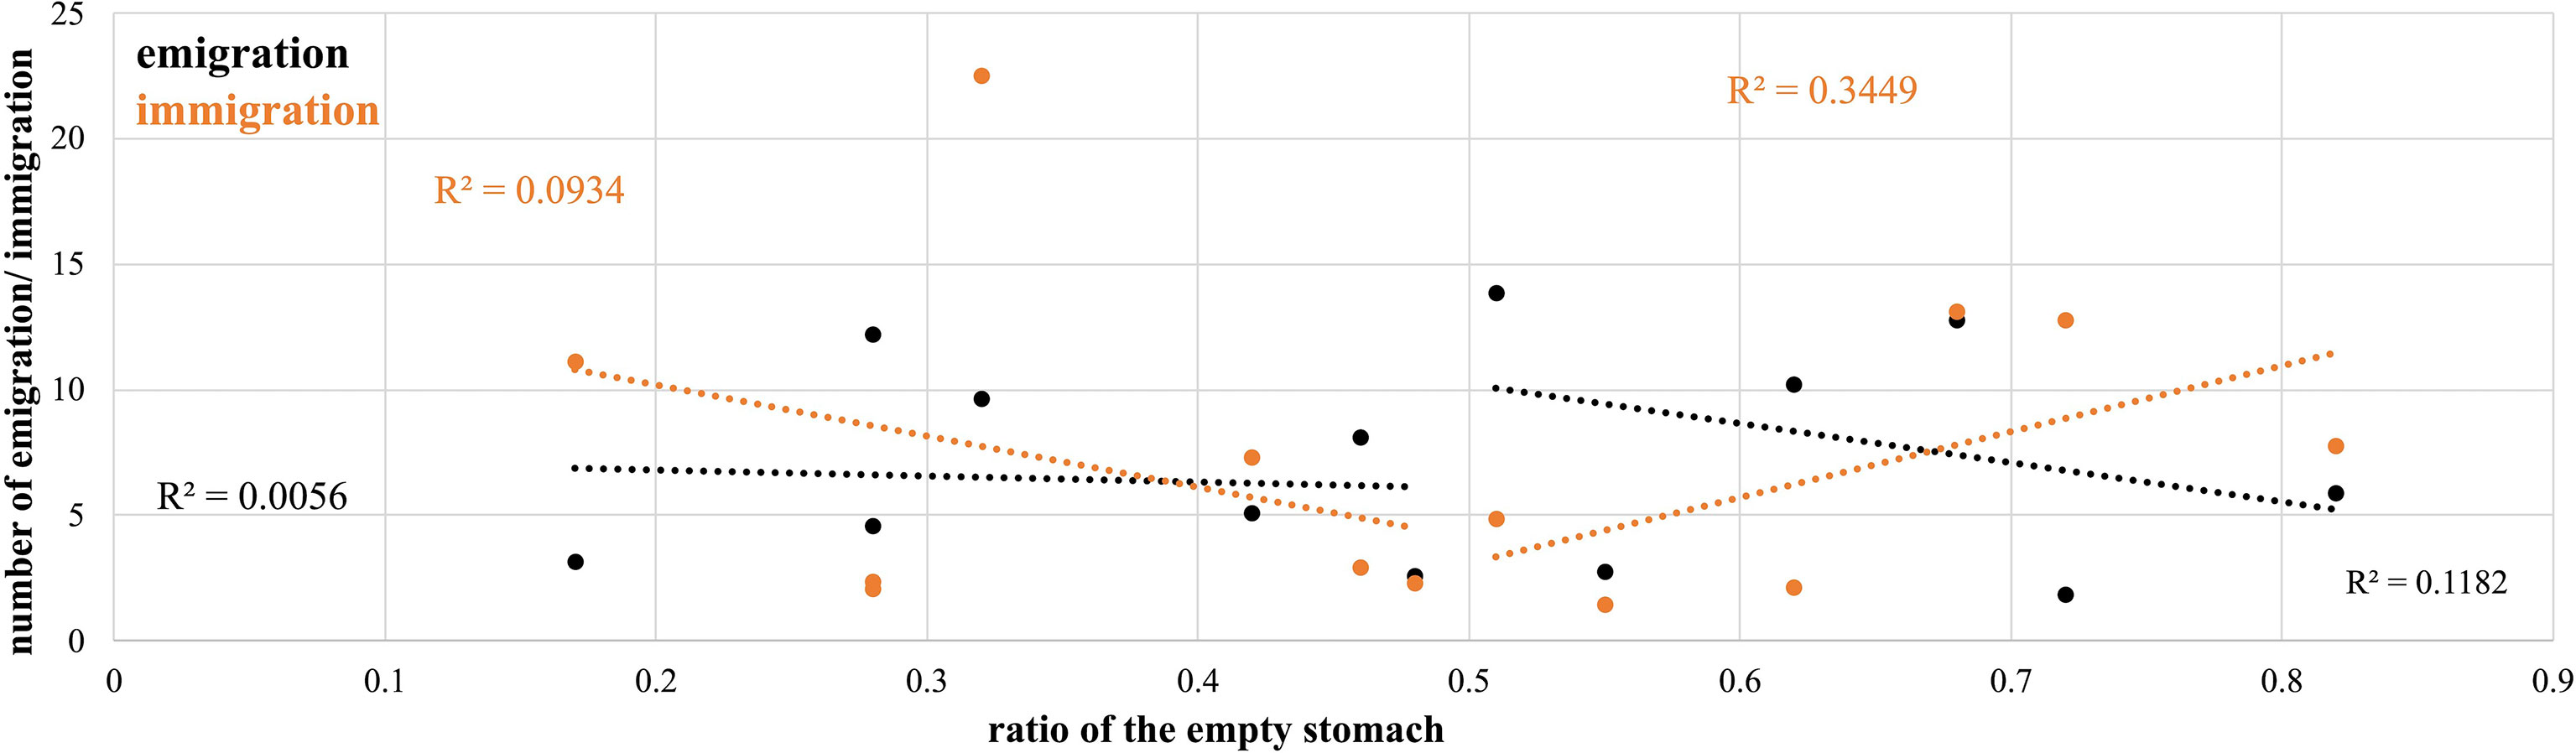
Figure 7 The linear regression between emigrations and immigration and the ratio of the empty stomach in each Trichiurus japonicus population.
Discussion
Species Habitat Characterization
A species is a necessary unit in all biological, ecological, and genetic studies. Clear species identification for fishery management purposes has been the subject of a major FAO program since the 1960s. However, the taxonomic status of the hairtail has not been resolved, especially within the genus Trichiurus. The species within the genus Trichiurus could be assigned to two groups: large-headed and short-tailed fishes (Hsu et al., 2009). The large-head group is also referred to as the T. lepturus species complex. Hsu et al. (2009) found three species within this species complex: T. japonicus, T. nanhaiensis, and T. lepturus. T. japonicus was distributed along the continental shelves in the northeastern Pacific, especially in the seas around Japan and mainland China. T. nanhaiensis was primarily distributed in the SCS, and T. lepturus was distributed in the Pacific and Atlantic. According to Hsu et al. (2009), only T. japonicus and T. nanhaiensis were distributed along the coast of the Asian continent. The findings of this study (Figure 1A; Table 1) and He et al. (2014) supported these distribution patterns. Although T. japonicus is distributed throughout all the China Seas, it is much less abundant in the SCS. The findings of this study revealed that T. brevis is more abundant in the SCS than other Trichiurus species (Figure 1A; Table 1).
The sea temperature in the SCS is higher than that in the ECS and YS. Accordingly, our study suggests that these three Trichiurus species have different habitat preferences along the coast of China. T. japonicus prefers colder waters on the continental shelves, while T. nanhaiensis prefers warmer waters on continental slopes and T. brevis prefers warmer waters on the continental shelves. These results corresponded to the results of Hou et al. (2021). Hou et al. (2021) found that the spawning of T. japonicus occurs along the continental shelf, T. nanhaiensis occurs along the continental shelf to the slope, and T. brevis occurs in shallow water. Although our study found that T. nanhaiensis and T. brevis migrated from the SCS to the southern end of the Taiwan Strait (see below: Migration for Feeding and Spawning), the Taiwan Strait is a barrier to the distribution patterns of other species (e.g., Liu et al., 2007; Xu et al., 2009; Liu et al., 2011; Hsu et al., 2021). The spatial and temporal distributions of Trichiurus species are determined by hydrological conditions, e.g., salinity and temperature (Hou et al., 2021).
Genetic Diversity and Structure
Among these three Trichiurus species along the Chinese coastline, the genetic diversity (θπ) of T. japonicus was higher than that of T. nanhaiensis and T. brevis, and the latter two species had similar genetic diversity (Table 1). However, the TMRCA of T. japonicus was higher than that of T. nanhaiensis and T. brevis, and that of T. brevis was higher than that of T. nanhaiensis (Table 3). Genetic diversity did not correspond to the TMRCA values. Yi et al. (2021a) found that the size of the specimen distribution of a given species and its genetic diversity are positively related based on the family Apogonidae in the SCS. Our study found that T. nanhaiensis and T. brevis are found only in the SCS, and T. japonicus is found in all the China Seas (Figure 1A; Table 1). Thus, our study suggests that the genetic diversity and the size of the specimen distribution area have positive relationships.
The results of NST and GST showed that these three Trichiurus species lacked population structure (Table 3). The distribution of the shared haplotypes also suggested that gene flows among populations were frequent. However, our study found that the results of the mismatch distribution analysis showed that the distributions of pairwise differences in these three Trichiurus species seemed bimodal (Figure 2). Previous studies reported that the bimodal mismatch distribution reveals population divergences (Yan et al., 2020; Yi et al., 2021b). Some studies found that there were two spawning cohorts of T. japonicus in the ECS and SCS, from February–July and November–December (Sun et al., 2020a; Sun et al., 2020b). The results of the DIYABC analyses also showed that the populations of Trichiurus species met in isolation (Table 4).
Additionally, the results of the TMRCA displayed a strange pattern (Table 3). The TMRCA of the total of T. japonicus and that of the metapopulation in the SCS were close (8.419 and 8.15), but those in the metapopulations in the YS and ECS were 4.863 and 4.305, respectively. However, T. japonicus was mainly distributed in the YS and ECS, and the population sizes in the YS and ECS were higher than those in the SCS (Figure 3B). Our study suggests that during glaciations, YS and ECS were completely exposed, and the SCS became a refugium. Thus, the TMRCA in the SCS and that of the total samples were similar and higher than those in the YS and ECS (Table 3). This result also implied that some populations of T. japonicus retreated to the SCS during glaciations and settled in interglacial periods. Thus, although our study found no significant genetic differentiation of these three Trichiurus species along the Chinese coastline because their swimming abilities were strong, we considered that Trichiurus species might have been differentiated in the China Seas and were shaped by landform changes during glaciations, as in other previous phylogeographic studies (e.g., Shen et al., 2011; Yang et al., 2017; Qu et al., 2018). Sea level and temperature fluctuations promoted differentiation in the Northwestern Pacific Ocean (Liu et al., 2006; Shen et al., 2011; Qu et al., 2018).
Migrations for Feeding and Spawning
Jaureguizar et al. (2004) proposed that the major aims of fish migrations are seasonal and reproductive. Sun et al. (2020a) also proposed that T. japonicus undergoes seasonal migration. Our study sampled specimens in the late fall and early winter. In this season, marine species might migrate southward, following warm waters through the China Coastal Current (Figure 1). Our study found that these three Trichiurus species generally did not migrate southward through the China Coastal Current (Figures 1, 6). The migration pattern of T. japonicus was supported by the full migration model (Figure 4A). Regression analysis revealed no significant positive relationship between immigration and emigration in each population (y = 0.1186x + 6.2647, R2 = 0.0064, where x = emigration and y = immigration; Figure 4B). These results might have resulted in their strong swimming abilities.
According to the migrations between populations, our study inferred the migration routes of T. japonicus and found that most specimens migrated from the YS southward to the ECS and SCS (Figure 6). Most specimens remain in the ECS, including the Taiwan Strait. Moreover, our study also found that some specimens migrated northward from the SCS to the Taiwan Strait. Our study also revealed that T. nanhaiensis and T. brevis migrated from the SCS to the Taiwan Strait (Figure 6). This region, south of the Yangtze River and north of the Taiwan Strait, has been recognized as the wintering ground of T. japonicus (Wang et al., 2011; Sun et al., 2020a; Sun et al., 2020b). In this region, the waters are formed by the Kuroshio Current and diluted Yangtze waters. The former current has high salinity and temperature, and the latter has low salinity and abundant nutrients (Chen et al., 2009). The branch of the Kuroshio Current flows from the east of the Philippines through the Bashi Channel into the Taiwan Strait. Moreover, Han et al. (2013) also found that nutrient transport from the ECS is a major source of support for winter primary production on the northeastern SCS shelf through the Taiwan Strait. Thus, there is more biomass in this area than in the surrounding areas. The northern wintering ground extended to the Taiwan Strait and northeastern SCS. Jaureguizar et al. (2004) suggest that both seasonal migrations and reproductive movements are affected by temporal structure. Chiang et al. (2002) also proposed that water temperature is a limiting factor for phytoplankton biomass density, and that carbon biomass increases in the warm season. Accordingly, our study suggests that these migrations of the Trichiurus species were shaped by feeding (Figure 7). Our study suggested that the ECS, including the Taiwan Strait, is a wintering ground for T. japonicus, and T. nanhaiensis and T. brevis winter in the northeastern SCS (Figure 6).
In addition to the wintering grounds in the ECS, including the Taiwan Strait, our study found that some specimens of T. japonicus remained in population SY (Figure 5). The water temperature in the SCS is higher than that in the YS and ECS. Hou et al. (2021) found that in late summer and early autumn, eggs of T. japonicus and T. nanhaiensis mainly occurred in the surface water mass of the SCS. Thus, our study suggests that population SY is a wintering and spawning ground for T. japonicus (Figure 6). These results also supported the results of the TMRCA (Table 3). During the LGM, T. japonicus migrated from the YS and ECS to the SCS as a refugium, and some populations settled during the interglacial period. Accordingly, our study suggests that the migrations of Trichiurus species are mainly associated with feeding and spawning preferences and that the behavior is shaped by oceanographic conditions (e.g., Han et al., 2013; Liu et al., 2020; Hou et al., 2021).
Demographic History in Different Samplings
Many studies of marine species have revealed a population expansion before or after the Last Glacial Maximum (pre-LGM or post-LGM; Delrieu-Trottin et al., 2017; Jenkins et al., 2018; Qu et al., 2018). Jenkins et al. (2018) also proposed that some species display stable population sizes pre- and post-LGM. Clark et al. (2009) identified the interval with LGM as between 0.027 and 0.019 mya. Our study found that these three Trichiurus species all showed a population expansion after the LGM (Figure 3A). Previous studies also displayed similar patterns (He et al., 2014; Lin et al., 2021). However, our results and those of He et al. (2014) displayed two different patterns. First, in the results of He et al. (2014), T. japonicus in the ECS experienced a genetic bottleneck, but in our results, T. japonicus in the YS experienced a genetic bottleneck, and that in the ECS did not (Figure 3B). Second, in the results of He et al. (2014), the population of T. japonicus in the SCS declined, but in our results, the population expanded (Figure 3B). Our study considered that these differences might have resulted from the sampling season. He et al. (2014) might have sampled in winter, while our study samples were collected in late fall and early winter. In winter, T. japonicus migrated from the YS to the ECS and SCS. Thus, the patterns in He et al. (2014) shifted from north to south.
Limits of the Bayesian Skyline Plot Analysis
The neutrality tests, mismatch distribution, and coalescent BSPs supported population expansion (Table 3; Figures 2, 3), but the approximate Bayesian computational approaches supported population declines or remained constant (Table 4). The incongruent results between approximate Bayesian computational approaches (Table 4) and other demographic analyses (Table 3; Figures 2, 3) might have resulted in a population differentiation (Heller et al., 2013; Yan et al., 2020; Yi et al., 2021b). Heller et al. (2013) proposed that the results of BSP analyses show false signals of population decline under biologically plausible combinations of population structure. Yan et al. (2020) and Yi et al. (2021b) also found that when populations met differentiation, the results of the BSP analyses displayed population expansion, but other analyses, e.g., mismatch distribution and Tajima’s D test, did not support the population expansion. Furthermore, the BSPs revealed that the population sizes of three Trichiurus species and three metapopulations of T. japonicus all displayed population expansion after the LGM and experienced a genetic bottleneck during the LGM (Figure 3). However, our study did not find that during the last interglacial period, the population size was not higher than that during glaciation in BSP (Figure 3; He et al., 2014). In other words, the population size was stable in the glacial and the last interglacial periods. Grant et al. (2012) found that the BSPs of simulated sequences showed a flat demographic curve before the LGM and suggested that the results of the BSP analyses lost the pre-LGM population history. Accordingly, our results also support limits in BSP analyses (Grant et al., 2012; Heller et al., 2013). Thus, the results of BSP analyses may need to be evaluated carefully.
Demography of Trichiurus Species
Our study suggests that the Trichiurus species underwent population differentiation due to landform changes during the Pliocene and Pleistocene glacial cycles, as in previous phylogeographic studies (Kizaki and Oshiro, 1980; Ota, 1994; Wang, 1999; Voris, 2000; Yang et al., 2017; Qu et al., 2018). The complex geological history might cause incorrect assessment in BSP analyses. However, our study did find evidence supporting the population history of Trichiurus species based on all the results.
Among the three Trichiurus species, the BSP results revealed that the population size of T. nanhaiensis was lower than that of the other two species, and only this species recently displayed population decline (Figure 3A). However, the genetic diversity of T. nanhaiensis was not lower than that of the other species (Table 1). Previous studies found that population differentiation could result in overestimated genetic diversity (Yan et al., 2020; Yi et al., 2021b). Our study found that the level of population differentiation of T. nanhaiensis was higher than that of the other two species (NST; Table 3). Thus, our study showed that the BSP results and genetic diversity in T. nanhaiensis might be overestimated, and the population size of T. nanhaiensis seriously declined (Figure 3A). Our study also found that people ate T. nanhaiensis more frequently in the South Sea (our observations) because this species is meatier than T. japonicus and T. brevis.
The BSP results also revealed different patterns among the three metapopulations of T. japonicus (Figure 3B). The estimated population size in the ECS was the highest, and that in the SCS was the lowest. These results corresponded to the annual marine capture fishery production of China (Kang et al., 2018). Thus, our study suggests that T. japonicus can be used as an indicator organism to monitor fishery resources in the China Seas. The ECS is the largest marginal sea in the northwestern Pacific, and there are more nutrient sources here than in other areas, including those from the Kuroshio Current and Yangtze River runoff (Chiang et al., 2002). Additionally, in our sampling season, T. japonicus migrated from the YS to the ECS as a wintering ground. Thus, the population size in ECS was higher. The YS is a semi-enclosed body of water, but the coastline is heavily populated, urbanized, and industrialized. Ji et al. (2019) proposed that the largehead hairtail in YS, including the Bohai Sea, experienced overexploitation. Moreover, in our sampling season, the populations in the YS migrated southward. Thus, the YS metapopulation declined significantly (Figure 3B). Furthermore, the population size in the SCS increased according to the BSP results (Figure 3B). Liu (2013) proposed that among the marginal seas of China, the South China Sea has the highest biodiversity. Our study also inferred a wintering and spawning ground in the SCS, and some populations migrated from the YS and ECS southward to the SCS (Figure 6). As the BSP analyses have limitations, the BSP results would display false signals of population decline under combinations of population structure. Thus, although the BSP results showed population growth in the SCS, the SCS population size was the lowest (Figure 3B). Kang et al. (2018) and Du et al. (2020) found that resources experienced a decline in catch per unit effort (CPUE), the annual catch in the YS decreased after 2008, the annual increments declined in the ECS and SCS, and a rapid decrease in the annual capture of the SCS began in 2018. Thus, our study suggests that policies are needed for the resource management of Trichiurus species.
Conclusion
Our study found that the three Trichiurus species studied have different habitat preferences along the coast of China. T. japonicus prefer colder waters on continental shelves, while T. nanhaiensis prefer warmer waters on continental slopes and T. brevis prefer warmer waters on the continental shelves. Our study showed that the distribution and intraspecific genetic structure of Trichiurus species were controlled by feeding and spawning, and the behavior might be shaped by environmental factors (Liu et al., 2020; Hou et al., 2021). Wang H. Y. et al., (2017) proposed temporal changes in hairtail composition. Moreover, our study suggested that the different results in the present study and those of He et al. (2014) were due to the different sampling seasons. Berger-Tal and Saltz (2019) proposed that movement and habitat selection are linked to the distribution of animals in space and time, and changes in movement patterns impact on the ecosystem. As a result, while habitat protection is an important step in the preserving biodiversity, our study suggests that, in addition to in situ conservation in two wintering and spawning grounds, an annual catch limit policy is required. These results will provide suggestions for protecting fish resources and habitat restoration.
Data Availability Statement
All nucleotide sequences were deposited in GenBank under accessions MZ959870–MZ959999, MZ960057–MZ960127, and OK053821–OK054341.
Ethics Statement
All animal experiments were carried out in accordance with the guidelines and approval of the Animal Research and Ethics Committee of the College of Fisheries, Guangdong Ocean University (permissions, B20200722-01).
Author Contributions
Y-RY and H-DL designed the study. K-CH and M-RY analyzed most of the data and wrote the initial draft of the paper. Y-RY, H-DL, and BK discussed and revised the manuscript. SG and Z-SL performed the experiments. X-BH collected samples and the data. All authors listed have made a substantial, direct, and intellectual contribution to the work and approved it for publication.
Funding
This work was supported by grants from the National Key R&D Program of China (Grant Number: 2018YFD0900905), the National Natural Science Foundation of China (Grant Number: U20A2087), the Guangdong Basic and Applied Basic Research Foundation (Grant Number: 2019B1515120064), the Marine Economy Development Special Foundation of Department of Natural Resources of Guangdong Province (Grant Number: GDNRC [2020]052), and the Science and Technology Plan Projects of Guangdong Province, China (Grant Number: 2018B030320006).
Conflict of Interest
The authors declare that the research was conducted in the absence of any commercial or financial relationships that could be construed as a potential conflict of interest.
Publisher’s Note
All claims expressed in this article are solely those of the authors and do not necessarily represent those of their affiliated organizations, or those of the publisher, the editors and the reviewers. Any product that may be evaluated in this article, or claim that may be made by its manufacturer, is not guaranteed or endorsed by the publisher.
Acknowledgments
The authors would like to thank Po-Hsun Kuo, Department of Industrial Management, National Taiwan University of Science and Technology, for helping with the data analysis. We would also like to express our gratitude to our colleagues Xin Su, Yajin Tao, and Chunxu Zhao for their help in collecting samples. We are grateful to the anonymous referees for their constructive comments.
Supplementary Material
The Supplementary Material for this article can be found online at: https://www.frontiersin.org/articles/10.3389/fmars.2022.875042/full#supplementary-material
References
Beerli P. (2016) MIGRATE-N 4.4.3. Available at: https://peterbeerli.com/migrate/tutorials.html.
Berger-Tal O., Saltz D. (2019). Invisible Barriers: Anthropogenic Impacts on Inter- and Intra-Specific Interactions as Drivers of Landscape-Independent Fragmentation. Phil. Trans. R. Soc. B. 374, 20180049. doi: 10.1098/rstb.2018b0049
Burhanuddin A. I., Iwatsuki Y., Yoshino T., Kimura S. (2002). Small and Valid Species of Trichiurus Brevis Wang and You 1992 and T. Russelli Dutt and Thankam 1966, Defined as the “T. Russelli Complex” (Perciformes: Trichiuridae). Ichthyol. Res. 49, 211–223. doi: 10.1007/s102280200030
Chakraborty A., Aranishi F., Iwatsuki Y. (2006). Genetic Differences Among Three Species of the Genus Trichiurus (Perciformes: Trichiuridae) Based on Mitochondrial DNA Analysis. Ichthyol. Res. 53, 93–96. doi: 10.1007/s10228-005-0313-3
Chen C. C., Shiah F. K., Chaing K., Gong G. C., Kemp W. M. (2009). Effects of the Changjiang (Yangtze) River Discharge on Planktonic Community Respiration in the East China Sea. J. Geophys. Res. 114, C03005. doi: 10.1029/2008JC004891
Chiang K. P., Kuo M. C., Chang J., Wang R. H., Gong G. C. (2002). Spatial and Temporal Variation of the Synechococcus Population in the East China Sea and Its Contribution to Phytoplankton Biomass. Cont. Shelf Res. 22, 3–13. doi: 10.1016/S0278-4343(01)00067-X
Chiu Y. W., Bor H., Kuo P. H., Hsu K. C., Tan M. S., Wang W. K., et al. (2017). Origins of Semisulcospira Libertina (Gastropoda: Semisulcospiridae) in Taiwan. Mitochondrial DNA Part A 28, 518–525. doi: 10.3109/24701394.2016.1149823
Clark P. U., Dyke A. S., Shakun J. D., Carlson A. E., Clark J., Wohlfarth B., et al. (2009). The Last Glacial Maximum. Science 325, 710–714. doi: 10.1126/science.1172873
Cornuet J. M., Pudlo P., Veyssier J., Dehne-Garcia A., Gautier M., Leblois R., et al. (2014). DIYABC V2.0: A Software to Make Approximate Bayesian Computation Inferences About Population History Using Single Nucleotide Polymorphism, DNA Sequence and Microsatellite Data. Bioinformatics 30, 1187–1189. doi: 10.1093/bioinformatics/btt763
Darriba D., Taboada G. L., Doallo R., Posada D. (2012). Jmodeltest 2: More Models, New Heuristics and Parallel Computing. Nat. Methods 9, 772–772. doi: 10.1038/nmeth.2109
Delrieu-Trottin E., Mona S., Maynard J., Neglia V., Veuille M., Planes S. (2017). Population Expansions Dominate Demographic Histories of Endemic and Widespread Pacific Reef Fishes. Sci. Rep. 7, 40519. doi: 10.1038/srep40519
Drummond A. J., Rambau A., Suchard M. (2013) BEAST 1.8.0. Available at: http://beast.bio.ed.ac.uk (Accessed March 26, 2021).
Du P., Chen Q. Z., Yan Y. R., Ye W. J., Li S. L., Yu C. G. (2020). Advances in the Trichiurus Lepturus Changes and Habitat Driving Factors in the East China Sea. J. Guangdong Ocean Univ. 40, 126–132. doi: 10.3969/j.issn.1673-9159.2020.01.017
Froese R., Pauly D. (2021). FishBase (World Wide Web Electronic Publication). Available at: http://www.fishbase.org.
Fu Y. X. (1997). Statistical Tests of Neutrality of Mutations Against Population Growth, Hitchhiking and Background Selection. Genetics 147, 915–925. doi: 10.1093/genetics/147.2.915
Golani D., Fricke R. (2018). Checklist of the Red Sea Fishes With Delineation of the Gulf of Suez, Gulf of Aqaba, Endemism and Lessepsian Migrants. Zootaxa 4509, 1–215. doi: 10.11646/zootaxa.4509.1.1
Grant W. S., Liu M., Gao T., Yanagimoto T. (2012). Limits of Besesian Skyline Plot Analysis of mtDNA Sequences to Infer Historical Demographies in Pacific Herring (and Other Species). Mol. Phylogenet. Evol. 65, 203–212. doi: 10.1016/j.ympev.2012.06.006
Gu S., Yi M. R., He X. B., Lin P. S., Liu W. H., Luo Z. S., et al. (2021). Genetic Diversity and Population Structure of Cutlassfish (Lepturacanthus Savala) Along the Coast of Mainland China, as Inferred by Mitochondrial and Microsatellite DNA Markers. Reg. Stud. Mar. Sci. 43, 101702. doi: 10.1016/j.rsma.2021.101702
Hall T. A. (1999). BioEdit: A User-Friendly Biological Sequence Alignment Editor and Analysis Program for Windows 95/98/NT. Nucleic Acids Symp. 41, 95–98. doi: 10.1017/CB9780511790492.007
Han A. Q., Dai M. H., Gan J. P., Kao S. J., Zhao X. Z., Jan S., et al. (2013). Inter-Shelf Nutrient Transport From the East China Sea as a Major Nutrient Source Supporting Winter Primary Production on the Northeast South China Sea Shelf. Biogeosciences 10, 8159–8170. doi: 10.5194/bg-10-8159-2013
Han C. C., Hsu K. C., Fang L. S., Chang I. M., Lin H. D. (2019). Geographical and Temporal Origins of Neocaridina Species (Decapoda: Caridea: Atyidae) in Taiwan. BMC Genet. 20, 86. doi: 10.1186/s12863-019-0788-y
Hebert P. D. N., Stoeckle M. Y., Zemlak T. S., Francis C. M. (2004). Identification of Birds Through DNA Barcodes. PloS Biol. 2, 1657–1663. doi: 10.1371/journal.pbio.0020312
Heller R., Chikhi L., Siegismund H. R. (2013). The Confounding Effect of Population Structure on Bayesian Skyline Plot Inferences of Demographic History. PloS One 8, e62992. doi: 10.1371/journal.pone.0062992
He L., Mukai T., Hou C. K., Ma Q., Zhang J. (2015). Biogeographical Role of the Kuroshio Current in the Amphibious Mudskipper Periophthalmus Modestus Indicated by Mitochondrial DNA Data. Sci. Rep. 5, 15645. doi: 10.1038/srep15645
He L., Zhang A., Weese D., Li S., Li J., Zhang J. (2014). Demographic Response of Cutlassfish (Trichiurus Japonicus and T. Nanhaiensis) to Fluctuating Palaeo-Climate and Regional Oceanographic Conditions in the China Seas. Sci. Rep. 4, 6380. doi: 10.1038/srep06380
Hou G., Xu Y., Chen Z., Zhang K., Huang W., Wang J., et al. (2021). Identification of Eggs and Spawning Zines of Hairtail Fishes Trichiurus (Pisces: Trichiuridae) in Northern South China Sea, Using DNA Barcoding. Front. Environ. Sci. 9, 703029. doi: 10.1007/s00343-011-0004-z
Hsu K. C., Shih N. T., Ni I. H., Shao K. T. (2009). Speciation and Population Structure of Three Trichiurus Species Based on Mitochondrial DNA. Zool. Stud. 48, 835–849.
Hsu K. C., Wu H. J., Kuo P. H., Chiu Y. W. (2021). Genetic Diversity of Cyclina Sinensis (Veneridae): Resource Management in Taiwan. Taiwania 66, 165–173. doi: 10.6165/tai.2021.66.165
Jaureguizar A. J., Menni R., Guerrero R., Lasta C. (2004). Environmental Factors Structuring Fish Communities of the RíIo De La Plata Estuary. Fish. Res. 66, 195–211. doi: 10.1016/S0165-7836(03)00200-5
Jenkins T. L., Castilho R., Stevens J. R. (2018). Meta-Analysis of Northeast Atlantic Marine Taxa Shows Contrasting Phylogeographic Patterns Following Post-LGM Expansions. PeerJ 6, e5684. doi: 10.7717/peerj.5684
Ji Y., Liu Q., Liao B., Zhang Q., Han Y. (2019). Estimating Biological Reference Points for Largehead Hairtail (Trichiurus Lepturus) Fishery in the Yellow Sea and Bohai Sea. Acta Oceanol. Sin. 38, 20–26. doi: 10.1007/s13131-019-1343-4
Jukes T. H., Cantor C. R. (1969). “Evolution of Protein Molecules,” in Mammalian Protein Metabolism. Ed. Monro H. N. (New York, NY: Academic Press), 21–132.
Kang B., Liu M., Huang X. X., Li J., Yan Y. R., Han C. C., et al. (2018). Fisheries in Chinese Seas: What Can We Learn From Controversial Official Fisheries Statistics? Rev. Fish Biol. Fisheries 28, 503–519. doi: 10.1007/s11160-018-9518-1
Kizaki K., Oshiro I. (1980). The Origin of the Ryukyu Islands. Natural History of the Ryukyus. Ed. Kizaki K. (Tokyo: Tsukiji-shokan), 8–37.
Kumar S., Steecher G., Li M., Knyaz C., Tamura K. (2018). MEGA X: Molecular Evolutionary Genetics Analysis Across Computing Platforms. Mol. Biol. Evol. 35, 1547–1549. doi: 10.1093/molbev/msy096
Lee S. C., Chang K. H., Wu W. L., Yang H. C. (1977). Formosan Ribbonfishes (Perciformes, Trichiuridae). Bull. Instit. Zool. 16, 77–84.
Liao T. Y., Lu P. L., Yu Y. H., Huang W. C., Shiao J. H., Lin H. D., et al. (2021). Amphidromous But Endemic: Population Connectivity of Rhinogobius Gigas (Teleostei: Gobioidei). PloS One 16, e0246406. doi: 10.1371/journal.pone.0246406
Librado P., Rozas J. (2009). DnaSP V5: A Software for Comprehensive Analysis of DNA Polymorphism Data. Bioinformatics 25, 1451–1452. doi: 10.1093/bioinformatics/btp187
Lin H. C., Tsai C. J., Wang H. Y. (2021). Variation in Global Distribution, Population Structures, and Demographic History for Four Trichiurus Cutlassfishes. PeerJ 9, e12639. doi: 10.7717/peerj.12639
Liu J. Y. (2013). Status of Marine Biodiversity of the China Seas. PloS One 8, e50719. doi: 10.1371/journal.pone.0050719
Liu J., Gao T. X., Wu S., Zhang Y. A. P. (2007). Pleistocene Isolation in the Northwestern Pacific Marginal Seas and Limited Dispersal in a Marine Fish, Chelon Haematocheilus (Temminck & Schlege). Mol. Ecol. 16, 275–288. doi: 10.1111/j1365-294X.2006.03140.x
Liu J. X., Gao T. X., Yokogawa K., Zhang Y. P. (2006). Differential Population Structuring and Demographic History of Two Closely Related Fish Species, Japanese Sea Bass (Lateolabrax Japonicus) and Spotted Sea Bass (Lateolabrax Maculatus) in Northwestern Pacific. Mol. Phylogenet. Evol. 39, 799–811. doi: 10.1016/j.ympev.2006.01.009
Liu J., Li Q., Kong L. F., Zheng X. D. (2011). Cryptic Diversity in the Pen Shell Atrina Pectinata (Bivalvia: Pinnidae): High Divergence and Hybridization Revealed by Molecular and Morphological Data. Mol. Ecol. 20, 4332–4345. doi: 10.1111/j.1365-294X.2011.05275.x
Liu S., Liu Y., Alabia I. D., Tian Y., Ye Z., Yu H., et al. (2020). Impact of Climate Change on Wintering Ground of Japanese Anchovy (Engraulis Japonicus) Using Marine Geospatial Statistics. Front. Mar. Sci. 7. doi: 10.3389/fmars.2020.00604
Nakabo T. (2000). Fishes of Japan With Pictorial Keys to the Species. 2nd (Tokyo: Tokai Univ. Press).
Nakamura I., Parin N. V. (1993). An Annotated and Illustrated Catalogue of the Snakemackerels, Snoeks, Escolars, Gemfishes, Sackfishes, Domine, Oilfish, Cutlassfishes, Scabbardfishes, Hairtails, and Frostfishes Known to Date. FAO Fish. Syn. 125, 200.
Nakamura I., Parin N. V. (2001). Families Gempylidae, Trichiuridae. In: Carpenter & Niem 2001. Species Identification Guide for Fishery Purposes. The Living Marine Resources of the Western Central Pacific. Bony Fishes Part 4 (Labridae to Latimeriidae), Estuarine Crocodiles, Sea Turtles, Sea Snakes and Marine Mammals. FAO Rome. v. 6: iii-v.
Nei M., Tajima F. (1983). Maximum Likelihood Estimation of the Number of Nucleotide Substitutions From Restriction Sites Data. Genetics 105, 207–217. doi: 10.1093/genetics/105.1.207
Ota H. (1994). Biogeographical Characteristics of Terrestrial Vertebrates of the Ryukyu Archipelago. In: Search of Origins of Okinawan Culture (Executive Committee International Symposium on Okinawan Studies, Ed.). Naha: Bunshinlnsatsu. 460–464.
Picq S., Alda F., Krahe R., Bermingham E. (2014). Miocene and Pliocene Colonization of the Central American Isthmus by the Weakly Electric Fish Brachyhypopomus Occidentalis (Hypopomidae, Gymnotiformes). J. Biogeogr. 41, 1520–1532. doi: 10.1111/jbi.12309
Pons O., Petit R. J. (1996). Measuring and Testing Genetic Differentiation With Ordered vs. Unordered Alleles. Genetics 144, 1237–1245. doi: 10.1093/genetics/144.3.1237
Qu M., Tang W., Liu Q., Wang D., Ding S. (2018). Genetic Diversity Within Grouper Species and a Method for Interspecific Hybrid Identification Using DNA Barcoding and RYR3 Marker. Mol. Phylogenet. Evol. 121, 46–51. doi: 10.1016/j.ympev
Rambaut A., Drummond A. J., Suchard M. (2013) Tracer V1.6. Available at: http://tree.bio.ed.ac.uk/software/tracer/ (Accessed 11 Dec).
Rogers A. R., Harpending H. (1992). Population Growth Makes Waves in the Distribution of Pairwise Genetic Differences. Mol. Biol. Evol. 9, 552–569. doi: 10.1093/oxfordjournals.molbev.a040727
Shen K. N., Jamandre B. W., Hsu C. C., Tzeng W. N., Durand J. D. (2011). Plio-Pleistocene Sea Level and Temperature Fluctuations in the Northwestern Pacific Promoted Speciation in the Globally-Distributed Flathead Mullet Mugil Cephalus. BMC Evol. Biol. 11, 83. doi: 10.1186/1471-2148-11-83
Shih N. T., Hsu K. C., Ni I. H. (2010). Age, Growth and Reproduction of Cutlassfishes Spp. In the Southern East China Sea. J. App. Ichthyol. 27, 1307–1315. doi: 10.1111/j.1439-0426.2011.01805.x
Sun P., Chen Q., Fu C., Xu Y., Sun R., Li J., et al. (2020b). Latitudinal Differences in Early Growth of Largehead Hairtail (Trichiurus Japonicus) in Relation to Environmental Variables. Fish. Oceanogr. 29, 470–483. doi: 10.1111/fog.12490
Sun P., Chen Q., Fu C., Zhu W., Li J., Zhang C., et al. (2020a). Daily Growth of Young-of-the Year Largehead Hairtail (Trichiurus Japonicus) in Relation to Environmental Variables in the East China Sea. J. Mar. Syst. 201, 103243. doi: 10.1016/j.jmarsys.2019.103243
Tajima F. (1989). Statistical Method for Testing the Neutral Mutation Hypothesis by DNA Polymorphism. Genetics 123, 585–595. doi: 10.1093/genetics/123.3.585
Thompson J. D., Gibson T. J., Plewniak F., Jeanmougin F. (1997). And Higgins, DThe CLUSTAL_X Windows Interface: Flexible Strategies for Multiple Sequence Alignment Aided by Quality Analysis Tools. G. Nucleic Acids Res. 25, 4876–4882. doi: 10.1093/nar/25.24.4876
Tucker D. W. (1956). Studies on the Trichiuroid Fishes a Preliminary Revision of the Family Trichiuridae. Bull. Nat. Hist. Mus. 4, 73–103. doi: 10.5962/p.271719
Tzeng C. H., Cheng C. S., Chiu T. S. (2007). Analysis of Morphometry and Mitochondrial DNA Sequences From Two Trichiusus Species in Waters of the Western North Pacific: Taxonomic Assessment and Population Structure. J. Fish Biol. 70, 1–12. doi: 10.1111/j.1095-8649.2007.01368.x
Voris H. K. (2000). Maps of Pleistocene Sea Levels in Southeast Asia: Shorelines, River Systems and Time Durations. J. Biogeogr. 27, 1153–1167. doi: 10.1046/j.1365-2699.2000.00489.x
Wang P. (1999). Response of Western Pacific Marginal Seas to Glacial Cycles: Paleoceanographic and Sedimentological Features. Ma. Geol. 156, 5–39. doi: 10.1016/S0025-3227(98)00172-8
Wang H. Y., Dong C. A., Lin H. C. (2017). DNA Barcoding of Fisheries Catch to Reveal Composition and Distribution of Cutlassfishes Along the Taiwan Coast. Fish. Res. 187, 103–109. doi: 10.1016/j.fishres.2016.11.015
Wang Y., Jia X., Lin Z., Sun D. (2011). Responses of Trichiurus Japonicas Catches to Fishing and Climate Variability in the East China Sea. J. Fish. China 35, 1881–1889.
Wang X., Kong L., Chen J., Matsukuma A., Li Q. (2017). Phylogeography of Bivalve Meretrix Petechialis in the Northwestern Pacific Indicated by Mitochondrial and Nuclear DNA Data. PloS One 12, e0183221. doi: 10.1371/journal.pone.0183221
Webb S. A., Graves J. A., Macias-Garcia C., Magurran A. E., ÒFoighil D., Ritchie M. G. (2004). Molecular Phylogeny of the Livebearing Goodeidae (Cyprinodontiformes). Mol. Phylogenet. Evol. 30, 45–56. doi: 10.1016/S1055-7903(03)00257-4
Xu J., Chan T. Y., Tsang L. M., Chu K. H. (2009). Phylogeography of the Mitten Crab Eriocheir Sensu Stricto in East Asia: Pleistocene Isolation, Population Expansion and Secondary Contact. Mol. Phylogenet. Evol. 52, 45–56. doi: 10.1016/j.ympev.2009.02.007
Yang J. Q., Hsu K. C., Liu Z. Z., Su L. W., Kuo P. H., Tang W. Q., et al. (2016). The Population History of Garra Orientalis (Teleostei: Cyprinidae) Using Mitochondrial DNA and Microsatellite Data With Approximate Bayesian Computation. BMC Evol. Biol. 16, 73. doi: 10.1186/s12862-016-0645-9
Yang Y., Li J., Yang S., Li X., Fang L., Zhong C., et al. (2017). Effects of Pleistocene Sea-Level Fluctuations on Mangrove Population Dynamics: A Less From Sonneratia Alba. BMC Evol. Biol. 17, 22. doi: 10.1186/s12862-016-0849-z
Yan Y. R., Hsu K. C., Yi M. R., Li B., Wang W. K., Kang B., et al. (2020). Cryptic Diversity of the Spotted Scat Scatophagus Argus (Perciformes: Scatophagidae) in South China Sea: Pre- or Post-Production Isolation. Mar. Freshwater Res. 71, 1640–1650. doi: 10.1071/MF19337
Yi M. R., Hsu K. C., Gu S., He X. B., Luo Z. S., Lin H. D., et al. (2022). Complete Mitogenomes of Four Trichiurus Species: A Taxonomic Review of the T. Lepturus Species Complex. Zookeys 1084, 1–26. doi: 10.3897/zookeys.1084.71576
Yi M. R., Hsu K. C., Luo Z. S., Gu S., Feng B., Lin H. D., et al. (2021a). Diversity of the Family Apogonidae Along the Northwestern Coastline of the South China Sea. Cah. Biol. Mar. 62, 381–391. doi: 10.21411/CBM.A.A90D1ED2
Yi M. R., Hsu K. C., Wang J. X., Feng B., Lin H. D., Yan Y. R. (2021b). Genetic Structure and Diversity of the Yellowbelly Threadfin Bream Nemipterus Bathybius in the Northern South China Sea Diversity 13,324. doi: 10.3390/d13070324
Zheng S. Y., Liu J. H., Jia P. F. (2019). Complete Mitogenome of the Cutlassfish Trichiurus Haumela (Scombriformes: Trichiuridae) From Ningde, Fujian Province, Southeast China. Mitochondrial DNA B. 4, 87–88. doi: 10.1080/23802359.2018.1536475
Keywords: habitat characterization, oceanographic conditions, Pleistocene, species composition, wintering ground
Citation: Hsu K-C, Yi M-R, Gu S, He X-B, Luo Z-S, Kang B, Lin H-D and Yan Y-R (2022) Composition, Demographic History, and Population Structures of Trichiurus. Front. Mar. Sci. 9:875042. doi: 10.3389/fmars.2022.875042
Received: 13 February 2022; Accepted: 29 March 2022;
Published: 28 April 2022.
Edited by:
Wei Huang, Ministry of Natural Resources, ChinaReviewed by:
Qiong Shi, Beijing Genomics Institute (BGI), ChinaXiujuan Shan, Chinese Academy of Fishery Sciences (CAFS), China
Copyright © 2022 Hsu, Yi, Gu, He, Luo, Kang, Lin and Yan. This is an open-access article distributed under the terms of the Creative Commons Attribution License (CC BY). The use, distribution or reproduction in other forums is permitted, provided the original author(s) and the copyright owner(s) are credited and that the original publication in this journal is cited, in accordance with accepted academic practice. No use, distribution or reproduction is permitted which does not comply with these terms.
*Correspondence: Yun-Rong Yan, dHVuYV9wc0AxMjYuY29t; Hung-Du Lin, dmFyaWNvcmhpbnVzQGhvdG1haWwuY29t
†These authors have contributed equally to this work