- 1State Key Laboratory of Estuarine and Coastal Research, East China Normal University, Shanghai, China
- 2Laboratory for Marine Geology, Qingdao National Laboratory for Marine Science and Technology, Qingdao, China
Mangrove forests grow on tropical and subtropical coastlines and play a significant role in reducing hydrodynamic energy. However, little information is known about the mechanism of wave attenuation caused by mangroves of different ages, even though the effects of mangroves on wave damping have received widespread concern. Here, a series of systemic biohydrological data were collected along a cross-shore transect through mangroves with different ages of native Aegiceras corniculatum (AC) distribution in the Nanliu Delta of China and were analyzed to investigate wave attenuation over mangroves during different tidal conditions. The results showed that the wave height decreased nearly 58.33%, with a transport distance of 275 m in the AC seedling-sapling region, and approximately 80%, with a transport distance of 1,000 m in the sapling-adult region, on average. The largest wave height attenuation rate of 3 × 10⁻³ was found in the measured time period and occurred in the seedling-sapling section during the neap tide, while the sapling-adult region had a basically constant reduction rate of 0.8 × 10⁻³ under changing tidal conditions. Moreover, the drag coefficient calculation indicated that an AC seedling with a height of nearly 0.55 m was more effective in attenuating wave energy than the stem part of a grown tree with a height of nearly 1.2 m. AC seedlings and saplings have significant impacts on wave damping, even though the stem part of an adult AC could produce a decline in wave energy. Moreover, differences in the drag coefficient caused by stems and canopies were responsible for wave attenuation, and the degree of AC inundation volume induced by water level fluctuation might affect the wave damping effect. Our results documented distinct differences in the wave attenuation process by mangroves of different ages, which can inform superior designs of mangroves along coasts against a background of sea-level rise and the occurrence of frequent typhoons.
1 Introduction
As one of the most productive halophytic populations situated in the intertidal areas of tropical and subtropical coastlines (Tomlinson, 2016; Van der Stocken et al., 2019), mangrove forests have extraordinary buffering and carbon stock functions (Horstman et al., 2014; Atwood et al., 2017). A 100-m-wide belt of mangroves with 30 trees per 100 m2 has the capacity of 90% to reduce flow pressure by 90% during a catastrophic tsunami (Danielsen, 2005). Several examples have indicated that mangrove forests prevent urban areas and villages from being destroyed by large waves, storm surges, and tsunami disasters (Danielsen, 2005, Mazda et al., 1997a, McIvor et al., 2015). Hurricane Wilma, which attacked the gulf coast of south Florida in America on 24 October 2005, was attenuated by a 6–30-km-wide mangrove band and prevented an area of 1,800 km2 from becoming inundated by decreasing the wave amplitudes (Zhang et al., 2012). Hepu County in Guangxi Province in China, as the starting point of the Maritime Silk Road in the Han Dynasty (Han and Yang, 2004), suffered the destructive Typhoon Sarah (No. 8609) with a wave height of greater than 3 m on 21 and 22 July 1986, resulting in a large financial loss of 172 million CNY and affecting more than 418 thousand people. Ninety percent of the sea walls were damaged, yet those that were protected by stretched mangroves were slightly broken or even intact (Chen et al., 2013). (Wu et al., 2021) adopted an applicable numerical model and indicated that the average typhoon wave height in the South China Sea was within 3.0–9.2 m. Therefore, while potential climate change has induced an increase in the occurrence of extreme events (Easterling, 2000), there is an urgent need to comprehend the living and coping mechanisms of these crucial forests in increasingly harsh circumstances.
Mangrove forests survive in a relatively quiescent zone of estuaries and bays; nevertheless, they experience moderate waves in normal weather or attenuate large waves from tsunamis and typhoons (Alongi, 2008; Alongi, 2009). Studies on the function of the wave attenuation of mangroves have received attention and have employed field and laboratory experiments or numerical models since the late nineties (Quartel et al., 2007; Alongi, 2009; Bao, 2011; Willemsen et al., 2016; Montgomery et al., 2019). For instance, Vo-Luong and Massel (2008) observed a significant wave reduction in a mixed mangrove forest of Avicennia sp. and Rhizophora sp. in Vietnam. Through laboratory experiments, Tuyen and Hung (2009) indicated that shallower water obtained a larger wave energy reduction rate. Parvathy and Bhaskaran (2017) revealed that a mild slope along mangrove tidal flats can reduce 93–98% of wave energy by Simulating Waves Nearshore (SWAN) modeling. Popular field observations in recent decades have mainly focused on mangrove trees grown over a single age period, and normal laboratory experiments have adopted artificial structures to simulate the dissipation process (Bao, 2011; McIvor et al., 2012; Abdullah et al., 2019). Moreover, most of the numerical models concentrate on biomechanical or hydrodynamic conditions of specific vegetation (Peralta et al., 2008; Vo-Luong and Massel, 2008; Thuy et al., 2017). Nonetheless, the wave attenuation process during half a lunar cycle for different ages of mangroves has been poorly captured by field observations.
Furthermore, both laboratory studies and field observations demonstrate that a proportional relationship between the submerged conditions of mangroves and attenuation effects can be found in dense mangroves in Vietnam and China (Quartel et al., 2007; Augustin et al., 2009; Chen et al., 2016). However, Mazda (2006) found that the wave reduction rate was proportional to the water level when the water rose above the canopy of Sonneratia sp. in northern Vietnam. Kinver (2016) indicated that the wave damping rate was determined by the distance of wave propagation along a mangrove band. Moreover, drag forces controlled by the inundation volume of young Rhizophora specimens generated the highest wave damping efficiency (Maza et al., 2021). Thereafter, various factors resulted in the distinct effects of wave dissipation based on the measured cases from Japan, China, and Australia (Brinkman, 2006; Cao et al., 2016). The conundrum about the leading mechanism of wave reduction among mangroves of different ages needs to be resolved.
Approximately 8,374.9 hm2 of mangroves extend along the coastline of the Beibu Gulf, located in the subtropical and tropical zones, where approximately 30% of the total area is occupied by mangroves in China. Moreover, more than 45% of the mangrove forests around the Beibu Gulf are predominantly distributed in the Nanliu Delta (Figure 1A). The Nanliu Delta, as the largest delta of the Beibu Gulf in Southwest China, is fed with 51.3 × 10⁸ m³ of water discharge and 1.18 × 10⁶ t of sediment discharge from the Nanliu basin yearly (Li et al., 2017) (Figures 1A, B). Mangroves are distributed widely along deltaic tidal flats, which can be highly efficient in protecting coastal zones over 500 km from the typhoon-induced wave attraction, especially as in the case of the unprecedented storms in 1986 (Chen et al., 2013). Therefore, the seaward mangrove tidal flat of Qixing Island, located in the central Nanliu Delta, provides a typical case for determining the coupling effects between mangroves and hydrodynamic behavior, especially the attenuation process across the entire tidal flat from low to high areas, with distributions of aboriginal Aegiceras corniculatum (AC) of different ages. The aims of this study are to reveal the wave damping process during half a lunar cycle among AC of different ages and to discern the respective wave attenuation abilities induced by the stem and canopy parts of AC under different tidal conditions. The results derived from this study are beneficial references for constructing a “green embankment” as a defense against storm hazards in the context of global warming.
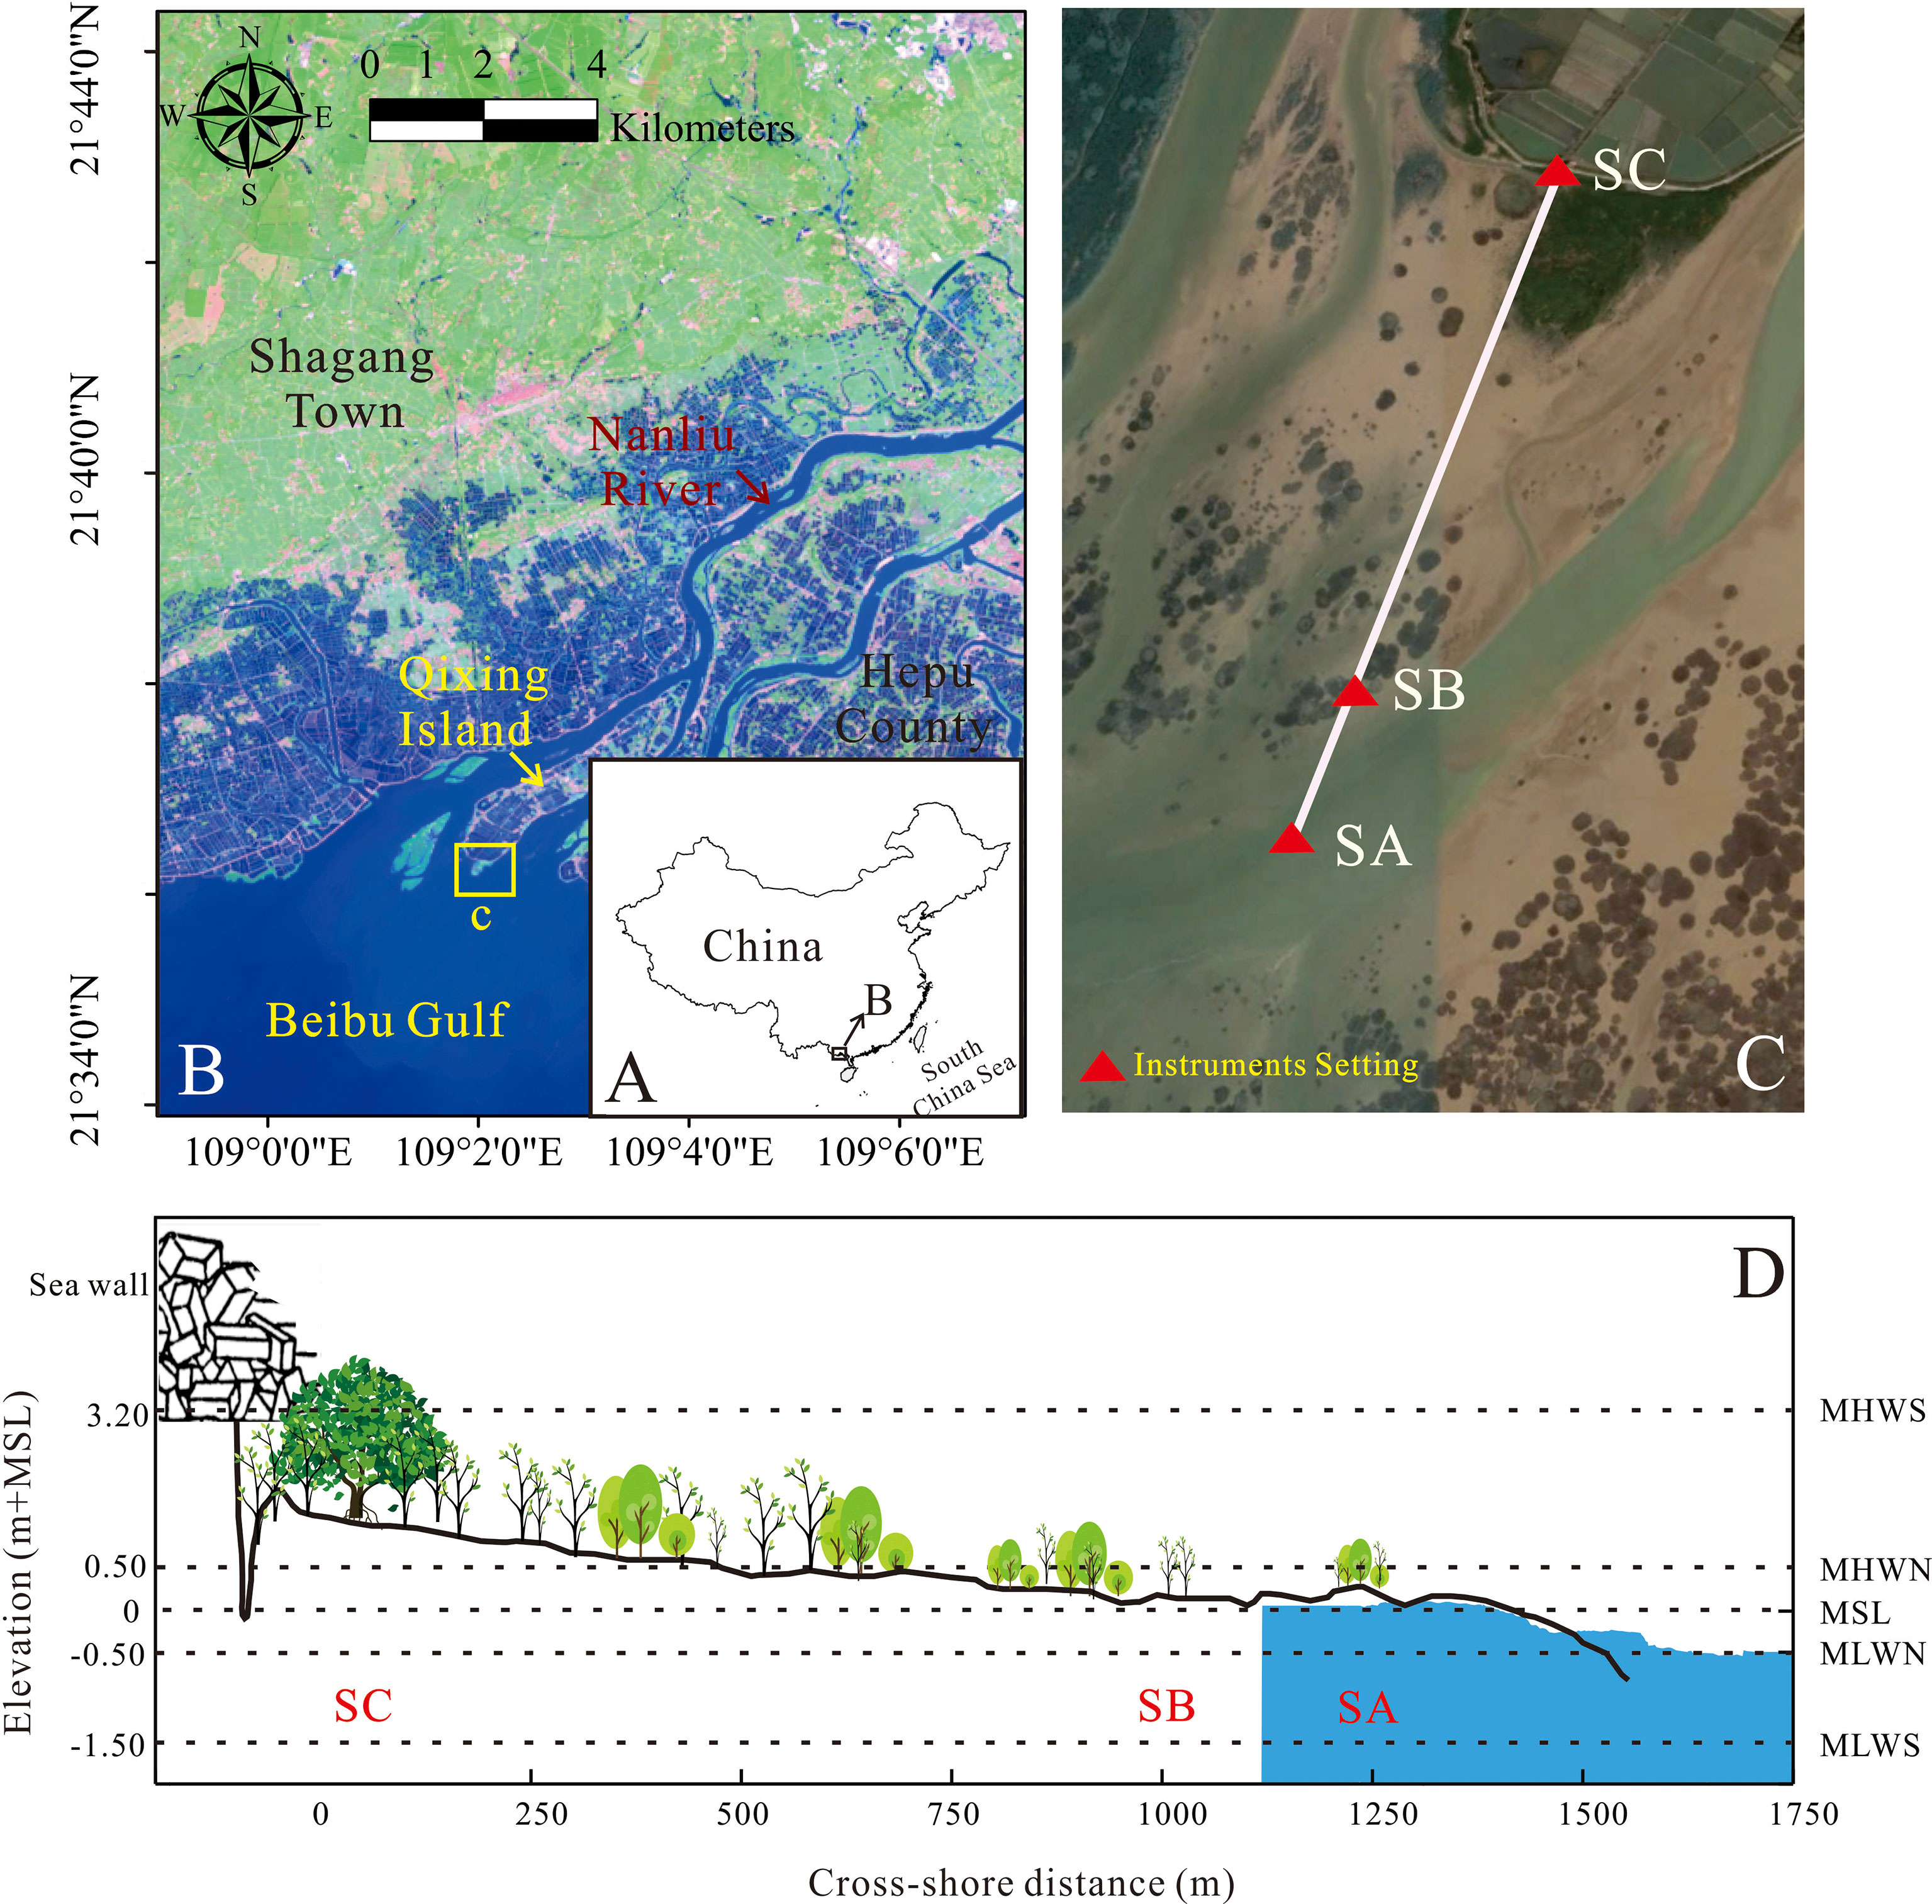
Figure 1 (A) Map of the Beibu Gulf with its location in relation to China; (B) study area in relation to Hepu County, Beibu Gulf, and Nanliu River; (C) tripod setting location on the Aegiceras corniculatum tidal flat; (D) elevation with respect to the mean sea level (MSL) of the cross-shore transects with relative distance from the inshore tripod, with instrument tripods and mixed age A. corniculatum. Tidal water levels are indicated on the right axis (MHWS, mean high water level at spring tide; MLWS, mean low water level at spring tide; MHWN, mean high water level at neap tide; MLWN, mean low water level at neap tide).
2 Methods
2.1 Data Collection
The Nanliu Delta is dominated by irregular diurnal tides with an average and maximum tidal range of 2.46 and 5.36 m, respectively. The nearshore wave climate in this region varies seasonally with a maximum average wave height of 1.36 m (State Oceanic Administration, 1998), yet the maximum current speeds are 0.26–0.36 m/s (Huang et al., 2022). AC is dominantly distributed over Qixing Island, which is located at the delta center with scattered Cyperus malaccensis patches. The mean grain size of sediments over the AC tidal flat ranges from 0.2 mm in the seedling-sapling region to 0.04 mm in the sapling-adult region. A transverse transect through an AC tidal flat composed of 3 hydrological tripods was set up on the south side of Qixing Island (Figure 1C). Three tripods were positioned along a transect with a length of 1.275 km. The Tripod SC (109°2’12.69”E, 21°36’9.73”N), with a location height of 2.63 m above mean sea level in Beihai, was set at the upper part of the AC tidal flat, with mixed adults and saplings (Figures 2C, F). The Tripod SB (109°2’2.04”E, 21°35’39.03”N) with a relative location height of 1.17 m, was set at the transition region between the adult AC tree region and the seedling region. Additionally, tripod SA (109°1’58.48”E, 21°35’30.47”N), with a relative location height of 0.25 m, was set offshore in an area with mixed saplings and small seedlings. The distance from tripod SA to tripod SB was 0.275 km, and that from SB to SC was 1 km (Figure 1D).
Furthermore, wave recorders (RBR-2050 and RBR-solo3) were placed in line at these three tripods along the AC transect to obtain the wave and tide information from the 16th to the 29th of August 2019. These recorders are robust and have internal memory and battery housing so that they can collect the data autonomously. The sampling start time can be set at every deployment. Based on previous work conducted in mangrove tidal flats (Quartel et al., 2007; Horstman et al., 2014), the instruments logged data at 4 Hz over a consecutive 512 s (~8 min) period every 20 min (2,048 samples per burst), and they were fixed 10 cm above the ground, which can indicate the wave variation during an entire tidal period. The wave recorder used in this observation had an effective measuring range for wave heights of 0.005–10 m. The measured water depth was converted to the water level based on mean sea level.
2.2 Data Processing
2.2.1 Mangrove Volumetric Cover Calculation
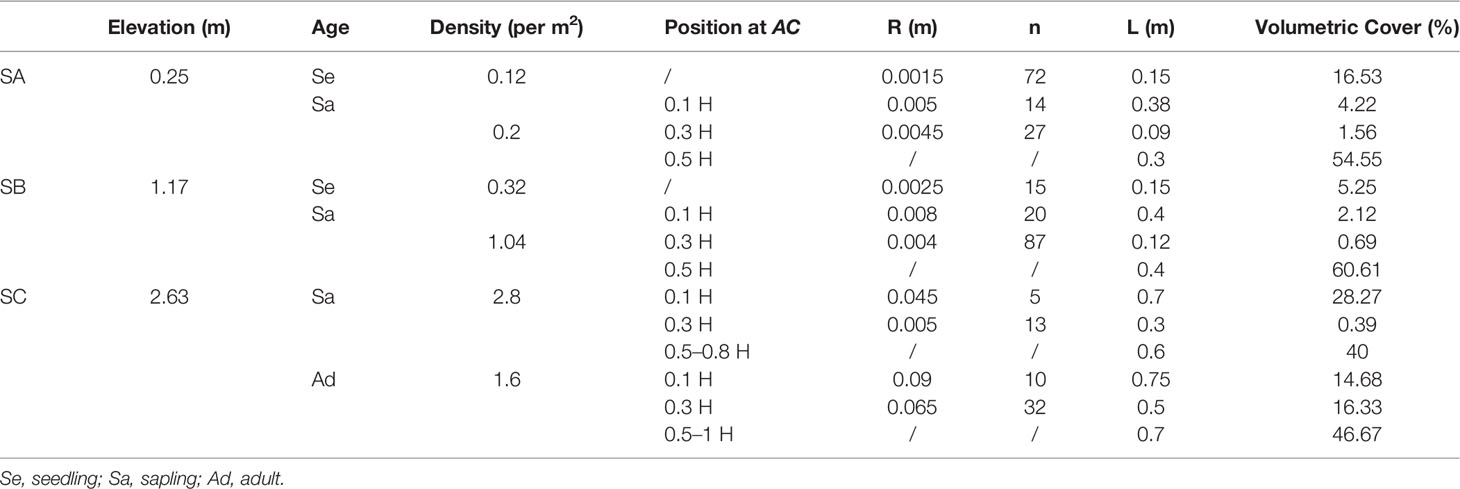
Three investigation zones were selected along the tripod transect to quantify vegetation parameters, and two plots were randomly distributed per zone to acquire general information about the area. Each plot was 5 × 5 m2 and was close to the hydrodynamic (Figures 2A–C) tripod, where AC, including adults, saplings, and seedlings, were present (Figures 2D–F). The height (H), length (L), and width (W) of the AC canopy in these three plots were measured (Figure 3). Stem diameters were obtained at 0.1, 0.3, 0.5, and 0.8 H above the bed. Each stem diameter and the number of stems at each height was also collected during the measurement (Figure 3, Table 1). Then, detailed information was transformed into volumetric cover (%) at different heights via Formula (1) deployed by Mazda et al. (1997b), which can quantify the occupation of the different parts of mangroves and the effect caused by this part.
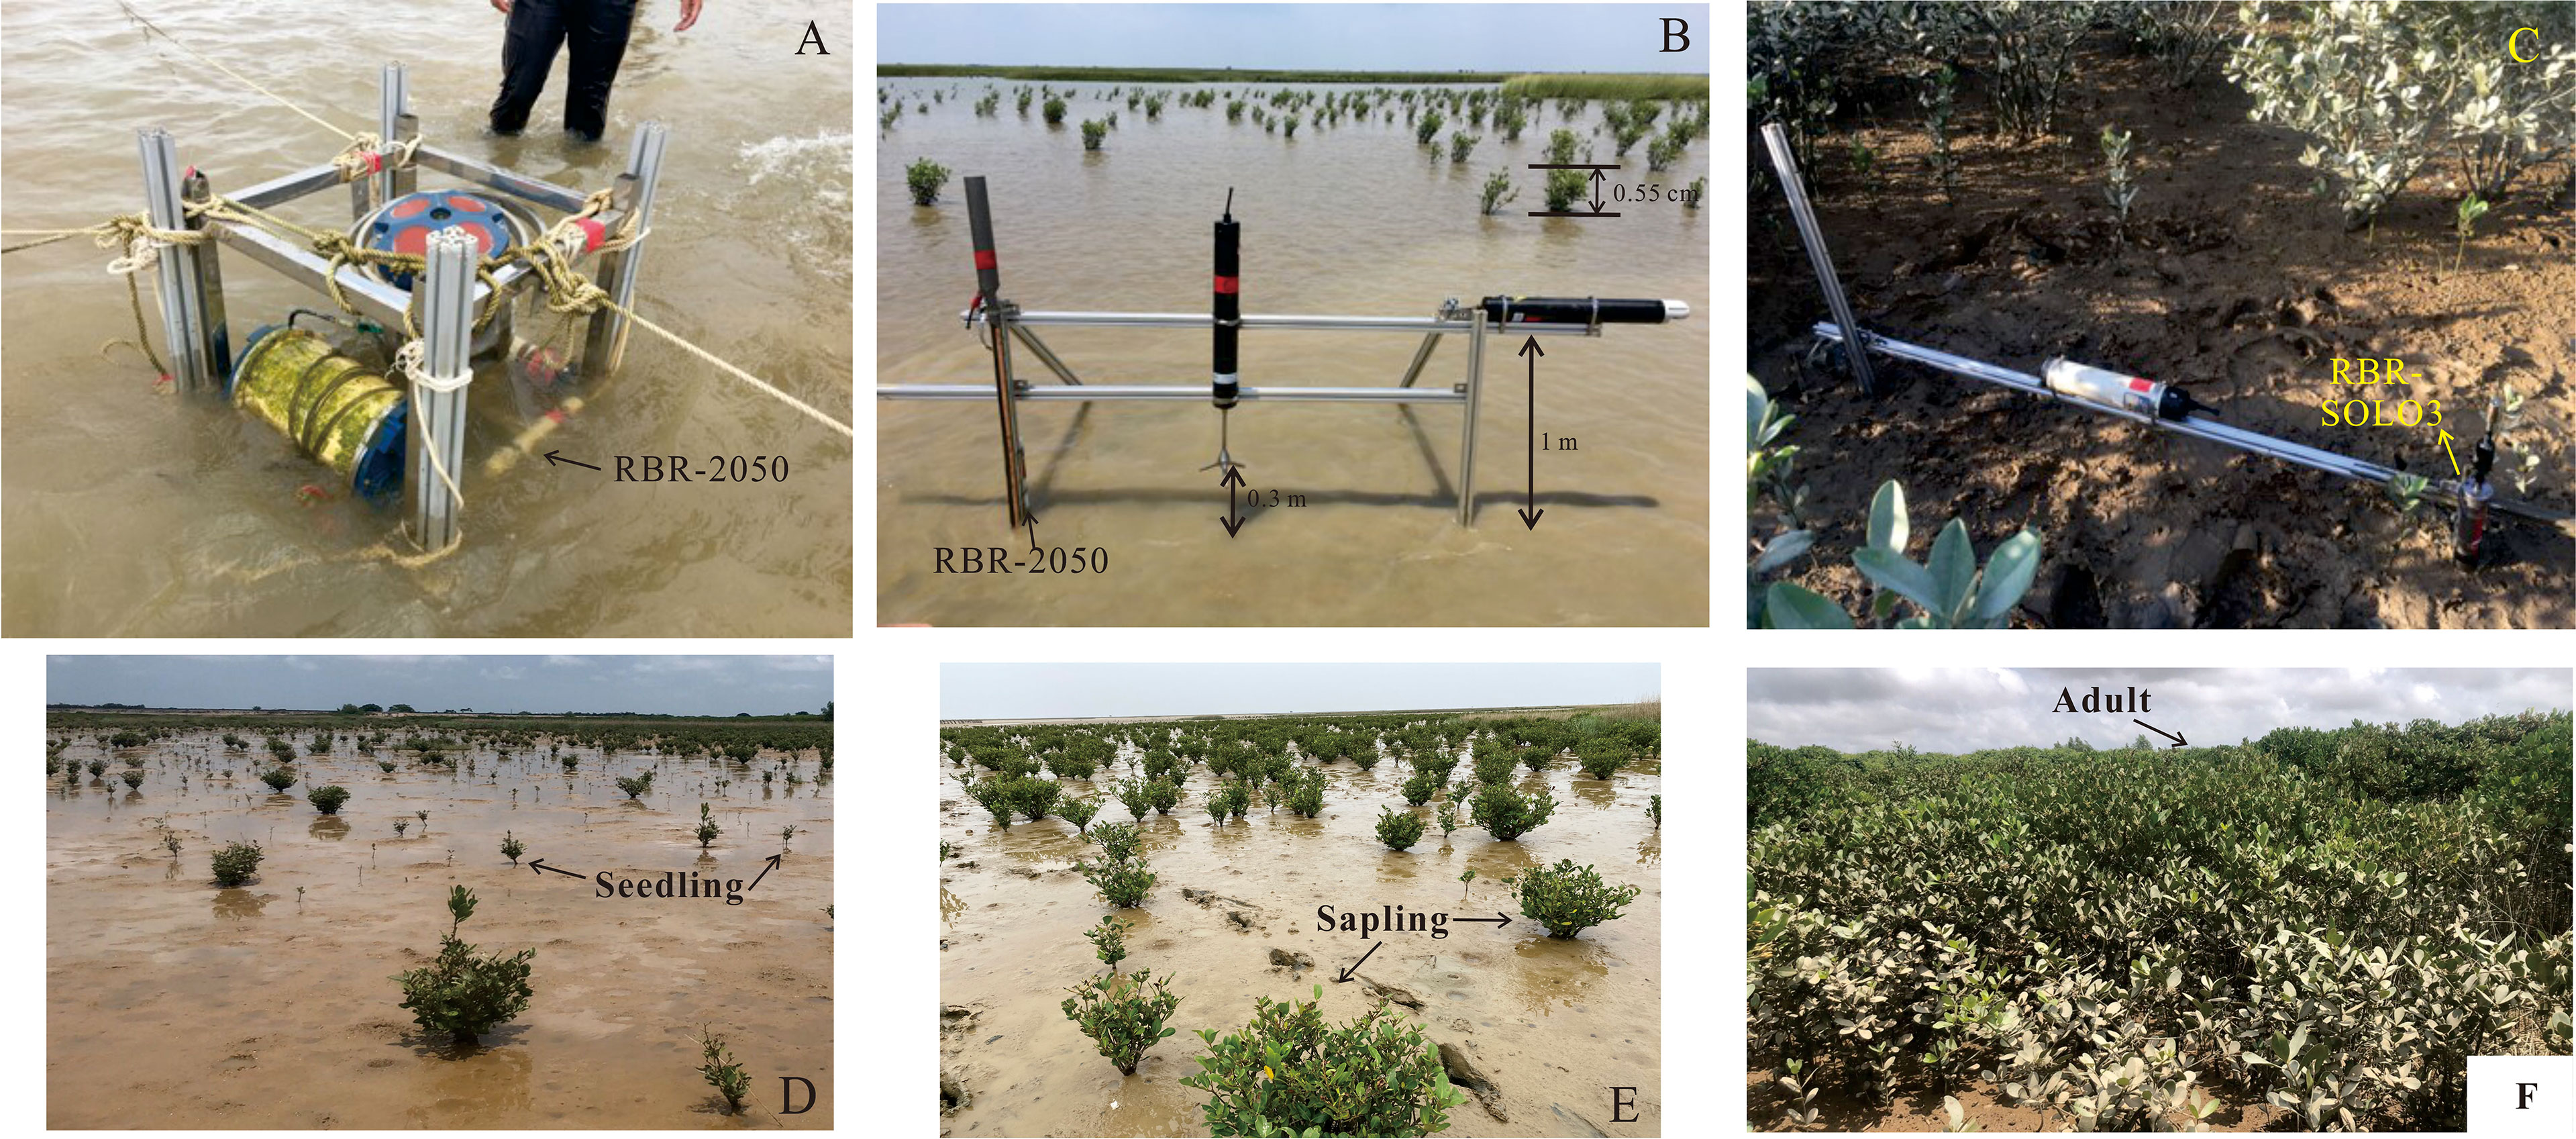
Figure 2 (A–C) show the deployment of each tripod and instrument placement method, which includes SA) RBR-2050; SB) RBR-2050; and SC) RBR-SOLO3. (D–F) show the distribution of mangroves of different ages. .
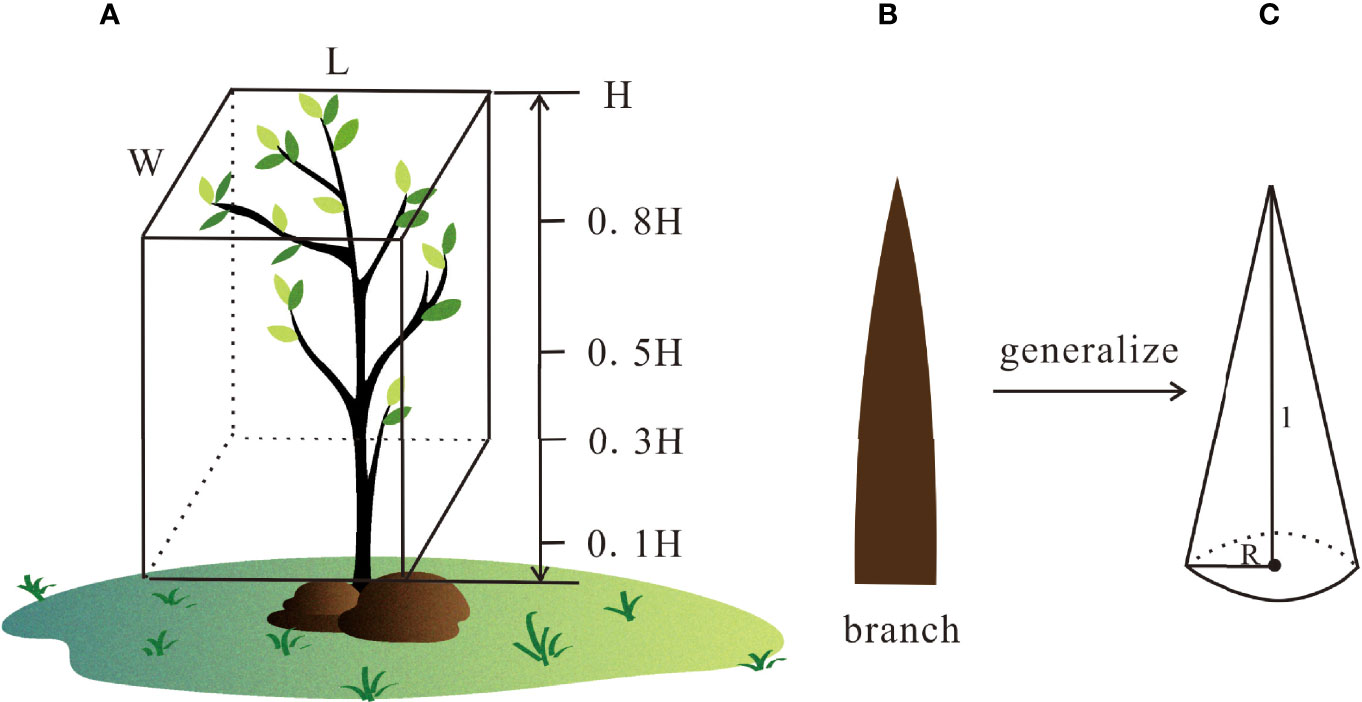
Figure 3 Calculation method of the volumetric cover. (A) W, L, and H refer to the width, length, and height of the plant canopy; (B) a single branch extracted from Aegiceras corniculatum, which is generalized in (C) l and R refer to the length and radius of a single branch, respectively.
To calculate the volumetric cover at different heights, every branch was simplified to a circular cone (Figure 3), and its radius and length were obtained. The volumetric cover of a single tree was acquired by Formula (1):
where R, l, and n are the mean radius, length, and number of branches at different heights, respectively. For small seedlings or samplings that were not high enough, only 0.1 to 0.5 H were measured. W, L, and H are the width, length, and height of the canopy, respectively. Since seedlings and saplings were not high enough to reach 0.5 H, measurements were limited to 0–0.5 H for these plants.
2.2.2 Wave Attenuation Calculation
Based on the wave data collected from 16 to 29 of August 2019, the average wave heights, periods, and wave energies every 20 min at the three stations were acquired directly from the wave recorders at each spring, middle, and neap tide. Water surface fluctuation data were processed by fast Fourier transforms (FFT) at bursts of 90–94, 236–241, and 570–576 to observed density spectrum changes with different frequencies at flood tide during spring, middle and neap tides, respectively. Bursts 95–98, 242–244, and 577–578 were observed at the ebb tide during the spring, middle, and neap tides, respectively. The wave components were also detected via this method. Moreover, the wave energy density for each burst was also calculated based on (Hegge and Masselink, 1996) Fourier analysis scheme.
Moreover, according to the definition proposed by (Mazda et al., 2006), the wave height reduction rate per unit length is:
where r is the wave attenuation rate and Δx is the distance between two observation stations. H is the wave height offshore, and ΔH is the wave height difference observed by the two stations. Here, the wave height reduction rate was calculated by adopting this formula to infer the attenuation ability of mangroves.
Regarding wave propagation in the shoaling zone, Mazda et al., (1997b) proposed the following:
where H1 and H2 are offshore and onshore wave heights, respectively. Δx is the distance between two observation stations. h is the average water depth of the two stations. Thus, the drag coefficient CD can be inferred as:
The coefficient is affected by vegetation density. Since each region had a unique density, CD was calculated for each region to manifest the resistance effect generated by AC.
3 Results
3.1 Distributions of AC
AC along the selected transect from SA to SB covered seedlings of 1 year of age and sparse saplings of 2–3 years of age. Seedlings in this region were approximately 0.19 m high, with canopy sizes of 0.09 m in width and 0.09 m in length. Saplings in this region were 0.55 m high with a canopy size of 0.2 m in width and 0.3 m in length (Table 1). Adults were distributed at a relative elevation of 2.63 m, which was above the mean high water level during spring tide (MHWS), with heights, widths, and lengths of 1.5, 1.7, and 1.7 m, respectively (Figure 4).

Figure 4 (A) Hydrodynamic information obtained by the three tripods from the 16th to the 29th of August 2019. Black lines refer to the data captured by tripod SA. Red dotted lines refer to the data captured by tripod SB, and blue lines refer to the data captured by tripod SC; (B–D) show the inundation states of mangroves in the spring, middle, and neap tides, respectively.
Moreover, canopy locations of adult AC were slightly higher than the MHWS water level (Figures 1D, 4A, B), and canopies of saplings or seedlings still emerged when tides arrived at the mean high water level during neap tide (MHWN).
Furthermore, the mean water levels during the spring tide were 2.38, 1.46, and 0.73 m at the locations of tripods SA to SC (Figure 4B), respectively, indicating that the canopies of mangroves at SA and SB were submerged most of the time due to tidal level fluctuations. AC at the SC site could be inundated only to the branch position with the canopy part exposed to the air. The same situation also occurred at middle tide, with water levels of 1.99, 1.34, and 0.62 m (Figure 4B), respectively, from offshore to the inshore station. Moreover, during the neap tide, AC at the SA station was wholly submerged, as the depth was 1.17 m. The water level was 0.49 m at tripod SB, where branches of mangroves can be submerged. At tripod SA, a fully adult mangrove was almost exposed to the air since the water level was less than 0.07 m (Figure 4D).
3.2 Characteristics of the Wave Density Spectrum at Different Mangrove Locations
The energy density varied distinctly with the AC of different ages at each station (Figures 5A, B). Specifically, the wave spectra remained unimodal during spring and neap tides (Figures 5A, C) and bimodal (Figure 5B) during midtide. The wave energy densities increased with rising water levels (Figure 5, blue lines in boxes A, C) and decreased with falling water levels during spring and neap tides (Figure 5, red lines in boxes A and C). The energy density in the seedling-sapling region during the spring tide accepted the most powerful energy. The values varied from 0.03 to 0.055 × 10⁻³ m2s and decreased to 0.009 × 10⁻³ m2s from bursts of 90–94 (Figure 5A, 1–5) to 95–98 (Figure 5A, 6–9), respectively. For SB (Figure 5A, 10–14), the value first increased from 0.005 to 0.013 and finally decreased to nearly zero (Figure 5A, 15–18). Although the wave energy at SC was weak at every burst, its trend was the same as that of the other two tripods that were proportional to the water level (Figure 5A, 19–23). Similar to the spring tide, the energy density changed from 0.21 to 1.18 × 10⁻⁶ m2s during rising water and declined to 0.18 × 10⁻⁶ m2s in SA.
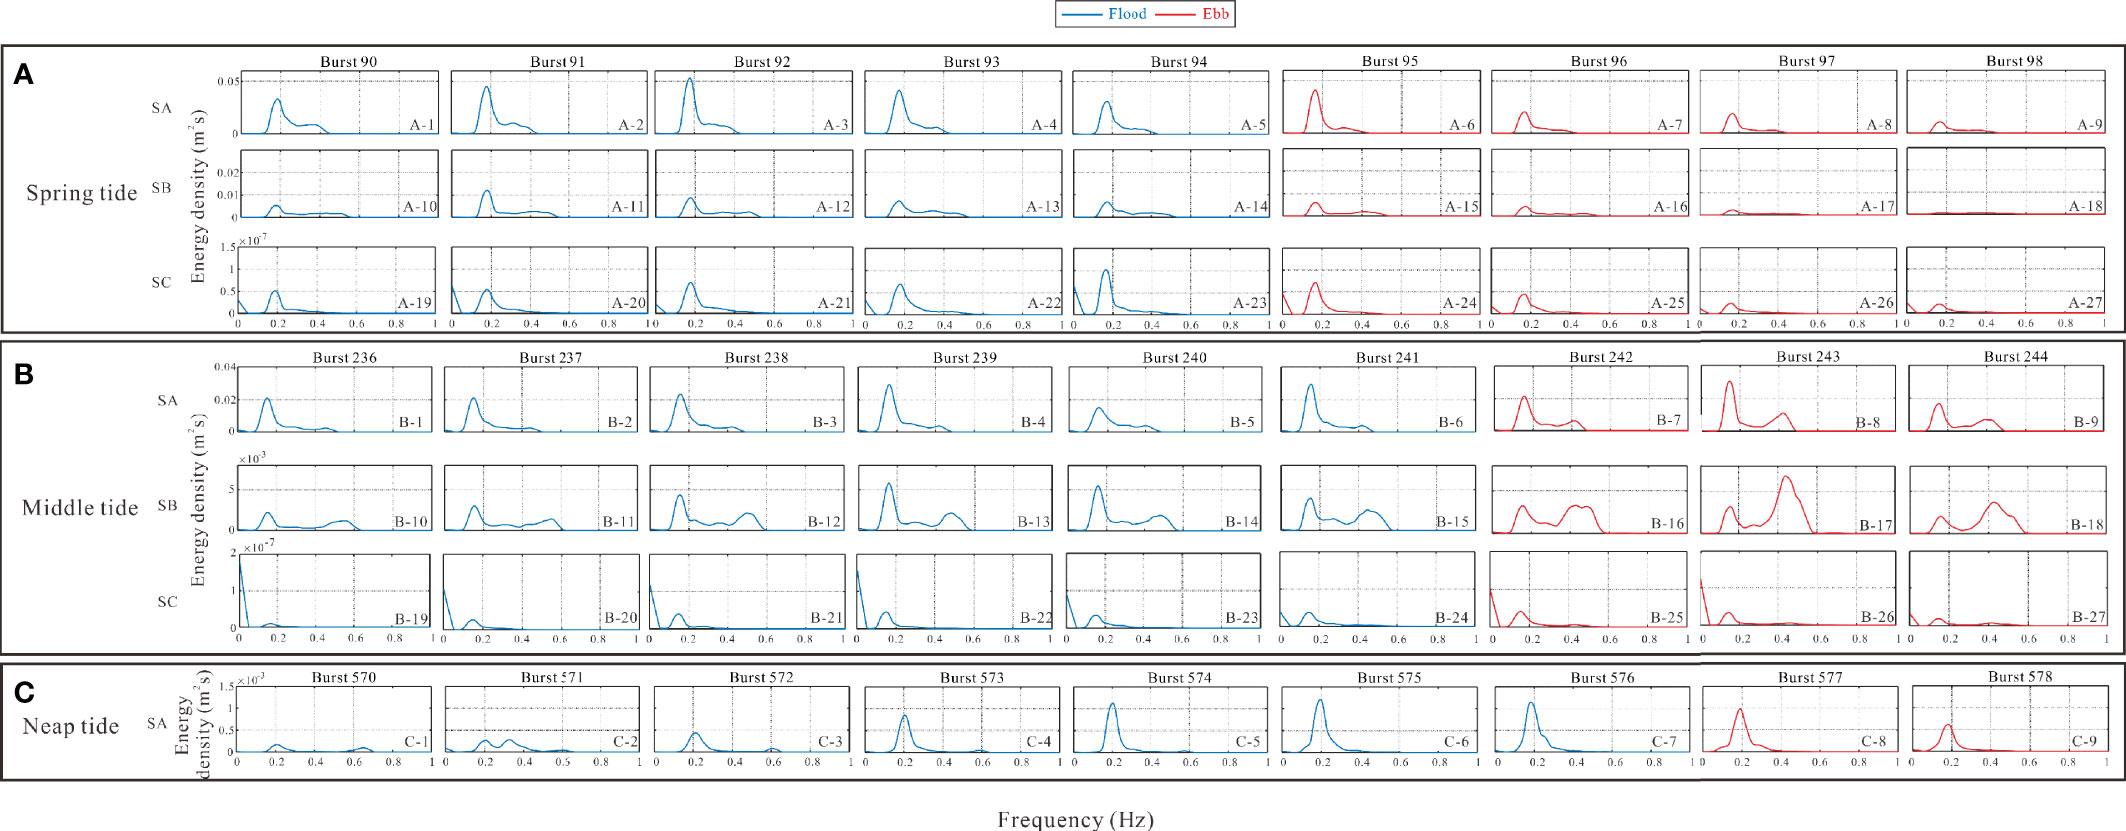
Figure 5 Energy density of the three observation tripods depicted from spring (box A), middle (box B) and neap (box C) tides.
The energy spectrum shape at the middle tide appeared bimodal, with the related high-frequency crest tending to occur during the falling water period (Figure 5B, 7–9) in the seedling-sapling region, and the higher-frequency crest occurred first. The energy of the former crest decreased, while that of the latter increased. The interaction between waves and seedlings-saplings was drastic during the middle tide with a relatively constant water level (Figure 4C), resulting in a transition of wave composition from unimodal to bimodal, with the latter crest occurring at 0.4–0.6 hz (Figure 5B, 10–18).
3.3 Variations in Wave Conditions Along the AC Tidal Flat
The wave environment during the observation period was dominated by a southwest (SW) wind with speeds of 0.15–0.32 m/s, indicating normal weather (Figure 6A). Significant wave heights showed distinct attenuation along the transect during different periods (Figure 6B). The average significant wave height was attenuated when it passed through every region during the spring tide. Specifically, from SA to SC, the wave height values were 0.1, 0.05, and 0.01 m, respectively. A similar declining trend was observed in every tidal period. At middle tide, the mean wave height along the transect decreased from 0.08 and 0.04 m to 0.008 m from SA to SC. Only wave data at tripod C were valid during neap tide, where the significant wave height was 0.02 m (Figure 6A). Limited by the low water level, no valid data were captured by the instruments at SB and SC in the neap tide. In summary, the wave height decreased by 58.33% in the SA–SB region and 80% in the SB–SC region on average during different tidal conditions.
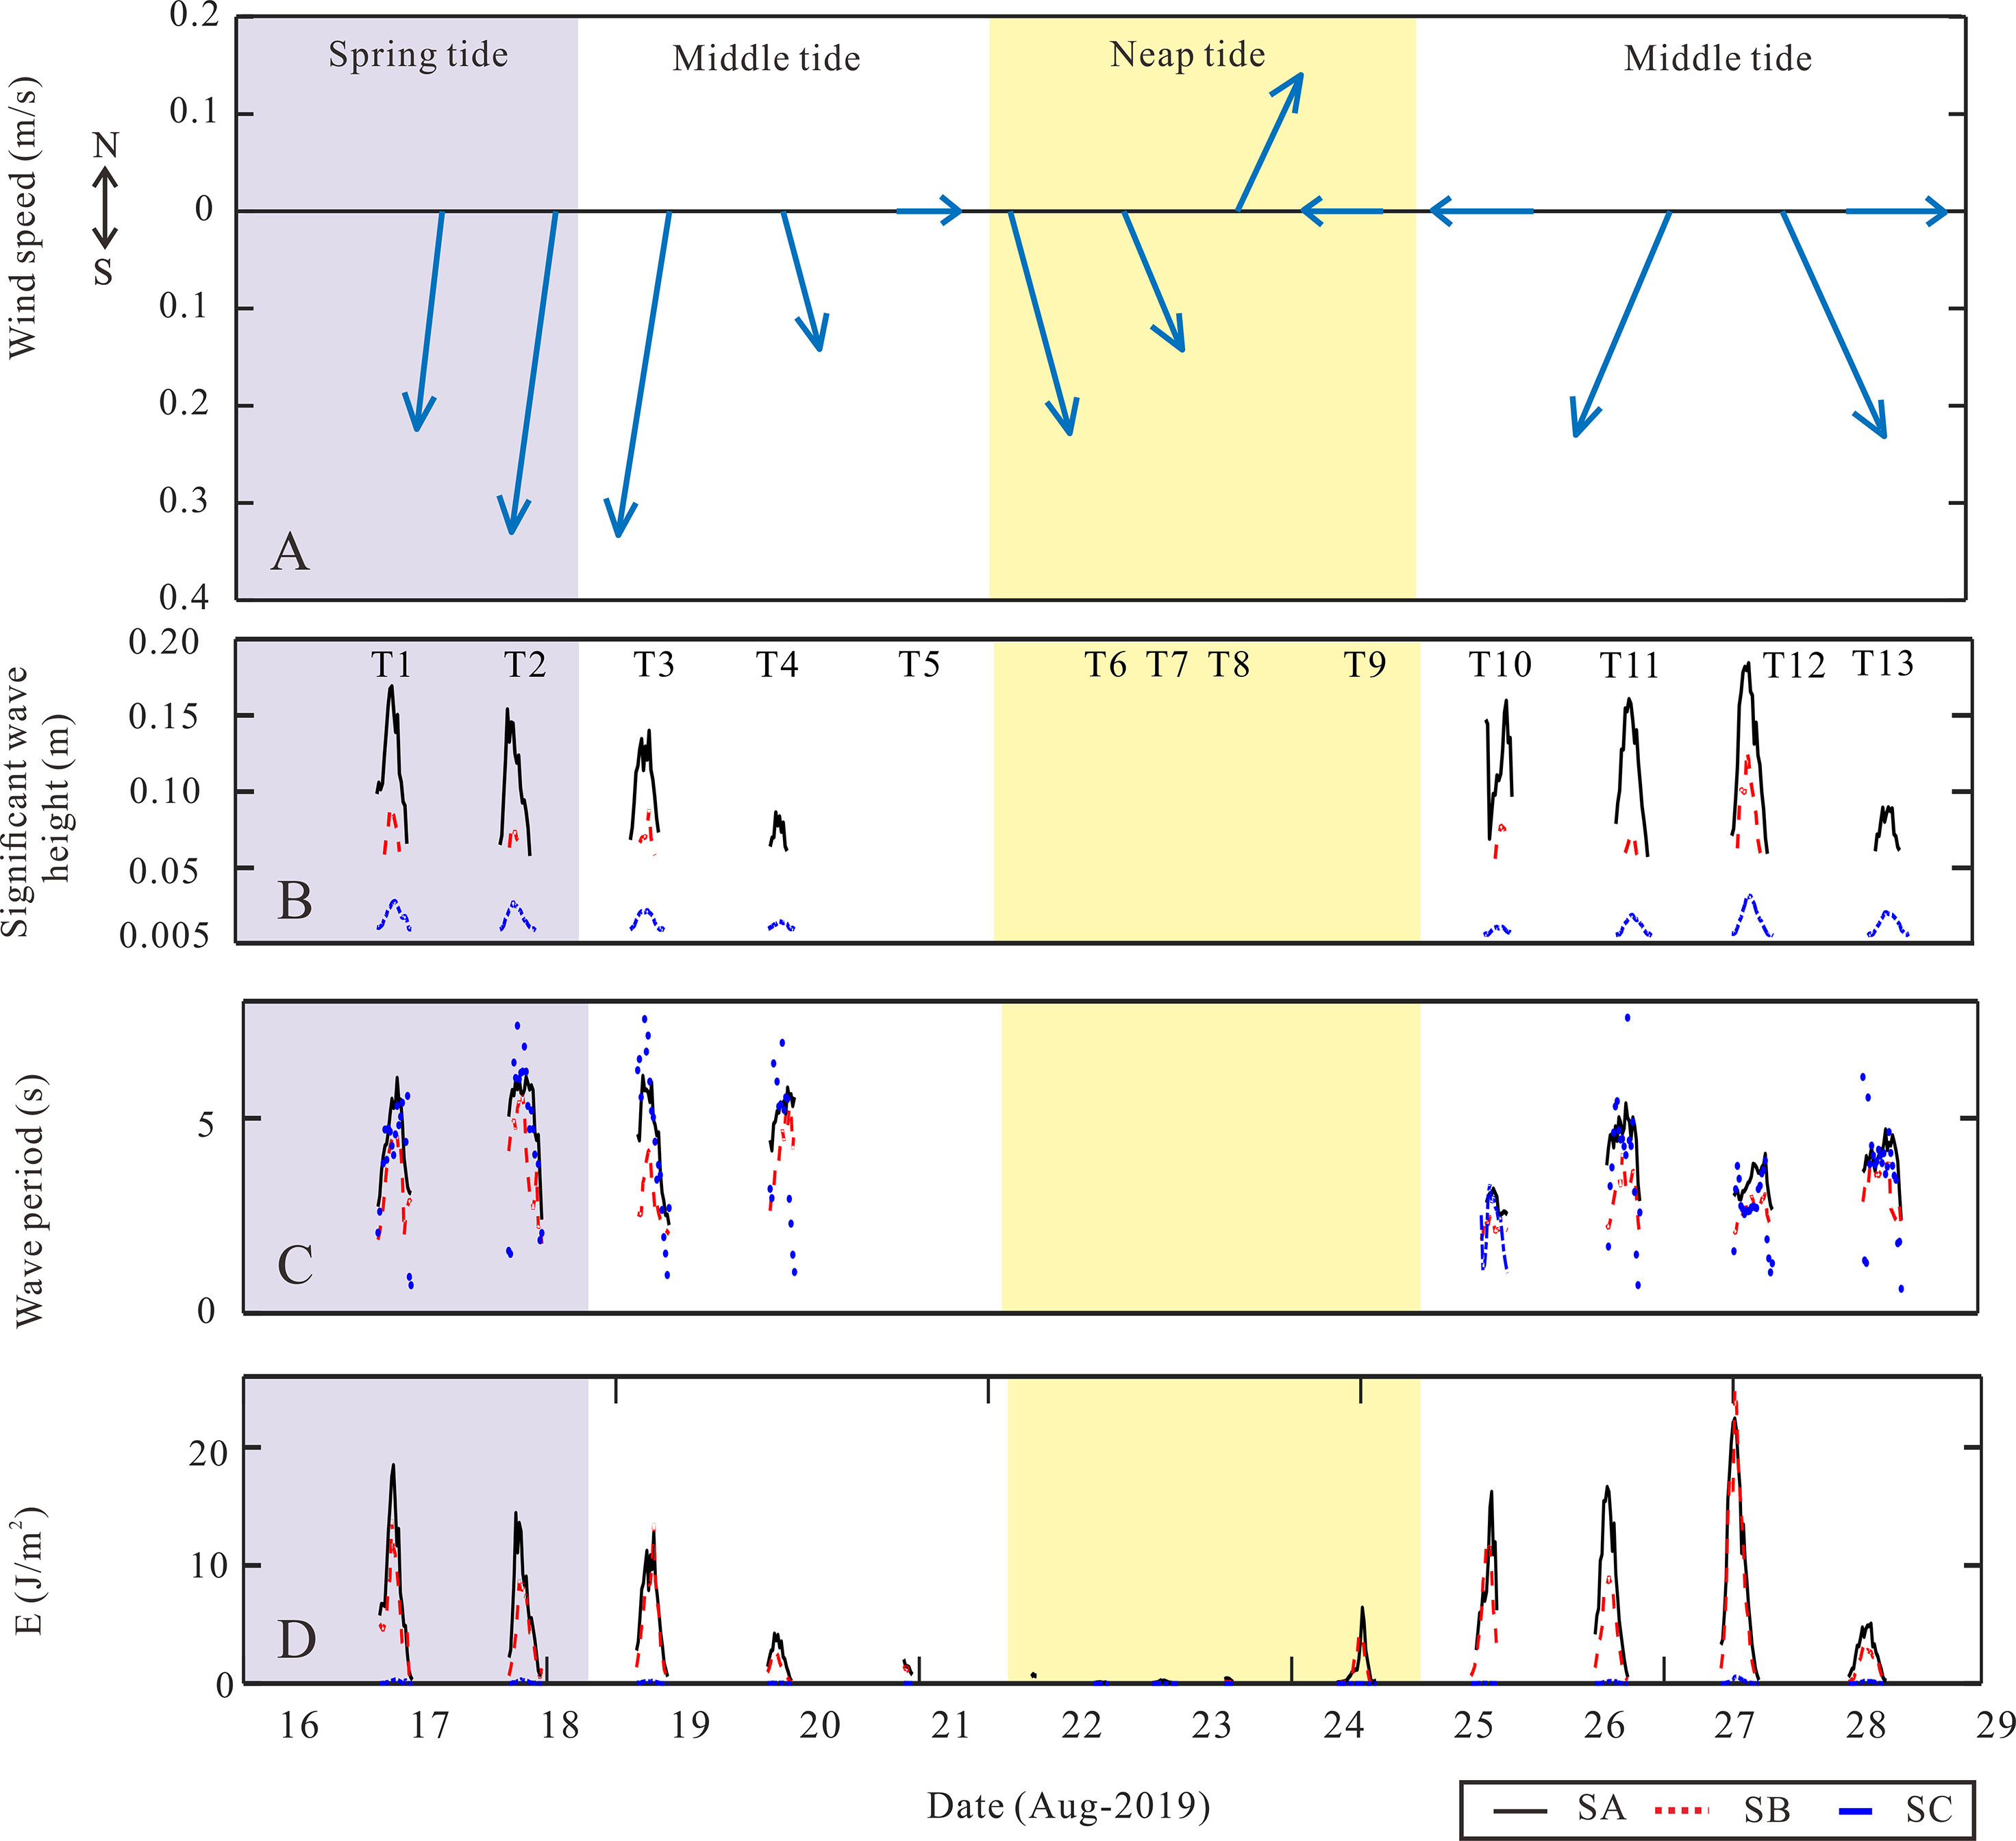
Figure 6 Purple, white, and yellow shadows representing the periods during spring, middle, and neap tides, respectively. The figure describes (A) wind information during the observation period; (B) significant wave height; (C) wave period; and (D) wave energy. Data from the SA station are shown as black lines. Data from the SB station are shown as red dotted lines and data in the SC station are shown as blue lines. .
However, wave periods did not exhibit the same trend from the SA to SC station as wave height did. During spring tide, the average wave periods from SA to SC were 5.07, 4.52, and 5.34 s, respectively. Periods shortened at the middle of the tide, when the values were 4.20, 2.31, and 4.04 s, respectively. Only the SA station had a 2.31 s wave period during the neap tide. The average wave periods of the SB station were the shortest of all tide periods. However, from spring to middle to neap tide, the wave periods all shortened at these observation stations (Figure 6B).
Moreover, the average wave energy dissipated along this transect under different tidal conditions (Figure 6C). During spring tide, the wave energy decreased from 7.44 J/m2 at tripod SA to 5.65 J/m2 at tripod SB and finally remained at 0.12 J/m2 when the wave arrived at tripod SC, reducing nearly 98.39% of the incident wave energy. During the middle tide, the wave energy declined from 6.86 and 4.18 to 0.08 J/m2 from SA to SC, reducing the incident wave energy by nearly 98.83%. During the neap tide, only tripod SA detected a faint energy of 0.48 J/m2. Both the significant wave height and energy experienced an obvious decline when the waves spread from offshore to the AC tidal flat.
3.4 Variation in the Wave Reduction Rate With Wave Propagation Distance
The wave height reduction rate along the AC transect was measured to evaluate the wave damping ability at these three tripods (Figure 7). The rate of the incident wave height reduction experienced a declining process with a longer propagation distance under different tidal conditions. Specifically, during spring tide, the rate varied from 1.8 × 10⁻³ to 0.79 × 10⁻³ from the areas of SA–SB to SB–SC. The variation ranges were 2.3 to 0.8 × 10⁻³ in the middle tide from the SA–SB region to the SB–SC region. The rate was 3.0 × 10⁻³m−3/m from region SA to SB during the neap tide. The wave height reduction rate was negatively related to the water level during the whole tidal period along the observation transect (Figure 7), indicating that deeper water may cause a weaker reduction rate. However, the region from SB to SC experienced an extremely low water level during the neap tide, and an emerged state of the AC (Figure 3D) was induced when no wave attenuation occurred.
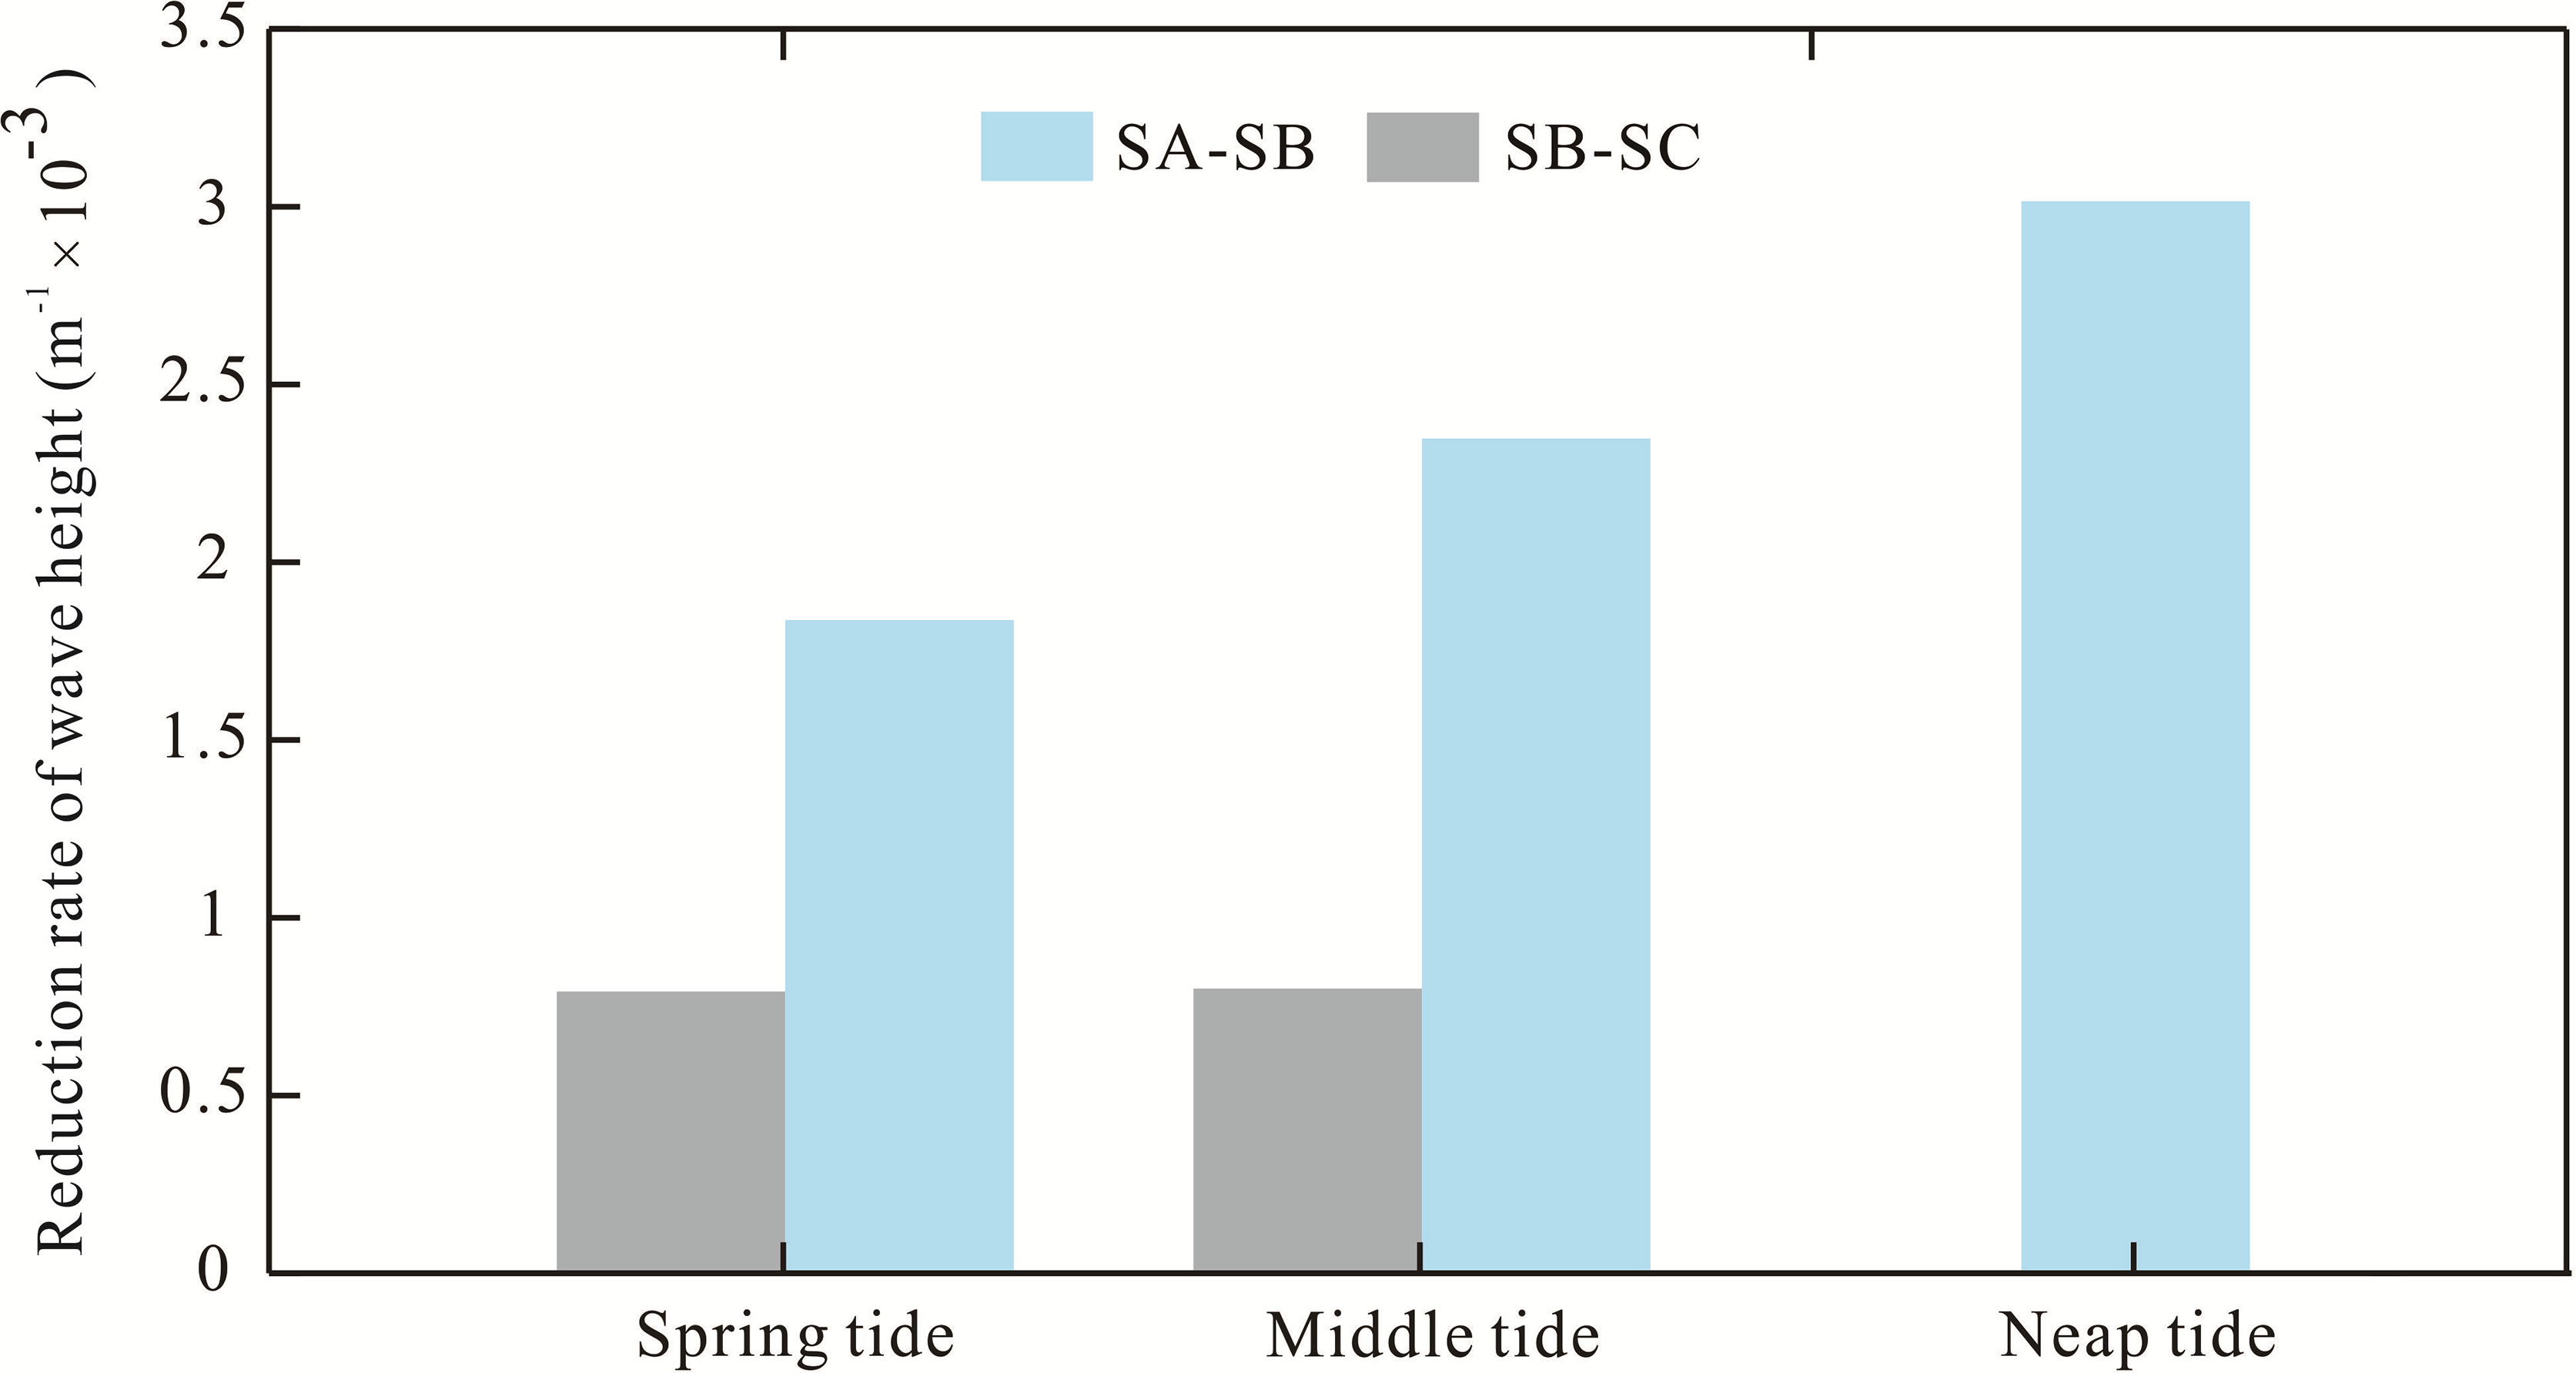
Figure 7 Wave height reduction rate from spring to the neap tide. Blue bars are the rate along the transect from tripod SA to SB, and gray bars are the rate along the transect from tripod SB to SC.
Moreover, the trend of the wave height reduction rate showed a large difference during the different tidal periods. Sparse AC seedlings and a few saplings were observed in the SA–SB region (Table 1), and the reduction rate increased nearly 27.78% from spring to middle tide and 30.43% from middle to neap tide. In contrast, in the SB–SC region, where dense adult trees of AC were vegetated (Table 1), this rate increased by less than 5% during the entire tidal period. Obviously, the variation degree of the wave attenuation rate was impacted by the water level fluctuation, which caused the variational drag effect and indirectly dominated the intensity of the wave height reduction rate.
4 Discussion
4.1 Impacts From AC
Coastal vegetation obstructs wave propagation via the drag effect caused by dense root or canopy systems (Augustin et al., 2009; Hu et al., 2014; Foster-Martinez et al., 2018; Devi et al., 2021). Moreover, the spatial distribution of vegetation densities may also play a crucial role in wave attenuation (Massel et al., 1999; Hashim et al., 2013). (Vo-Luong and Massel, 2008) indicated that wave breaking occurring in a sparse forest induced an obvious attenuation effect instead of the wave–trunk interactions that occur in a denser forest. Here, our results showed distinct differences in the wave attenuation process among the three tripods. During the entire tidal period, the wave height attenuated to an average of 2.37 × 10⁻³ m in the area of SA–SB and 0.82 × 10⁻³ m in the area of SB–SC per meter. The bed material from SA to SC was mainly composed of fine and very fine sand, indicating that the attenuation difference was caused by the plant drag effect rather than bottom friction.
However, the reduction rate from SB to SC was 50% less than the value from SA to SB during the entire tidal period. Furthermore, the rate from the SB to SC region rarely varied along with the SA to SB region, and the rate increased nearly 67% from the spring to neap tide (Figure 7), illustrating the difference in the volumetric cover of AC to induce the change in the drag effect and higher wave energy attenuation. Specifically, the seedling and sapling volumetric cover below 0.5 H was 16.53 and 60.33% at the SA station, respectively. At the SB station, this value was 5.25 and 63.42%, respectively. Although adult trees at the SC station had a larger canopy, their volumetric cover of the stem part (below 0.3 H) was only 31% (Figures 8A–C). At a low water level, dense vegetation structures occupied more space in the SA and SB regions at a low water level, which generated a larger drag effect compared to the relatively sparse parts in the SC region. Therefore, there is an obvious attenuation phenomenon at a low water level that occurs in the seedling and sapling areas rather than in the adult area. According to Figures 9D, E, when the water level was shallower than 1.5 m, the mean drag coefficient generated by mangroves in the SA–SB region was 3.74, but the value in the SB–SC region was 1.48, indicating that seedlings and saplings contributed to the attenuation process; however, only the stem part of an adult contributed to this process. Additionally, the SC station was at the high tidal flat (Figure 1D), with adult mangroves emerging at most times during the observation period, when the canopy part did not submerge due to the water level; this induced no drag effect, which explains why smaller mangroves had more power for attenuating wave energy than larger mangroves because the parts of the adult trees that are most effective at attenuation did not participate in this process (Figures 4D, 8E).
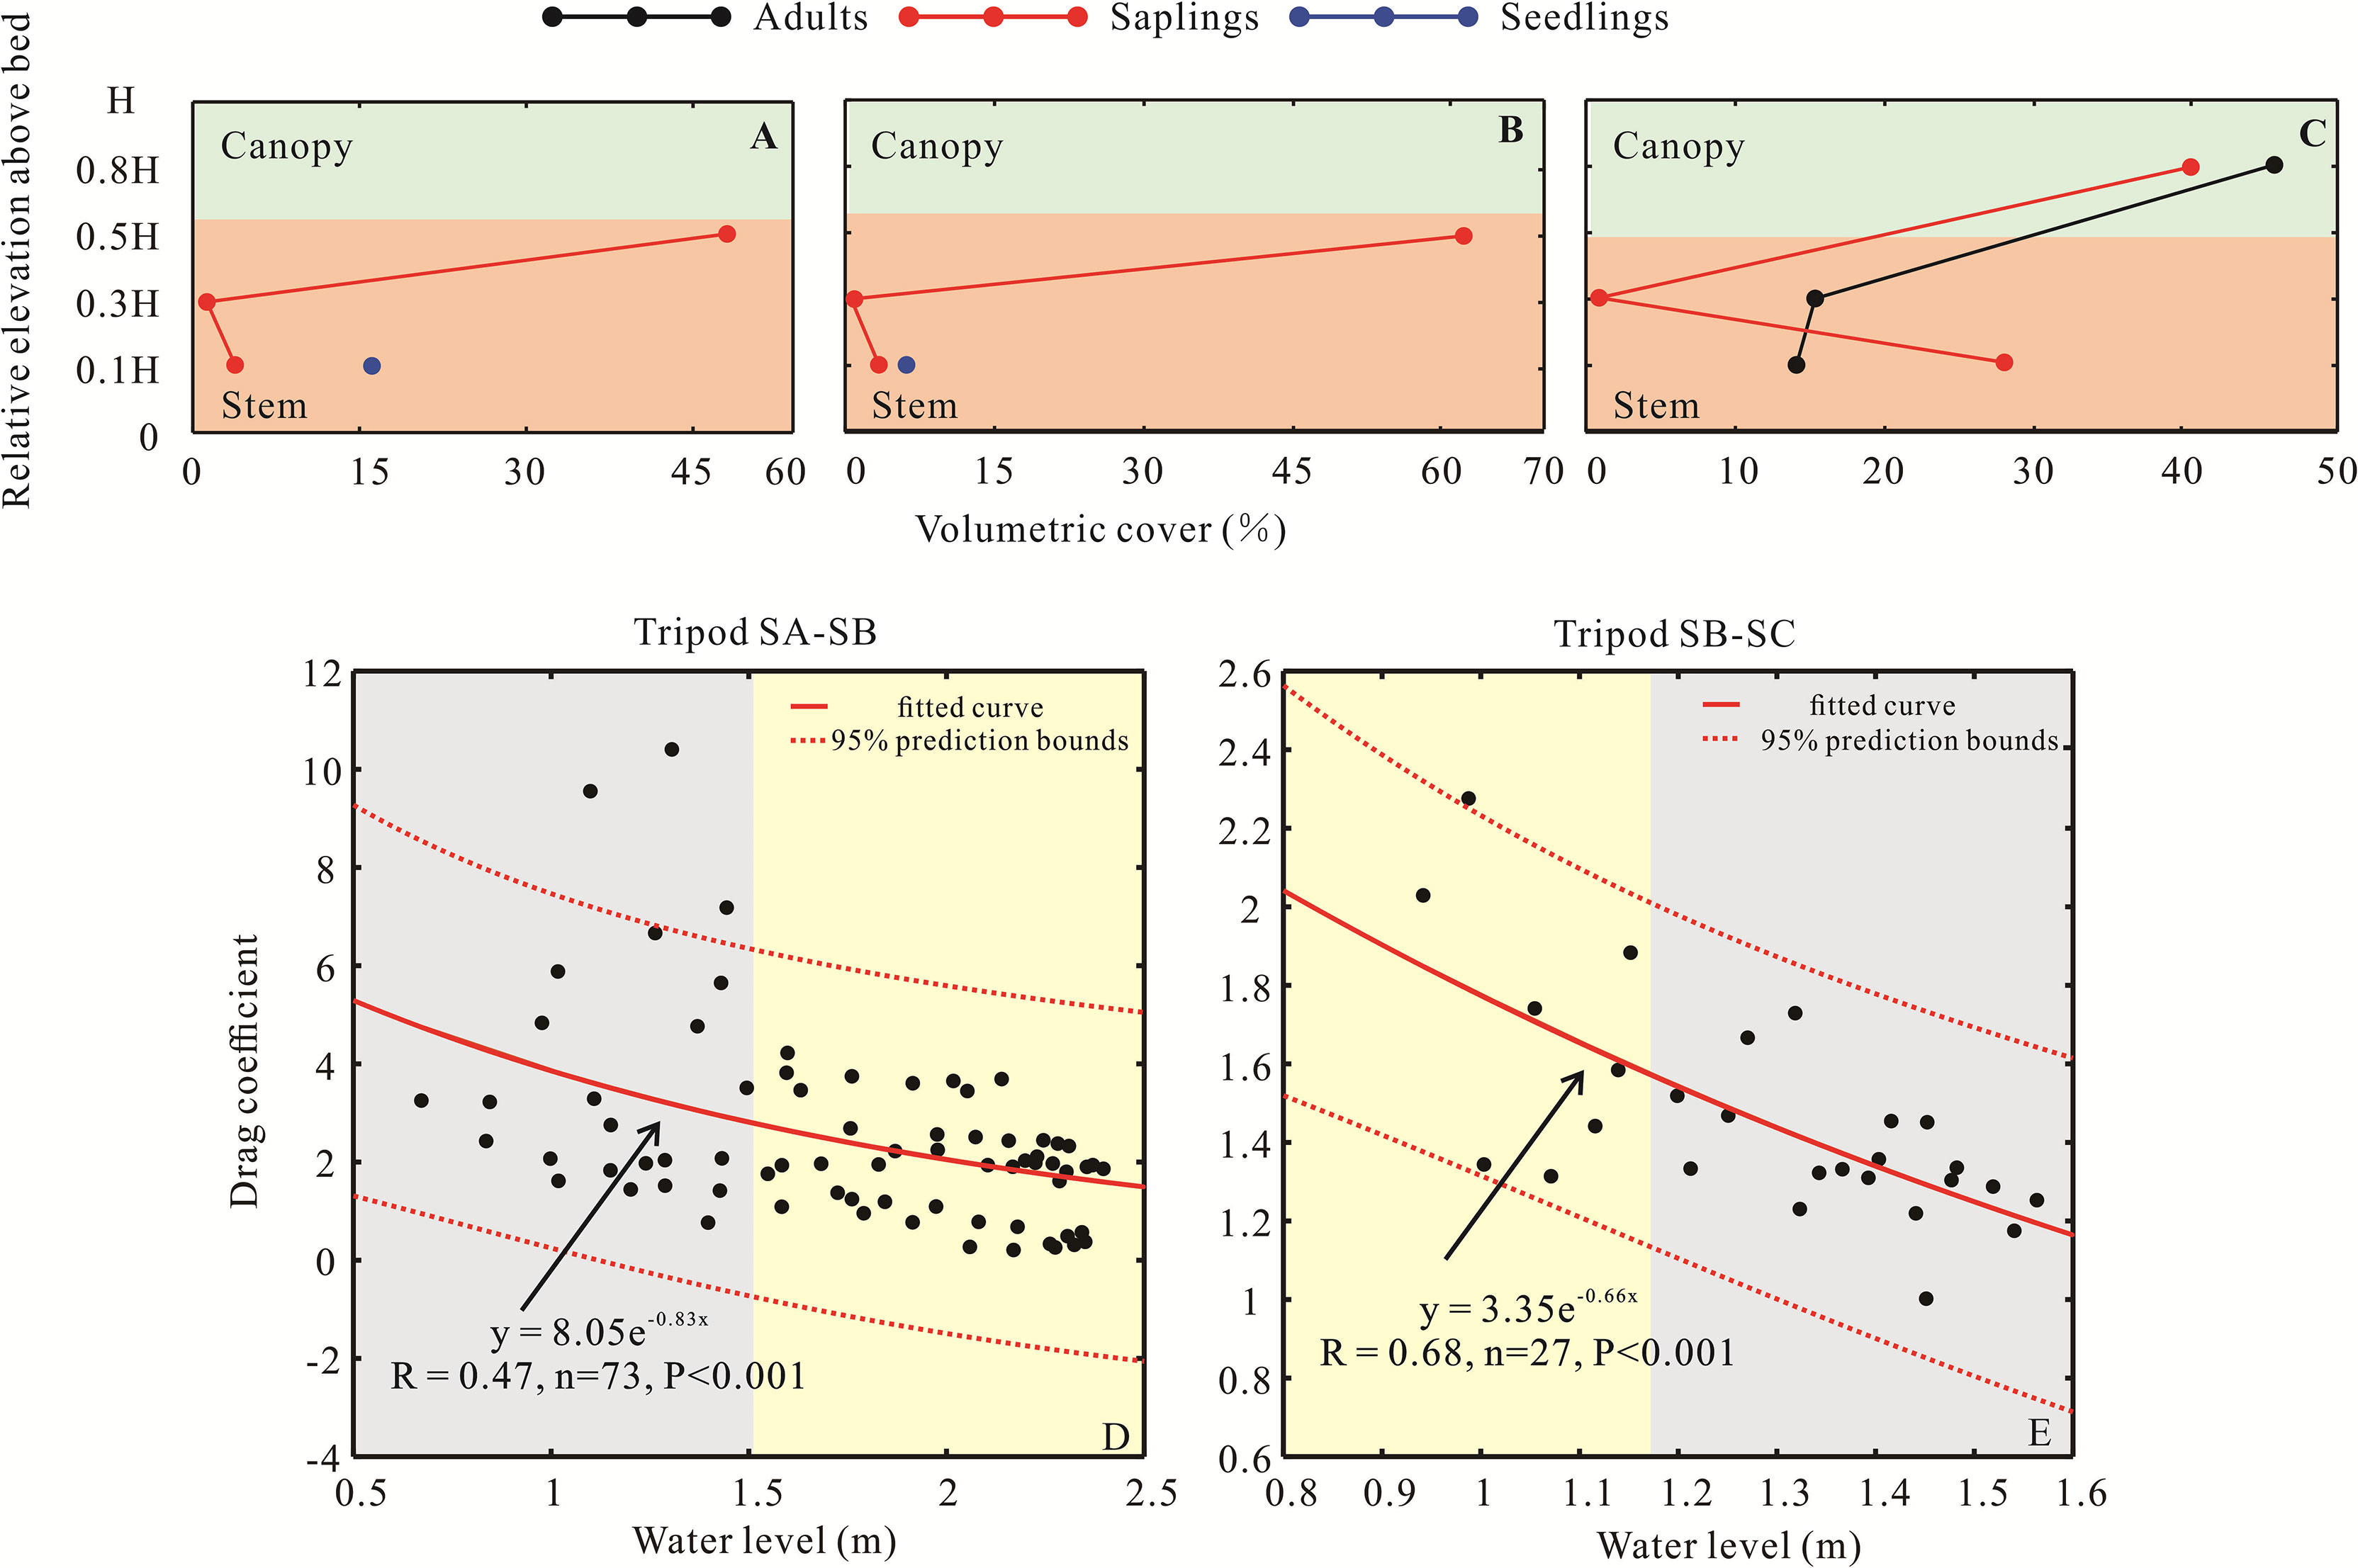
Figure 8 Volumetric cover in three measurement plots (A–C), corresponding to the three hydrodynamic tripods. The relationship between the volumetric cover and relative elevation above the bed is described as follows: a) black and red dots and lines refer to the adults and saplings at the SA station; b) red dots and lines and blue dots refer to the saplings and seedlings at the SB station; and c) red dots and lines and blue dots refer to the saplings and seedlings at the SC station. The relationship between the water level and drag coefficient is shown for (D) tripods SA-SB and (E) tripods SB-SC. The gray shadow is the period of the high drag effect, and the yellow shadow is the period of the low drag effect.
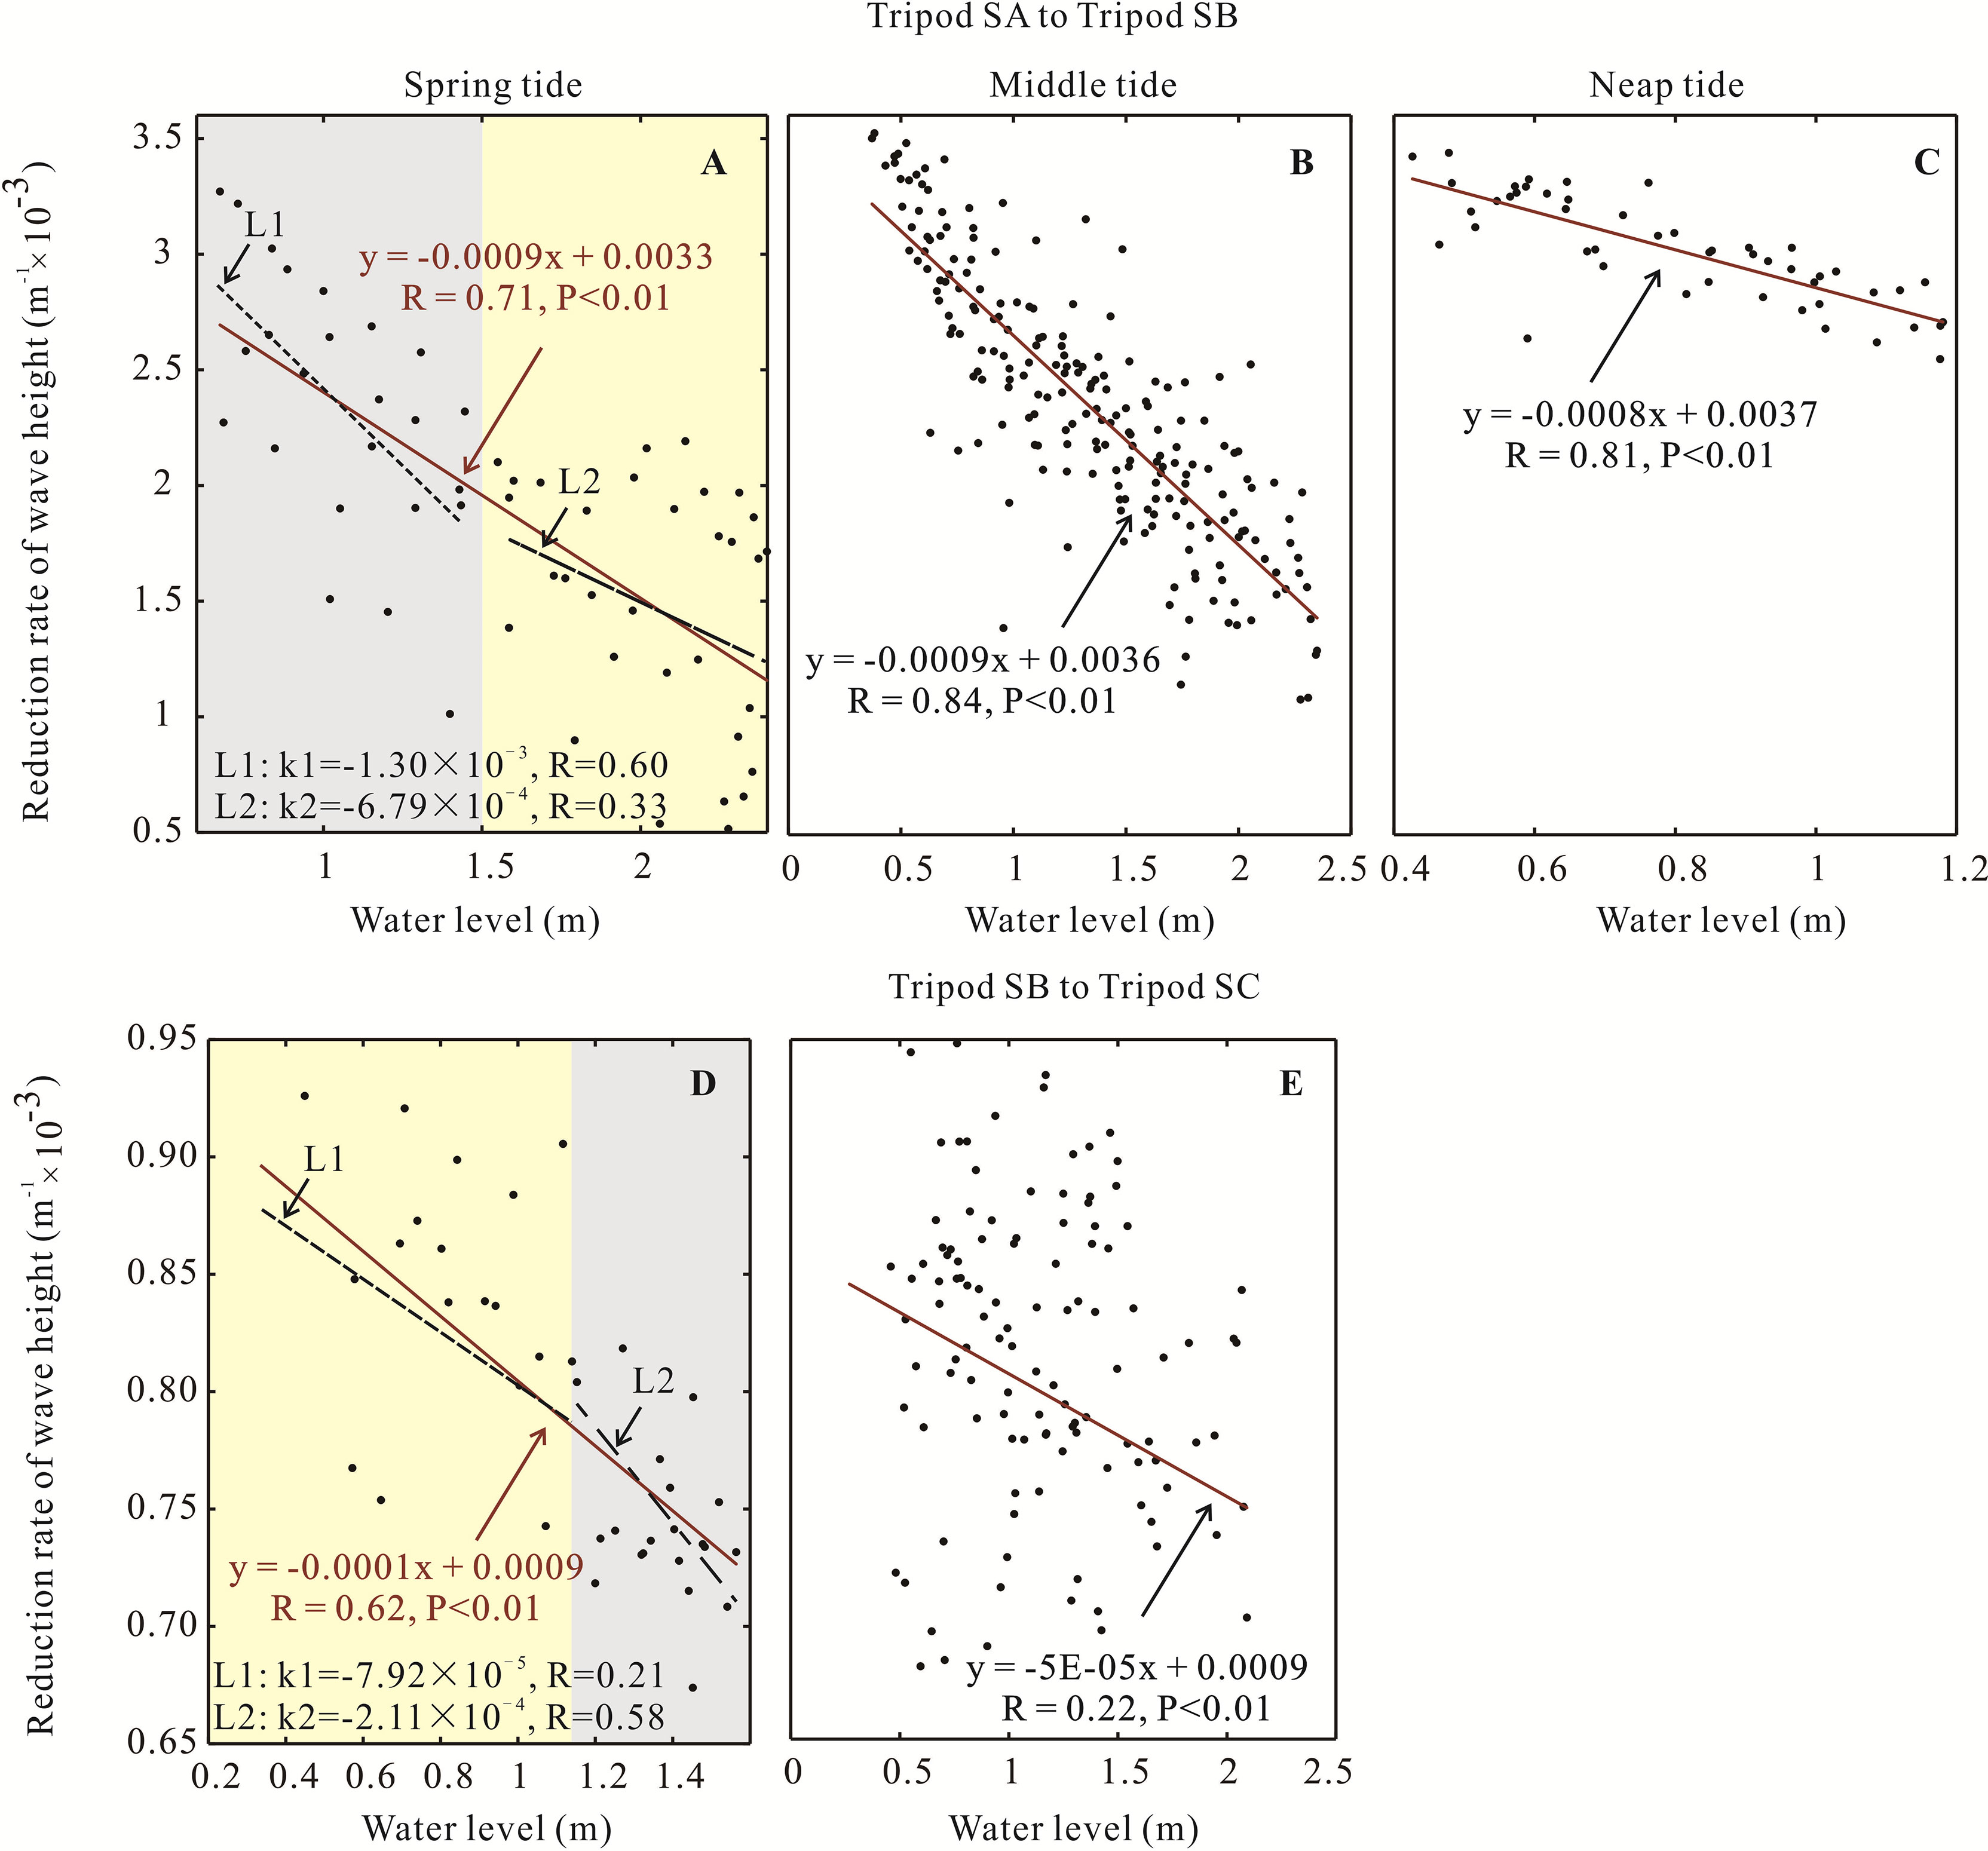
Figure 9 Relationship between the water level and wave height reduction rate shown along the transect from tripod SA to SB (A–C) and tripod SB to SC (D, E) during spring to neap tides. Black dots are the measured data, and red lines are the linear fitted relationship. Gray and yellow shadows in (A, D) represent the periods of high and low attenuation reduction rates, respectively.
4.2 Coupled Impacts Between Water Level Fluctuations and the Inundation state of AC
The drag effect difference generated by vegetation mostly depends on the inundation state (Figure 8). An abrupt change in the reduction rate occurred in the spring tide when the water rose up from the stem to the canopy (Figures 9A, D). In other words, the attenuation effect was distinctly different when the AC was in a shifted inundation state with different water levels. Particularly, if a typhoon event happens at a low water level when saplings and seedlings have submerged but the canopy parts of adults are emerged, the former can attenuate waves effectively, since adults always locate at the high part of a tidal flat.
For the seedling-sapling region, seedling mangroves were approximately 55 cm (Figures 3B–D), which often flooded due to the mean water level of 117 cm at this location. Moreover, the Cd reduction rate decreased rapidly below the 150 cm water level, and then the decreasing rate slowed down when the water level was above 150 cm (k1 = −1.30 × 10⁻³ for L1 and k2 = −6.79 × 10⁻⁴ for L2 in Figure 8D), inferring that seedlings have an effective wave attenuation ability below the 150 cm water depth. However, from SB to SC, with the height of standing adult AC greater than 150 cm, which is seldom flooded due to the average water level of approximately 73 cm in this area during the spring tide (Figure 4B), only the branches were submerged, and the canopies could not be reached. Taken together, the change in the drag force followed the inundated volume variation in AC and controlled the wave attenuation rate.
4.3 Relationship Between the Wave Height Reduction Rate and Cd
The wave height reduction rate was negatively correlated with the water fluctuations (Figure 9) and water-level variations for different drag coefficients induced by mangroves with different inundation states (Figures 8D, E). Furthermore, the similar structure and distribution of mangrove forests produce similar drag effect values, in which water fluctuation works as a medium. Therefore, a similar vegetation distribution may generate a similar drag coefficient (Hu et al., 2014; Foster-Martinez et al., 2018), even though the water level fluctuates during one tidal cycle. Thereafter, a direct relationship between the wave height reduction rate and Cd can explicitly express the impacts of mangrove vegetation on wave height, while wave data from most field observations are extremely difficult to obtain because of the inaccessibility of dense mangroves.
As the seedling-sapling region had a more powerful ability to attenuate waves than the sapling-adult region (Figure 7), the wave height reduction rate and Cd along this area during the spring tide were selected. An exponential relationship between these two parameters was deduced, which was R = -0.0023 × e-0.64Cd + 0.0025. While the water level rose and the seedlings were not entirely submerged, an obvious increase in the drag effect accelerated the wave attenuation process (blue box in Figure 10). Although the drag effect increased weakly when the water level was higher than the height of a plant, the wave could still be disturbed and attenuated within a certain water level range, and the reduction rate rose slowly beyond the canopy height of plants. The mechanism for the wave attenuation effect of seedlings and saplings of the AC illustrated that water depths shallower than 0.7 m were the most effective range of damping wave energy (Figure 10). Predictably, when a typhoon event happens during the spring tide, meeting the high fluvial discharge, such as in the case of Hepu County in 1986, the high tidal flat is submerged, and the canopy part of the AC plays a crucial role in this attenuation process.
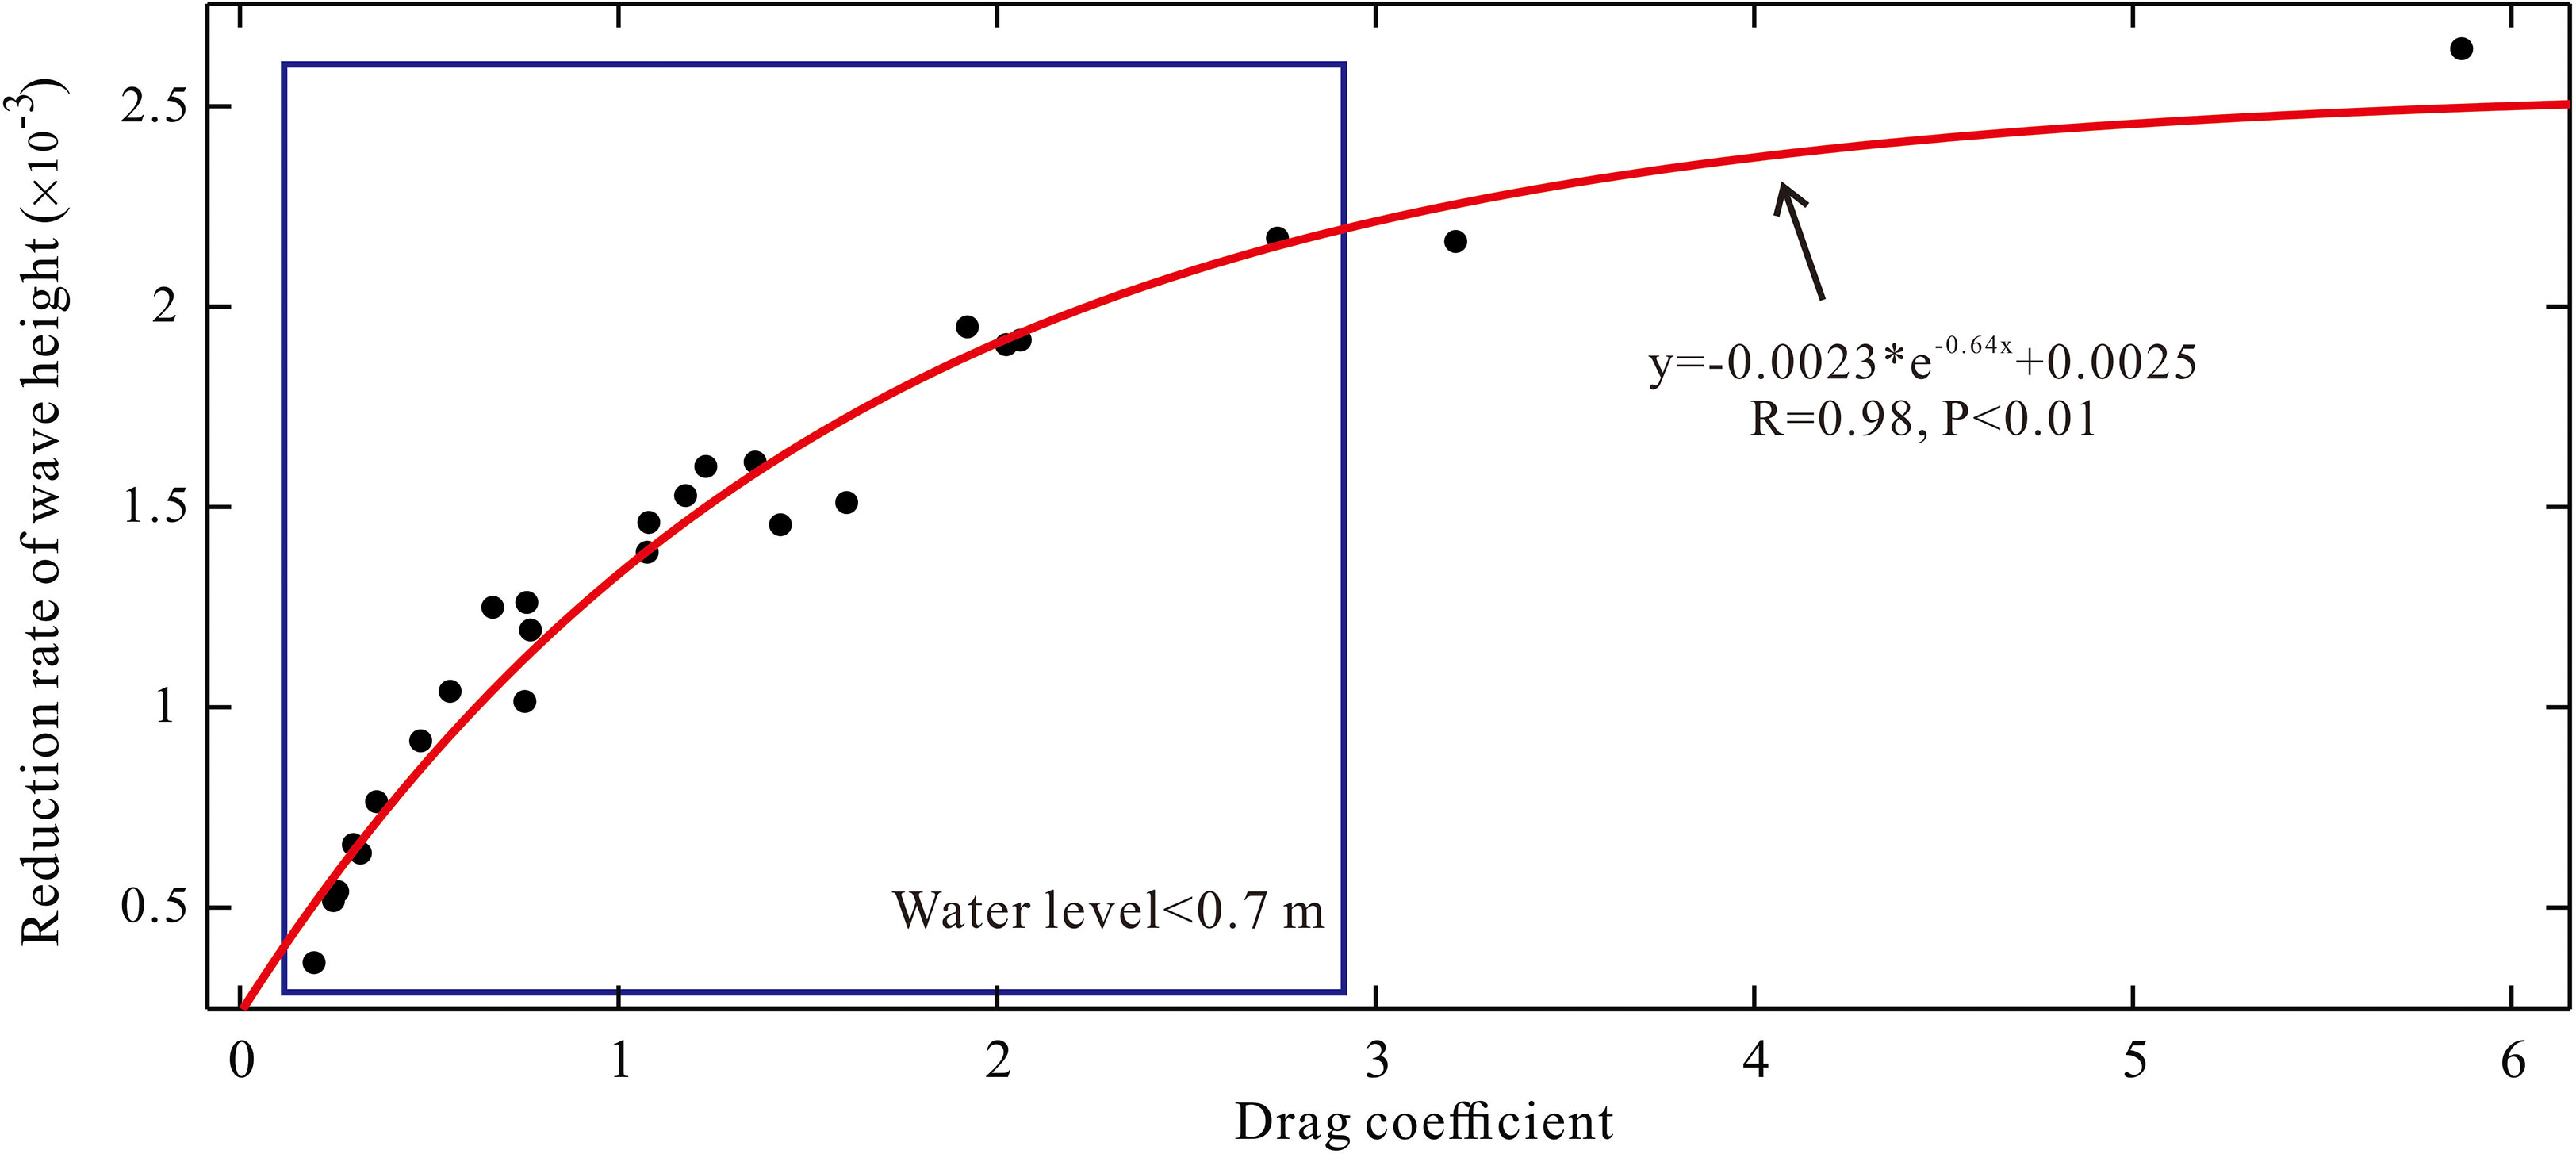
Figure 10 Descriptions of the drag coefficient. A fitting relationship is shown between the drag coefficient and wave height reduction rate. The fitting formula is shown in the figure. The relationship when the water level is shallower than 0.7 m is shown in the blue box.
Furthermore, (Massel et al., 1999) inferred that the wave attenuation mechanism was the same both with and without a typhoon event, demonstrating that both mangroves and bottom friction played important roles in the attenuation process regardless of whether short waves propagated in cyclonic weather or long waves propagated in normal weather. Similarly, the exponential relationship between Cd and the reduction rate for seedlings and saplings can also be adopted during the typhoon period. Since the location of SC is in the upper mudflat, no quantitative relationship for adult AC between Cd and the water level can be constructed. However, according to the dense canopy of an adult tree (Figure 8C), it can be speculated that the canopy part of an adult mangrove is of great significance in the wave attenuation process during an extreme event. Therefore, the “green-embankment” definition has been proposed (Temmerman et al., 2013) recently to defend against extreme events, replacing “hard engineering.” Our in-field observational data elucidated that the AC at different ages has distinct volumetric cover from the bottom to the canopy part, which can attenuate wave heights in stages via water-level variations. During normal or slight typhoon weather conditions, the number of seedlings can effectively attenuate the wave energy with lower economic costs and higher plant survival rates. When the weather conditions become more severe with greater wave energy, adult mangroves can participate in this attenuation process. Obviously, the distribution of mangroves for constructing a “green embankment” should consider the age of mangroves to cope with different attenuation effects with changing water levels from offshore to inshore to obtain a longer defense period with lower economic costs.
5 Conclusions
Mangrove forests have received worldwide attention because they provide significant habitats for organisms and play a crucial role in dissipating hydrodynamic energy. Therefore, in this study, the wave attenuation process over an AC tidal flat of Qixing Island in the Nanliu Delta in China was analyzed to highlight the importance of mangroves with different ages for wave damping. We found that between the spring and neap tides, the wave height decreased by 58.33% in the seedling-sapling region and 80% in the sapling-adult region. The lowest water level in the neap tide leads to the largest wave height reduction rate over half a lunar cycle. Meanwhile, the wave attenuation ability of the seedlings had a larger drag impact on the incident wave than the half-submerged grown trees due to larger drag forces, indicating that the seedlings had a remarkable attenuation ability. Furthermore, we proposed a relationship of R = -0.0023 × e-0.64Cd + 0.0025 between the wave attenuation rate and the drag coefficient, which demonstrates that wave attenuation is induced by vegetation obstruction.
Given that coastal urbanization, economic activities, and climate change have induced the dramatic deforestation of mangroves, leading to the potential failure of “hard-engineering,” our work provides new insight into the ecological embankment construction by an optimized combination of mangroves of different ages.
Data Availability Statement
The raw data supporting the conclusions of this article will be made available by the authors, without undue reservation.
Author Contributions
XZ analyzed the data and wrote the original paper. ZD conceived the idea for the study and participated in its writing. WP analyzed part of the data. JW and CL participated in the discussion. All authors listed have made a substantial, direct, and intellectual contribution to the work and approved it for publication.
Funding
This study was supported by the National Natural Science Key Foundation of China (NSFC) (41930537), the Key Projects of Science and Technology of Guangxi Province (AB21076016), the ECNU Academic Innovation Promotion Program for Excellent Doctoral Students (YBNLTS2021-031), and the Fundamental Research Funds for the Central Universities.
Conflict of Interest
The authors declare that the research was conducted in the absence of any commercial or financial relationships that could be construed as a potential conflict of interest.
Publisher’s Note
All claims expressed in this article are solely those of the authors and do not necessarily represent those of their affiliated organizations, or those of the publisher, the editors and the reviewers. Any product that may be evaluated in this article, or claim that may be made by its manufacturer, is not guaranteed or endorsed by the publisher.
Acknowledgments
The author thank Bingbin Feng, Riming Wang, Binbin Ma and Gaojian Hu for their help in the field observations. The authors also acknowledge the editor and the two anonymous reviewers for their valuable comments on this study.
References
Abdullah F. A. R., Husrin S., Bachtiar H. (2019). Experimental Data Analysis of Wave Attenuation in Mangroves. J. Phys. Conf. Ser. 1245, 012095. doi: 10.1088/1742-6596/1245/1/012095
Alongi D. M. (2008). Mangrove Forests: Resilience, Protection From Tsunamis, and Responses to Global Climate Change. Estuar. Coast. Shelf. Sci. 76, 1–13. doi: 10.1016/j.ecss.2007.08.024
Atwood T. B., Connolly R. M., Almahasheer H., Carnell P. E., Duarte C. M., Ewers Lewis C. J., et al. (2017). Global Patterns in Mangrove Soil Carbon Stocks and Losses. Nat. Clim. Change. 7 (7), 523–528. doi: 10.1038/nclimate3326
Augustin L. N., Irish J. L., Lynett P. (2009). Laboratory and Numerical Studies of Wave Damping by Emergent and Near-Emergent Wetland Vegetation. Coast. Eng. 56 (3), 332–340. doi: 10.1016/j.coastaleng.2008.09.004
Bao T. Q. (2011). Effect of Mangrove Forest Structures on Wave Attenuation in Coastal Vietnam. Oceanologia. 53 (3), 807–818. doi: 10.5697/oc.53-3.807
Brinkman R. (2006). Wave Attenuation in Mangrove Forests: An Investigation Through Field and Theoretical Studies (Australia: James Cook University).
Cao H., Chen Y., Tian Y., Feng W. (2016). Field Investigation Into Wave Attenuation in the Mangrove Environment of the South China Sea Coast. J. Coast. Res. 32 (6), 1417–1427. doi: 10.2112/JCOASTRES-D-15-00124.1
Chen Y., Li Y., Cai T., Thompson C., Li Y. (2016). A Comparison of Biohydrodynamic Interaction Within Mangrove and Saltmarsh Boundaries. Earth Surf. Proc. Land. 41 (13), 1967–79. doi: 10.1002/esp.3964
Chen X., Liu H., Dong D., Qiu S., Chen B. (2013). Analysis of Guangxi Marine Disaster Risk. Guangxi. Sci. 20 (3), 248–253.
Danielsen F. (2005). The Asian Tsunami: A Protective Role for Coastal Vegetation. Science 310 (5748), 643–643.
Devi C., Jairaj P. G., Balan K. (2021). Laboratory Investigations on Wave Attenuation Characteristics of Rhizophora Mucronata Poir Using Physical Models With Bottom Friction. Environ. Fluid. Mech. 21 (2), 361–81. doi: 10.1007/s10652-020-09777-z
Easterling D. R. (2000). Climate Extremes: Observations, Modeling, and Impacts. Science. 289 (5487), 2068–2074. doi: 10.1126/science.289.5487.2068
Foster-Martinez M. R., Lacy J. R., Ferner M. C., Variano E. A. (2018). Wave Attenuation Across a Tidal Marsh in San Francisco Bay. Coast. Eng. 136, 26–40. doi: 10.1016/j.coastaleng.2018.02.001
Han H. C, Yang S. H. (2004). A Review on Researches in Earliest Departure Harbor of Silk Road on Sea in Ancient China. Scient. Geograph. Sinica. 24 (6), 738–745. doi: 10.3969/j.issn.1000-0690.2004.06.017
Hashim A. M., Catherine S., Takaijudin H. (2013). Effectiveness of Mangrove Forests in Surface Wave Attenuation: A Review. Res. J. Appl. Sci. Eng. Technol. 5 (18), 4483–4488. doi: 10.19026/rjaset.5.4361
Hegge B. J., Masselink G. (1996). Spectral Analysis of Geomorphic Time Series: Auto–Spectrum. Earth Surf. Process. Landf. 21, 1021–1040. doi: 10.1002/(SICI)1096-9837(199611)21:11<1021::AID-ESP703>3.0.CO;2-D
Horstman E. M., Dohmen-Janssen C. M., Narra P. M. F., van denBerg N. J. F., Siemerink M., Hulscher S. J. M. H., et al. (2014). Wave Attenuation in Mangroves: A Quantitative Approach to Field Observation. Coast. Eng. 94, 47–62. doi: 10.1016/j.coastaleng.2014.08.005
Huang Z. M., Zhou X. Y., Dai Z. J, Che Z. W, et al. (2022). Analysis of Suspended Sediment Concentration Variations Invertical Profile Near-Bed of Aegiceras Corniculatum Tidal Flat. J. Trop. Oceanogr. doi: 10.11978/2021167
Hu Z., Suzuki T., Zitman T., Uittewaal W., Stive M. (2014). Laboratory Study on Wave Dissipation by Vegetation in Combined Current–Wave Flow. Coast. Eng. 88, 131–142. doi: 10.1016/j.coastaleng.2014.02.009
Kinver M. (2016). Let Mangroves Recover to Protect Coasts (London, British: BBC News). Available at: http://www.bbc.com/news/science-environment-37386267.
Li S., Dai Z., Mei X., Huang H., Wei W., Gao J., et al. (2017). Dramatic Variations in Water Discharge and Sediment Load From Nanliu River (China) to the Beibu Gulf During 1960s–2013. Quater. Int. 440, 12–23. doi: 10.1016/j.quaint.2016.02.065
Massel S. R., Furukawa K., Brinkman R. M. (1999). Surface Wave Propagation in Mangrove Forests. Fluid. Dyn. Res. 24 (4), 219–249. doi: 10.1016/S0169-5983(98)00024-0
Maza M., Lara J. L., Losada I. J. (2021). Predicting the Evolution of Coastal Protection Service With Mangrove Forest Age. Coast. Eng. 168, 103922. doi: 10.1016/j.coastaleng.2021.103922
Mazda Y., Wolanski E., King B., Sase A., Ohtsuka D., Magi M. (1997b). Drag Force Due to Vegetation Inmangrove Swamps. Mangr. Salt. Marshes. 1, 193–199. doi: 10.1023/A:1009949411068
Mazda Y., Magi M., Ikeda Y., Kurokawa T., Asano T. (2006). Wave Reduction in a Mangrove Forest Dominated by Sonneratia Sp. Wetl. Ecol. Manage. 14 (4), 365–378. doi: 10.1007/s11273-005-5388-0
Mazda Y., Magi M., Kogo M., Nguyen H. P. (1997a). Mangroves as a Coastal Protection From Waves in the Tong King Delta, Vietnam. Mangr. Salt. Marshes. 1 (2), 127–135. doi: 10.1023/A:1009928003700
McIvor A. L., Möller I., Spencer T., Spalding M. (2012). Reduction of Wind and Swell Waves by Mangroves. Natural Coastal Protection Series.
McIvor A., Spencer T., Spalding M., Lacambra C., Möller I. (2015). “Chapter 14 - Mangroves, Tropical Cyclones, and Coastal Hazard Risk Reduction A2 - Shroder, John F,” in Coastal and Marine Hazards, Risks, and Disasters. Eds. Ellis J. T., Sherman D. J. (Boston: Elsevier), 403–429.
Montgomery J. M., Bryan K. R., Mullarney J. C., Horstman E. M. (2019). Attenuation of Storm Surges by Coastal Mangroves. Geophys. Res. Lett. 46 (5), 2680–2689. doi: 10.1029/2018GL081636
Parvathy K. G., Bhaskaran P. K. (2017). Wave Attenuation in Presence of Mangroves: A Sensitivity Study for Varying Bottom Slopes. Int. J. Ocean. Climate Syst. 8 (3), 126–134. doi: 10.1177/1759313117702919
Peralta G., van Duren L., Morris E., Bouma T. (2008). Consequences of Shoot Density and Stiffness for Ecosystem Engineering by Benthic Macrophytes in Flow Dominated Areas: A Hydrodynamic Flume Study. Mar. Ecol. Prog. Ser. 368, 103–115. doi: 10.3354/meps07574
Quartel S., Kroon A., Augustinus P. G. E. F., Van Santen P., Tri N. H. (2007). Wave Attenuation in Coastal Mangroves in the Red River Delta, Vietnam. J. Asian Earth Sci. 29 (4), 576–584. doi: 10.1016/j.jseaes.2006.05.008
State Oceanic Administration (1998). China’s Coastal Embayment (Volume 14: Important Estuaries) (Beijing, China: China Ocean Press), 754–781.
Temmerman S., Meire P., Bouma T. J., Herman P. M. J., Ysebaert T., De Vriend H. J., et al. (2013). Ecosystem-Based Coastal Defence in the Face of Global Change. Nature 504 (7478), 79–83. doi: 10.1038/nature12859
Thuy N. B., Nandasena N. A. K., Dang V. H., Kim S., Hien N. X., Hole L. R., Thai T. H., et al. (2017). Effect of River Vegetation With Timber Piling on Ship Wave Attenuation: Investigation by Field Survey and Numerical Modeling. Ocean. Eng. 129, 37–45. doi: 10.1016/j.oceaneng.2016.11.004
Tuyen N. B., Hung H. V. (2009). “An Experimental Study on Wave Reduction Efficiency of Mangrove Forests,” in Proceeding of the 5th International Conference on Asian Pacific Coasts (APAC2009). (Singapore: Nanyang Technological University (NTU). Vol. 4, 336–43
Van der Stocken T., Dustin C., Dimitris M., Carroll D., Menemenlis D., Simard M., et al. (2019). Global-Scale Dispersal and Connectivity in Mangroves. P. Natl. Acad. Sci. U S A 116 (3), 915–922. doi: 10.1073/pnas.1812470116
Vo-Luong P., Massel S. (2008). Energy Dissipation in non-Uniform Mangrove Forests of Arbitrary Depth. J. Mar. Syst. 74 (1-2), 603–622. doi: 10.1016/j.jmarsys.2008.05.004
Willemsen P. W. J. M., Horstman E. M., Borsje B. W., Friess D. A., Dohmen-Janssen C. M., et al. (2016). Sensitivity of the Sediment Trapping Capacity of an Estuarine Mangrove Forest. Geomorphology. 273 (15), 189–201. doi: 10.1016/j.geomorph.2016.07.038
Wu Z., Chen J., Jiang C., Deng B. (2021). Simulation of Extreme Waves Using Coupled Atmosphere-Wave Modeling System Over the South China Sea. Ocean. Eng. 221, 108531. doi: 10.1016/j.oceaneng.2020.108531
Keywords: mangroves, tidal flat, wave attenuation, drag coefficient, Nanliu Delta
Citation: Zhou X, Dai Z, Pang W, Wang J and Long C (2022) Wave Attenuation Over Mangroves in the Nanliu Delta, China. Front. Mar. Sci. 9:874818. doi: 10.3389/fmars.2022.874818
Received: 13 February 2022; Accepted: 27 April 2022;
Published: 30 May 2022.
Edited by:
Zheng Gong, Hohai University, ChinaReviewed by:
Yining Chen, Ministry of Natural Resources, ChinaZhiyuan Wu, Changsha University of Science and Technology, China
Copyright © 2022 Zhou, Dai, Pang, Wang and Long. This is an open-access article distributed under the terms of the Creative Commons Attribution License (CC BY). The use, distribution or reproduction in other forums is permitted, provided the original author(s) and the copyright owner(s) are credited and that the original publication in this journal is cited, in accordance with accepted academic practice. No use, distribution or reproduction is permitted which does not comply with these terms.
*Correspondence: Zhijun Dai, empkYWlAc2tsZWMuZWNudS5lZHUuY24=
 Xiaoyan Zhou
 Zhijun Dai
 Wenhong Pang
 Jie Wang
 Chuqi Long