- 1State Key Laboratory of Estuarine and Coastal Research, East China Normal University, Shanghai, China
- 2Frontiers Science Center for Deep Ocean Multispheres and Earth System, and Key Laboratory of Marine Chemistry Theory and Technology, Ministry of Education, Ocean University of China/Qingdao Collaborative Innovation Center of Marine Science and Technology, Qingdao, China
Nutrients play an important role as biogenic elements in modulating marine productivity, and water mixing usually facilitates the transportation of nutrients in the coastal ocean. In this study, the distributions of naturally occurring radioisotopes 226Ra and 228Ra in the surface and water column of the northern South China Sea (NSCS) have been investigated to estimate oceanic mixing and nutrient supplies. We identified three masses of the South China Sea Warm Current (SCSWC), the South China Sea Branch of the Kuroshio (SCSBK), and shelf water in the summer of June 2015, but only SCSWC and SCSBK were observed in the spring of March 2017. The fraction of the SCSBK in summer was estimated to be an average of 0.25 ± 0.16, which was lower than that in the spring of 0.57 ± 0.32 in our study area. The horizontal mixing from the Pearl River plume revealed eddy diffusion of (1.2 ± 0.79) × 105 cm2/s and advection velocity ω of 0.25 ± 0.16 cm/s in the slope region. In the water column, the best-fit exponential curve gradient of 228Ra led to a vertical diffusion coefficient of 0.43 ± 0.33 cm2/s that went down to the subsurface of the upper 1,000 m, and an upward vertical diffusion coefficient was revealed as 18 ± 9.9 cm2/s from the near-bottom. Combining the nutrient distributions, horizontal mixing from the Pearl River plume carried (5.6 ± 4.9) × 102 mmol N/m2/d, 2.2 ± 2.0 mmol P/m2/d, and (4.1 ± 3.9) × 102 mmol Si/m2/d in the very surface layer, suggesting that shelf water plays a significant role in the nutrient sources of the slope of the NSCS during June 2015. The upward vertical mixing supplied 2.7 ± 1.6 mmol N/m2/d, 0.18 ± 0.11 mmol P/m2/d, and 15 ± 8.4 mmol Si/m2/d to the upper layer, which appeared more important than atmospheric deposition and rivaled submarine groundwater discharge.
Introduction
As biogenic elements, nutrients play a vital role in marine productivity in coastal oceans (Arrigo, 2005; Christie-Oleza et al., 2017). Apart from participating in biological growth, water movements mainly mediate the distribution of nutrients and mixing, such as submarine groundwater discharge (SGD) (e.g., Moore, 1996), advection (e.g., Su et al., 2013), and lateral and vertical mixing (e.g., Tremblay et al., 2014; Letscher et al., 2016). Generally, oceanic mixing and advection facilitate the transportation of nutrients to the euphotic zone (Oschlies, 2002; Hsieh et al., 2021), especially in the coastal seas. Terrigenous sources also contribute to the fate of nutrients in the water column due to the mixing of various water masses, which may significantly influence the primary production and ecological environment of the coastal seas (Kwon et al., 2019). Thus, knowing the movements of various water masses can provide us with valuable information on local nutrient status and improve our understanding of the potential limiting factors for productivity in oligotrophic regions.
The northern South China Sea (NSCS) is adjacent to the southernmost part of mainland China and one of the typical marginal seas in the world, connecting the western Pacific via the Luzon Strait (Figure 1). For years, the NSCS has been oligotrophic and other sources of nutrient injection can be more easily affected by it (Lin et al., 2010). In the surface water in the NSCS, it is characterized by seasonal variations in water masses due to monsoons (Su, 2004; Liu et al., 2016). The Kuroshio carries the most oligotrophic water and it intrudes into the NSCS via the South China Sea Branch of Kuroshio (SCSBK), which is strongly observed in winter but seldom in summer (Xue et al., 2004; Nan et al., 2015). Moreover, the NSCS is also driven by the seasonal Guangdong Coastal Current (GDCC) and a consistent northeastward current of the South China Sea Warm Current (SCSWC) straddling over the shelf-break region (Hu et al., 2000; Su, 2004). Therefore, the joint water masses are crucial to determining the distributions of temperature, salinity, typical geo-tracers, and even nutrients, which benefits the understanding of their roles in ecosystem functions of the NSCS.
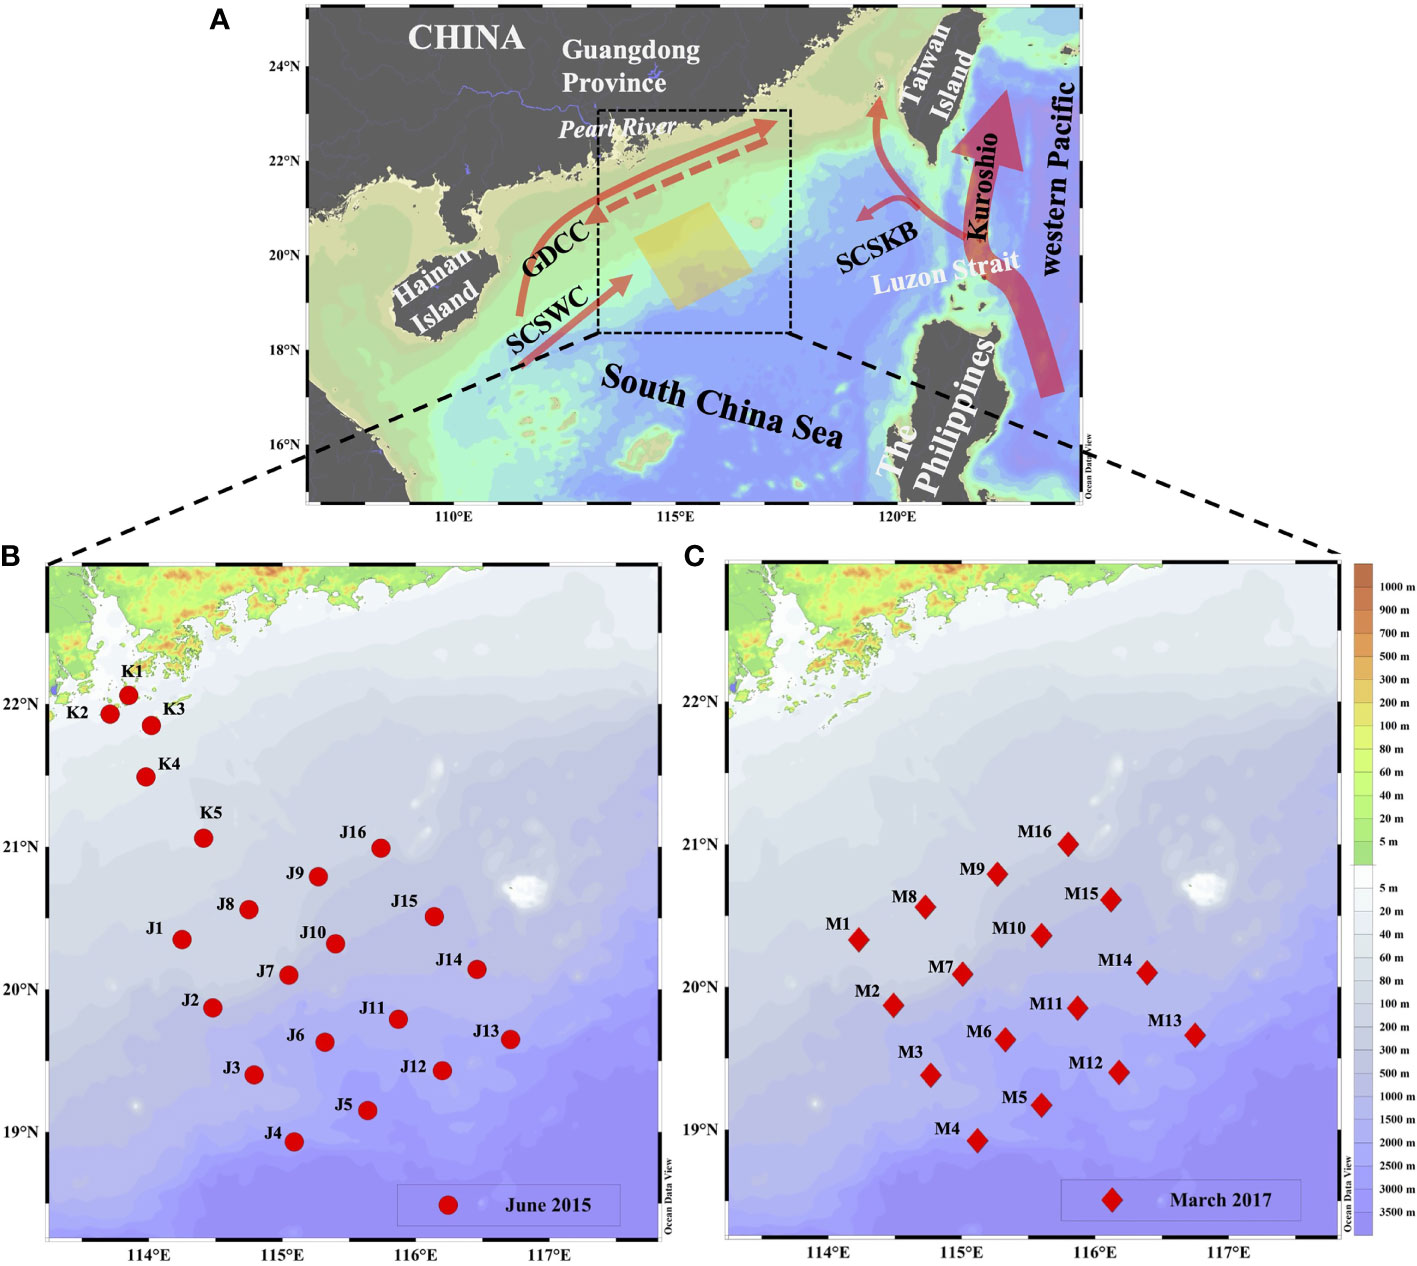
Figure 1 (A) Location of our study area and water currents pattern (Hu et al., 2000) in the NSCS; distributions of sampling stations during (B) June 2015 and (C) March 2017. Red arrows represent the potential current directions, solid arrows refer to currents in the summertime and dashed arrow refers to currents in the wintertime; GDCC represents the Guangdong Coastal Current, SCSWC represent the South China Sea Warm Current and SCSBK represents the South China Sea Branch of Kuroshio.
Previous studies have pointed out that a few hydrographic parameters are used to identify different water masses in the NSCS. For example, temperature and salinity are typical tools to classify the properties and variability of water masses (e.g., Zeng et al., 2015; Wang et al., 2021a), especially to quantify the contribution of the Kuroshio intrusion (Yang et al., 2019; e.g., Yu et al., 2013). Gao et al. (2020a) distinguished thirteen types of water masses in the NSCS based on the potential density-potential spicity diagram. However, these hydrographic parameters can sometimes not be established to quantify the proportion of individual water masses and it is hard to distinguish between specifically similar water masses in the NSCS (Farris & Wimbush, 1996; Nan et al., 2015). Furthermore, water masses such as the Kuroshio intrusion had a significantly impact on nutrient distribution and seasonal variation in the NSCS (Du et al., 2013). Because of the nature of the properties of each water mass, some geochemical tracers therein can exhibit unique properties. For example, Chen et al. (2020) applied the seawater oxygen isotope to trace the origins of SCSWC and its mixing process in the NSCS region, and dual hydrogen and oxygen isotopes were also used to trace the water mass processes between the South China Sea and the Western Pacific through the Luzon Strait (Wu J. et al., 2021) and northwestern SCS (Zhou et al., 2022). In addition, radium (Ra) isotopes were also used to calculate quantitively the signature of the Mekong River diluted water in the western South China Sea (Chen et al., 2010). Recently, Wang et al. (2021b) quantified the fraction of the Kuroshio water intruding into the NSCS based on 226Ra and 228Ra during summer. None of the tracers-related studies concerned the associated chemicals, nevertheless, providing us with the advantage of Ra isotopes in tracing water masses and their mixing processes.
Indeed, naturally-occurring Ra isotopes have been proven as ideal tracers for evaluating water mixing (e.g., Moore, 2000; Sanial et al., 2018). Ra isotopes are generally produced by the decay of their parent U–Th series nuclides from sediment and/or soil in the rivers or continental shelf, and then transported to offshore seawater in water-soluble. During this process, the activities of Ra isotopes vary primarily by decay and mixing. The shorter-lived isotope has more obvious decay in its activity relative to the longer-lived isotope, which could result in discrepancies in the activity ratio of multiple water sources. Thus, different radium signals commonly characterize different water masses (Nozaki et al., 1989; G. Wang et al., 2021b). Especially for 228Ra and 226Ra, due to their long half-lives of 5.75 and 1,600 years, respectively, they are very suitable for studying water mixing that leaves the continental shelf for the open ocean (Kawakami & Kusakabe, 2008; Hsieh et al., 2021).
As a consequence, based on the investigations of hydrographic parameters, Ra isotopes, and nutrients in the NSCS, this study quantifies the contribution of various water masses in the area of interest, namely, horizontal and vertical mixing processes in certain transects. More importantly, the water mixing-associated nutrients are also evaluated using 228Ra and 226Ra, which have never been reported before in the NSCS.
Materials and Methods
Study Area
Our study area is located in the NSCS and covers the Peral River plume (Figure 1). As the third-largest river in China, the Pearl River discharges into the NSCS and delivers approximately 3.3 × 10¹¹ m3 of freshwater per year (Li et al., 2017). The NSCS is under the influence of the East Asia Monsoon, which makes our study area experience frequent cyclonic and anti-cyclonic circulation, resulting in diluted Pearl River water reaching our study area through the continental shelf (Morimoto et al., 2000; Lin et al., 2010). Thus, the area-of-interest is jointly affected by the water masses of SCSWC, SCSKB, and a combination of the diluted Pearl River water and the GDCC. Under these circumstances, the nutrient distribution in our study area can be influenced by shelf water in some specific periods.
Sample Collection
Two cruises were conducted in the NSCS during June 2015 and March 2017 while onboard the R/V Nanfeng. Surface (~1 m) Ra samples of approximately 200 L were collected using a submersible pump at 21 stations and 16 stations in June 2015 and March 2017, respectively (Figures 2B, C), while subsurface samples (~100 L) were taken directly from an onboard Conductivity–Temperature–Depth (CTD) rosette. After collection, water samples were immediately passed through a column that was filled with approximately 20 g of MnO2-impregnated acrylic fiber at a flow rate of 0.5 L min−1 to enrich Ra isotopes (Moore & Reid, 1973). The seawater temperature and salinity were measured in situ using a Sea-Bird CTD (SBE 911plus, Sea-Bird Electronics, Inc., USA). Notably, the Ra samples in the Pearl River plume (K1–K5) were collected while the vessel was in transit, so the seawater temperature and salinity were measured by a portable salinometer with multiple parameters (Germany, multi350i). For each Ra sample, approximately 60 ml of samples were collected for the dissolved nutrients after being filtered through a 0.4 µm pore-size polycarbonate filter (Whatman, USA), and then stored frozen for laboratory analysis.
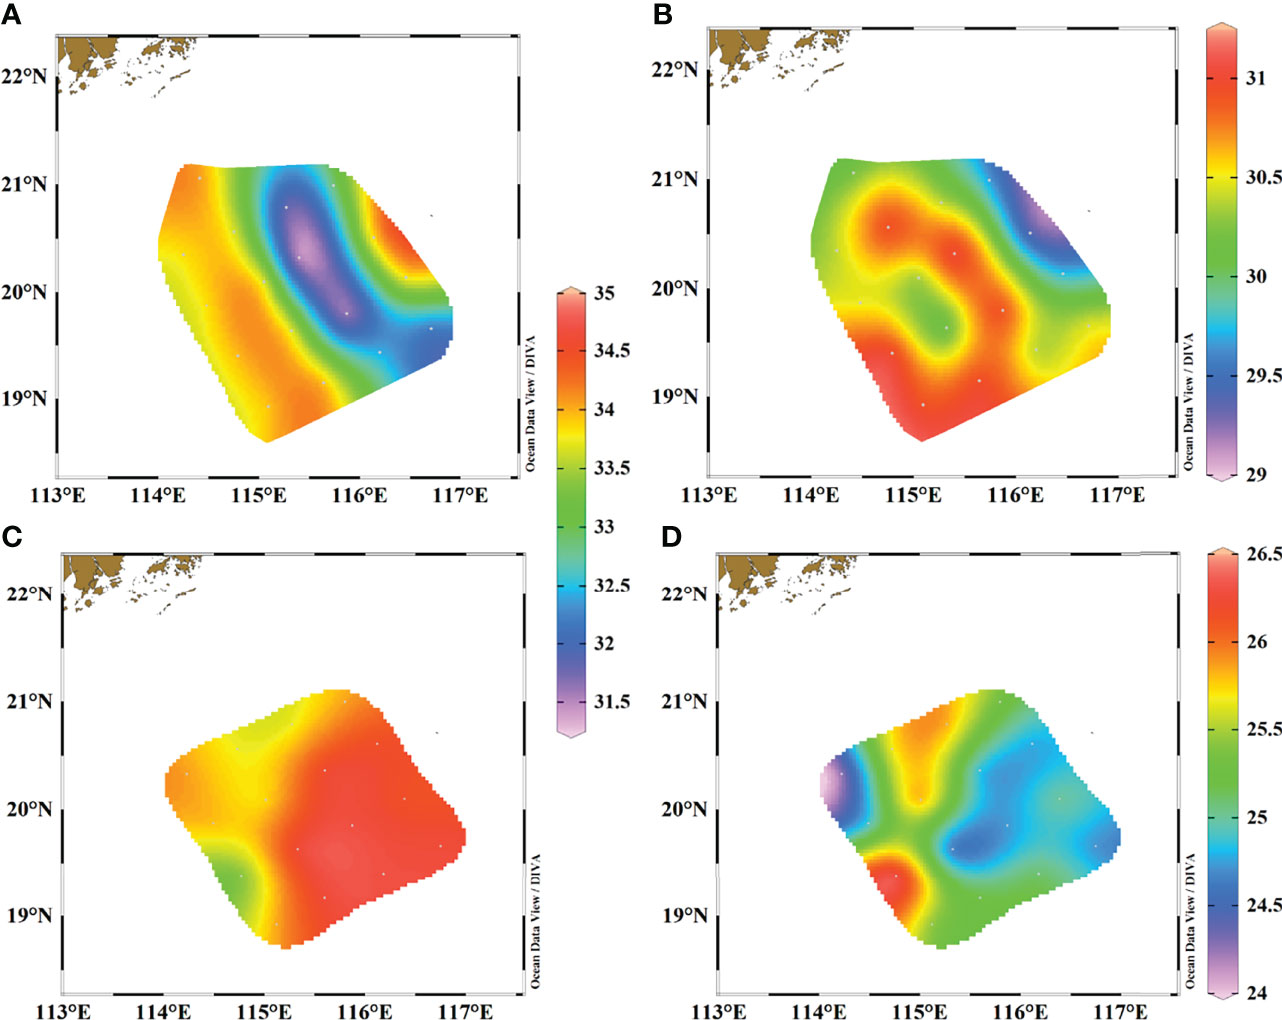
Figure 2 Distributions of surface salinity and temperature in our study area. (A) salinity in June 2015, (B) temperature in June 2015, (C) salinity in March 2017, and (D) temperature in March 2017.
Radium and Nutrient Analysis
Upon returning to the laboratory, the Mn fibers were ashed at 800°C for 8 h, homogenized, and loaded into a plastic vial sealed with an epoxy sealant for measurement. The details are shown in Liu et al. (2021a). Dissolved nutrient concentrations were determined using a QuAAtro Continuous–Flow Automatic Analyzer (SEAL Analytical GmbH, Norderstedt, Germany), and the analytical precision of , , , DIP, and DSi were all better than 5%, and the detection limits were 0.01, 0.01, 0.02, 0.01, and 0.04 μmol/L respectively (Wu N. et al., 2021). The concentration of dissolved inorganic nitrogen (DIN) is the sum of , , and .
Results
Surface Salinity and Temperature Distributions
The distributions of surface salinity and temperature in both two seasons are shown in Figure 2. During the observation period of June 2015, surface salinity ranged from 31.42 to 34.10 with the lowest values occurring in a transect of stations J9–J12, and the highest salinity was observed in the western and eastern parts of our study area (Figure 2A). Temperature ranged from 29.36 to 31.08°C with no clear distribution characteristic (Figure 2B). While in March 2017, surface salinity ranged between 33.33 and 34.70 and showed a significant differentiation trend, in which high salinity stations were all located on the eastern side and lower salinities were observed on the western side (Figure 2C). Temperature ranged from 24.38 to 26.38°C and had the opposite distribution trend as salinity, with the exception of station M1 (Figure 2D).
Surface Radium Isotopes and Nutrient Distributions
The distributions of surface 226Ra, 228Ra activities, and 228Ra/226Ra ratios in our study areas are shown in Figure 3, with obvious spatial variations. Actually, surface 226Ra, 228Ra activities, and 228Ra/226Ra ratios show similar patterns in both seasons. Specifically, in June 2015, our observed activities of 226Ra and 228Ra ranged from 77 to 120 dpm/m3 and from 111 to 305 dpm/m3, respectively, while the 228Ra/226Ra ratios were between 1.4 and 2.6. The lowest values of 226Ra, 228Ra, and the ratio occurred in the eastern region, which corresponded to the highest salinity. Similar to salinity and temperature, obvious differences in 226Ra, 228Ra and the ratios distributions were also observed between the eastern and western regions, with low values occurring on the eastern side and high values occurring on the western side.
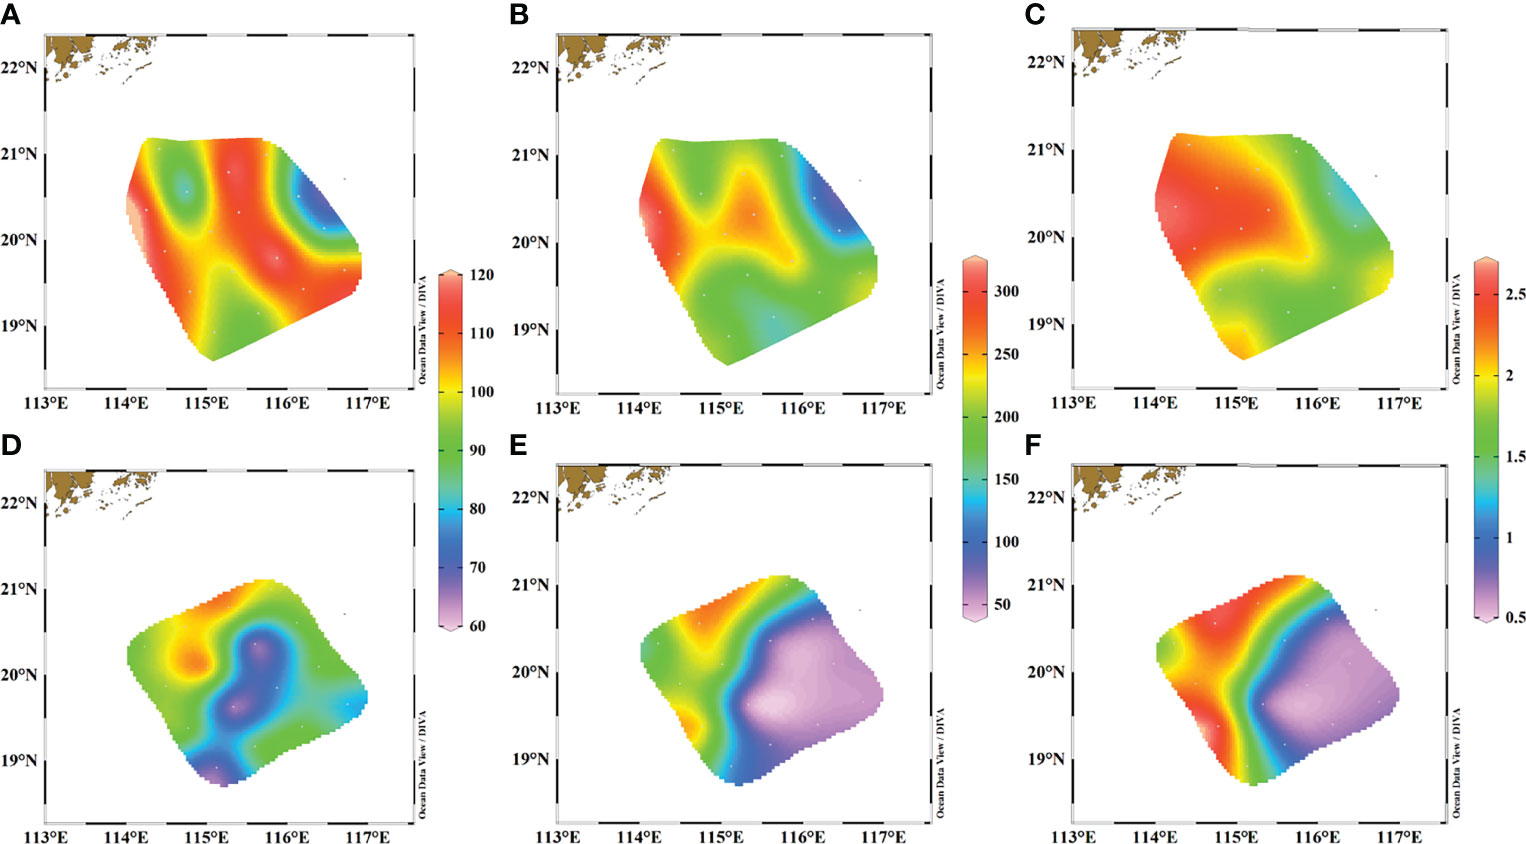
Figure 3 Distributions of surface Ra activities (dpm/m3) and the ratios in our study. (A) 226Ra in June 2015, (B) 228Ra in June 2015, (C) 228Ra/226Ra ratios in June 2015, (D) 226Ra in March 2017, (E) 228Ra in March 2017, and (F) 228Ra/226Ra ratios in March 2017.
From the Pearl River plume to the slope of the NSCS, values of surface salinity, Ra, and nutrients showed remarkable variations (Figure 4). Salinity significantly increased from 17.40 to 34.1, and 226Ra and 228Ra decreased from 388 to 96 dpm/m3 and from 610 to 210 dpm/m3, respectively. Before entering our square sampling area, good relationships with the distances from the coasts supported the distributions of 226Ra and 228Ra. The concentrations of DIN ranged from 0.14 to 99 μmol/L, concentrations ranged from 0.03 to 0.45 μmol/L and DSi concentrations ranged from 1.8 to 81 μmol/L. Nutrient concentrations both showed clear decreasing trends with the gradients (Δnutrient/Δx) of −0.56 ± 0.30, −0.0022 ± 0.0013, and −0.41 ± 0.27 μmol/L/km for DIN, and DSi, respectively. Along this transect, values of surface Ra and nutrients changed little over our investigating area (stations J8–J5), with averages of 93 ± 8.6 dpm/m3, 190 ± 36 dpm/m3, 0.10 ± 0.015 μmol/L, 0.013 ± 0.0047 μmol/L, and 1.7 ± 0.62 μmol/L for 226Ra, 228Ra, DIN, , and DSi, respectively, which were much lower than those on the transit pathway.
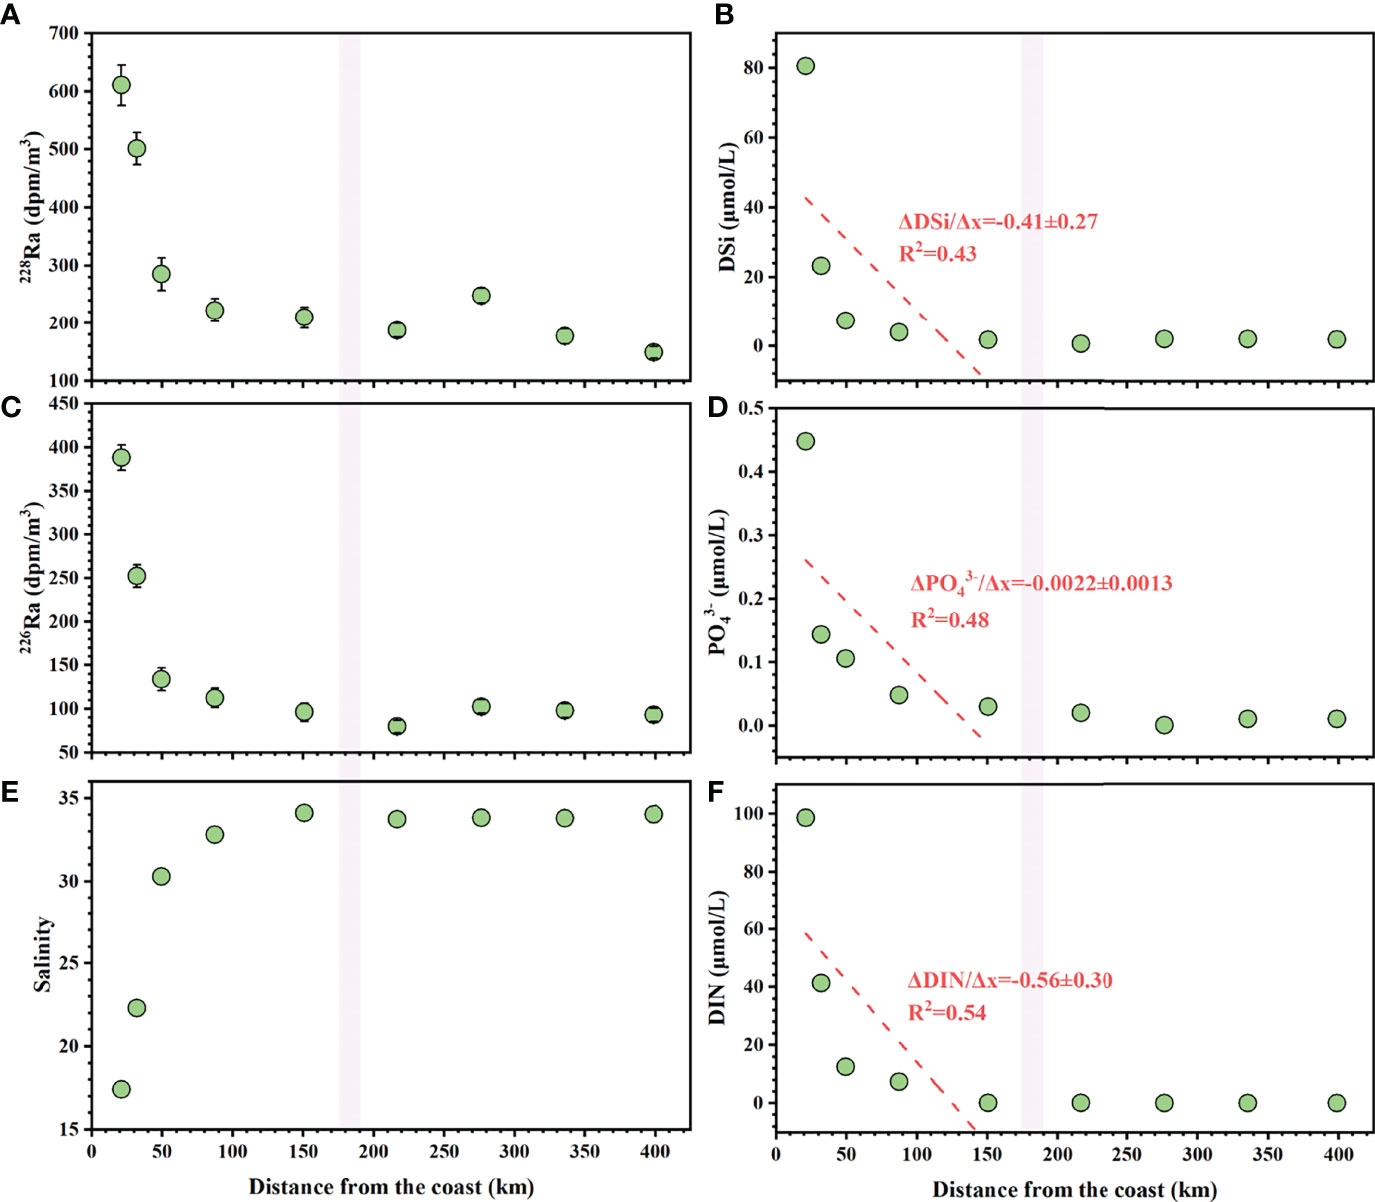
Figure 4 Surface (A) salinity, (B) 226Ra, (C) 228Ra, (D) DIN, (E) , and (F) DSi along the transect (stations K1–K5 to J8–J5) of June 2015. Dashed red lines represent the linear regression trends through the relationships between concentrations of Ra and nutrient and distance from the coast. The violet bands indicate the boundary of the shelf break, highlighted by high salinity and changing Ra and nutrient gradients. The Δnutrient/Δx indicates the nutrient gradients (μmol/km) over the distance from the coast.
Vertical Distributions of Radium Isotopes
The vertical profiles of hydrological parameters, 226Ra, 228Ra activities, and 226Ra/228Ra ratios are shown in Figure 5. In the upper 400 m of station J6, temperature, density, and salinity largely varied. The activity of 226Ra decreased from 98 to 85 dpm/m3, the activity of 228Ra decreased from 177 to 43 dpm/m3, and the 226Ra/228Ra ratio decreased from 1.8 to 0.47. However, from 1,000 m to near the bottom, density and salinity stayed nearly constant, while 226Ra and 228Ra activities both showed increasing trends and maximum values occurred near the bottom. Especially for 226Ra, the highest activity was observed near the bottom. The 226Ra/228Ra ratios below 1,000 m were almost constant at 0.019 but were noticeably lower than those observed in the upper 400 m. Similar patterns were also distributed at station J8, which suggested that the temperature, density, and salinity changed very little below 70 m, and 226Ra, 228Ra activities, and 226Ra/228Ra ratios showed downward trends from the bottom up.
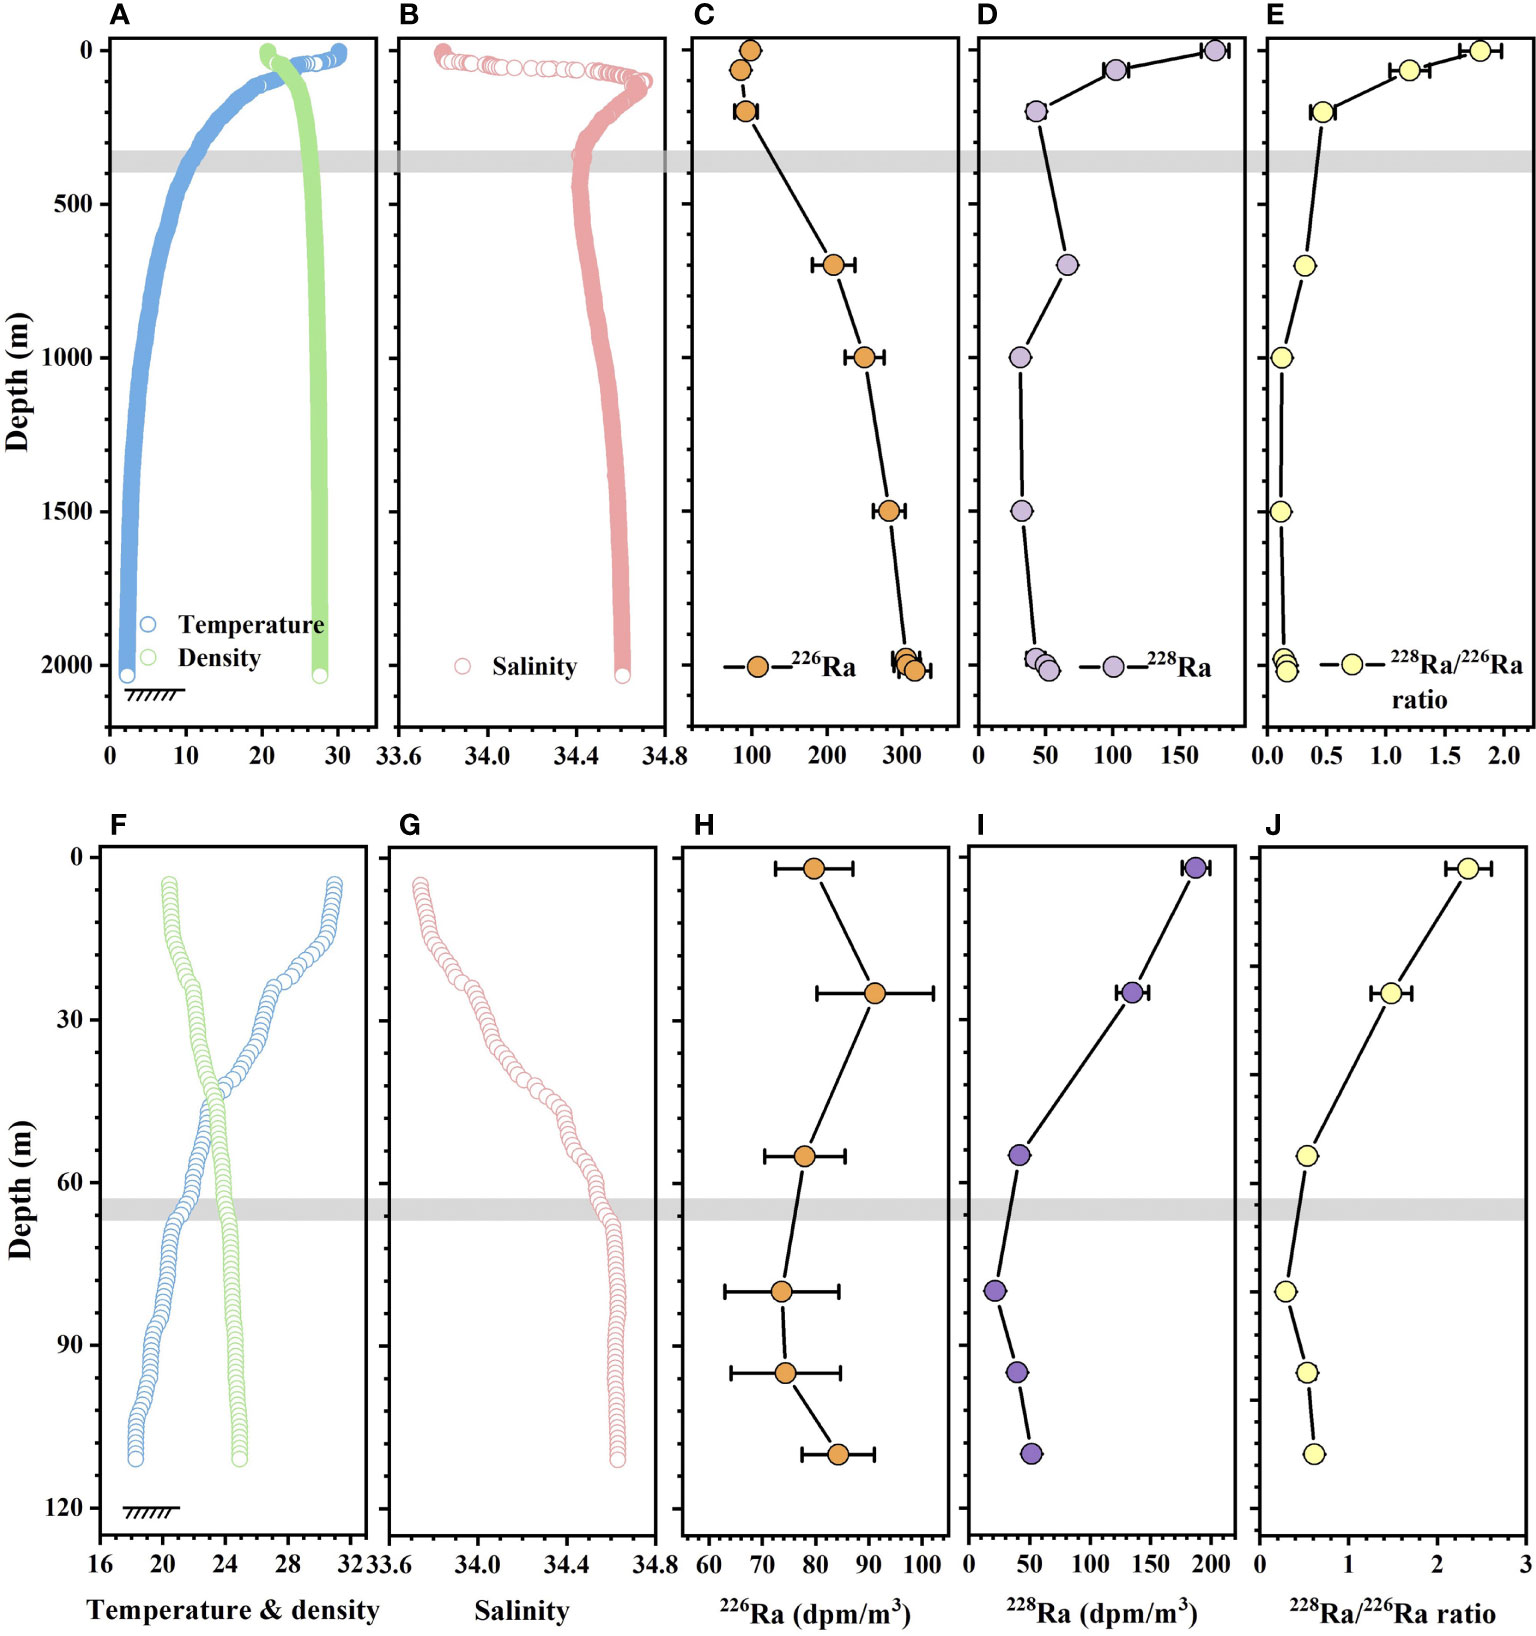
Figure 5 Depth profiles of temperature (°C), density (kg/m3), salinity, 226Ra, 228Ra activities (dpm/m3) and 226Ra/228Ra ratios at stations (A–E) J6 and (F–J) J8. The gray bands indicate the boundary of the different layers, highlighted by the significant changing salinity and Ra activities.
Discussion
Water Masses
When plotting 228Ra/226Ra ratios on the potential temperature–salinity diagram, it showed that the mixing of the water masses in the NSCS distributed their unique signals of 228Ra/226Ra ratios and salinity and has obvious seasonal variations (Figure 6). Specifically, relatively low salinity occurred in June 2015, indicating that the Shelf Water (SHW) had a significant impact on the region of interest, which may be driven by the joint contribution of Pearl River freshwater and mesoscale eddies (He et al., 2016; Zhang et al., 2019a). Besides, our study areas were affected by the SCSWC and SCSBK in both seasons, as illustrated in Figure 6.
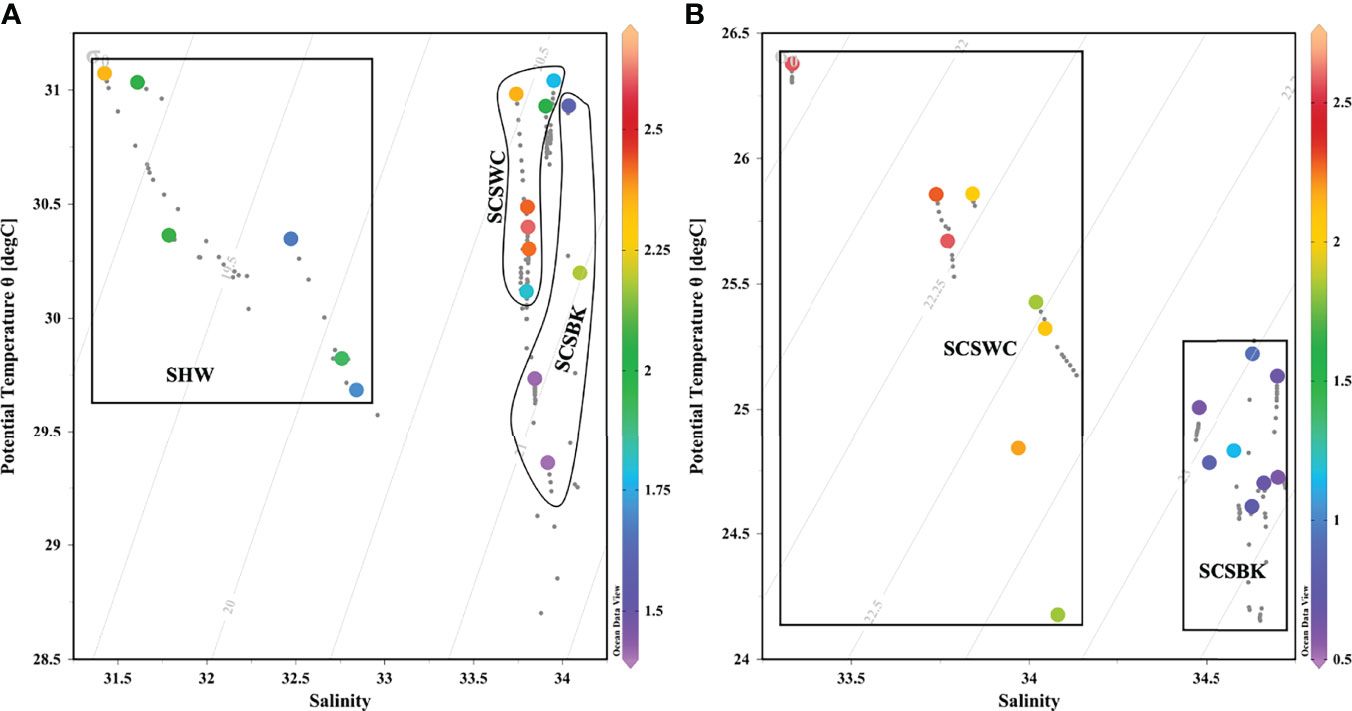
Figure 6 Surface 228Ra/226Ra ratios on the potential temperature–salinity diagram of upper 20 m in the continental slope of the NSCS in (A) June 2015 and (B) March 2017. SHW represents Shelf Water, SCSWC represents the South China Sea Warm Current, and SCSBK represents the South China Sea Branch of Kuroshio.
Due to fact that the effect of biogenic particles on Ra activity can be neglected, surface 226Ra and 228Ra activities were controlled only by water mixing and radioactive decay (G. Wang et al., 2021b). As a result, a mixing model of multi-end members based on Ra isotopes could be set up to quantify the proportion of water masses in the NSCS. The contributions of SHW, SCSWC, and SCSBK to the surface water in the area of our interest in June 2015 can be estimated by solving the following equation:
where f refers to the fraction of each water mass, S is salinity, 226Ra is the activity of the indicated Ra isotopes, and the subscripts SHW, SCSWC, SCSBK, and obs represent the SHW end-member, the SCSWC end-member, the SCSBK end-member, and the observed values of an individual sample, respectively. Here, we took the station K3 as the SHW end-member, in which the salinity was 30.30 and the 226Ra activity was 134 ± 13 dpm/m3, so 226Ra could be totally desorbed at such high salinity. Besides, the salinity and 226Ra activity in the SCSWC end-member were 33.81 and 117 ± 6.9 dpm/m3, respectively, and in the SCSBK end-member were 34.69 and 42 ± 2.7 dpm/m3 (Nozaki et al., 1989), respectively, and they were both in the respective transit pathways of the two water masses. Thus, the fraction of each water mass in June 2015 can be obtained using Eq. (1).
While in March 2017, signals of two water masses were observed, and we applied a two-end-member mixing model developed by Moore et al. (1986) to access the fractions, which can be written as follows:
where ARobs denotes the 228Ra/226Ra ratio in our observed samples. Note that even if there were only two water masses, salinity was still used to correct for evaporation and precipitation. Meanwhile, we chose the 228Ra/226Ra ratio to build the mixing model rather than the 226Ra or the 228Ra alone, because it was expected to reduce the effects of biological usage and physical interaction of a single isotope on the calculation (Kawakami & Kusakabe, 2008; Chen et al., 2010). For the SCSWC end-member during the period, we applied the values of 33.70 for salinity, 76 ± 3.7 dpm/m3 for 226Ra and 197 ± 11 dpm/m3 for 228Ra as collected in similar seasons (Tan et al., 2018). Because the 228Ra/226Ra activity ratio in the Kuroshio water stayed relatively stable over time (Wang et al., 2021b), the Ra activities in the SCSBK end-member were used as previously described. Combining the salinity and the 228Ra/226Ra ratios measured during our observation, the individual fraction of each water mass can be estimated from Eq. (2).
The fraction of the SHW in the study area of interest ranged from −0.01 to 0.73, with an average of 0.23 ± 0.26. The pattern of the SHW fraction was similar to salinity, with a high fraction corresponding to low salinity and vice versa (Figure 7). The maximum fraction of the SCSBK in June 2015 was observed in the southeast of the study area and a considerable fraction also appeared on the western side, indicating that the Kuroshio water could reach as far west as 115°E in the surface water of the NSCS under the possible influence of cyclonic circulation (Gan et al., 2016). The averaged SCSBK fraction was estimated to be 0.25 ± 0.16, which was highly in agreement with the result of 0.23 ± 0.11 derived by Wang et al. (2021b), which was both obtained in the summer and based on Ra isotopes. The SCSBK fraction in March 2017 ranged from 0.01 and 0.91, with an average of 0.57 ± 0.32 and was significantly higher than that in summer. The comparison followed a typical pattern because the strongest intrusion was usually shown to occur in the wintertime and weakened toward summer (Hsin et al., 2012; Nan et al., 2015). The western parts of the study area were heavily affected by the SCSWC in both two seasons, and the mean fractions were 0.52 ± 0.27 and 0.43 ± 0.32 for June 2015 and March 2017, respectively. Generally, the formation and expansion of the SCSWC are dynamically related to the SCSBK (e.g., Xue et al., 2004; Yu et al., 2021), so the intrusion of the SCSBK into the NSCS can influence the SCSWC proportion, which resulted in that higher fraction of the SCSWC occurring in June 2015. Overall, the fractions of the multi-water masses distributed significant seasonal variations.
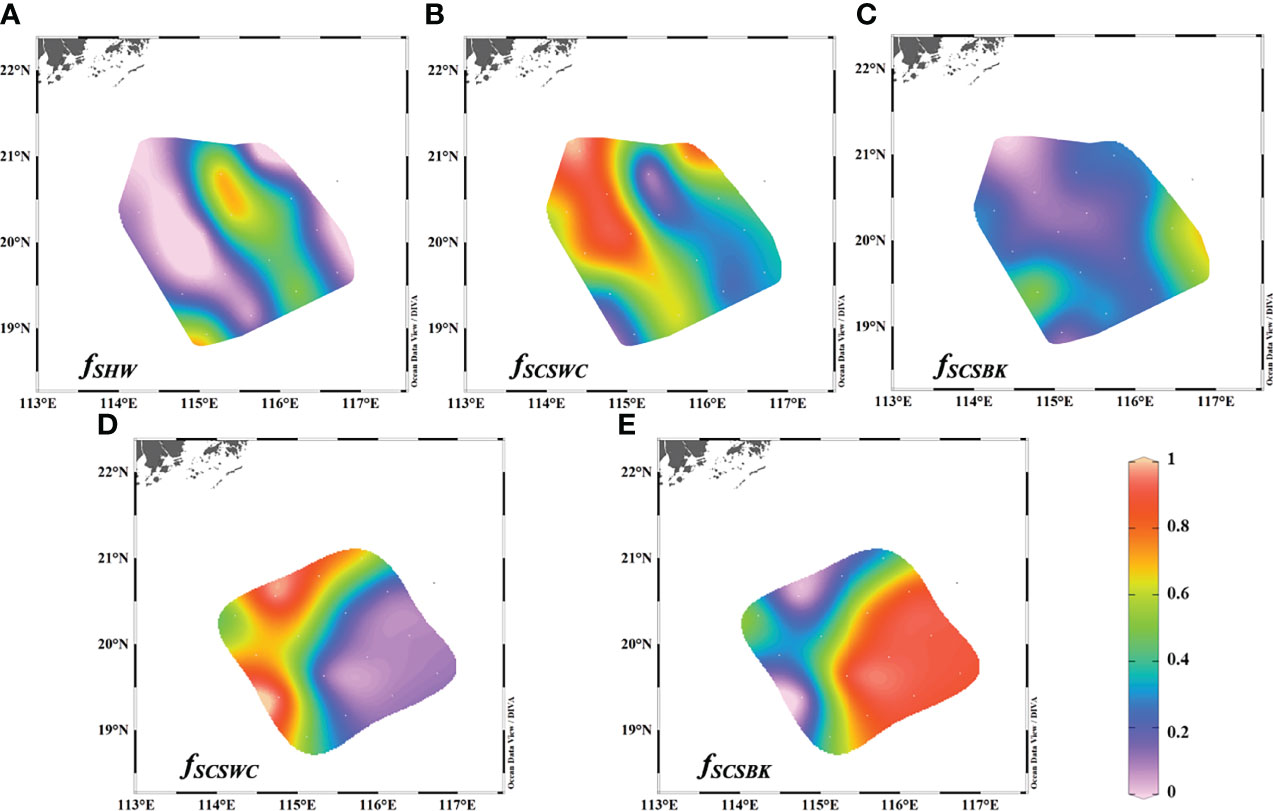
Figure 7 Fractions of SHW, SCSWC, and SCSBK in the surface water of our study area of interest in the NSCS during (A–C) June 2015 and (D, E) March 2017.
The fractions of water masses obtained by mixing models (Eqs. 2, 3) are generally sensitive to end-member variations. In this study, we also conducted an uncertainty analysis to evaluate our end-member choices. In June 2015, the water mass fractions were the most sensitive to 226Ra activity variations in the SCSWC end-member. Specifically, a 10% increase in the activity of 226Ra would increase in the fraction by 7.9% (SHW) to 28% (SCSBK), while 10% increases in the SHW and SCSBK end-members would only cause fraction variations by 5.0% (SHW) to 18% (SCSBK) and 1.7% (SHW) to 6.3% (SCSBK), respectively. In March 2017, similarly, a 10% increase in the activities of 226Ra or 228Ra in the SCSWC end-member would cause a fractional increase of 11% (SCSBK) to 17% (SCSWC), but only 1.1% (SCSBK) to 4.2% (SCSWC) caused by the activity variations of 226Ra or 228Ra in the SCSBK end-member. The quantitative uncertainty analysis indicated that our considered end-members were suitable to build the mixing models. Additionally, 226Ra and 228Ra measurement errors can also be involved in our mixing models and lead to variations in water mass fractions. Here, the measurement errors of 226Ra and 228Ra were both 3.6–12%, and we used a maximum measurement error of 12% to conduct the uncertainty analysis. The results showed that a 12% increase in observed 226Ra activities would cause a change in the water mass fraction by 19% (SHW) to 68% (SCSBK) in June 2015 and 14% (SCSBK) to 18% (SCSWC) in March 2017, suggesting a significant influence of Ra measurement errors on the uncertainty of water mass fraction, and the greater measurement error would usually contribute to greater uncertainty (Wang et al., 2021b).
Horizontal Mixing
In surface water, horizontal mixing is typically several orders of magnitude higher than vertical mixing, indicating that the term of downward mixing for 228Ra could be neglected (Hsieh et al., 2021). Therefore, except for water mixing and radioactive decay, there was no additional input or removal of 228Ra in the transit pathway and the study area of our interest. Assuming a steady state, a common one-dimensional 228Ra advection–diffusion model was set up to measure diffusion coefficients and advection rates, and the formula was expressed as follows (Moore, 2015):
where Kx denotes the horizontal eddy diffusion coefficient, ω is the advection velocity, x is the distance from the coast, Aex the excess 228Ra activity and λ is the 228Ra decay constant. Actually, a boundary condition was applied in Eq. (3), namely, the 228Ra activity was zero at an infinite distance (x→∞). However, this condition is not usually valid within the relatively small offshore distance scale (<50 km) (Moore, 2000), just like in our study region, not to mention that our measured surface 228Ra activity is far away from zero. As a consequence, we also followed the suggestion of Moore (2015) and Hsieh et al. (2021) to define the excess 228Ra by subtracting the background value in the center of the NSCS and then applying it to build the advection–diffusion model.
In this study, due to the significant excess 228Ra distributions before and after the shelf break (Figure 8), two scenarios were considered in our horizontal 228Ra estimations, one was mixing only (ω = 0) and the other was advection only (Kx = 0). Therefore, with the boundary conditions of Aex_0 = A0 − Abg at x = 0 and Aex = 0 at x = ∞, Eq. (3) can be solved for diffusive mixing only as:
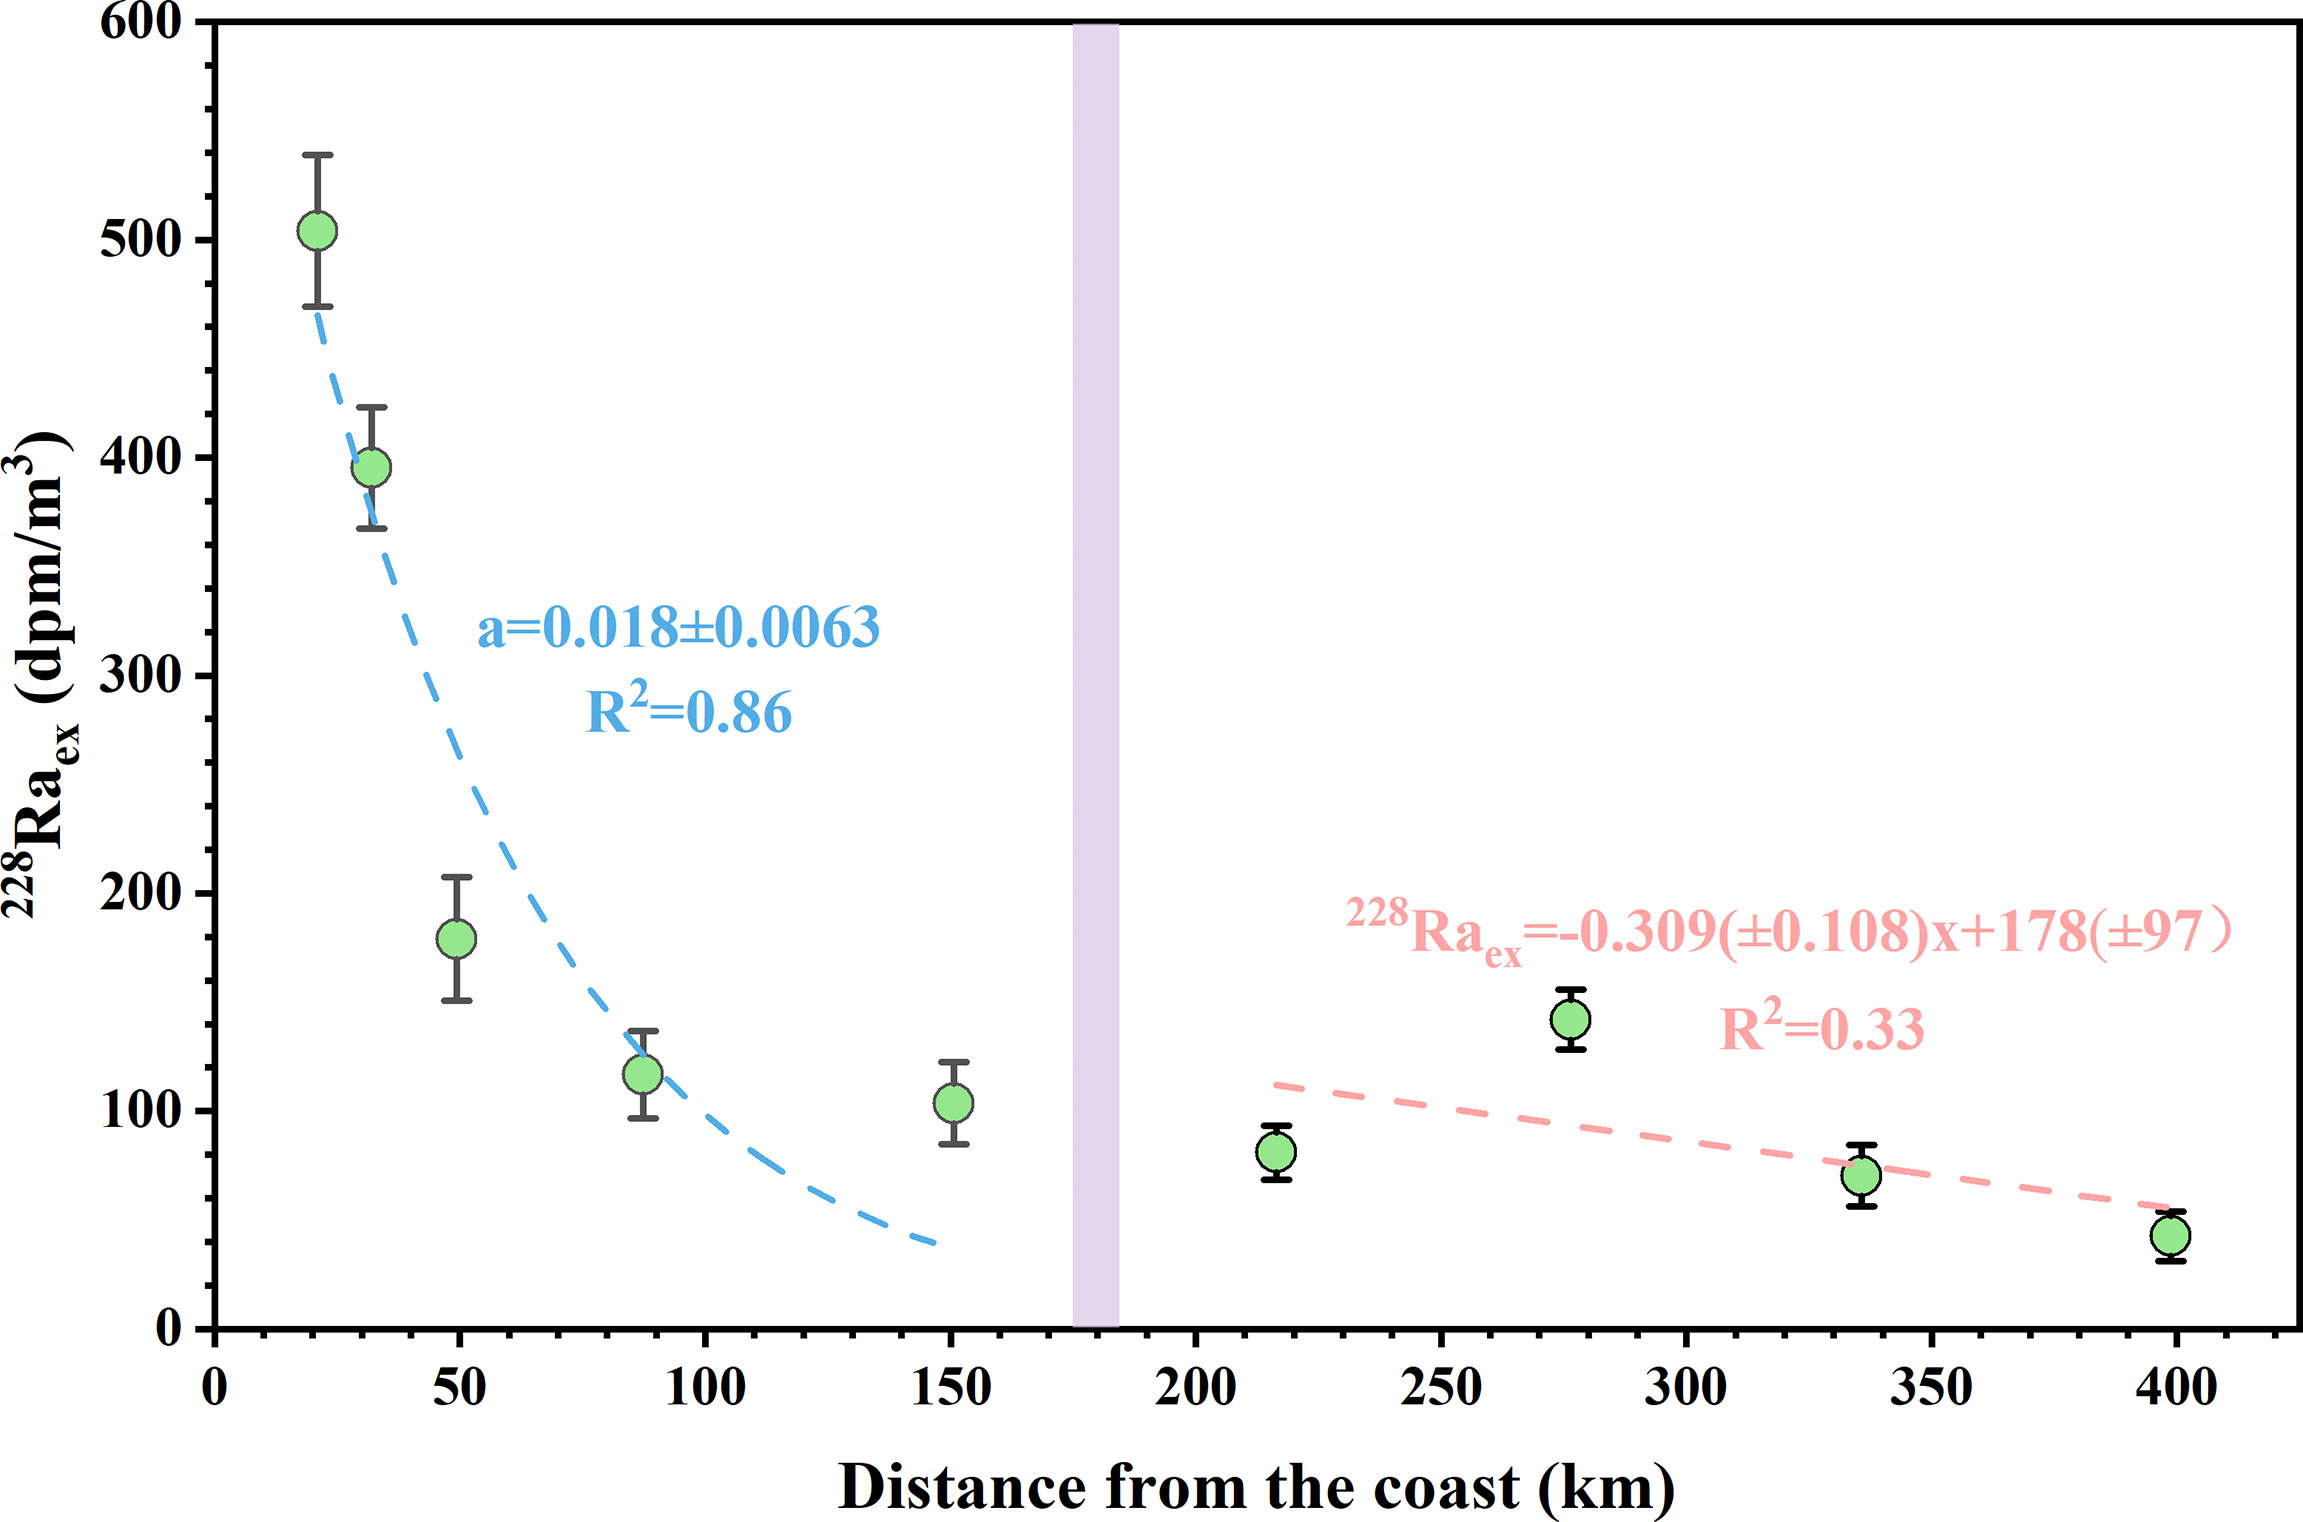
Figure 8 Plots of the surface excess 228Ra activities along the transect (stations K1–K5 to J8–J5) of June 2015. Dashed lines represent the best-fit exponential curves through the relationships between 228Raex activity and distance from the coast. The violet bands indicate the boundary of the shelf break.
And for advection only as:
where Aex_0 is the 228Raex activity at x = 0, X1/2 is the distance at which Aex = 0.5Aex_0 and T1/2 is the half-life of 228Ra.
Therefore, when plotting the surface excess 228Ra activities versus the distance from the coast, the best exponential fit was observed before the shelf break, with a gradient of 0.018 ± 0.0063 (Figure 8). So based on Eq. (4), the horizontal diffusion coefficient Kx was estimated to be (1.2 ± 0.79) × 105 cm2/s. The result was significantly lower than that obtained in the Pearl River estuary region (<80 km from the coast) of 4.7 × 106 cm2/s (Wang et al., 2021c), but was a bit higher than that mentioned in Liu et al. (2020) of 5 × 104 cm2/s obtained by numerical modeling. In this region, we only use the mixing model because of the Pearl River intrusion that results in a strong mixing signal. For the advection after the shelf break, according to Eq. (5) and the distinct linear fit between excess 228Ra activity and distance from the coast (Figure 8), the X1/2 was 445 ± 288 km (from station J8), thereby accessing advection velocity ω of 0.25 ± 0.16 cm/s. Our 228Ra-derived advection velocity was lower than the result from the track of the drifter during the same cruise and distributed a consistent direction (Chen et al., 2016), but was comparable to other surface regions of the NSCS (e.g., Chou et al., 2006; Liu et al., 2020). However, the surface water of the NSCS is occasionally controlled by eddies, which may result in considerable spatio-temporal variations of the advection velocity values.
Vertical Mixing
In the vertical profiles, 228Ra activities were distributed, with 228Ra concentrations in surface and near-bottom waters considerably higher than those in intermediate waters, indicating that the surface-mixed layer could supply the 228Ra down into the subsurface and that 228Ra in near-bottom water could be transported upward under the influence of sediment diffusion (Cai et al., 2002; Van Beek et al., 2007). Considering that 228Ra for vertical mixing calculations is mixed horizontally far away from the coast, the one-dimensional model can also be applied to obtain the vertical diffusion coefficients (Kz) downward and upward and was expressed as (Hsieh et al., 2021):
where Aez is the activity of excess 228Ra in the depth profile and z is the water depth. Like the horizontal mixing, we used the similar boundary conditions of Aez_0 = A0 − Abg at x = 0 and Aez = 0 at x = ∞, then solved Eq. (6) as follows:
where Aez_0 is the 228Raex activity at z = 0 (the mixed layer or near-bottom water). For a conservative calculation, the lowest 228Ra activity in the vertical profile of the station J8 was the background value, which was 22 ± 2.6 dpm/m3. So we plotted the 228Raex activity versus water depth, as shown in Figure 9, and both showed significant exponential fitting coefficients in the upper and lower layers. Note that the average activity and depth of the upper two samples of Figure 5 were used in the mixed layer.
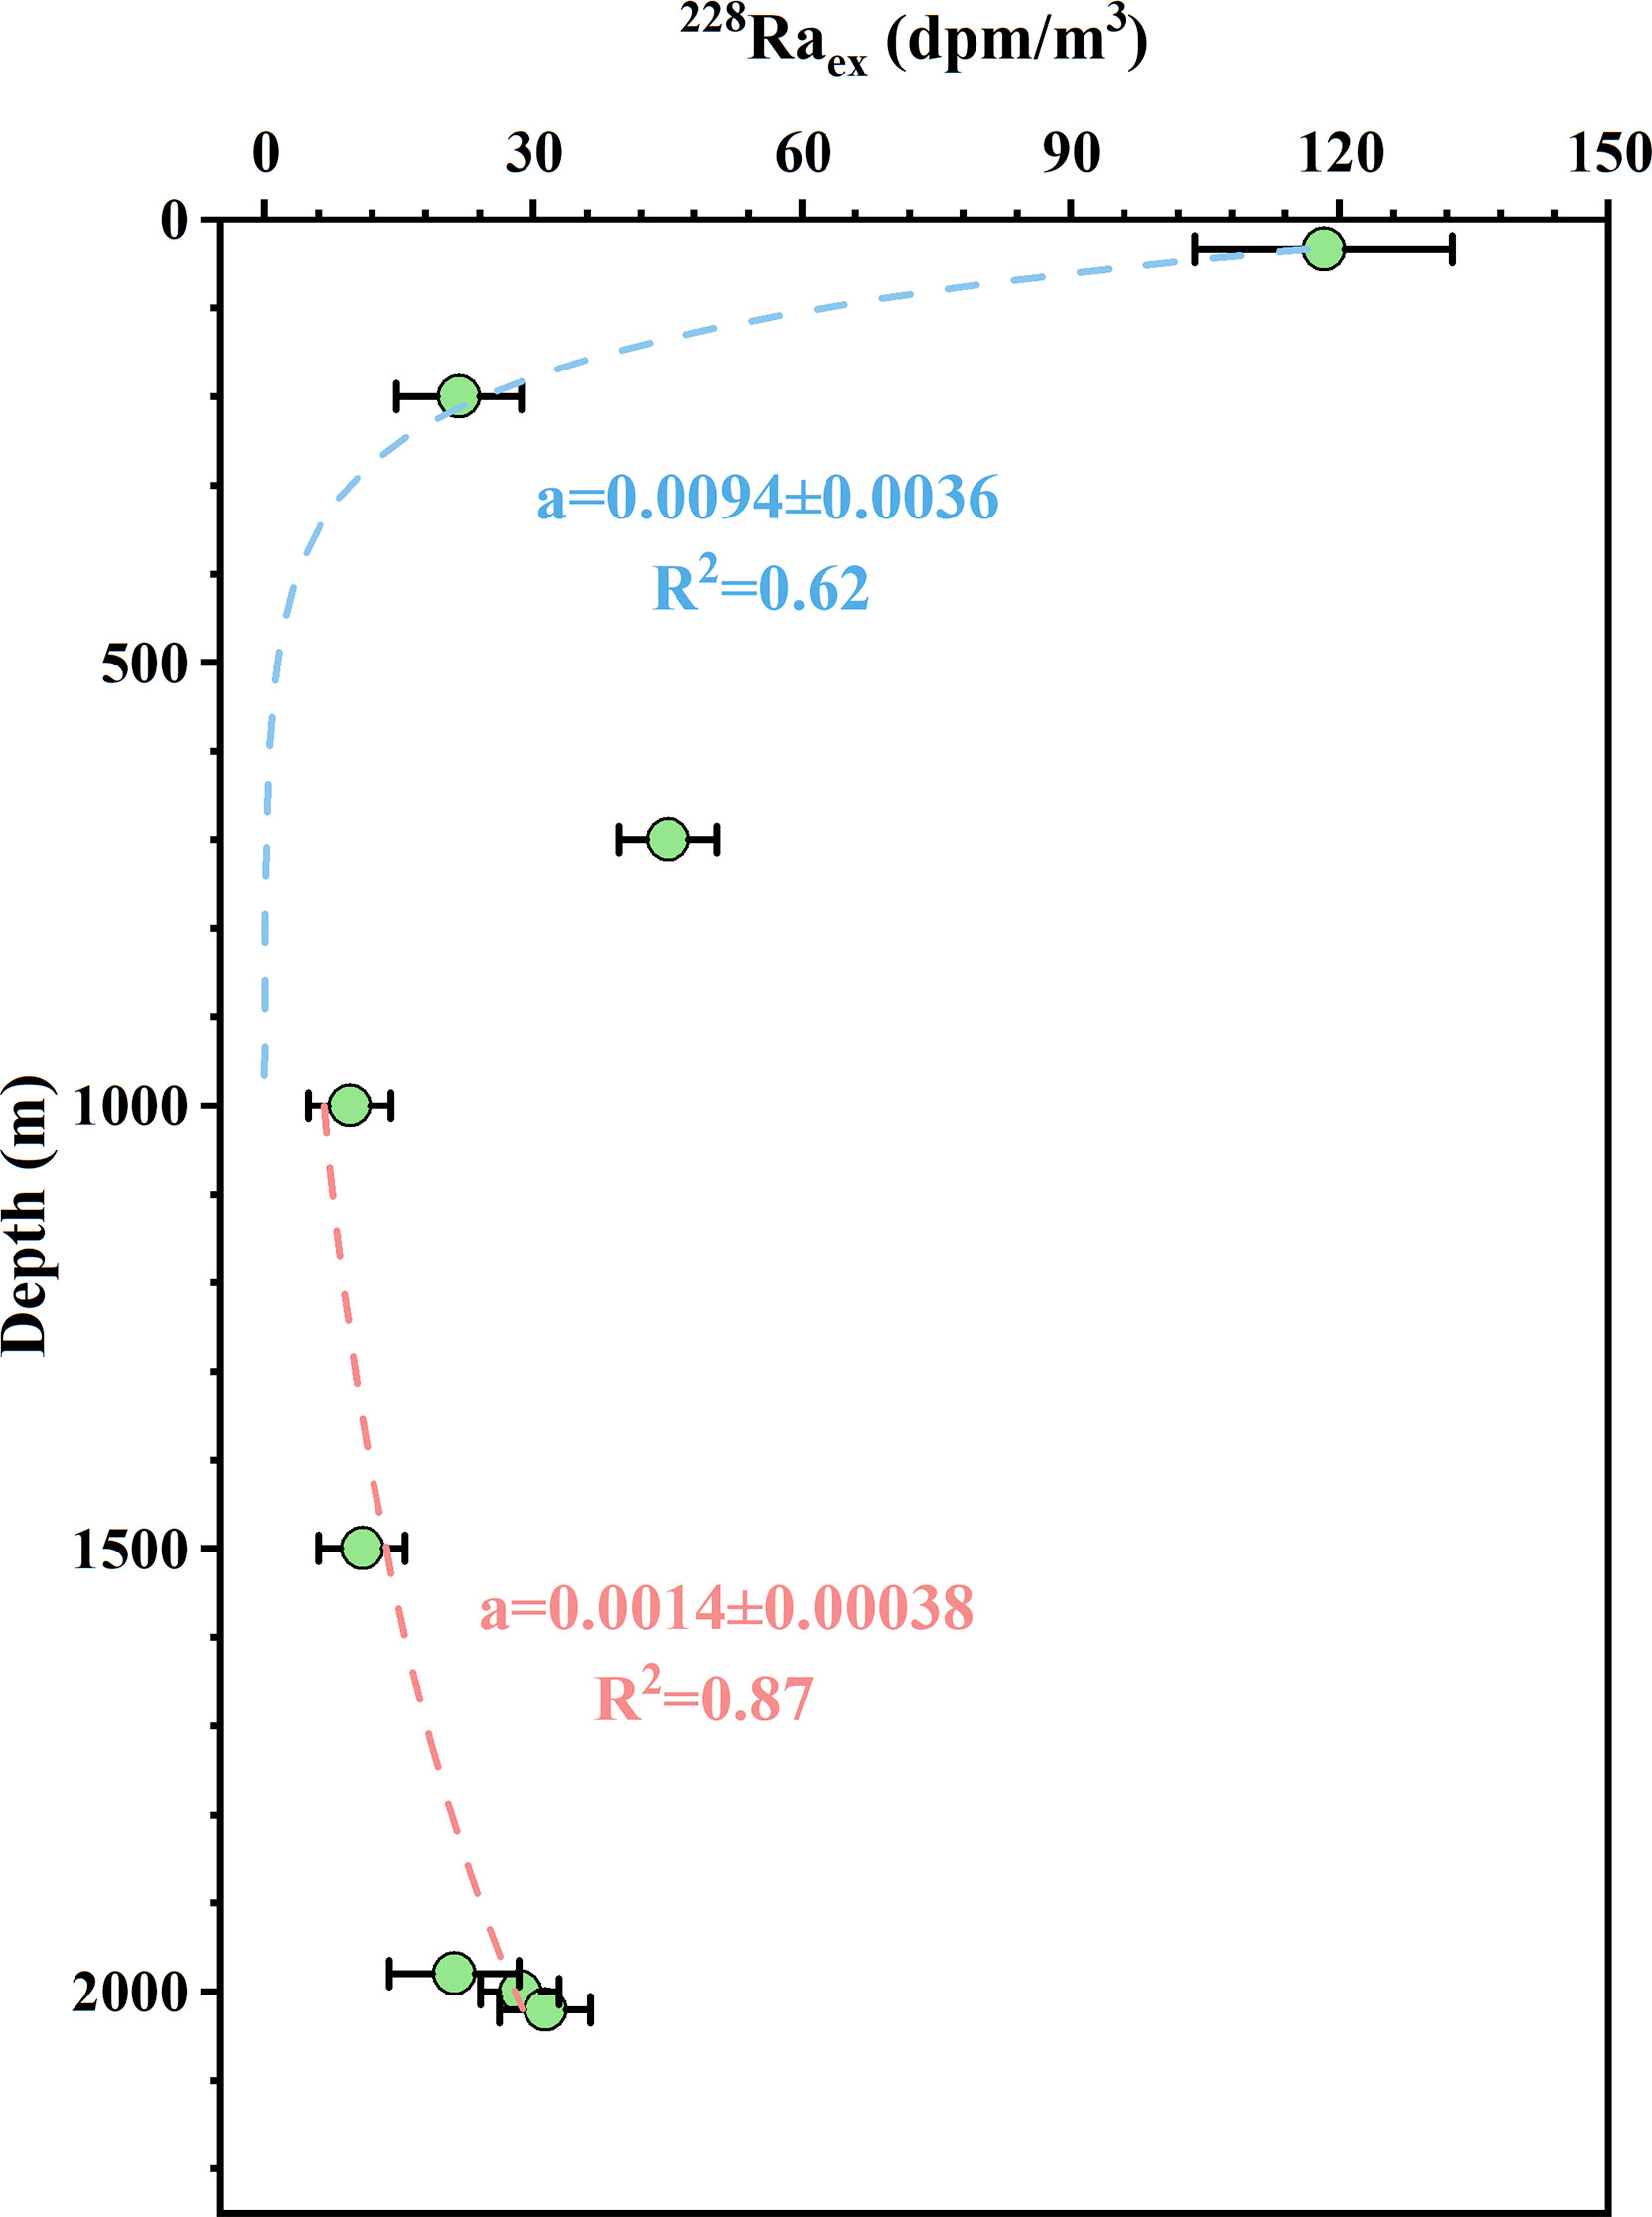
Figure 9 Plots of the excess 228Ra activities in the vertical profile of station J6 of June 2015. Dashed lines represent the best-fit exponential curve through the relationships between 228Raex activity and water depth.
In the upper 1,000 m, the best-fit exponential curve gradient (a) was 0.0094 ± 0.0036, leading to a vertical diffusion coefficient (Kz) of 0.43 ± 0.33 cm2/s down to the subsurface. Our result was highly consistent with the value of 0.23 cm2/s using 228Ra, estimated by Cai et al. (2002) in the upper 300 m, and within the range of 0.037 to ~10 cm2/s obtained from the results reported in the upper layer of the South China Sea (Li et al., 2016; Shang et al., 2017; Shih et al., 2020). As mentioned above, Ra diffusing across the sediment–water interface usually dominates Ra activity in the lower layer of the water column, accompanied by good exponential regression for 228Raex and simulated a fitting curve of 0.0014 ± 0.00038 (Figure 9). So the upward vertical diffusion coefficient was revealed as 18 ± 9.9 cm2/s according to Eq. (7). To our knowledge, our estimate was the first exploration of the Ra-derived upward vertical diffusion for the South China Sea but was comparable with the results in other Chinese seas (Liu et al., 2010; Su et al., 2013b). As a whole, in the upper layer, the vertical diffusion downward was 4–5 orders of magnitude lower than the surface horizontal mixing, confirming our above assumption when calculating horizontal mixing. While in the water column, the upward vertical diffusion from the bottom sediment was significantly higher than the vertical diffusion down to the subsurface.
Water Mixing Associated Nutrient
Because of water mixing, the surface waters on the slope of the NSCS receive nutrient supplies from multiple sources. For example, shelf water surprisingly intruded into the study area of interest in June 2015, and it was bound to carry nutrients from the coastal zones. Combined with the estimated horizontal diffusion and gradients of nutrient concentrations (Figure 4), the horizontal nutrient fluxes were assessed to be (5.6 ± 4.9) × 102 mmol/m2/d for DIN, 2.2 ± 2.0 mmol/m2/d for DIP, and (4.1 ± 3.9) × 102 mmol/m2/d for DSi. Previously, Tan et al. (2018) reported that SGD delivered nutrient fluxes of 7.9–19 mmol DIN/m2/d, 0.037–0.079 mmol DIP/m2/d, and 12–28 mmol DSi/m2/d into the NSCS, which were much lower than the 228Ra-derived horizontal diffusive nutrient fluxes. Meanwhile, our estimated horizontal DIN flux was much higher than that obtained by Li et al. (2018) of 0.2–3.6 mmol/m2/d (only for ). In fact, our estimates usually provide integrated fluxes of nutrients, not only considering all possible inputs, such as the Pearl River, SGD, and sediments from the coastal zones to the slope of the NSCS, but also the eddy-entrained Pearl River plume into the NSCS, which was also observed during our investigation (He et al., 2016), suggesting that the horizontal diffusion mixing could carry a large amount of nutrients to our study area of interest. While in the slope region after the shelf break, the mixing process also occurred for nutrients due to advection. The term was obtained by multiplying the advection velocity with the concentrations of nutrients in the initial advective waters (Hsieh et al., 2021). Here, we used nutrient concentrations at station J8 as the initial advective water, which were 0.12, 0.02, and 0.69 μmol/L for DIN, DIP, and DSi, respectively. Thus, the estimated 228Ra-derived advective nutrient fluxes in the slope region were 25 ± 16 mmol/m2/d for DIN, 4.2 ± 2.7 mmol/m2/d for DIP, and 146 ± 195 mmol/m2/d for DSi. For the vertical water column, the nutrient concentrations showed decreasing trends from near-bottom to the surface waters, and the upward vertical diffusion plays an important role among it. Considering the decreasing trends with the gradients of 0.017 ± 0.0047 μmol/L/m for DIN, 0.0011 ± 0.00032 μmol/L/m for DIP, and 0.095 ± 0.014 μmol/L/m for DSi, giving the upward vertical nutrient fluxes of 2.7 ± 1.6, 0.18 ± 0.11, and 15 ± 8.4 mmol/m2/d for DIN, DIP, and DSi, respectively, in which the vertical upward DIN flux was much lower than the result of 45 mmol/m2/d during the impacts of mesoscale eddies in the South China Sea (Guo et al., 2015), but was consistent with the previous estimate of 0.66 mmol/m−2/d (only for ) in Cai et al. (2002) and the ranges of 0.11 to 1.54 reported in Shih et al. (2020) and the references therein. The mixing associated DIP and DSi fluxes were scarcely reported in previous studies of the NSCS, however, our comparable DIN fluxes with others also gave us confidence in the DIP and DSi fluxes.
To better understand the nutrient dynamics in the NSCS, a very simple diagram of nutrient sources was built in the region of interest, as shown in Figure 10. It is obvious that the dominant nutrient source in the study area was identified as horizontal diffusion, namely, the input from the coastal zone by shelf water, without considering internal regeneration. Besides, vertical upward mixing appeared to be a more important source of supplying nutrients to the upper layer compared to atmospheric deposition (Gao et al., 2020b; Wu et al., 2018). As mentioned above, because of the multiple sources and eddy-entrained Pearl River plume, shelf water unusually transported materials to the slope of the NSCS, not only the nutrients raised in this study, but also the carbon (Zhang et al., 2020) and trace metals (Wang et al., 2019; Zhang et al., 2019b), suggesting that the intrusion of shelf water played a vital role in the slope of the NSCS during our cruise. In our nutrient diagram, even though advection generally does not provide nutrients in the study area, it transports nutrients and mixes them with other waters. Note that we did not consider the biological effects when conducting our estimates of nutrient fluxes, and further studies are needed to understand the combined effects of water mixing and biological uptake on nutrient cycles in the ocean.
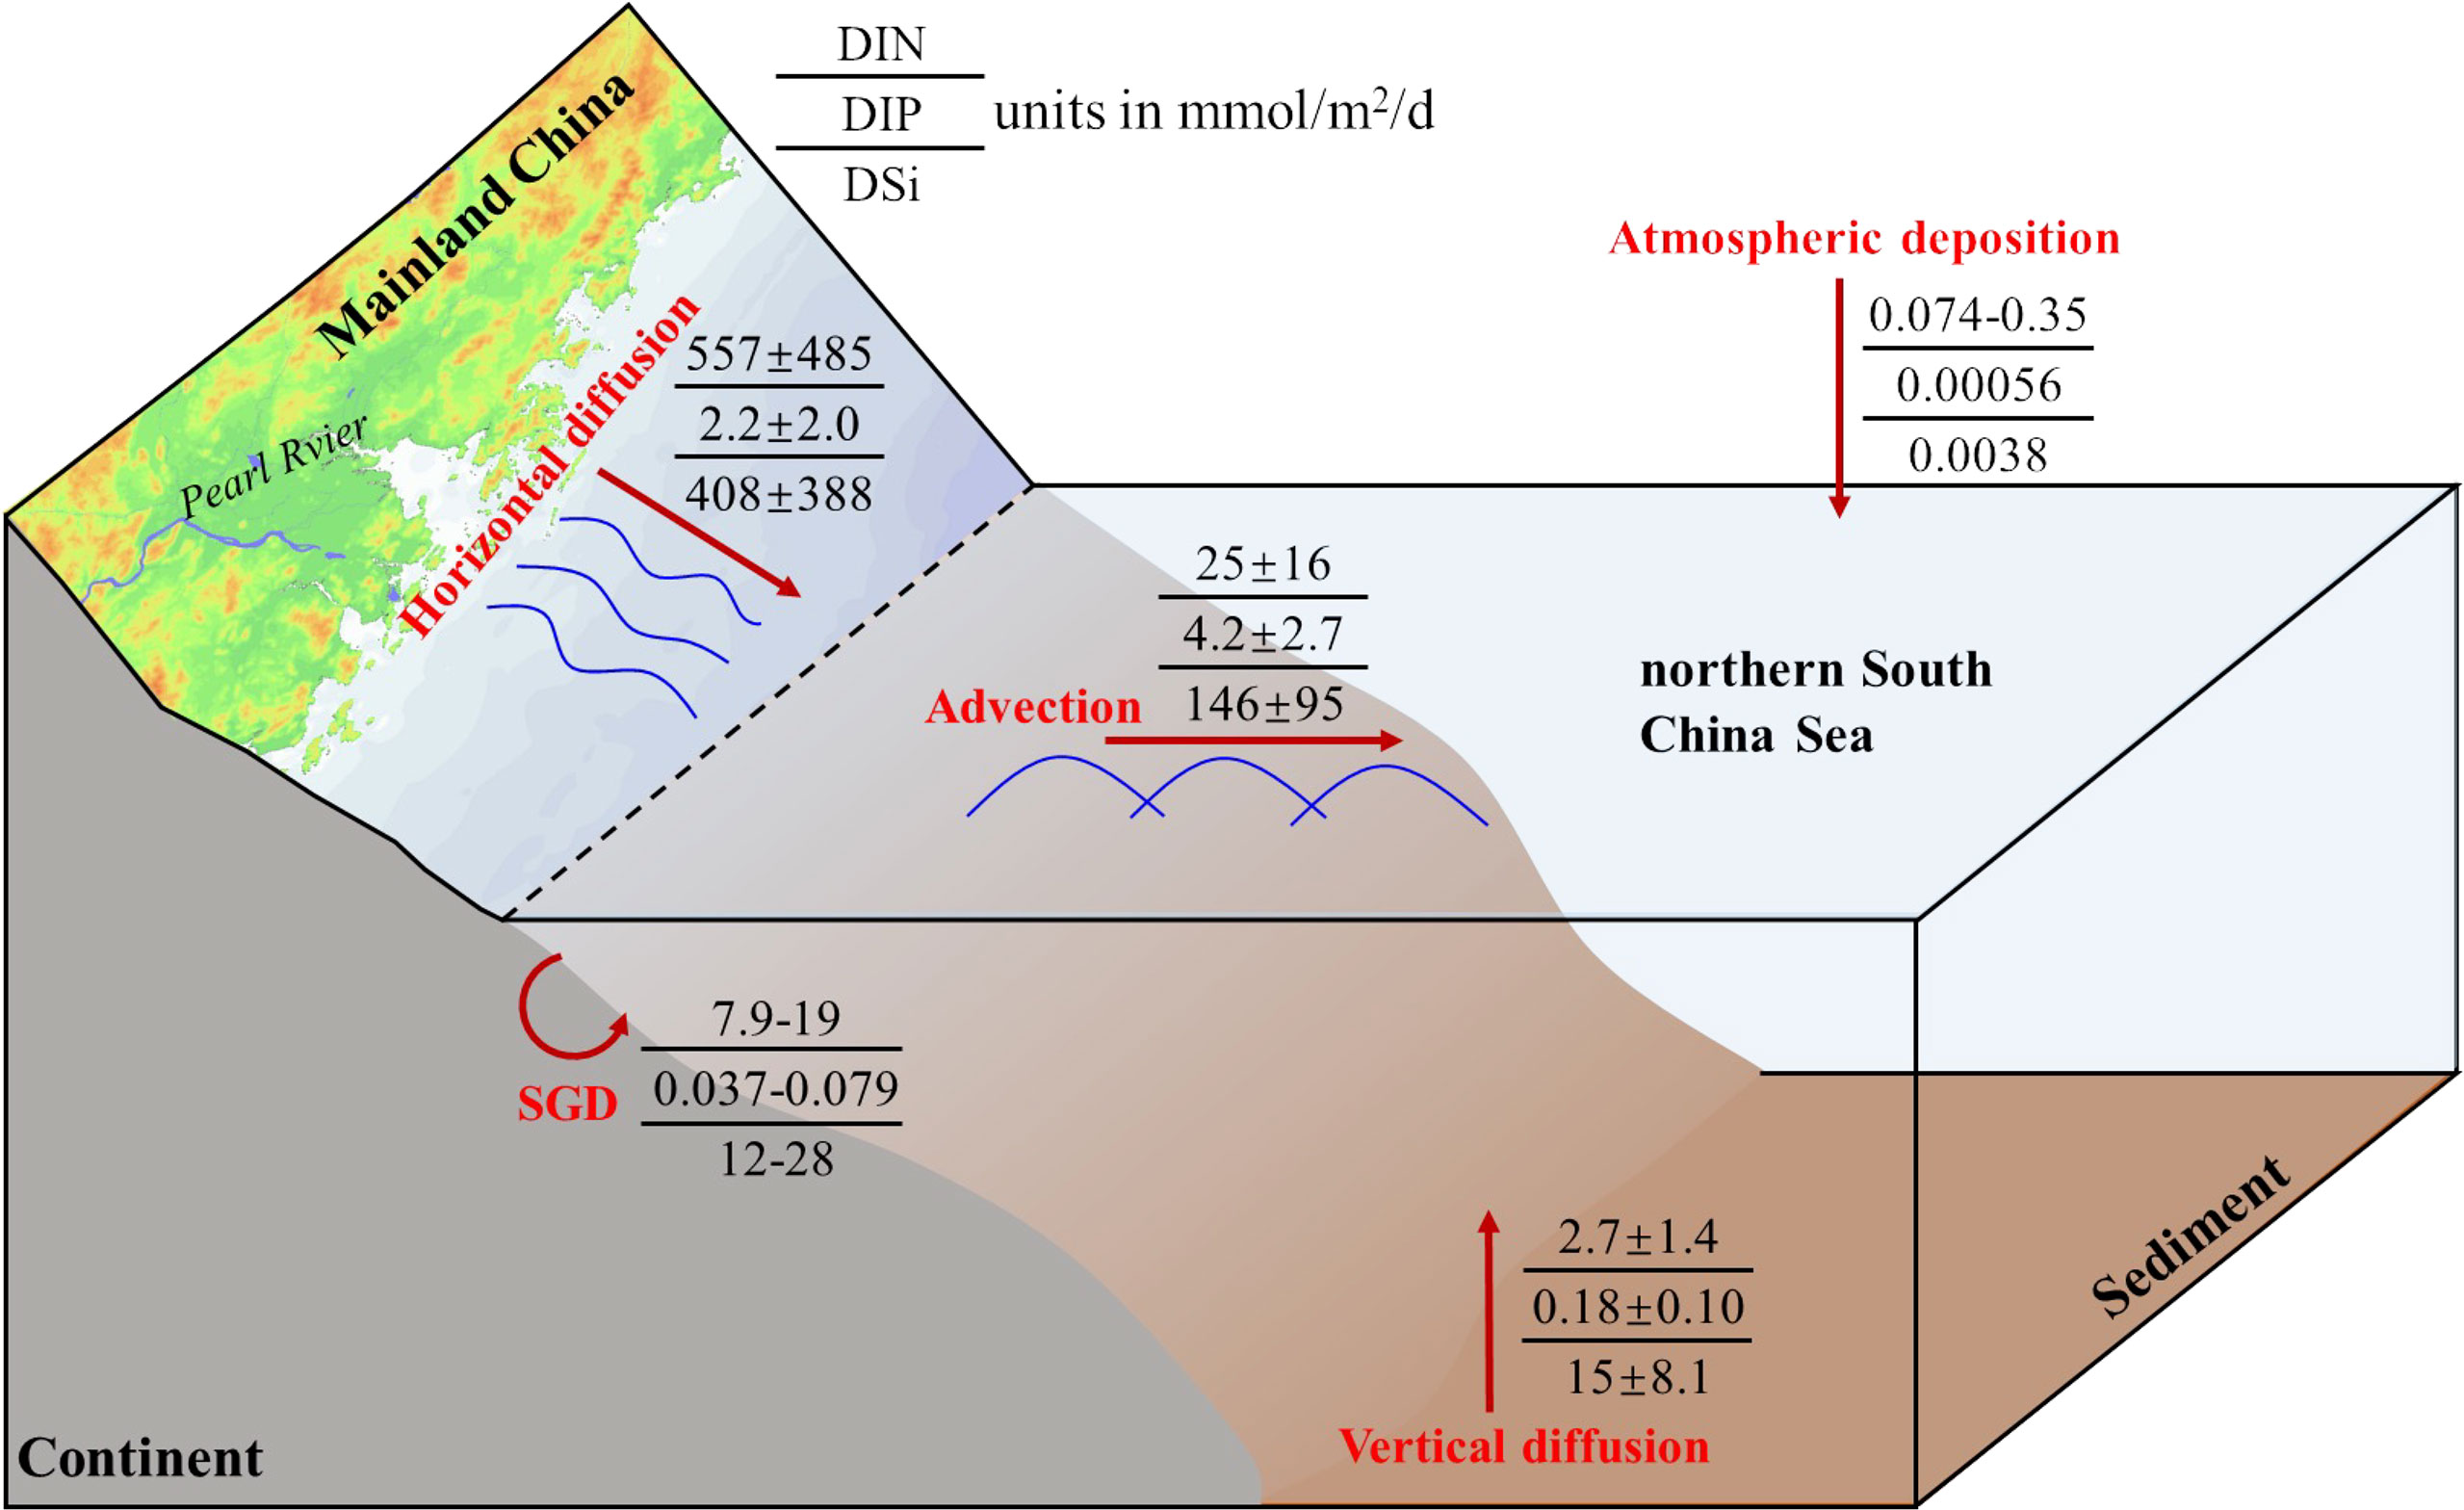
Figure 10 Schematic diagram of nutrient sources and mixing in the NSCS of our interest during June 2015.
Conclusion
By investigating the activities of 226Ra and 228Ra, this study provides an insight into the ocean water mixing processes in the NSCS. Through the end-members models, the fraction of each water mass was quantified and showed significant seasonal variations. In both horizontal and vertical directions, the diffusive velocities were accessed by a common one-dimensional 228Ra advection-diffusion model. Although based on some assumptions and certain uncertainties, our estimates are within the range of other observed values in the South China Sea. Then, combining the distributions of nutrient concentrations with the estimated water mixing associated nutrient fluxes suggests that the intrusion of shelf water played a vital role in the nutrient sources of the slope of the NSCS during our cruise, and nutrient fluxes via vertical upward mixing are more important than atmospheric deposition and comparable with SGD.
Data Availability Statement
The original contributions presented in the study are included in the article/supplementary material. Further inquiries can be directed to the corresponding author.
Author Contributions
JD and YW conceived the research project. JL collected samples, carried out data analysis, and wrote the manuscript. SL provides some nutrient data. All authors listed have made a substantial, direct, and intellectual contribution to the work and approved it for publication.
Funding
This study is supported by the Key Project of Chinese National Programs for Fundamental Research and Development (973 Program) (No. 2014CB441502), the National Natural Science Foundation of China (No. 41976040), and China Postdoctoral Science Foundation (No. 2021T140208).
Conflict of Interest
The authors declare that the research was conducted in the absence of any commercial or financial relationships that could be construed as a potential conflict of interest.
Publisher’s Note
All claims expressed in this article are solely those of the authors and do not necessarily represent those of their affiliated organizations, or those of the publisher, the editors and the reviewers. Any product that may be evaluated in this article, or claim that may be made by its manufacturer, is not guaranteed or endorsed by the publisher.
Acknowledgments
The authors would like to thank the crew on R/V Nanfeng for their assistance in the sample collection.
References
Arrigo K. R. (2005). Marine Microorganisms and Global Nutrient Cycles. Nature 437, 349–355. doi: 10.1038/nature04159
Cai P., Huang Y., Chen M., Guo L., Liu G., Qiu Y. (2002). New Production Based on 228Ra-Derived Nutrient Budgets and Thorium-Estimated POC Export at the Intercalibration Station in the South China Sea. Deep. Sea. Res. Part I 49, 53–66. doi: 10.1016/S0967-0637(01)00040-1
Chen D. Y., Lian E. G., Shu Y. Q., Yang S. Y., Li Y. L., Li C., et al. (2020). Origin of the Springtime South China Sea Warm Current in the Southwestern Taiwan Strait: Evidence From Seawater Oxygen Isotope. Sci. China Earth Sci. 63, 1564–1576. doi: 10.1007/s11430-019-9642-8
Chen W. F., Liu Q. A., Huh C. A., Dai M. H., Miao Y. C. (2010). Signature of the Mekong River Plume in the Western South China Sea Revealed by Radium Isotopes. J. Geophys. Res.: Ocean. 115, C12002. doi: 10.1029/2010jc006460
Chen Z., Yang C., Xu D. F., Xu M. (2016). Observed Hydrographical Features and Circulation With Influences of Cyclonic-Anticyclonic Eddy-Pair in the Northern Slope of the South China Sea During June 2015. J. Mar. Sci. 34, 10–19. doi: 10.3969/j.issn.1001-909X.2016.04.002
Chou W. C., Chen Y. L. L., Sheu D. D., Shih Y. Y., Han C. A., Cho C. L., et al. (2006). Estimated Net Community Production During the Summertime at the SEATS Time-Series Study Site, Northern South China Sea: Implications for Nitrogen Fixation. Geophys. Res. Lett. 33, L22610. doi: 10.1029/2005gl025365
Christie-Oleza J. A., Sousoni D., Lloyd M., Armengaud J., Scanlan D. J. (2017). Nutrient Recycling Facilitates Long-Term Stability of Marine Microbial Phototroph–Heterotroph Interactions. Nat. Microbiol. 2, 1–10. doi: 10.1038/nmicrobiol.2017.100
Du C., Liu Z., Dai M., Kao S. J., Cao Z., Zhang Y., et al. (2013). Impact of the Kuroshio Intrusion on the Nutrient Inventory in the Upper Northern South China Sea: Insights From an Isopycnal Mixing Model. Biogeosciences 10, 6419–6432. doi: 10.5194/bg-10-6419-2013
Farris A., Wimbush M. (1996). Wind-Induced Kuroshio Intrusion Into the South China Sea. J. Oceanogr. 52, 771–784. doi: 10.1007/BF02239465
Gan J. P., Liu Z. Q., Liang L. L. (2016). Numerical Modeling of Intrinsically and Extrinsically Forced Seasonal Circulation in the China Seas: A Kinematic Study. J. Geophys. Res.: Ocean. 121, 4697–4715. doi: 10.1002/2016jc011800
Gao Y., Huang R. X., Zhu J., Huang Y. X., Hu J. Y. (2020a). Using the Sigma-Pi Diagram to Analyze Water Masses in the Northern South China Sea in Spring. J. Geophys. Res.: Ocean. 125, e2019JC01567. doi: 10.1029/2019JC015676
Gao Y., Wang L. F., Guo X. H., Xu Y., Luo L. (2020b). Atmospheric Wet and Dry Deposition of Dissolved Inorganic Nitrogen to the South China Sea. Sci. China Earth Sci. 63, 1339–1352. doi: 10.1007/s11430-019-9612-2
Guo M. X., Chai F., Xiu P., Li S. Y., Rao S. (2015). Impacts of Mesoscale Eddies in the South China Sea on Biogeochemical Cycles. Ocean. Dynam. 65, 1335–1352. doi: 10.1007/s10236-015-0867-1
He X. Q., Xu D. F., Bai Y., Pan D. L., Chen C. T. A., Chen X. Y., et al. (2016). Eddy-Entrained Pearl River Plume Into the Oligotrophic Basin of the South China Sea. Cont. Shelf. Res. 124, 117–124. doi: 10.1016/j.csr.2016.06.003
Hsieh Y. T., Geibert W., Woodward E. M. S., Wyatt N. J., Lohan M. C., Achterberg E. P., et al. (2021). Radium-228-Derived Ocean Mixing and Trace Element Inputs in the South Atlantic. Biogeosciences 18, 1645–1671. doi: 10.5194/bg-18-1645-2021
Hsin Y. C., Wu C. R., Chao S. Y. (2012). An Updated Examination of the Luzon Strait Transport. J. Geophys. Res.: Ocean. 117, C03022. doi: 10.1029/2011jc007714
Hu J., Kawamura H., Hong H., Qi Y. (2000). A Review on the Currents in the South China Sea: Seasonal Circulation, South China Sea Warm Current and Kuroshio Intrusion. J. Oceanogr. 56, 607–624. doi: 10.1023/A:1011117531252
Kawakami H., Kusakabe M. (2008). Surface Water Mixing Estimated From 228Ra and 226Ra in the Northwestern North Pacific. J. Environ. Radioact. 99, 1335–1340. doi: 10.1016/j.jenvrad.2008.04.011
Kwon H. K., Kim G., Han Y., Seo J., Lim W. A., Park J. W., et al. (2019). Tracing the Sources of Nutrients Fueling Dinoflagellate Red Tides Occurring Along the Coast of Korea Using Radium Isotopes. Sci. Rep. 9, 9. doi: 10.1038/s41598-019-51623-w
Letscher R. T., Primeau F., Moore J. K. (2016). Nutrient Budgets in the Subtropical Ocean Gyres Dominated by Lateral Transport. Nat. Geosci. 9, 815–819. doi: 10.1038/ngeo2812
Li Q. P., Dong Y., Wang Y. (2016). Phytoplankton Dynamics Driven by Vertical Nutrient Fluxes During the Spring Inter-Monsoon Period in the Northeastern South China Sea. Biogeosciences 13, 455–466. doi: 10.5194/bg-13-455-2016
Lin I. I., Lien C.-C., Wu C.-R., Wong G. T. F., Huang C.-W., Chiang T.-L. (2010). Enhanced Primary Production in the Oligotrophic South China Sea by Eddy Injection in Spring. Geophys. Res. Lett. 37, L16602. doi: 10.1029/2010gl043872
Liu J., Du J., Yu X. (2021a). Submarine Groundwater Discharge Enhances Primary Productivity in the Yellow Sea, China: Insight From the Separation of Fresh and Recirculated Components. Geosci. Front. 12, 101204. doi: 10.1016/j.gsf.2021.101204
Liu G.-S., Men W., Ji L.-H. (2010). Calculation of Vertical Mixing Rate Based on Radium Isotope Distributions in the Yellow Sea and East China Sea. Chin. J. Geophys. 53, 862–871. doi: 10.1002/cjg2.1556
Liu H. J., Xue B., Feng Y. Y., Zhang R., Chen M. R., Sun J. (2016). Size-Fractionated Chlorophyll a Biomass in the Northern South China Sea in Summer 2014. Chin. J. Oceanol. Limnol. 34, 672–682. doi: 10.1007/s00343-016-5017-1
Liu Z. Q., Zu T. T., Gan J. P. (2020). Dynamics of Cross-Shelf Water Exchanges Off Pearl River Estuary in Summer. Prog. Oceanogr. 189, 102465. doi: 10.1016/j.pocean.2020.102465
Li R., Xu J., Li X., Shi Z., Harrison P. J. (2017). Spatiotemporal Variability in Phosphorus Species in the Pearl River Estuary: Influence of the River Discharge. Sci. Rep. 7, 1–13. doi: 10.1038/s41598-017-13924-w
Li Q. P., Zhou W. W., Chen Y. C., Wu Z. C. (2018). Phytoplankton Response to a Plume Front in the Northern South China Sea. Biogeosciences 15, 2551–2563. doi: 10.5194/bg-15-2551-2018
Moore W. S. (1996). Large Groundwater Inputs to Coastal Waters Revealed by 226Ra Enrichments. Nat. Geosci. 380, 612–614. doi: 10.1038/380612a0
Moore W. S. (2000). Determining Coastal Mixing Rates Using Radium Isotopes. Cont. Shelf. Res. 20, 1993–2007. doi: 10.1016/S0278-4343(00)00054-6
Moore W. S. (2015). Inappropriate Attempts to Use Distributions of 228Ra and 226Ra in Coastal Waters to Model Mixing and Advection Rates. Cont. Shelf. Res. 105, 95–100. doi: 10.1016/j.csr.2015.05.014
Moore W., Reid D. (1973). Extraction of Radium From Natural Waters Using Manganese-Impregnated Acrylic Fibers. J. Geophys. Res. 78(36), 8880–8886. doi: 10.1029/JC078i036p08880
Moore W. S., Sarmiento J. L., Key R. (1986). Tracing the Amazon Component of Surface Atlantic Water Using 228Ra, Salinity and Silica. J. Geophys. Res.: Ocean. 91, 2574–2580. doi: 10.1029/JC091iC02p02574
Morimoto A., Yoshimoto K., Yanagi T. (2000). Characteristics of Sea Surface Circulation and Eddy Field in the South China Sea Revealed by Satellite Altimetric Data. J. Oceanogr. 56, 331–344. doi: 10.1023/A:1011159818531
Nan F., Xue H. J., Yu F. (2015). Kuroshio Intrusion Into the South China Sea: A Review. Prog. Oceanogr. 137, 314–333. doi: 10.1016/j.pocean.2014.05.012
Nozaki Y., Kasemsypaya V., Tsubota H. (1989). Mean Residence Time of the Shelf Water in the East China and the Yellow Seas Determined by 228Ra/226Ra Measurements. Geophys. Res. Lett. 16, 1297–1300. doi: 10.1029/GL016i011p01297
Oschlies A. (2002). Nutrient Supply to the Surface Waters of the North Atlantic: A Model Study. J. Geophys. Res.: Ocean. 107, 14–1-14-13. doi: 10.1029/2000JC000275
Sanial V., Kipp L. E., Henderson P. B., van Beek P., Reyss J. L., Hammond D. E., et al. (2018). Radium-228 as a Tracer of Dissolved Trace Element Inputs From the Peruvian Continental Margin. Mar. Chem. 201, 20–34. doi: 10.1016/j.marchem.2017.05.008
Shang X. D., Liang C. R., Chen G. Y. (2017). Spatial Distribution of Turbulent Mixing in the Upper Ocean of the South China Sea. Ocean. Sci. 13, 503–519. doi: 10.5194/os-13-503-2017
Shih Y. Y., Hung C. C., Tuo S. H., Shao H. J., Chow C. H., Muller F. L. L., et al. (2020). The Impact of Eddies on Nutrient Supply, Diatom Biomass and Carbon Export in the Northern South China Sea. Front. Earth Sc-Switz. 8. doi: 10.3389/feart.2020.537332
Su J. (2004). Overview of the South China Sea Circulation and its Influence on the Coastal Physical Oceanography Outside the Pearl River Estuary. Cont. Shelf. Res. 24, 1745–1760. doi: 10.1016/j.csr.2004.06.005
Su N., Du J., Liu S., Zhang J. (2013b). Nutrient Fluxes via Radium Isotopes From the Coast to Offshore and From the Seafloor to Upper Waters After the 2009 Spring Bloom in the Yellow Sea. Deep Sea Res. Part II 97, 33–42. doi: 10.1016/j.dsr2.2013.05.003
Su N., Du J., Li Y., Zhang J. (2013). Evaluation of Surface Water Mixing and Associated Nutrient Fluxes in the East China Sea Using 226Ra and 228Ra. Mar. Chem. 156, 108–119. doi: 10.1016/j.marchem.2013.04.009
Tan E., Wang G., Moore W. S., Li Q., Dai M. (2018). Shelf-Scale Submarine Groundwater Discharge in the Northern South China Sea and East China Sea and Its Geochemical Impacts. J. Geophys. Res.: Ocean. 123, 2997–3013. doi: 10.1029/2017jc013405
Tremblay J.-É., Raimbault P., Garcia N., Lansard B., Babin M., Gagnon J. (2014). Impact of River Discharge, Upwelling and Vertical Mixing on the Nutrient Loading and Productivity of the Canadian Beaufort Shelf. Biogeosciences 11, 4853–4868. doi: 10.5194/bg-11-4853-2014
Van Beek P., François R., Conte M., Reyss J.-L., Souhaut M., Charette M. (2007). 228Ra/226Ra and 226Ra/Ba Ratios to Track Barite Formation and Transport in the Water Column. Geochim. Cosmochim. Acta 71, 71–86. doi: 10.1016/j.gca.2006.07.041
Wang X. P., Du Y., Zhang Y. H., Wang A. M., Wang T. Y. (2021a). Influence of Two Eddy Pairs on High-Salinity Water Intrusion in the Northern South China Sea During Fall-Winter 2015/2016. J. Geophys. Res.: Ocean. 126(6), e2020JC016733. doi: 10.1029/2020JC016733
Wang Z., Ren J., Zhang R., Xu D., Wu Y. (2019). Physical and Biological Controls of Dissolved Manganese on the Northern Slope of the South China Sea. Deep Sea Res. Part II167, 25–33. doi: 10.1016/j.dsr2.2018.07.006
Wang G. Z., Sun S. Y., Tan E. H., Chen L. W., Wang L. F., Huang T., et al. (2021b). A Strong Summer Intrusion of the Kuroshio and Residence Time in the Northern South China Sea Revealed by Radium Isotopes. Prog. Oceanogr. 197, 102619. doi: 10.1016/j.pocean.2021.102619
Wang X., Zhang Y., Luo M., Xiao K., Wang Q., Tian Y., et al. (2021c). Radium and Nitrogen Isotopes Tracing Fluxes and Sources of Submarine Groundwater Discharge Driven Nitrate in an Urbanized Coastal Area. Sci. Total. Environ. 763, 144616. doi: 10.1016/j.scitotenv.2020.144616
Wu J., Lao Q., Chen F., Huang C., Zhang S., Wang C., et al. (2021). Water Mass Processes Between the South China Sea and the Western Pacific Through the Luzon Strait: Insights From Hydrogen and Oxygen Isotopes. J. Geophys. Res.: Ocean. 126, e2021JC017484. doi: 10.1016/j.marpolbul.2018.01.019
Wu N., Liu S. M., Zhang G. L., Zhang H. M. (2021). Anthropogenic Impacts on Nutrient Variability in the Lower Yellow River. Sci. Total. Environ. 755, 142488. doi: 10.1016/j.scitotenv.2020.142488
Wu Y., Zhang J., Liu S., Jiang Z., Huang X. (2018). Aerosol Concentrations and Atmospheric Dry Deposition Fluxes of Nutrients Over Daya Bay, South China Sea.. Mar. Pollut. Bull. 128, 106–114. doi: 10.1016/j.marpolbul.2018.01.019
Xue H. J., Chai F., Pettigrew N., Xu D. Y., Shi M., Xu J. P. (2004). Kuroshio Intrusion and the Circulation in the South China Sea. J. Geophys. Res.: Ocean. 109, C02017. doi: 10.1029/2002jc001724
Yang Y. K., Wang D. X., Wang Q., Zeng L. L., Xing T., He Y. K., et al. (2019). Eddy-Induced Transport of Saline Kuroshio Water Into the Northern South China Sea. J. Geophys. Res.: Ocean. 124, 6673–6687. doi: 10.1029/2018jc014847
Yu Z. T., Metzger E. J., Fan Y. L. (2021). Generation Mechanism of the Counter-Wind South China Sea Warm Current in Winter. Ocean. Model. Online 167, 101875. doi: 10.1016/j.ocemod.2021.101875
Yu X. L., Wang F., Wan X. Q. (2013). Index of Kuroshio Penetrating the Luzon Strait and Its Preliminary Application. Acta Oceanolog. Sin. 32, 1–11. doi: 10.1007/s13131-013-0262-z
Zeng L., Wang Q., Xie Q., Shi P., Yang L., Shu Y., et al. (2015). Hydrographic Field Investigations in the Northern South China Sea by Open Cruises During 2004–2013. Sci. Bull. 60, 607–615. doi: 10.1007/s11434-015-0733-z
Zhang M., Wu Y., Qi L. J., Xu M. Q., Yang C. H., Wang X. L. (2019a). Impact of the Migration Behavior of Mesopelagic Fishes on the Compositions of Dissolved and Particulate Organic Carbon on the Northern Slope of the South China Sea. Deep Sea Res. Part II 167, 46–54. doi: 10.1016/j.dsr2.2019.06.012
Zhang M., Wu Y., Wang F. Q., Xu D. F., Liu S. M., Zhou M. (2020). Hotspot of Organic Carbon Export Driven by Mesoscale Eddies in the Slope Region of the Northern South China Sea. Front. Mar. Sci. 7. doi: 10.3389/fmars.2020.00444
Zhang R. F., Zhu X. C., Yang C. H., Ye L. P., Zhang G. L., Ren J. L., et al. (2019b). Distribution of Dissolved Iron in the Pearl River (Zhujiang) Estuary and the Northern Continental Slope of the South China Sea. Deep Sea Res. Part II 167, 14–24. doi: 10.1016/j.dsr2.2018.12.006
Keywords: radium, water mixing, nutrient fluxes, northern South China Sea (NSCS), Kuroshio
Citation: Liu J, Du J, Wu Y and Liu S (2022) Radium-Derived Water Mixing and Associated Nutrient in the Northern South China Sea. Front. Mar. Sci. 9:874547. doi: 10.3389/fmars.2022.874547
Received: 12 February 2022; Accepted: 28 March 2022;
Published: 28 April 2022.
Edited by:
Hiroaki Saito, The University of Tokyo, JapanReviewed by:
Kazuhiro Norisuye, Niigata University, JapanFajin Chen, Guangdong Ocean University, China
Copyright © 2022 Liu, Du, Wu and Liu. This is an open-access article distributed under the terms of the Creative Commons Attribution License (CC BY). The use, distribution or reproduction in other forums is permitted, provided the original author(s) and the copyright owner(s) are credited and that the original publication in this journal is cited, in accordance with accepted academic practice. No use, distribution or reproduction is permitted which does not comply with these terms.
*Correspondence: Jinzhou Du, anpkdUBza2xlYy5lY251LmVkdS5jbg==
 Jianan Liu
 Jinzhou Du
 Ying Wu
 Sumei Liu