 Takahito Horikawa1
 Daiki Nomura
 Naoya Kanna
 Shin Sugiyama
94% of researchers rate our articles as excellent or good
Learn more about the work of our research integrity team to safeguard the quality of each article we publish.
Find out more
ORIGINAL RESEARCH article
Front. Mar. Sci. , 22 July 2022
Sec. Marine Biogeochemistry
Volume 9 - 2022 | https://doi.org/10.3389/fmars.2022.873860
To understand the effects of the glacial meltwater supply on carbonate chemistry and the air–sea CO2 flux within the fjord, water samples were collected in Bowdoin Fjord in northwestern Greenland for dissolved inorganic carbon (DIC) concentration, total alkalinity (TA), oxygen isotopic ratio (δ18O), and chlorophyll a concentration analyses in the summers of 2016 and 2017. The partial pressure of CO2 (pCO2) in surface water, calculated from DIC and TA, was less than 200 µatm, and was significantly lower than that in the atmosphere (399 ± 3 µatm). Therefore, surface water of the fjord acts as sink for CO2 in the atmosphere (–4.9 ± 0.7 mmol m–2 d–1). To evaluate the effects of freshwater and land-derived substances by glacial meltwater on pCO2 in the fjord, we calculated the changes of pCO2 in salinity and carbonate chemistry that would result from the inflow of glacial meltwater into the fjord. The calculated pCO2 was high near the calving front, where the contribution of glacier meltwater was significant. Examination of the relationship between salinity-normalized DIC and TA, which was considered DIC and TA input from the land, suggested that the land-derived high pCO2 freshwater affected mainly by the remineralization of the organic matter by bacterial activity was supplied to the Bowdoin Fjord.
At present, the carbon dioxide (CO2) concentration in the Earth’s atmosphere is increasing, and both the atmosphere and the ocean are warming. The Arctic Ocean accounts for about 5–14% of the global ocean CO2 absorption from the atmosphere (Bates and Mathis, 2009). Although the carbon dynamics in basin areas of the Arctic have been well studied (e.g., Bates and Mathis, 2009; Gao et al., 2012), few studies have focused on high-latitude coastal areas such as the Greenland coastal fjord area. When melting occurs in summer, a large amount of meltwater from the Greenland ice sheet and peripheral glaciers flows into fjords around Greenland (Chu, 2014). This glacial meltwater is freshwater, which has a significant impact on physical, chemical, and biological processes in fjord seawater (e.g., Meire et al., 2015; Arrigo et al., 2017). Currently, meltwater is increasing in Greenland under the influence of enhanced warming in the Arctic (Carr et al., 2017; Nienow et al., 2017). Therefore, it is important to increase our understanding of the effects of glacial meltwater on carbon dynamics in seawater.
The dissolved inorganic carbon concentration (DIC) represents the sum of dissolved CO2 and carbonic acid substances in the ocean, and total alkalinity (TA) is an indicator of the form in which CO2 exists in seawater. Glacial meltwater reduces the concentrations of these marine carbonate chemistry components through dilution. As a result, the partial pressure of CO2 (pCO2) in seawater, which is determined by DIC and TA, is decreased and the ocean can more easily absorb CO2 from the atmosphere. For example, (Meire et al. 2015; 2017) reported that in Godthåbsfjord, southwestern Greenland, surface water pCO2 is reduced by the supply of glacial meltwater. Moreover, Seifert et al. (2019) showed that waters in the inner part of Nordvestfjord (Scoresby Sound, eastern Greenland), which are more affected by glacial meltwater, have higher biological productivity and higher carbon fixation capacity than waters at the fjord entrance.
If glacial meltwater consisted of pure freshwater (without impurities), then the supply of glacial meltwater to the ocean would simply dilute DIC and TA; however, actual meltwaters flowing into the ocean are turbid, owing to the presence of suspended terrestrial materials. For example, St Pierre et al. (2019) showed that when land-derived minerals (carbonates and silicates) are dissolved in glacial meltwater, CO2 in the water is consumed, with the result that pCO2 is decreased. Similarly, Sejr et al. (2011) showed that in summer, pCO2 is reduced in Young Sound, northeastern Greenland, as a result of carbonate dissolution and strong stratification caused by the supply of glacial and sea ice melt to the fjord. Furthermore, Fransson et al. (2015) observed calcite and dolomite crystals in glacial ice on Spitsbergen, Svalbard archipelago, and suggested that carbonate-rich glacial meltwater is supplied to the fjords there. Glacial meltwater flowing into fjord also contains organic particles (Kanna et al., 2018). When these organic particles are remineralized by bacterial activity (respiration), pCO2 increases (Zeebe and Wolf-Gladrow, 2001). Therefore, understanding inorganic carbon dynamics in such coastal fjord waters requires consideration of not only the dilution effect of glacial meltwater but also its effect on CO2 by biogeochemical processes.
Glacial meltwater not only reduces pCO2 through dilution but also through its effect on primary production in the surface ocean, because the meltwater supplies nutrients in terrestrial materials to the ocean (e.g., Meire et al., 2017; Kanna et al., 2018; Kanna et al., 2020). Meire et al. (2017) reported that in Godthåbsfjord, southwestern Greenland, where glacial meltwater is released from the glacier bed to the bottom of the ocean, the resulting upwelling carries deep seawater rich in nutrients to the surface. As a result, phytoplankton productivity is increased and pCO2 in the surface layer is reduced. In addition, Arrigo et al. (2017) showed that the release of large amounts of meltwater from the Greenland ice sheet in summer supplies abundant nutrients not only to waters of local fjords but also to the open ocean, where they increase phytoplankton production. As a result, open ocean areas near Greenland also act as a sink for atmospheric CO2 in summer.
The target area of our study was Bowdoin Fjord, northwestern Greenland, which is usually covered by sea ice during June; in early July the ice begins to melt, and it disappears by the end of July (Sugiyama et al., 2015; Kanna et al., 2018; Sugiyama et al., 2021). Waters of both Arctic and Atlantic origin are distributed in the fjord, and glacial and sea ice meltwaters also flow into the fjord (Ohashi et al., 2020). Two glaciers terminate near the innermost part of Bowdoin Fjord; Bowdoin Glacier is a marine-terminating outlet glacier, and Tugto Glacier is a land-terminating glacier (Figure 1). Meltwater from Bowdoin Glacier is released from the glacier bed to the bottom of the fjord. As a result, an extremely turbid plume can be observed in the surface layer near the glacier where the meltwater containing land-derived sediments upwells (Kanna et al., 2018). This upwelling brings deep ocean nutrients and glacier-derived iron-rich water to the surface, causing the activity of phytoplankton, zooplankton, and seabirds to be increased in the plume compared with that in nearby waters (Kanna et al., 2018; Naito et al., 2019; Nishizawa et al., 2019; Kanna et al., 2020). In contrast, meltwater from Tugto Glacier reaches the ocean via proglacial streams such that the meltwater and the land-derived sediments are discharged directly into the surface ocean. Thus, rather than being pure freshwater, glacial meltwaters in Bowdoin Fjord are turbid. The presence of dissolved terrestrial minerals (carbonates and silicates) and organic matter in the meltwater complicate the CO2 dynamics in the fjord. Furthermore, because the pCO2 in surface water is one of the important parameters that determine the amount of CO2 that is exchanged between the atmosphere and ocean, it is important to evaluate how freshwater dilution, terrestrial materials, and biological production affect the pCO2 dynamics of fjord waters.
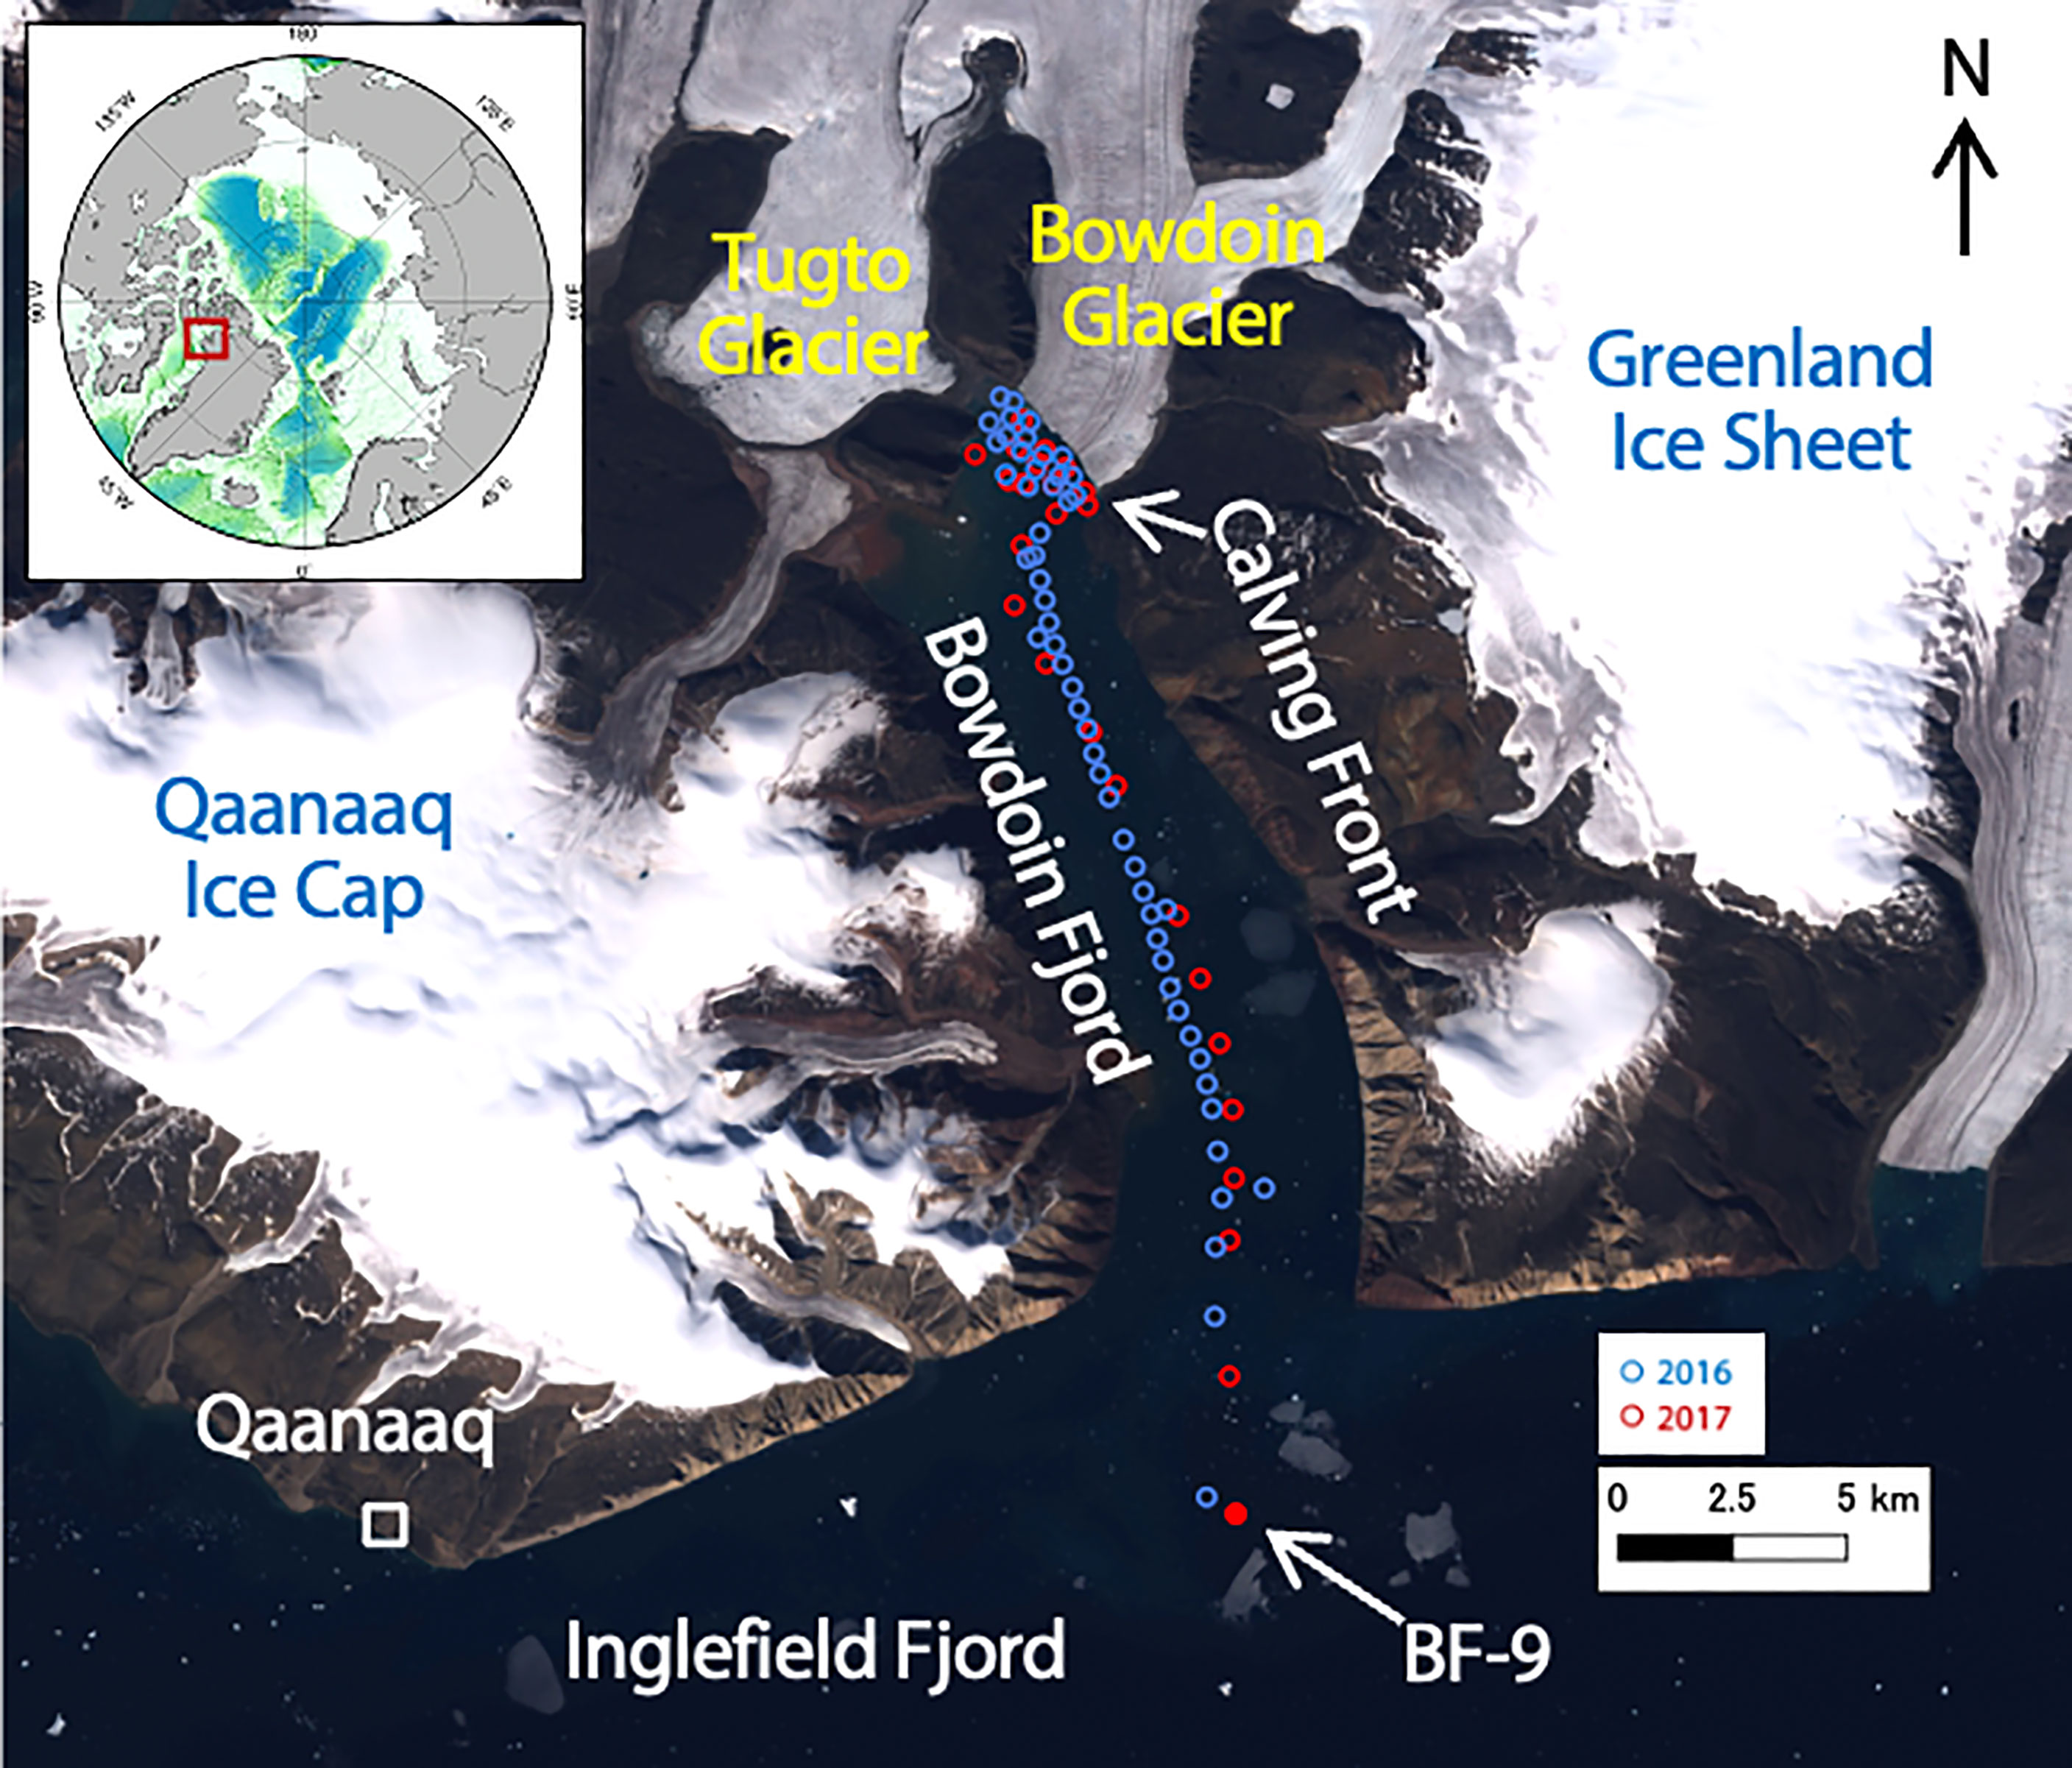
Figure 1 Sampling points in Bowdoin Fjord in northwestern Greenland. The Landsat image used for this figure was acquired on 30 July 2016. Blue and red dots indicate sampling points in 2016 and 2017, respectively.
The purpose of this study was to clarify the relationship between the inflow of glacial meltwater and the marine carbonate chemistry in Bowdoin Fjord, especially in surface waters, by analyses of salinity, temperature, DIC, TA, stable oxygen isotope ratios (δ18O), chlorophyll a concentrations (chl.a), and pCO2. To this end, we (1) evaluated the relationships between salinity and DIC, TA, and pCO2, (2) clarified the water mass structure of the ocean surface, and (3) evaluated the pCO2 dynamics of the surface water, based on the relationship between DIC and TA and the effects of the dissolution of mineral particles, the remineralization by bacterial activity, and primary production. We expect the results of these analyses to facilitate prediction of future changes in the carbonate chemistry of the fjord, and thus the amount of CO2 absorbed from the atmosphere, as a result of accelerated melting of the Greenland ice sheet and glaciers.
Field observations were conducted on Bowdoin Glacier and in Bowdoin Fjord between the 7th and 29th of July in 2016 and between the 24th of July and the 1st of August in 2017 (Figure 1). Bowdoin Glacier (Kangerluarsuup Sermia in Greenlandic; Bjørk et al., 2015) is a marine-terminating outlet glacier in northwestern Greenland that discharges freshwater into Bowdoin Fjord along a 3-km-wide calving front. The ice thickness is approximately 250–400 m within 6 km of the terminus, and 86–89% of the entire ice thickness at the terminus is situated below sea level (Sugiyama et al., 2015). The glacier terminus is grounded (Sugiyama et al., 2015); hence, it is not likely to have a floating tongue. Tugto Glacier, a 4-km-wide land-terminating glacier, is several kilometers west of Bowdoin Glacier (Tsutaki et al., 2016), and its proglacial stream discharges freshwater into the fjord. Bowdoin Fjord is approximately 20 km long and is typically covered by sea ice from around October until early July. During our study period, a persistent patch of sediment-rich water was observed on the fjord surface in front of Bowdoin Glacier. We interpreted this patch to be a plume of turbid water that visibly rises toward the fjord surface near the calving front of the glacier. This highly turbid patch is maintained free of sea ice by the upwelling subglacial discharge (Kanna et al., 2018; Podolskiy et al., 2021). In the summers of 2016 and 2017, sea ice began retreating from the fjord in mid-July and had disappeared by the end of July.
We sampled surface fjord water and collected hydrographic data from a 5-m-long boat from within 1 km of the calving front of Bowdoin Glacier to the outer part of Bowdoin Fjord (Figure 1). Sampling point coordinates, time (UTC), and tide information are available in the supporting information as Dataset S1. A conductivity-temperature-depth (CTD) profiler (model ASTD 102, JFE Advantech, Japan) mounted on a pole and suspended from the side of the boat was used to perform continuous measurements of temperature and salinity in the surface waters (0.3 m depth). We took water samples as short a time as possible (generally within 4 hours) to avoid the diurnal variation.
Additionally, surface water samples were collected at 0.3 m depth from the boat into (1) a 120-mL crimp top septum glass bottle (Maruemu Co., Ltd., Osaka, Japan) for measurement of DIC and TA, (2) a 15-mL glass screw-cap vial (Nichiden-Rika Glass Co., Ltd, Kobe, Japan) for measurement of δ18O, (3) a 250-mL glass bottle (Rigo Co., Ltd., Tokyo, Japan) for measurement of salinity, and (4) a 2-L high-density polyethylene bottle (AS ONE, Japan) for measurement of chl.a. Surface water samples were also collected from the plume near the glacier front by using a fishing rod and string to lower 500-mL polycarbonate bottles into the water (Kanna et al., 2018), and, subsampled into each bottle. Immediately after subsampling for DIC and TA, a 6.0% (wt.) mercuric chloride (HgCl2) solution (100 μL) was added to the samples for DIC and TA to stop biological activity.
Vertical fjord water sampling and hydrographic data collection were also conducted at St. BF-9 (68.465°N, 77.468°W) (Figure 1). The same CTD profiler used for the deep measurement was hung from a Kevlar rope and lowered into the water to measure the water properties every 1 s (~1-m intervals). Fjord water was also sampled at 300 m depth with a Niskin sampler (model 1010, General Oceanics, Inc., USA) equipped with messengers to close the sampler bottles and suspended on a Kevlar rope.
Samples for the DIC, TA, salinity, and δ18O analyses were stored at room temperature in the dark until analysis. Samples for chl.a measurements were immediately filtered through a 25-mm-diameter Whatman GF/F filter. Chlorophyll pigment on the filters was then extracted with N,N-dimethylformamide (Suzuki and Ishimaru, 1990) for more than 24 h, and the extract was stored between –15 and –20°C until analysis.
Seawater DIC was determined by coulometry (Johnson et al., 1985, Johnson et al., 1992) using a hand-made CO2 extraction system (Ono et al., 1998) and a coulometer (CM5012, UIC, Inc., Binghamton, NY, USA). TA of seawater was determined by titration (Dickson et al., 2007) with a TA analyzer (ATT-05, Kimoto Electric Co., Ltd., Japan). Both DIC and TA measurements were calibrated against reference seawater materials (Batch AO and AP; KANSO Technos Co., Ltd., Osaka, Japan) traceable to the certified reference material distributed by Prof. A. G. Dickson (Scripps Institution of Oceanography, La Jolla, CA, USA). The standard deviations of the DIC and TA measurements, calculated from the results for 10 subsamples of the reference water with DIC = 1987.1 µmol kg–1 and TA = 2257.6 µmol kg–1, were <2.0 µmol kg–1 and 2.0 µmol kg–1, respectively. The seawater pCO2 was computed from DIC and TA using the program CO2SYS, version 02.05 (Orr et al., 2018). For this calculation, we used the carbonic acid dissociation constants (K1 and K2) of Mehrbach et al. (1973) as revised by Dickson and Millero (1987) and the KHSO4 value determined by Dickson (1990).
The seawater salinity was determined with a salinometer (AUTOSAL 8400B, Guildline Instruments, USA). The instrumental accuracy < 0.002 psu. The seawater δ18O was determined with a mass spectrometer (DELTA plus, Finnigan MAT, San Jose, CA, USA) by the equilibration method. The δ18O in permil (‰) was calculated using the 18O:16O ratio of standard mean ocean water (SMOW) as the standard. The standard deviation of δ18O, calculated from 10 subsamples of reference water with a δ18O = +0.241‰, was 0.026‰.
Chl.a was determined with a fluorometer (Model 10AU, Turner Designs, Inc., Sunnyvale, CA, USA) by the method of Parsons et al. (1984). Standards (0–150 µg L–1 chl.a) prepared from a liquid chl.a standard (Wako Pure Chemical Industries, Ltd., Osaka, Japan) by stepwise dilution with N,N-dimethylformamide were used to calibrate the fluorometer before chl.a measurement.
The sea−air CO2 flux was calculated as,
Fsea−air = k • α • ΔpCO2 (1)
where k is gas transfer velocity (Wanninkhof et al., 2013), α is CO2 solubility (Weiss, 1974), and ΔpCO2 is the difference in pCO2 between the sea surface and the atmosphere. A negative flux indicates absorption of atmospheric CO2 by the ocean. The gas transfer velocity was computed by using the mean (± standard deviation) wind speed (= 2.9 ± 2.1 m s–1) during the observed month recorded at Qaanaaq weather station (https://www.timeanddate.com/weather/Greenland/qaanaaq/historic). Atmospheric pCO2 (399 ± 3 µatm) was calculated by using the atmospheric CO2 concentration (= 402 ± 3 ppm) measured at Summit, Greenland (https://www.esrl.noaa.gov/gmd/dv/iadv/), the barometric pressure, and saturated water vapor pressure (Weiss and Price, 1980).
The waters in Bowdoin Fjord were composed mainly of glacial and sea ice meltwaters and Arctic water (Kanna et al., 2018), hereafter referred to as polar water. We calculated the distributions of these three components in Bowdoin Fjord using the following equations (Østlund and Hut, 1984).
Fgm + Fsim + Fpw = 1 (2)
Fgm • Sgm + Fsim • Ssim + Fpw • Spw = Sobs (3)
Fgm • δgm + Fsim • δsim + Fpw • δpw = δobs (4)
F represents the fraction of each component in the fjord, and S and δ represent salinity and δ18O, respectively. The subscripts “gm”, “sim”, “pw”, and “obs” represent glacial meltwater, sea ice meltwater, polar water, and observed values. The endmember values of each component are from Kanna et al. (2018). Figure 2 shows the relationship between salinity and δ18O for all samples collected in the fjord and endmember values of each component.
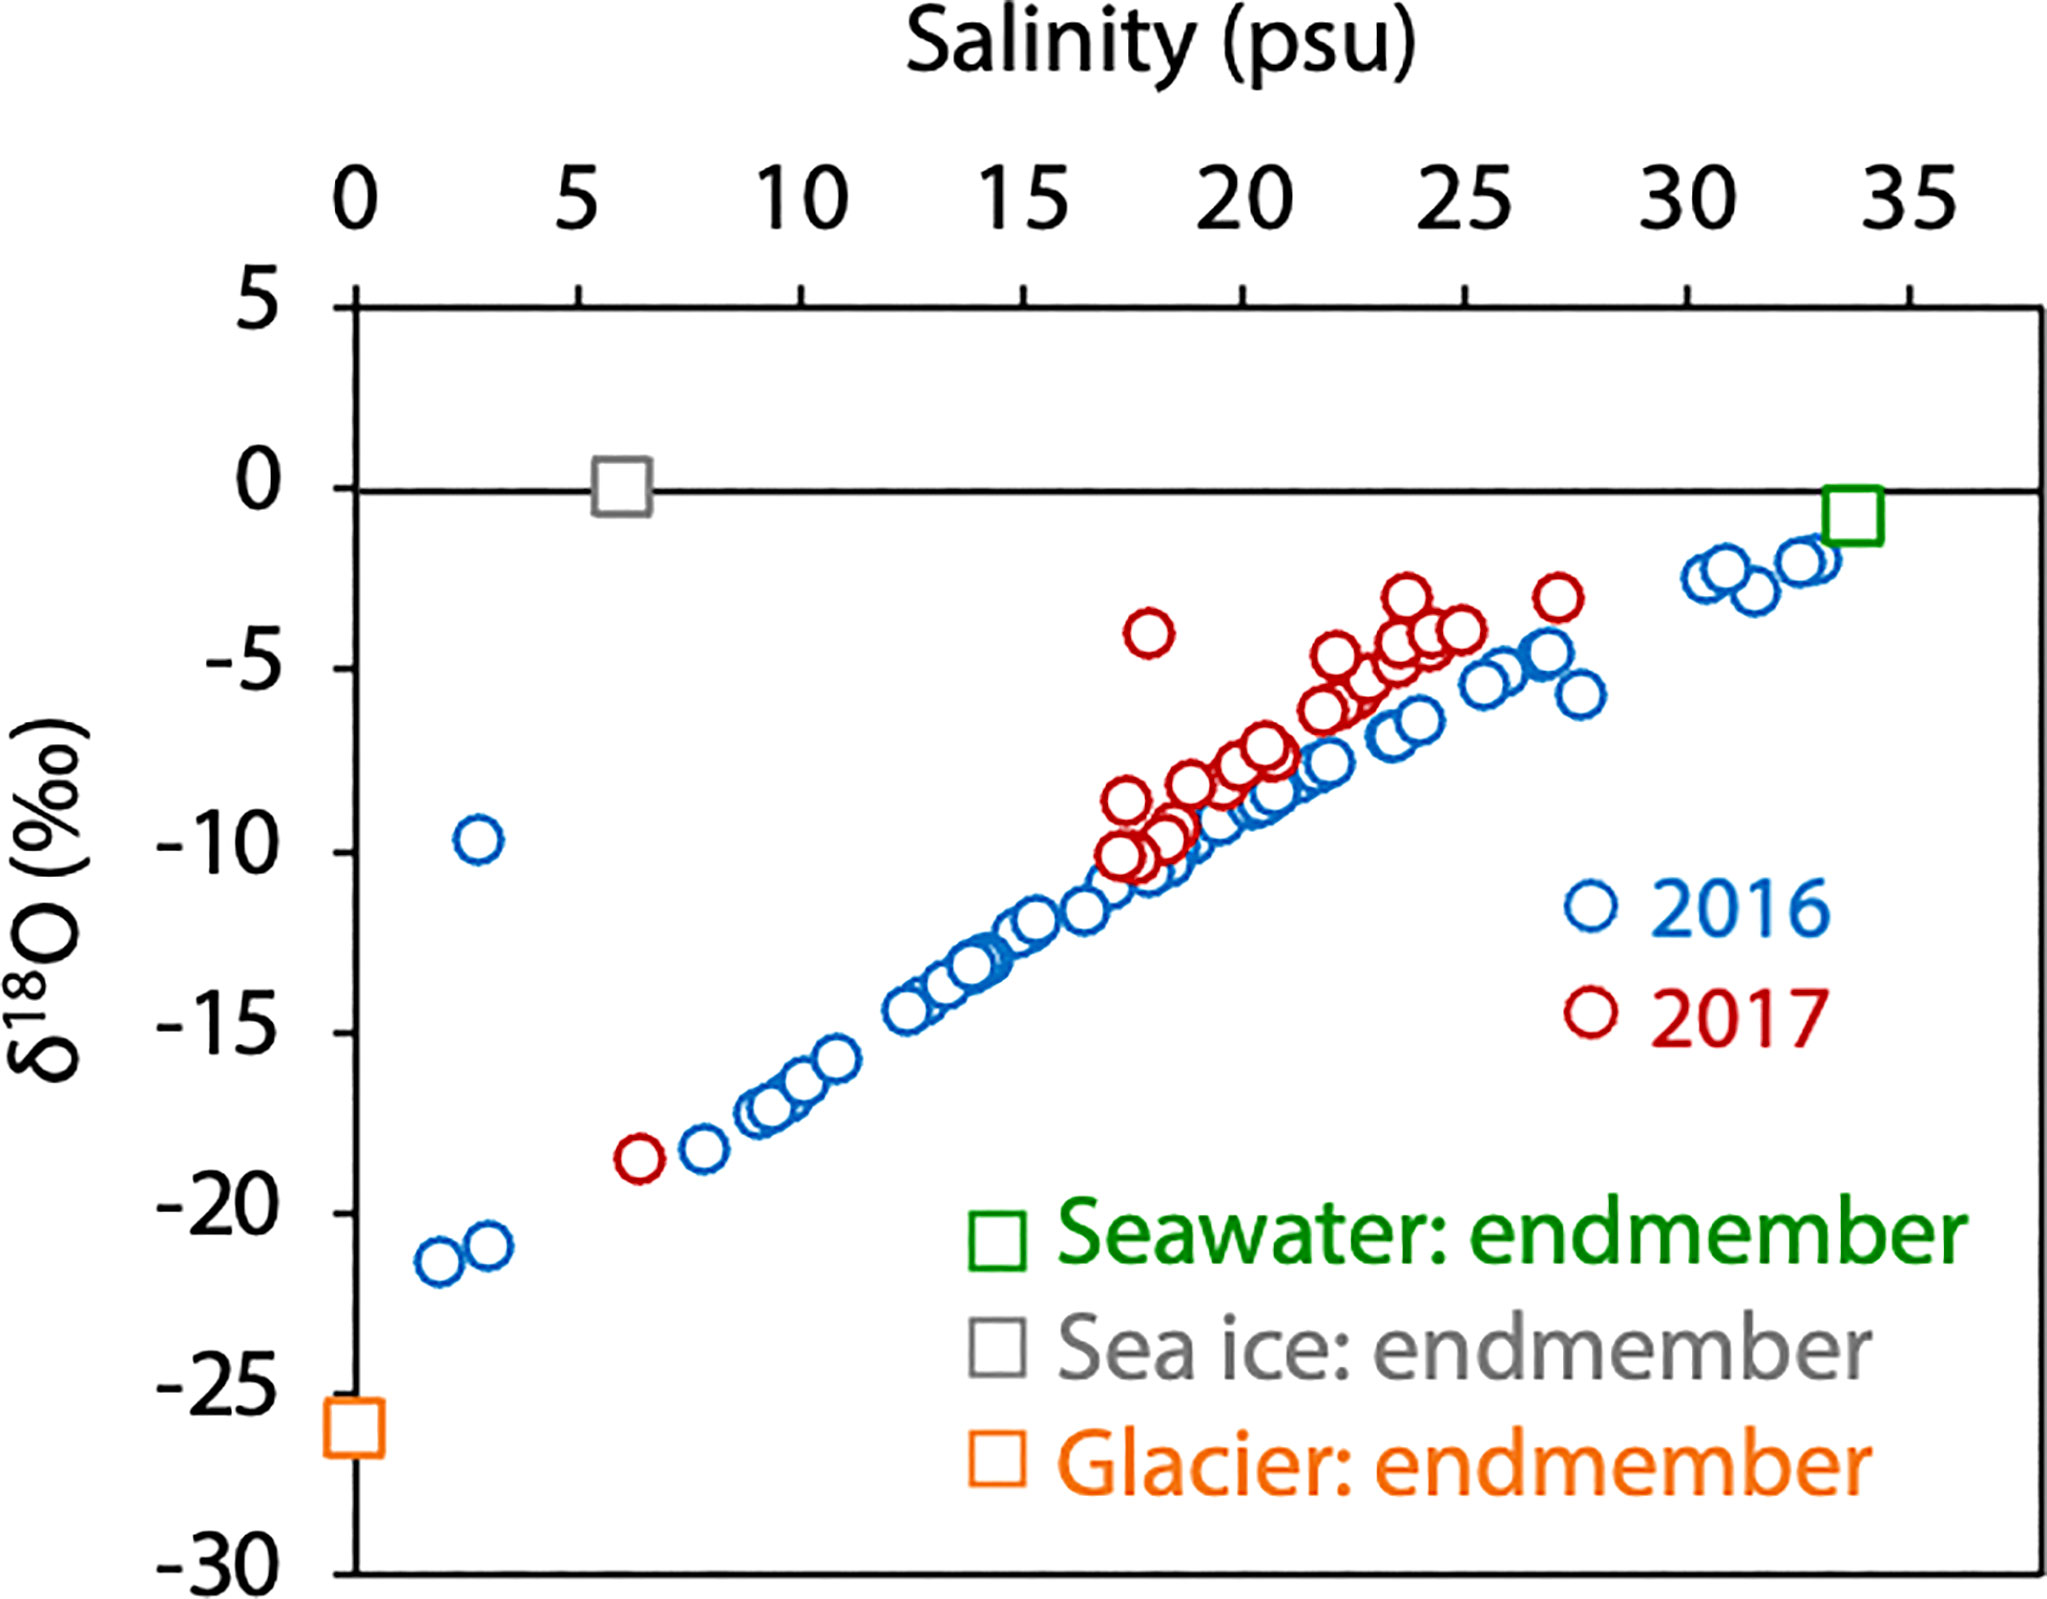
Figure 2 Relationship between δ18O and salinity for surface water and each endmember.
We examined the distributions of salinity, temperature, DIC, TA, pCO2, chl.a, and δ18O in the surface water relative to distance from the calving front of Bowdoin Glacier (Figure 3). Except in the plume, salinity near the calving front of Bowdoin Glacier was as low as 3.0 psu, (Figure 3A), and it increased with distance from the glacier to a maximum of 30.5 psu. Temperature showed no relationship with distance from Bowdoin Glacier; the minimum temperature was about +3°C, and the maximum was about +6°C (Figure 3B). The distributions of DIC and TA were similar to that of salinity; values were low near Bowdoin Glacier and increased with distance from the glacier (Figures 3C, D). pCO2 calculated from DIC and TA was 200 µatm or less at all sampling points except in the plume, where it was substantially lower than the atmospheric value of 399 ± 3 µatm (Figure 3E). Chl.a was usually low near the calving front of Bowdoin Glacier, but it was locally markedly high (8.0 µg L–1) (Figure 3F). Furthermore, chl.a was as high as 3.7 µg L–1 even at a distance of 12–15 km from the glacier. The distribution of δ18O was similar to that of salinity, with a maximum of –2.0‰ and a minimum of –21.4‰ (Figure 3G). In the plume, salinity, DIC, TA, pCO2, and δ18O were high relative to their values at sampling points outside of the plume. The sea−air CO2 flux calculated with Equation 1 was negative everywhere (CO2 sink for atmosphere); it ranged from –6.5 to –2.1 mmol m–2 d–1, and the mean ± standard deviation was –4.9 ± 0.7 mmol m–2 d–1.
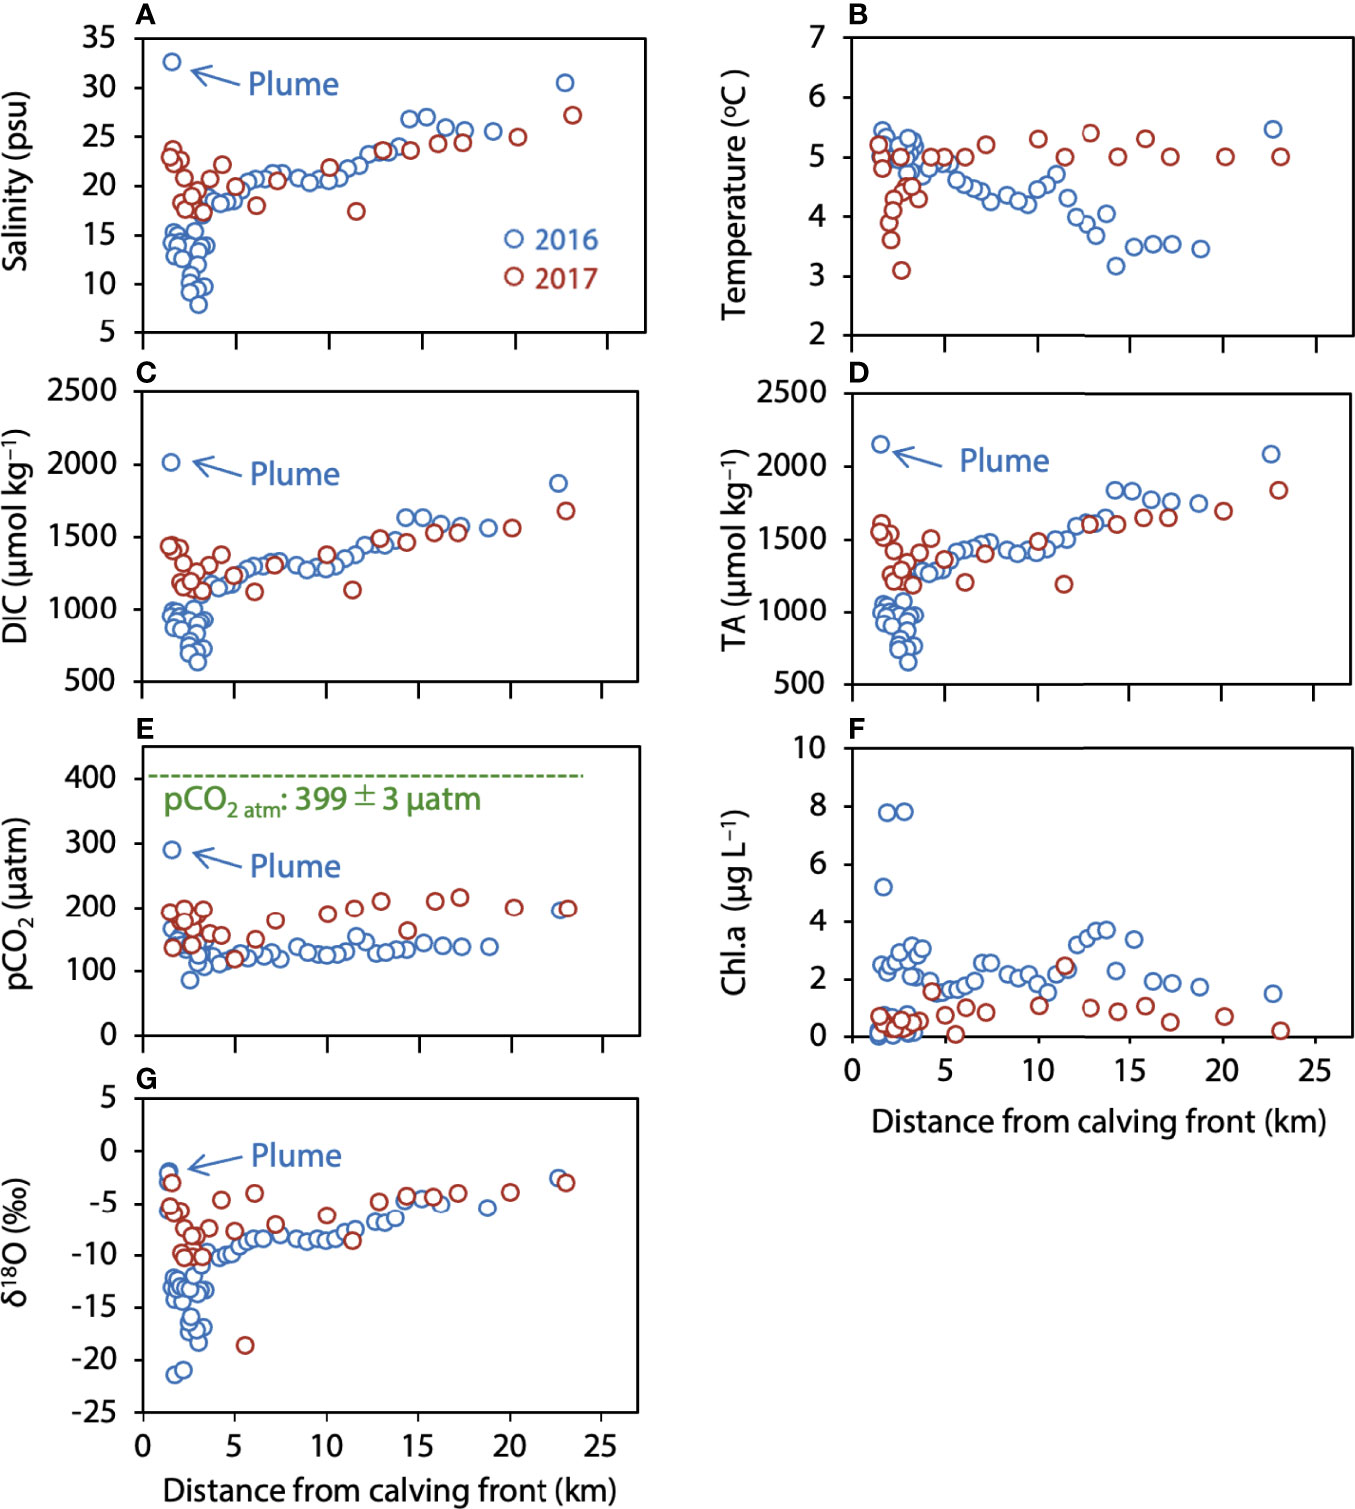
Figure 3 Distribution of (A) salinity, (B) temperature, (C) DIC, (D) TA, (E) pCO2, (F) chl.a, and (G) δ18O in surface water in relation to distance from the calving front.
Both DIC and TA showed strong linear relationships with salinity (S): Regression line equations were DIC = 54.9S + 167.5 (r² = 0.99) in both 2016 and 2017, DIC = 54.2S + 174.9 (r² = 0.99) in 2016, DIC = 55.3S + 166.8 (r2 = 0.99) in 2017, and TA = 63.7S + 105.0 (r2 = 0.99) in both 2016 and 2017, TA = 64.1S + 102.9 (r2 = 0.99) in 2016, and TA = 64.8S + 69.1 (r2 = 0.99) in 2017 (Figures 4A, B).
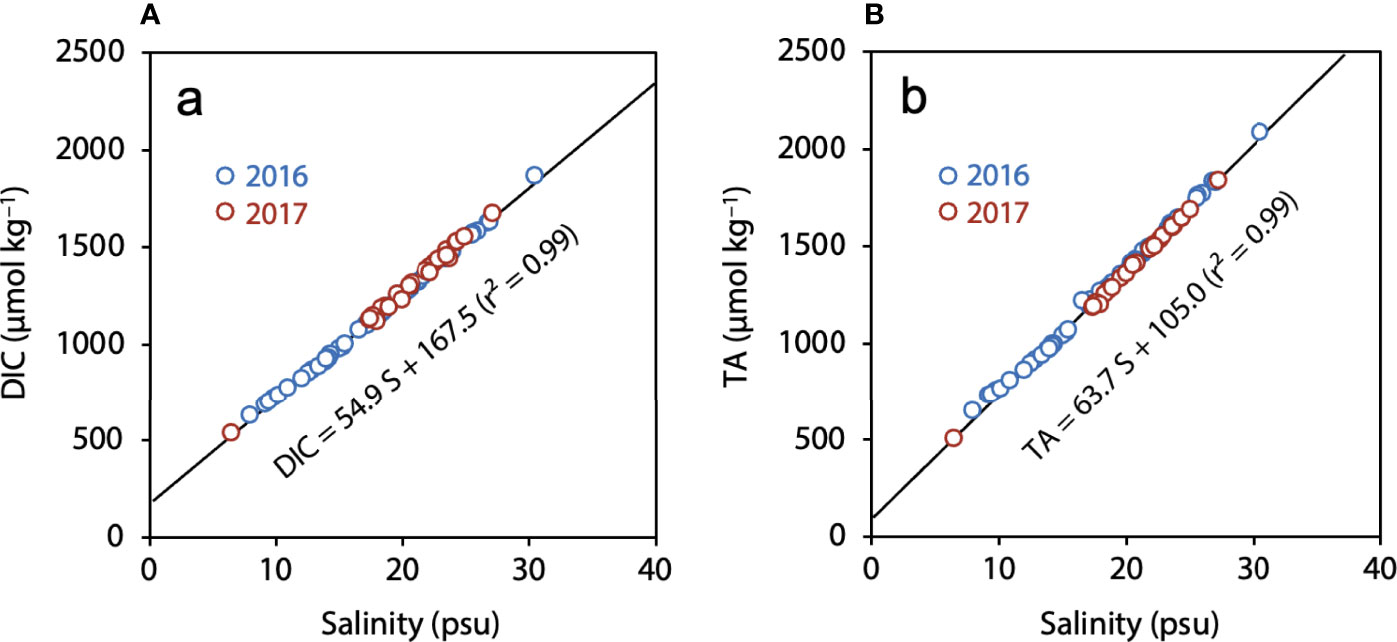
Figure 4 Relationships between (A) DIC, (B) TA and salinity.
Figure 5 shows the distribution of the fraction for each component. In Bowdoin Fjord, Fgm was highest, up to 94%, near the calving front of Bowdoin Glacier and decreased with distance from the glacier, whereas Fpw increased with distance from the glacier. Fsim was low, generally less than 10%, although it reached 14.2% at one point.
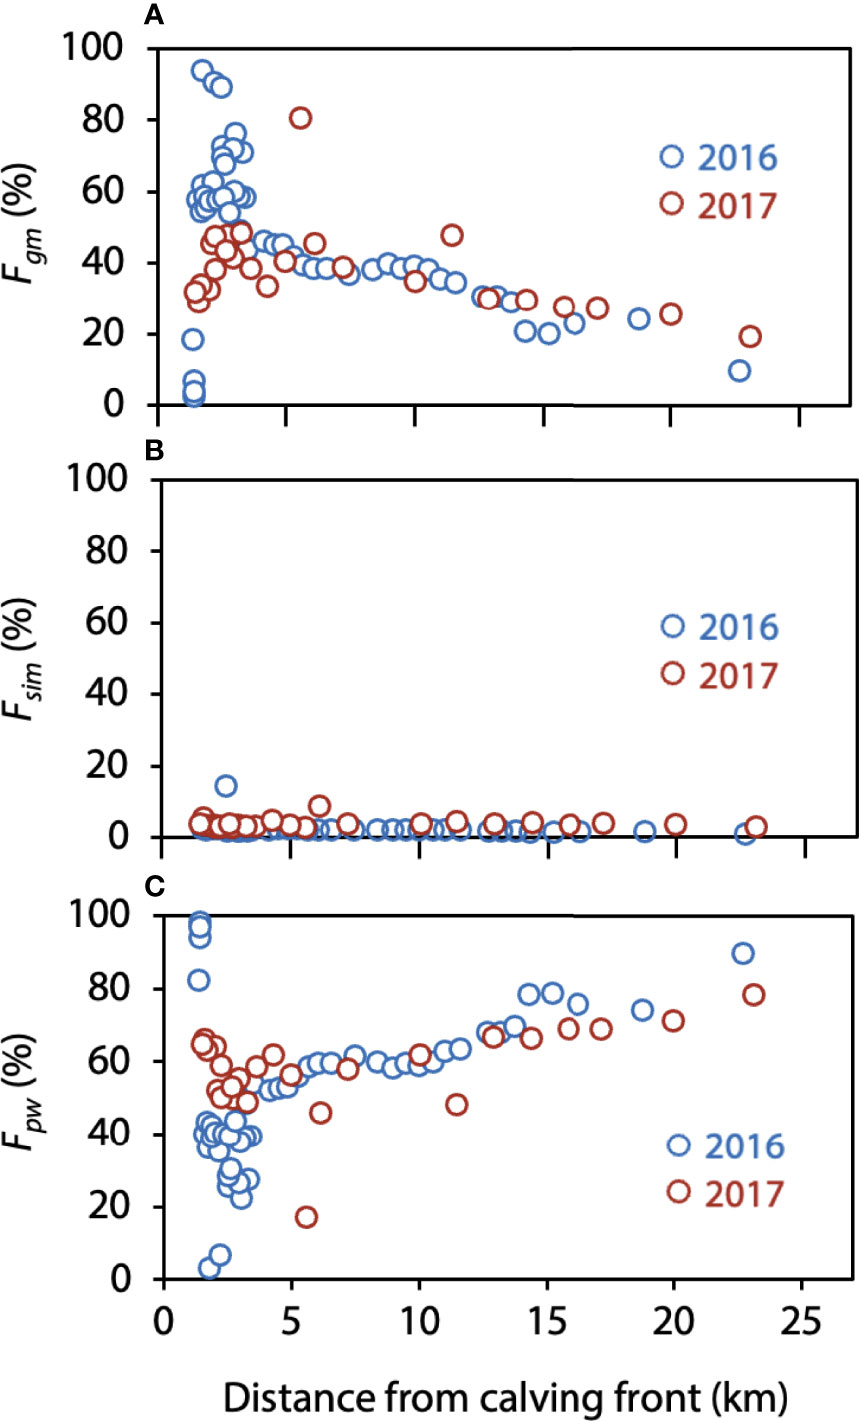
Figure 5 Distributions of the (A) glacial meltwater fraction (Fgm), (B) sea ice meltwater fraction (Fsim), and (C) polar water fraction (Fpw) in relation to the calving front.
The inflow of glacial meltwater was greater closer to the calving front of Bowdoin Glacier (Figures 3, 5). As a result, the salinity of the seawater was decreased close to the front (Figure 3A), and DIC and TA were decreased (Figures 3C, D), by the input of glacial meltwater although glacial meltwater contained DIC and TA because DIC-salinity and TA-salinity plots exhibit remarkable intercepts at zero salinity (Figures 4A, B).
Here, to evaluate the potential effect in pCO2 caused by the decrease in salinity resulting from the input of the freshwater from the melting glacier, the relationship between observed pCO2 (pCO2 obs) and salinity was indicated in Figure 6. pCO2 obs decreased as the salinity decreased. However, when salinity was low (e.g., S < 10 psu), there was limited pCO2 obs plots (data) (Figure 6) because it was difficult to obtain low salinity samples near the calving front due to dangerous and logistical reasons. In addition, glacier meltwater from Bowdoin Glacier is released from the glacier bed to the bottom of the fjord (Kanna et al., 2018). Therefore, technically, it was difficult to obtain samples to show the pCO2 obs for low salinity water.
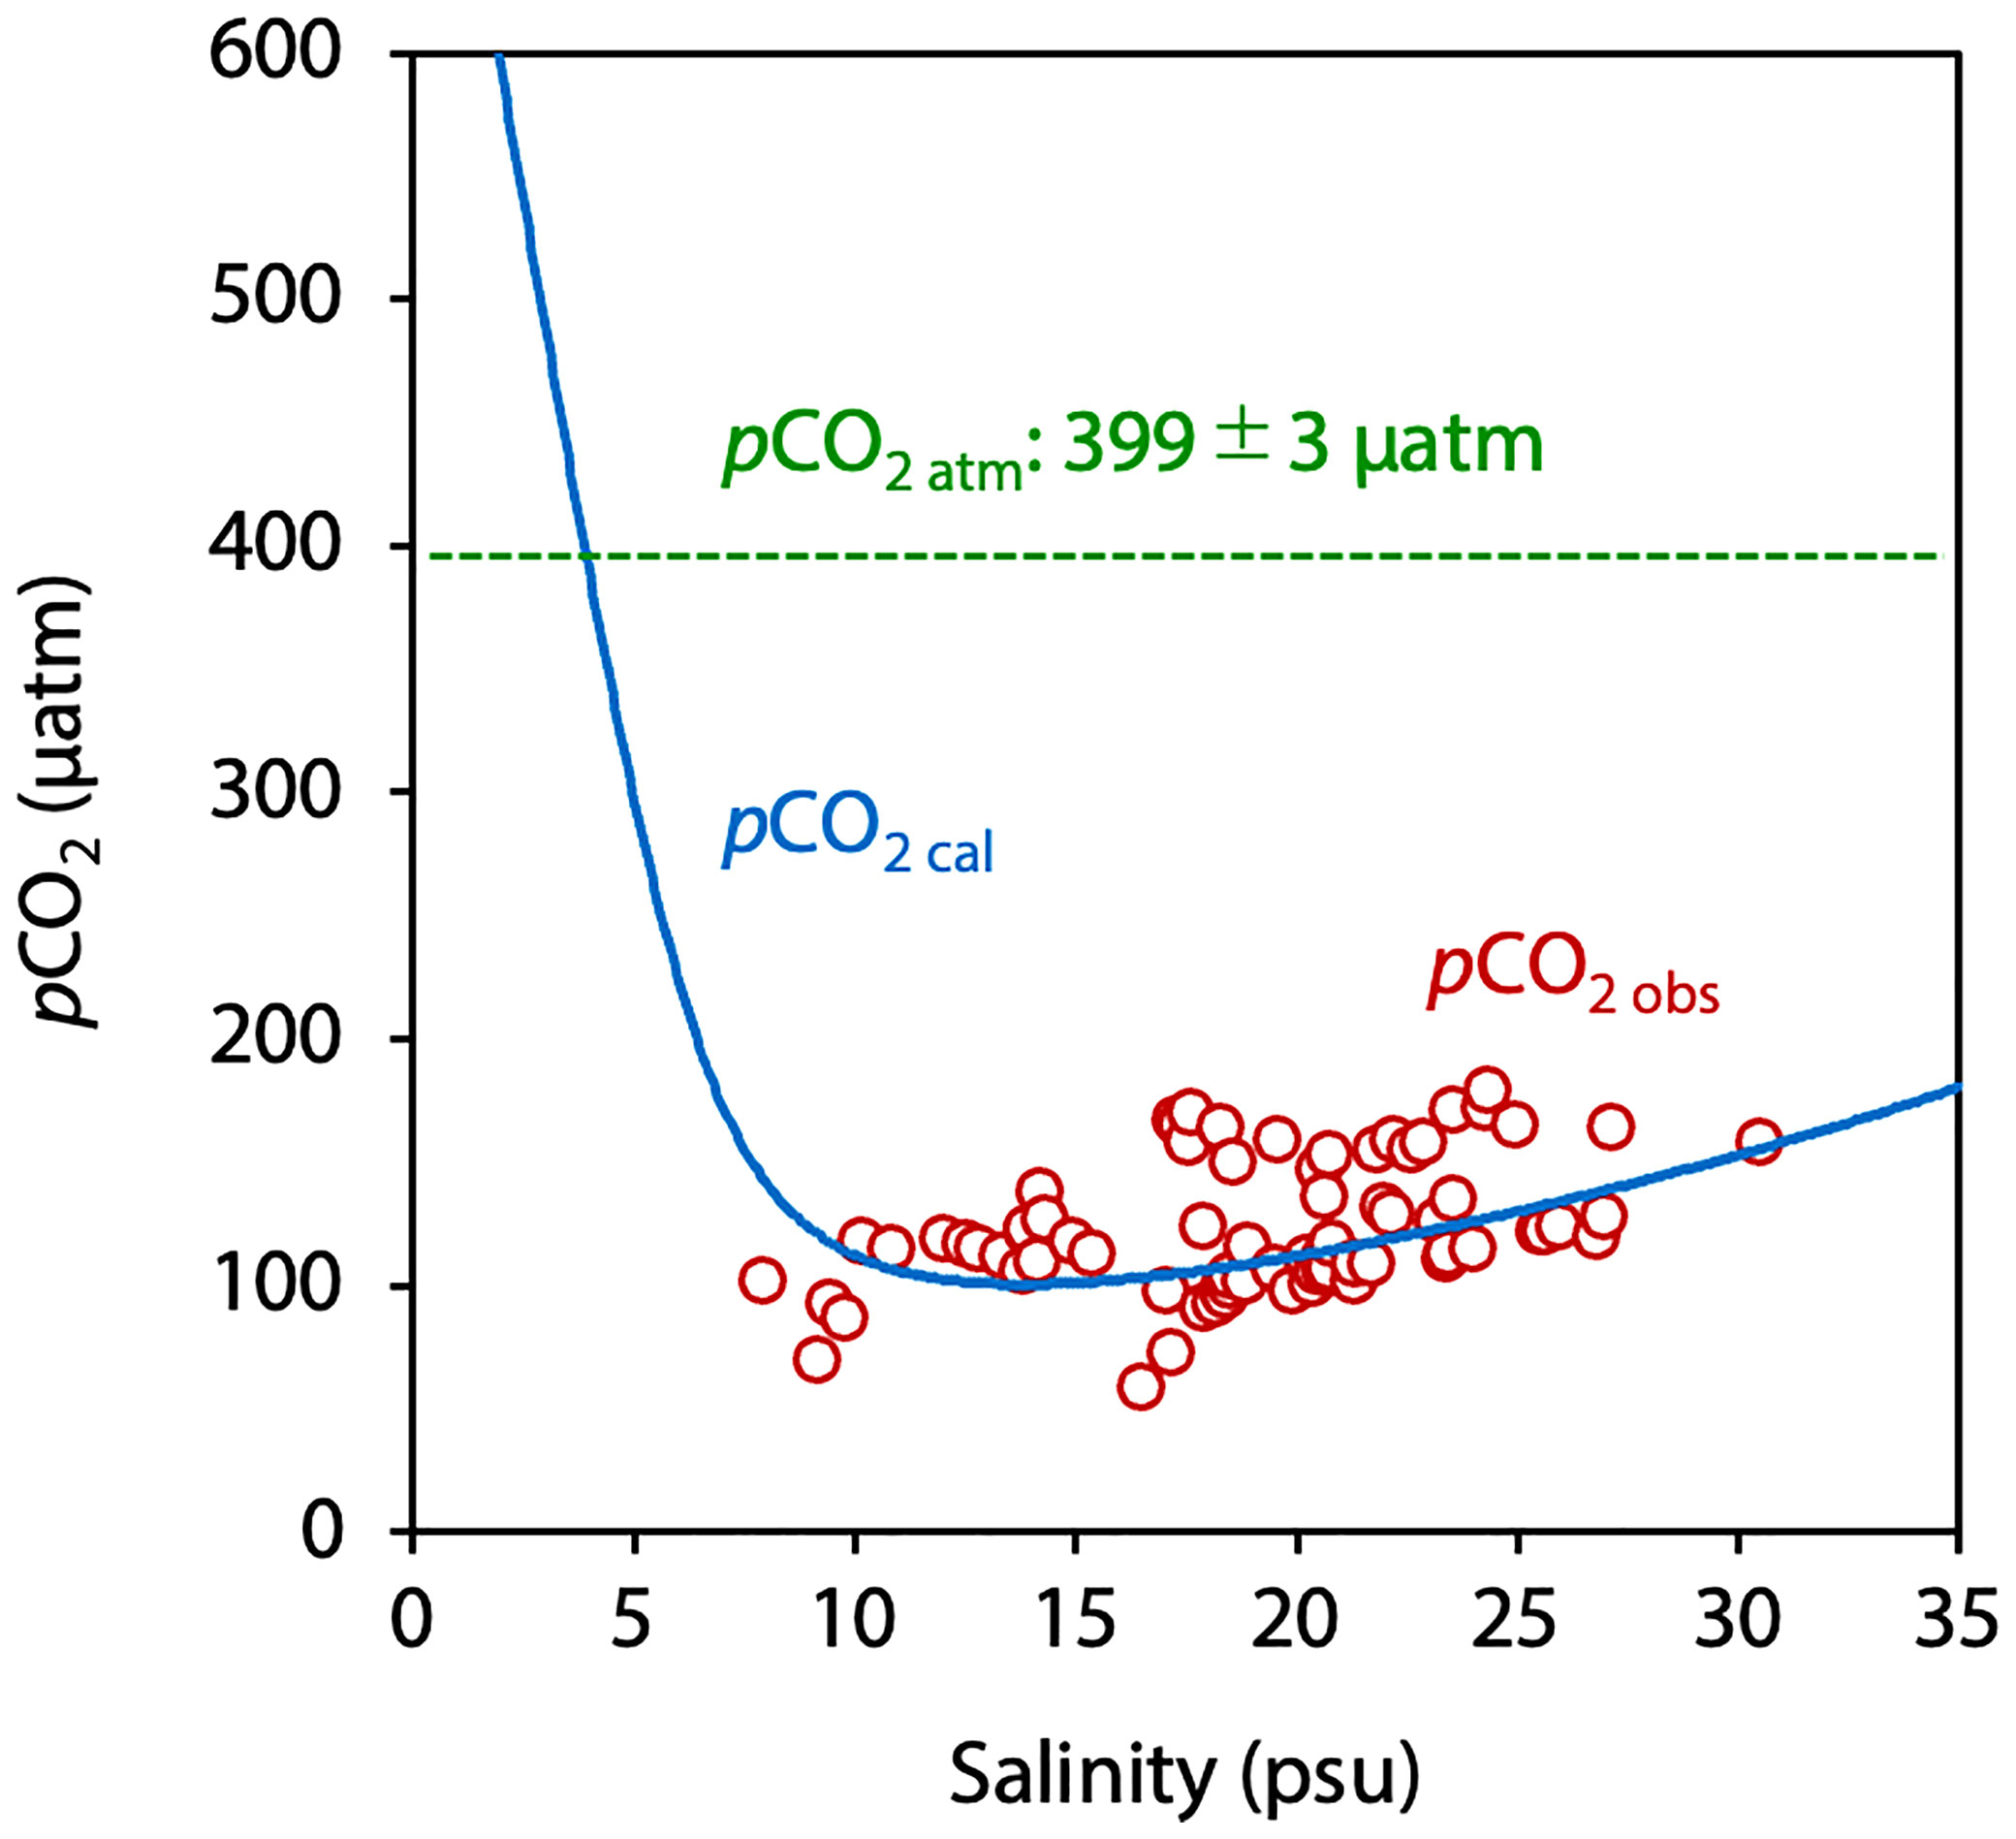
Figure 6 Relationship between pCO2 obs or pCO2 cal and salinity.
Therefore, to indicate pCO2 dynamics as a function of the salinity at low salinity water, we calculated pCO2 based on the linearities of the DIC and TA with salinity (Figures 4A, B). Values of DIC and TA at the any salinity, obtained by using these linear equations (DIC = 54.9S + 167.5 and TA = 63.7S + 105.0 in Figure 4), were decided. Then, we calculated pCO2 (pCO2 cal) using DIC and TA at any salinity. For this calculation, temperature was fixed at +5°C, which is the surface water near the calving front (Figure 3B) to isolate the effects of DIC and TA changes due to salinity changes on pCO2. pCO2 cal (blue line in Figure 6) decreased as the salinity decreased when salinity was relatively high (e.g., S > 10 psu). Comparison of pCO2 cal with pCO2 obs indicated that variations of pCO2 cal and pCO2 obs were similar with respect to the salinity. These results suggested that pCO2 obs could be explained by the dilution effect as a function of the salinity.
When salinity was low (e.g., S < 10 psu), pCO2 cal was substantially higher than the range of pCO2 obs (60–170 µatm). Because the glacial meltwater contained land-derived substances as indicated that DIC-salinity and TA-salinity plots exhibit remarkable intercepts at zero salinity (Figures 4A, B). Therefore, we expected that pCO2 at low salinity would be affected by the land-derived substances. In the next section, we will examine the effect of land-derived substances on the pCO2 by using the relationship between salinity normalized DIC and TA.
The positive intercepts of the regression lines fitted to the relationships between DIC and TA and salinity (Figures 4A, B) indicate that the glacial meltwater (unmixed with seawater) contained land-derived substances. To explain the high pCO2 cal at low salinity, we evaluated effects of land-derived substances on carbonate chemistry by using the relationship between DIC and TA.
To correct for the influences dilution that change DIC and TA proportionally with salinity, DIC and TA were normalized to account for the addition of DIC and TA by freshwater input following Friis et al. (2003) as follows:
nDIC = (DICobs – DICS=0) • 34.3/Sobs + DICS=0 (5)
nTA = TAobs – TAS=0) • 34.3/Sobs + TAS=0 (6)
where “nDIC” and “nTA” indicate the salinity normalized DIC and TA. “DICobs”, “Sobs”, and “TAobs” indicate the observed values of DIC, salinity, and TA, respectively, at each sampling point. “DICS=0” and “TAS=0” indicate DIC and TA at S = 0 psu. In this study, we used intercept values of 167.5 for DICS=0 and 105.0 for TAS=0 (Figures 4A, B). “34.3” indicates the salinity of the polar water.
We next plotted nTA against nDIC for all sampling points (Figure 7). We divided the data into two groups: data from sea areas near the glaciers, which were strongly affected by the glacier meltwater (e.g., S < 15 psu) (red circles) and data from other areas less affected by glacier meltwater (e.g., S > 15 psu) (blue circles). The expected changes in nDIC and nTA due to photosynthesis and organic matter decomposition (slope = 2.0), based on the Redfield ratio (C:N:P = 106:16:1) (slope = –0.14), the dissolution or precipitation of calcium carbonate, and the exchange of CO2 between the atmosphere and the ocean (slope = 0) (Zeebe and Wolf-Gladrow, 2001) were shown in the inset in Figure 7.
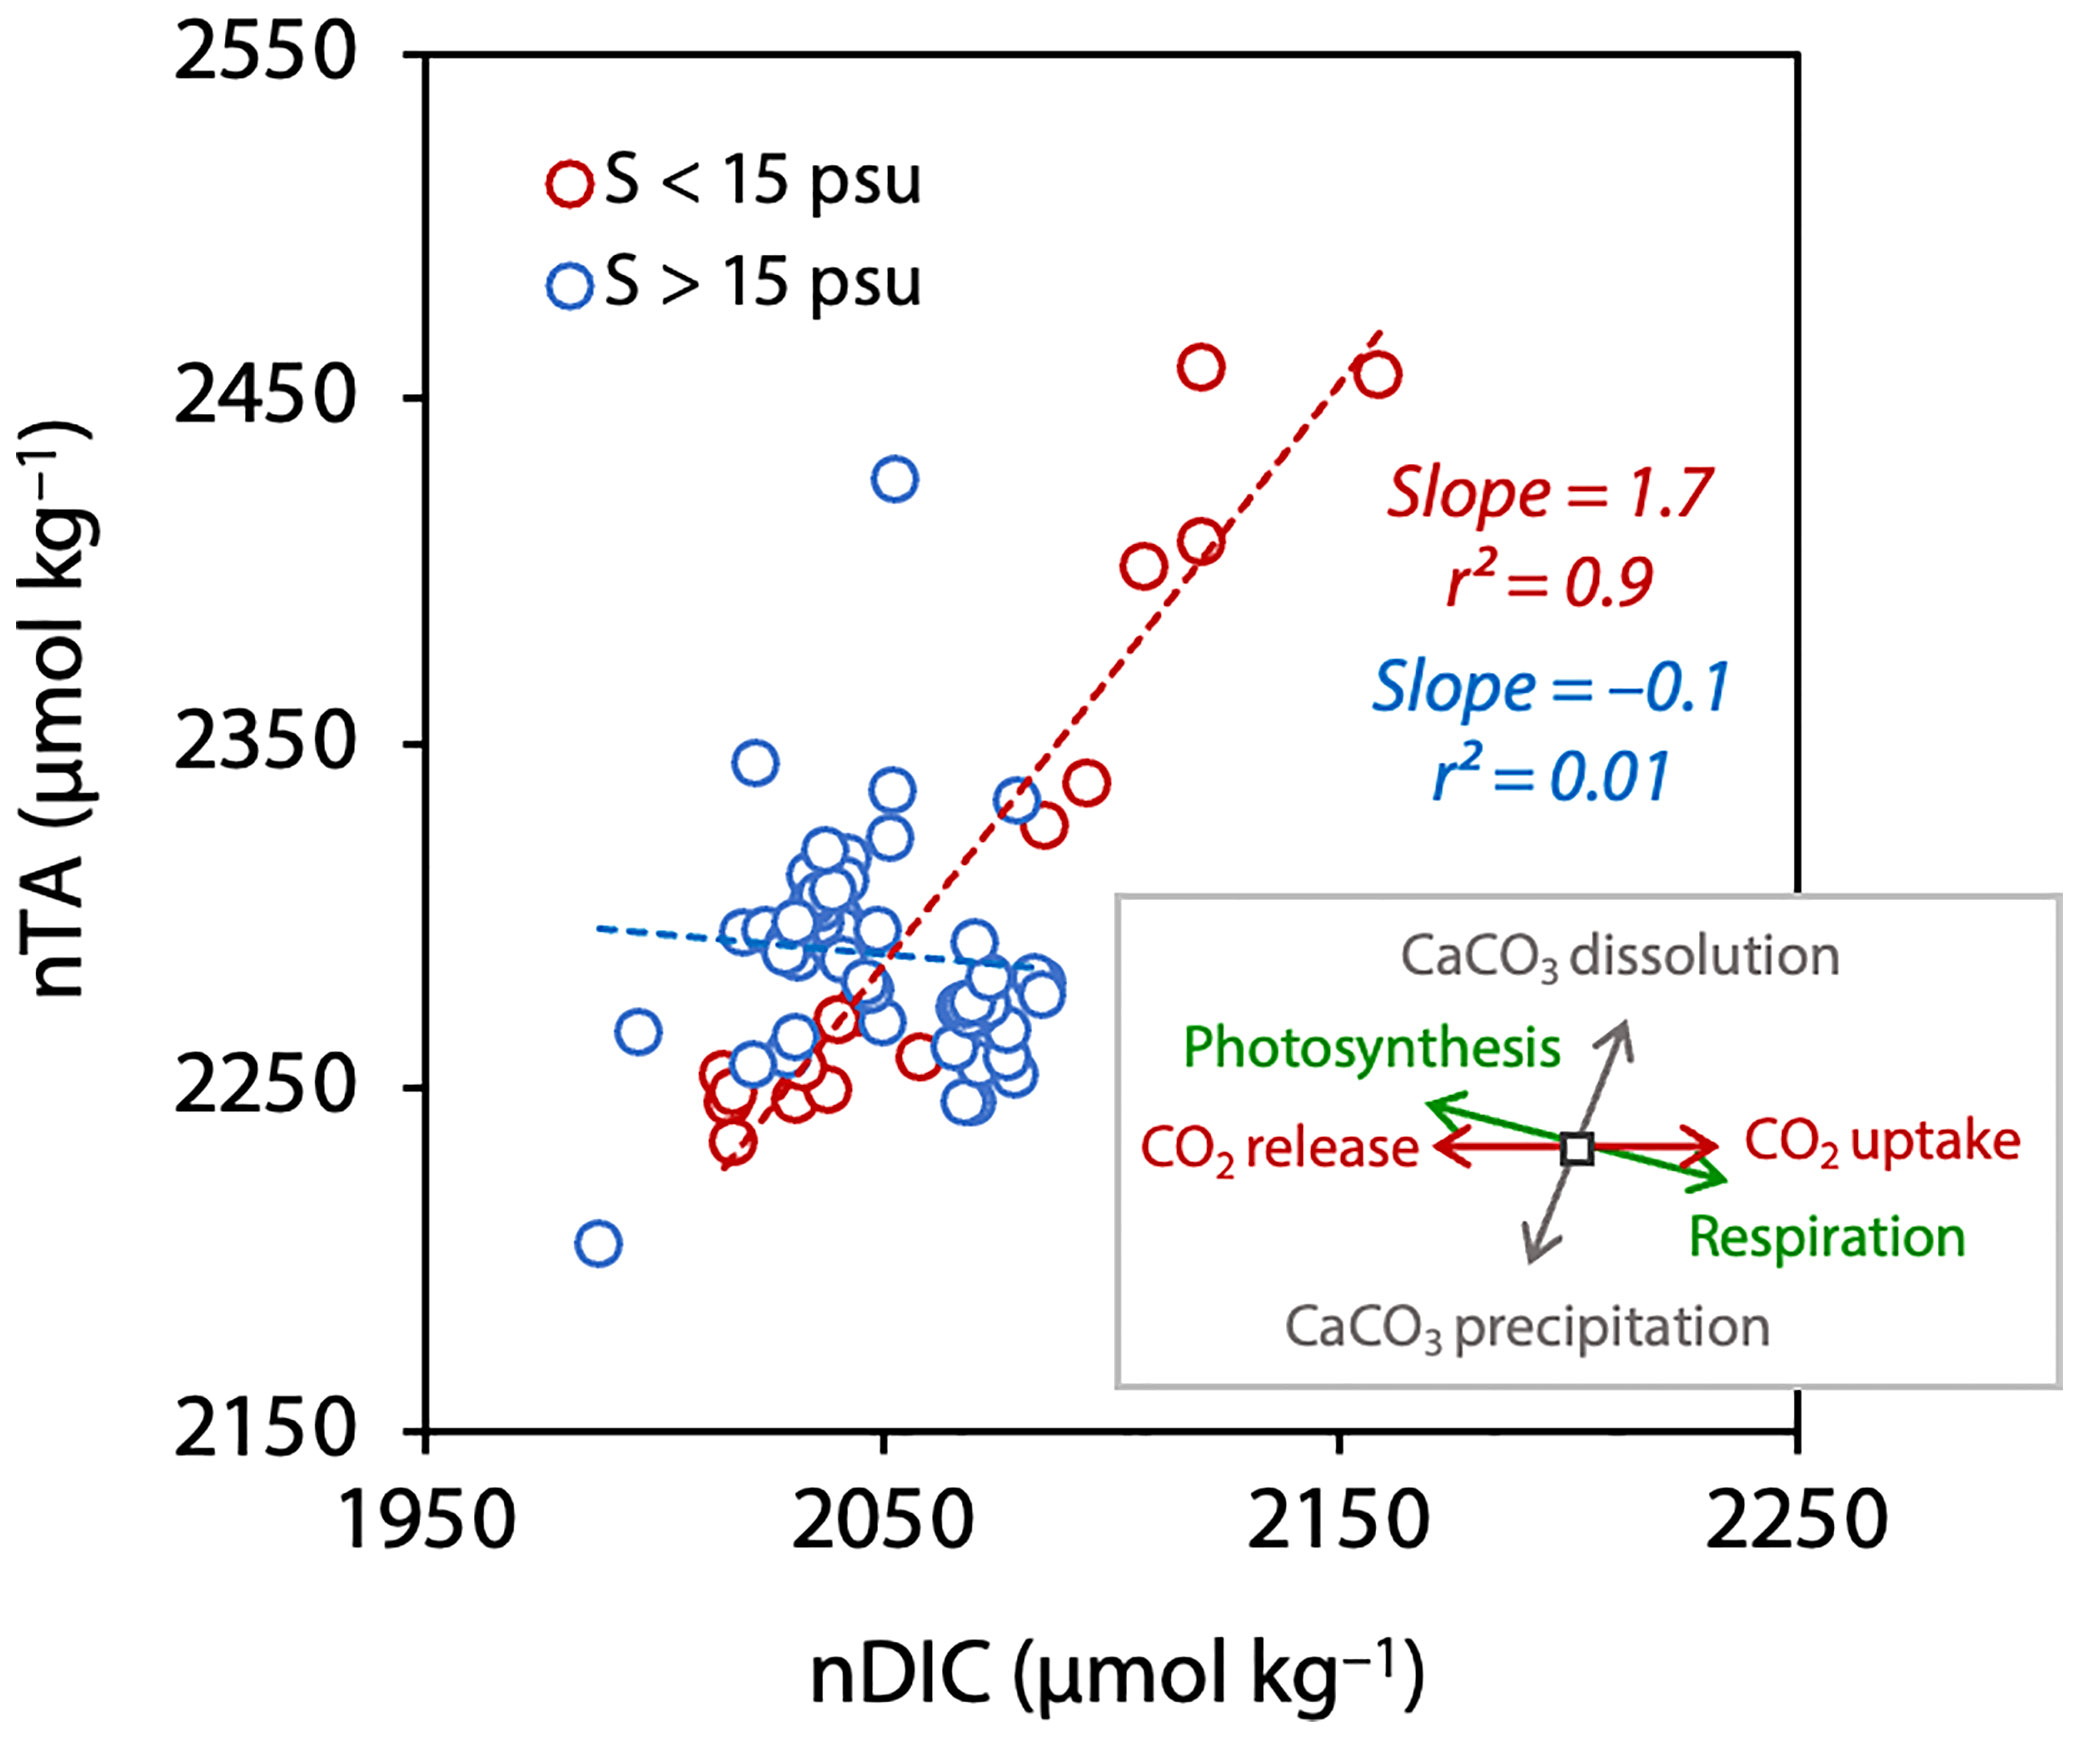
Figure 7 Relationships between nTA and nDIC for S > 15 psu (blue) and S < 15 psu (red). Dashed lines indicate the regression lines for each salinity category. The inset indicates the theoretical slope of the different processes affecting n-DIC and n-TA.
Data for S > 15 psu (blue) was relatively narrow range (2047 ± 22 µmol kg–1 for nDIC and 2289 ± 31 µmol kg–1 for nTA) with respect to those for S < 15 psu (red) (Figure 7). Data for S < 15 psu ranged widely from 2015 to 2158 µmol kg–1 for nDIC and 2233 to 2458 µmol kg–1 for nTA with respect to those of S > 15 psu. In addition, data for S < 15 psu deviated from the data for S > 15 psu to the higher nDIC and nTA (upper right side). Furthermore, the relationship between nDIC and nTA for S < 15 psu indicated high correlation (r2 = 0.9) with slope of 1.7. These results suggest that nDIC and nTA were changed by the mixing effects of dissolution of minerals such as calcium carbonate, the decomposition of organic matter (respiration), and absorption of CO2 from the atmosphere (CO2 uptake).
To understand dominant processes affecting nDIC and nTA variations, we first examined the change in nDIC (nTA does not change) due to the absorption of CO2 from the atmosphere. In this study, we calculated the CO2 flux between ocean and atmosphere to be –4.9 ± 0.7 mmol m–2 d–1 during the 15 days from mid-July, when sea ice melting started, to the end of our observation period (beginning of August) (see section 3.1). Given this flux, the increase in nDIC at the surface (e.g., 0–10 m depth) due to CO2 absorption from the atmosphere was calculated to be 7 µmol kg–1. This value is very small compared to the observed nDIC increases for S < 15 psu (Figure 7; >140 µmol kg–1 increase). Thus, we inferred that the effect on the nDIC increase of the exchange of CO2 between the atmosphere and ocean was negligible.
How does the dissolution of minerals affect nDIC and nTA near the calving front? As shown by the formulas for carbonate mineral dissolution (CaCO3 + CO2 (aq) + H2O→Ca2+ + 2HCO3−) and silicate mineral dissolution (CaAl2Si2O8 + 2CO2 (aq) + 2H2O→Ca2+ +2HCO3−(aq) + H2Al2Si2O8), the dissolution of both carbonate and silicate minerals would cause nDIC and nTA to increase in the ratio of 1:2 (slope = 2.0). Glacial meltwater flowing into Bowdoin Fjord also contains organic particles (Kanna et al., 2018). When these organic particles are remineralized by bacterial activity (respiration), nDIC increases and nTA decreases according to the Redfield ratio (C:N:P = 106:16:1). The dissolution of minerals and the decomposition of organic matter occur at the same time. Therefore, nDIC and nTA affected by glacial meltwater should plot between the theoretical lines for these processes.
In this discussion, we have assumed that the dissolution of carbonate minerals and the decomposition of organic matter occur in situ (i.e., in the fjord waters), but it is possible for these processes to affect the chemistry of the glacial meltwater before it flows into the fjord. Near the calving front of Bowdoin Glacier, where the influence of glacial meltwater is large (Figure 5A), nDIC and nTA were higher than nDIC and nTA of other area (Figures 8A, B). Therefore, DIC and TA components were added to the fjord water, either as a result of the dissolution of minerals such as calcium carbonate and the decomposition of organic matter occurring within the fjord waters, as described above, or as a result of mineral dissolution and organic matter decomposition occurring in the glacial meltwater before it flowed into the fjord. Podolskiy et al. (2021) estimated residence time near the calving front of the glacier to be about several days based on the time series of the surface water temperature. Therefore, we inferred that DIC and TA components were added by the glacial meltwater affected by the dissolution of minerals such as calcium carbonate and the decomposition of organic matter before it flowed into the fjord. This discussion was supported by the results that DIC-salinity and TA-salinity plots exhibit high correlation coefficient (r2 = 0.99) and the remarkable intercepts at zero salinity (Figures 4A, B). For the biological productivity, the effect of photosynthesis on the carbonate chemistry would be minimum because the short residence time of water and the low temperature water near the calving front have restrained primary production.
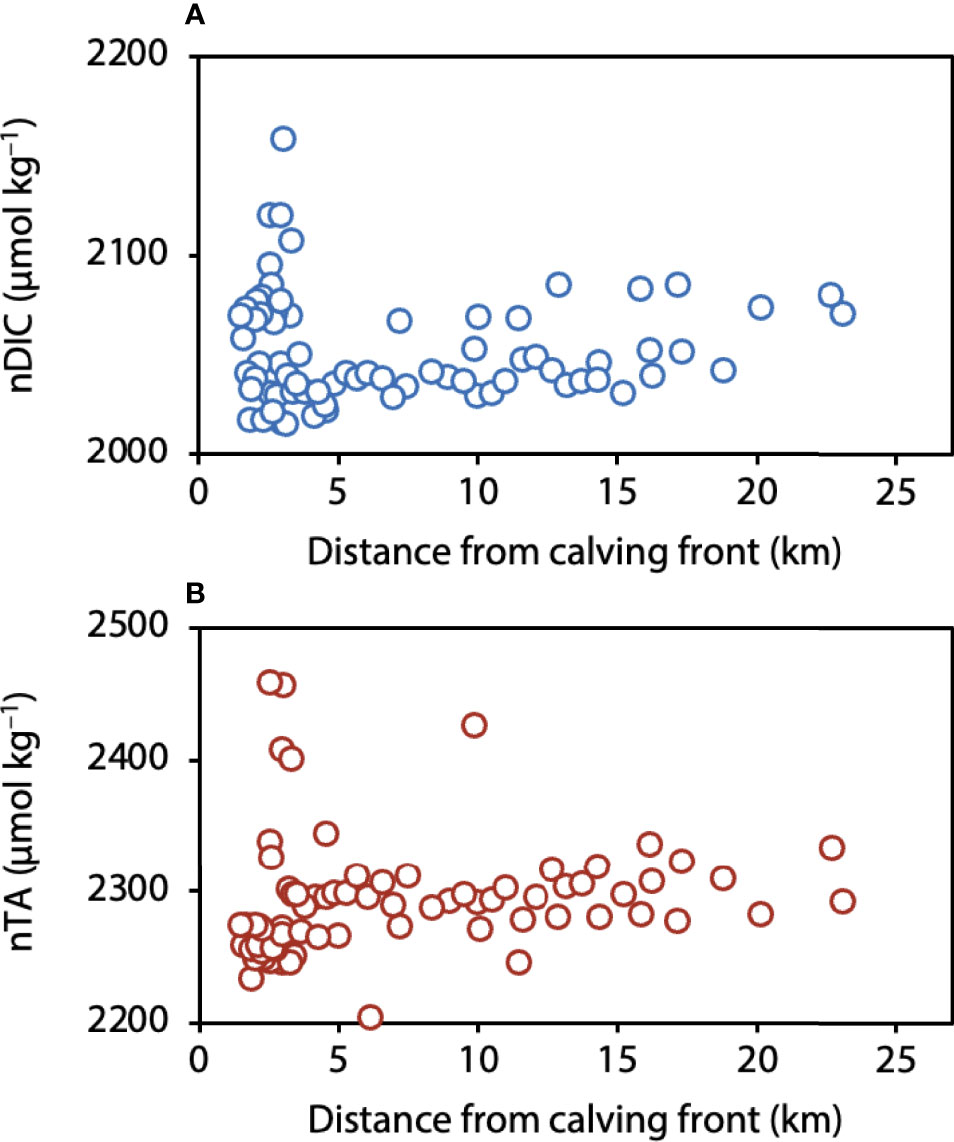
Figure 8 Distributions of (A) nDIC and (B) nTA in relation to the calving front.
Given these impacts on nDIC and nTA, how does the dissolution of minerals and the decomposition of organic matter in the glacial meltwater affect pCO2? The dissolution formulas for minerals given above show that dissolution works to reduce pCO2 of the seawater because it consumes CO2 (St Pierre et al., 2019). In contrast, when organic particles are decomposed, pCO2 of the seawater increases. Based on our pCO2 distribution (Figure 6) and the relationship between nDIC and nTA suggested that the dilution effect by freshwater was dominant in relatively higher salinity (e.g., S > 15 psu) site away from the glacier while for the lower salinity (e.g., S < 15 psu) site near the calving front, the land-derived high pCO2 freshwater affected mainly by the remineralization of the organic matter by bacterial activity was supplied to the fjord. Glacial meltwater flowing into the Bowdoin Fjord contains organic particles (Kanna et al., 2018). Therefore, we suggested that in our study area, the remineralization process was dominated and pCO2 near the calving front was increased.
Water was sampled in Bowdoin Fjord, northwestern Greenland, to examine the effects of glacier meltwater supply on the CO2 cycle within the fjord. The inflow of glacial meltwater was greater closer to the calving front of Bowdoin Glacier. As a result, the salinity of the seawater decreased near the ice front, and DIC and TA were decreased, by the input of glacial meltwater. The pCO2 variation suggested that the dilution effect was dominant in relatively higher salinity (e.g., S > 15 psu) site away from the glacier. However, for the lower salinity (e.g., S < 15 psu) site near the calving front, pCO2 was high due to the supply of the water affected by the decomposition of organic matter before it flowed into the fjord. Because the actual meltwaters from the glacier especially flowing via the land contained the terrestrial materials, inorganic carbon dynamics in such coastal fjord waters requires consideration of not only the dilution effect of glacial meltwater but also the biogeochemical modification by the land-derived substances supplied with freshwater.
Our results present facilitate understanding of the effects of glacial meltwater on carbon dynamics in seawater and subsequent prediction of future changes in the carbonate chemistry of the fjord, and thus the amount of CO2 absorbed from the atmosphere because the accelerated melting of glacier and ice shelves in recent years (e.g., Pritchard et al., 2012; Rignot et al., 2019) has provided large amounts of freshwater to the coastal areas and high productivity was observed (e.g., Meire et al., 2015; Arrigo et al., 2017). In addition to the freshwater, our results indicated that materials were supplied to the coastal areas, which would be modified the carbonate chemistry in the water, and thereby CO2 flux between ocean and atmosphere. Further investigations are needed for understanding the materials transport and the effects on the carbonate chemistry and gas flux process in the future.
The original contributions presented in the study are included in the article/Supplementary Material and the data repository of the National Institute of Polar Research, Tokyo, Japan (https://doi.org/10.17592/001.2022070101). Further inquiries can be directed to the corresponding author.
The original collectors of field data for this synthesis are DN, NK, YF, and SS. TH performed the data reevaluation and wrote the paper with contributions from all coauthors. All authors contributed to the article and approved the submitted version.
This work was supported by grants from the Japan Society for the Promotion of Science (JSPS) (#17H04715, #20H04345) and the Japanese Ministry of Education, Culture, Sports, Science and Technology (MEXT) through the Arctic research project, Arctic Challenge for Sustainability (ArCS) (JPMXD1300000000) and ArCS-II (JPMXD1420318865), and the Joint Research Program of the Institute of Low Temperature Science, Hokkaido University.
The authors declare that the research was conducted in the absence of any commercial or financial relationships that could be construed as a potential conflict of interest.
All claims expressed in this article are solely those of the authors and do not necessarily represent those of their affiliated organizations, or those of the publisher, the editors and the reviewers. Any product that may be evaluated in this article, or claim that may be made by its manufacturer, is not guaranteed or endorsed by the publisher.
We thank all of the people working in the field during the 2016 and 2017 field campaigns in Qaanaaq. Special thanks are due to S. Daorana, T. Oshima, and K. Peterson for providing logistical support in Qaanaaq. We are also grateful to D. Sakakibara, Y. Ohashi, S. Yunoki for assistance with the field and laboratory tasks. The Landsat image used for Figure 1 was downloaded from the U.S. Geological Survey Earth Explorer.
The Supplementary Material for this article can be found online at: https://www.frontiersin.org/articles/10.3389/fmars.2022.873860/full#supplementary-material
Østlund H. G., Hut G. (1984). Arctic Ocean water mass balance from isotope data. J. Geophysical. Res. 89 (C4), 6373–6381. doi: 10.1029/JC089iC04p06373
Arrigo K. R., van Dijken G. L., Castelao R. M., Luo H., Rennermalm Å.K., Tedesco M., et al. (2017). Melting glaciers stimulate large summer phytoplankton blooms in southwest Greenland waters. Geophysical. Res. Lett. 44, 6278–6285. doi: 10.1002/2017GL073583
Bates N. R., Mathis J. T. (2009). The Arctic ocean marine carbon cycle: evaluation of air-sea CO2 exchanges, ocean acidification impacts and potential feedbacks. Biogeosciences 6, 2433–2459. doi: 10.5194/bg-6-2433-2009
Bjørk A. A., Kruse L. M., Michaelsen P. B. (2015). Getting greenland's glaciers right–a new data set of all official greenlandic glacier names. Cryosphere. 9 (6), 2215–2218. doi: 10.5194/tc-9-2215-2015
Carr J. R., Stokes C. R., Vieli A. (2017). Threefold increase in marine terminating outlet glacier retreat rates across the Atlantic Arctic 1992–2010. Ann. Glaciol. 58, 72–91. doi: 10.1017/aog.2017.3
Chu V. W. (2014). Greenland Ice sheet hydrology, a review. Prog. Phys. Geogr. 38 (1), 19–54. doi: 10.1177/0309133313507075
Dickson A. G. (1990). Standard potential of the reaction: AgCl(s) + 1.2H2(g) = ag(s) + HCl (aq), and the standard acidity constant of the ion HSO4– in synthetic sea water from 273.15 to 318.15. J. Chem. Thermodynamics. 22, 113–127. doi: 10.1016/0021-9614(90)90074-Z
Dickson A. G., Millero F. J. (1987). A comparison of the equilibrium constants for the dissociation of carbonic acid in seawater media. Deep-Sea. Res. 34, 1733–1743. doi: 10.1016/0198-0149(87)90021-5
Fransson A., Chierici M., Nomura D., Granskog M3. A., Kristiansen S., Martma T., et al. (2015). Effect of glacial drainage water on the CO2 system and ocean acidification state in an Arctic tidewater-glacier fjord during two contrasting years. J. Geophysical. Research-Oceans. 120, 2413–2429. doi: 10.1002/2014JC010320
Friis K., Kortzinger A., Wallace D. W. R. (2003). The salinity normalization of marine inorganic carbon chemistry data. Geophysical. Res. Lett. 30 (2), 1085. doi: 10.1029/2002GL015898
Gao Z., Chen L., Sun H., Chen B., Cai W. J. (2012). Distributions and air–sea fluxes of carbon dioxide in the Western Arctic ocean. Deep-Sea. Res. II. 81–84, 46–52. doi: 10.1016/j.dsr2.2012.08.021
Johnson K. M. (1992). Single-operator multiparameter metabolic analyzer (SOMMA) for total carbon dioxide (CT) with coulometric detection. SOMMA manual 1.0, January 1992 (Upton, NY: Brookhaven National Laboratory), 70 pp. doi: 10.2172/10194787
Johnson K. M., King A. E., Sieburth J. M. (1985). Coulometric TCO2 analyses for marine studies; an introduction. Mar. Chem. 16, 61–82. doi: 10.1016/0304-4203(85)90028-3
Kanna N., Sugiyama S., Fukamachi Y., Nomura D., Nishioka J. (2020). Iron supply by subglacial discharge into a fjord near the front of a marine-terminating glacier in Northwestern Greenland. Global Biogeochemical. Cycles 34 (123), 1666–1682. doi: 10.1029/2020GB006567
Kanna N., Sugiyama S., Ohashi Y., Sakakibara D., Fukamachi Y., Nomura D. (2018). Upwelling of macronutrients and dissolved inorganic carbon by a subglacial freshwater driven plume in bowdoin fjord, northwestern Greenland. J. Geophysical. Research-Biogeosciences. doi: 10.1029/2017JG004248
Mehrbach C., Culberson C. H., Hawley J. E., Pytkowicx R. M. (1973). Measurement of the apparent dissociation constants of carbonic acid in seawater at atmospheric pressure. Limnology. Oceanography. 18 (6), 897–907. doi: 10.4319/lo.1973.18.6.0897
Meire L., Mortensen J., Meire P., Juul-Pedersen T., Sejr M. K., Rysgaard S., et al. (2017). Marine-terminating glaciers sustain high productivity in Greenland fjords. Global Change Biol. 23 (12), 5344–5357. doi: 10.1111/gcb.13801
Meire L., Søgaard D. H., Mortensen J., Meysman F. J. R., Soetaert K., Arendt K. E., et al. (2015). Glacial meltwater and primary production are drivers of strong CO2 uptake in fjord and coastal waters adjacent to the Greenland ice sheet. Biogeosciences 12, 2347–2363. doi: 10.5194/bg-12-2347-2015
Naito A., Abe Y., Matsuno K., Nishizawa B., Kanna N., Sugiyama S., et al. (2019). Surface zooplankton size and taxonomic composition in bowdoin fjord, north-western Greenland: A comparison of ZooScan, OPC and microscopic analyses. Polar. Sci. 19, 120–129. doi: 10.1016/j.polar.2019.01.001
Nienow P. W., Sole A. J., Slater D. A., Cowton T. R. (2017). Recent advances in our understanding of the role of meltwater in the Greenland ice sheet system. Curr. Clim. Change Rep. 3, 330–344. doi: 10.1007/s40641-017-0083-9
Nishizawa B., Kanna N., Ohashi Y., Sakakibara D., Asaji I., Abe Y., et al. (2019). Contrasting assemblages of seabirds in the subglacial meltwater plume and oceanic water of bowdoin fjord, northwestern Greenland. ICES. J. Mar. Sci. 77 (2), 711–720. doi: 10.1093/icesjms/fsz213
Ohashi Y., Aoki S., Matsumura Y., Sugiyama S., Kanna N., Sakakibara D. (2020). Vertical distribution of water mass properties under the influence of subglacial discharge in bowdoin fjord, northwestern Greenland. Ocean. Sci. 16, 545–564. doi: 10.5194/os-16-545-2020
Ono T., Watanabe S., Okuda K., Fukasawa M. (1998). Distribution of total carbonate and related properties in the north pacific along 30°N. J. Geophysical. Res. 103 (C13), 30873–30883. doi: 10.1029/1998jc900018
Orr J. C., Epitalon J.-M., Dickson A. G., Gattuso J.-P. (2018). Routine uncertainty propagation for the marine carbon dioxide system. Mar. Chem. 207, 84–107. doi: 10.1016/j.marchem.2018.10.006
Parsons T. R., Takahashi M., Hargrave B. (1984). Biological Oceanographic Processes (3rd ed.) (Oxford, UK: Pergamon: ELSEVIER).
Podolskiy E. A., Kanna N., Sugiyama S. (2021). Co-Seismic eruption and intermittent turbulence of a subglacial discharge plume revealed by continuous subsurface observations in Greenland. Communication. Earth Environ. 2 (66), 2–66. doi: 10.1038/s43247-021-00132-8
Pritchard H., Ligtenberg S., Fricker H., Vaughan D. G., van den Broeke M. R., Padman L. (2012). Antarctic Ice-sheet loss driven by basal melting of ice shelves. Nature 484, 502–505. doi: 10.1038/nature10968
Rignot E., Mouginot J., Scheuchl B., van den Broeke M., van Wessem M. J., Morlighem M. (2019). Four decades of Antarctic ice sheet mass balance from 1979–2017. Proc. Natl. Acad. Sci. 116 (4), 1095–1103. doi: 10.1073/pnas.1812883116
Seifert M., Hoppema M., Burau C., Elmer C., Friedrichs A., Geuer J. K., et al. (2019). Influence of glacial meltwater on summer biogeochemical cycles in scoresby sund, East Greenland. Front. Mar. Sci. 6. doi: 10.3389/fmars.2019.00412
Sejr M. K., Krause-Jensen D., Rysgaard S., Sorensen L. L., Christensen P. B., Glud R. N. (2011). Air-sea flux of CO2 in arctic coastal waters influenced by glacial melt water and sea ice. Tellus 63B, 815–822. doi: 10.1111/j.1600-0889.2011.00540x
St Pierre K. A., St Louis V. L., Schiff S. L., Lehnherr I., Dainard P. G., Gardner A. S., et al. (2019). Proglacial freshwaters are significant and previously unrecognized sinks of atmospheric CO2. Proc. Nat. Sci. U.S.A. 116 (36), 17690–17695 doi: 10.1073/pnas.1904241116
Sugiyama S., Kanna N., Sakakibara D., Ando T., Asaji I., Kondo K., et al. (2021). Rapidly changing glaciers, ocean and coastal environments, and their impact on human society in the qaanaaq region, northwestern Greenland. Polar. Sci. 27, 100631. doi: 10.1016/j.polar.2020.100632
Sugiyama S., Sakakibara D., Tsutaki S., Maruyama M., Sawagaki T. (2015). Glacier dynamics near the calving front of bowdoin glacier, northwestern Greenland. J. Glaciology. 61, 226. doi: 10.3189/2015JoG14J127
Suzuki R., Ishimaru T. (1990). An improved method for the determination of phytoplankton chlorophyll using n, n-dimethylforma-mide. J. Oceanography. 46, 190–194. doi: 10.1007/bf02125580
Tsutaki S., Sugiyama S., Sakakibara D., Sawagaki T. (2016). Surface elevation changes during 2007–13 on bowdoin and tugto glaciers, northwestern Greenland. J. Glaciology. 62 (236), 1083–1092. doi: 10.1017/jog.2016.106
Wanninkhof R., Park G.-H., Takahashi T., Sweeney C., Feely R., Nojiri Y., et al. (2013). Global ocean carbon uptake: Magnitude, variability and trends. Biogeosciences 10 (3), 1983–2000. doi: 10.5194/bg-10-1983-2013
Weiss R. F. (1974). Carbon dioxide in water and seawater: The solubility of a non-ideal gas. Mar. Chem. 2 (3), 203–215. doi: 10.1016/0304-4203(74)90015-2
Weiss R. F., Price B. A. (1980). Nitrous oxide solubility in water and sea water. Mar. Chem. 8 (1980), 347–359. doi: 10.1016/0304-4203(80)90024-9
Keywords: carbonate chemistry, freshwater, fjord, glacier, Greenland
Citation: Horikawa T, Nomura D, Kanna N, Fukamachi Y and Sugiyama S (2022) Effects of the glacial meltwater supply on carbonate chemistry in Bowdoin Fjord, Northwestern Greenland. Front. Mar. Sci. 9:873860. doi: 10.3389/fmars.2022.873860
Received: 11 February 2022; Accepted: 29 June 2022;
Published: 22 July 2022.
Edited by:
Gilles Reverdin, Centre National de la Recherche Scientifique (CNRS), FranceReviewed by:
Wei-dong Zhai, Shandong University, ChinaCopyright © 2022 Horikawa, Nomura, Kanna, Fukamachi and Sugiyama. This is an open-access article distributed under the terms of the Creative Commons Attribution License (CC BY). The use, distribution or reproduction in other forums is permitted, provided the original author(s) and the copyright owner(s) are credited and that the original publication in this journal is cited, in accordance with accepted academic practice. No use, distribution or reproduction is permitted which does not comply with these terms.
*Correspondence: Daiki Nomura, ZGFpa2kubm9tdXJhQGZpc2guaG9rdWRhaS5hYy5qcA==
Disclaimer: All claims expressed in this article are solely those of the authors and do not necessarily represent those of their affiliated organizations, or those of the publisher, the editors and the reviewers. Any product that may be evaluated in this article or claim that may be made by its manufacturer is not guaranteed or endorsed by the publisher.
Research integrity at Frontiers
Learn more about the work of our research integrity team to safeguard the quality of each article we publish.