
95% of researchers rate our articles as excellent or good
Learn more about the work of our research integrity team to safeguard the quality of each article we publish.
Find out more
ORIGINAL RESEARCH article
Front. Mar. Sci. , 21 June 2022
Sec. Marine Ecosystem Ecology
Volume 9 - 2022 | https://doi.org/10.3389/fmars.2022.872679
This article is part of the Research Topic Blue Carbon: Beyond the Inventory View all 17 articles
 Jack Michael Sheehy1*
 Nicola L Taylor2†Nadescha Zwerschke3†Mark Collar4†Vicky Morgan5†Eugenia Merayo4†
Cetaceans provide a range of ecosystem services of value to anthropogenic interests. Following the Common International Classification of Ecosystem Services (CICES) these are categorised as regulation and maintenance, provisioning, and cultural values. This study focuses on those of importance to climate change mitigation through regulation and maintenance. Under regulation and maintenance, cetaceans can store, transport, and influence stocks of carbon through: climate regulation through carbon sequestration, enhanced biodiversity and ecosystem potential, and enhanced primary productivity. ‘Climate regulation through carbon sequestration’ can be quantified as carbon fixation through living biomass and ‘whale-falls’. Cetacean populations store significant stocks of carbon in living biomass. After death, sinking whale carcasses, ‘whale-falls’, provide a significant transfer of biomass and nutrients to benthic sediments and support deep sea ecosystems. During their lifespan, cetaceans also disperse nutrients through feeding and excretion both horizontally through the ‘whale-conveyor’ and vertically through the ‘whale pump’. As nutrient limitations hinder phytoplankton growth, these processes can be quantified as the increased potential of phytoplankton carbon fixation from cetacean driven nutrient cycling. Enhanced biodiversity, ecosystem potential, and primary productivity can be quantified as carbon fixation through nutrient cycling. This study reviews the evaluative and valuative techniques used in cetacean ecosystem service research and adapts and applies them to the Joint Cetacean Protocol (JCP) data which details cetacean abundance and distribution in Europe. They are then reviewed with regards to their robustness, application in markets, and in decision making processes. Cetacean populations are estimated to contain 2 Mt C, cycle 60,000 t N yr-1, and impact carbon fluxes by as much as 22 Mt C yr-1 in the survey area. The values highlight key areas for cetacean conservation: the Outer Hebrides, west of south Wales, around the Isle of Man, to the east of England, and to the north-east of the Shetland Islands. There is, however, large uncertainty in the evaluative processes used; nutrient cycling models presented in this study don’t capture removal of excess nutrients, or the values of enhanced biodiversity and ecosystem potential. As such, they are not sufficiently robust to quantify market values but highlight key areas for future research on climate change mitigation through conservation. Key areas of future research include phytoplankton uptake rates of nitrogen and phosphorus in nutrient limited waters, quantification of ‘enhanced biodiversity and ecosystem potential’, and nutrient removal from coastal waters.
Whilst climate change is the result of anthropogenic activity and carbon emissions, the underlying factors of climate change are driven by economic, ecologic, and societal issues. Global policy therefore attempts to address climate change through an integrated approach of eco-social economics where common metrics (finance) are used to valuate natural capital and ecosystem services (Cisneros-Montemayor et al., 2019). There is debate on the suitability of ecologic valuations with regard to social equity (Peskett et al., 2008; FPP, 2011; Barbesgaard, 2016) and ecologic concerns (Fearnside, 1995; Fearnside, 2005; Fearnside, 2016). However, when carefully implemented, such valuations can aid conservation agendas and help communicate the value of natural capital to policy makers (Cavanagh et al., 2016; Dasgupta, 2021). Where values of natural capital are outside markets, they are often used to guide management of natural resources; in the ocean they are used in Marine Spatial Planning (MSP) processes (Price and Warren, 2016; Geraldi et al., 2019; Macreadie et al., 2019; Porter et al., 2020).
To valuate stocks of marine carbon, it’s first necessary to understand the complex biogeochemical and physical processes that influence global carbon fluxes and concentrations of atmospheric carbon. The ocean is of key importance as a major carbon sink and holds 98.5% of the carbon in the ocean-atmosphere system (Houghton, 2003). Marine carbon will flux between atmospheric carbon, in different forms in marine waters, and/or into benthic sediments and habitats. If carbon is stored for more than 100 years or transported below depths of 1000m or into sediments, this may be considered sequestered (Caldeira et al., 2002; Lovelock and Duarte, 2019). As atmospheric carbon contributes to climate change, and creates costs through climate change impacts, sequestered marine carbon may then be valued as the avoidance of that carbon in the atmosphere contributing to climate change impacts. Carbon therefore has an estimated value (Pearce, 2003; Watkiss et al., 2005) and this underpins carbon offsetting, ‘blue carbon’, and economic valuations of carbon stocks and fluxes (Ullman et al., 2013).
Marine carbon is defined as either being organic or inorganic, and as dissolved or particulate1 (Thompson et al., 2017):
● Organic: the carbon found in living plants and animals, in organic rich detritus, as dissolved organic carbon (DOC), and as particulate organic carbon (POC).
● Inorganic: the carbon dissolved in seawater that forms carbonates, dissolved inorganic carbon (DIC) and the calcareous skeletons, and hard shell material, formed by living organisms otherwise referred to as particulate inorganic carbon (PIC).
The relative global stocks of marine carbon are:
● DIC: There is roughly 38,000 Gt C of global DIC as carbonic acid, bicarbonates, and carbonates (Olson et al., 1985; Hansell and Carlson, 2015). DIC is mostly stored in the deep sea, which is often defined as waters greater than 100m in depth (Bishop, 2009). DIC fluxes with atmospheric carbon, in addition to POC, and between deep and shallow waters.
● DOC: Global estimates of DOC range from 662 Gt C to 740 Gt C in marine waters (Bishop, 2009; Hansell et al., 2009) and 150 Gt C in mixed surface marine sediments (Hedges, 1992). Photosynthesis is predominantly responsible for fixing DOC into POC and by extension DIC (Hedges, 1992) but microbial action may account for 30-50% of primary production (Jiao et al., 2010; Hansell and Carlson, 2015).
● POC: There is 22 Gt C mostly as inert matter and detritus with roughly 2 Gt C of that as organic carbon in living marine organisms (Olson et al., 1985; Hedges, 1992; SOEST, 2011). Global POC fluxes from primary productivity in surface waters to deeper waters and sediments are estimated to be between 8.5 Gt C yr-1 and 14.3 Gt C yr-1 (Xie et al., 2019).
● PIC: There is roughly 0.02 Gt C of PIC, mostly CaCO3, as a global average; it is important to note that CaCO3 production will generally occur in blooms and create high spatial and temporal variability (Balch et al., 2005). PIC is believed to represent one quarter of all marine sediments (Broecker and Peng, 1983; Balch et al., 2005; Seibold and Berger, 2017).
There are three main processes or ‘pumps’ which drive ocean-atmosphere carbon fluxes and nutrient cycling, and they are determined by both biotic and abiotic factors (Heinze et al., 1991; Bishop, 2009; Henson, 2020). They can be summarised as:
● A physical/solubility pump: driven by abiotic factors such as solubility, ventilation, and transport.
● A biological soft tissue pump: driven by a mix of abiotic factors and biotic processes such as photosynthesis, respiration, and heterotrophy.
● A calcium carbonate pump: driven by a mix of abiotic and biotic factors.
There is also a fourth pump, though it is generally considered to be part of the biological pump:
● A microbial carbon pump: this describes the production of DOC by microbial processes and can account for 30-50% of marine primary production (Ducklow et al., 1995; Biddanda and Benner, 1997; Jiao et al., 2010; Hansell and Carlson, 2015).
The biological pump describes the processes by which inorganic carbon (carbon dioxide) is fixed in the ocean through photosynthesis and then transported, and potentially sequestered, in the deep ocean (De La Rocha and Passow, 2013). This pump is principally driven by phytoplankton activity, photosynthesis, and respiration. It may be calculated without respiration to estimate Primary Productivity (PP), or also include respiratory requirements to estimate Net Primary Productivity (NPP). NPP is the foundation of the marine trophic chain and is determined by physical processes, such as tidal mixing (Marshall, 1997; Marshall et al., 1997), in addition to localised and regional nutrient concentrations which may limit phytoplankton growth (Parekh et al., 2006; Archer and Jokulsdottir, 2013). Nitrogen, phosphorus, and iron are the most common nutrients limiting phytoplankton growth (Roman and McCarthy, 2010; Zhao et al., 2019).
In the Southern Ocean, phytoplankton growth is limited by the availability of iron, therefore, processes which increase iron availability in the photic zone can increase NPP, the efficiency of the biological pump, and the export of carbon from the atmosphere to the deep ocean (Lavery et al., 2010; Ratnarajah et al., 2014). In the North Sea, in near coastal shallow waters, there is a terrigenous influx of nitrogen (Painting et al., 2018) and higher turbidity due to tidal mixing (Zhao et al., 2019); here light is the limiting factor for NPP (Zhao et al., 2019). Further away from shore in the North Sea, however, tidal mixing infuses nutrients into the surface (photic) waters and nitrogen availability is the limiting factor in NPP (Zhao et al., 2019).
Cetaceans have long been understood to provide a wide range of important ecosystem services (Katona and Whitehead, 1988; Apollonio, 2002; Springer et al., 2003) but techniques to evaluate and valuate specific services relevant to climate change are relatively novel (Lavery et al., 2010; Roman and McCarthy, 2010; Ratnarajah et al., 2016; Chami et al., 2020). Whilst there are a number of different methods with which to valuate ecosystem services, the Common International Classification of Ecosystem Services (CICES) is the most currently accepted for cetaceans (Haines-Young and Potschin, 2018). Using this framework, Cook et al. (2020) state that cetacean ecosystem services fall into the following categories:
● Provisioning:
o Food products (meat, blubber, skin, and intestines).
o Whale bones, teeth, and baleen.
o Oil-based products derived from blubber.
● Regulation and maintenance:
o Enhanced biodiversity and evolutionary potential.
o Climate regulation through carbon sequestration.
● Cultural:
o Tourism (whale watching).
o Music and arts (entertainment).
o Religious and/or sacred.
o Educational.
o Aesthetics.
o Community cohesiveness and cultural identity.
o Existence.
o Bequest.
Whilst provisioning and cultural values are key components of cetacean ecosystem valuation, this paper focuses on cetacean regulation and maintenance ecosystem services for their relevance to climate change mitigation.
In CICES, Cook et al. 2020b) state the valuation methods appropriate for subsets of the regulation and maintenance category:
● Climate regulation (carbon sequestration) – marginal abatement/damage costs.
● Enhanced biodiversity and ecosystem potential – production function or contingent valuation.
● Enhanced primary production – production function or contingent valuation.
These methods evaluate fluxes of marine carbon either as stocks or through facilitating primary production and carbon fixation through photosynthesis. Cetaceans can influence stocks of carbon in living biomass, in ‘whale-falls’, and by facilitating the cycling and mixing of nutrients essential for phytoplankton growth. Valuation of cetacean ecosystem services is then based on carbon market values. Most values provided in research are purely theoretical with no market value, such as the $2 million whale (Chami et al., 2020), as there are limited pathways for cetacean ecosystem services to be included in markets. Given sufficiently robust data, however, cetacean derived carbon could meet the criteria of Standard Setting Organisations (SSOs) for blue carbon accreditation. There are five criteria for SSOs to blue carbon accreditation; baseline, additionality, leakage, permanence, and co-benefits (Ullman et al., 2013).
Climate regulation has been valuated as carbon storage in living biomass (Chami et al., 2020). Large whales can weigh between 30 tonnes to 160 tonnes (Lockyer, 1976), and a 40 tonne grey whale contains roughly 2 t C (tonnes of carbon) (Smith and Baco, 2003). If anthropogenic protection restores cetacean populations, and their stocks of carbon in living biomass, this can reduce the concentration of atmospheric carbon and mitigate climate change. The increase in carbon stocks in cetacean living biomass could be accredited as carbon sequestered and removed from the atmosphere.
Climate regulation has also been evaluated as carbon sequestration through ‘whale-falls’ (Pershing et al., 2010). A grey whale carcass containing roughly 2 t C can provide an equivalent input to benthic habitats of ~2000 years of organic carbon compared to baseline activity (Smith and Baco, 2003). Soft tissues, however, are recycled over approximately 2 years back into trophic chains, shallow waters, and microbial loops (Higgs et al., 2011). Therefore, unless the carcass is transported to waters deeper than 1000m, this carbon will not be considered sequestered; only the skeleton is likely to remain on the benthos for over 100 years (Schuller et al., 2004). If benthic habitats are protected from disturbance, cetacean whale-fall carbon could be sequestered. Restoration of cetacean populations can therefore increase carbon sequestration through whale-falls, reduce atmospheric carbon, and mitigate climate change. The increase of this carbon export to benthic habitats could be accredited, given robust abundance and distribution data, as a probability of mortality and sinking of whale carcasses over protected benthic habitats. This could be as a portion of the entire carcass in waters greater than 1000m, or just the skeletal carbon in depths less than 1000m.
Enhanced biodiversity, evolutionary potential, and primary productivity has been evaluated together as nutrient cycling driving phytoplankton growth and carbon capture (Lavery et al., 2013; Ratnarajah et al., 2014; Ratnarajah et al., 2016; Ratnarajah et al., 2018). Cetacean feeding and excretion facilitates nitrogen retention in the photic zone which supports phytoplankton growth. This vertical cycling of nutrients is known as the ‘whale-pump’ and been noted to enhance NPP in the Gulf of Maine (Roman and McCarthy, 2010). The Gulf of Maine has an average NPP of 290 g C m-2 yr-1 (Townsend, 1998) and primary productivity enhancement from cetacean driven nutrient cycling may recycle 196,000 t N (tonnes of nitrogen) annually (Roman and McCarthy, 2010). Lateral movement of nutrients, notably nitrogen, from high latitude feeding grounds to low latitude calving areas also facilitates phytoplankton growth; this is known as the ‘whale conveyor’ (Roman et al., 2014). Cetaceans may therefore also provide ecosystem services for enhanced biodiversity, evolutionary potential, and primary productivity through the removal and transport of excess nutrients from coastal to offshore waters using valuations for nitrogen and phosphorus removal (Watson et al., 2020).
The whale-pump, cycling iron, has been shown to be self-sustaining in the iron depleted waters of the Southern Ocean. In this environment, cetacean driven nutrient cycling creates a positive feedback loop that increases both phytoplankton and cetacean biomass due to differences in cetacean and planktonic faecal dispersion; planktonic faeces sink into deeper waters and/or the benthos whilst cetacean faeces persist in the photic zone (Lavery et al., 2010). Cetacean nutrient cycling of iron allows a greater amount of carbon to be fixed through phytoplankton growth than is released through cetacean consumption and respiration (Lavery et al., 2014; Ratnarajah et al., 2014; Ratnarajah et al., 2016; Ratnarajah et al., 2018). In the North Sea, nitrogen availability may limit NPP (Zhao et al., 2019) and cetacean driven nutrient cycling might increase nitrogen availability and NPP. The marginal increase in NPP, and carbon fixation, with greater cetacean populations could be accredited as carbon removed from the atmosphere.
The scope of this research is matched to data from the Joint Cetacean Protocol (JCP) (Paxton et al., 2016) used by the Joint Nature Conservation Committee (JNCC) in ‘Management Units for cetaceans in UK waters’ (IAMMWG, 2015). This is the most comprehensive dataset of cetacean abundance and distribution in Europe and the result of larger SCANS (Small Cetaceans in European Atlantic waters and the North Sea) surveys (Hammond, 2006; Hammond et al., 2009; Hammond et al., 2018). Within the survey area, JCP data include abundance and distribution estimates for harbour porpoise (Phocoena phocoena), Atlantic white-sided dolphin (Lagenorhynchus acutus), short-beaked common dolphin (Delphinus delphis), white-beaked dolphin (Lagenorhynchus albirostris), bottlenose dolphin (Tursiops truncates), and minke whale (Balaenoptera acutorostrata). Average mass values and total population estimates for the survey area are detailed in Table 1. The survey area is shown in Figure 1.

Table 1 JCP population sizes and average mass values.
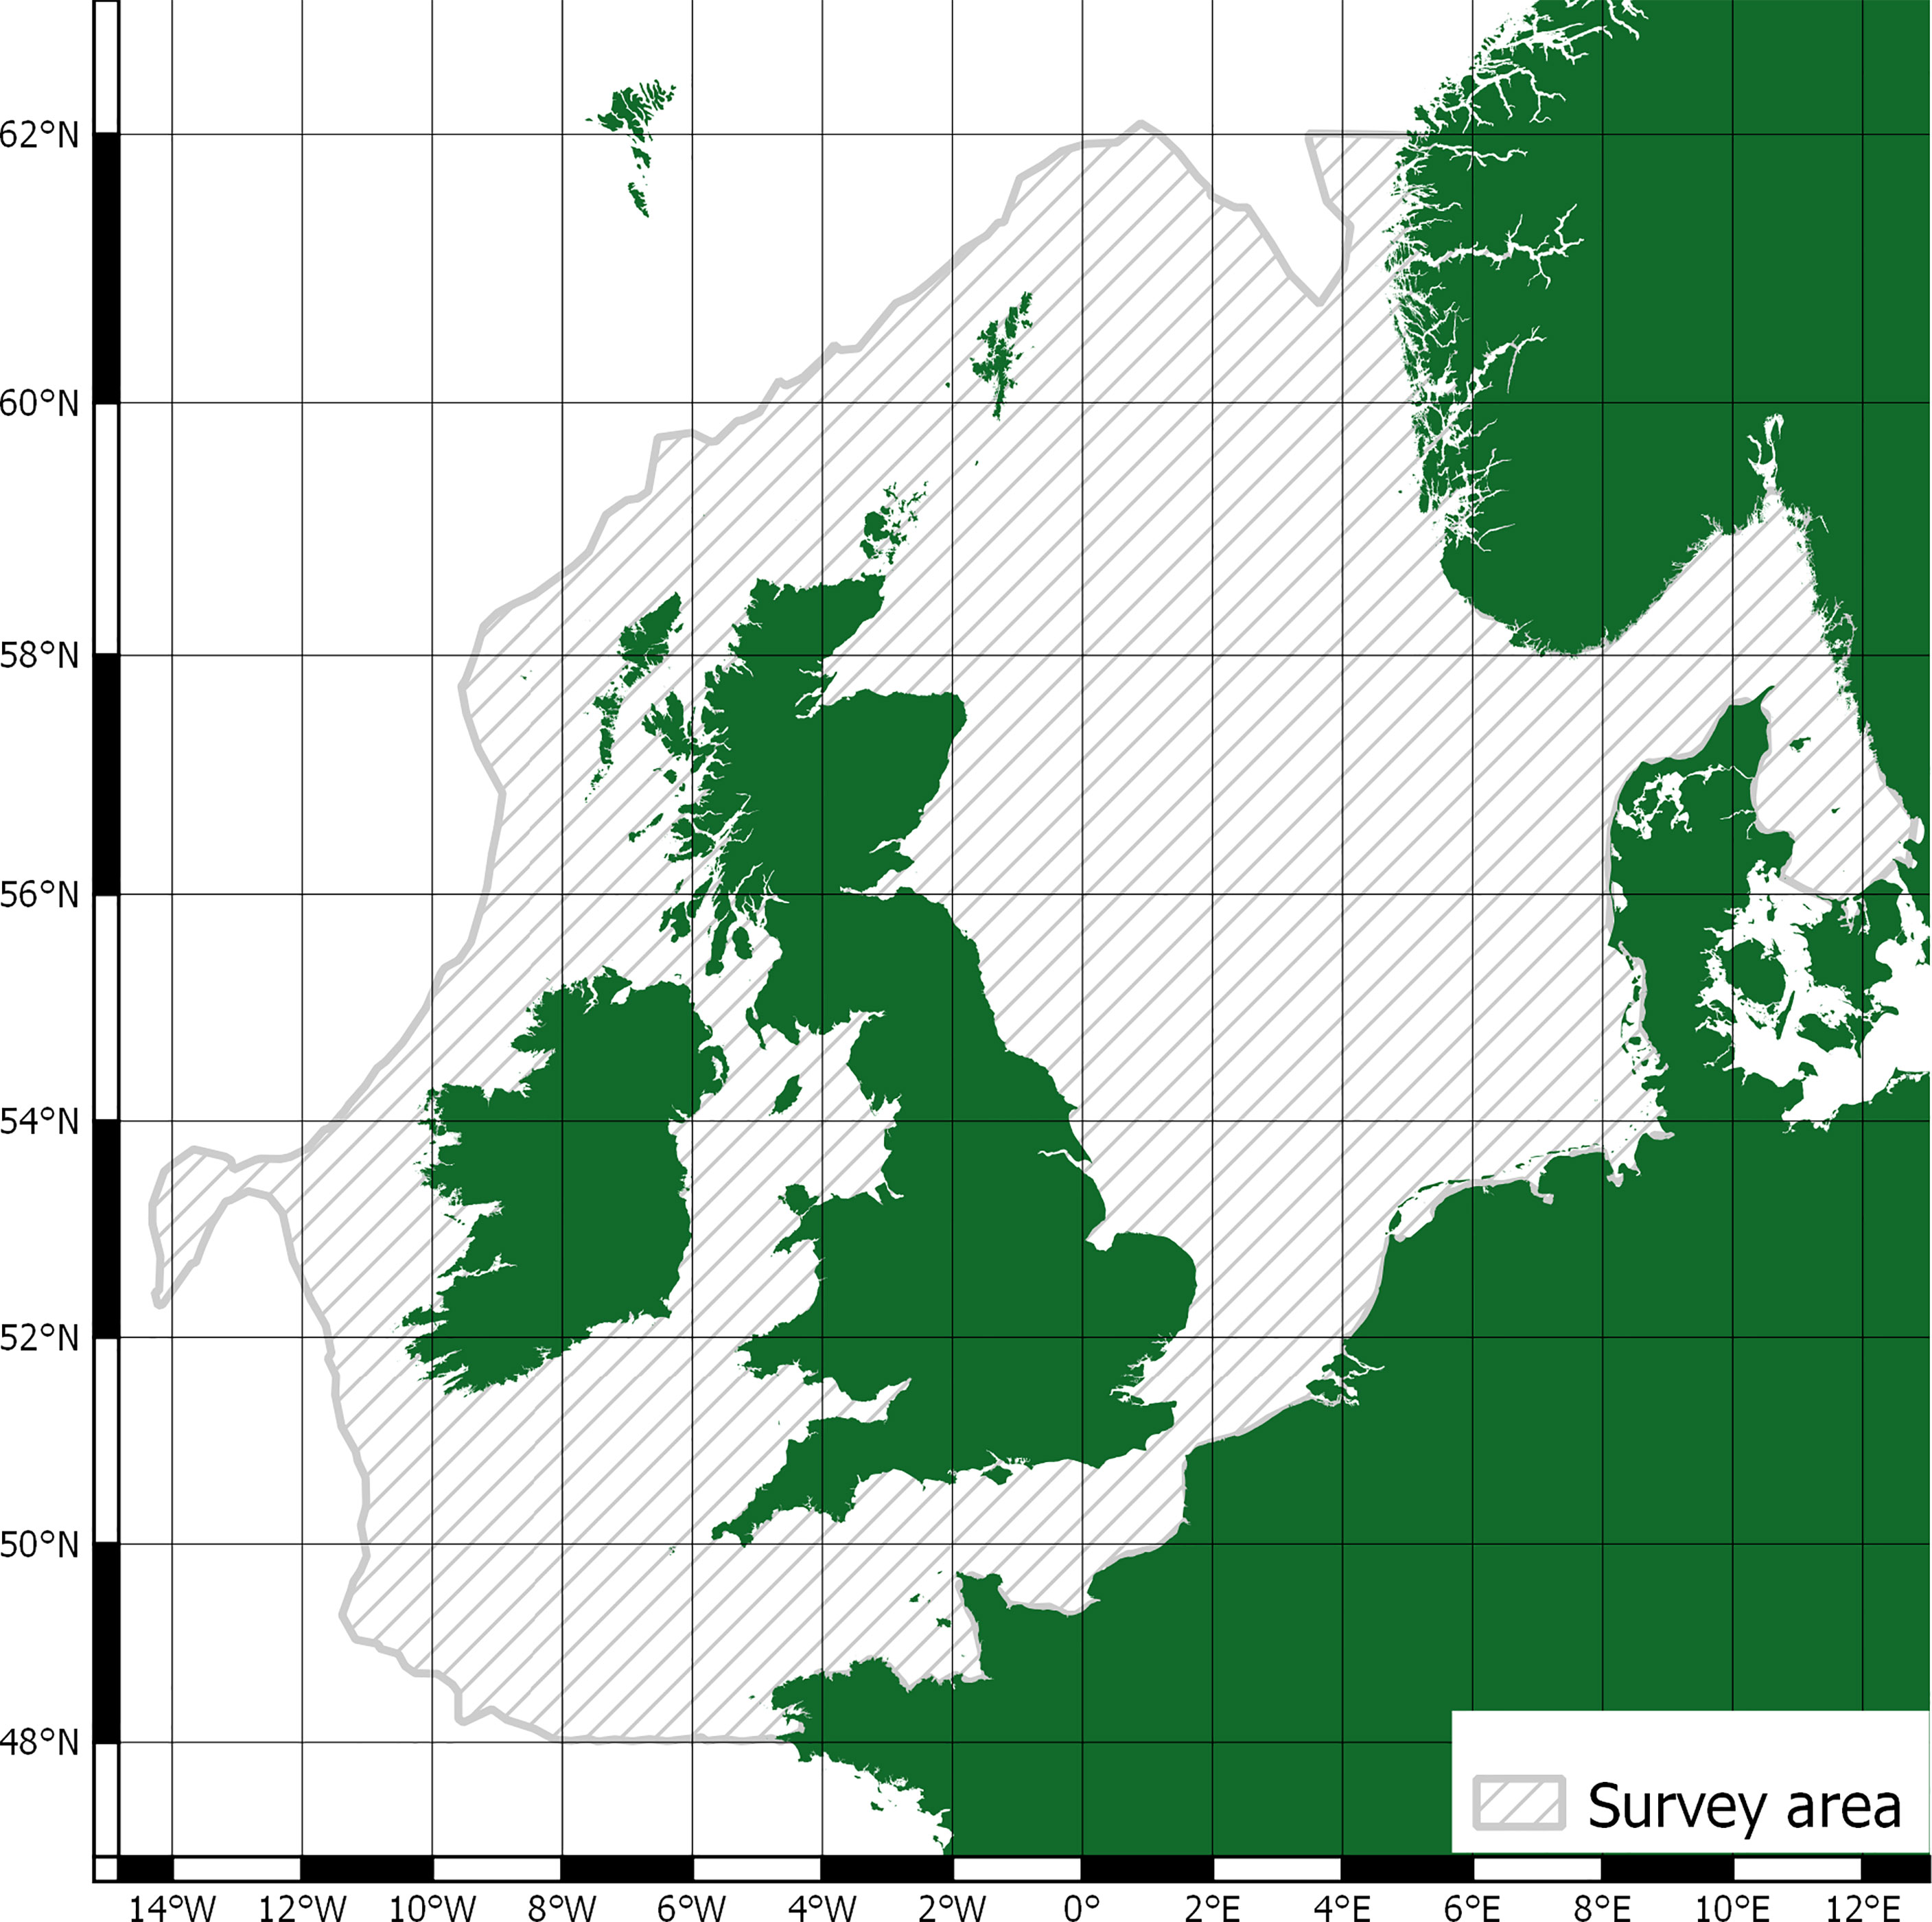
Figure 1 Survey area.
The survey area includes both the North Sea, Skagerrak, and the Celtic sea; it encompasses a total area of 1.09 million km2 (Paxton et al., 2016). Whilst the survey area overlaps with the territorial waters of France, Belgium, the Netherlands, Germany, Denmark, Sweden, and Norway, it’s predominantly relevant to UK and Ireland waters. Provisioning as a cetacean ecosystem service is closely tied to localised cultural values and practices (Donovan, 1982; Simmonds et al., 2002; Kenny et al., 2018) and there is no consumption of whales for food in the UK and Ireland. With regards to other provisioning uses, they are of limited use in a modern context and/or replaced with other, and cheaper, alternatives (Cook et al., 2020b). Cetacean cultural values have been much studied (Cook et al., 2020b; Malinauskaite et al., 2021a) but there are limited data relevant to the UK or Ireland (Parsons et al., 2003; O’Connor et al., 2009a). As such, this study focuses on cetacean regulation and maintenance ecosystem services for their relevance to climate change, and reviews evaluative and valuative methods through application to JCP abundance and distribution estimates.
The CICES regulation and maintenance category is evaluated and tentatively valuated based on cetacean derived carbon through:
● Stocks in cetacean living biomass.
● Cetacean driven nutrient cycling enhancing PP.
● Cetacean driven nutrient cycling enhancing NPP.
This paper does not attempt to evaluate or valuate whale-falls as there are no depths exceeding 1000m in the study area, see Figure 2. Therefore, only skeletal carbon could be considered sequestered in the study area. Unfortunately, whilst there is literature on cetacean skeletal compositions (Tont et al., 1977; Lees and Escoubes, 1987; Higgs et al., 2011), there is no clear detailing of cetacean skeletal carbon content. There are therefore insufficient data on carbon content of cetacean skeletons to infer any meaningful analysis. Additionally, whilst there are protected areas within the survey area, it is unclear on the level of benthic protection they offer (Dunckley and Solandt, 2021).
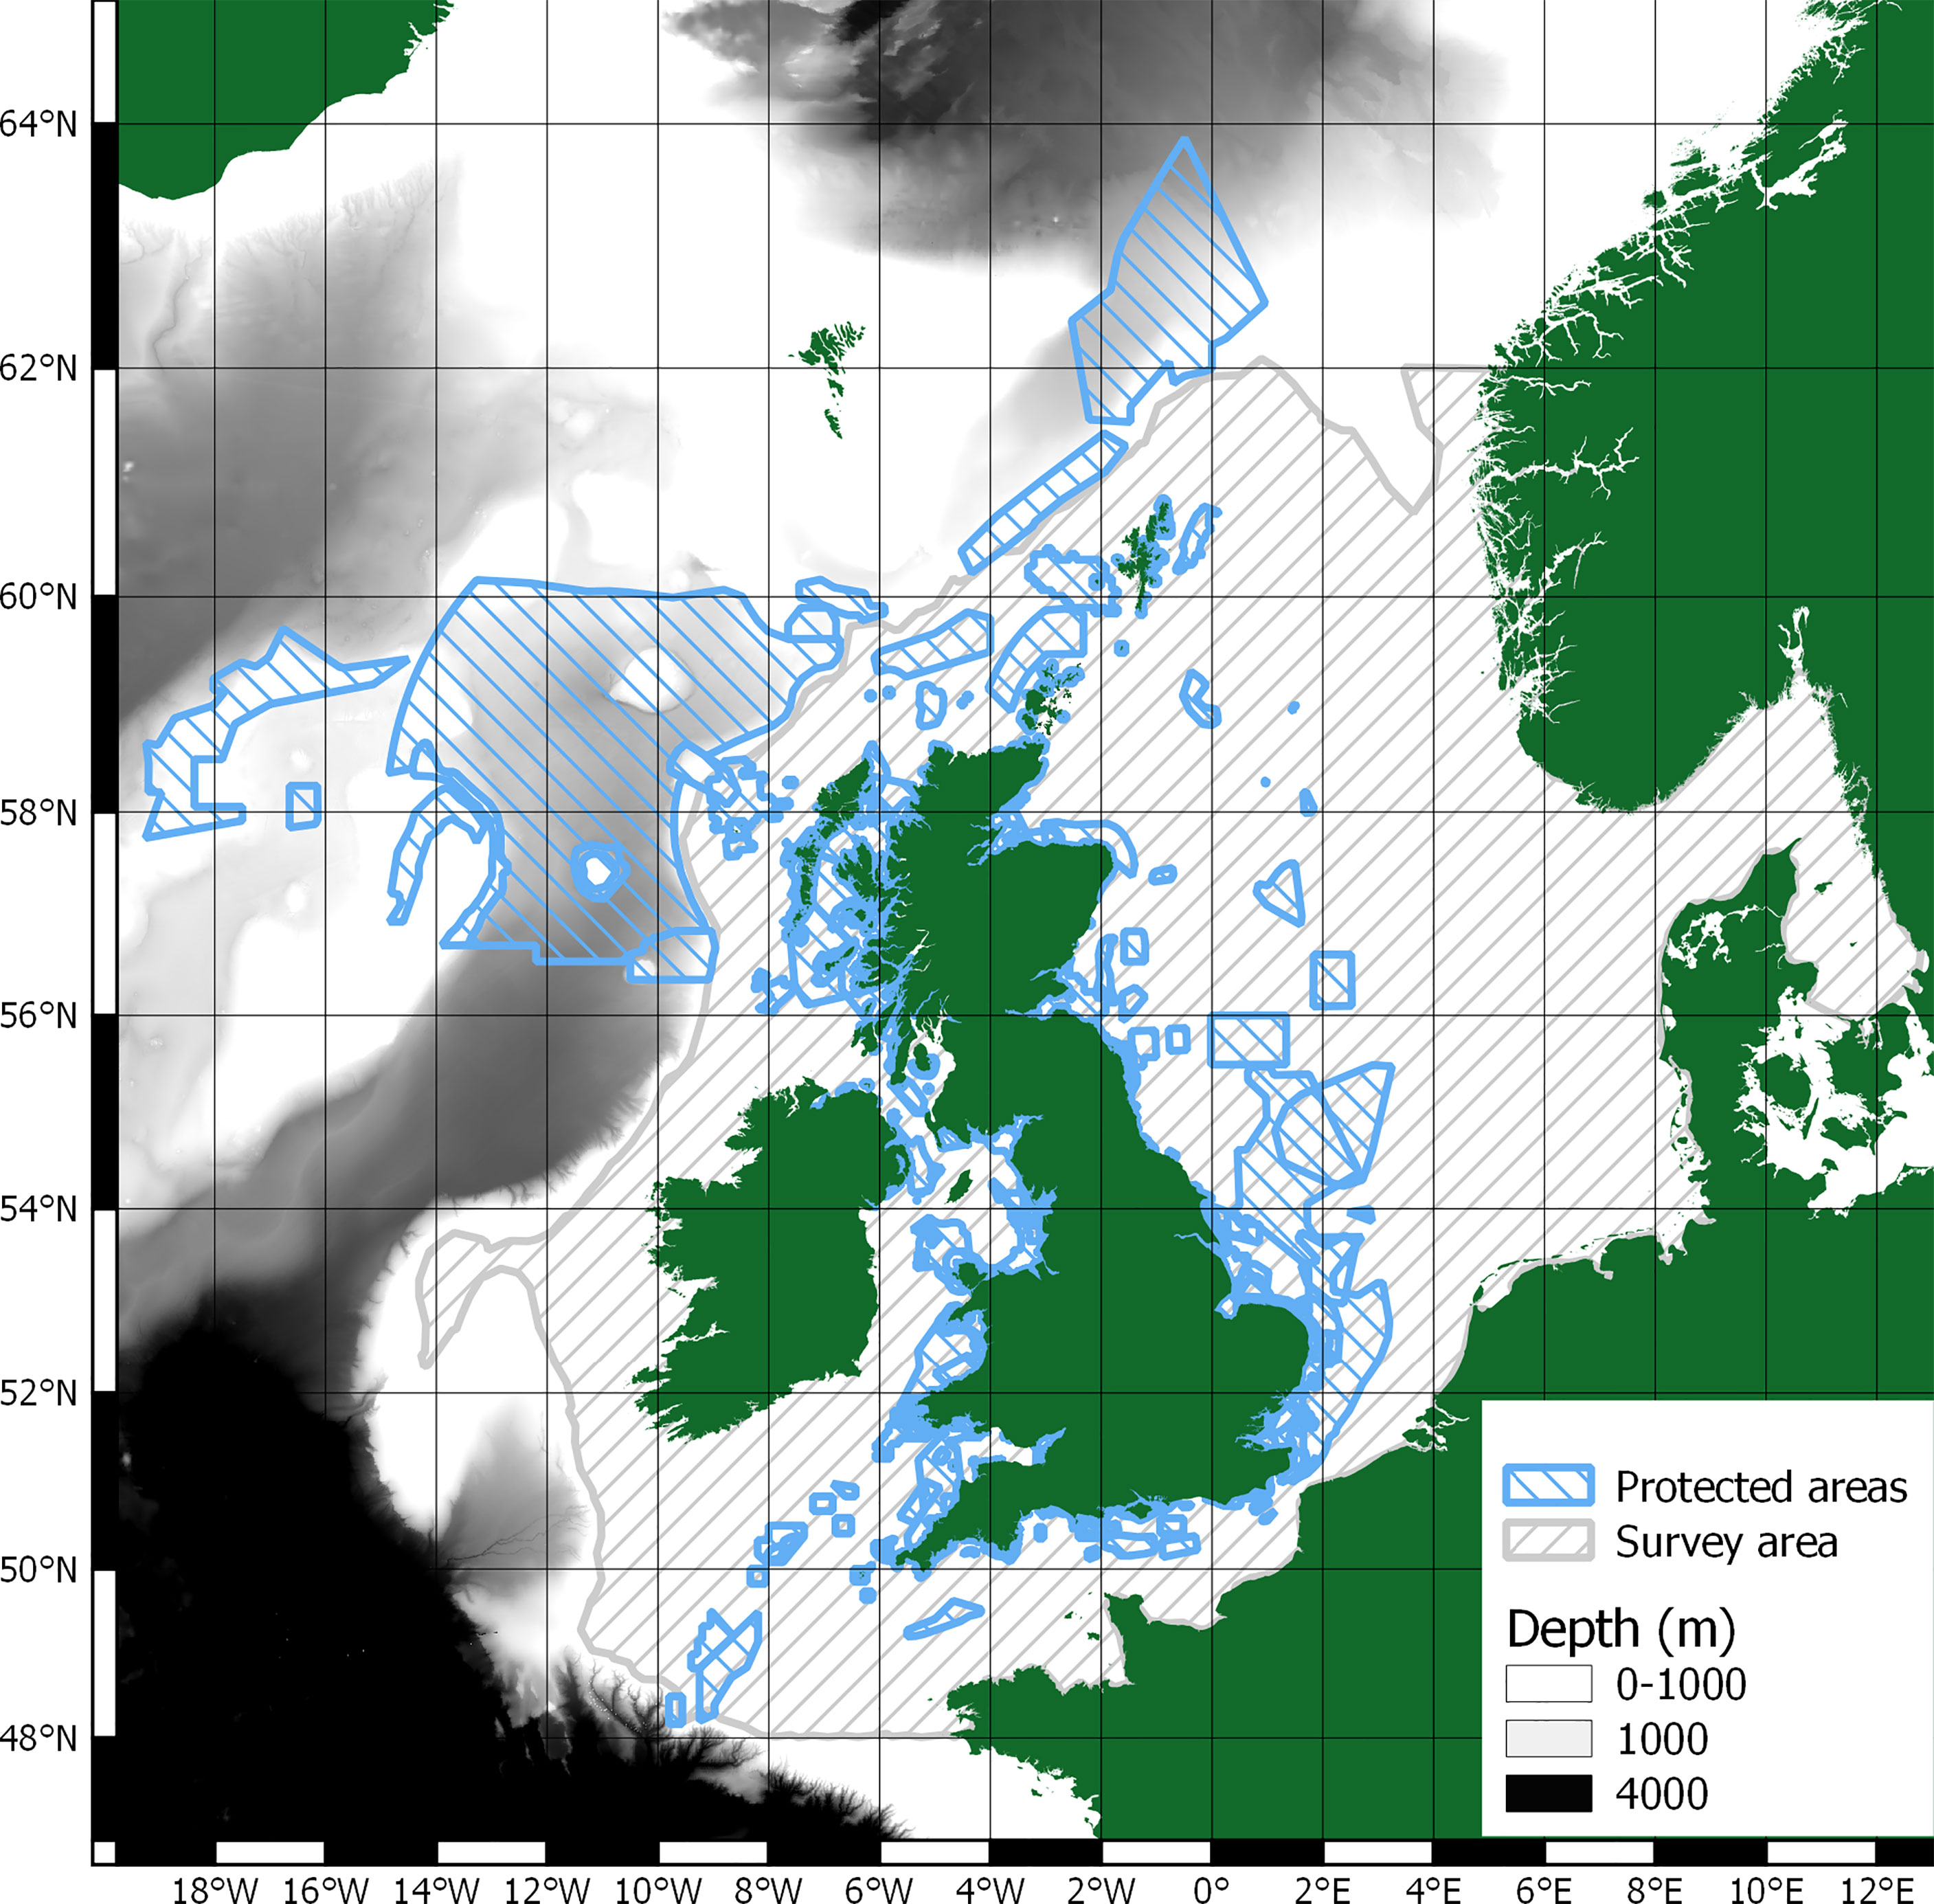
Figure 2 Survey area, protected areas, and >1000m depth bathymetry.
This paper does not attempt to valuate cetacean ecosystem services through removal of nitrogen from near coastal waters. Whilst this may form an important part of cetacean regulation and maintenance ecosystem services, the JCP data don’t detail cetacean abundance and distribution at a sufficient resolution to accurately detail their impact on near coastal nutrient cycling and nutrient removal.
Benefits to fisheries due to cetacean driven nutrient cycling increasing NPP are also not valuated in this study as by Chami et al. (2020). There are insufficient data to support analysis of correlations between fisheries value due to cetacean driven nutrient cycling and cetacean abundance and distribution. In this study potential benefits to fisheries from cetacean driven nutrient cycling on NPP are determined to already be incorporated into fisheries value, even if they are not, as yet, quantified.
This paper is framed with the following research questions:
● What are the current stocks, and potential value, of carbon in cetacean living biomass in the survey area?
● What are the estimates, and potential value, of cetacean driven nutrient cycling enhancing PP?
● What are the estimates, and potential value, of cetacean driven nutrient cycling, including cetacean consumption and respiratory requirements, enhancing NPP ?
● What is needed to translate these potential values into market values?
● Can these estimates, and potential values, be used to inform MSP processes?
To give context to the cetacean regulation and maintenance ecosystem services in determining marine carbon stocks and fluxes, estimates for ecosystem services in the survey area are provided here for reference. Whilst the survey area used in this study encompasses a total area of 1.09 million km2 (Paxton et al., 2016), there are limited data that use these same parameters. As such, average measurements for other areas, within the survey area, are extrapolated to the whole survey area used in this study:
● 1.82 Mt C (million tonnes of carbon) of fish biomass in the survey area, extrapolated from an average 1.67 g C m-2 in fish biomass. This was calculated from 10 Mt of fish biomass in a 750,000 km2 area of the North Sea and Skagerrak (Walday and Kroglund, 2008), and an average 12.5% carbon in fish biomass (Mariani et al., 2020).
● 2.18 Mt C of benthic biomass in the survey area. This was calculated from average North Sea benthos of 2 g C m-2 (Barrio Froján et al., 2012; Zhang et al., 2019).
● An average 315,000 t N yr-1 of total terrigenous inputs to the survey area. This was calculated from terrigenous North Sea nitrogen inputs of 150,000 t N yr-1 to 230,000 t N yr-1 and Celtic Sea terrigenous inputs of 100,000 t N yr-1 to 150,000 t N yr-1 (Painting et al., 2018).
● 255.06 Mt C yr-1 of NPP, extrapolated from average North Sea NPP of 234 g C m-2 yr-1 (Capuzzo et al., 2018).
● An average 10.45 Mt C yr-1 of NPP due to physical tidal mixing in the survey area, extrapolated from North Sea values which range from -40 g C m-2 yr-1 to +60 g C m-2 yr-1 (Zhao et al., 2019).
This section describes the evaluative and valuative methods used for cetacean ecosystem services through:
● Carbon stocks in cetacean living biomass.
● Cetacean driven nutrient cycling removing nitrogen.
● Cetacean driven nutrient cycling enhancing PP.
● Cetacean driven nutrient cycling enhancing NPP.
Cetacean average mass values are used to calculate carbon storage through living biomass and for nutrient cycling potential based on daily energy requirements and daily rations. Values are used in line with other literature (Barlow et al., 2008; Pershing et al., 2010), and extrapolated from the population age distribution model used by Lavery et al. (2014) where these data are not available.
Data extrapolated from Lavery et al. (2014) are based on average mass of population subsets and the proportional structure of those subsets within the population. Demographic parameters of cetacean populations can be found in other literature (Pershing et al., 2010), but only Lavery et al. (2014) and Mackintosh and Wheeler (1929) provide mass data for proportional subsets of cetacean populations; Lavery et al. (2014) model their population structure on the model used by Mackintosh and Wheeler (1929). These values are also used due to the absence of more relevant data for cetaceans included in this study and survey area. To derive average mass values, the mass and proportions of each population subset in a stable population were averaged. A conversion factor to adjust adult female mass2 to average population mass value, to match data in Lavery et al. (2014), was then calculated. The conversion factor was calculated as 0.7241 to adjust the blue whale adult female mass of 120,000kg to the average blue whale population mass of 86,900kg. Adult mass values are taken from those most relevant to the UK where available (WDG, 2021a; WDG, 2021b) then rounded down to the nearest ten for simplicity. This gives values similar to average mass for species detailed in current literature (Barlow et al., 2008; Pershing et al., 2010). Bottlenose dolphin populations are known to differ in size between coastal and offshore populations but are treated here as one uniform population to standardise it to JCP cetacean distribution and abundance data (Paxton et al., 2016).
Average mass values of cetacean species, and their population size distributed across the study area are detailed in Table 1.
Wet weight biomass is first converted to dry weight biomass. Dry weight biomass is taken to be 40% of wet weight (Jelmert and Oppen-Berntsen, 1996; Pershing et al., 2010) and further comprised of:
● 20% protein, with a carbon content of 54%.
● 20% fat, with a carbon content of 77%.
Stocks of carbon in living biomass are evaluated as:
Stocks of carbon were summed to give population totals per species, in addition to a cumulative value for all cetacean species included in this study. Stocks of carbon in living biomass were mapped to JCP distribution and abundance data to highlight spatial variability.
This is evaluated as the amount of nitrogen recycled through cetacean feeding and excretion. This is calculated based on cetacean average mass values, dietary requirements, nitrogen content within prey, and the ratio of retained nitrogen. From this, the increased potential carbon fixation due to phytoplankton growth that may occur from the replenishment of recycled nitrogen is evaluated.
There are a number of ways to calculate dietary requirements, often referred to as annual consumption of wet weight (Lockyer, 1981; Trites and Pauly, 1998; Reilly et al., 2004; Barlow et al., 2008; Lavery et al., 2014). Models either estimate the average daily ration directly (kg of wet weight) or calculate them from estimates of Average Daily Metabolic Requirements (ADMR in kJ d-1) (Barlow et al., 2008). ADMR is often modelled from Basal Metabolic Rate (BMR in kJ d-1) and cetaceans, as homeotherms, have a BMR related to their average mass using the Kleiber function (Kleiber, 1975):
● M – average mass.
● A – A value.
● B – B value.
The Kleiber function uses A and B values of 293.1 and 0.75 respectively. Other studies, however, may adjust these values to be more specific to marine mammals and/or to adjust from metabolic requirement values taken from animals in captivity; this may be referred to as the Field Metabolic Rate (FMR in kJ d-1) (Barlow et al., 2008). Various values for A and B used in literature include:
● A = 0.1, B = 0.8 (Trites and Pauly, 1998).
● A = 0.42, B = 0.67 (Lavery et al., 2014).
● A = 1.66, B = 0.556 (Reilly et al., 2004).
● A = 70.5, B = 0.7325 (Lockyer, 1981).
● A = 80, B = 1 (Blix and Folkow, 1995).
● A = 863.6, B = 0.783 (Sigurjónsson and Víkingsson, 1997).
● A = 2529.2, B = 0.524 (Boyd, 2002).
Other models use the standard A and B values as used in the Kleiber function, 293.1 and 0.75, then adjust the total BMR by 2.5 or 3 times; these models are known as 2.5BMR and 3BMR respectively. The 3BMR using the Kleiber function (Kleiber, 1975) was used in this study. This is believed to be the most accurate (Barlow et al., 2008; Roman and McCarthy, 2010) and provides values in a mid-range of the other models using alternate adjustment factors (Kenney et al., 1997; Costa and Williams, 1999; Hooker et al., 2002; Laidre et al., 2004; Croll et al., 2007) and A and B values (Trites and Pauly, 1998; Reilly et al., 2004; Lavery et al., 2014). This method also aligns with existing research on nitrogen cycling from cetacean ecosystem services (Roman and McCarthy, 2010).
3BMR is then the daily ration adjusted to provide an ADMR/FMR:
The ADMR/FMR was then divided by the energy provided in kJ per kg of prey (Leaper and Lavigne, 2007; Barlow et al., 2008). This converts the ADMR/FMR into a daily required wet weight of food; energy content of prey is generally accepted as 5450 kJ kg-1 for fish and squid and 3900 kJ kg-1 for crustacea. Given data constraints, with no further data on nitrogen composition of cetacean prey, it is assumed that cetacean diets are composed solely of zooplankton, squid, and/or fish. An additional assimilation efficiency of 80% was used to account for energetic losses in consumption (Leaper and Lavigne, 2007; Barlow et al., 2008). Annual consumption of wet weight (Q) was calculated as:
● dz – the proportion of dietary zooplankton.
To derive the faecal nitrogen concentrations, based on other literature (Roman and McCarthy, 2010), it is assumed that
● 80% of ingested nitrogen is metabolised and excreted.
● Fish and crustaceans are approximately 15% protein, which is 17% nitrogen by weight.
All consumption is deemed to be compositionally similar between prey; fish and crustaceans. Faecal nitrogen was calculated as:
● Nd – the total annual amount of defecated nitrogen (dry weight) (kg yr-1).
● Q – the total annual prey consumption in wet weight (kg yr-1).
● 0.8 – adjustment for metabolic efficiency.
● 0.15 – the proportion of weight as protein.
● 0.17 – the proportion of protein as nitrogen.
This calculates the replenishment of nitrogen from cetacean recycling that may be used to enhance primary productivity.
The dry weight of faecal nitrogen was then used to calculate the amount of carbon fixation:
● Cfixed – the carbon fixed by phytoplankton primary productivity generated by nutrient cycling (kg C ind-1 yr-1).
● Nd – the total annual amount of defecated nitrogen (dry weight) (kg N ind-1 yr-1).
● MN – the molecular mass of nitrogen equal to 14.0067 (g mol-1).
● MC – the molecular mass of carbon equal to 12.011 (g mol-1).
● r is the uptake ratios of C:N from available literature. The Redfield ratio states C:N:P ratios as 106:16:1 (Biddanda and Benner, 1997). This is equal to 6.625 (mol mol-1).
Fluxes of carbon from cetacean driven nutrient cycling driving Primary Productivity (PP) are evaluated as:
Carbon fluxes were summed and mapped to JCP distribution and abundance data as with carbon stocks in living biomass.
The Modified Surplus-Yield (MS-Y) model (Lavery et al., 2014) has been used to evaluate the differences in cetacean activity enhancing Primary Productivity (PP) against the Primary Productivity Requirements (PPR) of the cetaceans for consumption and respiration. This model was based on iron in the iron depleted waters of the Southern Ocean. In this study, we adapt that model from iron, to nitrogen, to create a Nitrogen Modified Surplus-Yield (N MS-Y) model. It is summarised as:
If N MS-Y is positive, it suggests cetacean driven nutrient cycling fixes more carbon through PP than they remove through nutritional requirements. If negative, it suggests cetaceans provide an ecosystem disservice and contribute to atmospheric carbon emissions. Negative values may, however, also highlight the transport and removal of nutrients, and/or highlight data gaps for cetacean driven nutrient cycling. The differences between carbon fixation and release are valuated based on carbon value.
PP is calculated using the same process detailed previously.
PPR was calculated from dietary requirements the same as for the PP. In conjunction with this, PPR is the sum of the total prey consumed by cetaceans at trophic levels, the carbon content of prey, and the trophic transfer efficiency between trophic levels (Pauly and Christensen, 1995; Trites and Pauly, 1998; Barlow et al., 2008).
The prey proportions of the species detailed in this study are taken from Pauly et al. (1998), as in Barlow et al. (2008), and adjusted where necessary for UK species3. They are detailed in Table 2.
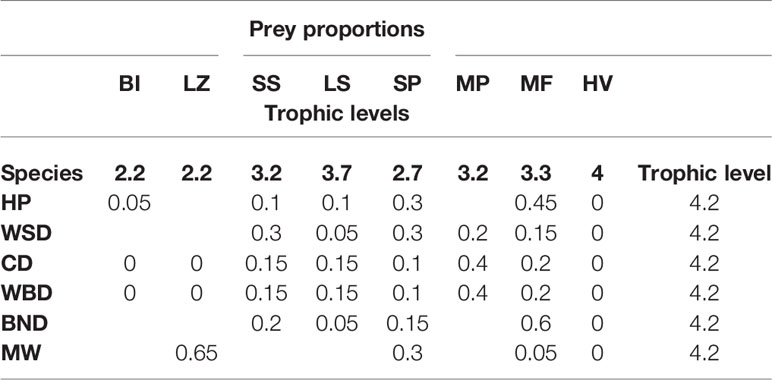
Table 2 Cetacean dietary prey proportions and trophic levels.
The eight prey categories are abbreviated as:
● BI – benthic invertebrates.
● LZ – large zooplankton.
● SS – small squid.
● LS – large squid.
● SP – small pelagic fish.
● MP – mesopelagic fish.
● MF – miscellaneous fish.
● HV – higher vertebrates.
PPR was then calculated as the sum of all individual species’ PPR:
● PPRi – calculated for each species (i) (kg C yr-1).
● Qi – the total prey consumption in wet weight per species (kg yr-1).
● di,g – the proportion of prey (g) in the diet (d) of species (i).
● cg – the dry weight proportion of carbon (c) per wet weight of each prey group (g), equal to 0.11 (Pauly and Christensen, 1995; Barlow et al., 2008).
● Te – the trophic transfer efficiency, equal to 0.1 (Barlow et al., 2008).
● Lg – the trophic level of the prey category.
The final calculation for the N MS-Y model is:
● N MS-Y – the difference in carbon fixation and consumption (kg C ind-1 yr-1).
Stocks of carbon from cetacean driven nutrient cycling driving PP against PPR are evaluated as:
Carbon fluxes were summed and mapped to JCP distribution and abundance data as with carbon stocks in living biomass and cetacean driven nutrient cycling enhancing PP.
Cetacean regulation and maintenance ecosystem services are all tentatively valuated through their estimated impacts on carbon stocks. Carbon is converted to CO2 with a conversion factor of 11/3 (Chami et al., 2020). CO2 values are taken as for 2010 to match available data (Paxton et al., 2016); 2010 value was £13 tCO2e (DECC, 2011). They are then standardised to 2020 US$ in line with National Ecosystem Assessment (NEA) guidelines (UK NEA, 2014). 2010 conversion value from £ to $ was 1.55 (ofx.com, 2019). Inflation was accounted for over this period4 with a factor of 1.19 (Inflation Calculator, 2016). Values are applied to individuals per species, then summed for total population values, in addition to a combined total population value.
Living biomass carbon stocks per individual per species are valuated as:
Stocks of carbon from cetacean driven nutrient cycling driving PP per individual per species are valuated as:
Stocks of carbon from cetacean driven nutrient cycling in the N MS-Y model per individual per species are valuated as:
Carbon stocks in cetacean living biomass, and potential value, is detailed in Table 3 and shown in Figure 3.
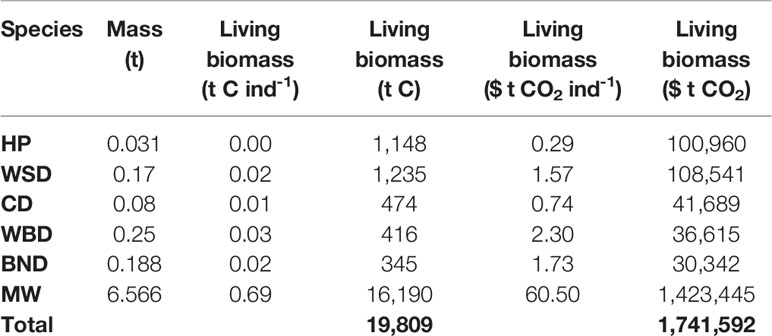
Table 3 Stocks and valuations of carbon in living biomass.
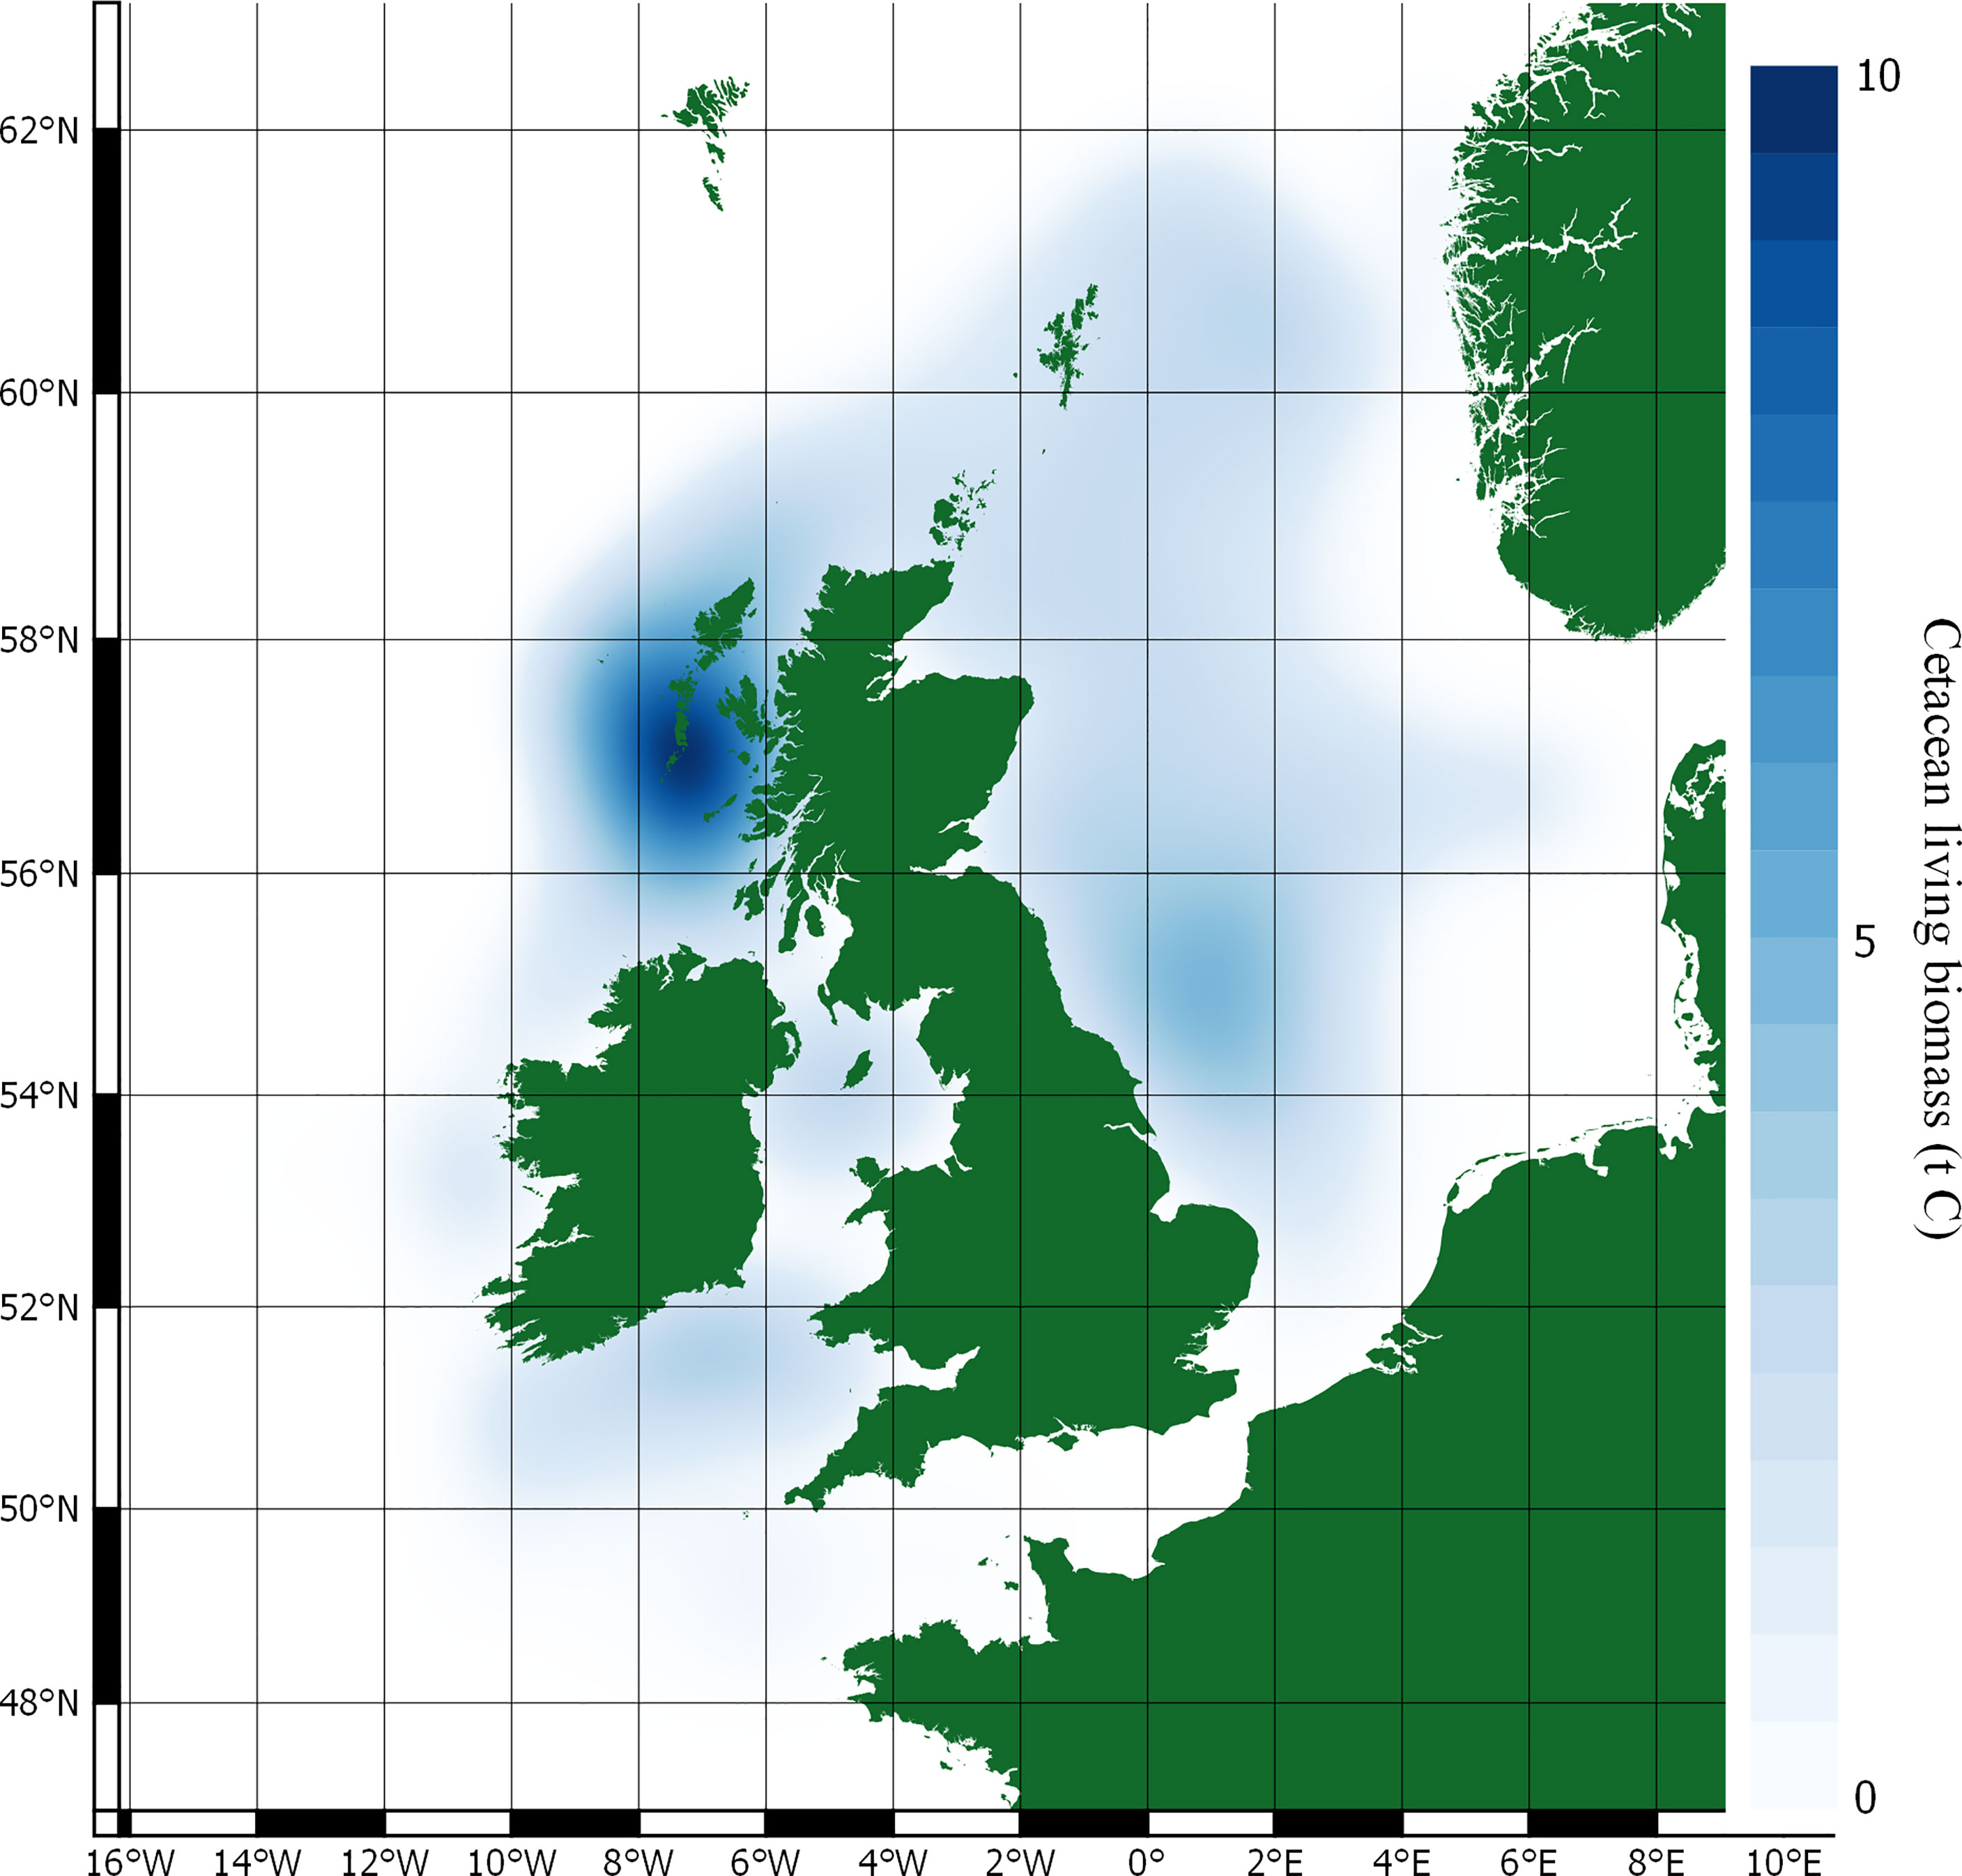
Figure 3 Carbon stocks in cetacean living biomass.
Stocks of carbon in cetacean living biomass total 19,809 t C. This is dominated by minke whales, which account for 82% of all cetacean carbon stocks in living biomass in JCP data. Carbon stocks in cetacean living biomass are greatest to the west of Scotland and around the Outer Hebrides. Whilst being generally spread around the total distribution range, there are additional concentrations of cetacean carbon stocks to the east of England, around the Isle of Man, and to the west of Wales.
Carbon fluxes driven by cetacean nutrient cycling are detailed in Table 4 and shown in Figure 4. The potential value of carbon in these fluxes is detailed in Table 5.
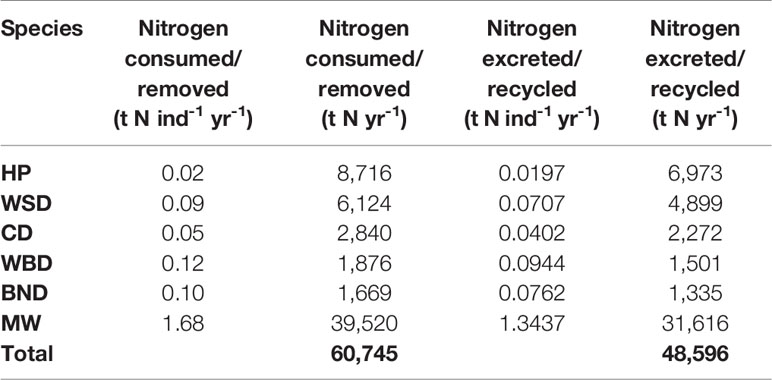
Table 4 Cetacean driven nitrogen fluxes.
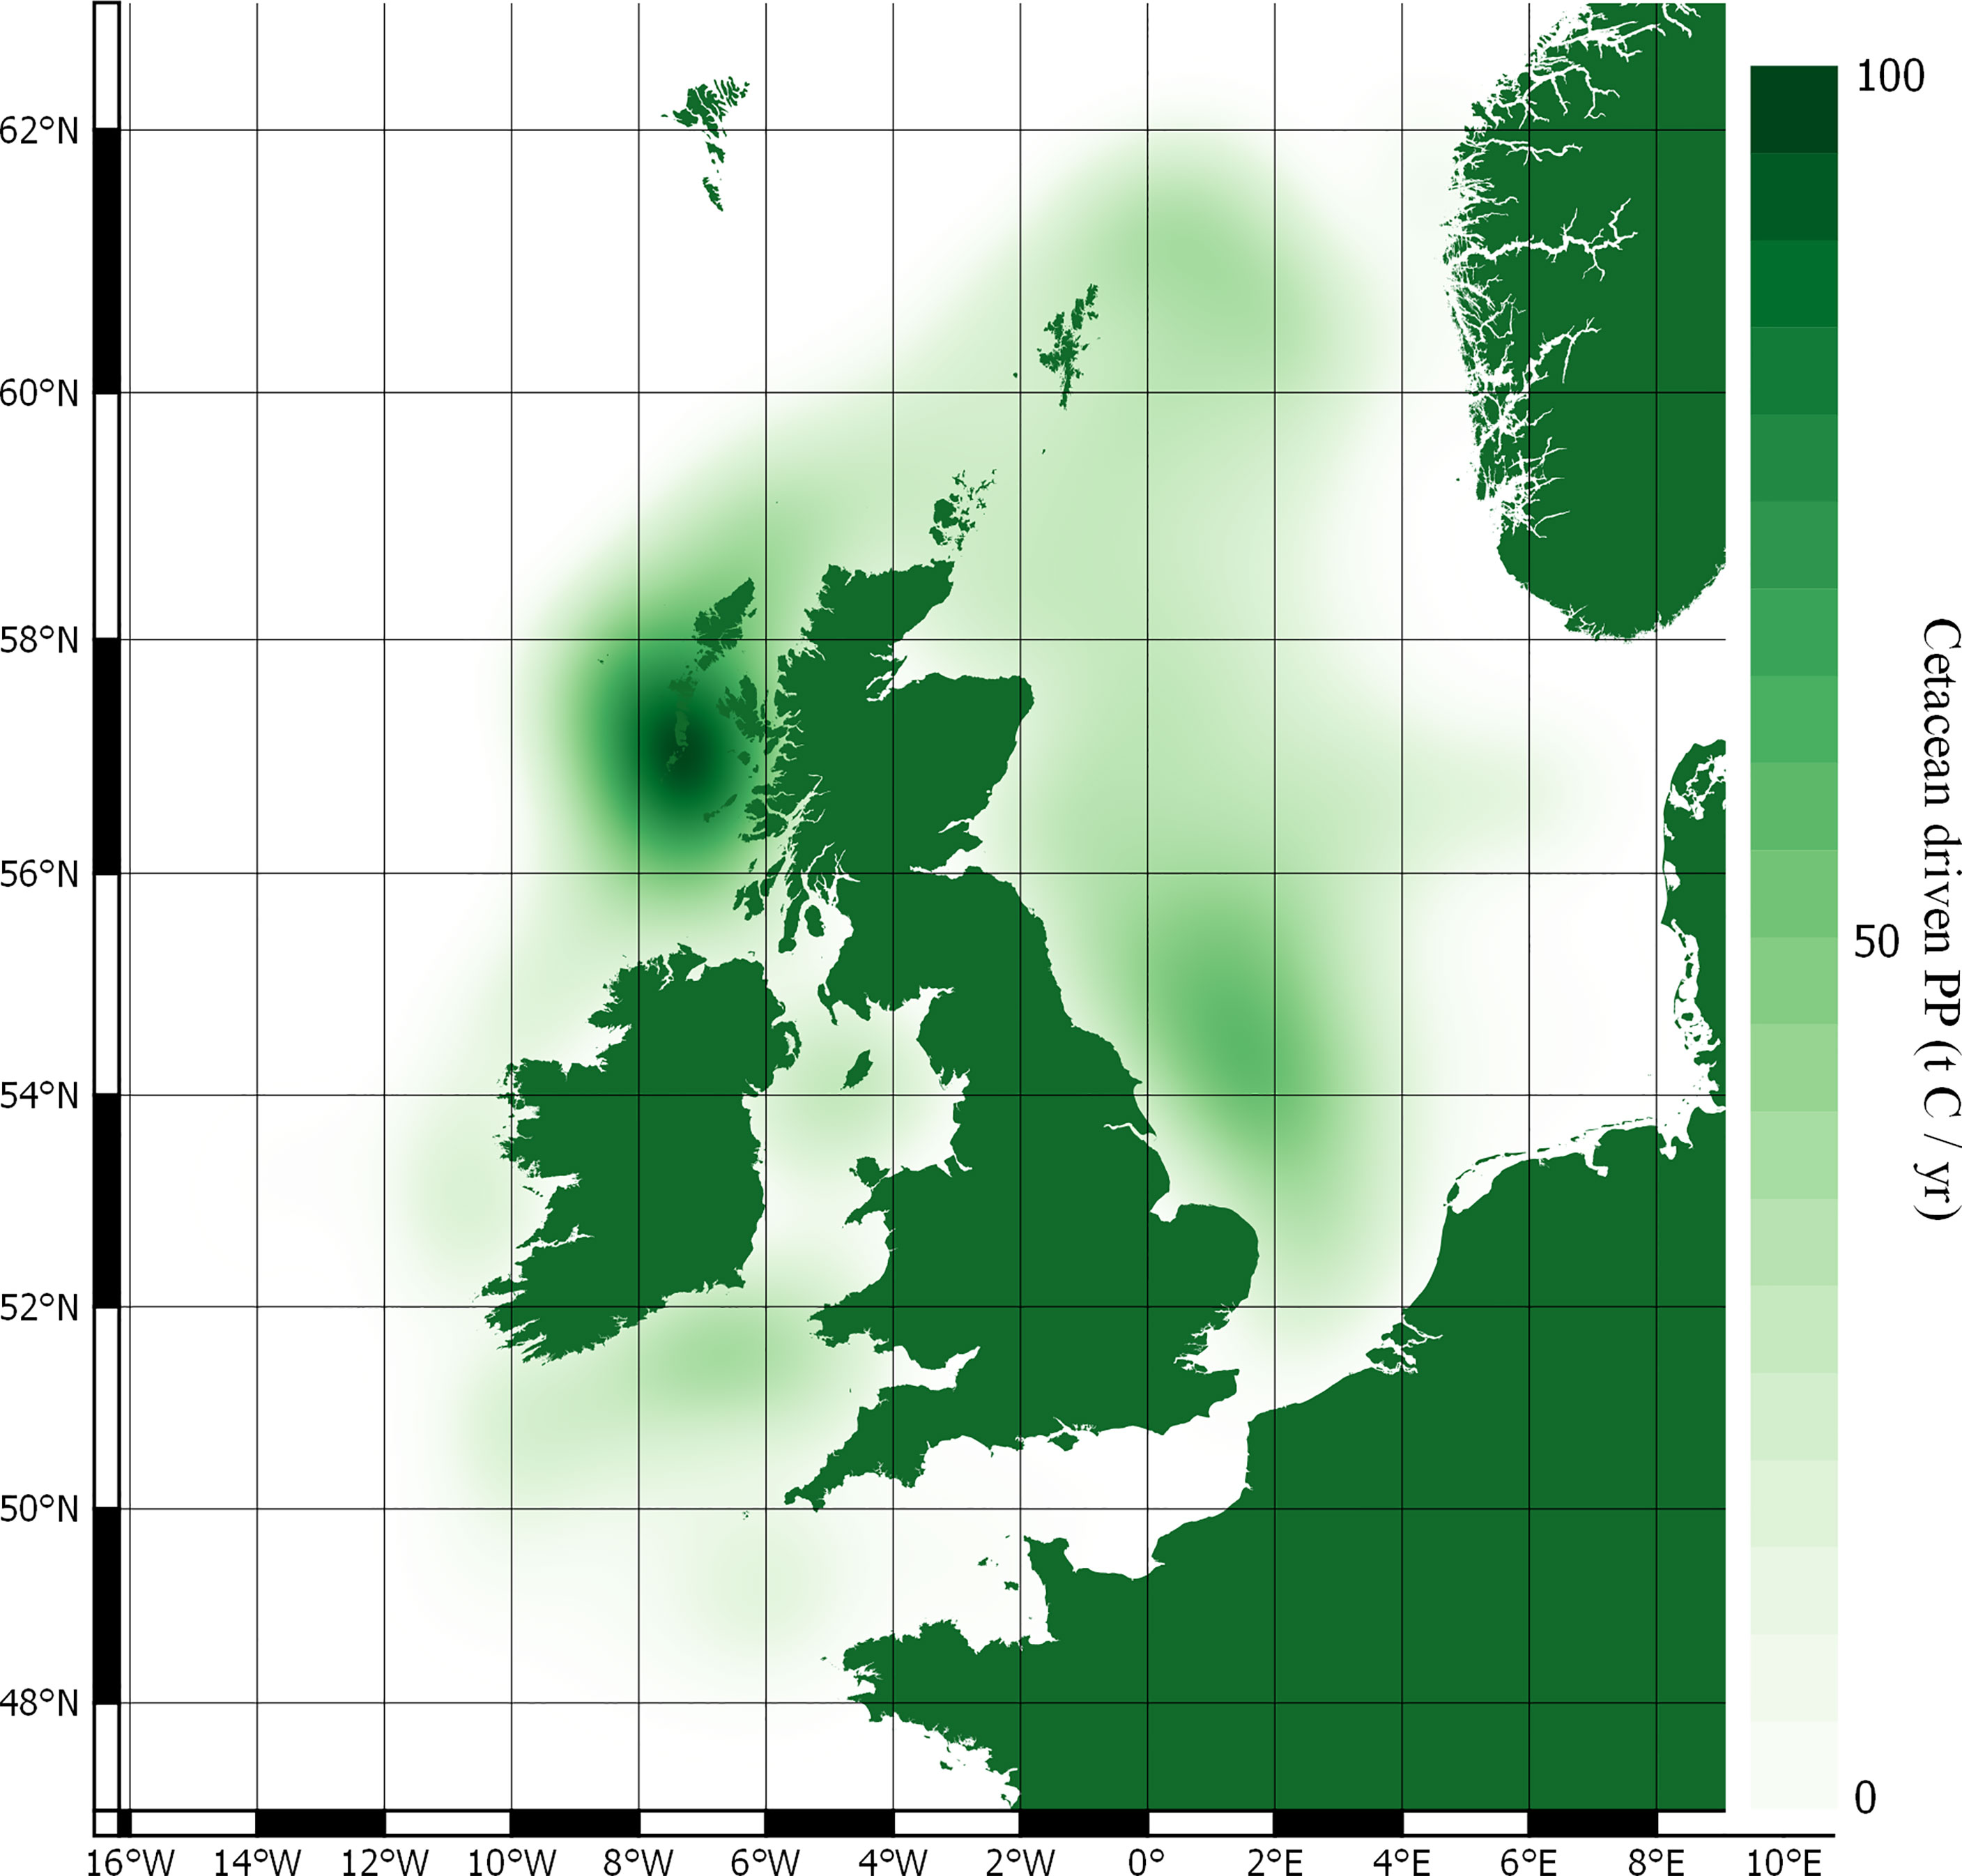
Figure 4 Cetacean driven PP carbon fluxes.
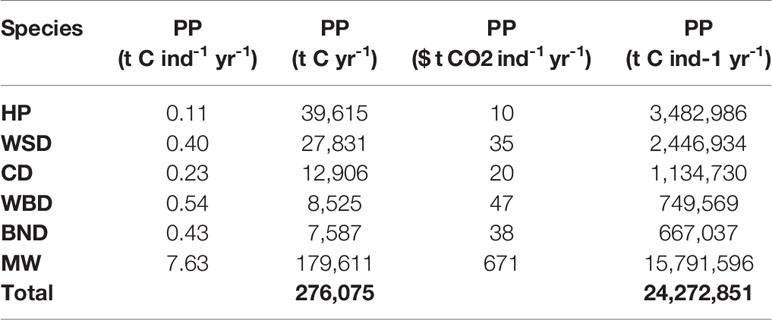
Table 5 Cetacean driven primary productivity and valuations.
The total nitrogen taken up by cetaceans is equal to 60,745 t N yr-1. The total nitrogen recycled back into the environment is 48,596 t N yr-1. Converting this into potential benefits to PP, equates to a total of 276,075 t C yr-1 across the survey area. The minke whale population accounts for 65% of this estimate. Carbon fluxes are mostly concentrated around the Outer Hebrides, but other key areas can be found west of Wales, along the east coast of England, and to the north-east of the Shetland Islands.
Carbon fluxes driven by cetacean nutrient cycling are detailed separately for PP and PPR in Table 6. Carbon fluxes using the N MS-Y model are detailed, with their potential values, in Table 7. Carbon fluxes using the N MS-Y model are shown in Figure 5.
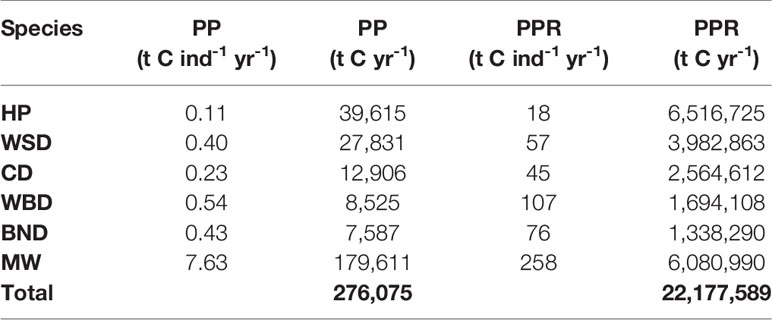
Table 6 Cetacean driven primary productivity and primary productivity requirements.
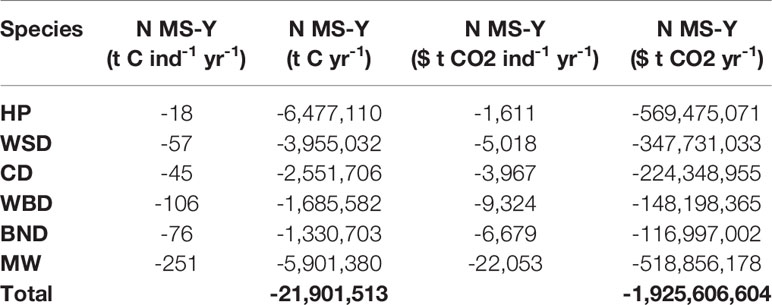
Table 7 Cetacean driven N MS-Y carbon fluxes and valuations.
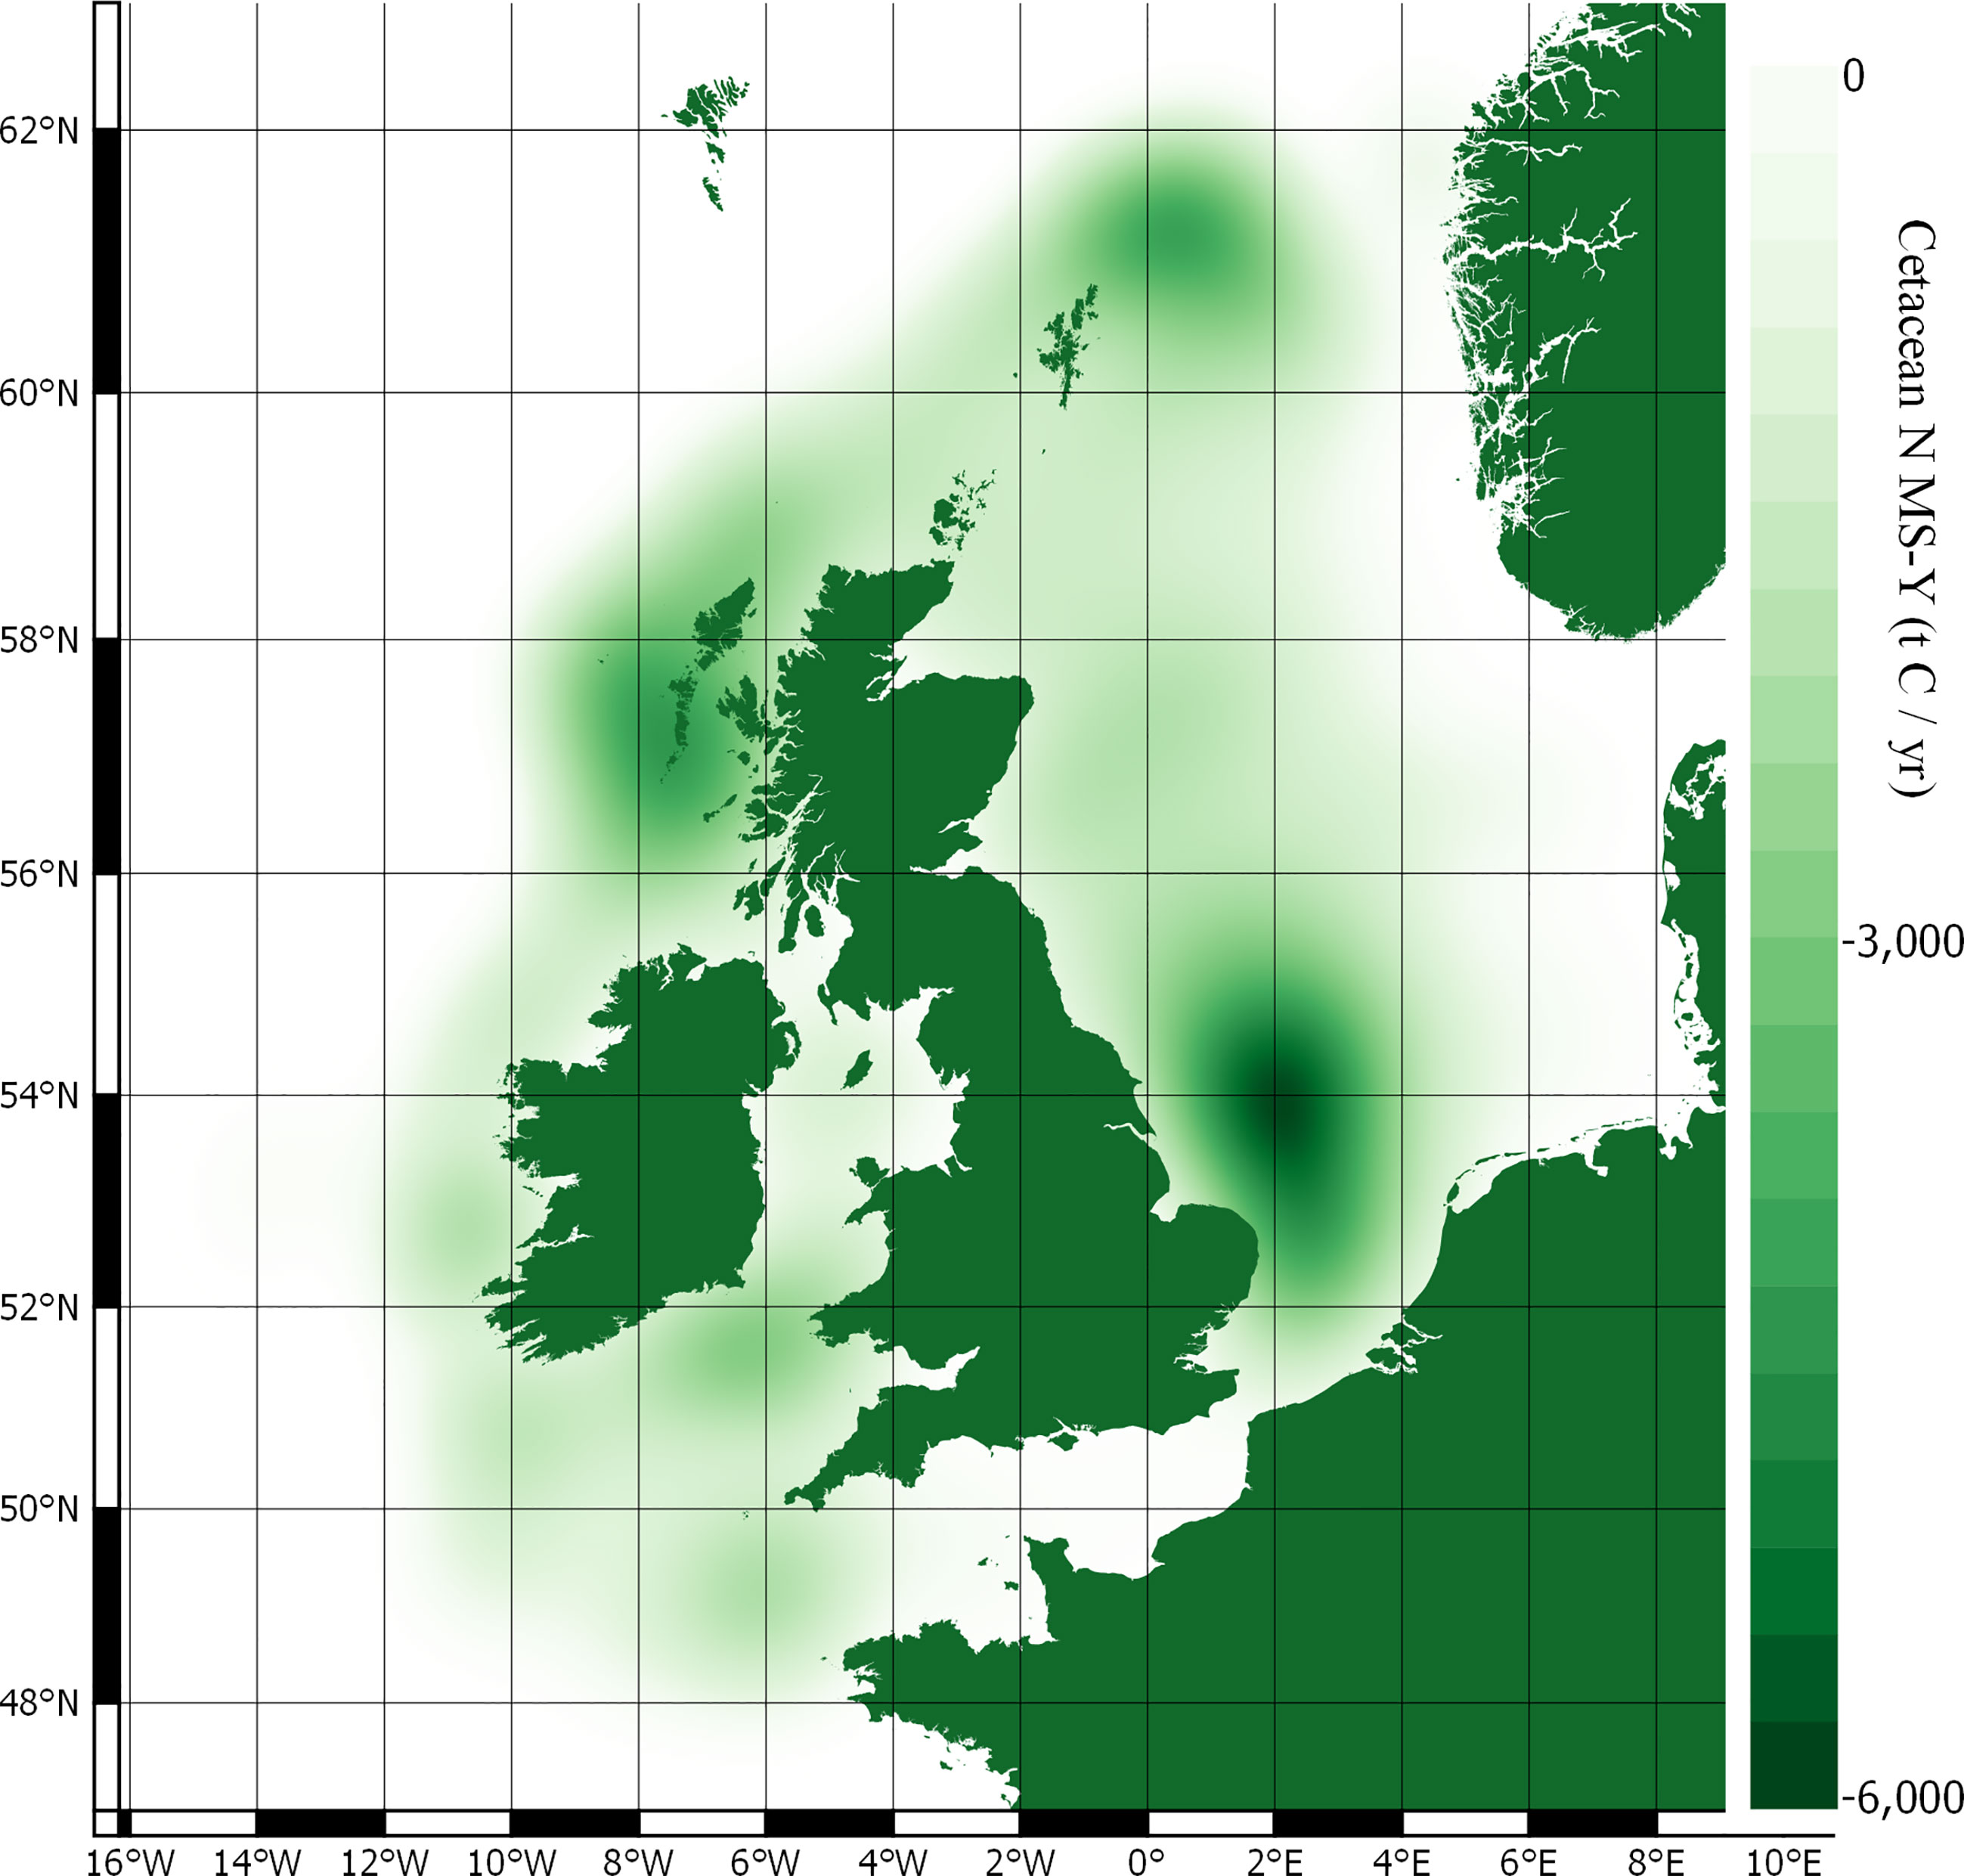
Figure 5 Cetacean driven N MS-Y carbon fluxes.
The N MS-Y models suggest that the cetaceans in this study cumulatively contribute to atmospheric emissions of 21 Mt C annually. The contributions of cetaceans in this model are relatively evenly spready between species, rather than dominated by one species. Whilst harbour porpoise populations bear the greatest influence on these values, owing to their large population, they have the lowest impact per individual. Key areas of activity are to the east of England, around the Outer Hebrides, and north-east of the Shetland Islands. They match the cumulative and more even distribution of value between all cetacean species distribution and abundance data.
Summary results for cetacean populations contributions to regulation and ecosystem services are detailed with wider ecological processes in Tables 8–10.
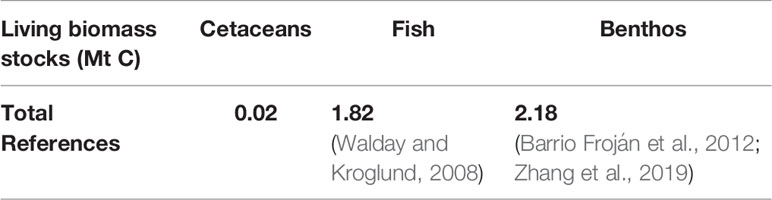
Table 8 Summary of survey area carbon stocks.

Table 9 Summary of survey area nitrogen fluxes.
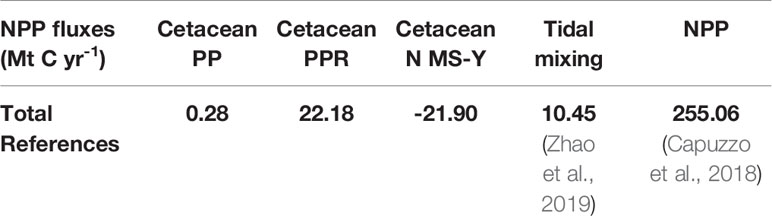
Table 10 Summary of survey area carbon fluxes.
Stocks of carbon in living biomass are minimal compared to other stocks of carbon in living biomass; there is estimated to be roughly 100 times as much carbon in stocks of fish (Walday and Kroglund, 2008) and another 100 times as much carbon in benthic biomass (Barrio Froján et al., 2012; Zhang et al., 2019).
Modelling of cetacean driven nutrient cycling suggests a modest impact on recycling nitrogen. In the survey area, cetaceans ingest just under 20% of the amount that is input into the marine environment from terrigenous sources annually (Painting et al., 2018). Cetaceans are estimated to recycle a total of just under 50,000 t N yr-1 and remove a total of just over 12,000 t N yr-1 from the marine environment in the survey area. These equate to 15% and 4% of annual terrigenous nitrogen inputs.
Modelling of cetacean driven nutrient cycling against consumption and respiration requirements suggest a more complex interaction of ecosystem services. Just considering PP, cetacean contributions are 0.11% of total NPP. The estimates of PPR dominate the N MS-Y equation, however, which cause both to have a negative and similar relative contribution with regards to NPP, roughly 8.5% of total NPP (Capuzzo et al., 2018). This suggests cetaceans have a negative effect on NPP, and using an average value for tidal mixing across the survey area (Zhao et al., 2019), suggests cetaceans impact NPP twice as much as tidal mixing.
When valuated, carbon stocks in cetacean living biomass cumulatively sum up to just under $2 million. As they are standing stocks, assuming no change in population growth or mortality, they represent a potential value only. At most they represent a baseline for SSO accreditation. Cetaceans may account for a potential total value of $24 million per year of phytoplankton growth in the survey area. Minke whales contribute the greatest amount in this model, contributing $671 per whale per year to phytoplankton growth. If the N MS-Y model is valuated, however, they suggest cetaceans account for carbon emissions at a cost of just under $2 billion per year.
There are significant areas of uncertainty in modelling and evaluative techniques used in this study. This uncertainty is compounded with each subsequent analysis and valuation.
Average mass values for populations of cetacean species are used. Whilst these are guided by the most relevant research (Lavery et al., 2010) there is still uncertainty on how proportions of population subsets may impact these average mass calculations. All cetacean populations were assumed to be in a stable state, rather than a depleted state, as defined in (Lavery et al., 2010). It is unclear, however, on the status, and population structure, of the cetacean populations included in this study. Carbon content per mass unit is assumed to be a specific value and proportional between all species detailed. Cetacean species, however, are known to differ in body content; blubber may vary significantly between cetacean species (Pershing et al., 2010).
Cetacean driven impacts on nitrogen, and by extension PP, are underpinned by cetacean population average mass values (see section 3.6.1 Carbon stocks in cetacean living biomass). From this, dietary proportions of zooplankton are used to calculate metabolic rates and daily ration. Zooplankton only feature in the diet of minke whales in this study, and taken as an average 65% of their diet in line with other research (Barlow et al., 2008). Whilst this is an average value, there is uncertainty of spatial and seasonal variability with diet for all cetacean species. All cetacean species’ diets in the study are assumed to be composed solely of zooplankton, squid, and/or fish. Energy content for zooplankton is assumed to be a standard value, as is the energy content of squid and fish. There is also then uncertainty on spatial and temporal variability for dietary energy content. The PP calculation used in this study uses the 3BMR method, but as detailed in section 2.3.1 Dietary requirements, there are a large number of other potential values that could be used. It is unclear which might be the most applicable to the cetaceans in this study and/or the survey area.
Dietary requirements form the basis to calculate the amount of nitrogen ingested, stored, and cycled by cetacean feeding and excretion. This is assumed to be standard for all prey items and all cetacean species. Nitrogen removal is a key, and valuated, ecosystem service (Watson et al., 2020). Nitrogen removal is valued at £295 kg-1, and whilst this could have been included in this study, it is likely only to be applicable to near coastal waters where nitrogen is not limited, but rather in excess, due to terrigenous nitrogen inputs (Painting et al., 2018; Watson et al., 2020).
The estimates for cycled nitrogen are used to calculate how much carbon will be fixed through PP. Crucially at this stage, the model assumes nitrogen uptake by phytoplankton to be a standard value in line with Redfield ratios (Biddanda and Benner, 1997). Where this approach is used for cetacean regulation and maintenance ecosystem service modelling in the Southern Ocean (Lavery et al., 2010; Ratnarajah et al., 2016), uptake ratios specific for iron in an iron depleted environment are used; this dramatically influences the cetacean driven PP. The survey area is known to have nutrient limitations for NPP (Zhao et al., 2019). There are, however, no known values of uptake for nitrogen or phosphorus by phytoplankton when these nutrients are limited. Additionally, nutrient limitations have spatial and temporal variability in the survey area (Zhao et al., 2019); this variability is not captured in evaluations used in this study.
Finally, the evaluation of cetacean driven PP is adapted from the modified surplus yield (MS-Y) model used for baleen whales in the Southern Ocean. It is unclear how applicable it is to the survey area, the cetaceans in this study, and to non-baleen species. In the Southern Ocean models, iron concentrations from cetacean defecation are used. There are, however, no data for nitrogen, or phosphorus, concentrations from cetacean defecation. As such, a standard estimate of 80% ingested nitrogen is assumed to be metabolised and excreted (Roman and McCarthy, 2010); there is uncertainty on how accurate this is with regards to specific cetacean species, population subsets and their proportion within the population, and for spatial and seasonal variability. This is also the basis of the N MS-Y model.
The PPR, like the PP, is also estimated using average mass values, dietary zooplankton proportions, and 3BMR. From this, prey categories and proportions are used to estimate productivity requirements with an assumed standard dry weight of carbon per wet weight of prey group. Prey categories and proportions are taken from the most relevant research (Pauly and Christensen, 1995; Barlow et al., 2008) but it is again uncertain if these are applicable to the cetaceans in this study and for this survey area. The model uses trophic levels for each prey group, and also assumes a standard trophic transfer efficiency between each level. The dry weight of carbon per wet weight of prey group is also assumed to be a standard value. There is uncertainty on the robustness of this and whether there is spatial and temporal variability in these values, whether this model is applicable to the cetaceans in this study, and whether this model is applicable for the survey area used in this study.
The model then evaluates ‘enhanced primary production’ but does not seem to include a value for ‘enhanced biodiversity and ecosystem potential’ as in CICES (Cook et al., 2020b). There is currently no quantification methodology to quantify the latter. Any model of cetacean driven nutrient cycling impacting NPP is therefore lacking a key additional value to robustly estimate cetacean regulation and maintenance ecosystem services.
The evaluative techniques in this study are applied to the JCP cetacean abundance and distribution data (Paxton et al., 2016). JCP data use elements of predictive modelling; data used include day of year, year, depth, slope, and sea surface temperature (Paxton et al., 2016). The evaluations in this study are then mapped to the point density values provided by the JCP data. JCP data, however, also provide lower (2.5%) and upper (97.5%) confidence limits for cell densities. All evaluative techniques used in this study, then mapped to JCP data, are subject to the uncertainty inherent in the JCP data (Paxton et al., 2016).
Whilst the JCP data detail estimates of cetacean distribution and abundance, data detailing distribution of linked ecosystem processes are not available. There is spatial and temporal variability in cetacean activity, nutrient cycling from physical processes, nutrient limitations, and phytoplankton growth and uptake ratios of nutrients. Finally, the JCP data provide estimates of cetacean abundance and distribution for 2010. They are, therefore, slightly outdated and it is unclear how relevant this data is now. All these various factors compound key uncertainties in data, evaluative techniques, mapping, and potential valuation of cetacean regulation and maintenance ecosystem services.
The results show large variability in both the evaluations, and potential valuations, of cetacean ecosystem services. The variability highlights the uncertainty inherent in the models as described in section 3.6 Data uncertainty. This section appraises the significance of the results, the potential accreditation process of valuations presented in this study with SSO criteria, and details future research that would best support future evaluation and valuation of cetacean regulation and maintenance ecosystem services.
Carbon stocks in living biomass are of minor significance in comparison to other marine stocks of carbon in the survey area (Walday and Kroglund, 2008; Barrio Froján et al., 2012; Zhang et al., 2019). Whilst there are some species unaccounted for in JCP data with regards to abundance and distribution, such as Risso’s dolphin Grampus griseus, these are likely to have little impact on the stocks; the majority of cetacean species in the survey area are included in JCP data. The minke whale population dominates the carbon stocks in living biomass and account for 82% of carbon. However, since the calculations involve all cetacean species detailed in the JCP data, the distribution of this carbon highlights key areas of cetacean activity. These key areas are therefore likely to be on the west coast of Scotland, around the Outer Hebrides and Isle of Man, to the west of Wales, and off the east coast of England.
Whilst the stocks of cetacean carbon, in comparison to other marine stocks, are relatively minor, the valuation details a potential value of just under $2 million in the UK. This is largely driven by minke whales and, given their large size, it is expected that other large cetacean species would likely have significant value if mapped. This value assumes that removal of cetaceans wouldn’t result in greater biomass, and carbon stocks, in other species in the trophic chain. This is supported by research that indicates removal of large species can decrease total community biomass by 30% due to differences in relative metabolic efficiency between large and small organisms (Pershing et al., 2010). It is unclear, however, if this would be applicable in the survey area and to what degree cetaceans influence total community biomass.
It is important to note that this potential combined value of just under $2 million is not an annual ecosystem service value. It only represents the value of carbon stocks in UK cetacean populations for 2010, and at most represent baseline data if considered for SSO accreditation (Ullman et al., 2013). They are also only taken for 2010, therefore, inferences regarding population changes can’t be made. As such, these stocks of carbon would likely not meet the criterion of permanence with no other data to robustly support population stability or recovery. If additionality and permanence can be proved through policy and management this may lead to carbon accreditation. To prove these criteria, international coordination of cetacean protection and restoration would need to coincide with more large scale survey efforts such as SCANS (Hammond et al., 2018). This would provide a future series of robust data to complement the baseline values presented in this study. Any carbon valuated through this process would also need to meet other criteria of leakage and co-benefits (Ullman et al., 2013). Leakage is inherently difficult with mobile trans-national species. It is unclear how such a valuation might work across international boundaries, with different policy agendas, and to whom that value might be assigned if ownership of cetacean populations, and their protection, is uncertain. This study does not attempt to quantify the co-benefits of cetacean living biomass and their importance to ecologic and societal considerations but these are likely to be significant (Roman et al., 2014; Malinauskaite et al., 2021b). Cetacean based tourism alone was valued at $21.4 million in 2008 (O’Connor et al., 2009b); without considering growth and adjusting for inflation, this is 2020 US $73.5 million. Cetacean populations are likely to have more market applicable values through cultural values (Cook et al., 2020a; Malinauskaite et al., 2021a) than the potential values highlighted here for carbon stocks.
Whale-falls are not evaluated in this study due to lack of data. This reflects uncertainty regarding the transport and sequestration of soft tissue carbon into deep waters in other potential blue carbon such as kelp (Krumhansl and Scheibling, 2012; Bayley et al., 2017). It is unclear whether this transport of carbon to the deep sea or benthos would meet the permanence criterion; isotopic, or eDNA, analysis to identify the carbon source might be required (Hopkinson, 2018).
There is a significant protected area just beyond the survey area to the west of the Outer Hebrides in waters deeper than 1000m, see Figure 2. As such, whale-falls in this area might provide significant sequestration of carbon if cetacean abundance and distribution can also be determined, see section 1.4 Scope of research.
Whale-falls incorporated into carbon accreditation are likely to be the most tangible of all potential values for cetacean derived carbon. There would, however, be uncertainty on where to set the baseline; the baseline might include existing protected areas. Additionality, permanence, and leakage could be met through the additional protection of skeletal carbon in protected areas. Alternatively, new protected areas might be based on cetacean distributions and likelihood of mortality. Co-benefits would likely be realised by protecting the wider ecosystem by protecting the benthos, and/or used to engage communities. A statistics approach to data, reliant on probabilities of cetacean-falls rather than verifiable data, would need to be accepted by SSOs. This, however, has already some pathways through tier assessment accreditation which recognises the data constraints that might otherwise impede blue carbon projects (Troxler et al., 2018). Additionally, there is advancement of probability-based data in carbon accreditation process with recommendations for a general 50% reduction in carbon seagrass quantification rather than identification of the carbon source. This simplifies and reduces costs inherent in autochthonous and allochthonous carbon analysis (Kennedy et al., 2010).
Cycling of nutrients is a key component of ecosystem function (Townsend, 1998; Zhao et al., 2019) and cetacean contributions to nutrient cycling have been evaluated (Roman and McCarthy, 2010) and valuated (Chami et al., 2020). This study shows that UK cetaceans recycle more than twice the amount of nitrogen than in the Gulf of Maine (Townsend, 1998; Roman and McCarthy, 2010). This is arguably a more pronounced enhancement than in the Gulf of Maine as the average PP is lower in the North Sea. In the survey area, cetaceans recycle 48,000 t N yr-1 in waters with an average PP of 234g c m-2 yr-1 (Capuzzo et al., 2018) whilst in the Gulf of Maine cetaceans recycle 19,600 t N yr-1 (Roman and McCarthy, 2010) in waters with an average PP of 290g C m-2 yr-1 (Townsend, 1998).
In coastal areas this could assist in removal of excess nutrients and has been valuated as an ecosystem service in other contexts (Watson et al., 2020). It is unclear, however, on the appropriate value that could be assigned to this process. A price of £295 kg-1 has been used for nitrogen removal (Watson et al., 2020) but this has been for sessile habitats where there is less uncertainty due to spatial and temporal variability from cetacean mobility. It is also uncertain how this value could be integrated into markets. If applied to data used in this study, estimating ingestion of 60,745 t N yr-1, this would equate to just under $23 billion5 yr-1 using 2020 £ to $ conversion values (ofx.com, 2019). Currently, however, this represents a value outside market mechanisms and requires more supporting data.
The evaluation and valuation of this ecosystem service was not investigated further or detailed in this study as there is currently too much uncertainty for which subset of the JCP data it could be mapped. If cetacean nutrient cycling of nitrogen is used to generate PP, it is unclear if cetacean nutrient cycling could also be used to valuate removal of nitrogen. In addition to nitrogen, there is also cycling of phosphorus which can also be valuated (Watson et al., 2020) and which is also a limiting factor for PP in the survey area (Zhao et al., 2019). There is uncertainty on where to separate the subsets of data if one subset (close to shore) is valuated for nitrogen removal and the other subset (farther offshore) is valuated for nitrogen cycling. An arbitrary distance from a shoreline could be used or it could be combined with spatial data on inputs of terrigenous nitrogen (Painting et al., 2018), and spatial data of nitrogen limited waters (Zhao et al., 2019), to detail which portions of cetacean populations are valuated for which ecosystem service. Alternatively, due to cetacean mobility, the whole population could be valuated for both services with transport of nitrogen from the coast to offshore waters to then enhance offshore PP. It is also unclear on which aspects of the nitrogen cycling should be valuated; valuation could be applied to nitrogen ingestion, nitrogen retention, and/or nitrogen cycling and transport. Nitrogen retention would apply to 20% of nitrogen ingested, whilst nitrogen cycling and transport could be applied to either 80% or 100% of the estimated nitrogen ingested.
When compared against terrigenous nitrogen inputs into the survey area (Painting et al., 2018), cetaceans will recycle or transport, at most, 20% of this input using the models in this study. There must therefore be key elements of nitrogen cycling in the survey area which are currently unaccounted. These elements could include uptake and cycling by other biota, such as fish and benthos which have a much larger biomass than cetaceans in the survey area (Walday and Kroglund, 2008; Barrio Froján et al., 2012; Zhang et al., 2019). They might also include physical processes (Zhao et al., 2019) and/or other aspects of biological pumps, calcium carbonate pumps, or microbial pumps driving nutrient fluxes (see section 1 Introduction).
Extrapolating cetacean driven nutrient cycling to then calculate potential carbon fixation through PP allows for this process to also be valuated through carbon. This study used the Redfield ratios of nutrients in phytoplankton due to lack of data on uptake rates specific to nutrient limitations in the environment. Compared to other nutrient cycling processes, cetacean driving nutrient cycling enhancing PP is of minor value. This study calculates that cetaceans enhance PP by 0.28 Mt C yr-1 which is just 2.64% of carbon fixed due to the average value of tidal mixing at 10.45 Mt C yr-1 (Zhao et al., 2019). Compared to total NPP in the survey area, extrapolated to be 255.06 Mt C yr-1 (Capuzzo et al., 2018), cetacean driven nutrient cycling contributes just 0.11%.
Cetacean driven contributions to PP are mostly concentrated around the Outer Hebrides but other key areas can be found west of Wales, along the east coast of England, and to the north-east of the Shetland Islands. These areas are somewhat aligned with existing protection, but this analysis suggests additional protection should be focused here with an increase of areal extent and in protective measures. These values also partially align with spatial distributions of nitrogen limited waters in the North Sea (Capuzzo et al., 2018; Zhao et al., 2019). It is unclear if this also holds true to the west of Scotland, where cetacean driven PP is most concentrated; there is limited data on spatial limitations of nutrients for the survey area outside the North Sea.
Valuating carbon fixation and applying them to JCP cetacean abundance and distribution data suggests the carbon cycled through this ecosystem service is worth $24 million per year in the survey area. It is, however, unlikely these values could be accredited through SSOs. Data would need to robustly show the importance of this nutrient recycling to primary productivity. Whilst there are data that highlight the importance of cetaceans for ecosystem function through regulation and maintenance (Apollonio, 2002; Springer et al., 2003; Reisewitz et al., 2006; Springer et al., 2008; Pershing et al., 2010; Wilmers et al., 2012; Roman et al., 2014), the contributions of this process are difficult to quantify. Furthermore, ecosystem complexity, environmental factors, and regional differences may preclude extrapolation of data to other areas. If robust data can be produced, they may only have value if additionality, permanence, non-leakage, and co-benefits criteria are met. These are the same barriers to accreditation as with cetacean living biomass carbon. If cetacean driven PP is viewed in conjunction with valuation of carbon stocks in living biomass, it is unclear whether this would be viewed as ‘double-counting’ or the result of positive feedback; increased cetacean populations, with larger carbon stocks, would have a greater impact on PP, which would cycle back to allow greater cetacean population growth.
Scientific robustness requires that cetacean driven nutrient cycling enhancing PP also needs to be balanced against the PPR of cetaceans. This has been calculated for cetaceans in the Southern Ocean, with recycled iron, and modelling of nutrient recycling is positive and self-sustaining. In the original research, this has only been evaluated with regards to carbon fluxes (Lavery et al., 2010; Roman and McCarthy, 2010; Lavery et al., 2014; Ratnarajah et al., 2018). Extrapolations of this research have, however, been valuated to attach monetary values to these processes (Chami et al., 2020).
The N MS-Y model indicates a negative contribution from cetaceans on NPP of -21.90 Mt C yr-1 in the survey area. Relative to other processes impacting NPP, this is roughly twice the average value of tidal mixing at 10.45 Mt C yr-1 (Zhao et al., 2019). Relative to total NPP of 255.06 Mt C yr-1 (Capuzzo et al., 2018), this would account for 8.5% in the survey area. Compared to the much larger stocks of carbon in other forms of biomass (Walday and Kroglund, 2008; Barrio Froján et al., 2012; Zhang et al., 2019) in the survey area, cetaceans may have a limited impact on NPP.
Whilst the individual contributions are dominated by minke whales again, the total value is more evenly spread between the cetacean species included. The individual contributions from minke whales are offset by the much larger abundances of other species. The largest values come from the harbour porpoise population, though their individual contributions are the smallest. The N MS-Y model shows hotspots of activity similar to that of PP, around the Outer Hebrides, the east of England, and the north-east of the Shetland Islands.
When valuated, the model suggests that UK cetacean populations provide an ecosystem disservice of just under $2 billion per year. Valuations of cetacean ecosystem disservices, however, are unlikely to gain accreditation due to excessive uncertainty. Even if policy pathways become available (Herr and Landis, 2016), accreditation processes would have the same obstacles as for living biomass and nutrient cycling driving primary productivity. If values for carbon stocks in living biomass, cetacean driven PP, and N MS-Y are contradictory, they highlight greater uncertainty in the evaluative methods which will need to be addressed before any carbon could be accredited. There is a significant body of research which highlights the importance of cetaceans in ecosystem function through regulation and maintenance ecosystem services (Apollonio, 2002; Springer et al., 2003; Reisewitz et al., 2006; Springer et al., 2008; Pershing et al., 2010; Wilmers et al., 2012; Roman et al., 2014). As such, the N MS-Y model here is deemed to be inaccurate and missing key data, see section 3.6.3 Cetacean driven nutrient cycling driving phytoplankton growth and carbon capture against cetacean consumption and respiration.
There are a number of points to consider when reviewing the N MS-Y model results. Since the North Sea, and other waters included in the survey area, are not iron deficient, recycled nitrogen was used as the basis of the analysis. Nitrogen, and phosphorus, limit phytoplankton growth in the North Sea (Zhao et al., 2019). Integrating the specific spatial distributions of these limitations, however, was beyond the scope of this research. The Southern Ocean also used environment specific uptake rates for iron but such data are not available for nitrogen, or phosphorus, in the survey area detailed in this study. Without these data, the N MS-Y model uses the Redfield ratios, and likely significantly underestimates cetacean driven nutrient cycling on PP. Other data constraints increase uncertainty in the evaluation.
Under CICES, the regulation and maintenance category has been evaluated as enhanced biodiversity, evolutionary potential, and primary productivity together. We find, however, that only primary productivity has been evaluated with enhanced biodiversity and evolutionary potential lacking any established methods of quantification. Where cetaceans have been removed from ecosystems, there is evidence of reduced productivity, biodiversity, and ecosystem function (Apollonio, 2002; Springer et al., 2003; Reisewitz et al., 2006; Springer et al., 2008; Pershing et al., 2010; Wilmers et al., 2012; Roman et al., 2014) but it is difficult to extrapolate these data to other environments due to site specific differences. This research suggests that negative values presented in the MS-Y modelling do not accurately detail cetacean ecosystem disservices. It is unclear, however, if negative values derived in MS-Y modelling are due to wider ecosystem effects and transfer of nutrients beyond the survey area, i.e. the whale conveyor, or if values fail to account for enhanced biodiversity and ecosystem potential. They may also be the result of failing to account for inputs and recycling of other key nutrients, such as phosphorus, which may act cumulatively to impact primary productivity (Ho et al., 2003; Stubbins, 2016).
There is too much uncertainty in the modelling to accurately quantify carbon fixation for the purposes of valuation or SSO accreditation. Research should focus on reducing quantification uncertainty in these ecosystem services to facilitate their valuation, conservation, and benefits from an eco-social economics perspective (Cisneros-Montemayor et al., 2019). This paper does not support any conclusions based off the N MS-Y values presented here or state that removal of cetaceans would increase ecosystem function in the survey area.
This study presents a complex model composed of different evaluative processes. As such, there are areas where future research could focus to more accurately detail cetacean regulation and maintenance ecosystem services specific to each evaluation.
Population structures of cetaceans included in the JCP data would better inform average mass values. The growth, or decline, of populations would be needed to prove ‘additionality’ as an SSO criterion and could also be used to characterise ‘stable’ or ‘depleted’ population structures (Lavery et al., 2010). Carbon content per mass unit could also be detailed for specific species, in addition to the population subsets of species. This would also help inform carbon sequestration through ‘whale-falls’ by better informing sinking rates (Pershing et al., 2010) and skeletal carbon content. Future research could further investigate species specific sinking rates (Pershing et al., 2010), spatial mortality of migratory species, benthic protective status from trawl data (Dunckley and Solandt, 2021), and cetacean skeletal carbon composition (Nishiwaki, 1950). Bycatch might also be incorporated into future valuations to better understand carbon fluxes through whale-falls. If carbon stocks in living biomass are able to be accredited, values applied to cetaceans could then also be used to support sustainable fishing practices; cetacean by-catch would have an associated cost or fine.
Whilst there are data on dietary prey compositions of cetaceans (Barlow et al., 2008), they are taken from the west coast of north America; it is unclear how relevant they are to cetacean populations in the survey area. Dietary composition of cetaceans relevant to Europe would better inform ecosystem service modelling. If spatial and temporal variability in cetacean diet could also be detailed this could provide more insight into PP and PPR calculations. A better understanding of the specifics of energy content in diet would also ensure the estimates of cetacean metabolic rates are more robust. This could also be used to better inform research as to which values for metabolic rates in the Kleiber function (Kleiber, 1975) are the most relevant for the survey area.
More robust dietary requirements would provide insight into cetacean driven nutrient cycling. Future research could then focus on spatial and temporal variability of nitrogen removal from near shore coastal areas (Painting et al., 2018). Given the high value associated with this ecosystem service, £295/kg (Watson et al., 2020), this is suggested as a priority even if it is unclear on how this value might be brought into markets. Research could focus on near shore cetacean activity, the transport of nutrients offshore through the ‘whale-conveyor’ (Roman et al., 2014), cetacean faecal nutrient concentrations, spatial and temporal variability in nutrients (Painting et al., 2018), spatial and temporal variability in nutrient limitations (Zhao et al., 2019), and the importance of these nutrients in regard to limiting factors for PP (Capuzzo et al., 2018; Zhao et al., 2019). In addition to nitrogen, research into the cycling of phosphorus would provide additional values to cetacean regulation and maintenance ecosystem services (Painting et al., 2018; Zhao et al., 2019; Watson et al., 2020).
Focusing on the value of nutrient cycling to PP, uptake rates of environmentally limited nutrients, nitrogen and phosphorus, would be key to future evaluations and valuations. This study did not apply an uptake ratio for uptake of nitrogen by phytoplankton; it is argued in this study that this lack of data precludes any meaningful valuation of this ecosystem service in the survey area. Future research that details this factor with spatial and temporal nutrient limitations could underpin robust evaluations along with potential valuation and accreditation. Finally, previous research has focused on baleen whales (Lavery et al., 2010; Ratnarajah et al., 2016; Chami et al., 2019) and it is unclear how appropriate it is to apply this process to non-baleen species. Evaluations of these species were included to provide an overall picture of cetacean nutrient cycling and PP, but species-specific models, using species-specific data as detailed earlier in this section, would be more accurate.
Species specific prey categories, proportions, and dry weight of carbon per wet weight of prey group could be used to better estimate PPR. The trophic levels and transfer efficiency between each level might also be species specific, location specific, and exhibit spatial and temporal variability. Finally, there is as yet no way to evaluate ‘enhanced biodiversity and ecosystem potential’ as in CICES (Cook et al., 2020b). Research into this area, based off data that details their importance in ecosystem function (Apollonio, 2002; Springer et al., 2003; Reisewitz et al., 2006; Springer et al., 2008; Pershing et al., 2010; Wilmers et al., 2012; Roman et al., 2014), could provide a key value that could be integrated into other values of cetacean ecosystem services (Villa et al., 2002).
Data constraints precluded the analysis of correlations of fisheries value between PP, PPR, and N MS-Y values. Future research could test the relative strength of correlations between PP and PPR from MS-Y models. If PP more closely correlates to fisheries value than PPR, it could support evaluations of cetacean nutrient cycling as a positive benefit to ecosystem function.
This study provides evaluations of a number of cetacean regulation and maintenance ecosystem services. There are, however, large uncertainties in the evaluative processes due to data constraints and lack of evaluative methods for ‘enhanced biodiversity and ecosystem potential’. This uncertainty is compounded with subsequent valuations of these processes. We do not suggest that any valuations presented for nutrient cycling here are robust for accreditation, either as benefits or as costs. The N MS-Y model is a preliminary application of valuating cetacean nutrient cycling from which future research might build.
Outputs of this study can, however, be used to assist decision making processes and marine management by highlighting key areas of cetacean activity. These areas, for all aspects of cetacean regulation and maintenance ecosystem services, are concentrated by the Outer Hebrides in Scotland, along the east coast of England, and to the west of south Wales. These hotspots are mostly synced with protected areas but suggest that additional protection might be a consideration for the Outer Hebrides, west of south Wales, around the Isle of Man, to the east of England, and to the north-east of the Shetland Islands.
Whilst the values presented in this study are not considered sufficiently robust for accreditation, they may provide a basis of valuation from which future research can build. For SSO accreditation, values here might provide a baseline from which future research could detail additionality. These values also highlight key areas for future ecosystem service research, and may be used to support cetacean regulation and maintenance ecosystem service evaluation and valuation from a policy perspective. They might also be used to drive public interest in cetacean research, and supplement other valuations such as the $2 million whale (Chami et al., 2020). With more robust evaluative processes, they may be used in an integrated approach to ecosystem service valuation, which combine different values and areas of ecosystem services (Villa et al., 2002). Added values for carbon might be able to support community engagement and conservation agendas by highlighting their importance to climate change mitigation alongside societal and cultural values (Cisneros-Montemayor et al., 2019).
The datasets analysed for this study can be found in the ‘Revised Phase III Data Analysis of Joint Cetacean Protocol Data Resources’ (https://hub.jncc.gov.uk/assets/01adfabd-e75f-48ba-9643-2d594983201e).
This study used existing data on abundance and distribution from the JCP and only applied desk-based modelling to these data. This study did not involve interaction with live animals, as such, an ethics review was not required.
JS developed the paper concept from analysis of existing literature and policy to modelling and mapping of cetacean ecosystem services. JS led writing of the manuscript and NT, NZ, MC, VM, and EM provided expert input. All authors contributed to manuscript revision and approved the submitted version.
This work was supported by the Natural Environment Research Council grant number NE/S007342/1.
The authors declare that the research was conducted in the absence of any commercial or financial relationships that could be construed as a potential conflict of interest.
The reviewer SM declared a shared affiliation with the authors NT, NZ, MC, VM, and EM
All claims expressed in this article are solely those of the authors and do not necessarily represent those of their affiliated organizations, or those of the publisher, the editors and the reviewers. Any product that may be evaluated in this article, or claim that may be made by its manufacturer, is not guaranteed or endorsed by the publisher.
The authors would like to acknowledge the support of Marine Alliance for Science and Technology Scotland (MASTS), the Scottish Universities Partnership for Environmental Research Doctoral Training Partnership (SUPER DTP), and the Joint Nature Conservation Committee (JNCC) in supporting policy internships and novel research. The authors would also like to acknowledge data used through the EMODnet Bathymetry Consortium (2020): EMODnet Digital Bathymetry (DTM) (https://doi.org/10.12770/bb6a87dd-e579-4036-abe1-e649cea9881a).
Apollonio S. (2002). Hierarchical Perspectives on Marine Complexities, New York Chichester, West Sussex: Columbia University Press. Available at: https://doi.org/10.7312/apol12488
Archer D., Jokulsdottir T. (2013). “Biological Fluxes in the Ocean and Atmospheric pCO2”, in The Oceans and Marine Geochemistry: Elsevier, Treatise on Geochemistry Holland H. D., Turekian K. K. (eds) Oxford, UK: Elsevier Inc., pp. 281–292. doi: 10.1016/B978-0-08-095975-7.00610-0.
Balch W. M., Gordon H. R., Bowler B. C., Drapeau D. T., Booth E. S. (2005). Calcium Carbonate Measurements in the Surface Global Ocean Based on Moderate-Resolution Imaging Spectroradiometer Data. J. Geophys. Res. C Ocean. 110, 1–21. doi: 10.1029/2004JC002560
Barbesgaard M. (2016). Blue Carbon: Ocean Grabbing in Disguise?, Transnational Institute, Afrika Kontakt, Indonesia Traditional Fisherfolks Union. 1–11. doi: 10.1111/cobi.12310.
Barlow J., Kahru M., Mitchell B. G. (2008). Cetacean Biomass, Prey Consumption, and Primary Production Requirements in the California Current Ecosystem. Mar. Ecol. Prog. Ser. 371, 285–295. doi: 10.3354/meps07695
Barrio Froján C. R. S., Bolam S. G., Eggleton J. D., Mason C. (2012). Large-Scale Faunal Characterisation of Marine Benthic Sedimentary Habitats Around the UK. J. Sea. Res. 69, 53–65. doi: 10.1016/j.seares.2012.02.005
Bayley D., Marengo I., Pelembe T. (2017). Giant kelp ‘Blue carbon’ storage and sequestration value in the Falkland Islands. Natural Capital in the UK’s Overseas Territories Report Series – Supplementary Report (South Atlantic Region). Contracted report to JNCC. Available at: https://hub.jncc.gov.uk/assets/72c89fdc-a14b-4176-b543-81fe1ecd94bc [Accessed November 7, 2019].
Biddanda B., Benner R. (1997). Carbon, Nitrogen, and Carbohydrate Fluxes During the Production of Particulate and Dissolved Organic Matter by Marine Phytoplankton. Limnol. Oceanogr. 42, 506–518. doi: 10.4319/lo.1997.42.3.0506
Bishop J. K. B. (2009). Autonomous Observations of the Ocean Biological Carbon Pump. Oceanography 22, 182–193. doi: 10.5670/oceanog.2009.48
Blix A. S., Folkow L. P. (1995). Daily Energy Expenditure in Free Living Minke Whales. Acta Physiol. Scand. 153, 61–66. doi: 10.1111/j.1748-1716.1995.tb09834.x
Boyd I. L. (2002). Energetics: Consequences for Fitness. In: Marine Mammal Biology: An Evolutionary Approach. Available at: https://www.wiley.com/en-us/Marine+Mammal+Biology%3A+An+Evolutionary+Approach-p-9780632052325 (Accessed May 21, 2021).
Broecker W. S., Peng T. H. (1983). Tracers in the Sea. New York: Eldigio Press doi: 10.1016/0016-7037(83)90075-3.
Caldeira K., Wickett M. E., Duffy P. B. (2002). Depth, Radiocarbon, and the Effectiveness of Direct CO2 Injection as an Ocean Carbon Sequestration Strategy. Geophys. Res. Lett. 29, 13–11. doi: 10.1029/2001gl014234
Capuzzo E., Lynam C. P., Barry J., Stephens D., Forster R. M., Greenwood N., et al. (2018). A Decline in Primary Production in the North Sea Over 25 Years, Associated With Reductions in Zooplankton Abundance and Fish Stock Recruitment. Glob. Change Biol. 24, e352–e364. doi: 10.1111/gcb.13916
Cavanagh R. D., Broszeit S., Pilling G. M., Grant S. M., Murphy E. J., Austen M. C. (2016). Valuing Biodiversity and Ecosystem Services: A Useful Way to Manage and Conserve Marine Resources? Proc. R. Soc B. Biol. Sci. 283(1844):20161635. doi: 10.1098/rspb.2016.1635
Chami R., Cosimano T., Fullenkamp C., Oztosun S. (2019). Nature's Solution to Climate Change: A Strategy to Protect Whales can Limit Greenhouse Gases and Global Warming. Financ. Dev. 56 (4), 34–38. https://www.imf.org/external/pubs/ft/fandd/2019/12/natures-solution-to-climate-change-chami.htm
Chami R., Fullenkamp C., Berzaghi F., Español-Jiménez S., Marcondes M., Palazzo J. (2020). On Valuing Nature-Based Solutions to Climate Change: A Framework with Application to Elephants and Whales. Economic Research Initiatives at Duke (ERID) Working Paper No. 297. Elsevier BV doi: 10.2139/ssrn.3686168.
Cisneros-Montemayor A. M., Moreno-Báez M., Voyer M., Allison E. H., Cheung W. W. L., Hessing-Lewis M., et al. (2019). Social Equity and Benefits as the Nexus of a Transformative Blue Economy: A Sectoral Review of Implications. Mar. Policy 109, 103702. doi: 10.1016/j.marpol.2019.103702
Cook D., Malinauskaite L., Davíðsdóttir B., Ögmundardóttir H. (2020a). A Contingent Valuation Approach to Estimating the Recreational Value of Commercial Whale Watching – the Case Study of Faxaflói Bay, Iceland. Tour. Manage. Perspect. 36, 100754. doi: 10.1016/j.tmp.2020.100754
Cook D., Malinauskaite L., Davíðsdóttir B., Ögmundardóttir H., Roman J. (2020b). Reflections on the Ecosystem Services of Whales and Valuing Their Contribution to Human Well-Being. Ocean. Coast. Manage. 186, 105100. doi: 10.1016/j.ocecoaman.2020.105100
Costa D. P., Williams T. M. (1999). “Marine Mammal Energetics”, in Encyclopedia of Marine Mammals. Washington, DC: Smithsonian Institution Press, p. 1355. Available at: https://vpn.gw.ulg.ac.be/science/book/,DanaInfo=www.sciencedirect.com+9780123735539#ancs18.
Croll D. A., Kudela R., Tershy B. R. (2007). “Ecosystem Impact of the Decline of Large Whales in the North Pacific,” in Whales, Whaling, and Ocean Ecosystems, 202–214. doi: 10.1525/california/9780520248847.003.0016
Danielsson L. G. (1982). On the Use of Filters for Distinguishing Between Dissolved and Particulate Fractions in Natural Waters. Water Res. 16, 179–182. doi: 10.1016/0043-1354(82)90108-7
Dasgupta P. (2021) The Economics of Biodiversity: The Dasgupta Review. Available at: www.gov.uk/official-documents (Accessed February 17, 2021).
DECC (2011) A Brief Guide to the Carbon Valuation Methodology for UK Policy Appraisal. Available at: http://www.decc.gov.uk/ (Accessed June 12, 2021).
De La Rocha C. L., Passow U. (2013). “The Biological Pump”, in Holland H., Turekian K. (eds) The Oceans and Marine Geochemistry: Elsevier, Treatise on GeochemistryTreatise on Geochemistry: Second Edition. Oxford, UK: Elsevier Inc., pp. 93–122. doi: 10.1016/B978-0-08-095975-7.00604-5
Donovan G. P. (1982). International Whaling Commission Aboriginal/Subsistence Whaling (with special reference to the Alaska and Greenland fisheries) Reports of the International Whaling Commission Special Issue 4 Cambridge 1982. Great Britain University Press, Cambridge.
Ducklow H. W., Carlson C. A., Bates N. R., Knap A. H., Michaels A. F. (1995). Dissolved Organic Carbon as a Component of the Biological Pump in the North Atlantic Ocean. Philos. Trans. - R. Soc Lond. B. 348, 161–167. doi: 10.1098/rstb.1995.0058
Dunckley F., Solandt J.-L. (2021). Marine Un-Protected Areas: Marine Conservation Society. Ross-on-Wye, UK.
Fearnside P. M. (1995). Hydroelectric Dams in the Brazilian Amazon as Sources of ‘Greenhouse’ Gases. Environ. Conserv. 22, 7–19. doi: 10.1017/S0376892900034020
Fearnside P. M. (2005). Brazil’s Samuel Dam: Lessons for Hydroelectric Development Policy and the Environment in Amazonia. Environ. Manage. 35, 1–19. doi: 10.1007/s00267-004-0100-3
Fearnside P. M. (2016). Environmental and Social Impacts of Hydroelectric Dams in Brazilian Amazonia: Implications for the Aluminum Industry. World Dev. 77, 48–65. doi: 10.1016/j.worlddev.2015.08.015
FPP (2011) Lessons From the Field : REDD + and the Rights of Indigenous Peoples and Forest Dependent Communities: Forest Peoples Programme. Available at: http://www.forestpeoples.org/sites/fpp/files/news/2011/09/Minam (Accessed April 4, 2020).
Geraldi N. R., Ortega A., Serrano O., Macreadie P. I., Lovelock C. E., Krause-Jensen D., et al. (2019). Fingerprinting Blue Carbon: Rationale and Tools to Determine the Source of Organic Carbon in Marine Depositional Environments. Front. Mar. Sci. 6. doi: 10.3389/fmars.2019.00263
Haines-Young R., Potschin M. (2018). Common International Classification of Ecosystem Services (CICES) V5.1 and Guidance on the Application of the Revised Structure. Available at: https://cices.eu/resources/ [Accessed February 15, 2021].
Hammond P. S. (2006). Small Cetaceans in the European Atlantic and North Sea (SCANS-II): Final Report. LIFE Project Number, LIFE04NAT/GB/000245, Final Report. Mamm. Species. Available at: http://marine.gov.scot/sma/content/small-cetaceans-european-atlantic-and-north-sea-scans-ii
Hammond P. S., Lacey C., Gilles A., Viquerat S., Börjesson P., Herr H., et al. (2018). Estimates of cetacean abundance in European Atlantic waters in summer 2016 from the SCANS-III aerial and shipboard surveys, Diseases of Aquatic Organisms. Available at: https://marine.gov.scot/sma/content/estimates-cetacean-abundance-european-atlantic-waters-summer-2016-scans-iii-aerial-and (Accessed: 15 February 2021).
Hammond P. S., Macleod K., Gillespie D., Swift R., Winship A., Burt M. L., et al. (2009). Cetacean Offshore Distribution and Abundance in the European Atlantic ( CODA ). Available at: http://marine.gov.scot/sma/content/cetacean-offshore-distribution-and-abundance-european-atlantic-coda [Accessed February 15, 2021].
Hansell D., Carlson C., Repeta D., Schlitzer R. (2009). Dissolved Organic Matter in the Ocean. Oceanography 22 (4), 202–211.
Hedges J. I. (1992). Global Biogeochemical Cycles: Progress and Problems. Mar. Chem. 39, 67–93. doi: 10.1016/0304-4203(92)90096-S
Heinze C., Maier-Reimer E., Winn K. (1991). Glacial Pco2 Reduction by the World Ocean: Experiments With the Hamburg Carbon Cycle Model. Paleoceanography 6, 395–430. doi: 10.1029/91PA00489
Henson S. (2020) Biological Components of the Ocean Carbon Cycle - National Oceanography Centre. Available at: http://projects.noc.ac.uk/greenhouse_gas_science/greenhouse-gases-oceans (Accessed June 8, 2020).
Herr D., Landis E. (2016). Coastal Blue Carbon Ecosystems Opportunities for Nationally Determined Contributions. Policy Brief. Natl. Wetl. Newsl. 36, 1–28. doi: 10.2305/IUCN.CH.2015.10.en
Higgs N. D., Little C. T. S., Glover A. G. (2011). Bones as Biofuel: A Review of Whale Bone Composition With Implications for Deep-Sea Biology and Palaeoanthropology. Proc. R. Soc. B.: Biol. Sci. 278, 9–17. doi: 10.1098/rspb.2010.1267
Hooker S. K., Whitehead H., Gowans S. (2002). Ecosystem Consideration in Conservation Planning: Energy Demand of Foraging Bottlenose Whales (Hyperoodon Ampullatus) in a Marine Protected Area. Biol. Conserv. 104, 51–58. doi: 10.1016/S0006-3207(01)00153-7
Hopkinson C. S. (2018). “Net Ecosystem Carbon Balance of Coastal Wetland-Dominated Estuaries”, in A Blue Carbon Primer (CRC PRess), 51–65. doi: 10.1201/9780429435362-5
Ho T. Y., Quigg A., Finkel Z. V., Milligan A. J., Wyman K., Falkowski P. G., et al. (2003). The Elemental Composition of Some Marine Phytoplankton. J. Phycol. 39, 1145–1159. doi: 10.1111/j.0022-3646.2003.03-090.x
Houghton R. A. (2003). “The Contemporary Carbon Cycle,” in Treatise on Geochemistry (Pergamon:Oxford, UK), 473–513. doi: 10.1016/B0-08-043751-6/08168-8
IAMMWG (2015) Management Units for Cetaceans in UK Waters (January 2015) (JNCC Peterborough: JNCC Report No. 547) (Accessed June 15, 2021).
Inflation Calculator (2016) Inflation Calculator | Find US Dollar’s Value from 1913-2015. Available at: https://www.usinflationcalculator.com/ (Accessed June 11, 2021).
Jelmert A., Oppen-Berntsen D. O. (1996). Whaling and Deep-Sea Biodiversity. Conserv. Biol. 10, 653–654. doi: 10.1046/j.1523-1739.1996.10020653.x
Jiao N., Herndl G. J., Hansell D. A., Benner R., Kattner G., Wilhelm S. W., et al. (2010). Microbial Production of Recalcitrant Dissolved Organic Matter: Long-Term Carbon Storage in the Global Ocean. Nat. Rev. Microbiol. 8, 593–599. doi: 10.1038/nrmicro2386
Katona S., Whitehead H. (1988). Are Cetacea Ecologically Important? Oceanogr. Mar. Biol. Annu. Rev. 26, 553–568.
Kennedy H., Beggins J., Duarte C. M., Fourqurean J. W., Holmer M., Marbá N., et al. (2010). Seagrass Sediments as a Global Carbon Sink: Isotopic Constraints. Global Biogeochem. Cycle. 24(4). doi: 10.1029/2010GB003848
Kenney R. D., Scott G. P., Thompson T. J., Winn H. E. (1997). Estimates of Prey Consumption and Trophic Impacts of Cetaceans in the USA Northeast Continental Shelf Ecosystem. J. Northw. Atl. Fish. Sci. 22, 155–171. doi: 10.2960/J.v22.a13
Kenny T. A., Hu X. F., Kuhnlein H. V., Wesche S. D., Chan H. M. (2018). Dietary Sources of Energy and Nutrients in the Contemporary Diet of Inuit Adults: Results From the 2007-08 Inuit Health Survey. Public Health Nutr. 21, 1319–1331. doi: 10.1017/S1368980017003810
Krumhansl K. A., Scheibling R. E. (2012). Production and Fate of Kelp Detritus. Mar. Ecol. Prog. Ser. 467, 281–302. doi: 10.3354/meps09940
Laidre K. L., Heide-Jørgensen M. P., Jørgensen O. A., Treble M. A. (2004). Deep-Ocean Predation by a High Arctic Cetacean. ICES J. Mar. Sci. 61, 430–440. doi: 10.1016/j.icesjms.2004.02.002
Lavery P. S., Mateo M.Á., Serrano O., Rozaimi M. (2013). Variability in the Carbon Storage of Seagrass Habitats and Its Implications for Global Estimates of Blue Carbon Ecosystem Service. PloS One 8, e73748. doi: 10.1371/journal.pone.0073748
Lavery T. J., Roudnew B., Gill P., Seymour J., Seuront L., Johnson G., et al. (2010). Iron Defecation by Sperm Whales Stimulates Carbon Export in the Southern Ocean. Proc. R. Soc B. Biol. Sci. 277, 3527–3531. doi: 10.1098/rspb.2010.0863
Lavery T. J., Roudnew B., Seymour J., Mitchell J. G., Smetacek V., Nicol S. (2014). Whales Sustain Fisheries: Blue Whales Stimulate Primary Production in the Southern Ocean. Mar. Mammal. Sci. 30, 888–904. doi: 10.1111/mms.12108
Lees S., Escoubes M. (1987). Vapor Pressure Isotherms, Composition and Density of Hyperdense Bones of Horse, Whale and Porpoise. Connect. Tissue Res. 16, 305–322. doi: 10.3109/03008208709005617
Lockyer C. (1976). Body Weights of Some Species of Large Whales. ICES J. Mar. Sci. 36, 259–273. doi: 10.1093/icesjms/36.3.259
Lockyer C. (1981). Growth and Energy Budgets of Large Baleen Whales From the Southern Hemisphere. Mamm. Seas. 3 (FAO Fish. Ser. no. 5), 379–487.
Loomis J. B., Larson D. M. (1994). Total Economic Values of Increasing Gray Whale Populations: Results From a Contingent Valuation Survey of Visitors and Households. Mar. Resour. Econ. 9, 275–286. doi: 10.1086/mre.9.3.42629085
Lovelock C. E., Duarte C. M. (2019). Dimensions of Blue Carbon and Emerging Perspectives. Biol. Lett. 15, 23955–26900. doi: 10.1098/rsbl.2018.0781
Mackintosh N. A., Wheeler J. F. G. (1929). Southern Blue and Fin Whales. Discovery Rep. 1, 257–540. https://www.biodiversitylibrary.org/part/236587
Macreadie P. I., Anton A., Raven J. A., Beaumont N., Connolly R. M., Friess D. A., et al. (2019). The Future of Blue Carbon Science. Nat. Commun. 10, 1–13. doi: 10.1038/s41467-019-11693-w
Mariani G., Cheung W. W. L., Lyet A., Sala E., Mayorga J., Velez L., et al. (2020). Let More Big Fish Sink: Fisheries Prevent Blue Carbon Sequestration-Half in Unprofitable Areas. Sci. Adv. 6(44). doi: 10.1126/sciadv.abb4848
Marshall D. (1997). Subduction of Water Masses in an Eddying Ocean. J. Mar. Res. 55, 201–222. doi: 10.1357/0022240973224373
Marshall J., Adcroft A., Hill C., Perelman L., Heisey C. (1997). A Finite-Volume, Incompressible Navier Stokes Model for, Studies of the Ocean on Parallel Computers. J. Geophys. Res. C Ocean. 102, 5753–5766. doi: 10.1029/96JC02775
Nishiwaki M. (1950). On the Body Weight of Whales, The Scientific reports of the Whales Research Institute. Tokyo: Scientific Reports Whales Research Institute.
O’Connor S., Campbell R., Cortez H., Knowles T. (2009a). Whale Watching Worldwide Tourism Numbers, Expenditures and Expanding Economic Benefits. Available at: www.ecolarge.com (Accessed February 16, 2021).
O’Connor S., Campbell R., Cortez H., Knowles T. (2009b). Whale Watching Worldwide Tourism Numbers, Expenditures and Expanding Economic Benefits. Available at: https://www.mmc.gov/wp-content/uploads/whale_watching_worldwide.pdf (Accessed May 11, 2021).
ofx.com. (2019). Monthly Average Rates | OFX. ofx.com. Available at: https://www.ofx.com/en-au/forex-news/historical-exchange-rates/monthly-average-rates/ (Accessed June 11, 2021).
Olson J. S., Garrels R. M., Berner R. A., Armentano T. V., Dyer M. I., Yaalon D. H. (1985). ’The Natural Carbon Cycle‘, in Trabalka J. R. (ed.) Atmospheric Carbon Dioxide and the Global Carbon Cycle. Washington, DC: US Department of Energy Report DOE/ER-0239., pp. 175–214.
Painting S., Collingridge K., Garcia L., Barry J., Leaf S., Best M., et al. (2018). Nutrient Inputs in Water and Air (UK Marine Online Assessment Tool). Available at: https://moat.cefas.co.uk/pressures-from-human-activities/eutrophication/nutrient-inputs/ (Accessed April 11, 2022).
Parekh P., Follows M. J., Dutkiewicz S., Ito T. (2006). Physical and Biological Regulation of the Soft Tissue Carbon Pump. Paleoceanography 21(3). doi: 10.1029/2005PA001258
Parsons E. C. M., Warburton C. A., Woods-Ballard A., Hughes A., Johnston P. (2003). The Value of Conserving Whales: The Impacts of Cetacean-Related Tourism on the Economy of Rural West Scotland. Aquat. Conserv. Mar. Freshw. Ecosyst. 13, 397–415. doi: 10.1002/aqc.582
Pauly D., Christensen V. (1995). Primary Production Required to Sustain Global Fisheries. Nature 374, 255–257. doi: 10.1038/374255a0
Pauly D., Trites A. W., Capuli E., Christensen V. (1998). Diet Composition and Trophic Levels of Marine Mammals. ICES J. Mar. Sci. 55,467–481. doi: 10.1006/jmsc.1997.0280
Paxton C. G. M., Scott-Hayward L., Mackenzie M., Rexstad E., Thomas L. (2016) Revised Phase III Data Analysis of Joint Cetacean Protocol Data Resources. Available at: http://jncc.defra.gov.uk/page-6991 (Accessed April 20, 2021).
Pearce D. (2003). The Social Cost of Carbon and its Policy Implications. Oxf. Rev. Econ. Policy 19, 362–384. doi: 10.1093/oxrep/19.3.362
Pershing A. J., Christensen L. B., Record N. R., Sherwood G. D., Stetson P. B. (2010). The Impact of Whaling on the Ocean Carbon Cycle: Why Bigger was Better. PloS One 5, e12444. doi: 10.1371/journal.pone.0012444
Peskett L., Huberman D., Bowen-Jones E., Edwards G., Brown J., Brown D., et al. (2008). Making REDD Work for the Poor A Poverty Environment Partnership (PEP) Report Making REDD Work for the Poor Prepared on Behalf of the Poverty Environment Partnership (PEP). IUCN: International Union for Conservation of Nature.
Porter J. S., Austin W. E. N., Burrows M. T., Clarke D., Davies G., Kamenos N., et al. (2020). Blue Carbon Audit of Scottish Waters. Scott. Mar. Freshw. Ser. 11(3), 96pp. doi: 10.7489/12262-1
Price J. T., Warren R. (2016). Literature Review of the Potential of “Blue Carbon” Activities to Reduce Emissions. 1104872/AVOID2 WPE.2 Report 1. https://docslib.org/doc/10123770/blue-carbon-activities-to-reduce-emissions
Ratnarajah L., Bowie A. R., Lannuzel D., Meiners K. M., Nicol S. (2014). The Biogeochemical Role of Baleen Whales and Krill in Southern Ocean Nutrient Cycling. PloS One 9, e114067. doi: 10.1371/journal.pone.0114067
Ratnarajah L., Melbourne-Thomas J., Marzloff M. P., Lannuzel D., Meiners K. M., Chever F., et al. (2016). A Preliminary Model of Iron Fertilisation by Baleen Whales and Antarctic Krill in the Southern Ocean: Sensitivity of Primary Productivity Estimates to Parameter Uncertainty. Ecol. Modell. 320, 203–212. doi: 10.1016/j.ecolmodel.2015.10.007
Ratnarajah L., Nicol S., Bowie A. R. (2018). Pelagic Iron Recycling in the Southern Ocean: Exploring the Contribution of Marine Animals. Front. Mar. Sci. 5. doi: 10.3389/fmars.2018.00109
Reilly S., Hedley S., Borberg J., Hewitt R., Thiele D., Watkins J., et al. (2004). Biomass and Energy Transfer to Baleen Whales in the South Atlantic Sector of the Southern Ocean. Deep. Res. Part II. Top. Stud. Oceanogr. 51, 1397–1409. doi: 10.1016/j.dsr2.2004.06.008
Reisewitz S. E., Estes J. A., Simenstad C. A. (2006). Indirect Food Web Interactions: Sea Otters and Kelp Forest Fishes in the Aleutian Archipelago. Oecologia 146, 623–631. doi: 10.1007/s00442-005-0230-1
Ridgwell A., Arndt S. (2015). ‘Why Dissolved Organics Matter: DOC in Ancient Oceans and Past Climate Change’, in Hansell D. A., Carlson C. A. (eds) Biogeochemistry of Marine Dissolved Organic Matter: Second Edition. Copyright © 2014 Elsevier Inc. All rights reserved.: Academic Press, pp. 1–20. doi: 10.1016/B978-0-12-405940-5.00001-7
Roman J., Estes J. A., Morissette L., Smith C., Costa D., McCarthy J., et al. (2014). Whales as Marine Ecosystem Engineers. Front. Ecol. Environ. 12, 377–385. doi: 10.1890/130220
Roman J., McCarthy J. J. (2010). The Whale Pump: Marine Mammals Enhance Primary Productivity in a Coastal Basin. PloS One 5, 13255. doi: 10.1371/journal.pone.0013255
Schuller D., Kadko D., Smith C. R. (2004). Use of 210Pb/226Ra Disequilibria in the Dating of Deep-Sea Whale Falls. Earth Planet. Sci. Lett. 218, 277–289. doi: 10.1016/S0012-821X(03)00690-3
Seibold E., Berger W. (2017). ‘Sources and Composition of Marine Sediments’ in The Sea Floor. Springer Textbooks in Earth Sciences, Geography and Environment. Springer, Cham, pp. 45–61. doi: 10.1007/978-3-319-51412-3_4
Sigurjónsson J., Víkingsson G. A. (1997). Seasonal Abundance of the Estimated Food Consumption by Cetaceans in Icelandic and Adjacent Waters. J. Northw. Atl. Fish. Sci. 22, 271–287. doi: 10.2960/J.v22.a20
Sillanpää M., Matilainen A., Lahtinen T. (2015). ‘Characterization of NOM’, in Natural Organic Matter in Water: Characterization and Treatment Methods (Oxford, UK:Elsevier Inc), 17–53. doi: 10.1016/B978-0-12-801503-2.00002-1
Simmonds M. P., Haraguchi K., Endo T., Cipriano F., Palumbi S. R., Troisi G. M. (2002). Human Health Significance of Organochlorine and Mercury Contaminants in Japanese Whale Meat. J. Toxicol. Environ. Heal. - Part A. 65, 1211–1235. doi: 10.1080/152873902760125714
Smith C. R., Baco A. R. (2003). “Ecology of Whale Falls at the Deep-Sea Floor”, in Oceanography and Marine Biology, Vol 41 (CRC Press), 311–354.
SOEST (2011) The Carbon Cycle: School of Ocean and Earth Science and Technology. Available at: www.royalsoc.ac.uk (Accessed June 10, 2020).
Springer A. M., Estes J. A., Van Vliet G. B., Williams T. M., Doak D. F., Danner E. M., et al. (2003). Sequential Megafaunal Collapse in the North Pacific Ocean: An Ongoing Legacy of Industrial Whaling? Proc. Natl. Acad. Sci. U. S. A. 100, 12223–12228. doi: 10.1073/pnas.1635156100
Springer A. M., Estes J. A., Van Vliet G. B., Williams T. M., Doak D. F., Danner E. M., et al. (2008). Mammal-Eating Killer Whales, Industrial Whaling, and the Sequential Megafaunal Collapse in the North Pacific Ocean: A Reply to Critics of Springer Et Al 2003. Mar. Mammal. Sci. 24, 414–442. doi: 10.1111/j.1748-7692.2008.00185.x
Stubbins A. (2016). A Carbon for Every Nitrogen. Proc. Natl. Acad. Sci. U. S. A. 113, 10736–10738. doi: 10.1073/pnas.1612995113
Thompson K., Miller K., Johnston P., Santillo D. (2017). Storage of carbon by marine ecosystems and their contribution to climate change mitigation Greenpeace Research Laboratories Technical Report (Review) 03-2017. Exeter, UK Available at: https://www.greenpeace.to/greenpeace/wp-content/uploads/2017/05/Carbon-in-Marine-Ecosystems-Technical-Report-March-2017-GRL-TRR-03-2017.pdf [Accessed April 1, 2020].
Tont S. A., Pearcy W. G., Arnold J. S. (1977). Bone Structure of Some Marine Vertebrates. Mar. Biol. 39, 191–196. doi: 10.1007/BF00387004
Townsend D. W. (1998). Sources and Cycling of Nitrogen in the Gulf of Maine. J. Mar. Syst. 16, 283–295. doi: 10.1016/S0924-7963(97)00024-9
Trites A. W., Pauly D. (1998). Estimating Mean Body Masses of Marine Mammals From Maximum Body Lengths. Can. J. Zool. 76, 886–896. doi: 10.1139/z97-252
Troxler T. G., Kennedy H. A., Crooks S., Sutton-Grier A. E. (2018). “Introduction of Coastal Wetlands into the IPCC Greenhouse Gas Inventory Methodological Guidance”, in A Blue Carbon Primer (CRC PRess), 217–234. doi: 10.1201/9780429435362-16
UK NEA (2014) UK National Ecosystem Assessment Follow-On: Synthesis of Key Findings. Available at: http://uknea.unep-wcmc.org/Resources/tabid/82/Default.aspx (Accessed February 16, 2021).
Ullman R., Bilbao-Bastida V., Grimsditch G. (2013). Including Blue Carbon in Climate Market Mechanisms. Ocean Coast. Manag. 83, 15–18. doi: 10.1016/j.ocecoaman.2012.02.009
Villa F., Wilson M. A., de Groot R., Farber S., Costanza R., Boumans R. M. J. (2002). Designing an Integrated Knowledge Base to Support Ecosystem Services Valuation. Ecol. Econ. 41, 445–456. doi: 10.1016/S0921-8009(02)00093-9
Walday M., Kroglund T. (2008). The North Sea -bottom Trawling and Oil/gas Exploitation. Copenhagen: European Environment Agency. https://www.eea.europa.eu/publications/report_2002_0524_154909
Watkiss P., Anthoff D., Downing T. E., Hepburn C. J., Hope C., Hunt A., et al. (2005) The Social Costs of Carbon Review – Methodological Approaches for Using SCC Estimates in Policy Assessment. Available at: www.defra.gov.uk (Accessed April 2, 2020).
Watson S. C. L., Preston J., Beaumont N. J., Watson G. J. (2020). Assessing the Natural Capital Value of Water Quality and Climate Regulation in Temperate Marine Systems Using a EUNIS Biotope Classification Approach. Sci. Total. Environ. 744, 140688. doi: 10.1016/j.scitotenv.2020.140688
WDG (2021a) Atlantic White-Sided Dolphin - Whale and Dolphin Conservation. Available at: https://uk.whales.org/whales-dolphins/species-guide/atlantic-white-sided-dolphin/ (Accessed May 19, 2021).
WDG (2021b) White-Beaked Dolphin - Whale and Dolphin Conservation. Available at: https://uk.whales.org/whales-dolphins/species-guide/white-beaked-dolphin/ (Accessed May 19, 2021).
Wilmers C. C., Estes J. A., Edwards M., Laidre K. L., Konar B. (2012). Do Trophic Cascades Affect the Storage and Flux of Atmospheric Carbon? An Analysis of Sea Otters and Kelp Forests. Front. Ecol. Environ. 10, 409–415. doi: 10.1890/110176
Xie F., Tao Z., Zhou X., Lv T., Wang J. (2019). Spatial and Temporal Variations of Particulate Organic Carbon Sinking Flux in Global Ocean From 2003 to 2018. Remote Sens. 11, 2941. doi: 10.3390/rs11242941
Zhang W., Wirtz K., Daewel U., Wrede A., Kröncke I., Kuhn G., et al. (2019). The Budget of Macrobenthic Reworked Organic Carbon: A Modeling Case Study of the North Sea. J. Geophys. Res. Biogeosci. 124, 1446–1471. doi: 10.1029/2019JG005109
Keywords: ecosystem services, cetacean, valuation, evaluation, blue carbon, climate change
Citation: Sheehy JM, Taylor NL, Zwerschke N, Collar M, Morgan V and Merayo E (2022) Review of Evaluation and Valuation Methods for Cetacean Regulation and Maintenance Ecosystem Services With the Joint Cetacean Protocol Data. Front. Mar. Sci. 9:872679. doi: 10.3389/fmars.2022.872679
Received: 09 February 2022; Accepted: 20 April 2022;
Published: 21 June 2022.
Edited by:
William Richard Turrell, Marine Scotland, United KingdomReviewed by:
Jan Marcin Weslawski, Polish Academy of Sciences, PolandCopyright © 2022 Sheehy, Taylor, Zwerschke, Collar, Morgan and Merayo. This is an open-access article distributed under the terms of the Creative Commons Attribution License (CC BY). The use, distribution or reproduction in other forums is permitted, provided the original author(s) and the copyright owner(s) are credited and that the original publication in this journal is cited, in accordance with accepted academic practice. No use, distribution or reproduction is permitted which does not comply with these terms.
*Correspondence: Jack Michael Sheehy, am1zOUBody5hYy51aw==
†These authors have contributed equally to this work and share last authorship
Disclaimer: All claims expressed in this article are solely those of the authors and do not necessarily represent those of their affiliated organizations, or those of the publisher, the editors and the reviewers. Any product that may be evaluated in this article or claim that may be made by its manufacturer is not guaranteed or endorsed by the publisher.
Research integrity at Frontiers
Learn more about the work of our research integrity team to safeguard the quality of each article we publish.