 Anastasia N. Drozdova
 Ivan N. Krylov
 Andrey A. Nedospasov
 Elena G. Arashkevich
 Timur A. Labutin
- 1Shirshov Institute of Oceanology, Russian Academy of Sciences, Moscow, Russia
- 2Department of Chemistry, Lomonosov Moscow State University, Moscow, Russia
The East Siberian Sea is an area of high biogeochemical activity caused by multiple factors, such as an influence of river runoff, Atlantic, and Pacific waters, formation and melting of sea ice, and internal circulation. Extensive amounts of carbon are accumulated in sub-sea permafrost within the Arctic shelf in East Siberia. Thawing permafrost and resulting microbial decomposition of frozen carbon pool is a potential feedback process affected global climate dynamics. Several studies of dissolved organic carbon (DOC) distribution in the East Siberian Sea have demonstrated untypical for other Arctic shelf seas pronounced non-conservative DOC behavior. Using seawater samples from the 69th cruise of R/V Akademik Mstislav Keldysh conducted in the Laptev and East Siberian seas in September 2017, this study examines the distribution of fluorescent dissolved organic matter (FDOM) along the shelf-crossing transects including the areas affected by the Khatanga, Lena, Indigirka, and Kolyma river runoff. The set of 137 excitation-emission matrices (EEMs), analyzed with Parallel Factor analysis (PARAFAC), was described by a 4-component model demonstrating Tucker’s congruence coefficient above the 0.95 threshold. Spectral characteristics of the resulting components allowed identifying them as well-known humic-like A and C, protein-like B/T, and marine humic-like M fluorophores. Component C1 (A fluorophore) showed a good correlation with salinity for different river plume influenced regions. As well as chromophoric DOM (CDOM) absorption, it can be used as marker of input of terrestrial DOM to the Arctic Ocean. A distinctive feature of the East Siberian Sea shelf waters in comparison with the Laptev Sea is the higher content of the C2 and C4 components, exhibiting protein-like and marine humic-like fluorescence. Component C3 (C fluorophore) which is usually identified as terrestrial-derived material, was found to be produced locally on the East Siberian Sea shelf and in the continental slope region of the Khatanga transect. Destruction of dead algae cells, production of marine biota and dissolved organic matter (DOM) reworking are considered as possible autochthonous FDOM sources in the Siberian shelf seas.
Introduction
Dissolved organic matter represents an important component of oceanic carbon cycle (Stein et al., 2004; Vetrov and Romankevich, 2010) that influences on ecosystem functioning controlling microbial food webs and through many physical and biogeochemical processes, such as sunlight absorption, photo- and biodegradation, flocculation, formation of metal-organic complexes, etc. (Jaffé et al., 2008). In the context of serious concerns about global climate change, DOM is considered as a key component of the biological pump - a series of processes through which CO2 is fixed as organic matter by photosynthesis and then transferred to the ocean interior by means of particulate organic matter (POM) sedimentation and transport of DOM to deep waters. This mechanism includes the transformation of the labile DOM of euphotic zone into recalcitrant DOM through the microbial carbon pump (Jiao et al., 2010). Since the production, transformation, and consumption of organic matter in aquatic ecosystems is strongly dependent on DOM composition (D’Andrilli et al., 2019), DOM quality represent a perspective indicator of biogeochemical trends related to climate change and anthropogenic stress (Wohlers et al., 2009; Savun-Hekimoğlu and Gazioğlu, 2021).
Recently, optical techniques have become widespread in the study of CDOM. It is related to multiple factors, such as i) fast and simple preparation of seawater for laboratory analysis, ii) developments of in situ fluorescence sensors (Carstea et al., 2020), iii) development of algorithms for CDOM and DOC determination with the use of satellite remote sensing (Griffin et al., 2018), iv) incubation experiments aimed to investigate production of FDOM by marine biota, i.e. (Castillo et al., 2010; Romera-Castillo et al., 2011), v) development PARAFAC decomposition of EEMs (Bro, 1997) and OpenFluor spectral library (Murphy et al., 2014), vi) investigation of the influence anthropogenic factors, such as oil pollution (Gonnelli et al., 2016) and microplastics (Chen et al., 2018) on the fluorescence spectra of natural waters. Consequently, in the study of Jaffé et al. (2008) the importance of absorbance and fluorescence measurements as a part of long-term ecological research and monitoring programs were emphasized, since they may provide an advanced understanding of organic matter dynamics in aquatic ecosystems.
In the recent decades, the Arctic is undergoing significant transformations induced by climate change. Carbon fluxes and sources of DOM are changing due to increase in the discharge of major rivers terminating in the Arctic, reduce the ice cover, and melting of permafrost (Box et al., 2019 and references therein). Sub-sea permafrost thaw and formation of taliks result in release of organic matter of glacial origin or modern production from ancient organic matter (Anderson et al., 2011; Vonk et al., 2012). The resulting microbial decomposition of frozen carbon pool is a potential feedback process affected global climate dynamics accelerating global warming (Schuur et al., 2008). The Siberian shelf seas, in particular the East Siberian Sea, are considered to be the most affected by the above changes.
Although a lot of studies were devoted to the CDOM optical properties in the Arctic Ocean, see, for example (Stedmon et al., 2011; Gonçalves-Araujo et al., 2015; Mann et al., 2016), СDOM and especially FDOM of the East Siberian Sea shelf, remains one of the least investigated. In the paper of Mann et al. (2012) DOC concentration and the composition of CDOM across the hydrograph in Siberia’s Kolyma River is discussed. Water sampling was performed in the vicinity of the Northeast Science Station near Cherskiy, Russia. The composition of DOM within the Kolyma basin was characterized using absorbance-derived measurements and fluorescence spectroscopy, including EEMs + PARAFAC analysis. The B, T, M, A, and C fluorophores according to Coble (Coble et al., 1998) were identified, and substantial losses of DOC occurring via biological and photochemical pathways were demonstrated. The study of Guéguen et al. (Guéguen et al., 2012) examined seawater FDOM outside the East Siberian Sea shelf north of 75○N at depths >100 m. Two protein-like (B, T) and three humic-like (A/C, M) components were identified by PARAFAC. High protein-like and terrestrial humic-like FDOM signals were most often associated with surface waters. Microbial/marine humic-like component was associated with the middle halocline at depth 50-200 m. It was suggested to be of Pacific origin. Another study of East Siberian Sea FDOM was performed recently by Chen et al. (2021) as a part of investigation of organic carbon release from the sediments of East Siberian subsea permafrost. The shelf (north of 73○N) and slope sites were examined. Six FDOM components, namely four humic-like and two protein-like, were identified from PARAFAC modeling. Strong signals of terrestrial humic-like FDOM in seawater and pore waters allowed suggesting the predominance of permafrost-derived DOM over the products of marine sediment mineralization. Marine/microbial humic-like component was found to be more abundant in the seawaters on the slope sites (28-47%) compared to East Siberian shelf waters (8-16%).
This paper focuses on characterization of FDOM in East Siberian Sea waters influenced by Indigirka and Kolyma rivers in the end of the productive period when the finality of phytoplankton development was detected (Drits et al., 2019). It continues the investigation of East Siberian Sea DOM (Drozdova et al., 2021), that revealed high variability of seawater absorbance and DOC that cannot be described by conservative mixing often reported for the river-influenced Arctic coastal regions. Other areas under investigation are the western and central parts of the Laptev Sea influenced by the Khatanga and Lena river runoff. With respect to the East Siberian Sea, the Laptev Sea represents a contrasting example of a river-influenced shelf region where DOC was distributed conservatively. The study is based on excitation-emission matrices of seawater, sampled during the 69th cruise of R/V Akademik Mstislav Keldysh in September 2017. We analyze the distribution of PARAFAC components along the 4 cross-shelf transects to get a better understanding of DOM quality in the region.
Methods
Sampling
Water samples were collected during the 69th cruise of R/V Akademik Mstislav Keldysh in the Laptev and East Siberian seas in September 2017. We consider three shelf-crossing transects that include the areas influenced by the Khatanga, Indigirka and Kolyma runoff, as well as individual sampling sites in the region affected by the Lena River runoff. The location of the sampling stations is given in Figure 1. Water depth of the stations varied from 13 m in the inner East Siberian shelf (station 5598) to 178 m at the northernmost station of the Khatanga transect (5634).
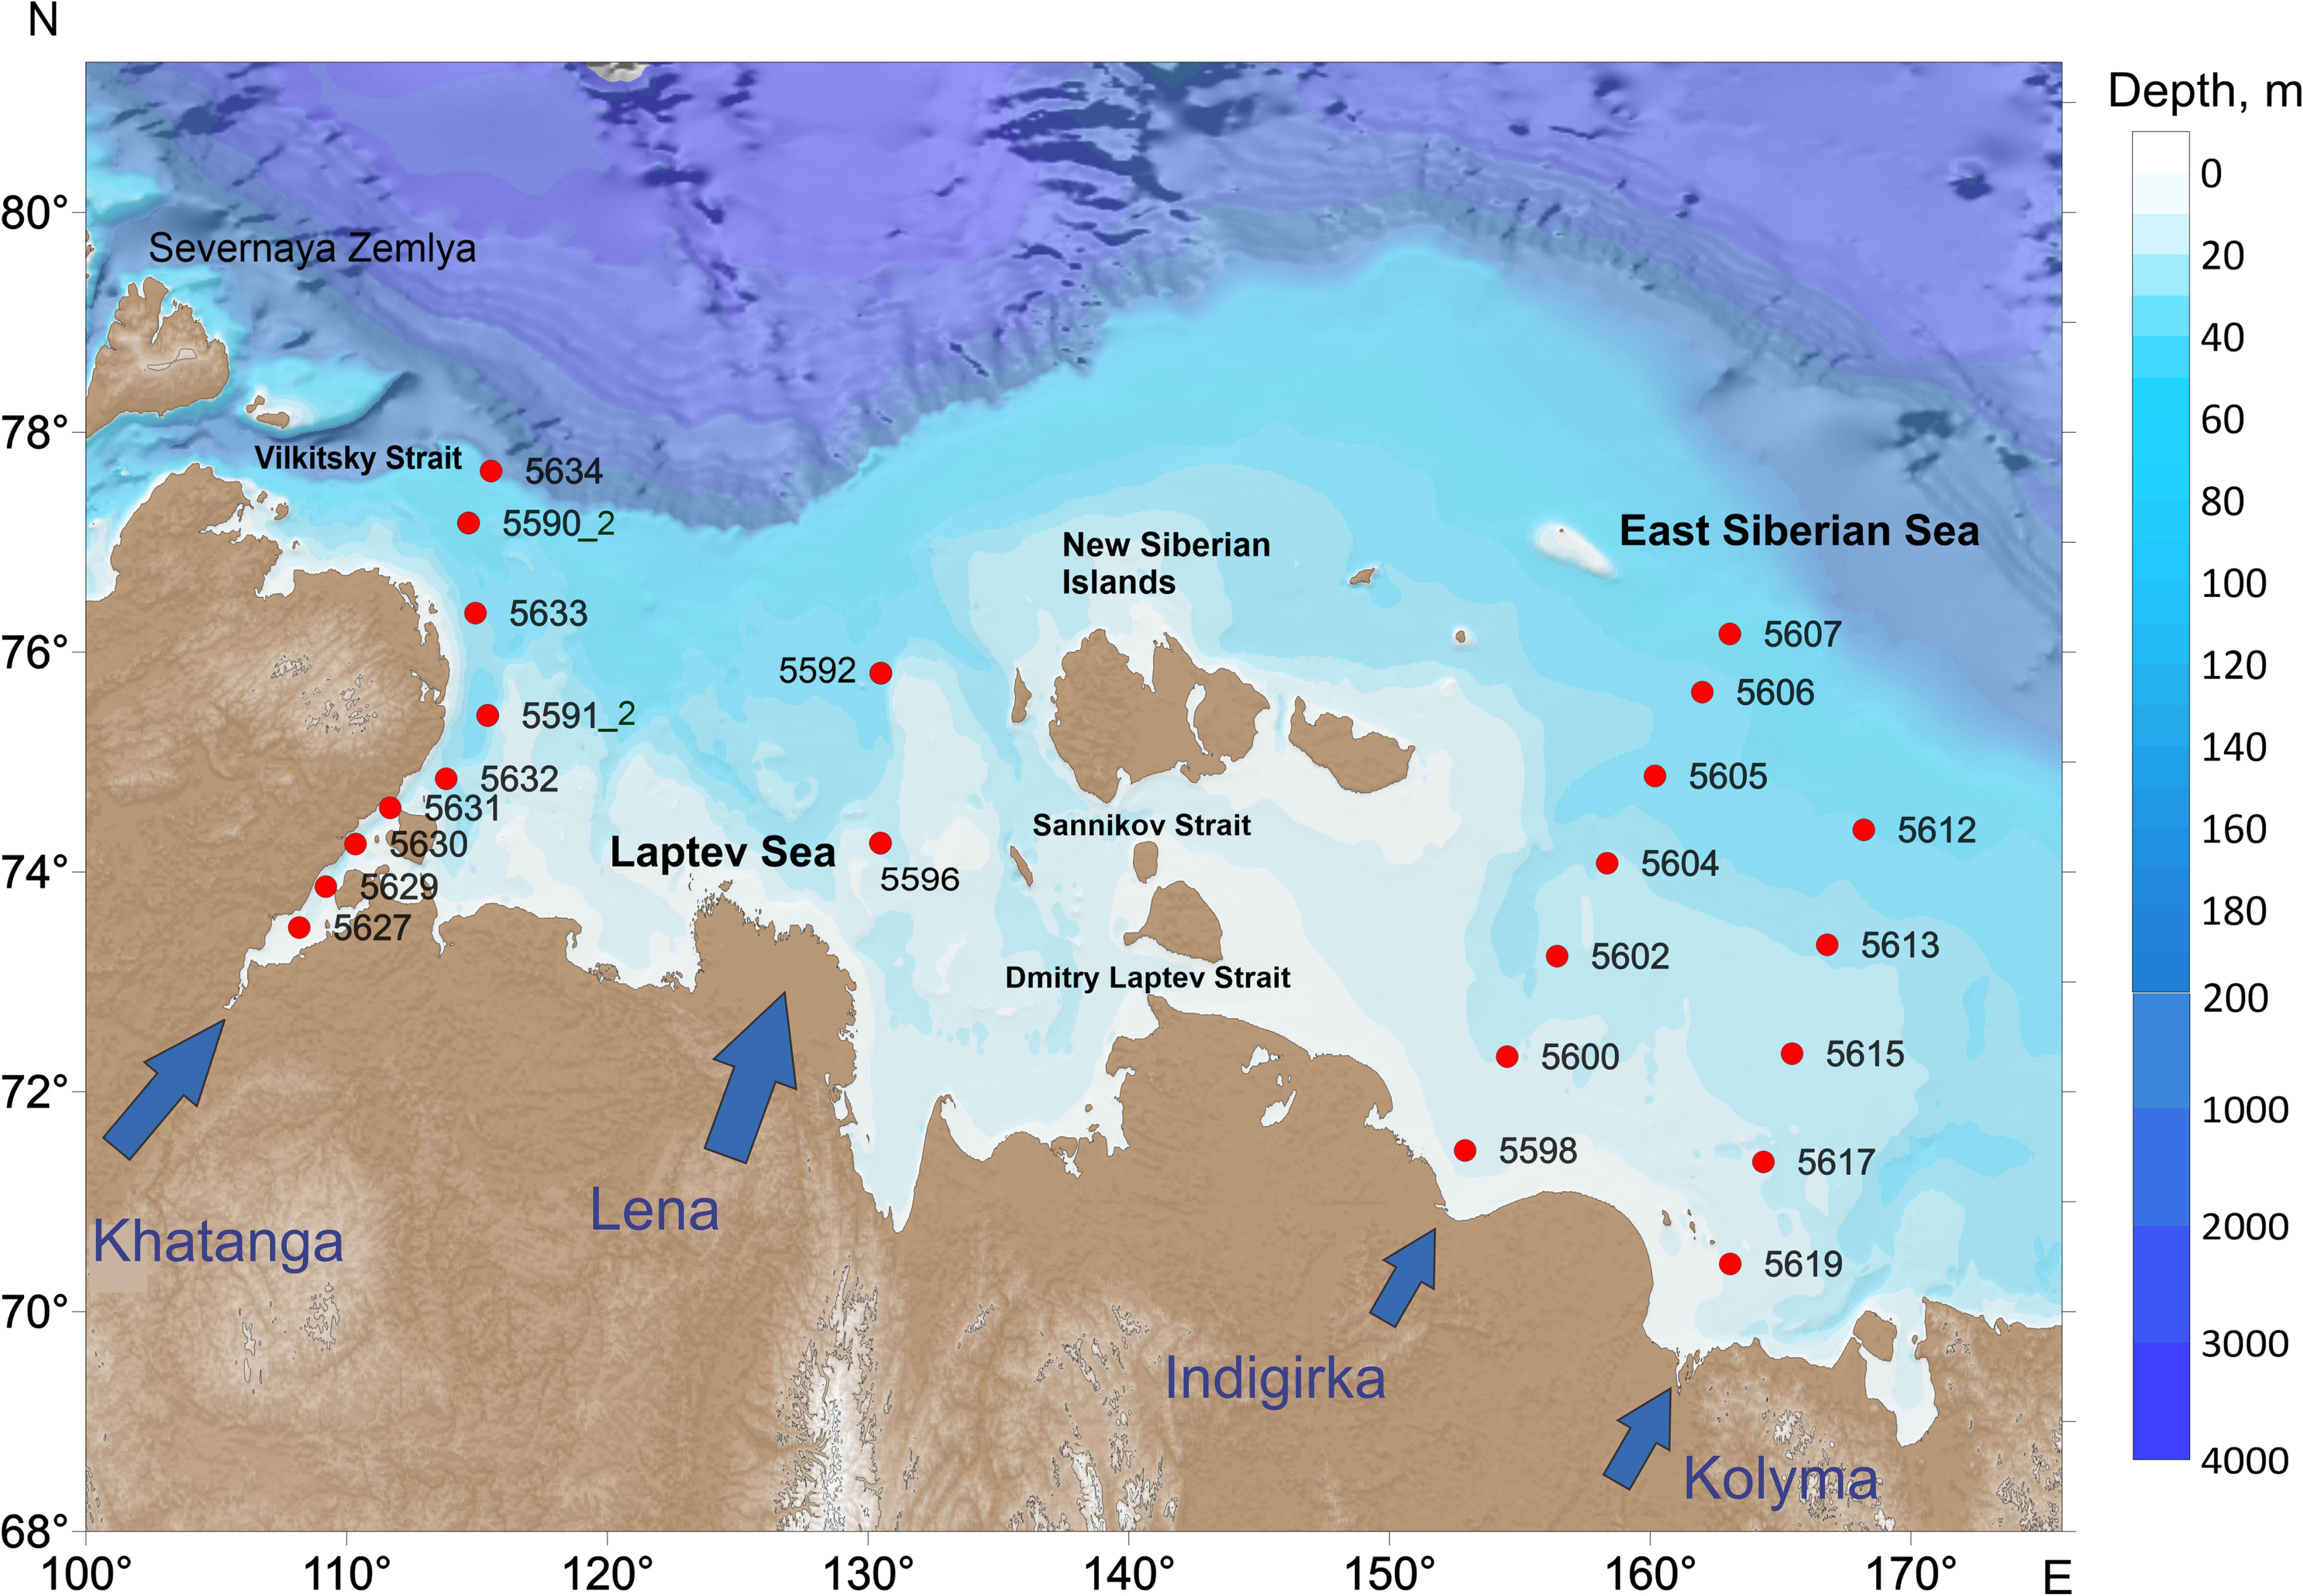
Figure 1 Sample site locations during the 69th cruise of the R/V Akademik Mstislav Keldysh.
Water samples were taken using Niskin bottles of 5 L volume from near-surface, mid-water and bottom layers. Maximal sampling depth was 50 m. Additional discrete sampling depths, associated with boundaries of large gradients of temperature and salinity, were chosen on the basis of CTD profiles obtained with the SBE 911plus CTD probe (Drozdova et al., 2021). The CTD pressure, temperature and conductivity sensors were calibrated in 2015 by Sea-Bird (temperature accuracy 0.001°C, conductivity accuracy 0.0003 S/m and pressure accuracy 0.015% of full-scale range). All the samples were gravity-filtered through pre-combusted at 450°C Whatman GF/F glass fiber filters with nominal pore size of 0.7 µm directly after the sampling. A Sartorius 47 mm polycarbonate in-line filter holder was use for filtration. The filtrate was collected into the acid-cleaned 10 mL glass vials and stored under dark conditions at 4°C until further analysis.
EEM registration
Fluorescence measurements were performed with a Fluorat-02-Panorama spectrofluorometer (Lumex Instruments) equipped with a Xenon flash lamp as a light source, and a PMT as a detector of luminescence signals. A signal averaging over 20 flashes was applied in order to compensate instability of the flash lamp intensity. The accuracy of excitation and detection wavelength settings was ascertained on a basis of Xe atomic line position and estimated as ±1 nm, spectral resolution of monochromators was 5 nm (Drozdova et al., 2019). Emission spectra were recorded between 240 and 600 nm with a 2‐nm increment, and the excitation wavelengths were recorded from 230 to 550 nm with a 5‐nm increment. Fluorescence measurements were performed in 1 cm quartz cuvette. The inner-filter effect has been corrected using the measured absorbance spectra (Drozdova et al., 2019), in accordance with the following expression (Kothawala et al., 2013; Lakowicz, 2013):
where Iorig ( λem ,λex ) is the detected fluorescence intensity, Icorr ( λem ,λex ) is the corrected fluorescence intensity, A( λex ) and A( λem ) represent absorbances at the wavelength of excitation and emission, respectively, related to optical path length of labs .
PARAFAC analysis
The analysis was carried out using the R programming language and the Albatross package (Krylov et al., 2020) and its dependencies. Fluorescence signal is typically assumed to adhere to a trilinear model (Bro, 1997):
In this formula, Xi,j,k is the intensity of fluorescence of the k th sample, measured at i th emission wavelength and j th excitation wavelength, while the A , B , C matrices contain the emission spectra, excitation spectra and relative contributions of each fluorophore in the mixture. Excitation-emission matrices typically contain a scattering component that doesn’t adhere to the PARAFAC model and must therefore be handled before performing the analysis. In this work, areas of each EEM corresponding to 1st and 2nd diffraction order Rayleigh and Raman scattering were interpolated using Whittaker smoothing (Eilers, 2003) with combined 1st and 2nd difference order penalty. Prior to performing the analysis, each EEM was scaled (Bro and Smilde, 2003) by its standard deviation to prevent extreme fluorescence intensity values from affecting the PARAFAC solution.
The PARAFAC model has been validated using the split-half approach, by repeatedly splitting the dataset in randomly-selected halves as it is described by us earlier (Krylov et al., 2020), performing PARAFAC on them and assessing the similarity of the resulting decompositions. The probable identities of the resulting PARAFAC components were determined by comparing their fluorescence and absorbance spectra with OpenFluor database (Murphy et al., 2014) with Tucker’s congruence coefficient (TCC) set at a 95%.
Chlorophyll-a
For the measurement of chlorophyll-a (chl-a) concentration, water samples were collected with Niskin bottles at selected depths according to the CTD profile and the in situ fluorometer readings. 500 ml of water were filtered on GF/F filters. Extraction was carried out with 90% acetone in the dark at a temperature of +4°C for 24 hours. Chl-a concentration was measured fluorometrically in acetone extracts on a Trilogy Turner Designs fluorometer (USA) according to Holm-Hansen and Riemann (1978). The fluorometer was calibrated spectrophotometrically using pure chlorophyll-a (Sigma) as a standard.
Redundancy analysis
Redundancy analysis (RDA) (Rao, 1964) was performed using the R programming language, package “vegan”, version 2.5.7. We explored the relationship between the PARAFAC components values and various metadata of our samples, including salinity, temperature, DOC, absorption coefficients at 350 nm (aCDOM(350)) and spectroscopic indices given in Table 1.
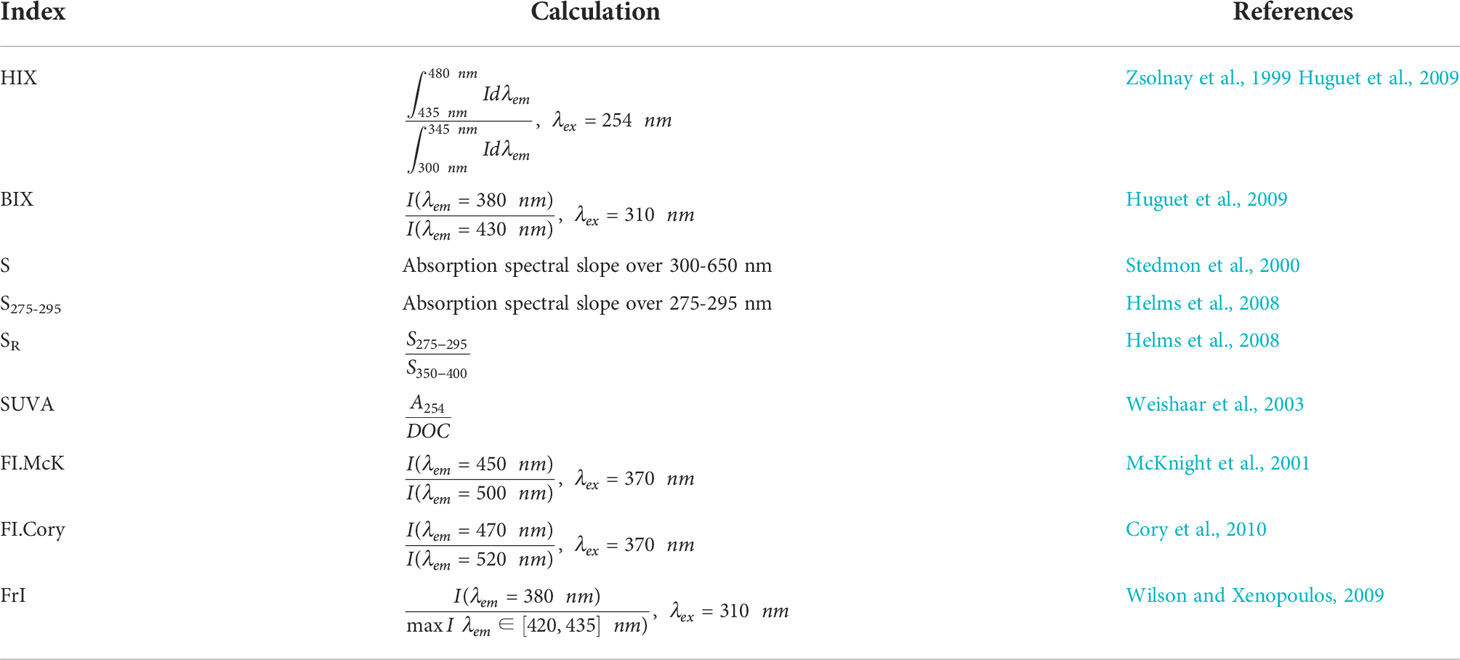
Table 1 Spectroscopic indices for identification the sources of organic matter.
Results
Study area
The Laptev and East Siberian seas represent the shallow (average water depths are ~50 m and 58 m) marginal seas of Siberian Shelf occupying 500×103 km2 and 987×103 km2, respectively (Jakobsson et al., 2004). They are covered by ice most of the year. Sea ice formation during the winter season and its melting in summer as well as spreading and transformation of river plumes has a major impact on physical and biogeochemical conditions of the East Siberian and Laptev seas (Dmitrenko et al., 2005; Savel’eva et al., 2008; Osadchiev et al., 2020).The spring flood occurs from the end of May to the beginning of July and constitutes 60%–90% of the riverine freshwater discharge (Raymond et al., 2007). The Laptev Sea receives large freshwater discharge from the Lena (590 km3 yr-1), Khatanga (105 km3 yr-1), Olenyok (36 km3 yr-1), and Yana (36 km3 yr-1) rivers. The East Siberian Sea is supplied by seawater from both the Atlantic and Pacific Oceans (Semiletov et al., 2005) and has a substantial input of Kolyma (136 km3 yr-1) and Indigirka (61 km3 yr-1) river runoff providing about 75% of the total freshwaters discharge to the East Siberian Sea (Pavlov et al., 1994; Gordeev et al., 1996; Holmes et al., 2002; Osadchiev et al., 2020). The western region is dominated by input of terrestrial-derived material from the Laptev Sea (Alling et al., 2010).
Detailed description of the hydrography of the studied areas is given in previous studies (Osadchiev et al., 2020; Drozdova et al., 2021). Variations of salinity and temperature along the transect are shown in Figure 2. Shortly, the surface water temperature varied from 3°CC in the Khatanga River estuary to −1°CC near the continental slope. Deep waters were characterized by temperatures below zero. Khatanga plume was weakly-stratified within the shallow inner part of the estuary (stations 5627–2629) due to intense tidal mixing in the Khatanga Gulf. Salinity along the Khatanga transect varied between 3.5 and 31.5 The surface water temperature at the Indigirka transect reached 6.2°CC at the station 5598 closest to the Indigirka delta and decreased gradually to −1.4°CC at station 5607 located near the ice edge. Negative temperatures of bottom water were typical for the inner shelf region (station 5601) at the 26 m depth. Low-salinity waters extended to a depth of 10–15 m. At the Kolyma transect, the surface water temperature on the inner shelf was 6.7°CC (stations 5619 and 5620) and decreased to 0.5 at the northern station 5612. In the shelf area adjacent to the Kolyma and Indigirka deltas, the minimum salinities were 17 and 15, respectively. The maximum salinity values were recorded at the northernmost stations 5607 (30 and 32.5 at the surface and bottom, respectively) and 5612 (29.2 and 31.2). Potential temperature-salinity diagram (Figure 3) demonstrates that the shelf waters of the Laptev and East Siberian seas were formed by mixing the warm fresh waters supplied by rivers, Arctic (ArW), and cold intermediate (CIW) waters. In comparison with ArW, CIW are characterized by lower salinity values of 31.5 – 33.5. They were formed on the shelf during winter convection. Warm salt (salinity > 34.5) waters related to the admixture of Atlantic waters entering the Arctic Ocean (Guéguen et al., 2012; Oziel et al., 2016) were detected at the 100-300 m depth of the northern part of the Khanatga transect. These stations, however, are not considered in the present study.
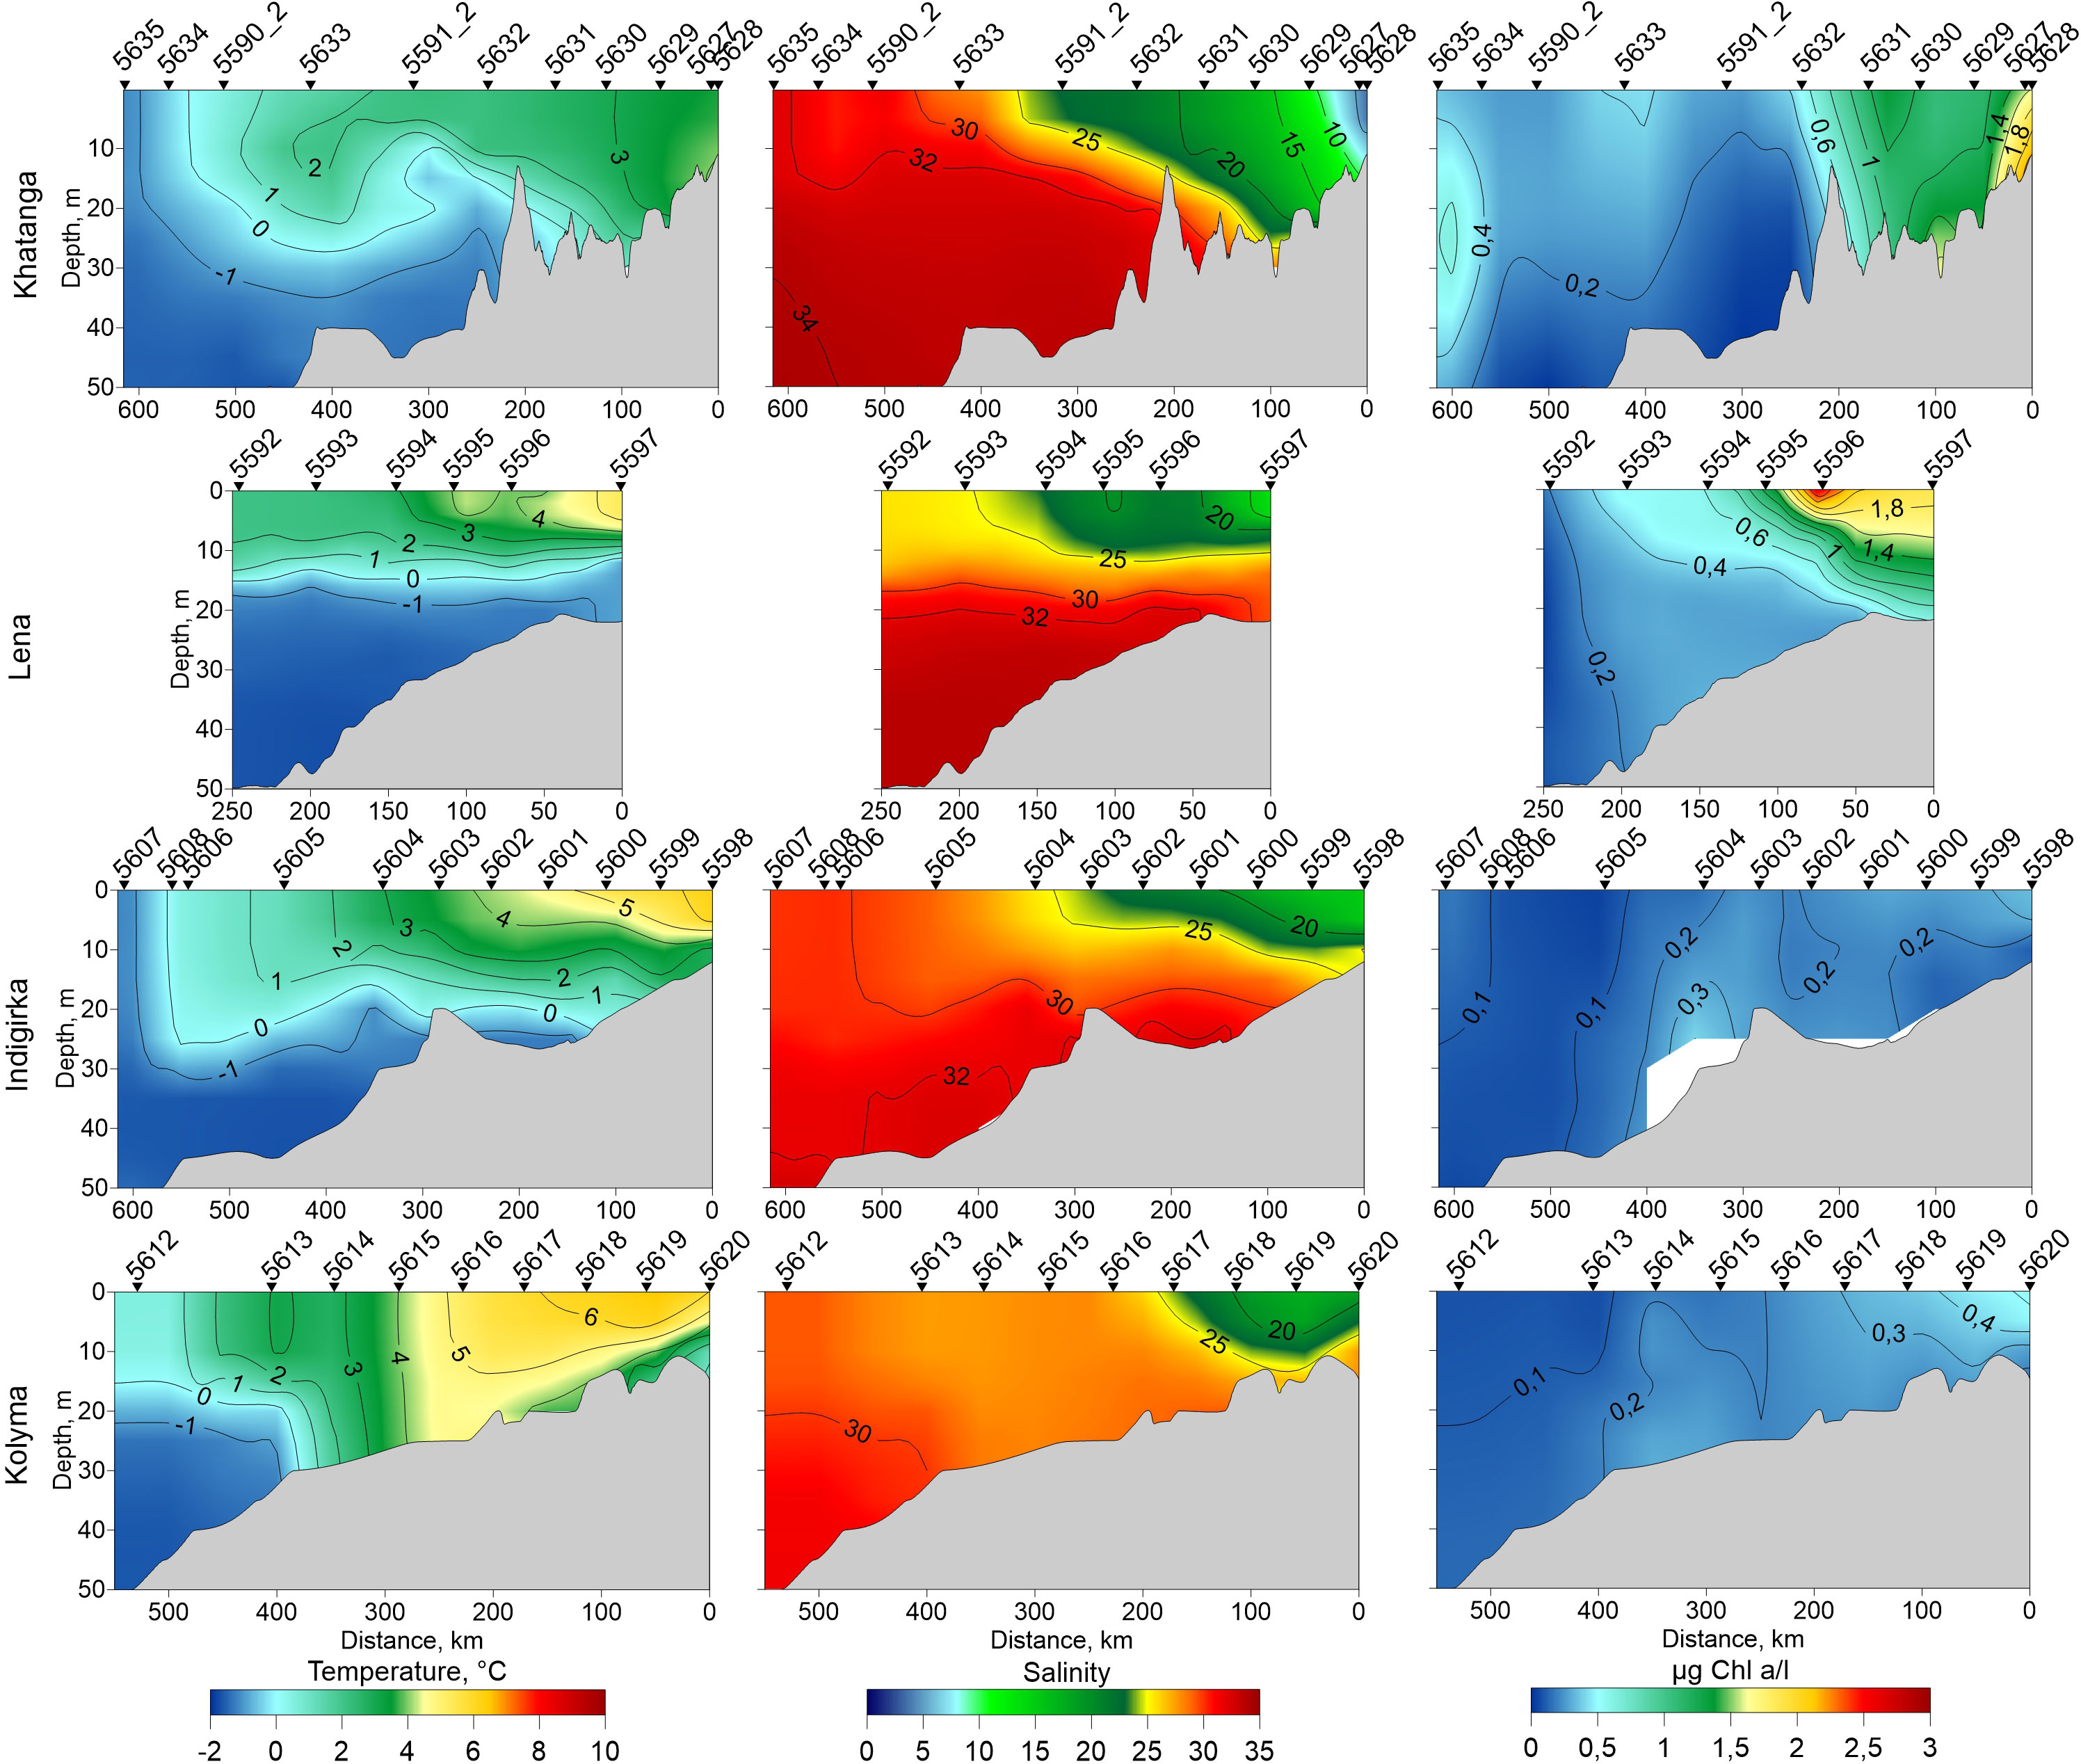
Figure 2 Distribution of temperature (left), salinity (middle) and chlorophyll-a (right) along the Khatanga (17-20 September), Lena (2-3 September), Indigirka (5-7 September) and Kolyma (8-9 September) transects.
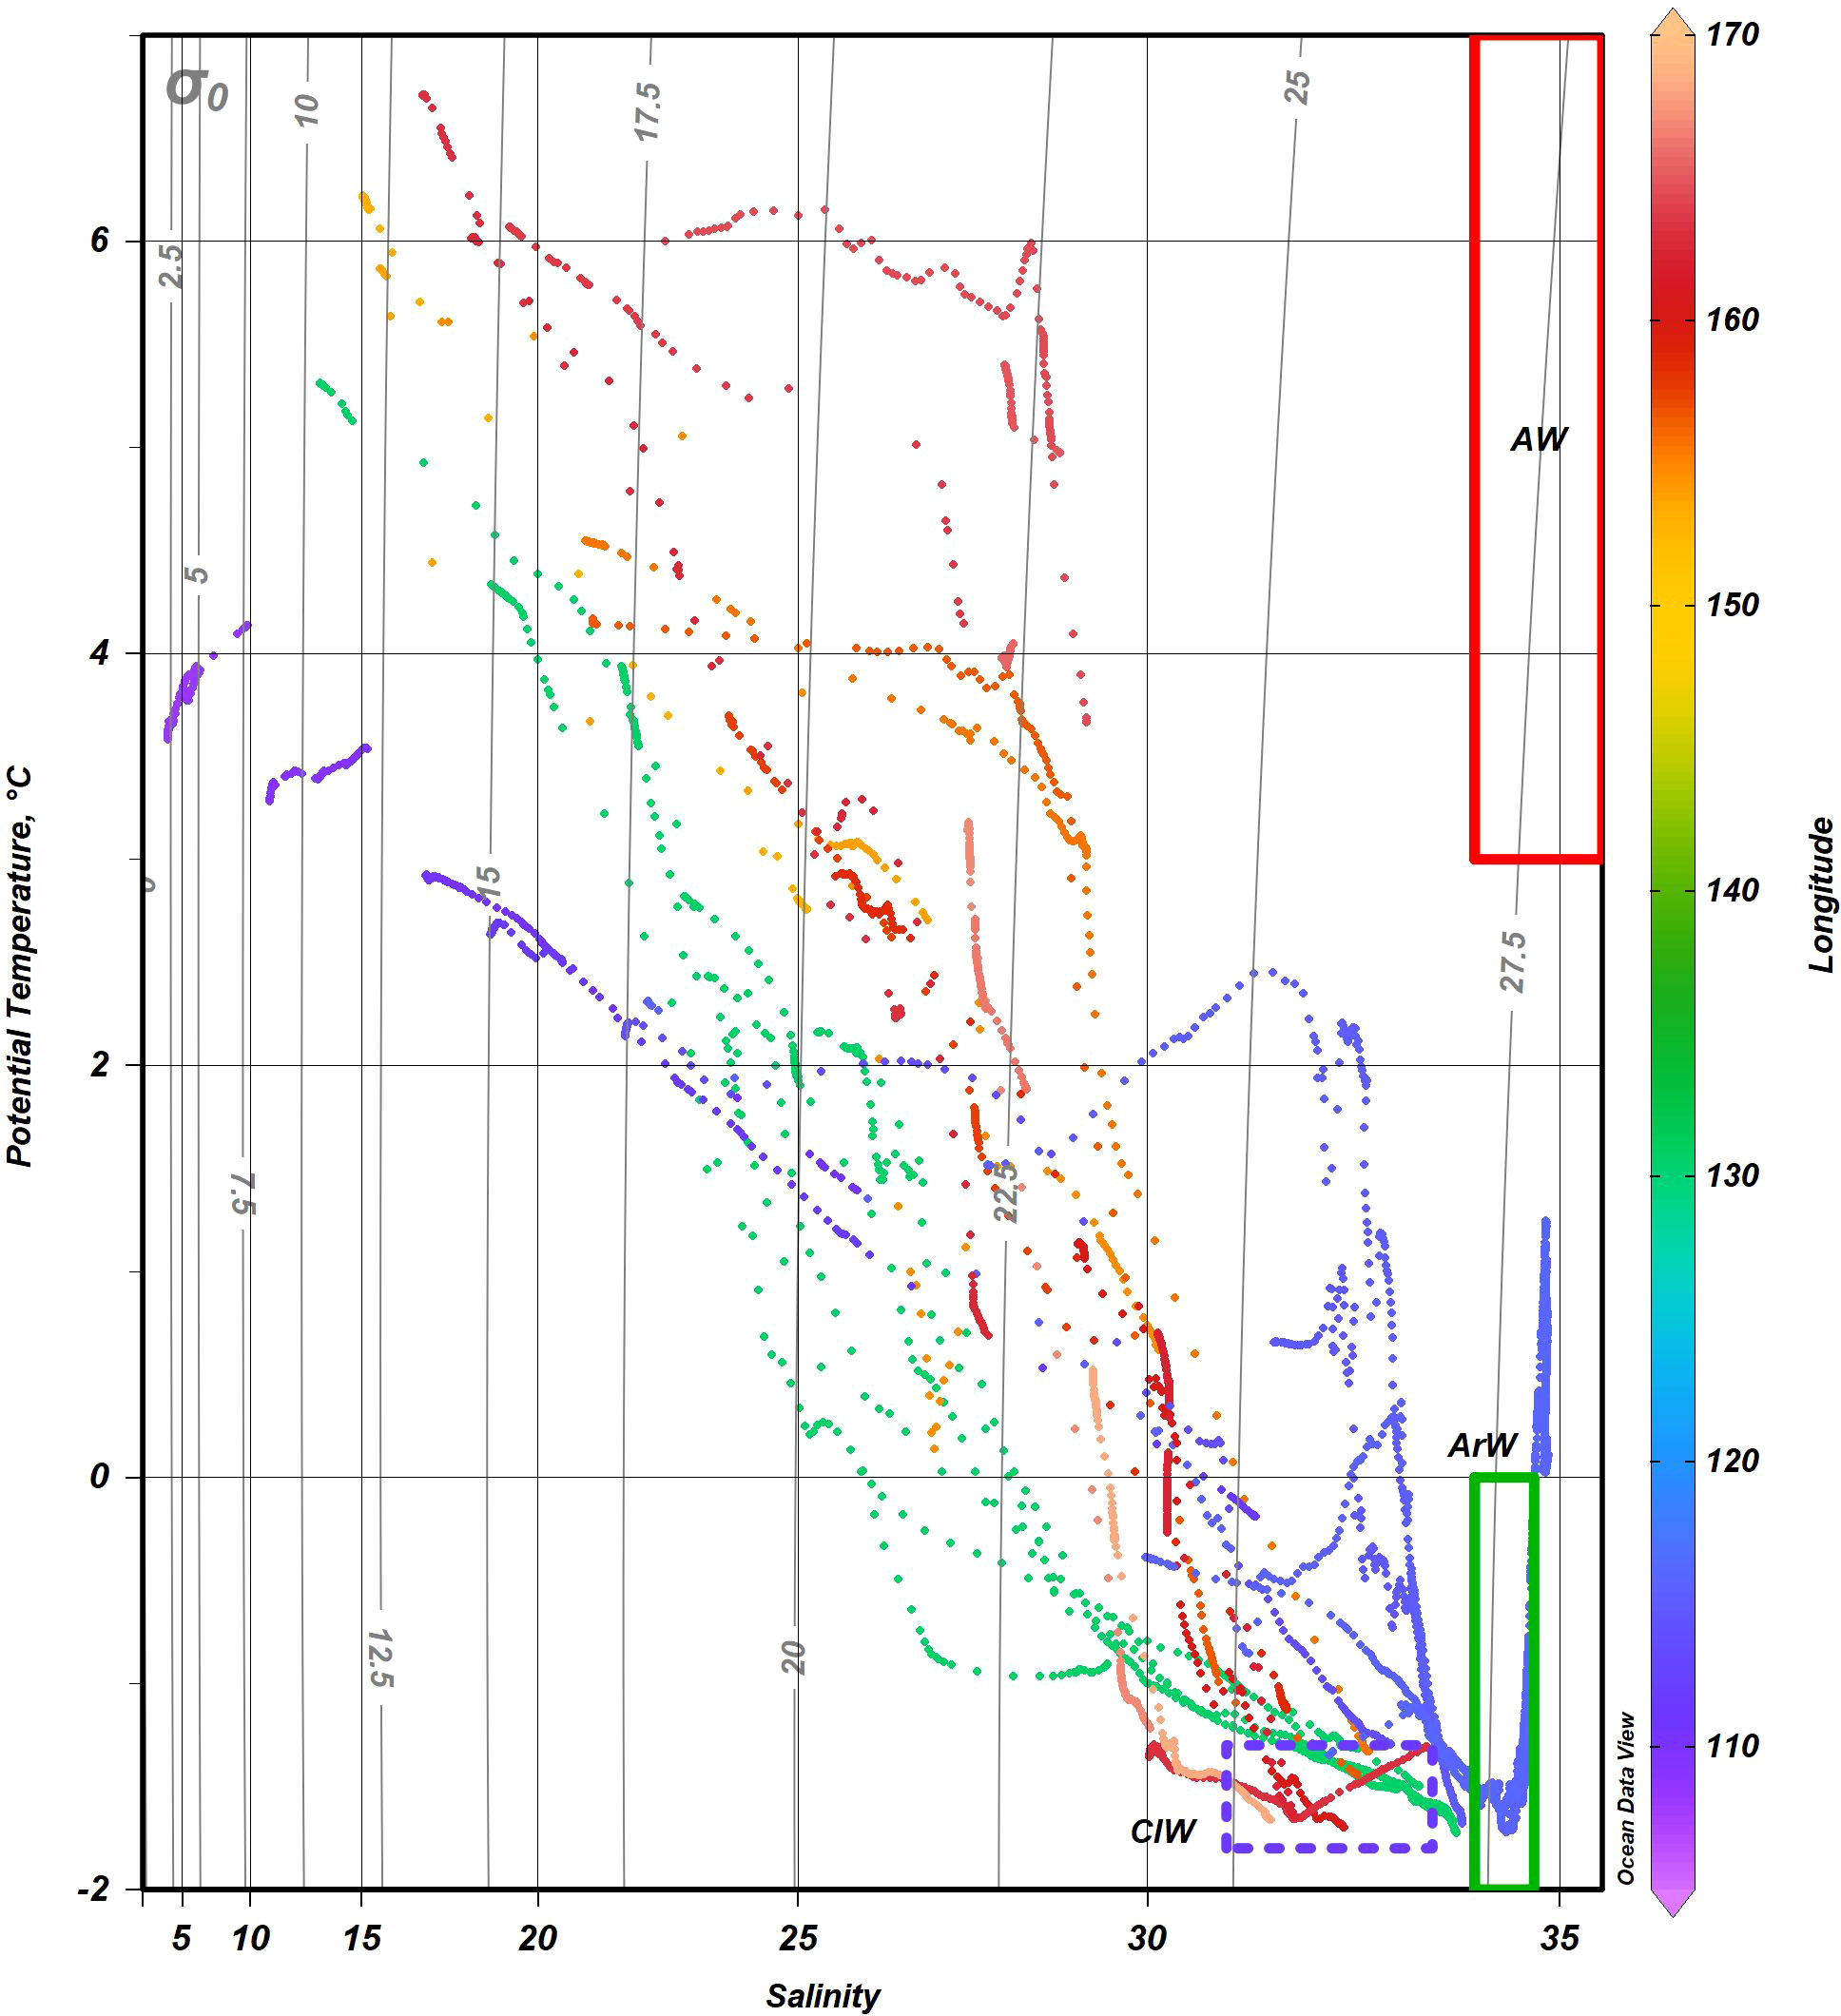
Figure 3 Potential temperature-salinity diagram over the shelf and slope regions of the Laptev and East Siberian seas. Blue dots correspond to Khatanga transect, green – Lena, orange – Indigirka, and red – Kolyma. Red and green rectangles correspond to Atlantic (AW) and Arctic (ArW) waters, respectively, in accordance with the water mass definition given in (Oziel et al., 2016). Blue dotted rectangle shows cold intermediate waters (CIW) formed during winter convection.
To examine the lateral transport of water masses among the transects the latitudinal component of geostrophic current velocity was calculated on the basis of hydrological sounding data with the Ocean Data View software (Schlitzer, 2020), see Figure S1 of Supplementary materials. The reference velocity horizons were chosen to ensure zero velocities in the near-bottom zones. The Indigirka and Khatanga transects were characterized by low latitudinal component of geostrophic current velocity of 2 cm s-1 and below, directed mainly to the east. Weak currents (~ 0.5 cm s-1) in the opposite direction were observed in the central parts of transects at the stations 5602 (Indigirka) and 5615 (Kolyma). The Laptev Sea showed higher current velocities up to 7 cm s-1. In case of the Khatanga transects the maximal velocity of 6 cm s-1 was observed in the upper water layer in the continental slope region, while in the Lena transect the eastward current of 7 cm s-1 was detected in between the station 5596 and 5592. The obtained results on geostrophic current velocities should be used with caution due to the ambiguous choice of the reference velocity horizons as well as large distances between the stations where CTD measurements were performed.
Chl-a concentration along the transects is shown in Figure 2. Generally, chl-a distribution features were similar along all four transects. Concentrations were maximum in the areas influenced by river runoff and then noticeably decreased towards the north. In the freshened layers of the Khatanga and Lena transects the concentration was mostly higher than 1 µg Chl l-1. Outside the plume the chl-a concentration at the Laptev Sea shelf varied between 0.4-0.2 µg l-1. An exception was the northernmost stations on the Khatanga transect, located near the ice edge. A deep maximum of chl-a (about 1 µg l-1) was observed there at a depth of 25 m, apparently formed by a recent near-ice phytoplankton bloom. The East Siberian Sea was characterized by low chlorophyll values decreasing in the south-north direction from 0.44 to 0.03 µg l-1 at the Kolyma transect and from 0.48 to 0.04 µg l-1 at the Indigirka transect. The obtained results on chl-a distribution are consistent with the data reported for the Laptev Sea (Demidov et al, 2019; Demidov et al, 2020) and the East Siberian Sea (Ershova and Kosobokova, 2019) in autumn season.
Optical studies revealed the mixed autochthonous-allochthonous character of CDOM at the Indigirka transect. Kolyma transect cites east of 160°CE were distinguished by the presence of autochthonous CDOM in seawater (Drozdova et al., 2021). This is in a good agreement with the results of Semiletov et al. (2005), showing that a significant component of freshwater from Siberian river inflows extends to ~160°CE, where the long-term average position of the Pacific frontal zone is located. The DOC content varied in the range between 82.8 and 886.7 µM. In the Laptev seas, the higher DOC concentrations were measured for the upper fresher water layer formed under the influence of Lena and Khatanga runoff. At the Kolyma transect DOC varied between 125.8 and 505.0 µM for the salinity range 17.0–31.5. The Indigirka transect covered a larger salinity gradient from 15.2 to 33.4. The values of DOC varied there from 165.0 to 526.7 µM. The surface waters of the transect were characterized by moderate DOC concentrations of 236.7–393.3 µM with its local increase up to 520.0 µM at the station 5606. In contrast to the Laptev seas, the linkage between DOC and hydrological parameters in the East Siberian Sea was not observed. DOC was distributed rather randomly, with significant DOC concentrations of 300–526.7 µM typical for both Indigirka and Kolyma plumes and continental slope region (Drozdova et al., 2021).
FDOM PARAFAC components
The modeled data set contained 137 EEMs of the samples collected in 2017 in the East Siberian and Laptev seas. Initial split-half results showed 5 as possible candidate for the number of components (Supplementary Figure S2), demonstrating the median value of TCC between PARAFAC components of cube halves above the 0.95 threshold (Supplementary Figure S3), while the TCC varies in a significant range of and the 2nd component scores are highly correlated with those for 1st and 5th components (Supplementary Figure S4). The latter resulted from high variance at the shortest wavelengths, and this effect in turn may be related with fluorescence quenching by dissolved oxygen and absorbance of excitation radiation by the inorganic constituents of seawater (bromide, bisulfide, nitrate and nitrite), at the range 210-250 nm (Johnson and Coletti, 2002). Dataset with cut off excitation below 255 nm led to perfect 4-component model (Figure 4) meeting the strictest criteria for model validation, when even the minimal value of TCC between halves is higher 0.95 (Figure 5). Thus, we decided to consider the reliable 4-component model, excluding consideration of short wavelengths excitation that can be distorted by inorganic components. Excitation and emission maxima for each PARAFAC component are given in Table 2, providing also a comparison with the results of previous studies of East Siberian Sea FDOM.
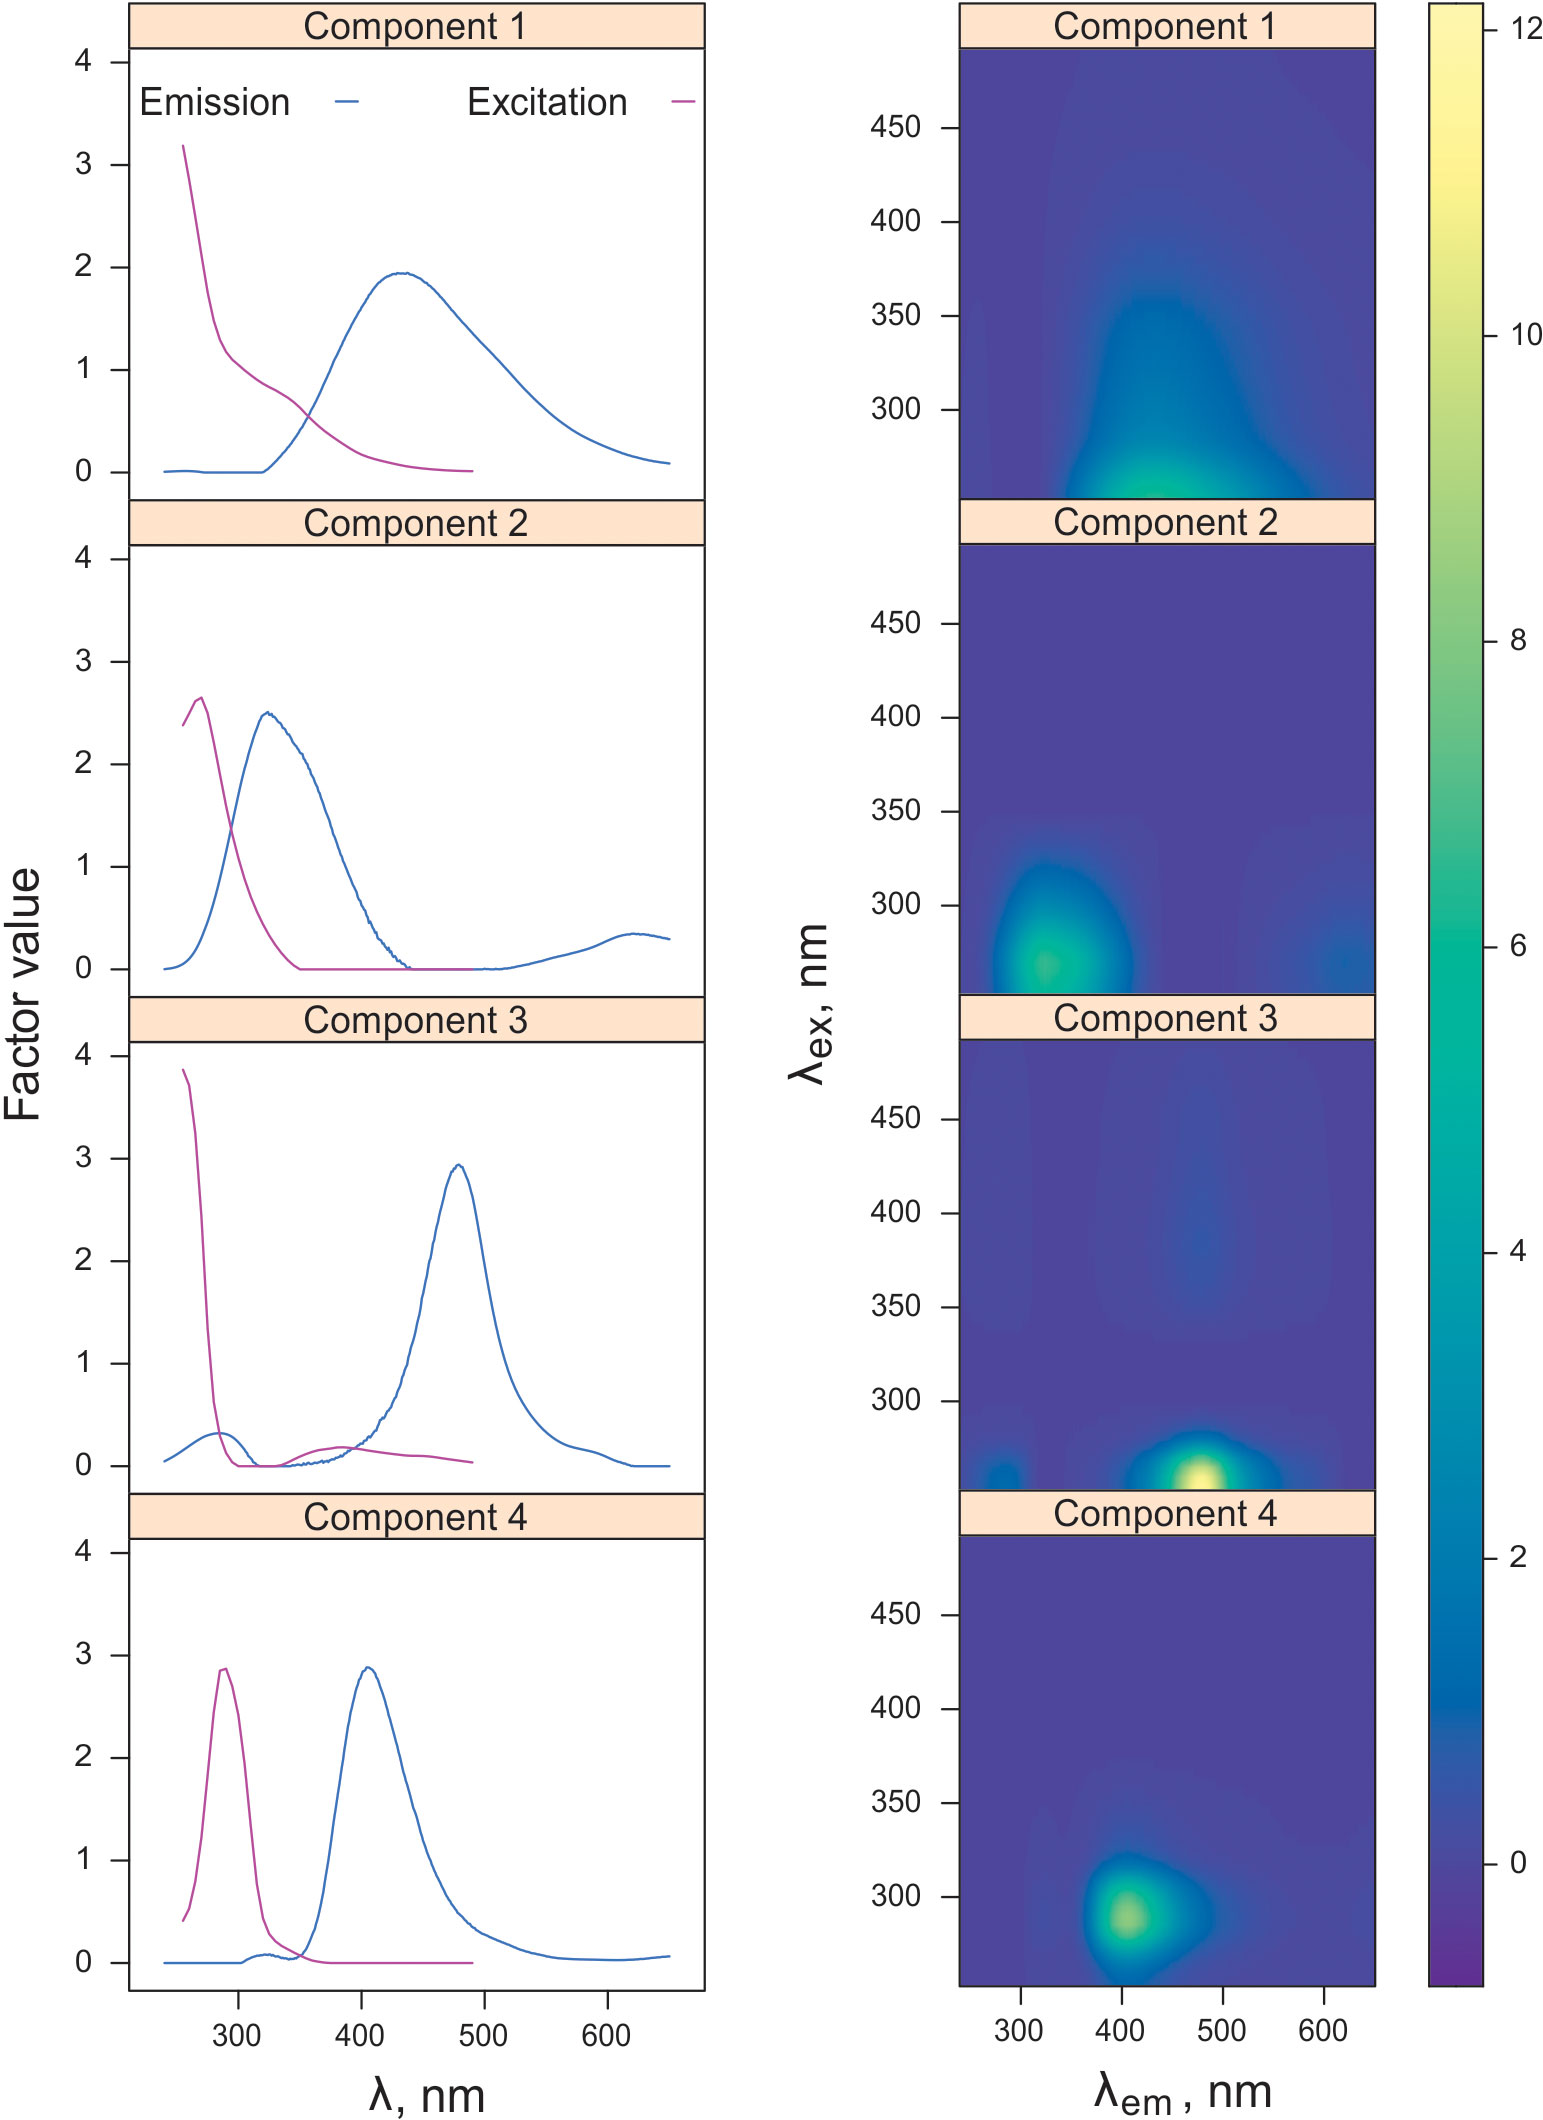
Figure 4 Excitation and emission spectra (left panel) and excitation-emission matrices (right panel) for each identified PARAFAC component.
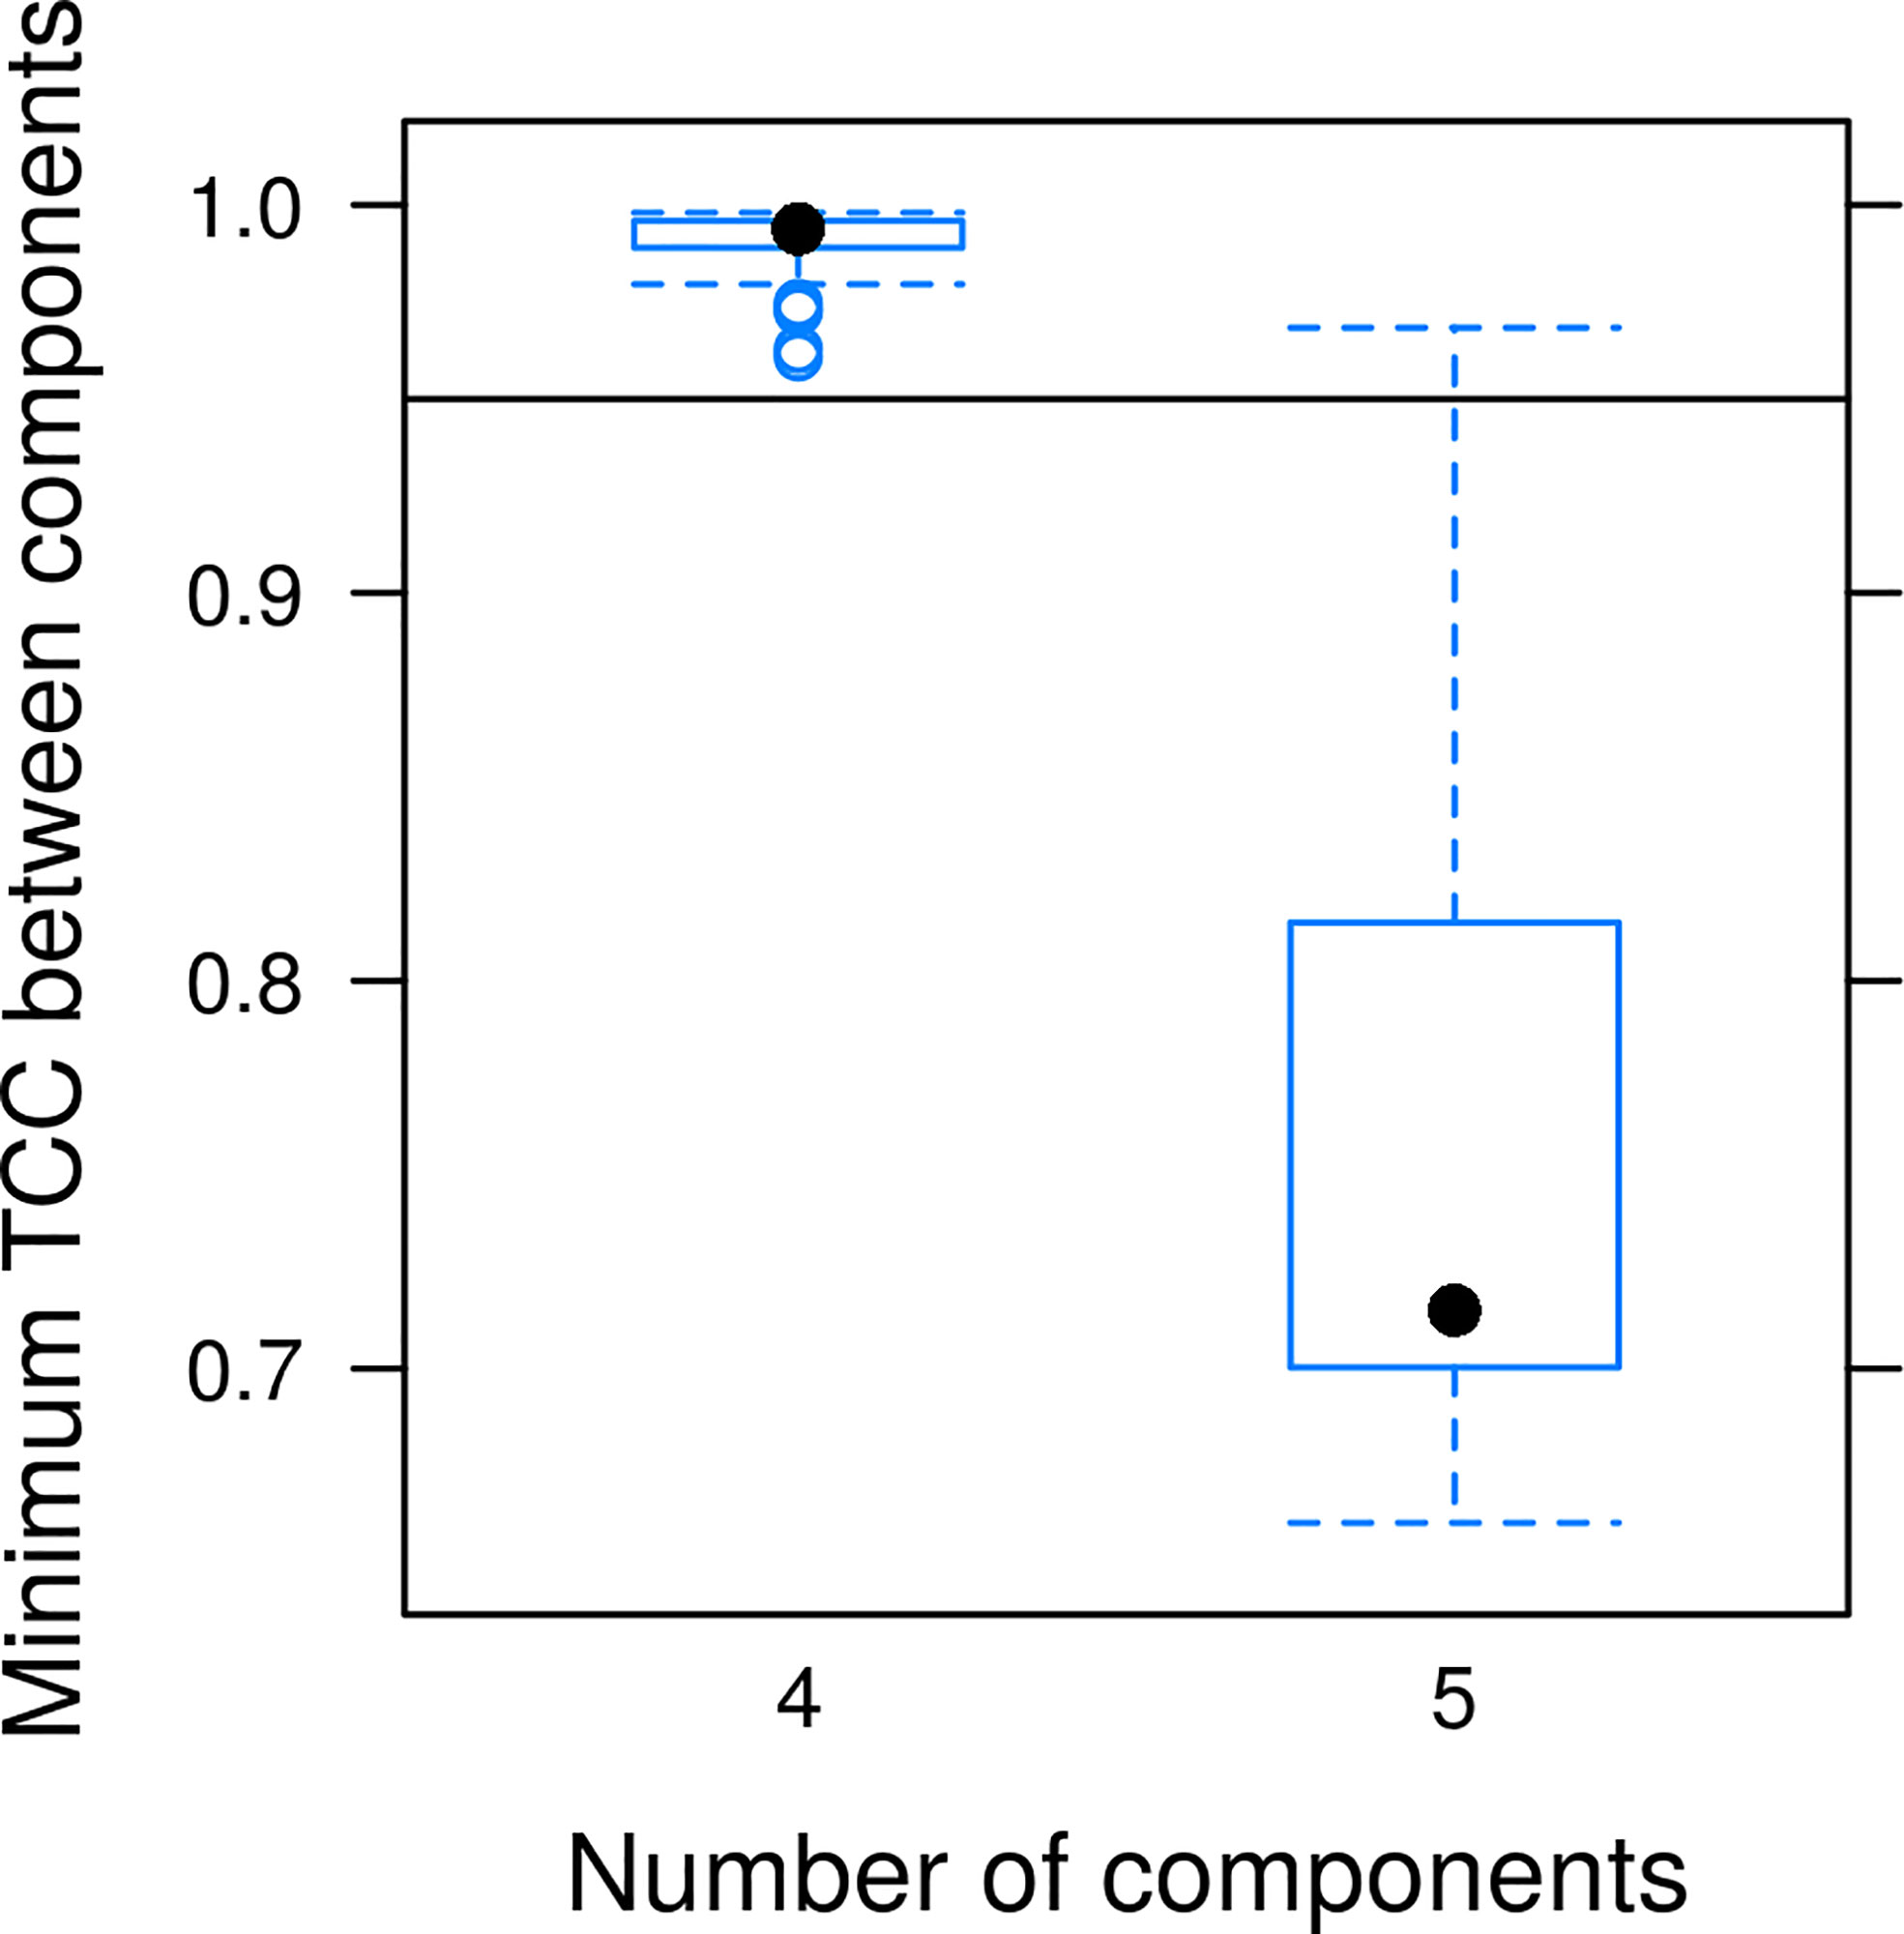
Figure 5 Split-half validation for the PARAFAC model. The dataset has been randomly shuffled and split in halves 100 times; a PARAFAC decomposition was computed for every split. After reordering the components according to best match by ‘TCC, the minimal TCC value among all pairs of emission and excitation components was taken for every pair of decompositions.
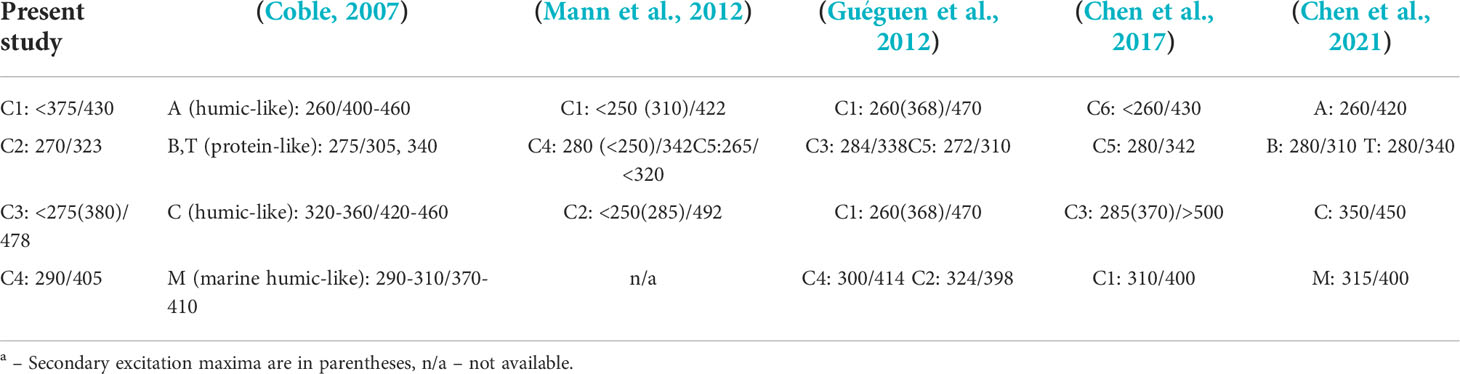
Table 2 Excitation and emission maxima of four PARAFAC components compared to results of previous studies of East Siberian Sea FDOMa.
Distribution of FDOM
Distribution of FDOM PARAFAC component C1 along the three cross-shelf transects (Figure 6) agrees well with distribution of low salinity waters: the maximal concentrations were observed in areas influenced by Khatanga, Indigirka and Kolyma river runoff. As the distance from the coast increased, the fluorescence intensity of C1 gradually decreased. In the waters sampled along the 130○E we observed the predominance of humic-like C1 component. Closer to the Lena Delta (station 5596) the fraction of C1 was accounted for 70-80% through the entire water column, and it decreased up to 44% in deeper waters farther north (station 5592). At the same time the increase of C2 (up to 20%) and C3 (up to 35%) was measured.
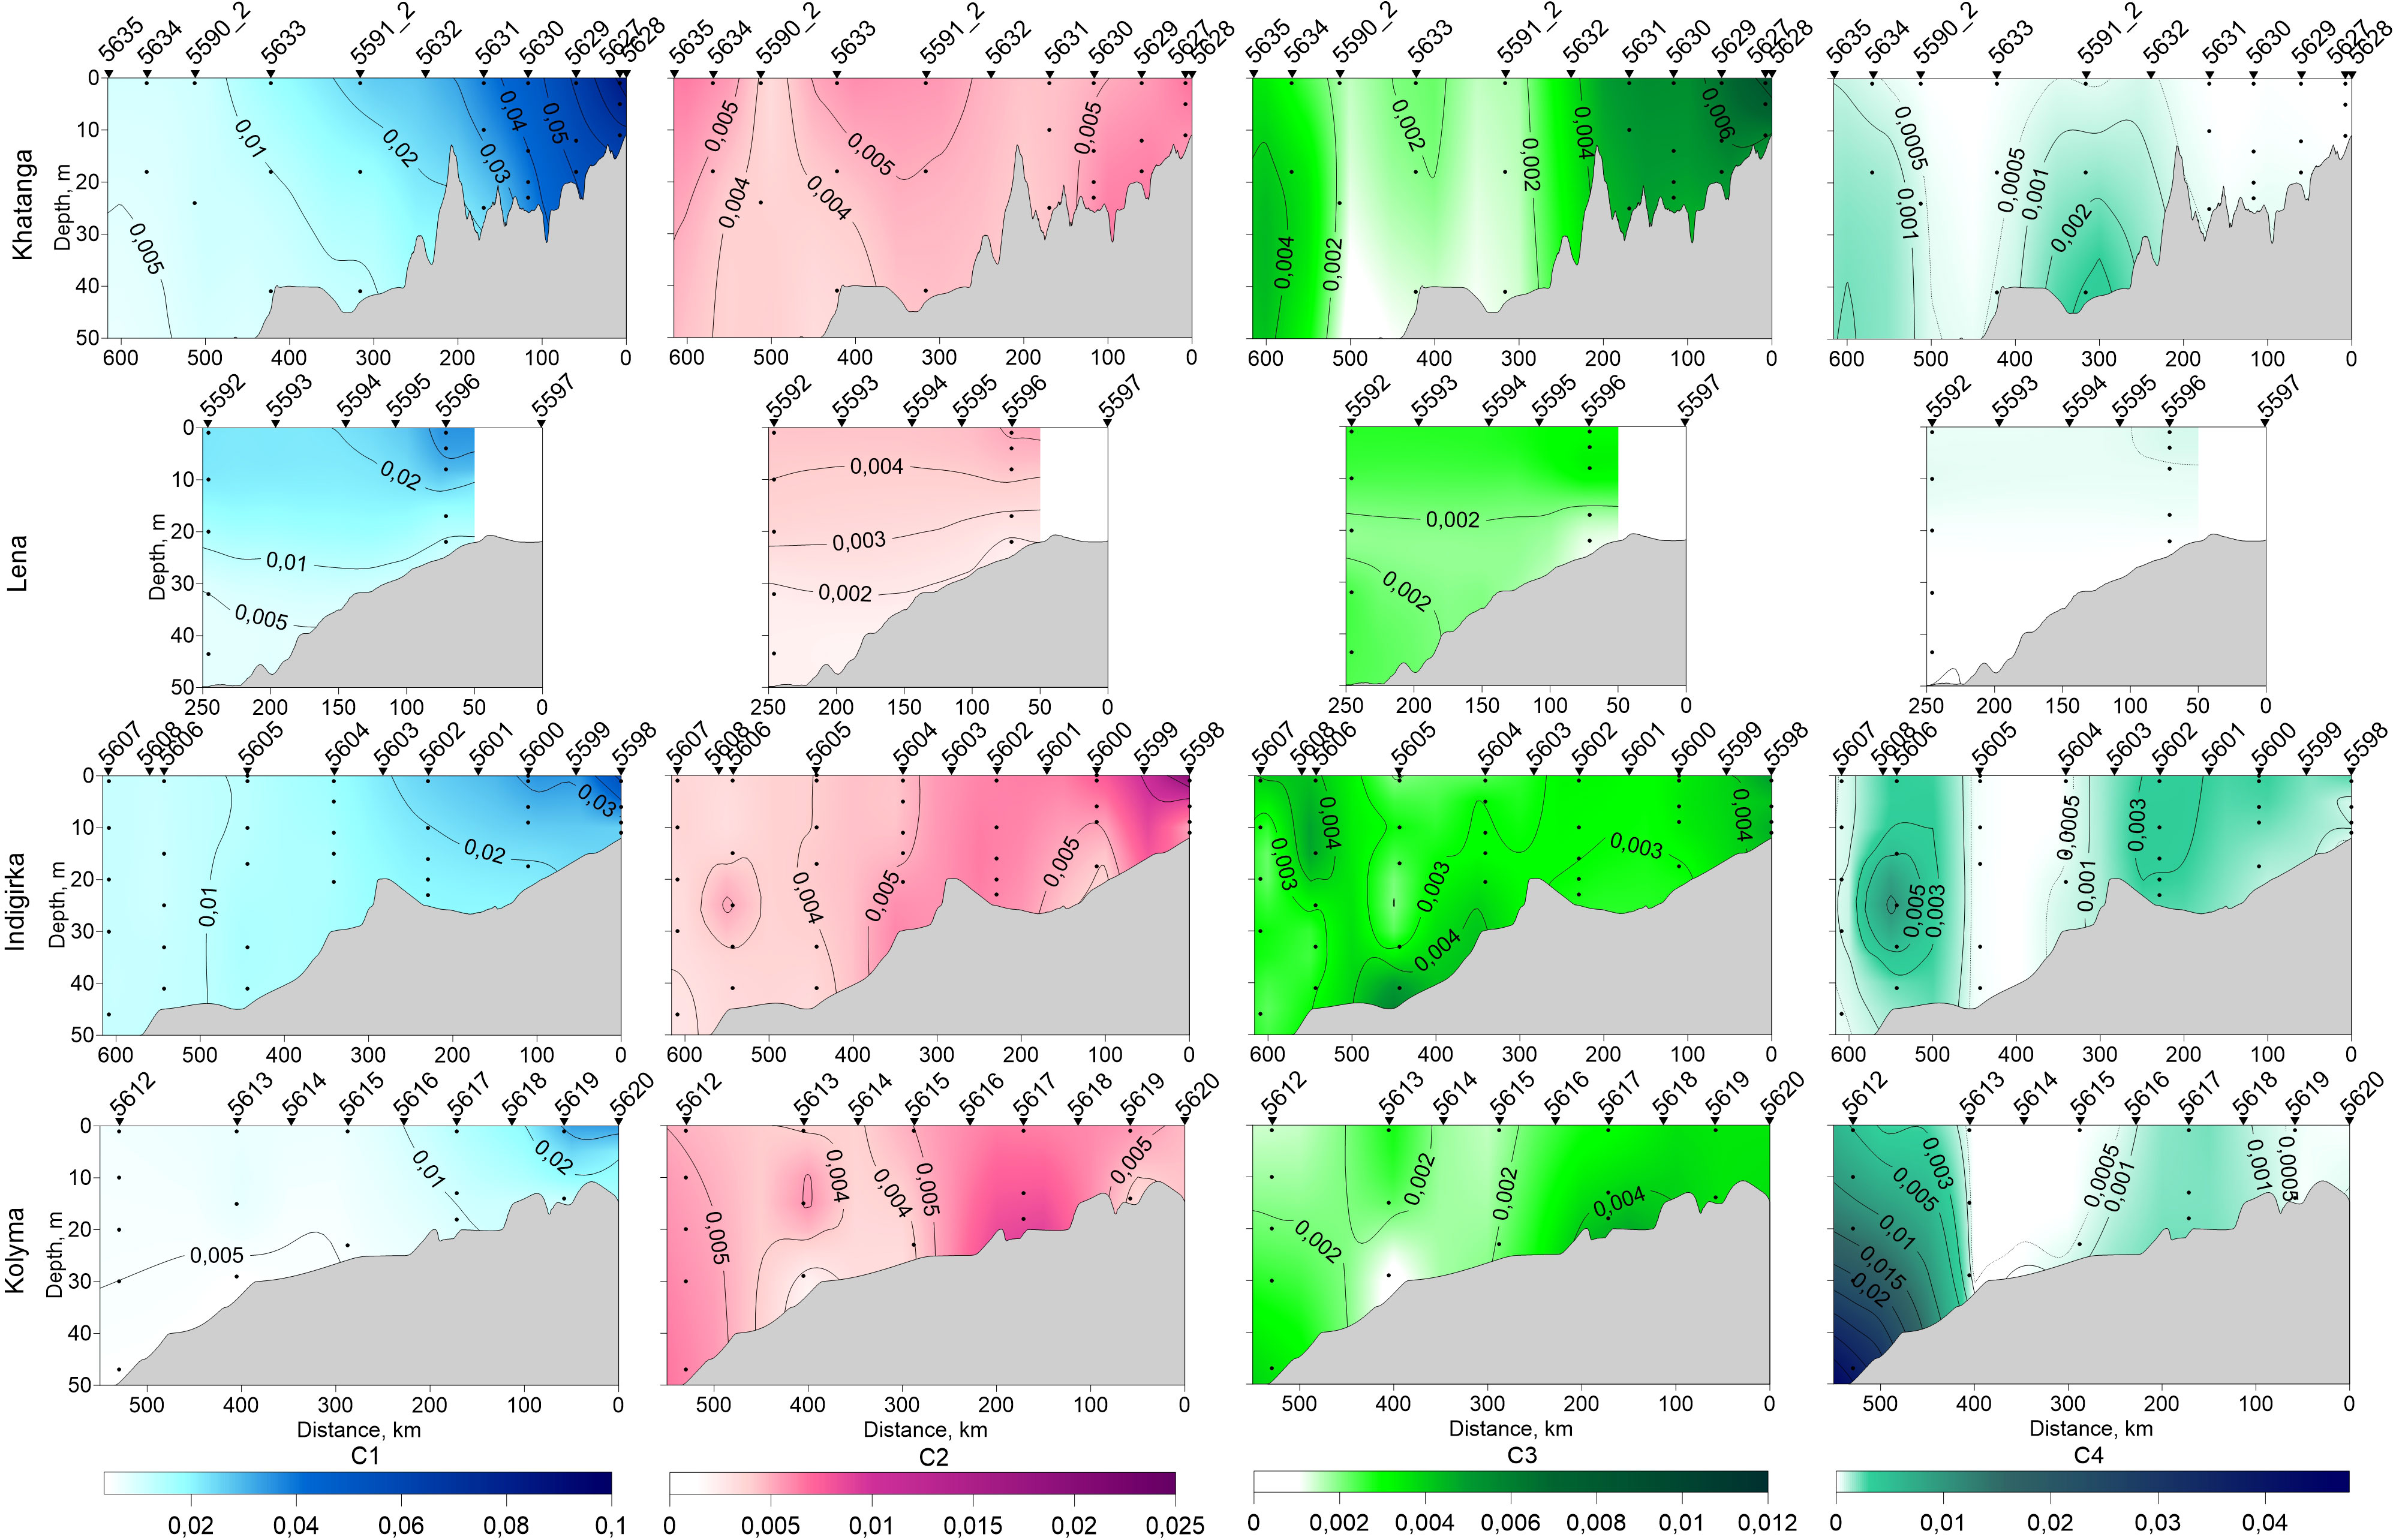
Figure 6 Distribution of PARAFAC components C1 – C4 along the Khatanga (17 – 19 September, 2017), Lena (2 –3 September, 2017), Indigirka (5 –7 September, 2017) and Kolyma (8 – 9 September, 2017) transects, obtained from the original data points, marked by black dots.
Protein-like component C2 was poorly represented along the Khatanga transect. The maximal concentration of C2 was measured mostly in the upper 15-m water layer as well as along the entire water column within the Khatanga River plume (stations 5627 – 5630, salinity 3.5 – 25.4). The absence of pronounced stratification in this area was recently explained by estuarine tidal mixing in the region (Osadchiev et al., 2020). The contribution of C2 was more significant in the East Siberian Sea. At the transect from Indigirka River delta region to continental slope C2 was distributed irregularly. It was more abundant at the southern part of the transect with the maximal C2 concentration at the stations 5598 and 5600 (salinity 15.2 – 17.6). The surface water layer of the Kolyma transect was generally depleted CDOM component C2 as compared with the deep waters of the transect (Figure 6); C2 was concentrated in the continental slope region at the station 5612, as well as in bottom waters at the station 5617. The C3 distribution in the Kolyma transect repeats the C2 except for the southernmost station: the C3 content at the station 5619 was quite high and comparable to the deep waters in the continental slope area, while the C2 content was rather low. Enrichment with the C3 component was also observed for the Khatanga and Indigirka rivers-influenced regions. At the Khatanga transect, a decrease in C3 followed the salinity gradient similar to C1. In contrast to C1, an increase in the C3 concentration was observed at high salinities near the continental slope (station 5634, 18 m).
The PARAFAC component C4 was not observed in the Khatanga transect. A very weak increase in the C4 concentration was detected in the continental slope area and in the bottom waters at the station 5591_2. In the East Siberian Sea, local maxima were found at station 5606 (23 m) of the Indigirka transect and in the continental slope region of the Kolyma transect (station 5612, 10-48 m). The waters influenced by the Lena River runoff (stations 5596 and 5592) contained no marine humic-like C4 and little to moderate C3 and protein-like C2 component.
Discussion
Component C1 matched a lot of EEM - PARAFAC models describing CDOM from various regions, including Arctica (Brogi et al., 2018; Painter et al., 2018) and Antarctica (Kida et al., 2019). It was usually assigned as terrestrial humic material and was abundant mostly in rivers, lakes, estuarine, costal and shelf regions of the oceans. The spectral characteristics of C1 were reported to be similar to the ones of syringaldehyde which, along with vanillin, is a product of oxidative degradation of lignin (Murphy et al., 2011). We conclude that C1 in the Laptev and East Siberian seas is supplied by river runoff. Component C2 exhibited protein-like fluorescence (Table 2) typical for proteins and/or aromatic amino acids and often linked to aquatic productivity (Castillo et al., 2010). In the study of DOM composition and bioavailability during the sea ice formation (Jørgensen et al., 2015) the similar component with excitation and emission maxima of 273 nm and 327 nm, respectively, was reported to represent a combined signal of tryptophan and tyrosine amino acids referred to the T and B peaks (Coble, 2007; Stedmon and Nelson, 2015). The PARAFAC components with spectral characteristics similar to C3 were found in various studies. For example, C3 absorption and emission maxima (Table 2) are close to C3 (λex = 270 (360) nm, λem = 478 nm) in the study of DOM in the catchment and estuary of Horsens Fjord (Denmark) (Stedmon et al., 2003), and C2 (λex = 240 (370) nm, λem = 480 nm) in the PARAFAC model of EEMs of Atlantic Ocean FDOM (Kowalczuk et al., 2013). Although the fluorescence maximum is blue-shifted by ~30 nm compared to conventional peak C (Coble, 1996), in the above studies the components were identified as peak C and assigned to humic material exported from terrestrial sources (Stedmon et al., 2003; Kowalczuk et al., 2013). Peak C was also reported to represent a product of microbial transformation of phytoplankton exudates (Romera-Castillo et al., 2011). The C4 component resembles fluorescence typical for marine humic substances peak M (Coble, 2007). In the experiments, provided Romera-Castillo et al., peak M fluorophore consumed by bacteria had been produced by phytoplankton (Castillo et al., 2010). A component BERC6 very similar to C4 was identified by a PARAFAC modeling of Canadian Arctic surface water FDOM fluorescence (Walker et al., 2009). Low fluorescence of this component was interpreted as minimal microbial productivity it the studied water area.
The relationship between the PARAFAC component values and various metadata of our samples was explored with the RDA analysis. Since the full set of parameters are available for 78 samples, RDA analysis was performed for them only. Using a permutation test, we validated 2 canonical axes as significant at α=0.01 level (Figure 7). The angle between the variable arrows indicates the correlation between them, while the length of the variable arrows reflects the degree of its influence on the fluorescent components. Based on the obtained results, fewer parameters have been chosen to study their correlation with PARAFAC component fluorescence intensity in more detail, namely, salinity, DOC, chlorophyll-a, aCDOM(350), S, HIX, BIX, SUVA, and FIMcK. Pearson’s correlation coefficients were calculated individually for the Khatanga, Lena, Indigirka, and Kolyma transects (Table 3) with the Origin7.0 software (Edwards, 2002).
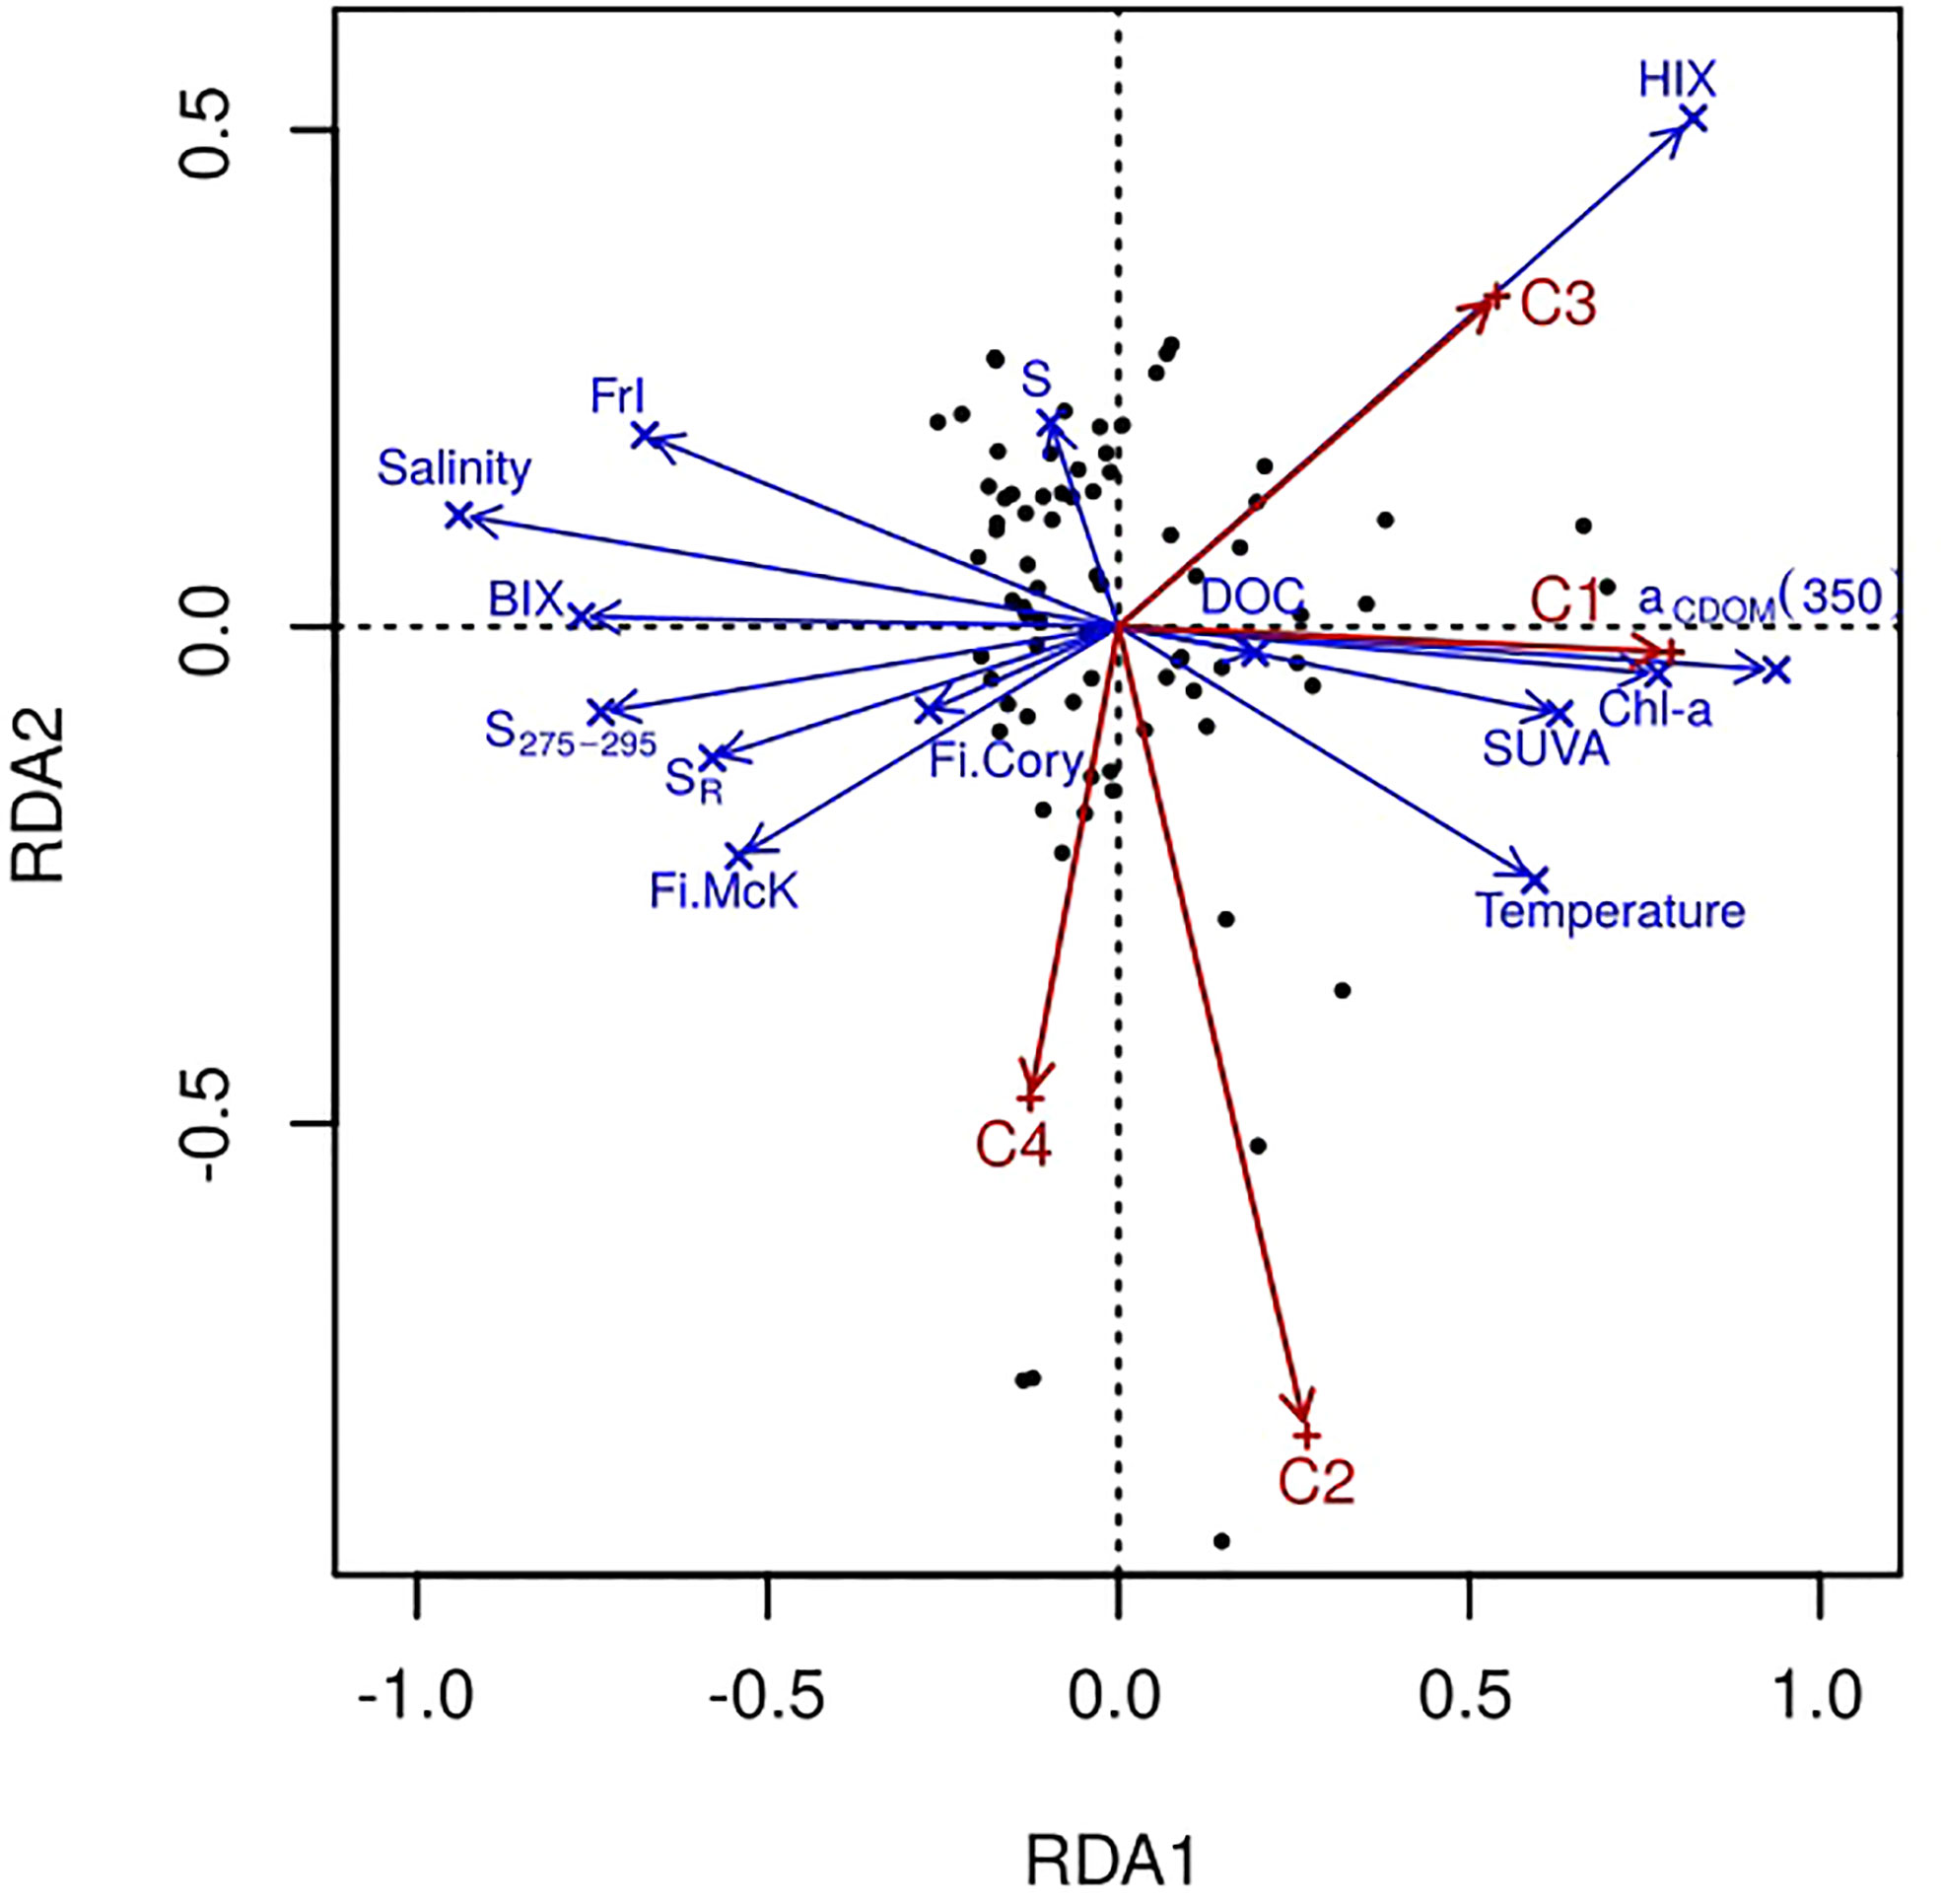
Figure 7 Redundancy analysis of spectral parameters and environmental factors.
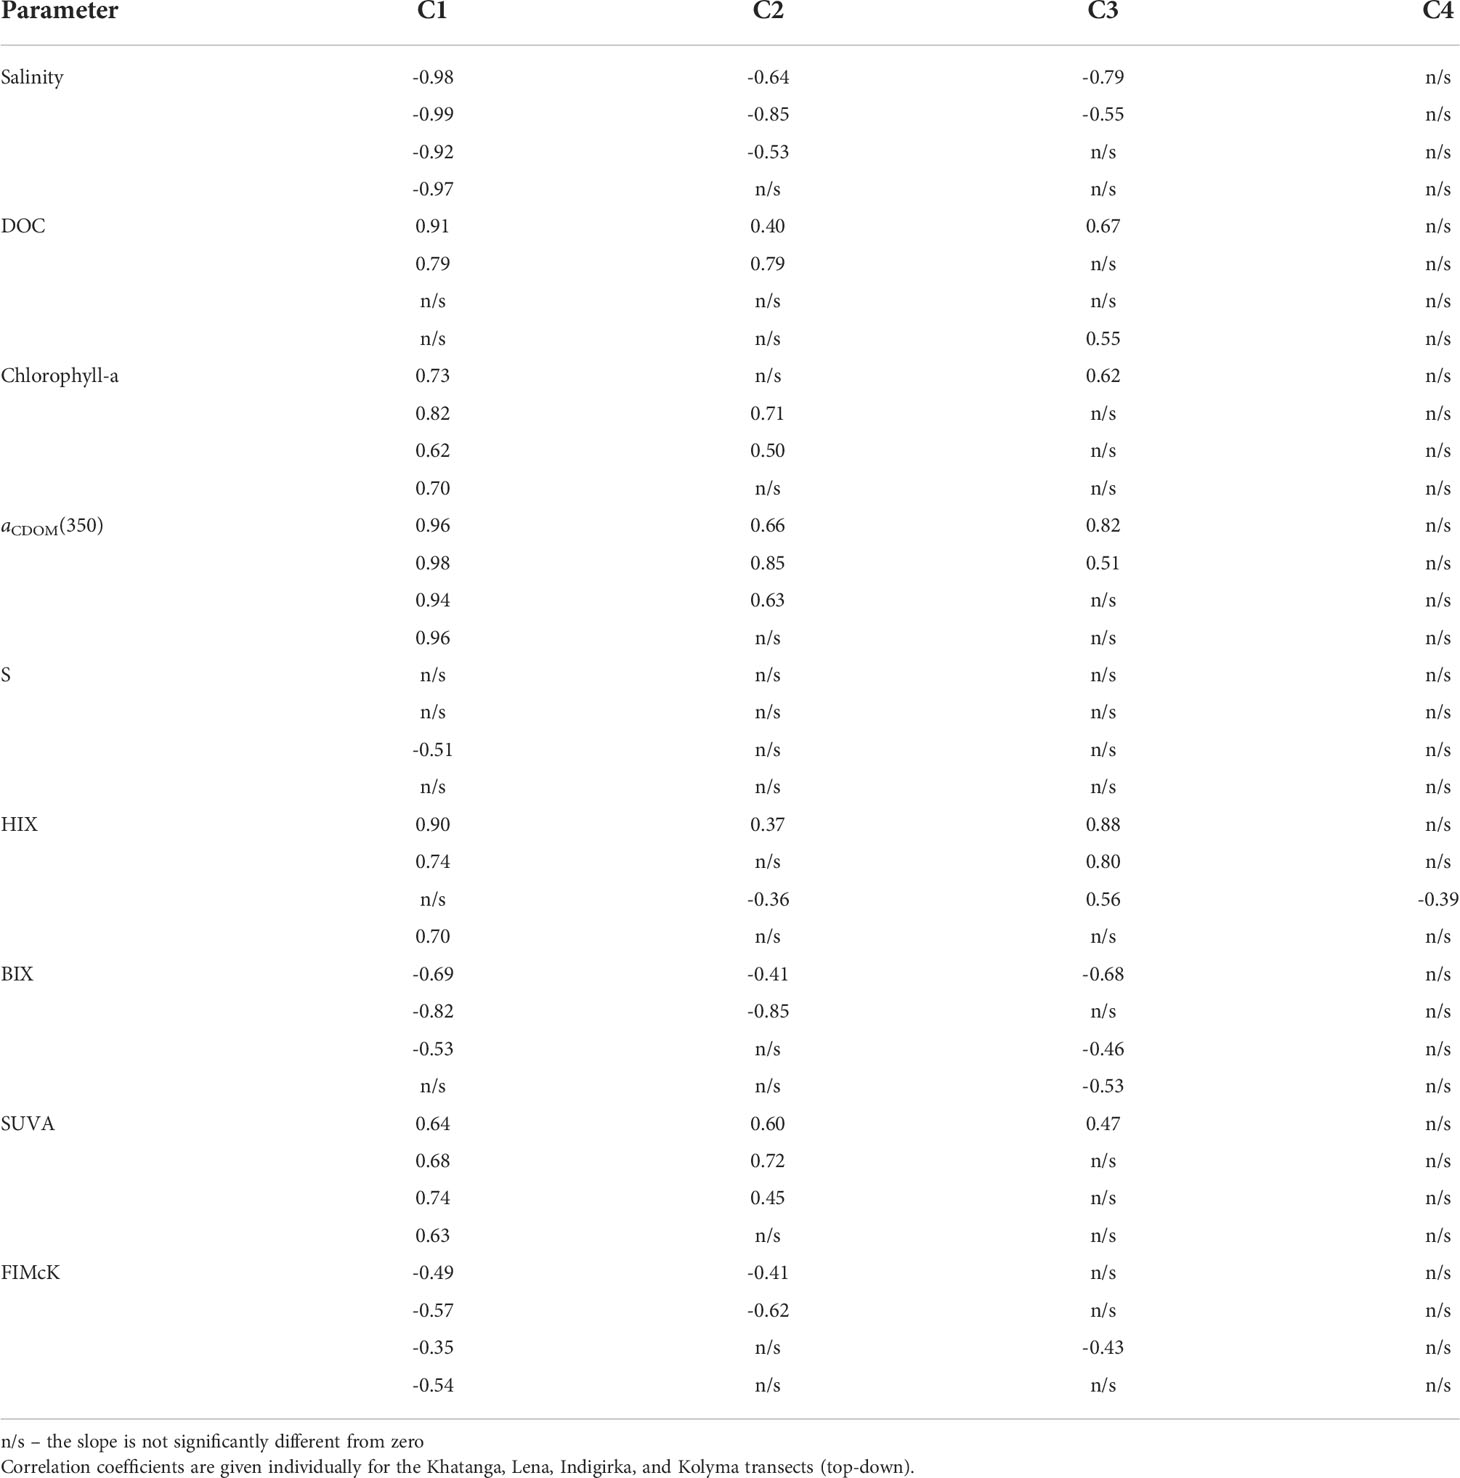
Table 3 Pearson’s correlation coefficients significant at 0.05 level for PARAFAC components C1 – C4 against various characteristics of seawater.
Fluorescent component distribution along the salinity gradient for salinity ranges of 3.5 – 33.8 in the Laptev Sea and 15.2 – 32.7 in the East Siberian Sea is shown in Figure 8. The C1 appeared to be linearly anti-correlated with salinity for all the transect with correlation coefficient varying between -0.99 and -0.92. Conservative mixing of C1 confirms our assumption about its supply by river runoff. Intercept values of the equations describing linear correlations are very close for the Khatanga and Lena, as well as for the Indigirka and Kolyma transects. At the same time, they differ for the Laptev (average value is 8.5×10⁻²) and East Siberian (6.4×10⁻²) seas (see Table 4). Such a difference in optical patterns between the rivers can be related to their individual watershed characteristics. So, we assume that the Khatanga and Lena rivers are characterized by higher content of terrigenous humic substances with a fluorescence maximum at 430 nm. This is consistent with the study of variation of FDOM of large Arctic rivers, in which lower aCDOM(350) values in the Kolyma River, compared to the Lena River, were explained by lower vascular plant inputs during freshet and its more extensive microbial degradation in the Kolyma watershed (Walker et al., 2013).
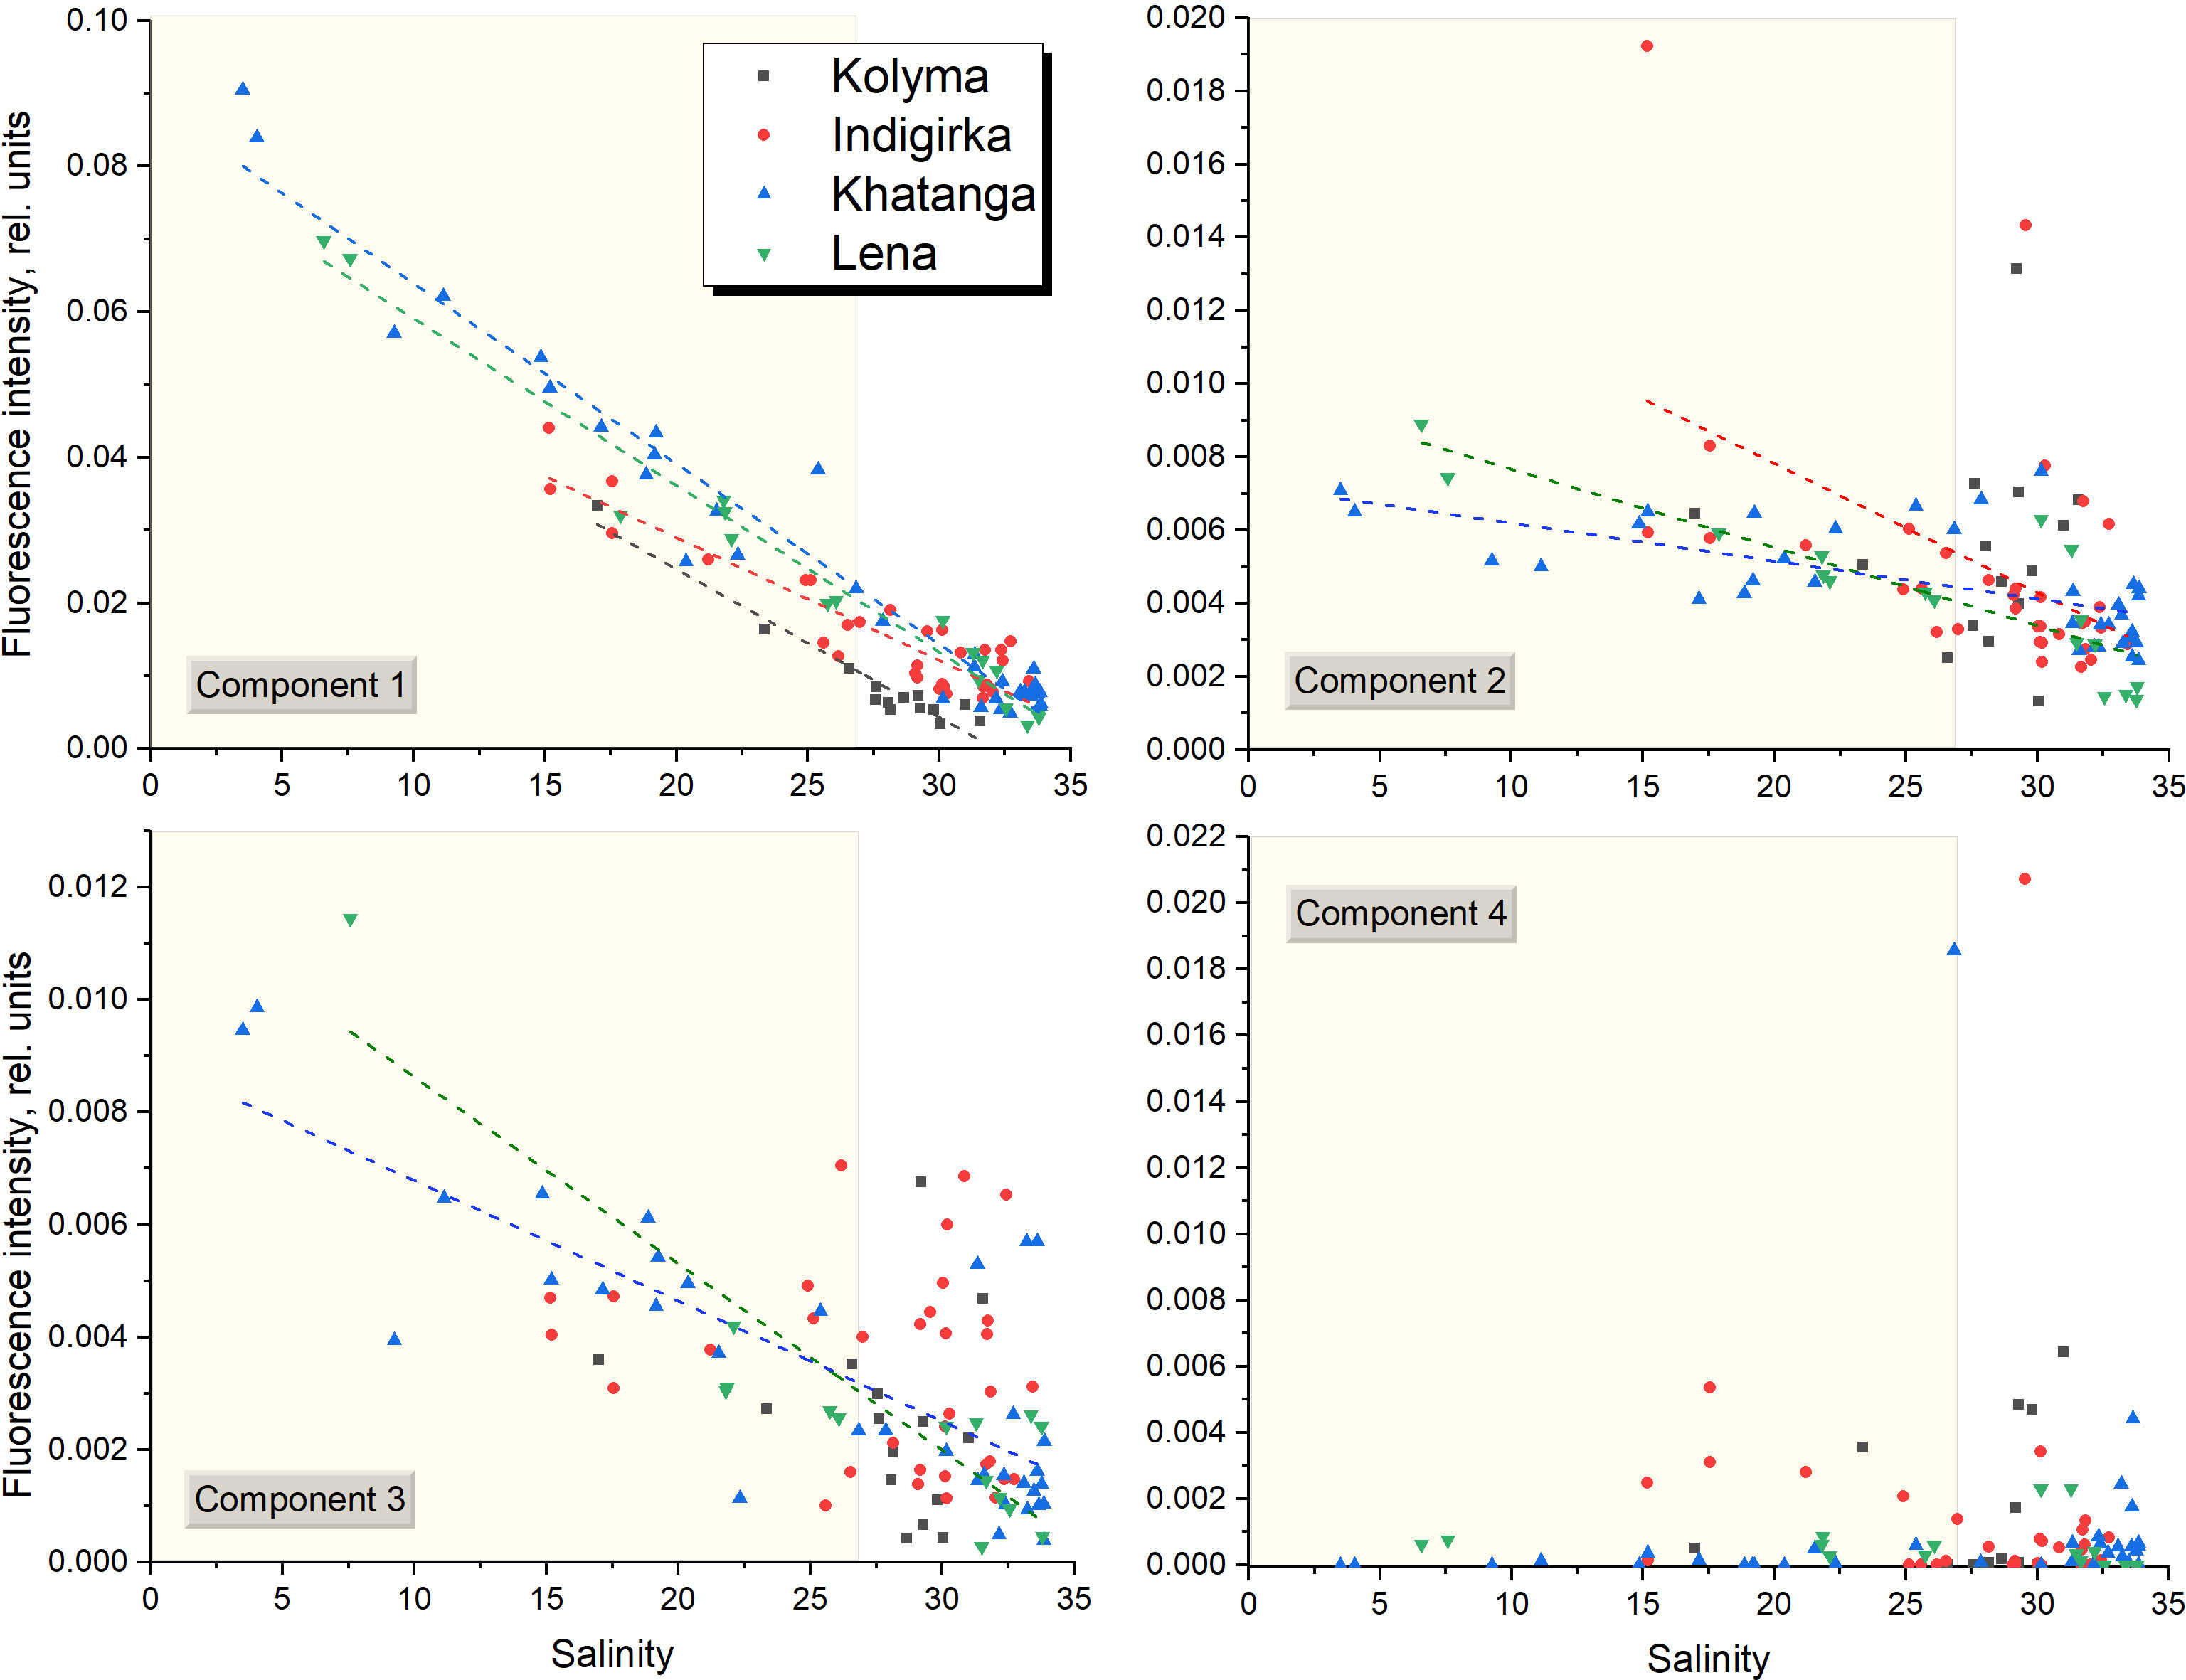
Figure 8 All samples from the 69th cruise of R/V Akademik Mstislav Keldysh collected in the Laptev and East Siberian seas, showing fluorescence intensity of PARAFAC components plotted against salinity. Yellow rectangles show the data obtained from the river plume regions with salinity below 27. The equations for linear correlations (dashed lines) are given in Table 4.
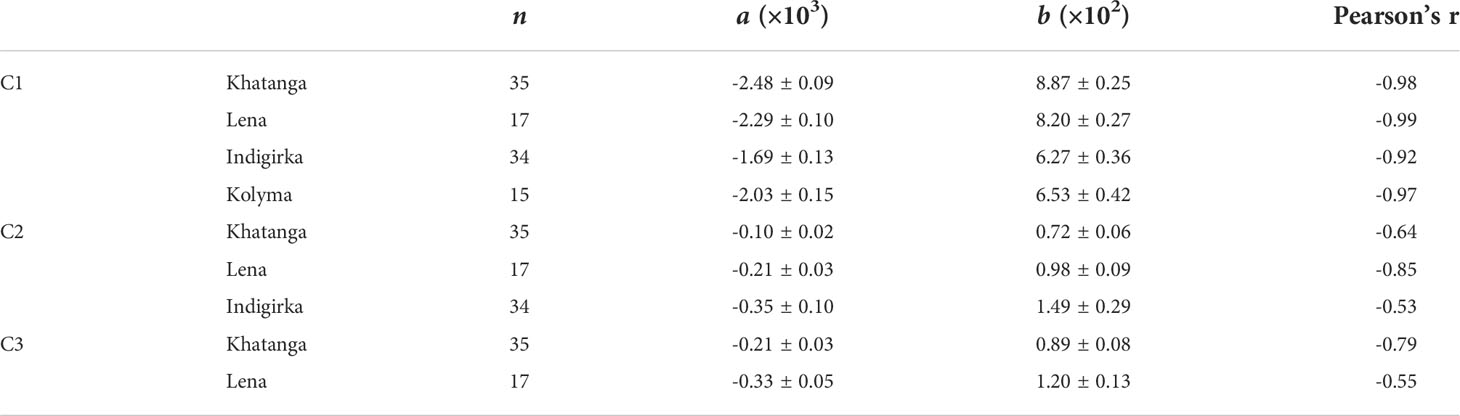
Table 4 Summary of regression analysis for PARAFAC components C1-C3 against salinity in the Khatanga, Lena, Indigirka, and Kolyma transects: n - number of samples, a – slope, b - intercept.
We also suggest that C1 component makes a dominant contribution to the CDOM absorption, since a strong correlation was revealed also between C1 and CDOM absorption coefficients at wavelengths from 300 nm to 400 nm, in particular, with aCDOM(350), often used as a quantitative measure for lignin concentration and input of terrestrial DOM to the Arctic Ocean (Spencer et al., 2009; Stedmon et al., 2011; Mann et al., 2016) (Figure 9). Component C1 correlates with DOC concentration in the river plume influenced areas in the Laptev Sea (Figure 10A), where conservative DOC behavior along the salinity gradient was demonstrated recently (Drozdova et al., 2021). Chl-a correlates with C1 to a lesser extent (0.62 < r < 0.82), showing higher values at the southern stations of the transects most affected by river runoff (Figure 10B). A positive linear correlation between C1 and humification index HIX – an indicator of humic substance content or extent of humification – was demonstrated for the Khatanga, Lena and Kolyma transects, while BIX - an indicators of autochthonous DOM input (Stedmon and Nelson, 2015) – was lower in the river-influenced areas (Figures 10C, D). A weak positive correlation was observed also between C3 and HIX and negative – between C3 and BIX (Figure 11). The HIX is based on the idea that the emission spectra of fluorescing molecules shift toward longer wavelengths as humification of DOM proceeds. Higher values indicate an increasing degree of humification. So, the increase of the content of C3 with fluorescence maxima at 478 nm, necessarily leads to an increase of HIX (Table 1).
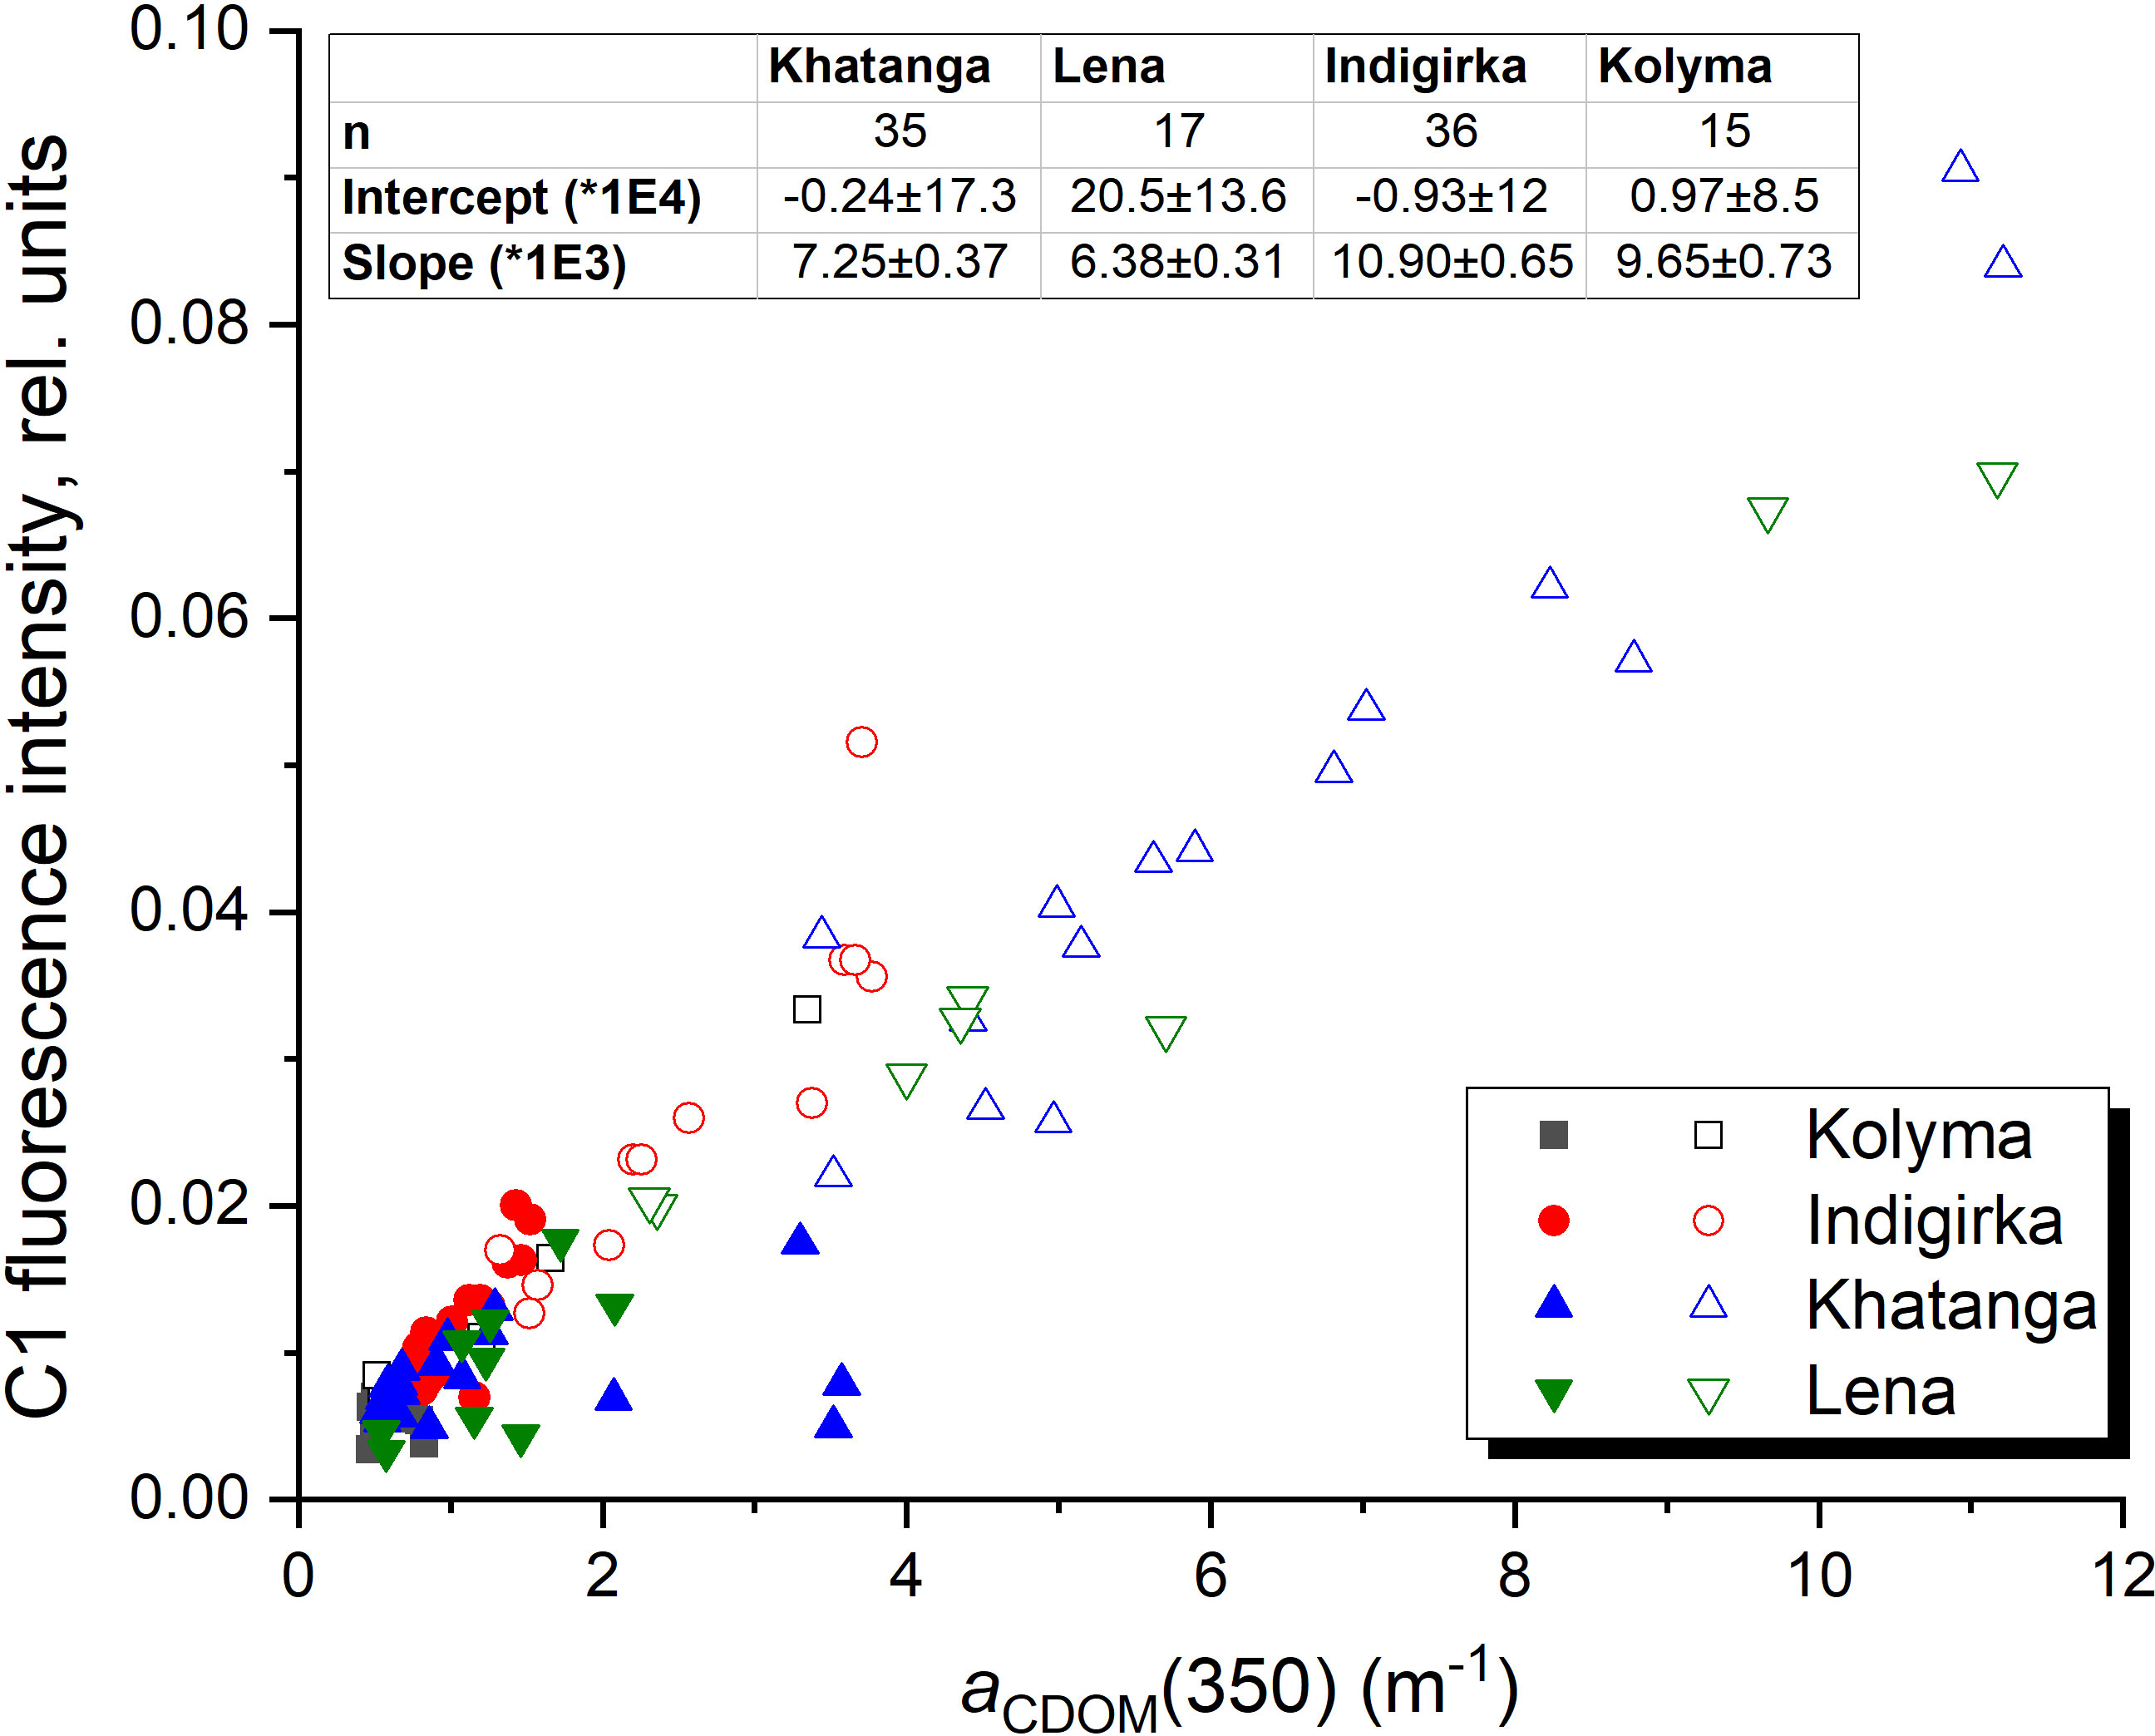
Figure 9 Fluorescence intensity of C1 against CDOM absorption coefficient at 350 nm. Filled symbols indicate the data obtained outside the river plume regions with salinity above 27.
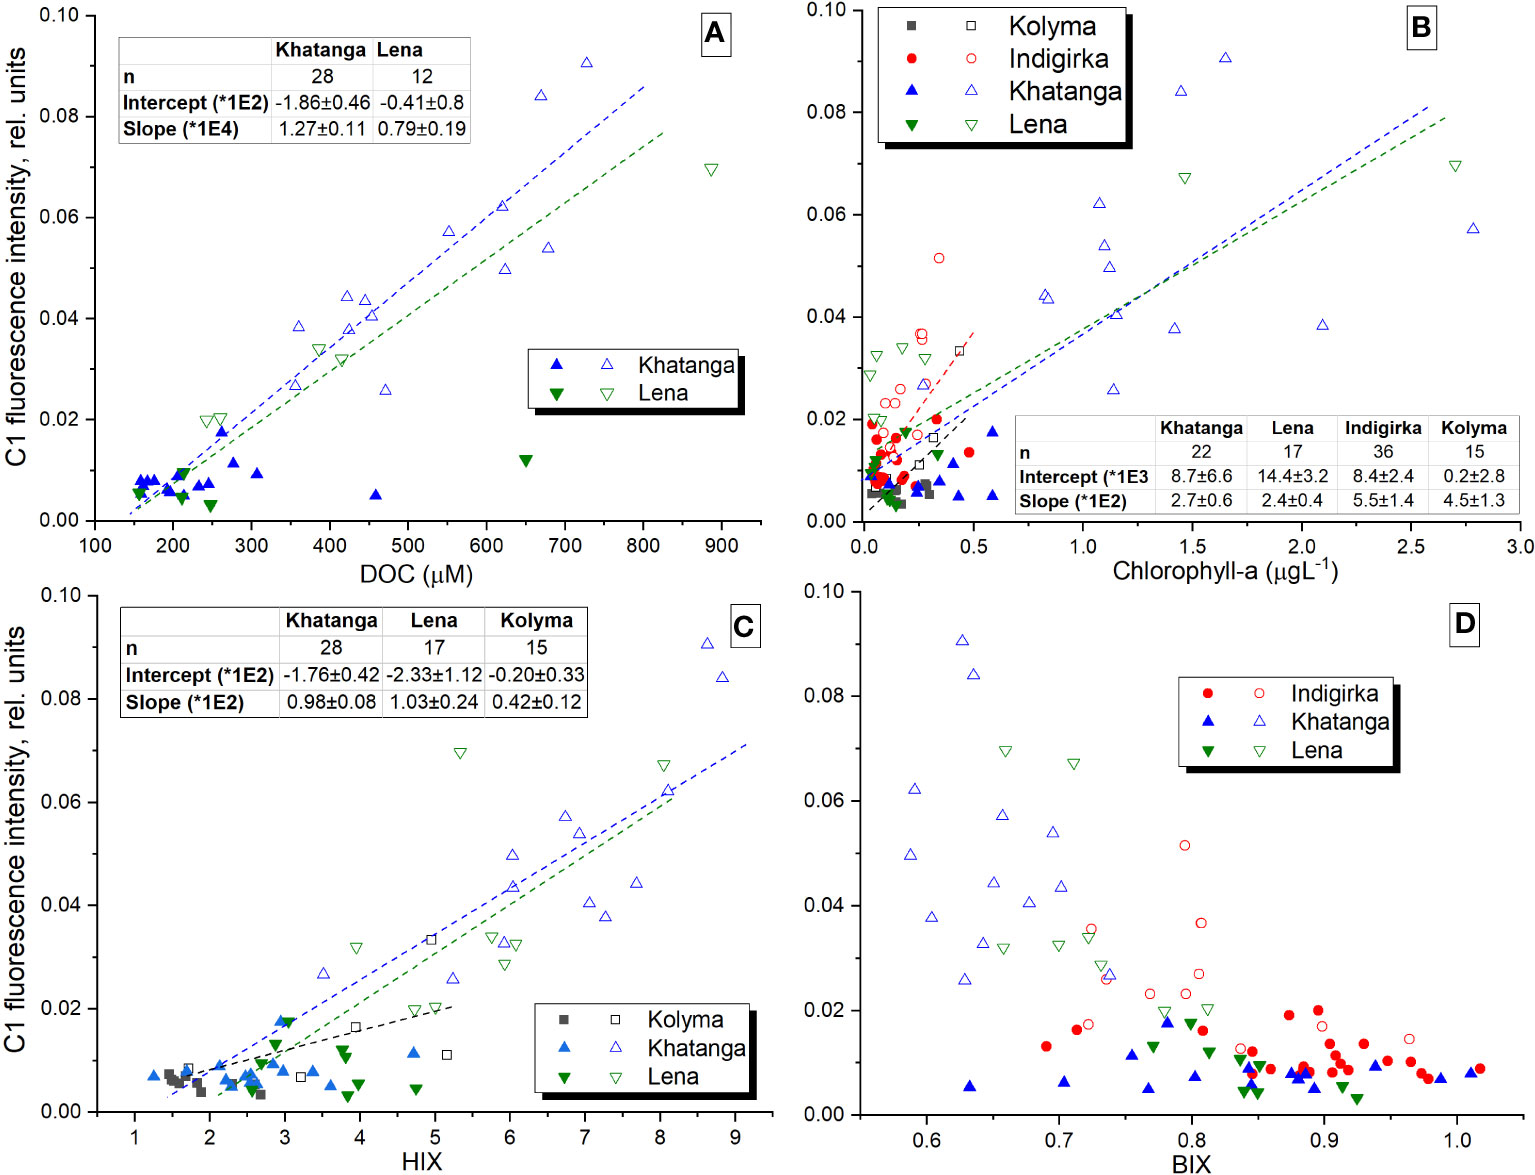
Figure 10 Fluorescence intensity of C1 against DOC, chlorophyll-a, HIX, and BIX. Filled symbols indicate the data obtained outside the river plume regions with salinity above 27.
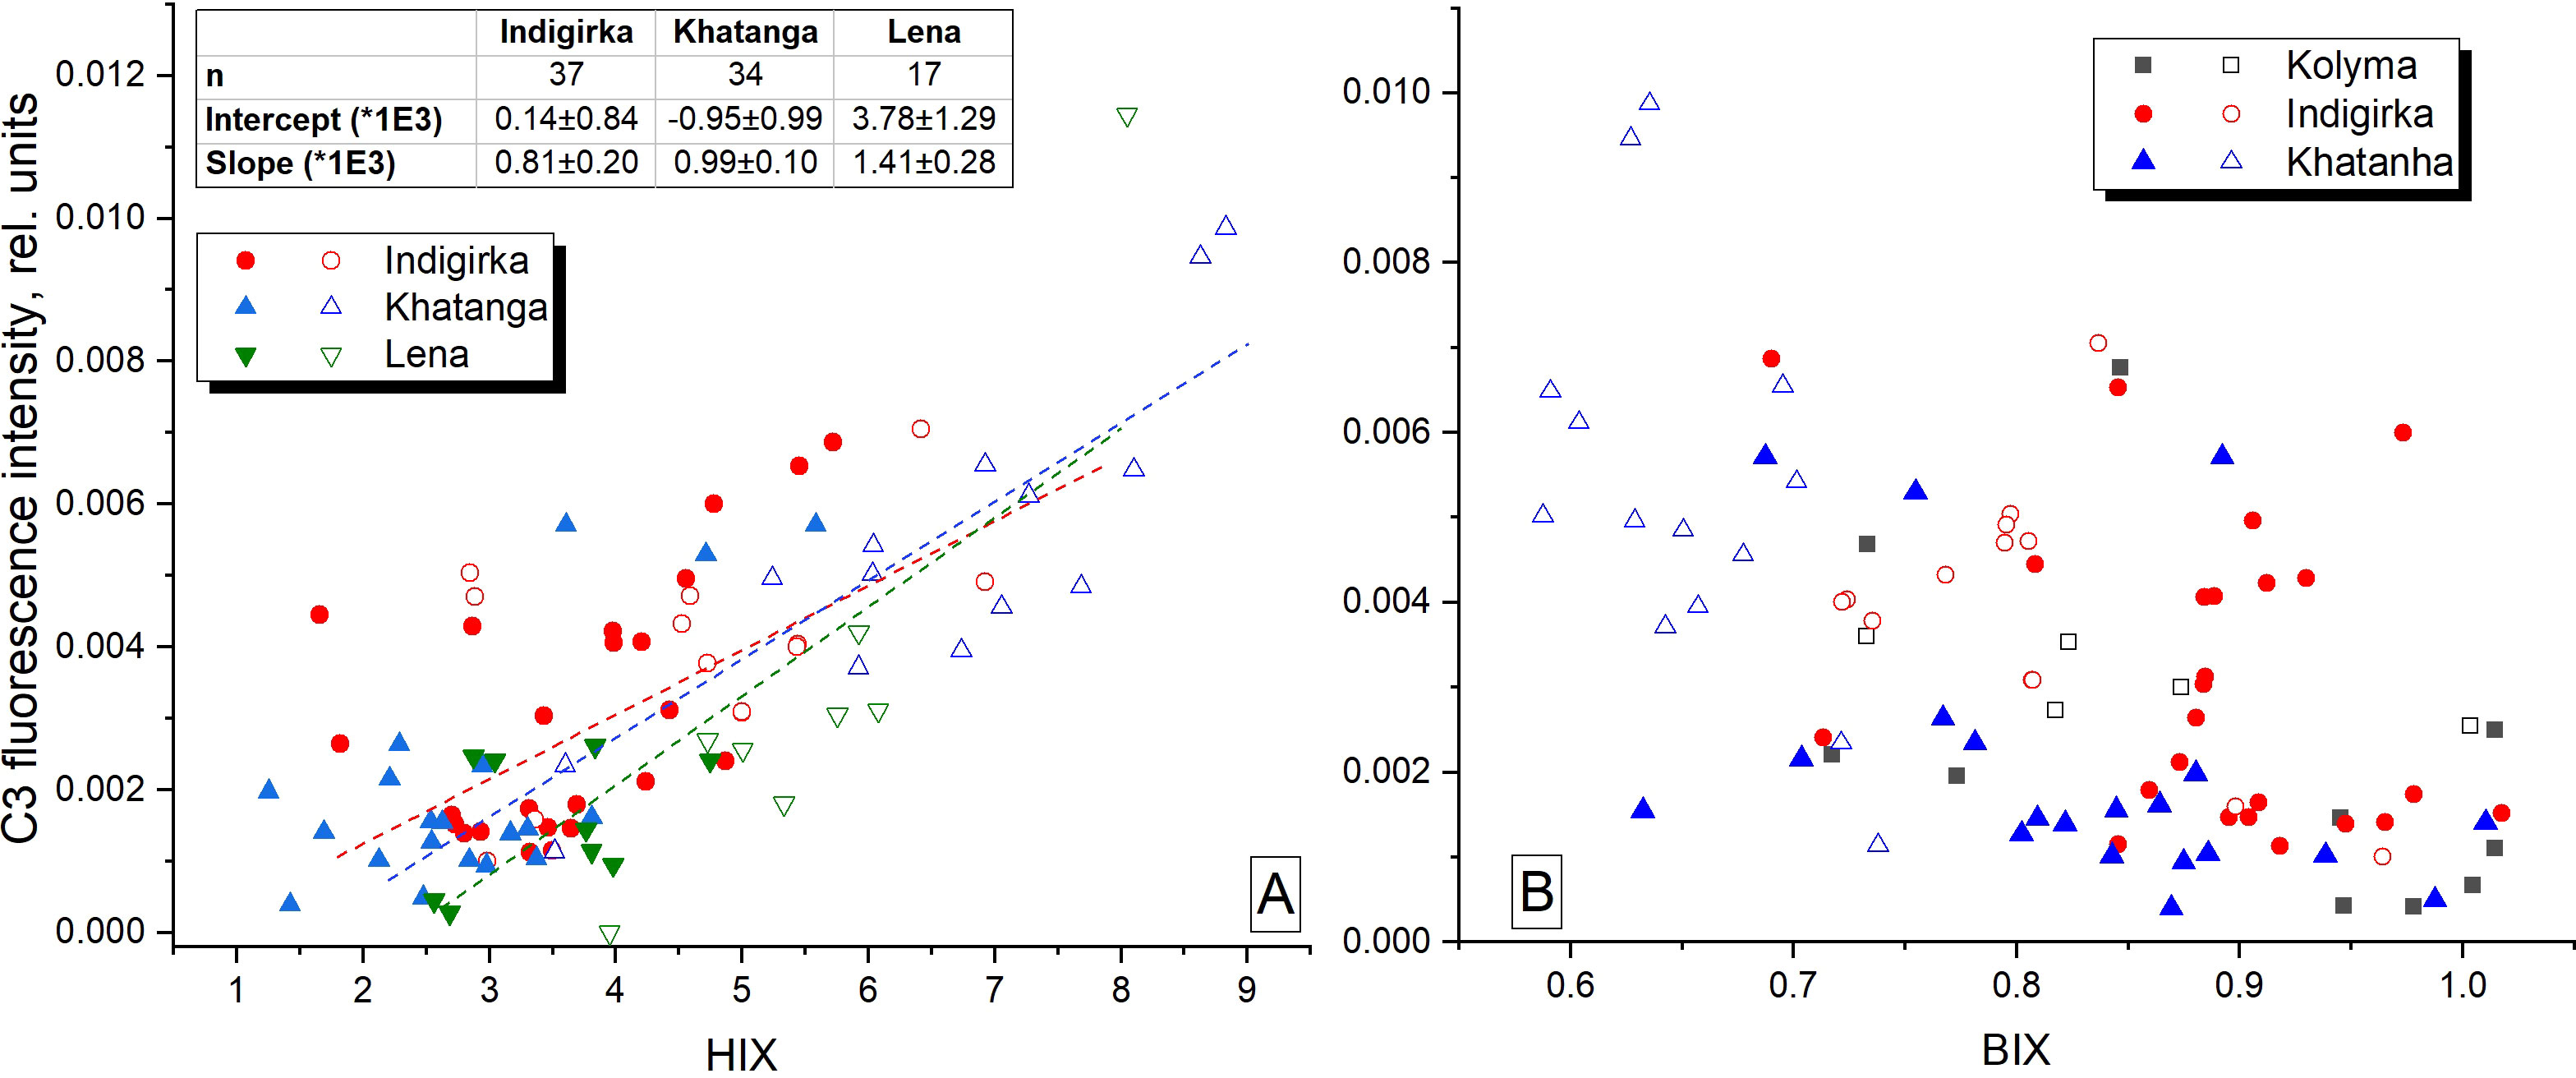
Figure 11 Fluorescence intensity of C3 against HIX and BIX. Filled symbols indicate the data obtained outside the river plume regions with salinity above 27.
The C2 and C3 component fluorescence intensities were generally higher at low salinities (and high CDOM absorption aCDOM(350)). A moderate negative correlation (-0.85 < r < -0.53) was observed for the Khatanga, Lena, and Indigirka transects (Figure 8 and Table 4). Higher concentration of C2 and C3 in the river-influenced regions is in a good agreement with reports of their allochthonous source, see, for example, the studies (Yamashita and Jaffé, 2008; Sun et al., 2014; Lee and Kim, 2018). Non-conservative behavior of protein substances (C2) in many estuaries is explained by relatively rapid degradation labile DOM (Yamashita and Tanoue, 2003; Vignudelli et al., 2004; Yamashita and Tanoue, 2008). Another possible reason for non-conservative distribution of C2 and C3 FDOM components is their production in marine environment. Thus, the study of Amerasian Basin seawaters revealed high abundance of protein-like fluorescence suggesting potential influence of fall phytoplankton blooms in the Chukchi and East Siberian seas in August – September (Chen et al., 2017) and its production from sediments (Chen et al., 2016). Taking into account weak correlations of C2 and C3 with salinity caused mostly by the local maxima of C2 and C3 fluorescence in the continental slope regions and in bottom waters (Figure 6), we suggest the mixed autochthonous-allochthonous origin of C2 and C3 components with the predominance of allochthonous (mostly riverine runoff) sources in the river plumes - waters with salinity below 27 (Kang et al., 2013). The local maxima of the C2-C4 fluorescence intensity outside the plumes, in turn, are associated with autochthonous FDOM production, in particular with the fall phytoplankton blooms and, possibly, with a processes of organic matter reworking in the bottom water layer. Indeed, the areas of the continental slope of the Arctic shelf are known as potential depots for the accumulation of large masses of organic matter, and the mineralization on the bottom surface was estimated as about 89% of the total input (Romankevich et al., 2009).
At present, it seems to be complicated to relate unambiguously the spectral composition of FDOM to specific biogeochemical processes and DOM sources. Nevertheless, we assume that the increase of C2 and C3 content at the continental slope region of the Khatanga transect (station 5634) is most likely related to the recent near-ice phytoplankton bloom. It is supported by a deep maximum of chl-a (about 1 µg l-1 at the station 5635 and 0.6 µg l-1 at the station 5634). The bottom waters of the northmost station of the Kolyma transect (5612), exhibited high C2 – C4 fluorescence intensity (Figure 6). The study of Sukhanova et al. (2021) revealed the maximum abundance and biomass of algae of the genus Chaetoceros with high content of spores and dead cells (up to 40%) in the lower layers of the water column. This region was also characterized by the maximal nitrate concentration along the transect of 4.1 µM (Sukhanova et al., 2021), high concentration of detrital and mineral particles, (Kopylov et al., 2021), as well as the maximal abundance and biomass of heterotrophic nanoflagellates (Kopylov et al., 2021). The complex composition of DOM in this area may be caused by several factors, for example, destruction of dead algae cells, production of heterotrophic nanoflagellates and bacterioplankton, and DOM released as a result of viral lysis of bacteria (Middelboe and Jørgensen, 2006; Jürgens and Massana, 2008).
Suspended matter at the station 5606 of the Indigirka transect was analyzed as a part of the study of the role of plankton in the vertical suspended matter (SM) flux in the East Siberian Sea (Drits et al., 2019). The dramatic increase of the total vertical SM flux at 35 m depth at the station 5606 was suggested to be due to re-suspension in the bottom nepheloid layer. At the same time, the analysis of physical and chemical data (CTD data, nutrients, oxygen, dissolved inorganic carbon, fCO2, CH4) measured in September 2008 in the East Siberian Sea revealed microbial decay of organic matter occurring through much of the water column with its predominance at the sediment interface (Anderson et al., 2011). We assume that at the stations 5605 and 5606 of the Indigirka transect high concentrations of FDOM in mid-waters and bottom water layer can be related to the erosion of the nepheloid layer containing organic matter decay products. It should be taken into account, that the increase in the concentration of SM in bottom waters does not necessarily indicate the resuspension of nepheloid layer. Ungrazed phytoplankton blooms, combined with aggregation and coagulation can lead to rapid sinking of the newly produced organic material. Mesozooplankton can also compact slowly sinking smaller phytoplankton cells into fecal pellets (Wassmann et al., 2004).
The study of FDOM of the Arctic shelf waters showed the difference in the distribution of PARAFAC components in the East Siberian and Laptev seas. In the Laptev Sea, components C1 and C3 dominate, with the maximal fluorescence intensities observed mostly in the Lena and Khatanga river-influenced shelf areas. Protein-like (C2) and marine humic-like (C4) components are poorly represented. In the East Siberian Sea, a similar distribution was observed only for the terrestrial humic-like component C1, while C2 and C4 components are more abundant and distributed irregularly. Component C3, usually assigned as terrestrial-derived FDOM, exhibited local maxima throughout the water column which pointed on autochthonous production of FDOM with emission maximum at 478 nm. The obtained results make the optical studies of FDOM a powerful tool for identifying the most interesting areas in terms of understanding the carbon cycling in the Arctic shelf seas. It is necessary to take into account the high variability of FDOM, and when studying processes in the bottom water layer, much attention should be paid to natural barriers, where organic matter can be accumulated.
Summary
FDOM of Siberian shelf seas is described by the set of four PARAFAC components which correspond to conventional fluorophores A, C, T/B and M (Coble, 1996; Coble et al., 1998; Coble, 2007) identified in natural waters. The composition of FDOM was found to be typical for the Siberian shelf seas (Guéguen et al., 2012; Mann et al., 2012; Chen et al., 2017; Chen et al., 2021), but this study showed the difference in FDOM distribution in the Laptev Sea (Khatanga and Lena transects) and in the East Siberian Sea (Indigirka and Kolyma transects). The consideration of fluorescence intensities of individual PARAFAC components along the shelf-crossing transects made it possible to draw the following conclusions:
Components C1 and C4 are of allochthonous and autochthonous origin, respectively, while C2 and C3 are supplied by river runoff and produced in marine environment.
The main features of the East Siberian Sea shelf waters were the higher abundances of the protein-like (C2) and marine humic-like (C4) components, as well as significant contribution of autochthonous-derived FDOM components C2 – C4.
The PARAFAC component C1 was found to be a reliable marker of input of riverine terrestrial-derived DOM to the Arctic Ocean. Among all studied fluorescence-based indices, C1 (fluorophore A) correlated best with salinity in the studied areas of Siberian shelf seas.
Based on related data, we suggest the destruction of dead algae cells, production of heterotrophic nanoflagellates and bacterioplankton, organic matter reworking, and DOM released as a result of viral lysis of bacteria as possible sources of FDOM.
Data availability statement
The raw data supporting the conclusions of this article will be made available by the authors, without undue reservation.
Author contributions
AD, IK, and TL contributed to conception and design of the study. TL performed spectral measurements. IK performed PARAFAC decomposition. Analysis of CTD and chlorophyll-a data was performed by AN and EA. AD, and IK wrote the first draft of the manuscript. All the authors revised the draft and approved the submitted version of the manuscript.
Funding
This research was funded by the Russian Science Foundation, project 21-77-10064.
Acknowledgments
We are grateful to Nikolay V. Lobus for water sampling, Mikhail V. Flint for the opportunity to take part in the impressive complex expeditions to the Arctic shelf seas and the crew of the R/V Akademik Mstislav Keldysh for their contribution during field studies. We would like to thank the reviewers for their constructive comments and the editor for his review of the manuscript.
Conflict of interest
The authors declare that the research was conducted in the absence of any commercial or financial relationships that could be construed as a potential conflict of interest.
Publisher’s note
All claims expressed in this article are solely those of the authors and do not necessarily represent those of their affiliated organizations, or those of the publisher, the editors and the reviewers. Any product that may be evaluated in this article, or claim that may be made by its manufacturer, is not guaranteed or endorsed by the publisher.
Supplementary material
The Supplementary Material for this article can be found online at: https://www.frontiersin.org/articles/10.3389/fmars.2022.872557/full#supplementary-material
References
Alling V., Sanchez-Garcia L., Porcelli D., Pugach S., Vonk J. E., Van Dongen B., et al. (2010). Nonconservative behavior of dissolved organic carbon across the laptev and East Siberian seas. Global Biogeochemical Cycles 24 (4), GB4033. doi: 10.1029/2010GB003834
Anderson L. G., Björk G., Jutterström S., Pipko I., Shakhova N., Semiletov I., et al. (2011). East Siberian Sea, An Arctic region of very high biogeochemical activity. Biogeosciences 8 (6), 1745–1754. doi: 10.5194/bg-8-1745-2011
Box J. E., Colgan W. T., Christensen T. R., Schmidt N. M., Lund M., Parmentier F.-J. W., et al. (2019). Key indicators of Arctic climate change: 1971–2017. Environ. Res. Lett. 14 (4), 045010. doi: 10.1088/1748-9326/aafc1b
Bro R. (1997). PARAFAC. tutorial and applications. Chemom. intelligent Lab. Syst. 38 (2), 149–171. doi: 10.1016/S0169-7439(97)00032-4
Brogi S. R., Ha S.-Y., Kim K., Derrien M., Lee Y. K., Hur J. (2018). Optical and molecular characterization of dissolved organic matter (DOM) in the Arctic ice core and the underlying seawater (Cambridge bay, canada): Implication for increased autochthonous DOM during ice melting. Sci. Total Environ. 627, 802–811. doi: 10.1016/j.scitotenv.2018.01.251
Bro R., Smilde A. K. (2003). Centering and scaling in component analysis. J. Chemom. 17 (1), 16–33. doi: 10.1002/cem.773
Carstea E. M., Popa C. L., Baker A., Bridgeman J. (2020). In situ fluorescence measurements of dissolved organic matter: a review. Sci. Total Environ. 699, 134361. doi: 10.1016/j.scitotenv.2019.134361
Castillo C. R., Sarmento H., Alvarez-Salgado X. A., Gasol J. M., Marraséa C. (2010). Production of chromophoric dissolved organic matter by marine phytoplankton. Limnol. Oceanogr. 55 (1), 446–454. doi: 10.4319/lo.2010.55.1.0446
Chen M., Kim J.-H., Lee Y. K., Lee D.-H., Jin Y. K., Hur J. (2021). Subsea permafrost as a potential major source of dissolved organic matter to the East Siberian Arctic shelf. Sci. Total Environ. 146100. doi: 10.1016/j.scitotenv.2021.146100
Chen M., Kim J.-H., Nam S.-I., Niessen F., Hong W.-L., Kang M.-H., et al. (2016). Production of fluorescent dissolved organic matter in Arctic ocean sediments. Sci. Rep. 6 (1), 1–10. doi: 10.1038/srep39213
Chen M., Nam S.-I., Kim J.-H., Kwon Y.-J., Hong S., Jung J., et al. (2017). High abundance of protein-like fluorescence in the amerasian basin of Arctic ocean: Potential implication of a fall phytoplankton bloom. Sci. Total Environ. 599, 355–363. doi: 10.1016/j.scitotenv.2017.04.233
Chen W., Ouyang Z.-Y., Qian C., Yu H.-Q. (2018). Induced structural changes of humic acid by exposure of polystyrene microplastics: a spectroscopic insight. Environ. pollut. 233, 1–7. doi: 10.1016/j.envpol.2017.10.027
Coble P. G. (1996). Characterization of marine and terrestrial DOM in seawater using excitation-emission matrix spectroscopy. Mar. Chem. 51 (4), 325–346. doi: 10.1016/0304-4203(95)00062-3
Coble P. G. (2007). Marine optical biogeochemistry: the chemistry of ocean color. Chem. Rev. 107 (2), 402–418. doi: 10.1021/cr050350+
Coble P. G., Del Castillo C. E., Avril B. (1998). Distribution and optical properties of CDOM in the Arabian Sea during the 1995 southwest monsoon. Deep Sea Res. Part II: Topical Stud. Oceanogr. 45 (10-11), 2195–2223. doi: 10.1016/S0967-0645(98)00068-X
Cory R. M., Miller M. P., McKnight D. M., Guerard J. J., Miller P. L. (2010). Effect of instrument-specific response on the analysis of fulvic acid fluorescence spectra. Limnol. Oceanogr.: Methods 8 (2), 67–78. doi: 10.4319/lom.2010.8.67
D’Andrilli J., Junker J. R., Smith H. J., Scholl E. A., Foreman C. M. (2019). DOM composition alters ecosystem function during microbial processing of isolated sources. Biogeochemistry 142 (2), 281–298. doi: 10.1007/s10533-018-00534-5
Demidov A., Gagarin V., Arashkevich E., Makkaveev P., Konyukhov I., Vorobieva O., et al. (2019). Spatial variability of primary production and chlorophyll in the laptev Sea in august–September. Oceanology 59 (5), 678–691. doi: 10.1134/S0001437019050047
Demidov A., Gagarin V., Artemiev V., Arashkevich E., Makkaveev P., Shchuka S., et al. (2020). Vertical variability of primary production and features of the subsurface chlorophyll maximum in the laptev Sea in august–september 2015, 2017, and 2018. Oceanology 60 (2), 189–204. doi: 10.1134/S0001437020010063
Dmitrenko I., Kirillov S., Eicken H., Markova N. (2005). Wind-driven summer surface hydrography of the eastern Siberian shelf. Geophys. Res. Lett. 32 (14), L14613. doi: 10.1029/2005GL023022
Drits A. V., Pasternak A. F., Kravchishina M. D., Arashkevich E. G., Sukhanova I. N., Flint M. V. (2019). The role of plankton in the vertical flux in the East Siberian Sea shelf. Oceanology 59 (5), 669–677. doi: 10.1134/S0001437019050059
Drozdova A. N., Nedospasov A. A., Lobus N. V., Patsaeva S. V., Shchuka S. A. (2021). CDOM optical properties and DOC content in the largest mixing zones of the Siberian shelf seas. Remote Sens. 13 (6)1145. doi: 10.3390/rs13061145
Drozdova A. N., Puiman M. S., Krylov I. N., Patsaeva S. V., Shatravin A. V. (2019). Dataset on optical characteristics and spectroscopic indices of dissolved organic matter of the kara, laptev, and East Siberian seas in august–September 2017. Data Brief 26, 104562. doi: 10.1016/j.dib.2019.104562
Edwards P. M. (2002). Origin 7.0: scientific graphing and data analysis software. J. Chem. Inf. Comput. Sci. 42 (5), 1270–1271. doi: 10.1021/ci0255432
Ershova E., Kosobokova K. N. (2019). Cross-shelf structure and distribution of mesozooplankton communities in the East-Siberian Sea and the adjacent Arctic ocean. Polar Biol. 42 (7), 1353–1367. doi: 10.1007/s00300-019-02523-2
Gonçalves-Araujo R., Stedmon C. A., Heim B., Dubinenkov I., Kraberg A., Moiseev D., et al. (2015). From fresh to marine waters: Characterization and fate of dissolved organic matter in the Lena river delta region, Siberia. Front. Mar. Sci. 2, 108. doi: 10.3389/fmars.2015.00108
Gonnelli M., Galletti Y., Marchetti E., Mercadante L., Brogi S. R., Ribotti A., et al. (2016). Dissolved organic matter dynamics in surface waters affected by oil spill pollution: Results from the serious game exercise. Deep Sea Res. Part II: Topical Stud. Oceanogr. 133, 88–99. doi: 10.1016/j.dsr2.2016.05.027
Gordeev V. V., Martin J. M., Sidorov I. S., Sidorova M. V. (1996). A reassessment of the Eurasian river input of water, sediment, major elements, and nutrients to the Arctic ocean. Am. J. Sci. 296 (6), 664–691. doi: 10.2475/ajs.296.6.664
Griffin C. G., McClelland J. W., Frey K. E., Fiske G., Holmes R. M. (2018). Quantifying CDOM and DOC in major Arctic rivers during ice-free conditions using landsat TM and ETM+ data. Remote Sens. Environ. 209, 395–409. doi: 10.1016/j.rse.2018.02.060
Guéguen C., McLaughlin F., Carmack E., Itoh M., Narita H., Nishino S. (2012). The nature of colored dissolved organic matter in the southern Canada basin and East Siberian Sea. Deep Sea Res. Part II: Topical Stud. Oceanogr. 81, 102–113. doi: 10.1016/j.scitotenv.2021.146100
Helms J. R., Stubbins A., Ritchie J. D., Minor E. C., Kieber D. J., Mopper K. (2008). Absorption spectral slopes and slope ratios as indicators of molecular weight, source, and photobleaching of chromophoric dissolved organic matter. Limnol. Oceanogr. 53 (3), 955–969. doi: 10.4319/lo.2008.53.3.0955
Holmes R. M., McClelland J. W., Peterson B. J., Shiklomanov I. A., Shiklomanov A. I., Zhulidov A. V., et al. (2002). A circumpolar perspective on fluvial sediment flux to the Arctic ocean. Global biogeochemical cycles 16 (4), 45–41-45-14. doi: 10.1029/2001GB001849
Holm-Hansen O., Riemann B. (1978). Chlorophyll a determination: improvements in methodology. Oikos 438-447. doi: 10.2307/3543338
Huguet A., Vacher L., Relexans S., Saubusse S., Froidefond J.-M., Parlanti E. (2009). Properties of fluorescent dissolved organic matter in the gironde estuary. Organic Geochem. 40 (6), 706–719. doi: 10.1016/j.orggeochem.2009.03.002
Jørgensen L., Stedmon C. A., Kaartokallio H., Middelboe M., Thomas D. N. (2015). Changes in the composition and bioavailability of dissolved organic matter during sea ice formation. Limnol. Oceanogr. 60 (3), 817–830. doi: 10.1002/lno.10058
Jaffé R., McKnight D., Maie N., Cory R., McDowell W. H., Campbell J. L. (2008). Spatial and temporal variations in DOM composition in ecosystems: The importance of long-term monitoring of optical properties. J. Geophys. Research: Biogeosci. 113 (G4), G04032. doi: 10.1029/2008JG000683
Jakobsson M., Grantz A., Kristoffersen Y., Macnab R. (2004). “The Arctic ocean: boundary conditions and background information,” in The organic carbon cycle in the Arctic Ocean, eds Stein R., R., Macdonald W. (Berlin: Springer), 1–32. doi: 10.1007/978-3-642-18912-8_1
Jiao N., Herndl G. J., Hansell D. A., Benner R., Kattner G., Wilhelm S. W., et al. (2010). Microbial production of recalcitrant dissolved organic matter: long-term carbon storage in the global ocean. Nat. Rev. Microbiol. 8 (8), 593–599. doi: 10.1038/nrmicro2386
Johnson K. S., Coletti L. J. (2002). In situ ultraviolet spectrophotometry for high resolution and long-term monitoring of nitrate, bromide and bisulfide in the ocean. Deep Sea Res. Part I: Oceanogr. Res. Papers 49 (7), 1291–1305. doi: 10.1016/S0967-0637(02)00020-1
Jürgens K., Massana R. (2008). “Protistan grazing on marine bacterioplankton,” in Microbial Ecology of the Oceans, ed Kirchman D. L. (New York, NY: Wiley), 383–441.
Kang Y., Pan D., Bai Y., He X., Chen X., Chen C.-T. A., et al. (2013). Areas of the global major river plumes. Acta Oceanologica Sin. 32 (1), 79–88. doi: 10.1007/s13131-013-0269-5
Kida M., Kojima T., Tanabe Y., Hayashi K., Kudoh S., Maie N., et al. (2019). Origin, distributions, and environmental significance of ubiquitous humic-like fluorophores in Antarctic lakes and streams. Water Res. 163, 114901. doi: 10.1016/j.watres.2019.114901
Kopylov A., Kosolapov D., Zabotkina E., Romanenko A., Sazhin A. (2021). Distribution and relationship between heterotrophic organisms and viruses on the East Siberian Sea shelf. Oceanology 61 (2), 220–232. doi: 10.1134/S0001437021020089
Kothawala D. N., Murphy K. R., Stedmon C. A., Weyhenmeyer G. A., Tranvik L. J. (2013). Inner filter correction of dissolved organic matter fluorescence. Limnol. Oceanogr.: Methods 11 (12), 616–630. doi: 10.4319/lom.2013.11.616
Kowalczuk P., Tilstone G. H., Zabłocka M., Röttgers R., Thomas R. (2013). Composition of dissolved organic matter along an Atlantic meridional transect from fluorescence spectroscopy and parallel factor analysis. Mar. Chem. 157, 170–184. doi: 10.1016/j.marchem.2013.10.004
Krylov I. N., Drozdova A. N., Labutin T. A. (2020). Albatross r package to study PARAFAC components of DOM fluorescence from mixing zones of arctic shelf seas. Chemom. Intelligent Lab. Syst. 207, 104176. doi: 10.1016/j.chemolab.2020.104176
Lakowicz J. R. (2013). Principles of fluorescence spectroscopy (Berlin, Germany: Springer science & business media).
Lee S.-A., Kim G. (2018). Sources, fluxes, and behaviors of fluorescent dissolved organic matter (FDOM) in the nakdong river estuary, Korea. Biogeosciences 15 (4), 1115–1122. doi: 10.5194/bg-15-1115-2018
Mann P., Davydova A., Zimov N., Spencer R. G., Davydov S., Bulygina E., et al. (2012). Controls on the composition and lability of dissolved organic matter in siberia's kolyma river basin. J. Geophys. Research: Biogeosci. 117 (G1), G01028. doi: 10.1029/2011JG001798
Mann P. J., Spencer R. G. M., Hernes P. J., Six J., Aiken G. R., Tank S. E., et al. (2016). Pan-Arctic trends in terrestrial dissolved organic matter from optical measurements. Front. Earth Sci. 4, 25. doi: 10.3389/feart.2016.00025
McKnight D. M., Boyer E. W., Westerhoff P. K., Doran P. T., Kulbe T., Andersen D. T. (2001). Spectrofluorometric characterization of dissolved organic matter for indication of precursor organic material and aromaticity. Limnol. Oceanogr. 46 (1), 38–48. doi: 10.4319/lo.2001.46.1.0038
Middelboe M., Jørgensen N. O. (2006). Viral lysis of bacteria: an important source of dissolved amino acids and cell wall compounds. J. Mar. Biol. Assoc. United Kingdom 86 (3), 605–612. doi: 10.1017/S0025315406013518
Murphy K. R., Hambly A., Singh S., Henderson R. K., Baker A., Stuetz R., et al. (2011). Organic matter fluorescence in municipal water recycling schemes: toward a unified PARAFAC model. Environ. Sci. Technol. 45 (7), 2909–2916. doi: 10.1021/es103015e
Murphy K. R., Stedmon C. A., Wenig P., Bro R. (2014). OpenFluor–an online spectral library of auto-fluorescence by organic compounds in the environment. Anal. Methods 6 (3), 658–661. doi: 10.1039/C3AY41935E
Osadchiev A., Medvedev I., Shchuka S., Kulikov M., Spivak E., Pisareva M., et al. (2020). Influence of estuarine tidal mixing on structure and spatial scales of large river plumes. Ocean Sci. 16 (4), 781–798. doi: 10.5194/os-16-781-2020
Oziel L., Sirven J., Gascard J.-C. (2016). The barents Sea frontal zones and water masses variability (1980–2011). Ocean Sci. 12 (1), 169–184. doi: 10.5194/os-12-169-2016
Painter S. C., Lapworth D. J., Woodward E. M. S., Kroeger S., Evans C. D., Mayor D. J., et al. (2018). Terrestrial dissolved organic matter distribution in the north Sea. Sci. Total Environ. 630, 630–647. doi: 10.1016/j.scitotenv.2018.02.237
Pavlov V. K., Timohov L. A., Baskakov G. A., Kulakov M. Y., Kurazhov V. K., Pavlov P. V., et al. (1994) Hydrometeorological Regime of the Kara, Laptev and East-Siberian Seas. (St Petersburg: The Arctic and Antarctic Research Institute) 179.
Rao C. R. (1964). The use and interpretation of principal component analysis in applied research. Sankhyā: Indian J. Statistics Ser. A 26, 329–358.
Raymond P. A., McClelland J., Holmes R., Zhulidov A., Mull K., Peterson B., et al. (2007). Flux and age of dissolved organic carbon exported to the Arctic ocean: A carbon isotopic study of the five largest arctic rivers. Global Biogeochemical Cycles 21 (4), GB4011. doi: 10.1029/2007GB002934
Romankevich E. A., Vetrov A. A., Peresypkin V. I. (2009). Organic matter of the world ocean. Russian Geology Geophys. 50 (4), 299–307. doi: 10.1016/j.rgg.2009.03.013
Romera-Castillo C., Sarmento H., Álvarez-Salgado X. A., Gasol J. M., Marrasé C. (2011). Net production and consumption of fluorescent colored dissolved organic matter by natural bacterial assemblages growing on marine phytoplankton exudates. Appl. Environ. Microbiol. 77 (21), 7490–7498. doi: 10.1128/AEM.00200-11
Savel’eva N., Semiletov I., Pipko I. (2008). Impact of synoptic processes and river discharge on the thermohaline structure in the East Siberian Sea shelf. Russian Meteorol. Hydrol. 33 (4), 240–246. doi: 10.3103/S1068373908040079
Savun-Hekimoğlu B., Gazioğlu C. (2021). Mucilage problem in the semi-enclosed seas: recent outbreak in the Sea of marmara. Int. J. Environ. Geoinformatics 8 (4), 402–413. doi: 10.30897/ijegeo.955739
Schuur E. A., Bockheim J., Canadell J. G., Euskirchen E., Field C. B., Goryachkin S. V., et al. (2008). Vulnerability of permafrost carbon to climate change: Implications for the global carbon cycle. BioScience 58 (8), 701–714. doi: 10.1641/B580807
Semiletov I., Dudarev O., Luchin V., Charkin A., Shin K. H., Tanaka N. (2005). The East Siberian Sea as a transition zone between pacific-derived waters and Arctic shelf waters. Geophys. Res. Lett. 32 (10), L10614 . doi: 10.1029/2005GL022490
Spencer R. G. M., Aiken G. R., Butler K. D., Dornblaser M. M., Striegl R. G., Hernes P. J. (2009). Utilizing chromophoric dissolved organic matter measurements to derive export and reactivity of dissolved organic carbon exported to the Arctic ocean: A case study of the Yukon river, Alaska. Geophys. Res. Lett. 36 (6), L06401. doi: 10.1029/2008GL036831
Stedmon C. A., Amon R. M. W., Rinehart A. J., Walker S. A. (2011). The supply and characteristics of colored dissolved organic matter (CDOM) in the Arctic ocean: Pan Arctic trends and differences. Mar. Chem. 124 (1-4), 108–118. doi: 10.1016/j.marchem.2010.12.007
Stedmon C. A., Markager S., Bro R. (2003). Tracing dissolved organic matter in aquatic environments using a new approach to fluorescence spectroscopy. Mar. Chem. 82 (3-4), 239–254. doi: 10.1016/S0304-4203(03)00072-0
Stedmon C. A., Markager S., Kaas H. (2000). Optical properties and signatures of chromophoric dissolved organic matter (CDOM) in Danish coastal waters. Estuarine Coast. Shelf Sci. 51 (2), 267–278. doi: 10.1006/ecss.2000.0645
Stedmon C. A., Nelson N. B. (2015). “"The optical properties of DOM in the ocean,",” in Biogeochemistry of Marine Dissolved Organic Matter, (Elsevier), eds Hansell D. A., Carlson C. A. (San Diego, CA: Elsevier Inc.), 481–508.
Stein R., Macdonald R. W. (eds.). (2004). The organic carbon cycle in the Arctic Ocean. (Berlin; Heidelberg: Springer). doi: 10.1007/978-3-642-18912-8
Sukhanova I., Flint M., Fedodov A., Sakharova E., Makkaveev P., Polukhin A., et al. (2021). First data on the structure of phytoplankton communities of the East Siberian Sea. Oceanology 61 (6), 909–929. doi: 10.1134/S0001437021060151
Sun Q., Wang C., Wang P., Hou J., Ao Y. (2014). Absorption and fluorescence characteristics of chromophoric dissolved organic matter in the Yangtze estuary. Environ. Sci. pollut. Res. 21 (5), 3460–3473. doi: 10.1007/s11356-013-2287-4
Vetrov A. A., Romankevich E. A. (2010). Carbon cycle in the Russian Arctic Seas. (Berlin; Heidelberg: Springer-Verlag).
Vignudelli S., Santinelli C., Murru E., Nannicini L., Seritti A. (2004). Distributions of dissolved organic carbon (DOC) and chromophoric dissolved organic matter (CDOM) in coastal waters of the northern tyrrhenian Sea (Italy). Estuarine Coast. Shelf Sci. 60 (1), 133–149. doi: 10.1016/j.ecss.2003.11.023
Vonk J. E., Sánchez-García L., Van Dongen B., Alling V., Kosmach D., Charkin A., et al. (2012). Activation of old carbon by erosion of coastal and subsea permafrost in Arctic Siberia. Nature 489 (7414), 137–140. doi: 10.1038/nature11392
Walker S. A., Amon R. M., Stedmon C., Duan S., Louchouarn P. (2009). The use of PARAFAC modeling to trace terrestrial dissolved organic matter and fingerprint water masses in coastal Canadian Arctic surface waters. Journal of Geophysical Research: Biogeosciences 114(G4). doi: 10.1029/2009JG000990
Walker S. A., Amon R. M. W., Stedmon C. A. (2013). Variations in high-latitude riverine fluorescent dissolved organic matter: A comparison of large Arctic rivers. J. Geophys. Research: Biogeosci. 118 (4), 1689–1702. doi: 10.1002/2013JG002320
Wassmann P., Bauerfeind E., Fortier M., Fukuchi M., Hargrave B., Moran B., et al. (2004). “Particulate organic carbon flux to the Arctic Ocean sea floor,” in The organic carbon cycle in the Arctic Ocean. Springer), 101–138. doi: 10.1007/978-3-642-18912-8_5
Weishaar J. L., Aiken G. R., Bergamaschi B. A., Fram M. S., Fujii R., Mopper K. (2003). Evaluation of specific ultraviolet absorbance as an indicator of the chemical composition and reactivity of dissolved organic carbon. Environ. Sci. Technol. 37 (20), 4702–4708. doi: 10.1021/es030360x
Wilson H. F., Xenopoulos M. A. (2009). Effects of agricultural land use on the composition of fluvial dissolved organic matter. Nat. Geosci. 2 (1), 37–41. doi: 10.1038/ngeo391
Wohlers J., Engel A., Zöllner E., Breithaupt P., Jürgens K., Hoppe H.-G., et al. (2009). Changes in biogenic carbon flow in response to sea surface warming. Proc. Natl. Acad. Sci. 106 (17), 7067–7072. doi: 10.1073/pnas.0812743106
Yamashita Y., Jaffé R. (2008). Characterizing the interactions between trace metals and dissolved organic matter using excitation– emission matrix and parallel factor analysis. Environ. Sci. Technol. 42 (19), 7374–7379. doi: 10.1021/es801357h
Yamashita Y., Tanoue E. (2003). Chemical characterization of protein-like fluorophores in DOM in relation to aromatic amino acids. Mar. Chem. 82 (3-4), 255–271. doi: 10.1016/S0304-4203(03)00073-2
Yamashita Y., Tanoue E. (2008). Production of bio-refractory fluorescent dissolved organic matter in the ocean interior. Nat. Geosci. 1 (9), 579–582. doi: 10.1038/ngeo279
Keywords: Arctic shelf, FDOM, river plume, East Siberian Sea, Laptev Sea, PARAFAC decomposition
Citation: Drozdova AN, Krylov IN, Nedospasov AA, Arashkevich EG and Labutin TA (2022) Fluorescent signatures of autochthonous dissolved organic matter production in Siberian shelf seas. Front. Mar. Sci. 9:872557. doi: 10.3389/fmars.2022.872557
Received: 09 February 2022; Accepted: 22 July 2022;
Published: 09 August 2022.
Edited by:
Toru Kobari, Kagoshima University, JapanReviewed by:
Michael Thomas Montgomery, Texas A&M University Corpus Christi, United StatesHideki Fukuda, The University of Tokyo, Japan
Copyright © 2022 Drozdova, Krylov, Nedospasov, Arashkevich and Labutin. This is an open-access article distributed under the terms of the Creative Commons Attribution License (CC BY). The use, distribution or reproduction in other forums is permitted, provided the original author(s) and the copyright owner(s) are credited and that the original publication in this journal is cited, in accordance with accepted academic practice. No use, distribution or reproduction is permitted which does not comply with these terms.
*Correspondence: Anastasia N. Drozdova, YWRyb3pkb3ZhQG9jZWFuLnJ1