 Aniefiok Ini Inyang
 You-Shao Wang
 Hao Cheng
- 1State Key Laboratory of Tropical Oceanography, South China Sea Institute of Oceanology, Chinese Academy of Sciences, Guangzhou, China
- 2Daya Bay Marine Biology Research Station, Chinese Academy of Sciences, Shenzhen, China
- 3Southern Marine Science and Engineering Guangdong Laboratory (Guangzhou), Guangzhou, China
- 4Innovation Academy of South China Sea Ecology and Environmental Engineering, Chinese Academy of Sciences, Guangzhou, China
- 5University of Chinese Academy of Sciences, Beijing, China
Although the relationship between biodiversity and ecological functioning is a vital issue in coastal water ecology, how this relationship is influenced by environmental conditions is still unknown. It was investigated for the dynamics of algal diversity and algal pollution indices, as well as their relationships with trophic state, in a mangrove forest along the Guangdong coast, South China. It is hypothesized that the phytoplankton alpha-diversity indices and algal pollution indices have the potential to provide a signal linking trophic state and water quality variation in the mangrove forest. The t-test showed that phytoplankton alpha-diversity indices and algal pollution indices varied significantly between the dry and wet seasons (p < 0.01 or p < 0.05). The trophic state index record confirmed that the mangrove forest was mesotrophic to eutrophic during study periods while the CCME: WQI revealed that the water quality in the forest was under poor and marginal conditions in both seasons. Multivariate analysis revealed that the dynamics of phytoplankton alpha-diversity and algal pollution indices was closely related to trophic states change and influenced by environmental conditions. The results indicated that pH, total dissolved solids, salinity, electrical conductivity, turbidity, nitrate, and phosphate were the main factors affecting algal assemblages in the mangrove forest. The indices were confirmed as a quicker, faster, and reliable approach to appropriately describe and measure the trophic state variations in the mangrove ecosystem, though an integrated approach may be required in the future.
1 Introduction
Mangroves, which can be found in tropical and subtropical regions, serve as buffer zones between freshwater and marine biomes, providing habitat for a variety of life (Wang, 2019), and providing natural sewage treatment systems that have been utilized over decades (Wong et al., 1997; Carlos et al., 2007; Wu et al., 2008; Wang and Gu, 2021). Due to the mixing of these distinct water bodies, they are characterized by pronounced gradients of physical, chemical (McLusky, 1993), and biological components (Inyang and Wang, 2020). Ecosystem assessment is typically conducted using ecological indicators (Rapport and Hildén, 2013), which provide tools for managerial decisions by providing information about a specific area of interest (Jørgensen et al., 2013). Hence, ecological indicators are often based on the biological community at a site, and variation in community characteristics is used to compare the ecological state of that site to those of other sites. Over time, it has been reasoned that environmental parameters and changes therein determine the characteristics of biological communities (Friberg, 2014). Microalgae communities are known to respond rapidly to environmental variation, their short life cycle being sensitive to ecosystem changes (Marchetto et al., 2009; Taipale et al., 2019; Bergstrom et al., 2020; Inyang and Wang, 2020).
Globally, different mangrove forests have been stressed with a significant impact of algal bloom in the forest (Adhavan et al., 2015; Kamalifar et al., 2016; Temino-Boes et al., 2019). The anthropogenic eutrophication impact on coastal waters has always been a global issue before the 2000s, due to wastewater discharge from urban cities, agricultural activities (Meng et al., 2020), and aquaculture facilities into rivers, lakes, and wetlands directly; these also result in algal blooms, mainly of cyanobacteria and diatoms. Meanwhile, this phenomenon has been reported across numerous coastal waters in China (Yang et al., 2004; Xiao et al., 2007; Meng et al., 2020). The anthropogenic nutrient enrichment in coastal waters may cause an extensive impact on the nitrogen cycle (Reis et al., 2017), which could lead to accelerated changes (Geedicke et al., 2018) in the mangrove forest.
Generally, the eutrophication phenomenon has led to ecosystem imbalance, establishment of tolerance species, and disappearance of sensitive taxa (Gu and Wang, 2015). Meanwhile, the application of microalgae for ecosystem monitoring has a long history (Lepisto, 1999) where numerous indices have been developed but none have become widely accepted. Nevertheless, the application of alpha biodiversity indices (i.e., Magarlef index, Shannon index, Pielou’s index, and Simpson diversity) to study the characteristics of the microalgae community structure in different water bodies has just been established (Mulder et al., 2001; Weis et al., 2007; Meng et al., 2020), but the application of these indices in ecological study of the mangrove forest is lacking. This study is the first to establish the response mechanism of alpha-diversity indices to changes in water quality parameters in the mangrove forest. Though the diversity based on species richness (number of taxa) and evenness (taxa distribution) can reflect microalgae community composition and could also describe the impacts of water pollution on biotic communities (Hooper et al., 2005), these indices require a high level of taxonomic classification. The degree to which physical and chemical variables affect microalgae alpha-diversity indices is different across different aquatic habitats (Meng et al., 2020). The knowledge of the biotic indicators to explore microalgae assemblage response to environmental change in the mangrove forest is a fundamental research objective in the ecology of the ecosystem.
Therefore, microalgae alpha-diversity indices, algal biomass, algal pollution indices, single-factor trophic state index (TSI Chl a), and Canadian Council of Ministers of the Environment Water Quality Index (WQI: CCME) were evaluated in the mangrove forest along the Guangdong coast, South China. Correlation analysis (Pearson correlation) and multivariate analysis were applied to understand the response of microalgae alpha-diversity indices and algal pollution indices to nutrients and other environmental parameters. Microalgae alpha-diversity indices and WQI: CCME were compared during the wet and dry seasons across the mangrove forest. The purposes of the study are as follows: (i) to explore the impact of hydrological parameters on microalgae indicator species; (ii) to understand alpha-diversity indices and algal pollution indices in relation to nutrient distribution; (iii) to establish trophic conditions of the mangrove forest through evaluation of algal pollution indices, algal diversity indices, and TSI (Chl a); and (iv) to evaluate the WQI: CCME across the mangrove forest.
2 Materials and Methods
The samplings were collected for 34 different locations throughout the Guangdong mangrove forest, at latitude 20°12’–25°31’ N and longitude 109°45’–117°20’ E (Figure 1). The sampling sites are characterized by different species of true mangroves, such as Acrostichum aureum, Excoecaria agallocha, Bruguiera gymnorrhiza, Kandelia obovata, Rizhophora stylosa, Lumnizera racemosa, Aegicera corniculatum, Avicennia marina, and Acanthus ilicifolius, and non-true mangrove species, e.g., Pongamia pinnata, Hibiscus tiliaceus, Thespesia populnes, Herltiera littoralis, Cerbera manghas, Clerodendrum inerme, and Pluchea indica (Inyang and Wang, 2020). Guangdong’s mangrove forest is influenced by semidiurnal to mixed tides all year, with a tidal range of 0.8 m during neap tides and 4.0 m during spring tides. The average annual precipitation in the study region is ~2,000 mm (Liu, 2013), and approximately 85% of the total rainfall is concentrated in the rainy season from April to September.

Figure 1 Study area and sampling stations identified by the red dots on the map.
The study locations were selected across the mangroves from the Leizhou Peninsula in the west to the east. A total of 34 locations were selected spatially across the mangroves to evaluate the spatial and temporal change in phytoplankton community and variation in trophic state (Figure 1). Figures 2A–D show algal bloom formation in some parts of the mangrove forest along the Leizhou Peninsula and across the eastern part of the Guangdong coast.
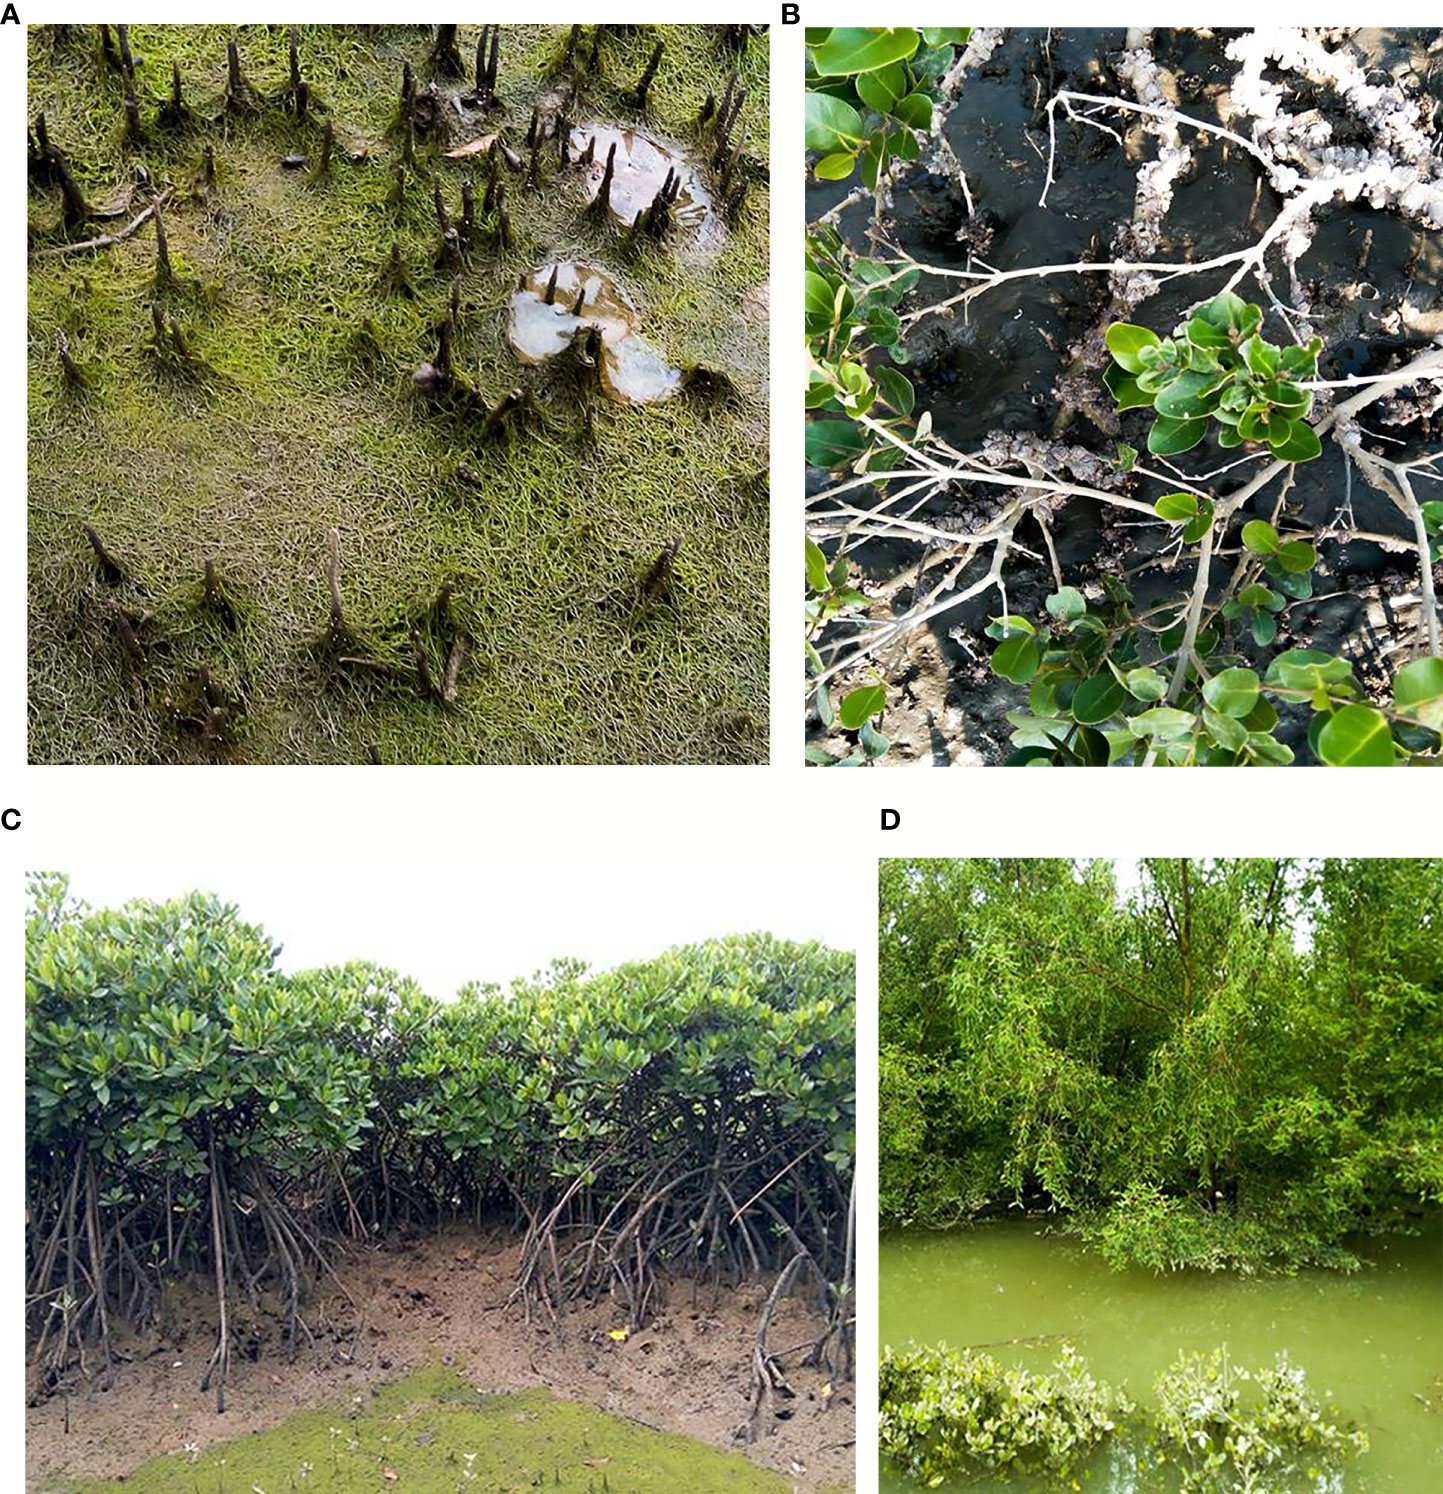
Figure 2 Different sections of the mangrove forest. (A) Mangrove pneumatophores covered with algal bloom. (B) Avecinnia marina bed covered with algal bloom and the plant burdened with high density of barnacles species. (C) Rhizophora forest during low water level with a eutrophic pool of water at high tide. (D) Sonneratia and Avecinnia forest during high water level.
2.1 Sampling Procedure
The sampling and monitoring studies were carried out across 34 stations (30 stations selected during the dry season and 23 stations selected during the wet season) within the mid-section of the mangrove forest from October 2017 to January 2018 (for the dry season) and July to August 2018 (for the wet season). At each station, measurement of environmental parameters and collection of phytoplankton samples were obtained during flood tide.
2.2.1 Measurement of Water Quality Parameters
At each site, in situ measurement of water quality parameters such as water temperature, pH, salinity, electrical conductivity (EC), turbidity, and total dissolved solids (TDS) were measured by using a Quanta® Water Quality Monitoring System (Hydrolab Corporation, USA) during flood water level within the depth of 1 m. Three hundred milliliters of surface water was collected by using sampling plastic bottles for analysis of nutrients (phosphate, nitrate, nitrite, and silicate). The water samples were filtered using 0.22-μm Whatman® GF/F filters before analysis. Within 2–3 h after sampling, nitrate (NO3-N), nitrite (NO2-N), phosphate (PO4-P), and silicate (SiO3-Si) were analyzed with a SKALAR auto-analyzer (Skalar Analytical B.V. SanPlus, Holland). Chlorophyll a (Chl a) analysis was carried out according to HELCOM (2015) using a SHIMADZU Spectrophotometer (UV-1700-Japan) and calculated as follows:
where:
Cv = Chl a concentration, mg/m3; e = volume of ethanol, cm3; a (665K) = absorbance at 665 nm (the peak) minus the absorbance at 750 nm after correction by the cell-to-cell blank; L = length of the curette, cm; V = water volume filtered, dm3; 83 = absorption coefficient in 96% ethanol.
2.2.2 Microalgae Analysis
The microalgae samples were collected during flooding tide by vertically hauling within the depth of 1 m, using a plankton net of 0.045 mm size. Approximately 90 L of water was filtered at each station, and the net was rinsed before new sampling to avoid contamination of the new sample by the previous one. The collected phytoplankton samples in 300-ml plastic bottles were preserved with neutral Lugol’s solution of 10% concentration for further analysis. Further analysis and identification were conducted as described by Inyang and Wang (2020).
2.3 Evaluation of Algal Pollution Indices
The algal genera and species mentioned by Palmer (1969) as pollution indicators were investigated in the study areas. This technique is considered to be a rapid, reliable, and relatively inexpensive way to record water pollution probability across a number of sites (Noel and Rajan, 2015). It can be applied with other indices of inorganic pollution and eutrophication level (Bellinger and Sigee, 2010). Palmer (1969) compiled a list of 60 genera and 80 species as pollution-tolerant individuals, of which he used 20 genera and 20 species to compute the pollution index score. However, only 17 genera and 16 species (Table 1) appeared in the study areas out of the 20 genera and 20 species mentioned in the Palmer pollution index (Palmer, 1969). The taxon was considered significant if its concentration was at least (>10) cells per ml. The final Palmer pollution index value is the summation of the scores of all the present taxa in a given station. Palmer index numerical values were calculated for both species and genera and compared to Palmer’s proposed reference values (0–10 indicated no evidence of organic pollution, 10–5 indicated moderate pollution, 15–20 indicated likely high organic pollution, and 20 or more indicated high organic pollution).
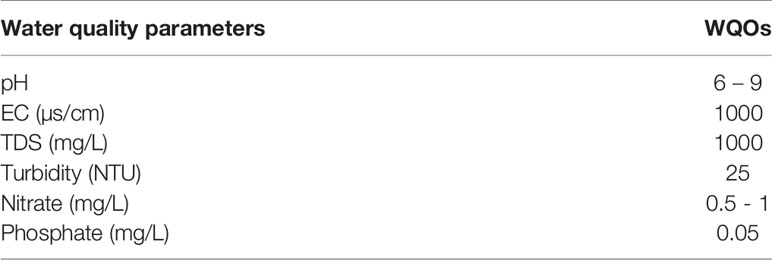
Table 1 Water quality objective used in this assessment according to Chinese Environmental Protection Agency, 2002 (GB3838-2002).
2.4 Trophic State Index
Trophic state index (TSI) using single factor (Chl a) was used to describe the trophic status (Wang, 2002) in the mangrove forest according to the equation:
Evaluation standard: 0 < TSI ≤ 30 oligotrophic, 30 < TSI ≤ 50 mesotrophic, TSI > 50 eutrophic, > 70 high eutrophic.
2.5 Canadian Council of Ministers of the Environment Water Quality Index
The evaluation of index scores in CCME WQI is obtained as stated in the literature (CCME, Canadian Council of Ministers of the Environment, 2001; Feng et al., 2018; Zhu et al., 2019):
where , , and represent scope (number of variables, whose objectives are not met), frequency (number of times by which the objectives are not met), and amplitude (the amount by which the objectives are not met), respectively, and are calculated as follows:
Water quality is categorized into five different categories based on the WQI scores: Poor (0–44), Marginal (45–64), Fair (65–79), Good (80–94), and Excellent (95–100). According to the environmental quality standards for surface waters (GB3838–2002) (Table 1) in China, the water quality in the mangrove forest during both seasons were classified as grade III with a nitrogen concentration limit of 1 mg/L and a phosphorus concentration limit of 0.05 mg/L (Ministry of Environment Protection of the People's Republic, 2010; Ministry of Environment Protection of the People's Republic, 2011).
2.6 Phytoplankton Alpha-Diversity Indices
The phytoplankton assemblage diversity was measured using univariate statistics, such as alpha-diversity indices. This was made possible using the software package PRIMER© version 7 (Plymouth Marine Laboratory, U.K.), and following the methods described in Clarke and Warwick (2001) and Clarke and Gorley (2006). Besides the Species richness (S), expressed as the number of species per sample, the alpha-diversity indices were also evaluated. These included the Shannon index (H′), the Margalef index (d), Pielou’s (J’) diversity, Simpson’s (λ) dominance, and inverted Simpson’s (1 − λ) index.
2.7 Statistical Analysis
Statistical analysis was carried out with the aid of XLSTAT (2016 version), SPSS (version 22.0), PAST 3, and PRIMER 7. Student’s t-test analysis was carried out with the aid of XLSTAT (2016 version), while Pearson’s correlation was performed via SPSS (version 22.0) at a significant level (p < 0.01) and (p < 0.05). CCA ordination plot was carried through PAST 3.
3. Results
3.1 Environmental Characteristics and Pollution Indices Fluctuation
The univariate statistics of the environmental characteristics of the 11 water quality parameters including pollution indices across the mangrove forest in two different seasons (dry and wet) are given in Table 2. The pH was within the range for surface water standard limit and showed no significant difference between the two seasons (p < 0.05) while turbidity fluctuated above the limit across most of the sampling sites during both seasons and showed no significant difference between the two seasons. Electrical conductivity, total dissolved solids, nitrate, and phosphate were significantly different between the two seasons (p < 0.05 or p < 0.01). However, EC, TDS, and phosphate values in most of the sampling sites were above the standard limit, whereas nitrate was below the limit value in most of the sites during the wet season but above its limit value in the Pearl River axis of the Guangdong coast during the dry season.
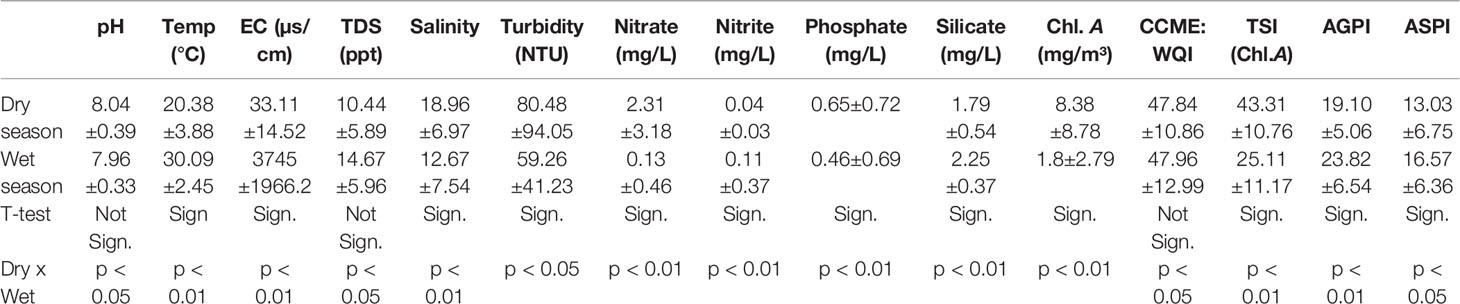
Table 2 The temporal and spatial variation of environmental parameters and pollution indices during study period.
The calculated surface water quality index according to the CCME method (Figure 3) showed no significant difference between the two seasons (p < 0.05) (Tables 3, 4). These values were basically within the range of poor and marginal category. Meanwhile, only at sites gd-21 in the wet season and gd-27 in the dry season was the water quality index recorded > 70 (fair). The sampling sites gd-33 to gd-38 were under poor water quality category during both seasons. The single-factor trophic state index analysis (TSI Chl a) showed a significant difference between the two seasons (p < 0.01). Its index value in the dry season was under mesotrophic to eutrophic state, while in the wet season, it was basically mesotrophic to oligotrophic (Figure 4). Based on environmental variable pattern and TSI, we found that pH, TDS/salinity, nitrate, and phosphate were positively correlated with TSI, and were vital components of an ecological process that influenced the trophic state in the mangrove forest.
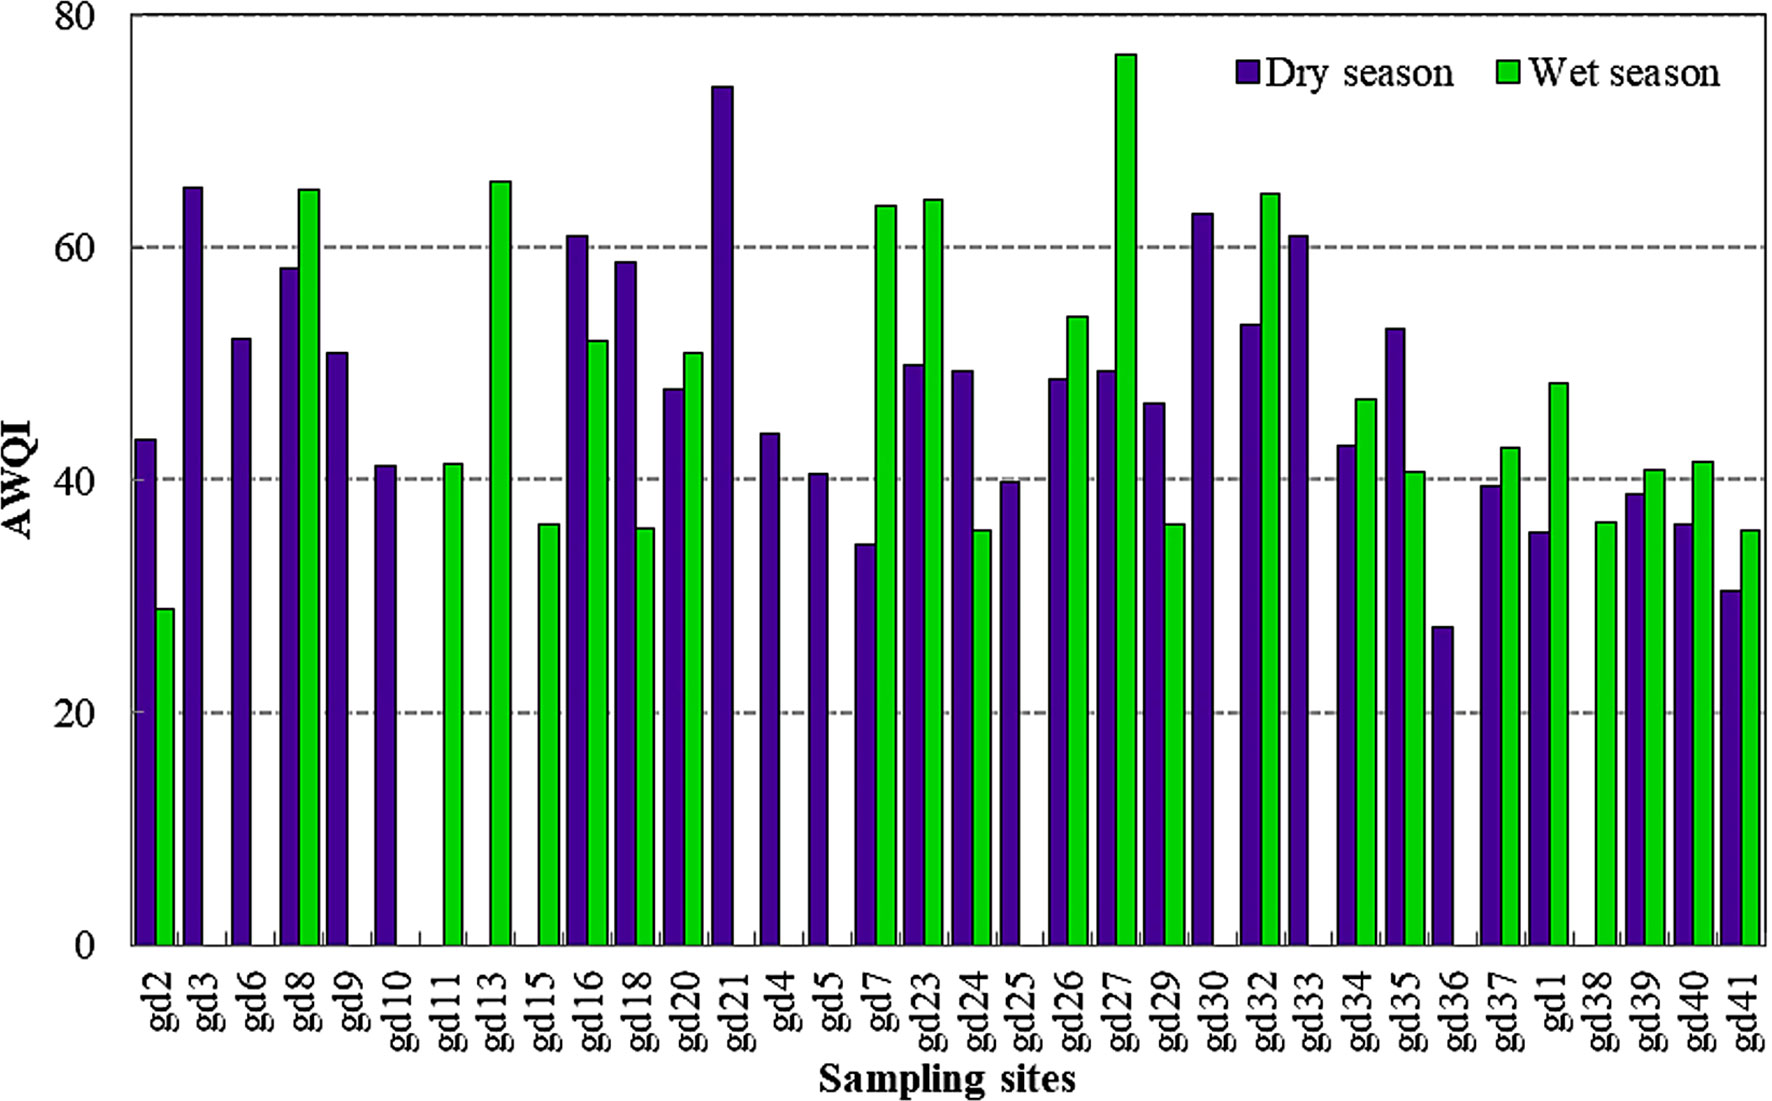
Figure 3 Aquatic water quality index of the mangrove forest at different locations using the CCME method.
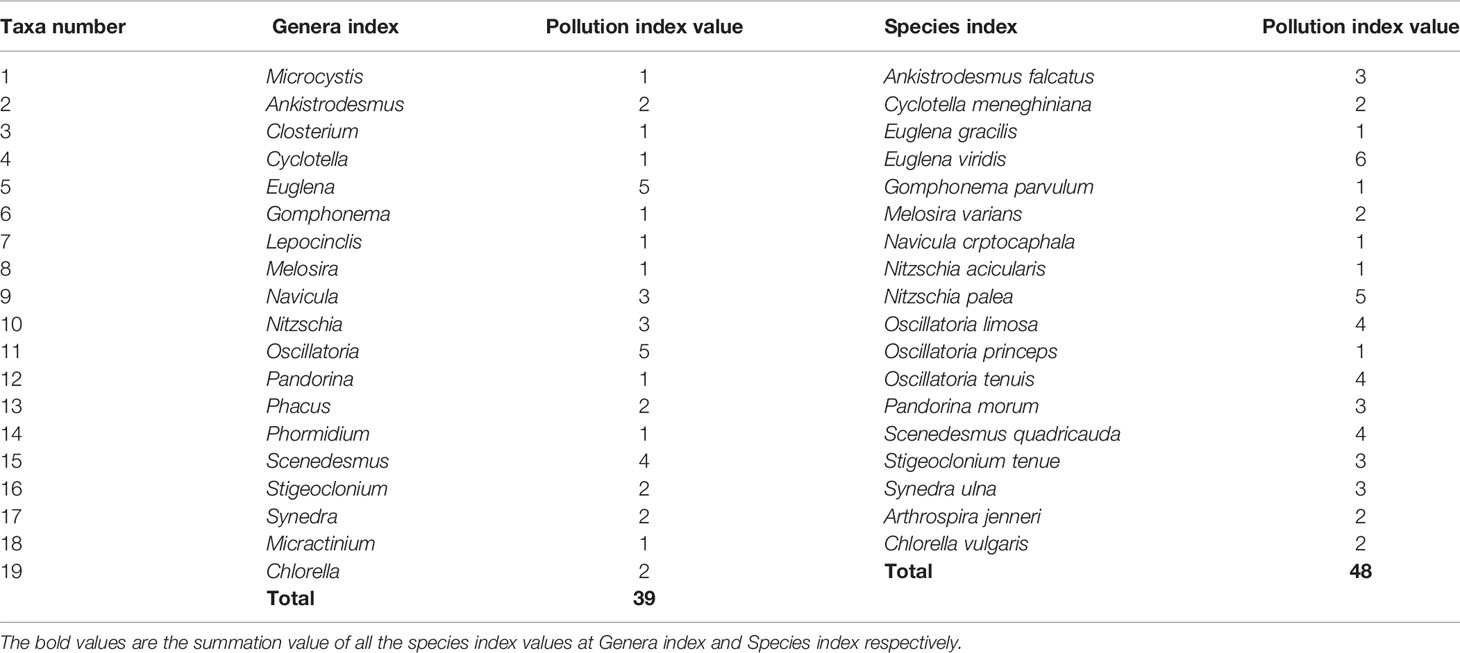
Table 3 Algal Genera and species of pollution interest that are included in the Palmer, 1969 and were detected in the mangroves.
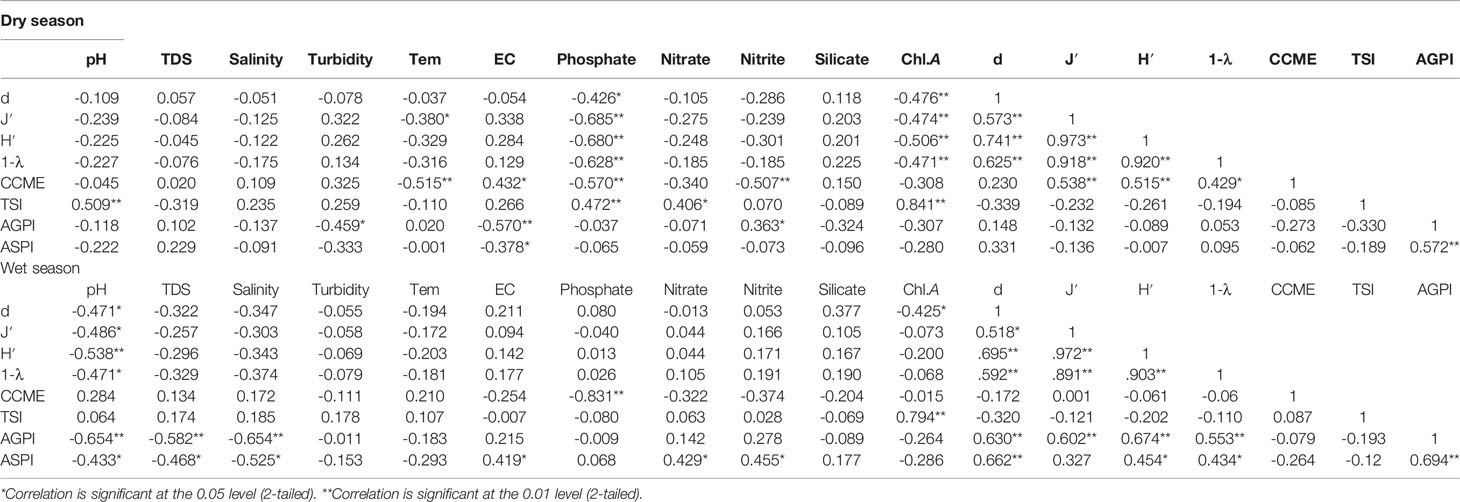
Table 4 The correlation coefficients found by Pearson’s correlation analysis of alpha diversity indices, CCME-WQI, AGPI, ASPI, and TSI (Chl.A) in the mangrove forest.
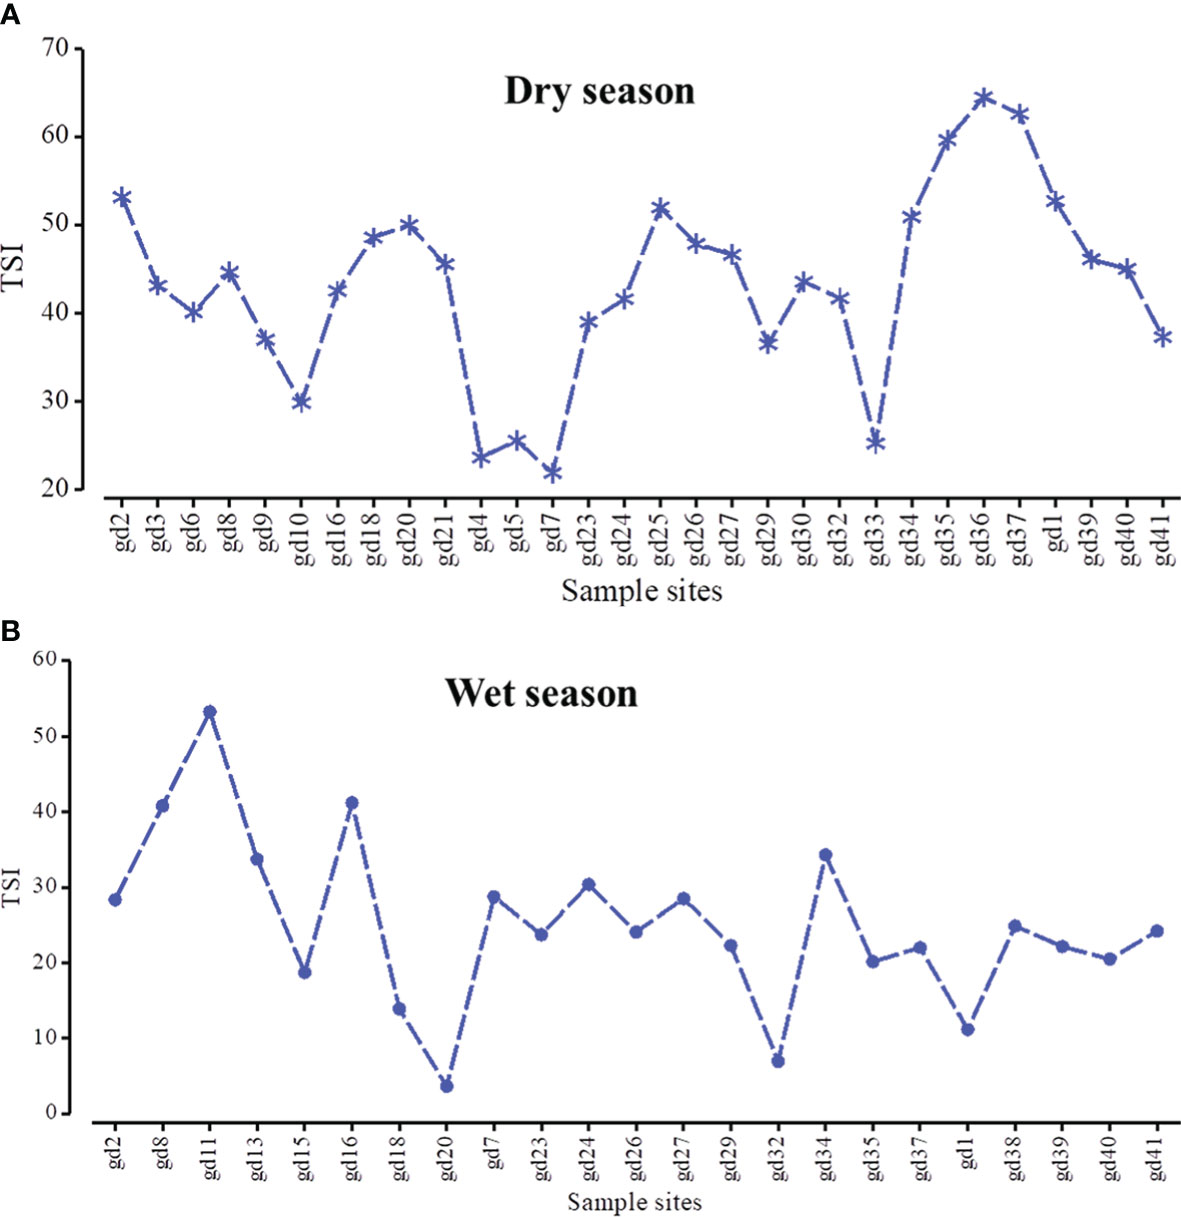
Figure 4 The spatial distribution of trophic state index in dry (A) and wet (B) seasons across the mangrove forest.
According to Palmer (1969), a total of 18 species and 18 genera were identified as pollution-tolerant indicators during the wet season, whereas in the dry season, a total of 14 species and 16 genera were identified (Table 5). These indicator species consist of diatoms, cyanobacteria, green algae, and euglena (e.g., Cyclotella, Navicula, Nitzschia and Synedra, Gomphonema, Melosira, Microcystis, Oscillatoria, Phormidium, Scenedesmus Closterium, Pandorina, Stigeoclonium, Lepocinclis, and Phacus). The micro plates of these species are given in Plate 1.
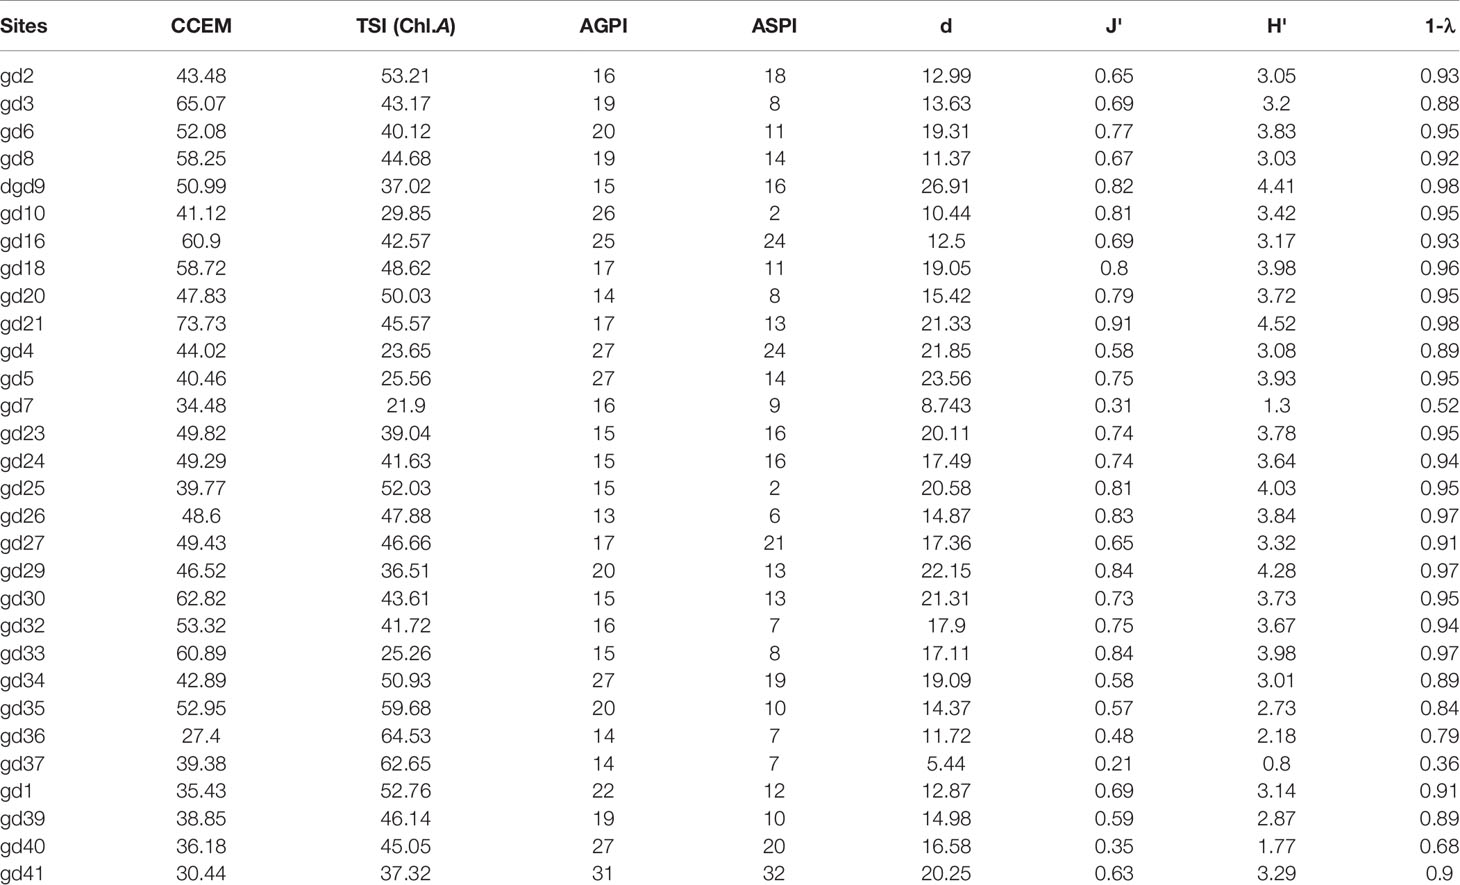
Table 5 The calculated indices values during the dry season across the mangroves.
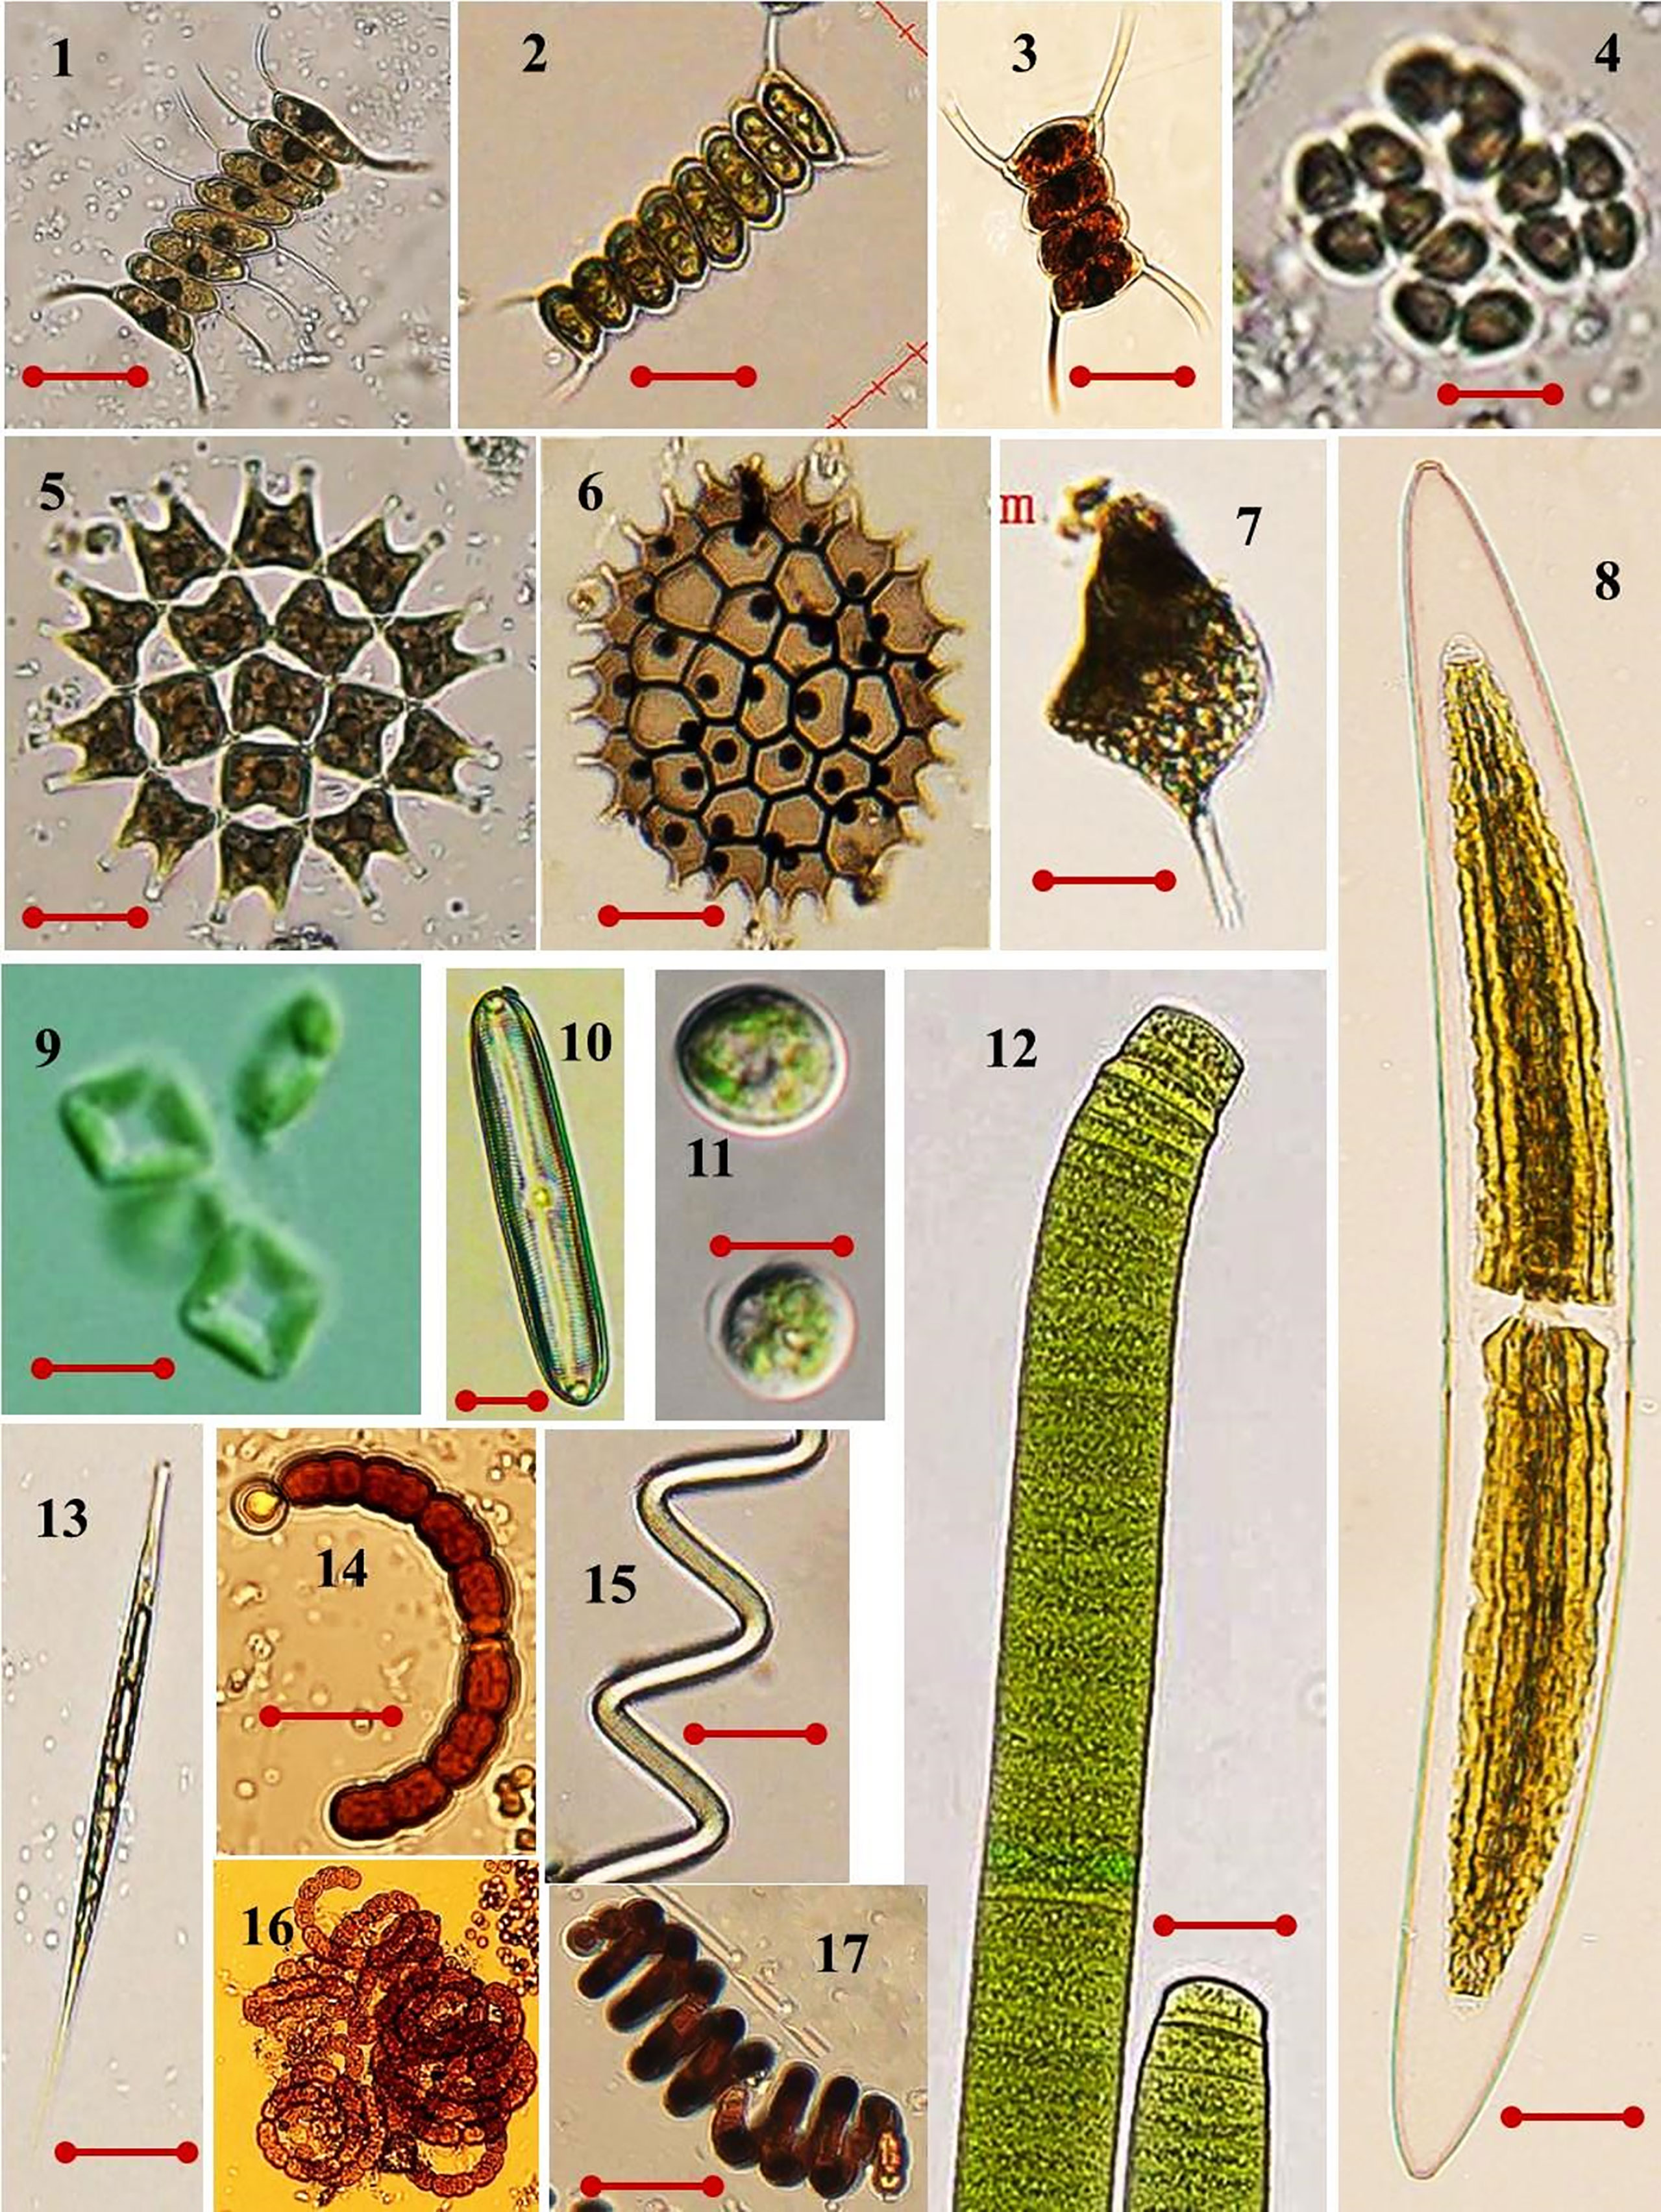
Plate 1 Some optical images of high organic tolerant microalgae that was present in the studied area. (1) Scenedesmus quadricauda var. biornatus f. giganticus (av. diam. 10 µm); (2) S. armatus (av. diam. 6.5 µm); (3) S. quadricauda (av. diam. 6 µm); (4) Crucigenia quadrata (av. diam. 5.5 µm); (5) Pediastrum duplex (av. diam. 13.5 µm); (6) Pediastrum boryanum (av. diam. 16 µm); (7) Phacus longicauda (av. diam. 31 µm); (8) Closterium acerosum (av. diam. 53 µm); (9) Crucigenia fenestrate (av. diam. 3.5 µm); (10) Pinnularia viridis (av. diam. 20.7 µm); (11) Scenedesmus obliquus (av. diam. 16 µm); (12) Oscillatoria princeps (av. diam. 25 µm); (13) Lepocinclis acus (av. diam. 15 µm); (14) Anabaena circinalis (av. diam. 10 µm); (15) Arthrospira jenneri (av. diam. 4 µm); (16) A. spiraoides (av. diam. 8 µm); (17) S. subsalsa (av. diam. 4 µm). Scale bar = 10 µm. LM magnification ×200.
Moreover, the spatial and temporal variation of the algal genus pollution index (AGPI) in the mangrove forest was significantly different between the two seasons (p < 0.01) (Table 2). The mean AGPI in the dry season was 19.10 ± 5.06, significantly lower than that in the wet season (mean = 23.82 ± 6.54) (p < 0.01). The AGPI confirmed that all sampling sites in the dry season experienced moderate to very high organic pollution (Figure 5). More so, all the sampling sites in the wet season experienced moderate to very high organic pollution except gd-23, where no evidence of organic pollution was detected (Figure 5). Furthermore, the evaluation of organic pollution status at the algal species level in the mangrove forest revealed that numerous sampling sites were organically threatened during the dry and wet season (Figure 6). The spatiotemporal distribution of the organic pollution indicator genera and species (Table 5) was significantly affected by water quality parameters (p < 0.05 or p < 0.01) (Table 6).
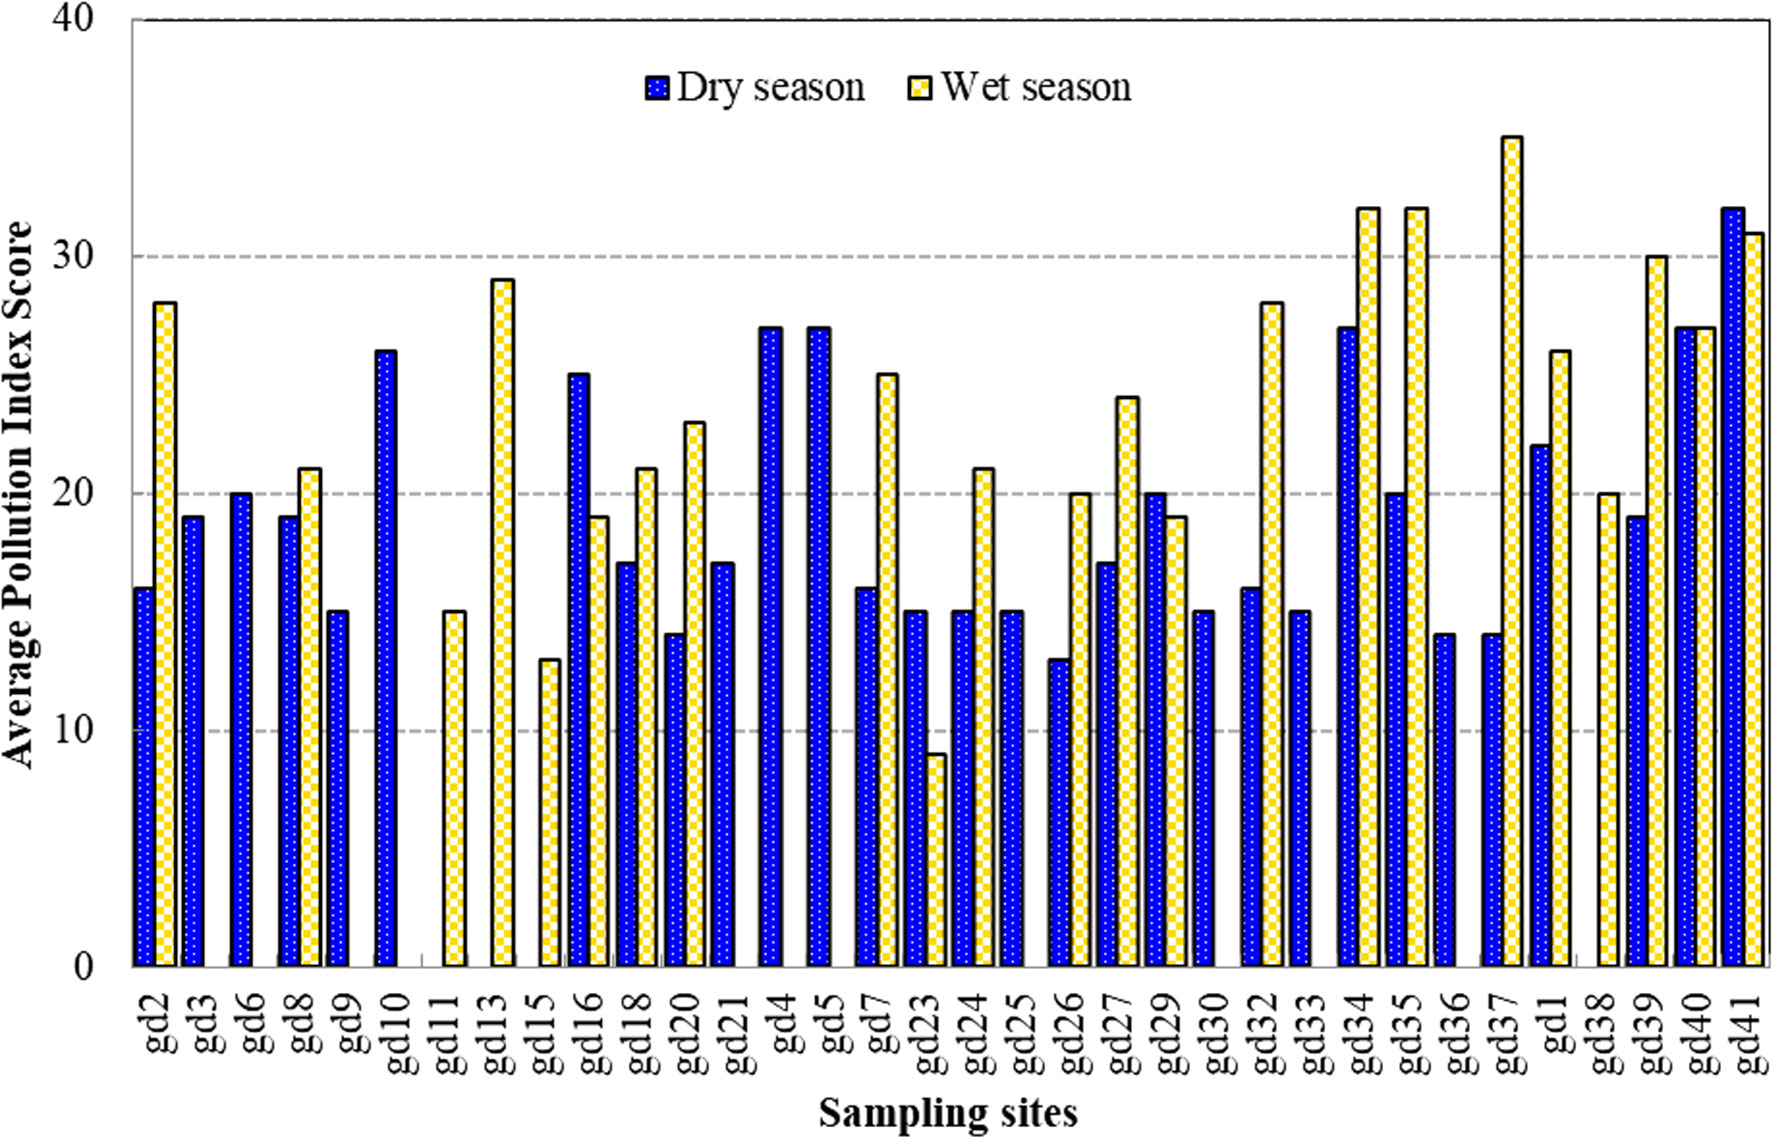
Figure 5 The temporal and spatial variation of the algal genera pollution index score during the study period.
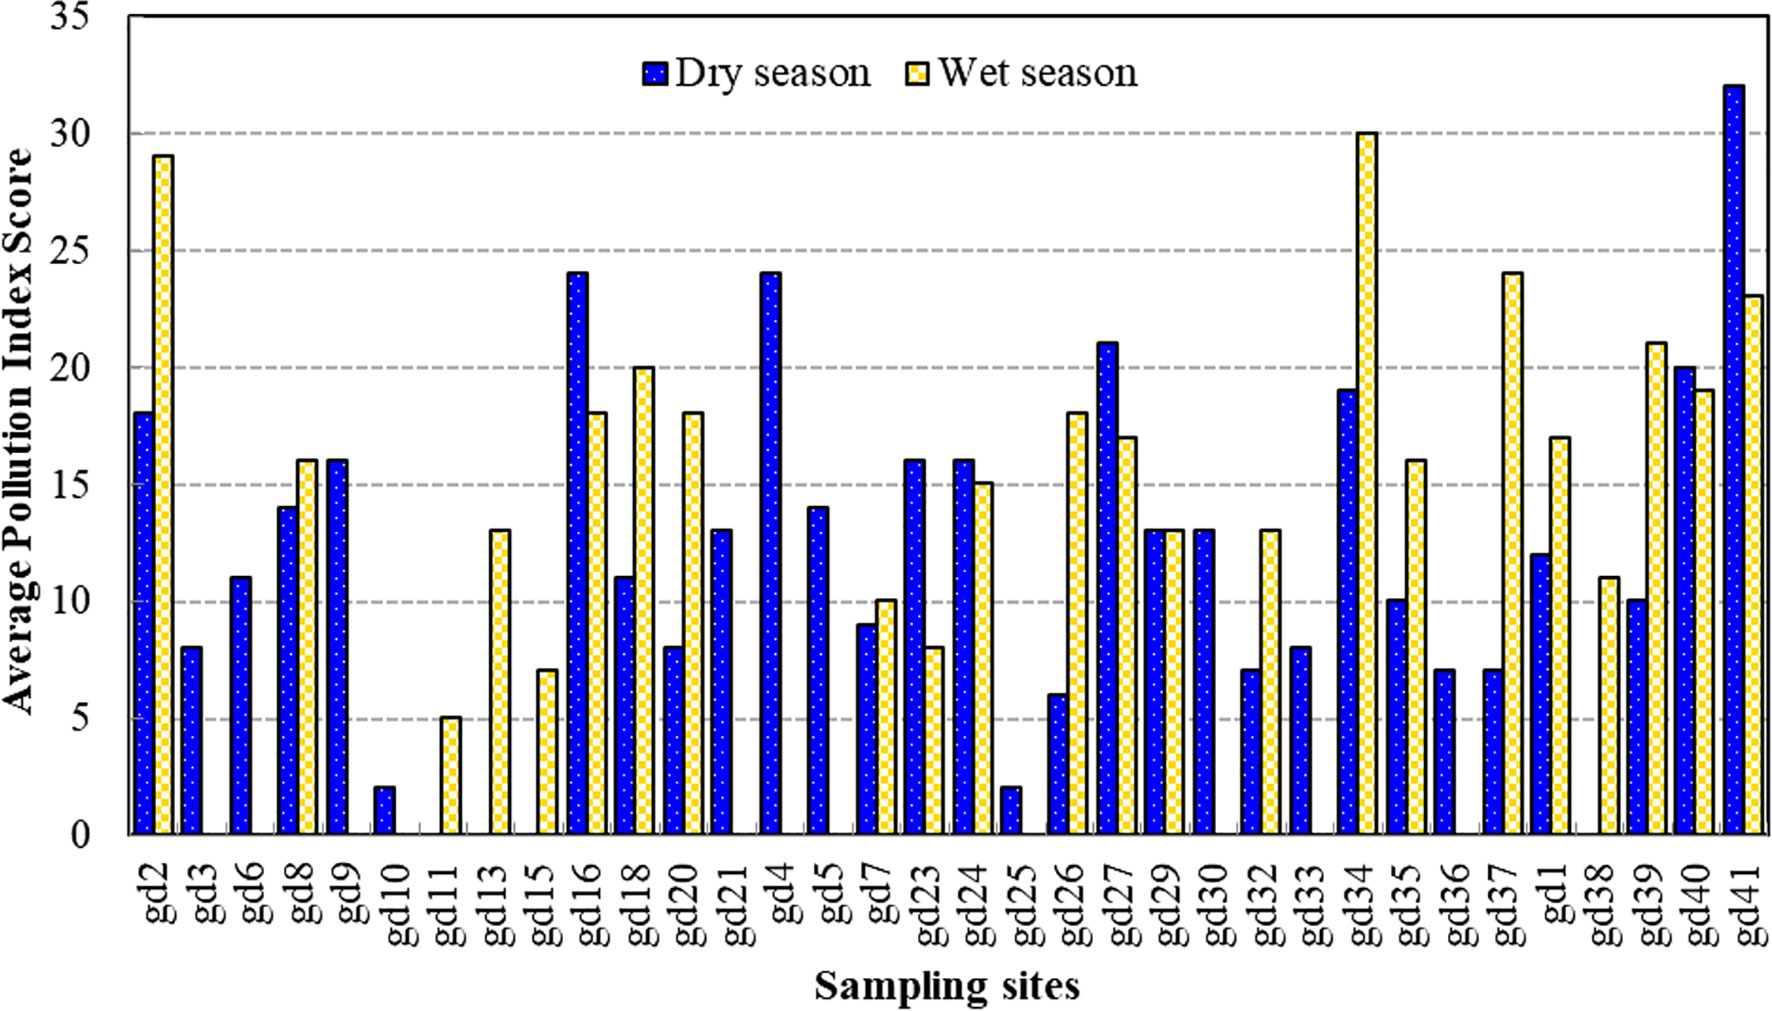
Figure 6 The temporal and spatial variation of the algal species pollution index score during the study period.
3.2 Alpha-Diversity Index and Its Relationship With Water Quality Parameters
The t-test results showed no significant difference in the spatiotemporal variation of alpha-diversity indices across the mangrove forest (p < 0.05) (Table 2). The mean value of the Margalef index was 16.71 ± 4.78 in the dry season and 14.82 ± 3.38 in the wet season. The peak value of the Margalef index was reported at the Leizhou Peninsula (gd-9: 26.91) during the dry season and at the midsection of the Guangdong coast (gd-34: 21.05) during the wet season (Figure 7). We noted that different environmental variables affected the species richness during the dry and wet season. TDS/salinity, nitrate, phosphate, and silicate affected the Margalef index during the dry season while pH, EC, TDS/salinity, and silicate significantly affected it during the wet season (Table 6). These results revealed that increased EC and nutrient concentrations promote the phytoplankton species richness in the mangrove forest. The Pielou index was 0.68 ± 0.17 in the dry season and 0.62 ± 0.12 in the wet season. Like the Margalef index, the maximum value of the Pielou index was recorded at the midsection of the Guangdong coast (gd-34: 0.85) during the wet season and at the Leizhou Peninsula (gd-21: 0.91) during the dry season (Figure 7). The Pielou index is a signal to indicate community species evenness. Our results confirmed that increased salinity in the dry season and EC in the wet season are beneficial factors for species evenness across the mangrove forest (Table 6). Variation on the Shannon–Weaver index (species diversity) across the mangrove forest was influenced by different environmental variables, which included the Margalef and Pielou indices. However, the t-test showed that seasonal change had a slight influence on the Shannon–Weaver index (p > 0.05). The mean value of the Shannon–Weaver index during the dry season and wet season was 3.29 ± 0.86 and 3.02 ± 0.63, respectively (Figure 7). Our results confirmed that the Shannon–Weaver index was controlled by increased TDS/salinity and nutrient salts during the dry season, and by increased EC level and nutrient salts concentration in the wet season (p < 0.05) (Table 6). pH and salinity played a negative significant influence on the Shannon–Weaver index during the wet season (p < 0.01) (Table 6). The spatial distribution of the Simpson index in both dry and wet periods in the mangrove forest was very similar to that of the Shannon–Weaver index (Figure 7). Like the Shannon–Weaver index, the variation of the Simpson index was influenced by the same environmental variables during the dry and wet seasons, respectively (Table 6) (p < 0.05). The Simpson index mean value was 0.89 ± 0.14 in the dry season and 0.87 ± 0.09 in the wet season. The correlation analysis showed that the alpha-diversity indices across the mangrove forest were significantly positively correlated with each other in both seasons (p < 0.01) (Table 6).
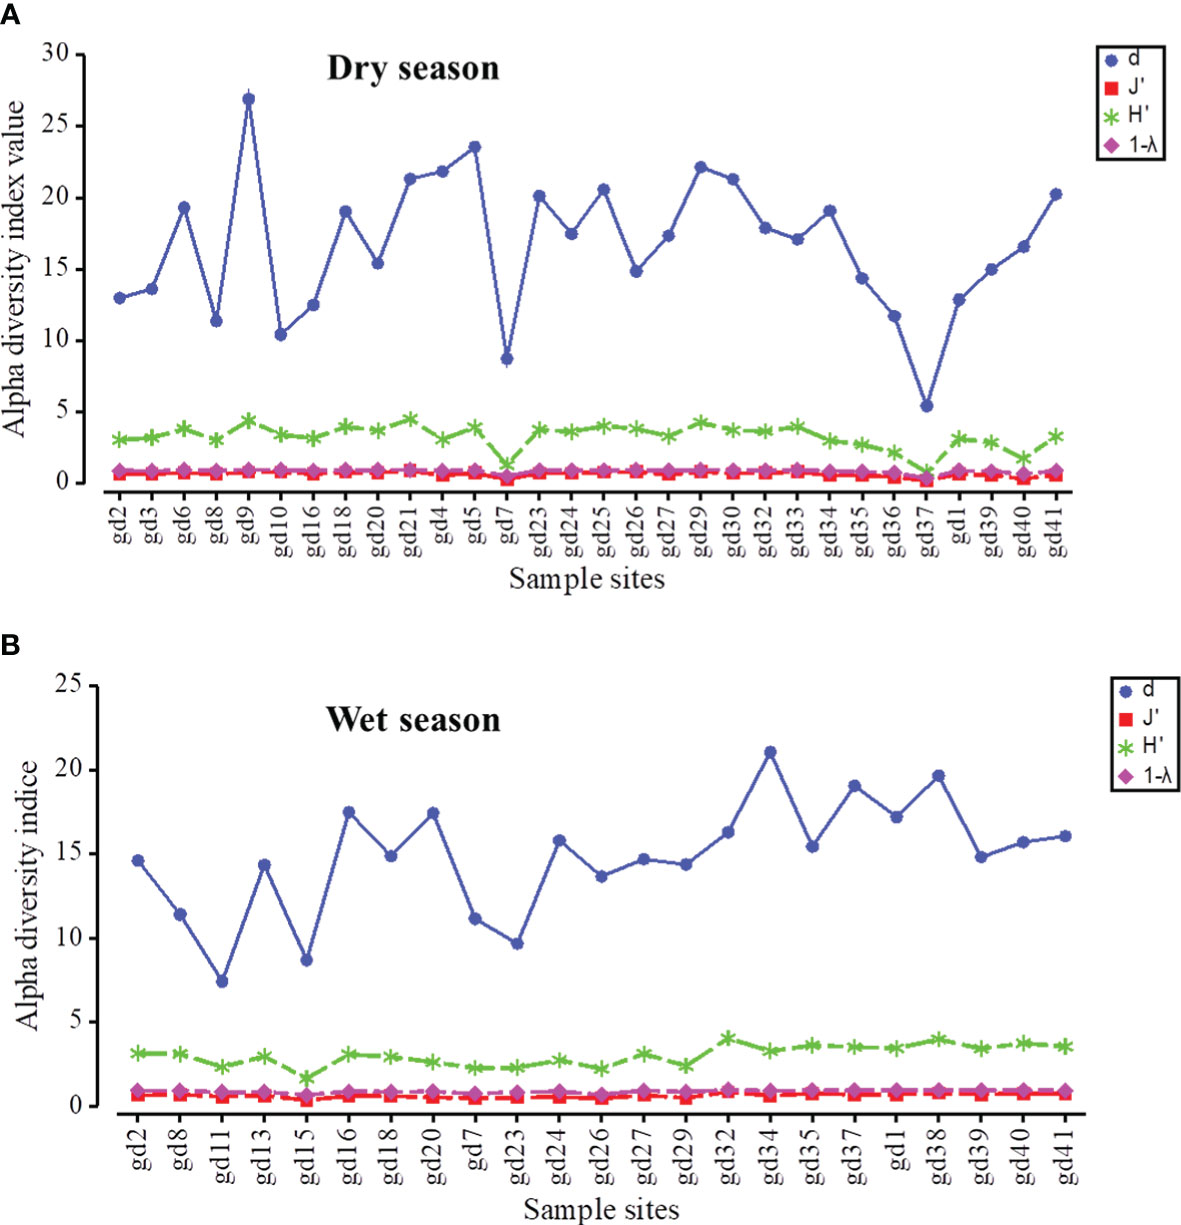
Figure 7 The spatial distribution of phytoplankton alpha-diversity indices during dry (A) and wet (B) seasons. (d = Margalef index; J′ = Pielou index; H′ = Shannon–Weaver index; 1 − λ = Simpson index).
3.3 Relationship Between Alpha-Diversity Indices and Water Quality Indices
Correlation analysis showed that the CCME: WQI in the dry season was significantly positively correlated with the Pielou index, Shannon index, and Simpson index (p < 0.05 or p < 0.01) (Table 6). This implies that the water quality (poor to marginal category) factors during the dry season influenced the species evenness, diversity, and dominance. The TSI was negatively correlated with the alpha-diversity indices in both seasons (p < 0.05) (Table 6). The correlation analysis of AGPI and ASPI during the dry season showed no significant relationship with all the diversity indices; instead, a significant positive correlation was recorded in the wet season (p < 0.01). This implies that a greater proportion of the phytoplankton species in the mangrove forest were made up of organic pollution indicators.
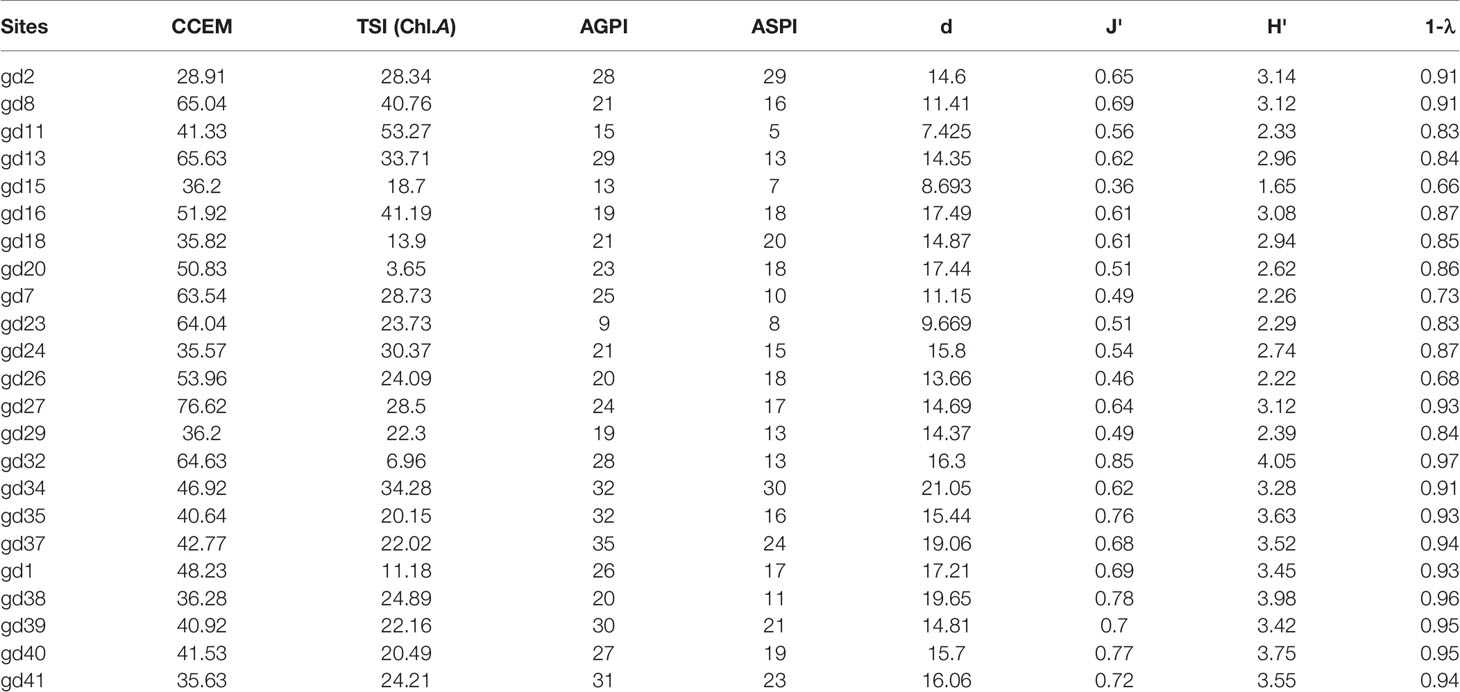
Table 6 The calculated indices values during the wet season across the mangroves.
The multivariate statistical relationships of the algal indices, algal pollution indices, trophic state index, and environmental parameters revealed that the canonical axes of algal indices/environmental parameters during the dry and wet season significantly accounted for 97.56% (pseudo-F = 0.27, p < 0.001), whose axes 1 and 2 explained 95.22% (Eigenval = 0.26, p = 0.001) and 2.34% (Eigenval = 0.006, p = 0.033) variation, respectively (Figure 8). This explains the fact that the applied indices and TSI during both seasons related positively to the environmental parameters on each axis.
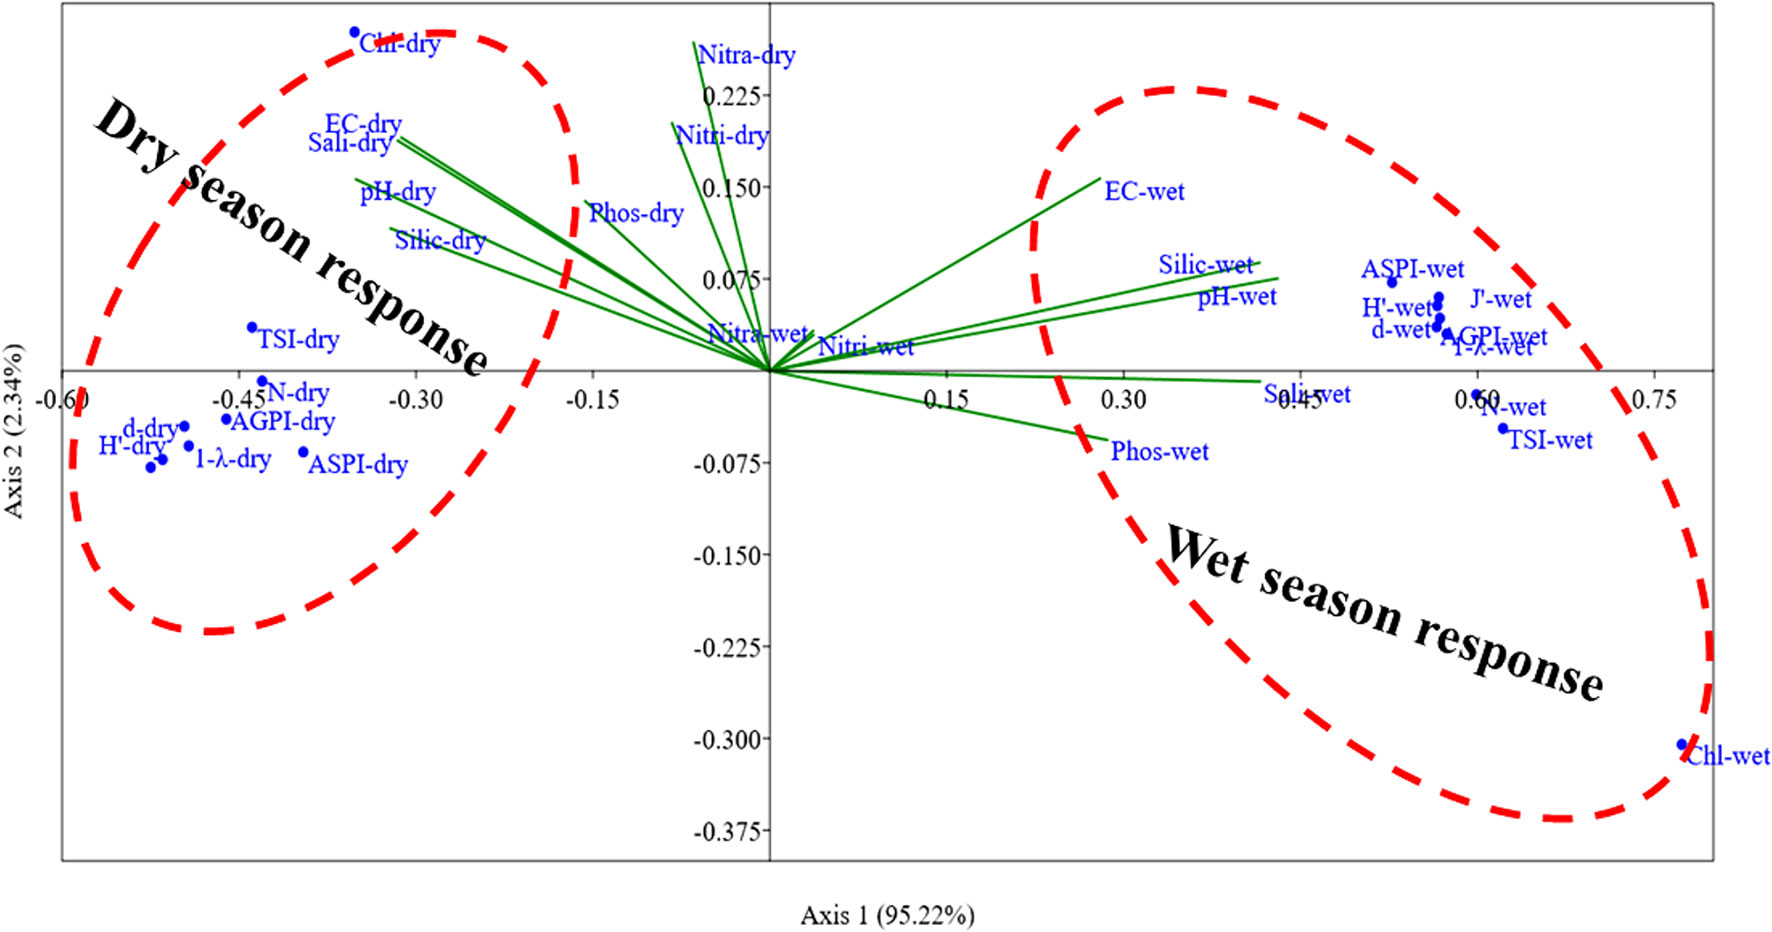
Figure 8 CCA ordination showing the response relationship of the biodiversity indices, trophic state indices, and environmental variables in the mangrove ecosystem during dry and wet seasons. (N, algal abundance; d, Margalef index; J′, Pielou index; H′, Shannon–Weaver index; 1 − λ, Simpson index; AGPI, Algal genus pollution index; ASPI, Algal species pollution index; EC, Electrical conductivity; Sali, salinity; Chl, Chlorophyll-a; Nitra, Nitrate; Nitri, Nitrite; Phos, phosphate; Silic, Silicate).
4 Discussion
Phytoplankton diversity indices have been shown to be a useful approach in the evaluation of community structure (e.g., evenness, richness, function, and stability) (Mousing et al., 2016); specifically, phytoplankton alpha-diversity indices have been applied as a tool for trophic state assessment and monitoring of the potential harmful algae blooms (Yang et al., 2016; Katsiapi et al., 2020; Meng et al., 2020). Deduction of ecological traits, which include ecological information of richness, abundance, and evenness, is the main advantage of phytoplankton alpha-diversity index evaluation (Mousing et al., 2016; Tian et al., 2017). Also, the evaluation of algal pollution indices that make use of pollution-tolerant taxa as developed by Palmer (1969) has the potential of detecting early signs of organic pollution in coastal ecosystems before reaching eutrophication state without chemical analysis of the water body. Organic pollution has become a major concern in the mangrove forest due to increased urbanization, aquaculture, agricultural activities, and tourism (Adam et al., 2018; Temino-Boes et al., 2019; Inyang and Wang, 2020). In this study, it is hypothesized that the phytoplankton alpha-diversity indices and algal pollution indices have the potential to provide a signal linking trophic state and water quality index variation in the mangrove forest. Moreover, our results showed that the phytoplankton alpha-diversity indices and algal pollution indices relate to the water quality parameters, presenting an obvious variation in seasonal scale. In addition, the phytoplankton alpha-diversity indices and algal pollution indices had a close relation with the trophic states index and CCME: WQI as revealed by the multivariate analysis. All of these findings verified our hypothesis that the phytoplankton alpha-diversity indices and algal pollution indices were a potential signal for indicating environmental variations in the mangrove forest.
4.1 Impact of Water Quality Fluctuation on Algal Indicator Species
The mangrove forest in China had been burdened by sewage (Wong et al., 1997; Wu et al., 2008) from households and industries, and by aquaculture wastewater, which has resulted in the deterioration of the forest in some places (Figure 2). Regina et al. (2019) pointed out that the development of tourism, agricultural facilities, and urban cities along the coast causes serious mangrove degradation in Mexico. The CCME: WQI had revealed that the water quality in the mangrove forest remained under poor and marginal conditions in both seasons, indicating the impact of the discharged effluent from the river, aquaculture facilities, farmland, and coastal industries (Inyang and Wang, 2020). In the present study, the nutrient parameters, EC, TDS, and turbidity showed a significant spatiotemporal difference (p < 0.05), which directly affects the diversity and dispersal of phytoplankton in the forest (Saifullah et al., 2014). Thus, the dynamics of algal assemblage can be an excellent bio-indicator in spatial and temporal monitoring of the forest.
The changes in hydrodynamics and the seasonal environmental change act as driving factors for phytoplankton abundance (Mohammad-Noor et al., 2013) and productivity (Pradhan and Shaikh, 2011). This indicates that the dynamic characteristics of the phytoplankton community in the mangrove forest are closely linked to the water quality parameter fluctuation. It was found that diatom indicator species dominate the plankton community and are more abundant in the wet season than in the dry season (p < 0.05). In contrast, indicator species of cyanobacteria and euglena showed no significant variation in abundance during wet and dry periods. It was noted that the motile species of cyanobacteria and euglena were predominant in the forest. During the wet season, it was discovered for low concentrations of nitrate and nitrite, which corresponded with a high abundance of Pseudanabaena sp. The EC and nutrients strongly influenced indicator species of cyanobacteria, green algae, and euglena (Yuan et al., 2018; Meng et al., 2020).
4.2 Alpha-Diversity Indices and Algal Pollution Indices’ Response to Water Quality Indices
Recent studies suggest that environmental variables may be vital for influencing phytoplankton alpha-diversity patterns (Yang et al., 2016; Tian et al., 2017). In this study, which is based on spatial correlation analysis, it was found that EC, turbidity, and temperature were considerable factors in the fluctuation range of the phytoplankton alpha-diversity pattern other than nutrient salts in the dry season. pH, TDS, and salinity affect the phytoplankton alpha-diversity pattern in the wet season. These results showed that alpha-diversity was not significantly different between the two seasons, suggesting that the seasonal changes in hydrological characteristics did not necessarily promote the richness and evenness in the phytoplankton community temporally. Meanwhile, alpha-diversity is considered positively dependent on catchment characteristics (Stefanidou et al., 2020). Increases in the Shannon–Weaver, Simpson, and Pielou indices were primarily interpreted as indicators of community stability and improved trophic status (Yang et al., 2020).
The Simpson, Margalef, and Pielou indices were negatively correlated with TSI during both seasons, and positively significantly correlated with CCME: WQI in the dry season (p < 0.01). Meanwhile, the Margalef index is recorded as a signal for indicating the richness of the community in aquatic and terrestrial ecosystems (Yang et al., 2016). It also was found that pH, TDS, and salinity relatively influenced the phytoplankton richness through the exchange of water and nutrients in the wet season. High EC and trophic state with low salinity and pH provide an appropriate condition for colonization of cyanobacteria and green algae indicator species. The mangrove forest’s environmental conditions, such as shallow and calm water and a high trophic state, create a unique habitat and provide ambient conditions for phytoplankton proliferation. This study revealed that the Margalef and Pielou indices presented a significant correlation with pollution indices (AGPI and ASPI). This implied that the main Palmer pollution indices depend on the species richness and the presence of individual indicator taxa. This correlation is governed by water quality variation. In addition, we inferred that the relevant phytoplankton index assessment could be made by a corresponding ordination analysis for visualizing the interaction of phytoplankton diversity, trophic indices, and nutrient concentrations through multivariate statistical methods. However, our ordination evaluation revealed that the trophic state indices relate significantly with the alpha indices and with the nutrient variation during both seasons (Figure 8) (p < 0.001). Understanding the relationships between diversity indices and trophic state aspects remains a challenge in coastal water research, and at the same time, it is essential for establishing water management databases on a larger spatial and temporal scale.
5 Conclusions
The possibility of algal indices (alpha-diversity and algal pollution indices) to serve as a biological indicator to assess water quality variation in the mangrove forest was investigated in the present study. The multivariate statistical analysis revealed that environmental variables (like pH, TDS, salinity, EC, and nutrients) strongly influenced the alpha-diversity indices and trophic states during different sampling seasons. Spatially, the water quality variables relatively impacted the algal indices during the dry and wet season due to the differences in catchment characteristics. Based on the CCME: WQI evaluation, the surface water of the Guangdong mangrove forest experiences various levels of enrichment across the sampling sites. TDS, EC, turbidity, nitrate, and phosphate were above the surface water standard limit in most of the studied sites during both seasons. Because of the pressure from fish farming facilities, tourist activities, agricultural activities, and urban cities, the Leizhou Peninsula and other parts of the Guangdong coast experienced mesotrophic to eutrophic state pollution during both seasons. The pollution indicator species showed a seasonal variation in its distribution pattern, probably due to the temporary changes in water quality variables. The development of integrated algal indices is beneficial for environmental regulation since the mangrove forest is very important for the production, diversity, relative abundance, and fecundity of phytoplankton.
Data Availability Statement
The raw data supporting the conclusions of this article will be made available by the authors, without undue reservation.
Author Contributions
AI: methodology, software, data curation, and writing—original draft preparation. Y-SW: conceptualization, supervision, and writing—reviewing and editing. HC: investigation and writing—reviewing. All authors contributed to the article and approved the submitted version.
Funding
This research was supported by the National Key Research and Development Program of China (No. 2017FY100700), the National Natural Science Foundation of China (No. U1901211 and No. 41876126), the International Partnership Program of Chinese Academy of Sciences (No. 133244KYSB20180012), the Key Special Project for Introduced Talents Team of Southern Marine Science and Engineering Guangdong Laboratory (Guangzhou) (No. GML2019ZD0305), and the Strategic Priority Research Program of the Chinese Academy of Sciences (No. XDA23050200 and No. XDA19060201).
Conflict of Interest
The authors declare that the research was conducted in the absence of any commercial or financial relationships that could be construed as a potential conflict of interest.
Publisher’s Note
All claims expressed in this article are solely those of the authors and do not necessarily represent those of their affiliated organizations, or those of the publisher, the editors and the reviewers. Any product that may be evaluated in this article, or claim that may be made by its manufacturer, is not guaranteed or endorsed by the publisher.
References
Adam M. F., Najera E., Lovelock C. E., Brown C. J. (2018). Avoided Emissions and Conservation of Scrub Mangroves: Potential for a Blue Carbon Project in the Gulf of California, Mexico. Biol. Lett. 14, 20180400. doi: 10.1098/rsbl.2018.0400
Adhavan D., Marimuthu N., Tikadar S., Sivakumar K. (2015). Impact of Algal Bloom on Mangrove and Coral Reef Ecosystem in the Marine National Park, Gulf of Kachchh, Gujarat, India. J. Mar. Biol. Aquacult. 1, 1–2. doi: 10.15436/2381-0750.15.006
Bellinger E., Sigee D. (2010). “Algae as Bioindicators,” in Freshwater Algae: Identification and Use as Bioindicators. Eds. Bellinger E., Sigee D. (Chichester: John Wiley & Sons, Ltd Inc), 99–136.
Bergstrom A. K., Jonsson A., Isles P. D. F., Creed I. F., Lau D. C. P. (2020). Changes in Nutritional Quality and Nutrient Limitation Regimes of Phytoplankton in Response to Declining N Deposition in Mountain Lakes. Aquat. Sci. 82, 31–47. doi: 10.1007/s00027-020-0697-1
Carlos A. R. S., Sérgio R. O., Ronaldo D. P. R., Antonio A. M. (2007). Dynamics of Phosphorus and Nitrogen Through Litter Fall and Decomposition in a Tropical Mangrove Forest. Mar. Environ. Res. 64, 4524–4534. doi: 10.1016/j.marenvres.2007.04.007
CCME (Canadian Council of Ministers of the Environment) (2001). “Canadian Water Quality Guidelines for the Protection of Aquatic Life: CCME Water Quality Index 1.0, User’s Manual,” in Canadian Environmental Quality Guidelines (Winnipeg: Canadian Council of Ministers of the Environment) 1999.
Clarke K. R., Warwick R. M. (2001). Change in Marine Communities: An Approach to Statistical Analysis and Interpretation (Plymouth, UK: PRIMER-E).
Feng Y., Bao Q., Chenglin L., Bowen W., Zhang Y. (2018). Introducing Biological Indicators Into CCME WQI Using Variable Fuzzy Set Method. Water Resour. Manag. 32, 2901– 2915. doi: 10.1007/s11269-018-1965-x
Friberg N. (2014). Impacts and Indicators of Change in Lotic Ecosystems. Wire. Water. 1, 513–531. doi: 10.1002/wat2.1040
Geedicke I., Oldeland J., Leishman M. R. (2018). Urban Stormwater Run-Off Promotes Compression of Saltmarshes by Freshwater Plants and Mangrove Forests. Sci. Total. Environ. 637, 137–144. doi: 10.1016/j.scitotenv.2018.04.357
Gu J. D., Wang Y. S. (2015). Coastal and Marine Pollution and Ecotoxicology. Ecotoxicology 24, 1407–1410. doi: 10.1007/s10646-015-1528-3
HELCOM (2015). “Guidelines Concerning Phytoplankton Species Composition, Abundance and Biomass,” in Manual for Marine Monitoring in the COMBINE Programme of HELCOM. Available at: http://www.helcom.fi/action-areas/monitoring-andassessment/manuals-and-guidelines/combine-manual. Annex C-6.
Hooper D. U., Chapin F. S. III, Ewel J. J., Hector A., Inchausti P., Lavorel S., et al. (2005). Effects of Biodiversity on Ecosystem Functioning: A Consensus of Current Knowledge. Ecol. Monogr. 75, 3–35. doi: 10.1890/04-0922
Inyang A. I., Wang Y. S. (2020). Phytoplankton Diversity and Community Responses to Physicochemical Variables in Mangrove Zones of Guangzhou Province, China. Ecotoxicology 29, 650–668. doi: 10.1007/s10646-020-02209-0
Jørgensen S. E., Burkhard B., Müller F. (2013). Twenty Volumes of Ecological Indicators – An Accounting Short Review. Ecol. Indic. 28, 4–9. doi: 10.1016/j.ecolind.2012.12.018
Kamalifar R., Aeinjamshid K., Nurinejad M., Dehghan-Mediseh S., Vazirizadeh A. (2016). Ecological Status Assessment of Bidkhun Mangrove Swamp From Bushehr Province, Persian Gulf, Using Macrofauna Community Structure. AAC Bioflux. 9, 8– 18.
Katsiapi M., Genitsaris S., Stefanidou N., Tsavdaridou A., Giannopoulou I., Stamou G., et al. (2020). Ecological Connectivity in Two Ancient Lakes: Impact Upon Planktonic Cyanobacteria and Water Quality. Water 12, 18–30. doi: 10.3390/w12010018
Lepisto L. (1999). “Phytoplankton Assemblages Reflecting the Ecological Status of Lakes in Finland,” in Monographs of the Boreal Environment Research 16(Tampere). Finland: Finnish Environment Institute
Liu J. Y. (2013). Status of Marine Biodiversity of the China Seas. PloS One 8, 50719 – 50743. doi: 10.1371/journal.pone.0050719
Marchetto A., Padedda B. M., Mariani M. A., Luglie A., Sechi N. (2009). A Numerical Index for Evaluating Phytoplankton Response to Changes in Nutrient Levels in Deep Mediterranean Reservoirs. J. Limnol. 68, 106–121. doi: 10.4081/jlimnol.2009.106
McLusky D. S. (1993). Marine and Estuarine Gradients-an Overview. Netherlands J. Aquat. Ecol. 27, 489–493. doi: 10.1007/BF02334809
Meng F., Li Z., Li L., Lu F., Liu Y., Lu X., et al. (2020). Phytoplankton Alpha Diversity Indices Response the Trophic State Variation in Hydrologically Connected Aquatic Habitats in the Harbin Section of the Songhua River. Scien. Rep. 10, 21337–21350. doi: 10.1038/s41598-020-78300-7
Ministry of Environmental Protection of the People’s Republic of China (MEPPRC) (2010). Gazette of Ecoenvironmental Monitoring of Three Gorges Project, Yangzi River, China 2009. Beijing, China
Ministry of Environmental Protection of the People’s Republic of China (MEPPRC) (2011). Gazette of Ecoenvironmental Monitoring of Three Gorges Project, Yangzi River, China 2010. Beijing, China.
Mohammad-Noor N., Harun S. N. R., Lazim Z. M., Mukai Y., Mohamad N. T., Saad S. (2013). Diversity of Phytoplankton in Coastal Water of Kuantan, Pahang, Malaysia. Malay. J. Sci. 32, 29–37. doi: 10.22452/mjs.vol32no1.6
Mousing E. A., Richardson K., Bendtsen J., Cetinic I., Perry M. J. (2016). Evidence of Small-Scale Spatial Structuring of Phytoplankton Alpha- and Beta-Diversity in the Open Ocean. J. Ecol. 104, 1682–1695. doi: 10.1111/1365-2745.12634
Mulder T., Migeon S., Savoye B., Faugeres C. (2001). Inversely Graded Turbidite Sequences in the Deep Mediterranean. A Record of Deposits From Flood Generated Turbidity Currents? Geo-Maine. Lett. 21, 86–93. doi: 10.1007/s003670100071
Noel S. D., Rajan M. R. (2015). Evaluation of Organic Pollution by Palmer’s Algal Genus Index and Physico-Chemical Analysis of Vaigai River at Madurai, India. Natural Resour. Conserv. 3, 7–10. doi: 10.13189/nrc.2015.030102
Palmer C. M. (1969). A Composite Rating of Algae Tolerating Organic Pollution. J. Phycol. 5, 78–82. doi: 10.1111/j.1529-8817.1969.tb02581.x
Pradhan V., Shaikh J. D. (2011). Seasonal Fluctuation of Plankton Population Correlated With Physico-Chemical Factors in Backwards of Jaikwadi Dam (Kaigaon). J. Chem. Biol. Phys. Sci. 1, 270–274.
Rapport D. J., Hildén M. (2013). An Evolving Role for Ecological Indicators: From Documenting Ecological Conditions to Monitoring Drivers and Policy Responses. Ecol. Indic. 28, 10–15. doi: 10.1016/j.ecolind.2012.05.015
Reis C. R. G., Nardoto G. B., Oliveira R. S. (2017). Global Overview on Nitrogen Dynamics in Mangroves and Consequences of Increasing Nitrogen Availability for These Systems. Plant Soil 410, 1–19. doi: 10.1007/s11104-016-3123-7
Stefanidou N., Katsiapi M., Tsianis D., Demertzioglou M., Michaloudi E., Moustaka-Gouni M. (2020). Patterns in Alpha and Beta Phytoplankton Diversity Along a Conductivity Gradient in Coastal Mediterranean Lagoons. Diversity 12, 38–54. doi: 10.3390/d12010038
Taipale S. J., Vuorio K., Aalto S. L., Peltomaa E., Tiirola M. (2019). Eutrophication Reduces the Nutritional Value of Phytoplankton in Boreal Lakes. Environ. Res. 179, 108836–108849. doi: 10.1016/j.envres.2019.108836
Temino-Boes R., Romero-López R., Romero I. (2019). A Spatiotemporal Analysis of Nitrogen Pollution in a Coastal Region With Mangroves of the Southern Gulf of Mexico. Water 11, 2143–2159. doi: 10.3390/w1110214
Tian W., Zhang H. Y., Zhao L., Zhang F. F., Huang H. (2017). Phytoplankton Diversity Effects on Community Biomass and Stability Along Nutrient Gradients in a Eutrophic Lake. Int. J. Environ. Res. Public Health 14, 15–30. doi: 10.3390/ijerph14010095
Wang M. (2002). Evaluate Method and Classification Standard on Lake Eutrophication. Environ. Monit, China 18, 47–49. doi: 10.3969/j.issn.1002-6002.2002.05.018
Wang Y. S., Gu J. D. (2021). Ecological Responses, Adaptation and Mechanisms of Mangrove Wetland Ecosystem to the Global Climate Change and Anthropogenic Activities. Int. Biodeterior. Biodegrad. 162, 105248. doi: 10.1016/j.ibiod.2021.105248
Weis J. J., Cardinale B. J., Forshay K. J., Ives A. R. (2007). Effects of Species Diversity on Community Biomass Production Change Over the Course of Succession. Ecology 88, 929–939. doi: 10.1890/06-0943
Wong Y. S., Tam N. F. Y., Lan C. Y. (1997). Mangrove Wetlands as Wastewater Treatment Facility: A Field Trial. Hydrobiologia 352, 49–59. doi: 10.1023/A:1003040920173
Wu Y., Chung A., Tam N. F. Y., Pi N., Wong M. H. (2008). Constructed Mangrove Wetland as Secondary Treatment System for Municipal Wastewater. Ecol. Eng. 38, 137–146. doi: 10.1016/j.ecoleng.2008.07.010
Xiao Y. J., Ferreira J. G., Bricker S. B., Nunes J. P., Zhu M. Y., Zhang X. L. (2007). Trophic Assessment in Chinese Coastal Systems-Review of Methods and Application to the Changjiang (Yangtze) Estuary and Jiaozhou Bay. Estuar. Coast. 60, 901–908. doi: 10.1007/BF02841384
Yang B., Jiang Y. J., He W., Liu W. X., Kong X. Z., Jørgensen E. J., et al. (2016). The Tempo-Spatial Variations of Phytoplankton Diversities and Their Correlation With Trophic State Levels in a Large Eutrophic Chinese Lake. Ecol. Indic. 66, 153–162. doi: 10.1016/j.ecolind.2016.01.013
Yang Y. F., Li C. H., Nie X. P., Tang D. L., Chung I. K. (2004). Development of Mariculture and its Impacts in Chinese Coastal Waters. Rev. Fish. Biol. Fish. 14, 1–10. doi: 10.1007/s11160-004-3539-7
Yuan Y. X., et al. (2018). Environmental Variables Influencing Phytoplankton Communities in Hydrologically Connected Aquatic Habitats in the Lake Xingkai Basin. Ecol. Indic. 91, 1–12. doi: 10.1016/j.ecolind.2018.03.085
Keywords: alpha-diversity indices, algal pollution indices, mangrove forest, trophic state index, coastal water
Citation: Inyang AI, Wang Y-S and Cheng H (2022) Application of Microalgae Assemblages’ Parameters for Ecological Monitoring in Mangrove Forest. Front. Mar. Sci. 9:872077. doi: 10.3389/fmars.2022.872077
Received: 09 February 2022; Accepted: 23 May 2022;
Published: 28 June 2022.
Edited by:
Ana Carolina Ruiz-Fernández, National Autonomous University of Mexico, MexicoReviewed by:
Chao Wang, Chinese Academy of Fishery Sciences, ChinaBiraja Kumar Sahu, Council of Scientific and Industrial Research (CSIR), India
Rosalba Alonso-Rodríguez, National Autonomous University of Mexico, Mexico
Copyright © 2022 Inyang, Wang and Cheng. This is an open-access article distributed under the terms of the Creative Commons Attribution License (CC BY). The use, distribution or reproduction in other forums is permitted, provided the original author(s) and the copyright owner(s) are credited and that the original publication in this journal is cited, in accordance with accepted academic practice. No use, distribution or reproduction is permitted which does not comply with these terms.
*Correspondence: You-Shao Wang, eXN3YW5nQHNjc2lvLmFjLmNu