 Andrew W. Jones1*
 Katie A. Burchard1
 Anna M. Mercer1John J. Hoey1Michael D. Morin1Giovanni L. Gianesin2Jacob A. Wilson1Calvin R. Alexander1Brooke A. Lowman1Debra G. Duarte2David Goethel3James Ford4James Ruhle5Rodman Sykes6Troy Sawyer7
- 1Northeast Fisheries Science Center, National Marine Fisheries Service, Narragansett, RI, United States
- 2Northeast Fisheries Science Center, National Marine Fisheries Service, Woods Hole, MA, United States
- 3Fishing Vessel Ellen Diane, Hampton, NH, United States
- 4Fishing Vessel Lisa Ann III, Newburyport, MA, United States
- 5Fishing Vessel Darana R, Wanchese NC, United States
- 6Fishing Vessel Virginia Marise, Narragansett, RI, United States
- 7Fishing Vessel Debbie Sue, Narragansett, RI, United States
Logbook data from commercial fisheries are a vital component in the machinery of management, including tracking the volume of catches and allocating catch spatially. At the same time, logbooks can provide a unique window into the ecological and sociological conditions in marine fisheries, where fishermen interact with marine species and environments frequently and broadly. Traditional logbooks, however, often are not sufficiently standardized (when personal logs), or lack the detail (when regulatory documents) required to adequately understand fisheries ecosystems. The Study Fleet program, operated by the Northeast Fisheries Science Center’s Cooperative Research Branch, was developed to address these shortfalls by engaging members of the fishing industry in collecting high-resolution catch, effort, and environmental data using electronic logbooks. Since its inception, the Study Fleet has expanded from a small project focused on collecting detailed catch information from the New England multispecies groundfish fishery to a program with a wider scope encompassing a variety of fisheries, gears, and environmental parameters from North Carolina to Maine U.S. Over the years, a number of lessons have been learned about recruiting and supporting industry partners, managing the data, evolving technical specifications, and the challenges associated with analyzing and applying self-reported fisheries data. Here we describe the current state of the program and provide summaries of the Study Fleet program operations and outcomes from 2007-2020, with an eye towards successes, challenges, and applicability of the approach in other regions. We suggest other reference fleet programs, as well as other developing fishery dependent data collections (e.g., electronic monitoring programs), develop detailed roadmaps for each data collection to keep participants engaged as collaborators, target specific fisheries to keep resources from being stretched too thin, and partner with data users early. Additionally, we suggest programs invest in the long-term participation of individual fishermen, carefully weigh the pros and cons of involvement in regulatory reporting, and plan data products and applications well in advance to ensure that the sampling scheme and granularity of the data meet the needs of stock assessment, ecosystem, and oceanographic scientists.
Introduction
Around the world, fishermen use logbooks to record information about where, when, and how they fish and what they catch. Logbooks can take many forms, from paper notebooks in the wheelhouse to advanced electronic systems. In many fisheries, fishermen are required to submit trip summaries of logbooks to fishery managers, detailing what species and quantities were caught. These data are used to track catch quotas and estimate fishery removals, among other applications. Logbooks have been identified as a valuable source of contemporary and historical information (Fox and Starr, 1996; Pederson and Hall-Arber, 1999; Johnson, 2007; Hoare et al., 2011; Kraan et al., 2013; Mion et al., 2015; DeCelles et al., 2017; Steins et al., 2020). For example, in the southeast United States (U.S.) logbooks have been used to better understand changing size at maturity in red snapper (Lutjanus campechanus) and other southeastern species (Bonney et al., 2021). On the West Coast of the U.S., recent work paired long-term logbook data with sophisticated Bayesian analyses to explore potential drivers of change in community composition (Essington et al., 2021). In many cases, however, the utility of logbook data for fisheries science is limited by the coarse spatial and temporal resolution of the typical trip summary reports (summed effort and catch) by reporting grids.
Fishery dependent data (logbooks, seafood dealers’ records, and data from regional observer programs) provide a unique window into marine systems. Collections of fishermen’s information span regions and seasons not often sampled by scientific surveys, are a type of information inherently trusted by stakeholders, and provide observations of biological information at a scale that dwarfs regional scientific surveys (Cadrin et al., 2020a; Steins et al., 2020). Because much of this information is required to guide management, and does not require additional costs, leveraging these data sets for science can be an economical form of data collection (Johnson and van Densen, 2007; Pennington and Helle, 2011; Bell et al., 2017). Conversely, because the samples lack a statistical design, data track the behavior of fishermen as they seek to maximize their profits and adhere to management requirements, making trends more challenging to interpret (Maunder and Punt, 2004). Despite this, there is a growing interest in the applications of fisheries dependent data, especially data that is self-reported by fishermen or collected with advanced technology such as electronic monitoring (van Helmond et al., 2020; Bell et al., 2021; ICES, 2021). This is in part because of expanding monitoring requirements and the rapid advancement of the technology used to record catches. Finally, the recent development of sophisticated statistical methods that avoid the common pitfalls of earlier methods (Forrestal et al., 2019; Clegg et al., 2021), facilitates the potential application of the data sets.
Logbooks are often recorded by individual fishermen or small businesses but can also be a component of reference fleet programs (Rountree et al., 2004; Nedreaas et al., 2006; Roman et al., 2011; Mercer et al., 2018; Clegg et al., 2021). These programs provide more structured and often higher resolution data collection and more robust quality assurance and quality control (QA/QC), with the intention of using the logbook data as a scientific product (Bjørkan, 2011; Pennington and Helle, 2011; Bastille, 2019). Reference fleets can also provide the methodological structure needed for fishermen to effectively contribute scientific data, such as oceanographic conditions (Manning and Pelletier, 2009; Gawarkiewicz et al., 2019; Gawarkiewicz and Mercer, 2019; Van Vranken et al., 2020).
In addition to the direct scientific value of data collected by stakeholders, there is growing appreciation for the broader value of engaging stakeholders and industry members in research endeavors (Neis et al., 1999; Johnson and van Densen, 2007, Feeney et al., 2010, Stephenson et al., 2016; Thompson et al., 2019). There are myriad indirect benefits of this type of science-industry research collaboration (reviewed in Steins et al., 2020), including improved communication of results, the sharing of insights only available to those actively involved in the fishery, increased capacity of stakeholders to actively participate in fisheries science, and perhaps most importantly trust in the scientific process. Despite the clear direct and indirect value of these programs, collaborations of this nature are difficult to maintain, and can fall short of their initial goals. Regardless, it is important to report the progress and findings of these programs, highlighting the lessons learned from specific collaborative efforts.
One of the largest and longest-running scientific logbook programs in the U.S. is the Study Fleet (Palmer et al., 2007; Bell et al., 2017), a program developed and operated by the Northeast Fisheries Science Center’s (NEFSC) Cooperative Research Branch (hereafter CRB) that engages fishermen in collecting high-resolution catch, effort, and environmental data. This program traces its origins to recommendations by members of the fishing community during regional strategic planning workshops in 1999 and 2000 (Hartley and Robertson, 2006). The primary objective of the Study Fleet at its time of initiation was to recruit a fleet of commercial New England groundfish vessels to provide high-resolution (temporal and spatial) self-reported data during routine fishing activities. Additionally, the region’s fishing community articulated a need for enhanced logbook reporting to complement and leverage haul-based data collected by independent fishery observers (Palmer et al., 2016; Bell et al., 2017). The ultimate goal of collecting this high-resolution data was and still is to improve the accuracy and precision of stock and ecosystem assessments to inform fisheries management. The Study Fleet also seeks to enhance opportunities to incorporate fishermen’s local ecological knowledge into assessments through collaboration with NEFSC scientists, thereby enhancing trust and support for scientific management advice (Figure 1).
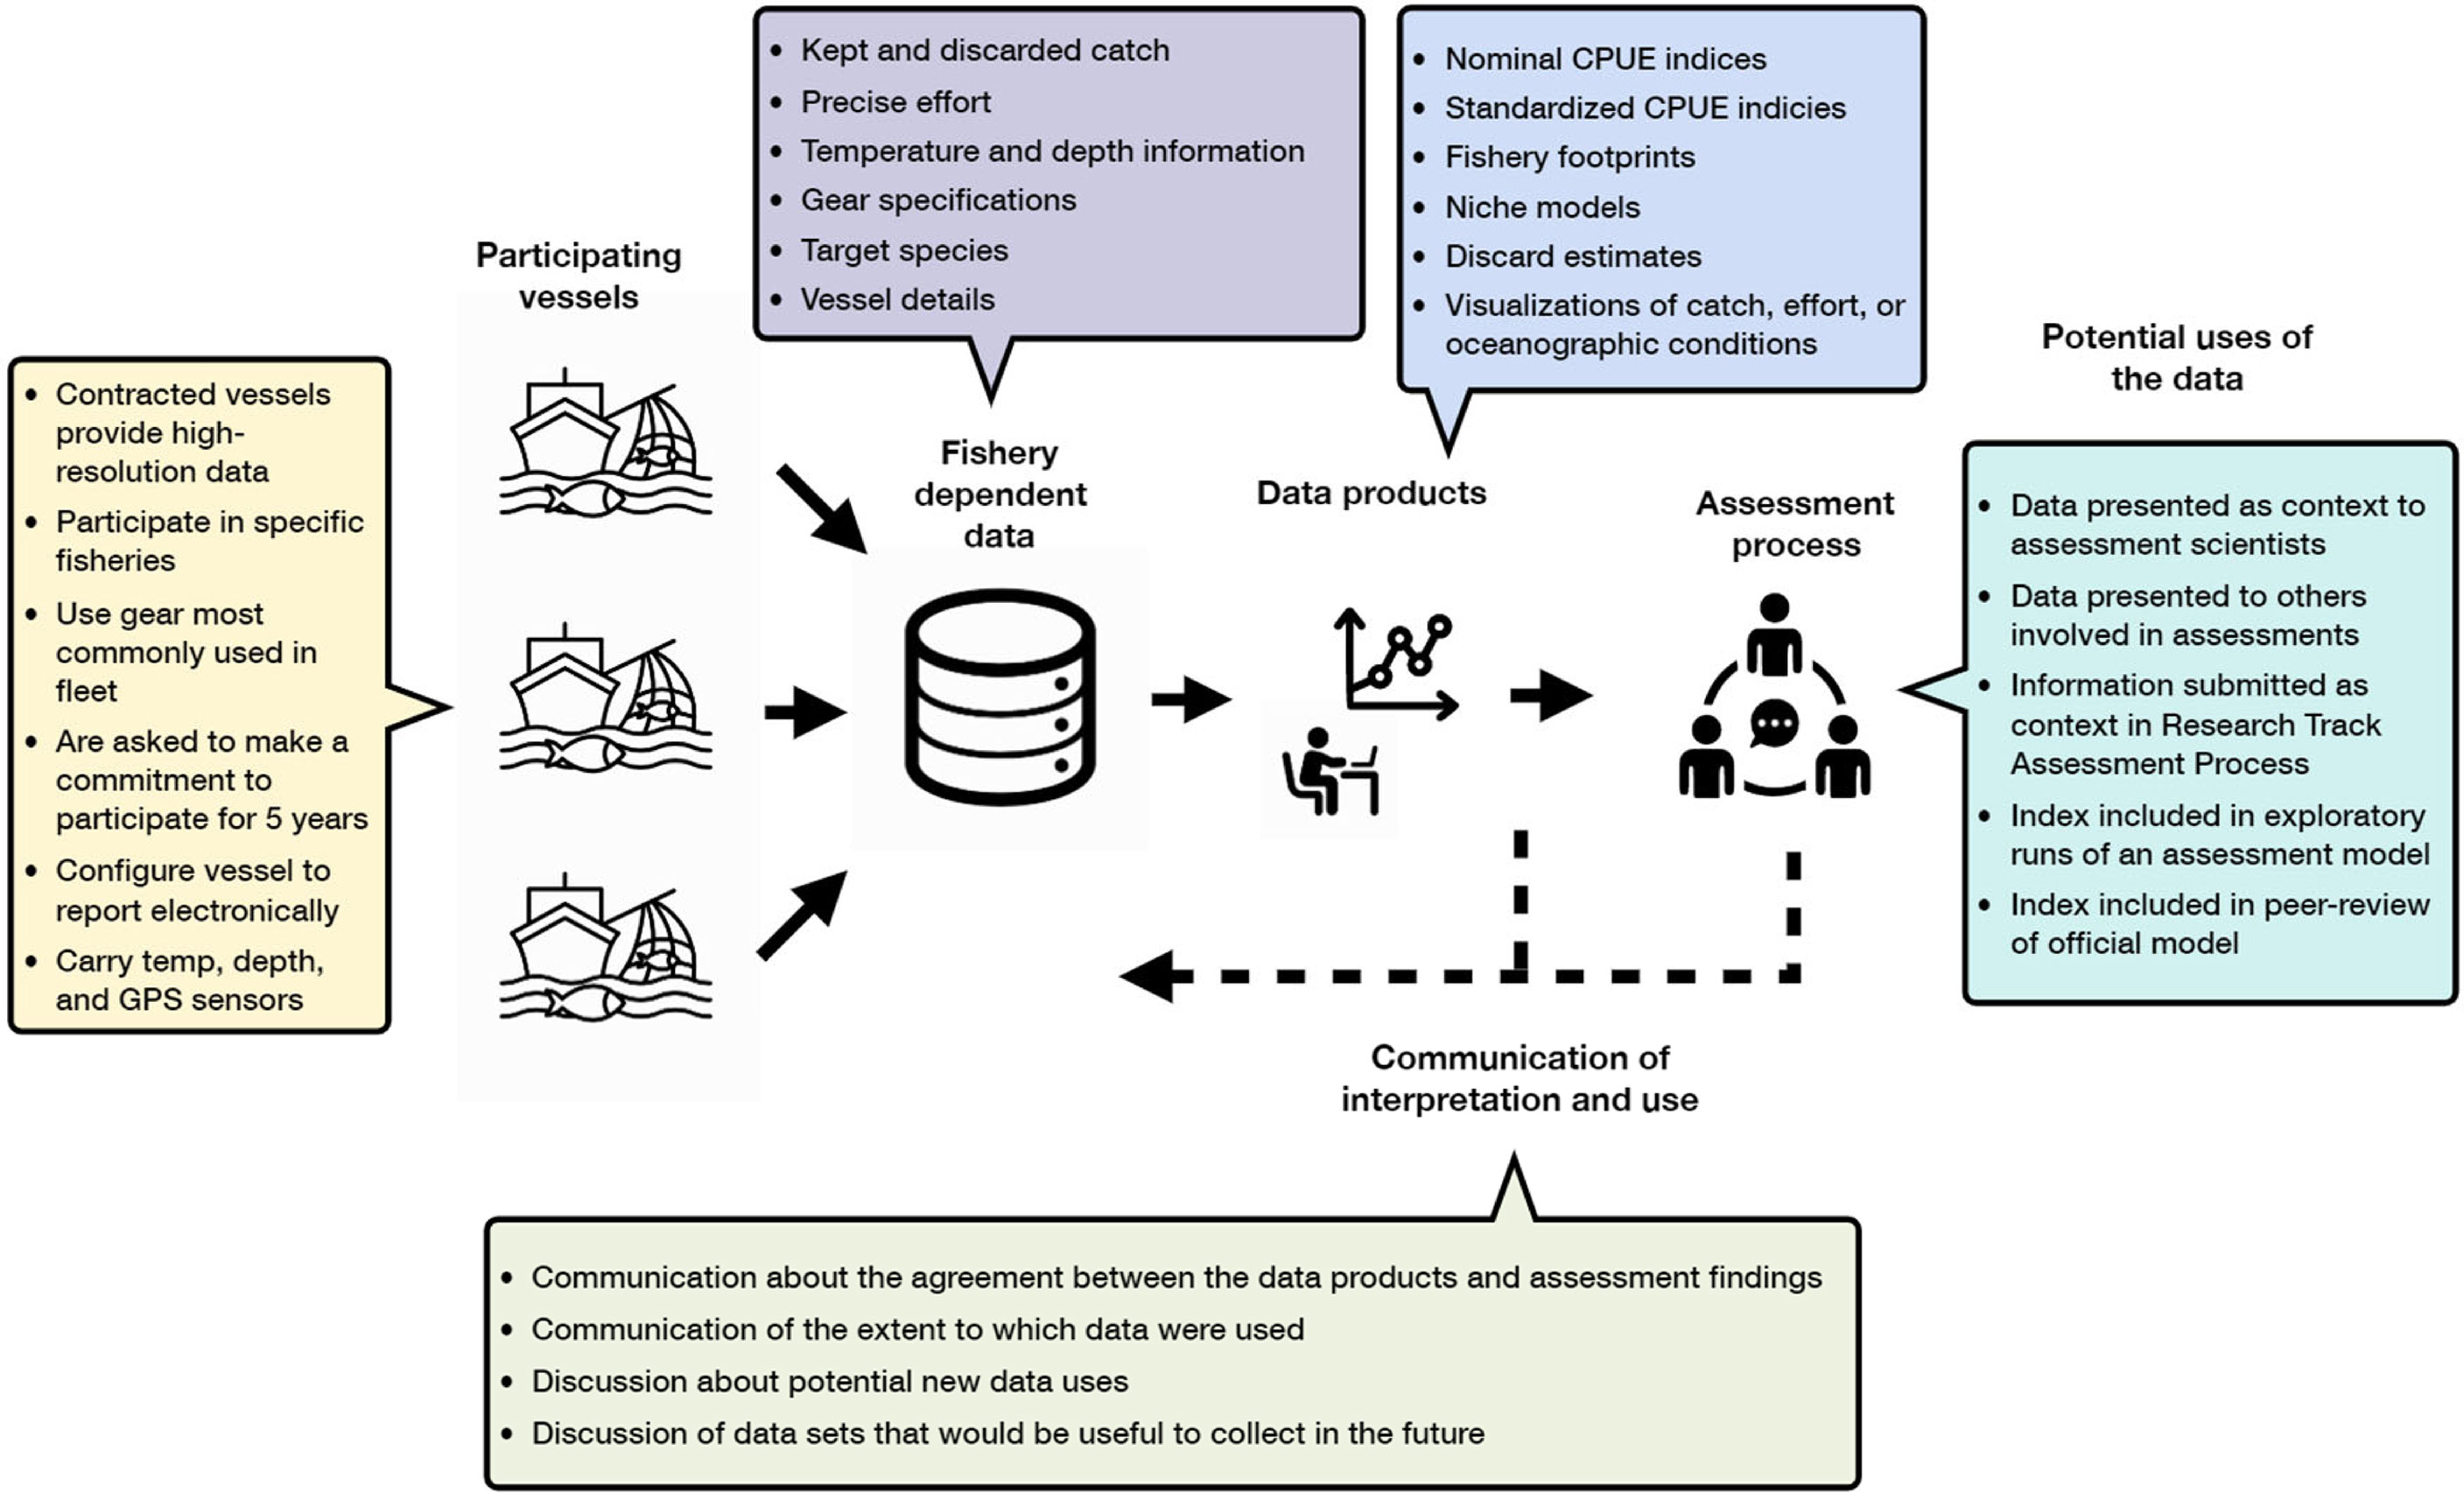
Figure 1 A conceptual diagram of the data flow and purpose of the Study Fleet program. Starting with the reporting vessels and fishermen (yellow) information flows to the Science Center (purple and blue) where it is curated and developed into analytical products for science and management. These products are presented as part of the assessment process (darker green) and then communicated back to participating captains (light green). This cycle is simplified in many ways as iterative loops are likely to improve the products and assessments.
A secondary objective of the Study Fleet has been to evaluate hardware and software options for electronic logbook (hereafter ELB) reporting technology that would improve the accuracy and timeliness of mandatory Vessel Trip Reports (VTR). The ELB allows fishermen to automate data entry to make it easier to collect data during their already labor-intensive fishing trips. Specifically, the ELB enables fishermen to easily collect data on gear characteristics, fishing location, time, and catch by species and disposition (kept or discarded) for each fishing effort. This increases the spatial and temporal resolution of self-reported fishery-dependent data dramatically, from estimates of fishing effort and catch summed across multiple hauls and days within large statistical areas (10s of km2) to haul records with precise time and location parameters collected electronically.
Here we outline the current Study Fleet program operations, summarize the scope of data collected to date, and highlight high-level successes and challenges. We detail the current state of the data set generated by this program with an eye towards making it available for regional stock assessments or qualitative comparisons to other regions. Building on these data summaries we develop specific recommendations for other study or reference fleet programs.
Program Description
Vessels are selected to participate in the Study Fleet through a structured competitive bid process. Selection considers multiple factors including: vessel size, fishing location, species targeted, frequency of fishing, and for vessels that have participated previously, the quality of prior data submissions. Contracts run for a period of five years, with approximately five to ten vessel slots being selected at a time, and a number of participants continuing with the program through multiple cycles. Participating captains are provided with a small stipend, as the program requires substantial time and attention to record the additional data. The monetary compensation, however, is one of many motivators for captains to participate (e.g. desire to contribute to fisheries science). Study Fleet target species have shifted over time (Appendix A), with the composition of the participating vessels reflecting priorities related to stock assessments, industry interests, and management actions. Additionally, the total number of contracts has been limited by the program budget, which has varied over the course of the program. Participants in the program have provided written consent to have data utilized for applicable scientific purposes. Data collection dovetails with regional regulatory reporting requirements and the use of these data complies with the ethical standards of the National Marine Fisheries Service (NMFS).
Data collection by Study Fleet vessels at sea mirror information collected by the northeast region’s observer program (NEFSC, 2019). Specifically, trip information (e.g., information about the date a trip sailed), haul information (e.g., the latitude and longitude where a given fishing effort occurred), as well as haul-specific (haul-level) catch and discard information are reported. A detailed track of GPS fishing locations can be recorded by the logbook software and differentiates the Study Fleet haul duration and location information from that collected by the observer program. Catch and discard weights can be generated in a variety of ways. For kept catch, basket or tote counts are often extrapolated using a known conversion factor. Captains typically use visual estimates and extrapolations for discarded catch, as more intensive methods (e.g., basket counts) frequently used by observers and field staff can be considered possession when observers are not onboard and could potentially lead to regulatory fines. Kept catch estimates by captains and observers at the end of the trip can be verified against dealer weight receipts, and discarded catch estimates can be compared to estimates by observers on co-sampled trips.
In addition to collecting detailed catch and effort information, Study Fleet vessels also record bottom water temperatures using temperature sensors attached to their fishing gear. Bottom water temperatures are collected during every gear haul and are matched with the catch and effort records. Probes from different manufacturers have been deployed over the history of the program including instruments from Aquatec (https://www.aquatecgroup.com), Star-Oddi (https://www.star-oddi.com), and Lowell Instruments (https://lowellinstruments.com). Advances in the probes and integration with the laptop eventually allowed Captains to see recorded temperatures during a tow within minutes of hauling that net.
Data are submitted at the end of the trip as an electronic file which is loaded into databases at the NEFSC. The high-resolution haul data are then summarized and formatted to the lower-resolution required by management and submitted to the regional management offices. Ultimately, kept catch that is sold to dealers is weighed and reported, and this components of the catch can be verified, as discrepancies between dealer and vessel records can prompt an inquiry into the nature of the difference. Information on discards are not regularly compared, but studies which have paired the discard estimates from captains to observer records have found reasonable similarities between their magnitudes (Bell et al., 2017). Specifically, the majority (>65%) of comparisons of the trend and scale of discard estimates were similar between Study Fleet and the observer program. Additionally, significant differences that were discovered where related to the large number of samples rather than substantial effects.
The sampling scheme inherent to the Study Fleet is somewhat distinct from other regional fishery dependent data sets (i.e., regulatory trip reporting and regional observer programs). Specifically, the vessels participating in the program report continuously, documenting all of their fishing activity with minor exceptions (e.g., when participating in other research). This produces a time series across seasons and years of trip, effort, and catch information that is similar to regulatory vessel trips reports where all landings must be reported by permitted vessels, but at a higher spatial resolution. In practice this means that captains record the catch, effort (e.g., active fishing time), and location of each fishing event or haul rather than aggregating the catch for an entire trip, providing a single location at the center of the region sampled, and a mean estimate of the active fishing time across hauls. While the resolution of sampling mirrors the observer program, the sampling scheme is distinct. The observer program attempts to select a random stratified sample by fishery-area and month (Palmer et al., 2016), and the Study Fleet data represents more of a longitudinal sample of the participating vessels. Because of this sampling scheme, the Study Fleet may not be as unbiased a representation of a given fishery (e.g., geographically or temporally), and for applications of the data, methods such as random subsampling of the Study Fleet time series (Clegg et al., 2021), provide a means to ensure the representativeness of the data set. Further, combining and comparing the time series of regional fishery dependent data program programs (observer, Study Fleet, and regulatory VTR reporting) is likely the best way to evaluate data quality and representativeness.
Program Data Summaries
Since 2007, the number of hauls and trips reported by the Study Fleet program have increased dramatically (Table 1). In recent years, Study Fleet structure and funding has stabilized, and as a result the Study Fleet has collected high-resolution catch and effort data from around 3,500 trips per year (Figure 2). Limited funding and eligible and interested fishing vessels are the major constraints on the program’s size and the volume of data generated. Specifically, the programmatic need for high-resolution accurate reporting by captains has limited the pool of those interested in participating. As the number of participating vessels increased, the number of records reported using the ELB system at a coarser resolution (one or a couple records per trip) increased. This pattern reflected an interest from captains in the use of electronic reporting, but less interest in reporting at a level higher than that required by managers. In the past five years the number of trips with trip records has greatly increased to approximately 4,000 per year (Figure 2). This trip-level data, however, is less useful for understanding fishery and ecosystem dynamics, as the spatial and temporal resolution is analytically limiting.

Table 1 Metrics of study fleet participation.
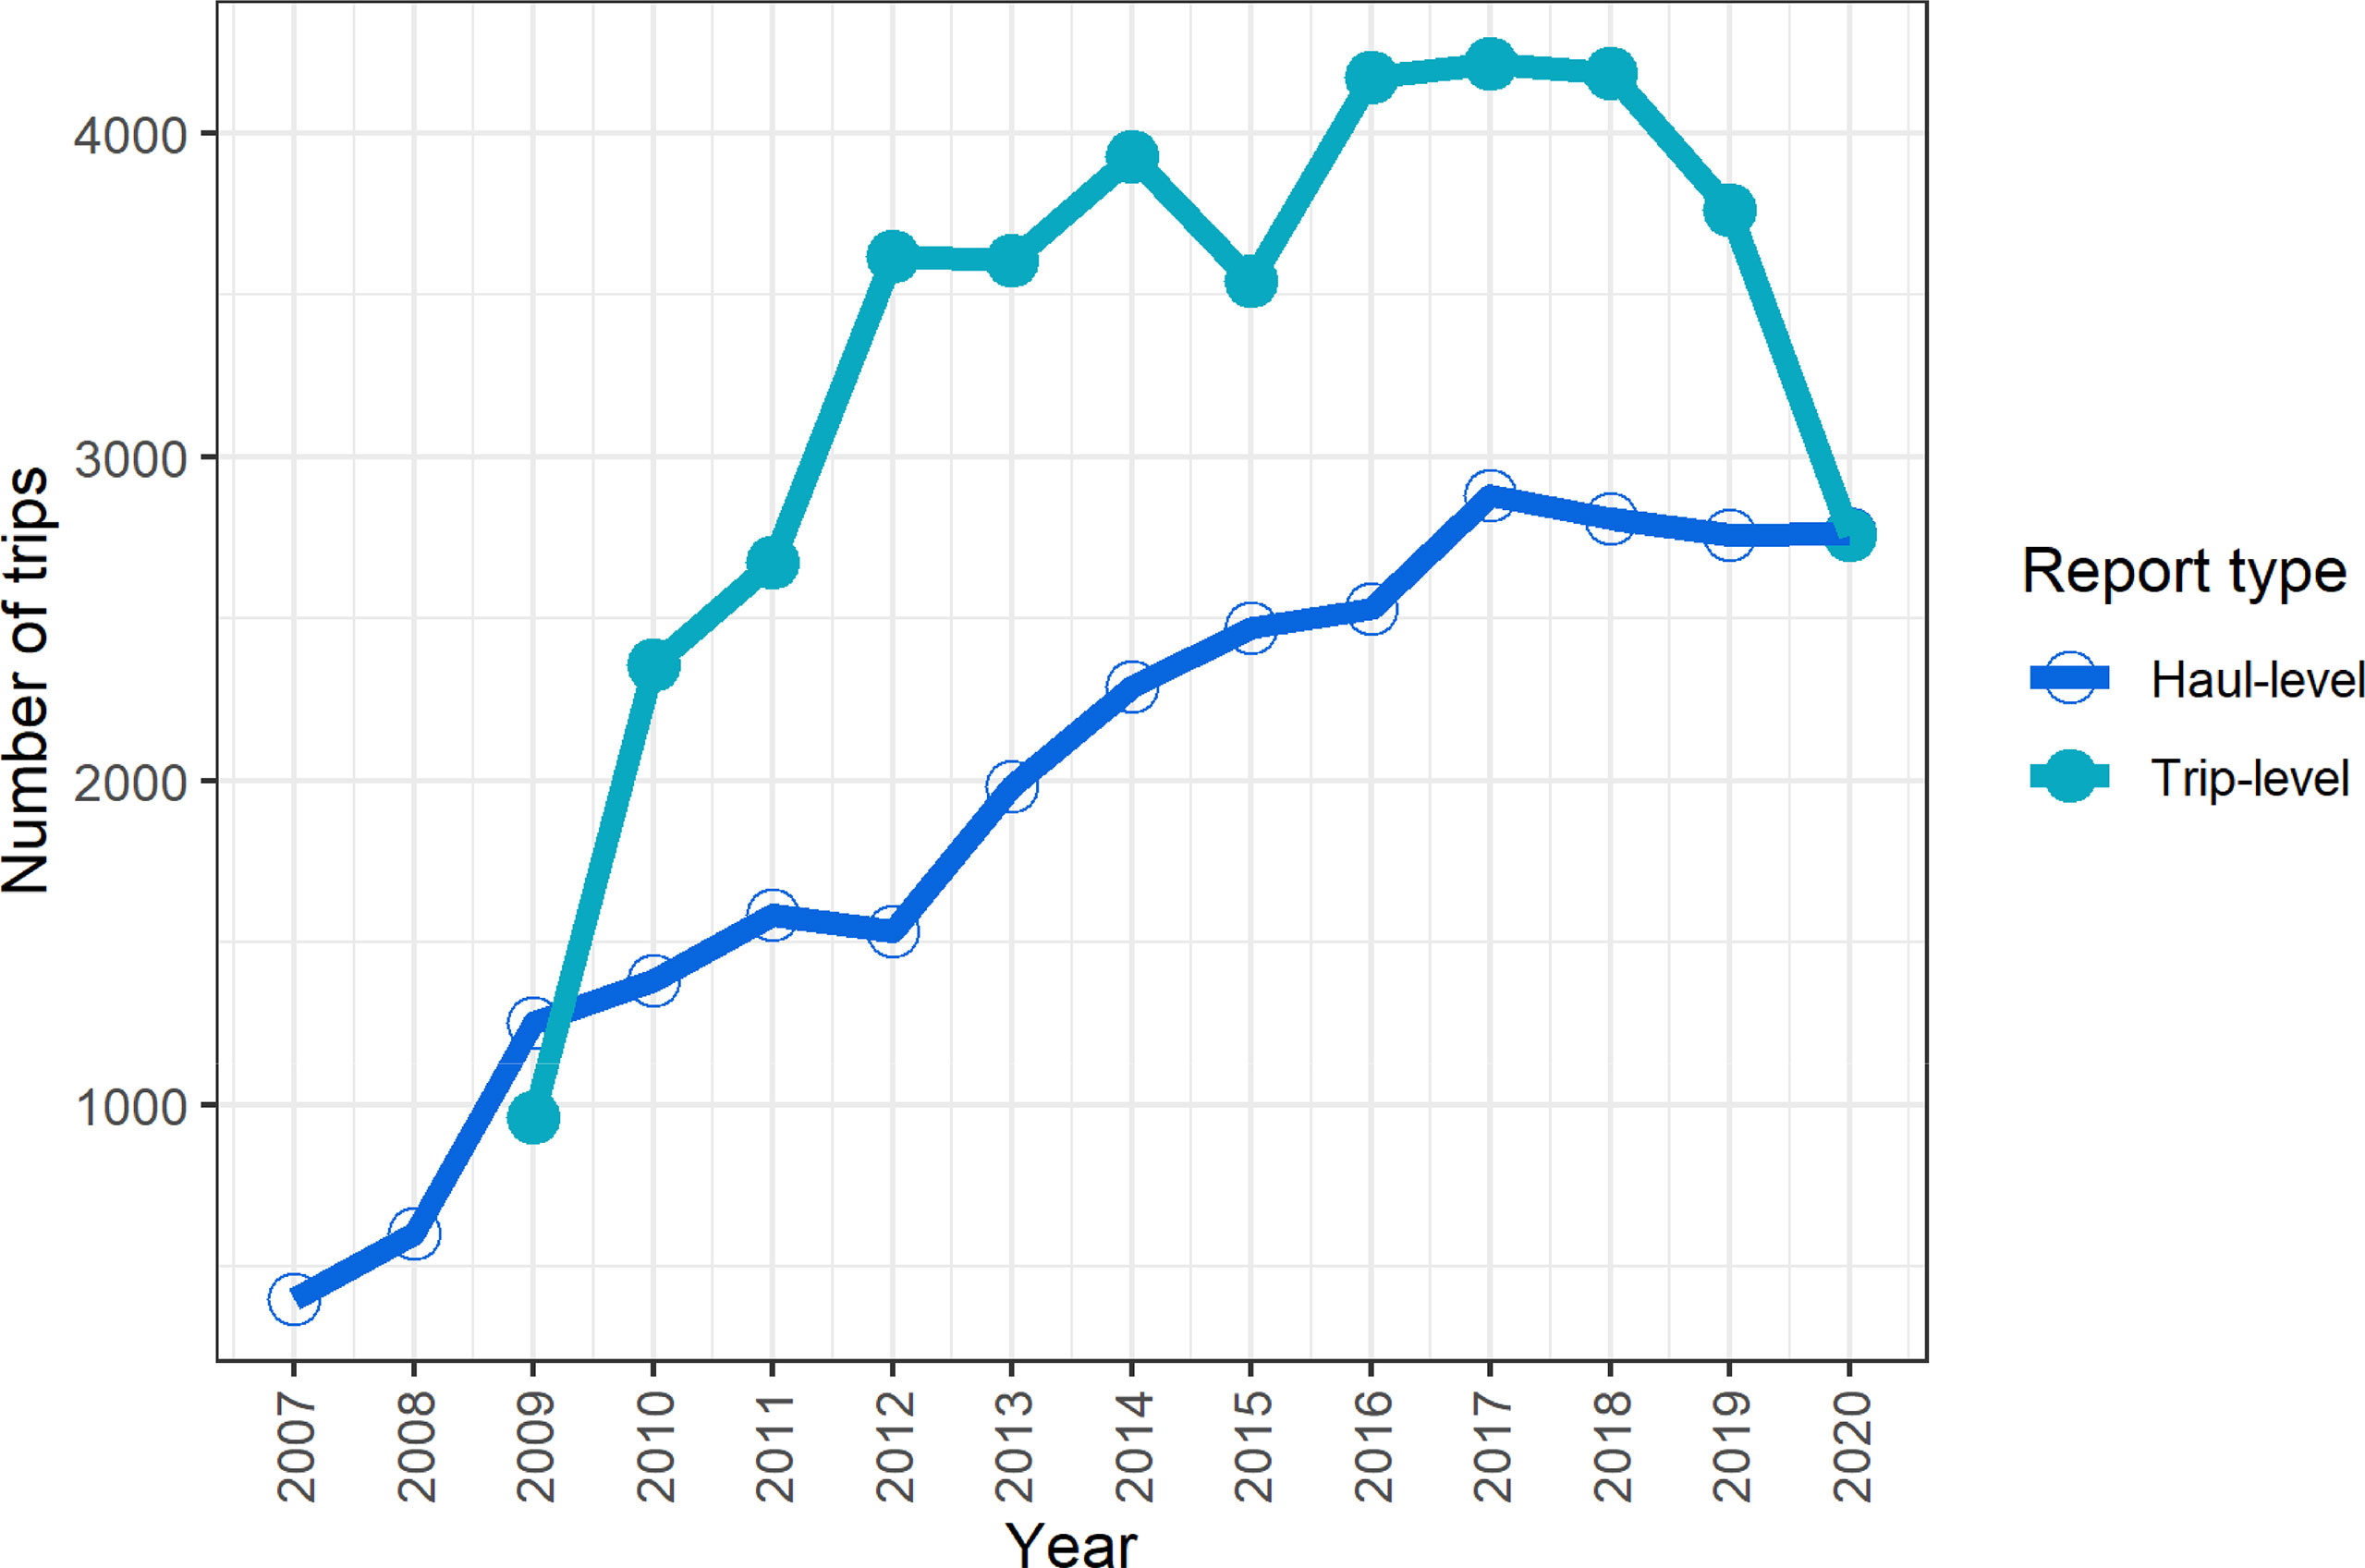
Figure 2 The number of trips that were collected by the ELB system. Haul-by-haul reporting (high-resolution) trips are shown in dark blue (open circles), and trip reporting (lower resolution) in light blue (closed circles).
The number of fishing vessels participating in the Study Fleet has increased over time, however, only a limited number of vessels have a continuous record of data collection (Table 1 and Appendix B). The general trend in Study Fleet participation is of rapid increase, however the voluntary records do not begin until 2011. These vessels, trips, and hauls are currently spread across a range of fisheries in the northeast (Figure 3) with the largest number of hauls targeting groundfish, summer flounder (Paralichthys dentatus), scup (Stenotomus chrysops), longfin squid (Doryteuthis pealii), shortfin squid (Illex illecebrosus), and sea scallops (Placopecten magellanicus). The vast majority of these data come from vessels fishing mobile gear, with ‘fish’ otter trawl gear being the most common (Table 2). Generally, otter trawl gear has been the dominant category of gear used by vessels in the program. Other gears have become more common in recent years suggesting that the ELB is capable of supporting these fleets.
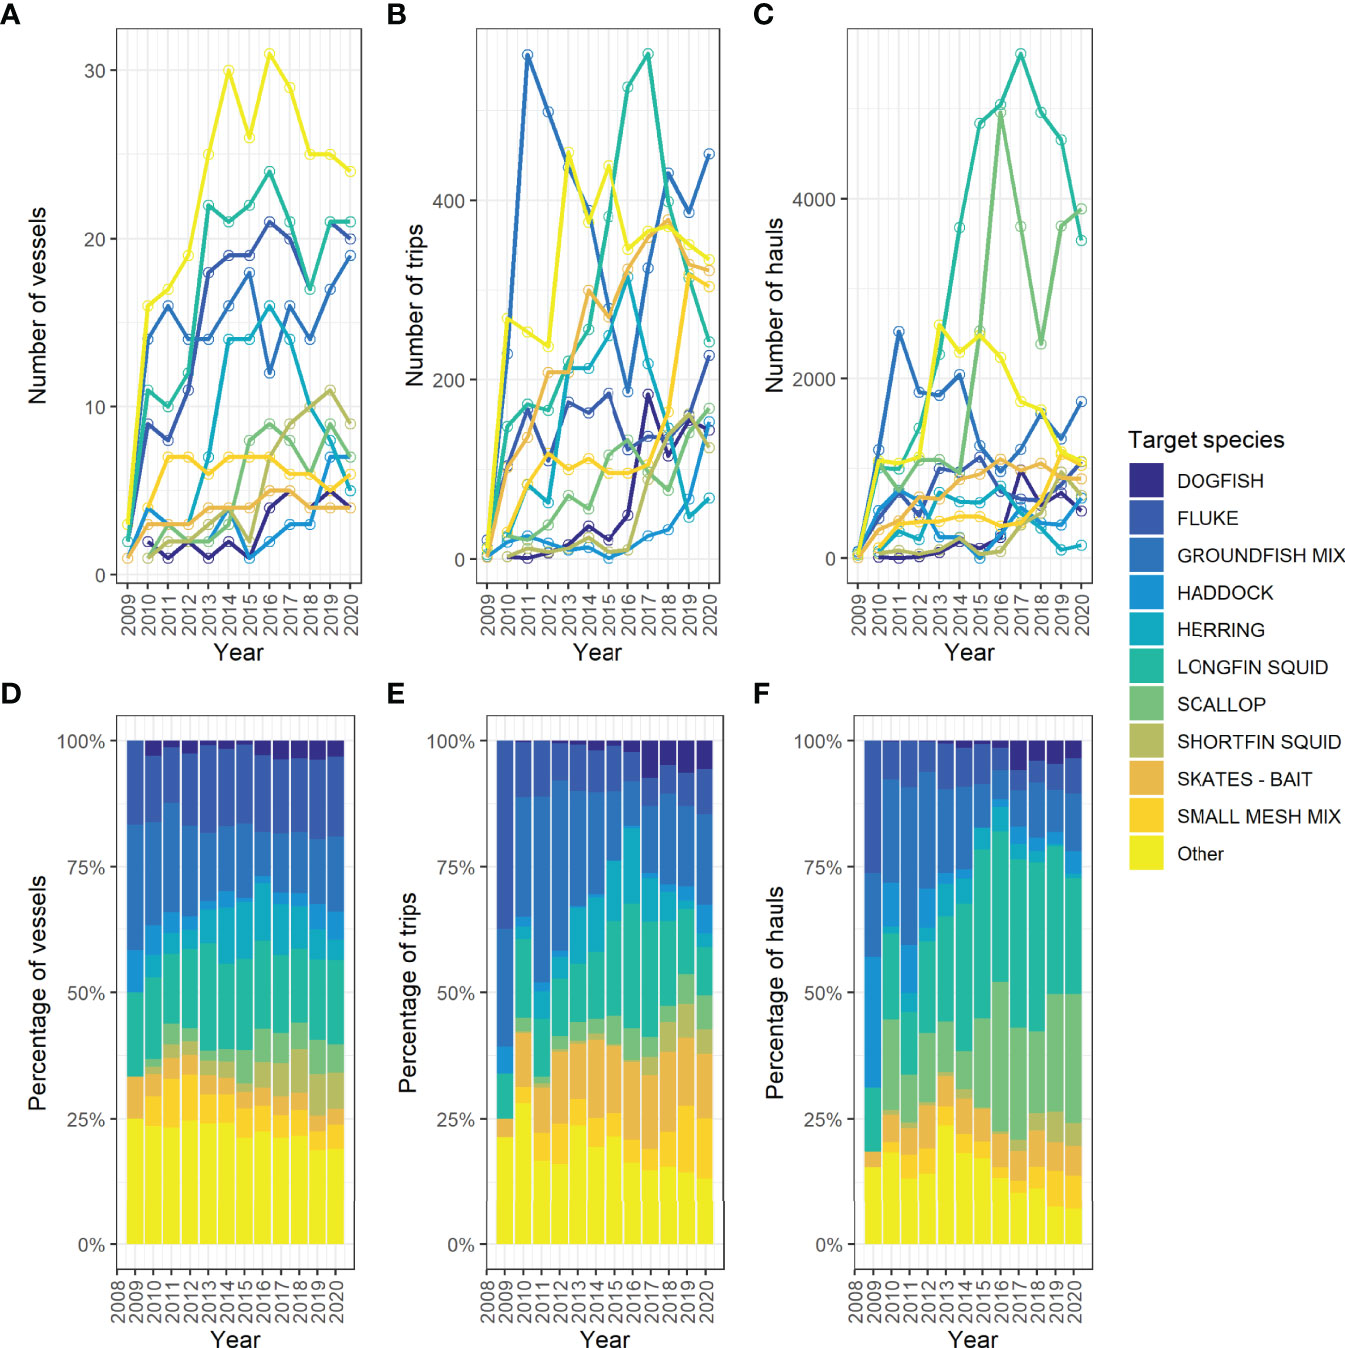
Figure 3 The breakdown of Study Fleet number of vessels, trips, and hauls by target species through time. The trends through time for each level of the data are shown in panels (A–C). The annual proportions of vessels, trips, and hauls are shown in panels (D–F). The category ‘Other’ includes twenty additional target species designations each of which comprised less than three percent of the total trips records.
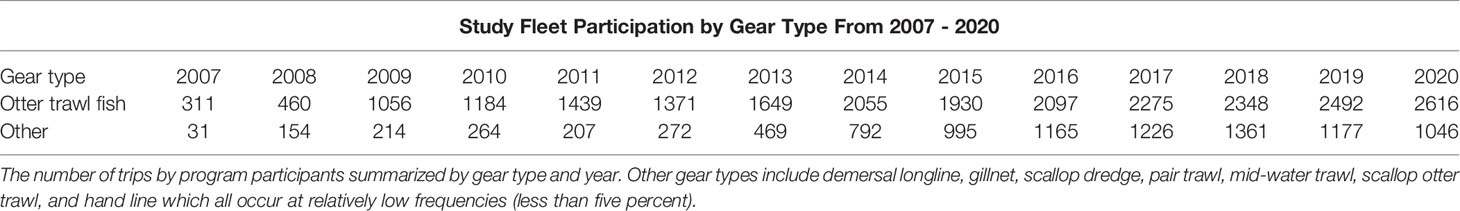
Table 2 Study fleet participation by gear type.
Comparing the number of Study Fleet records to the other major fishery dependent sampling programs from the region (Northeast Fisheries Observer Program and At-Sea-Monitoring Program), we can see that the number of trips and hauls is similar in size to the number recorded from trawl gear vessels (Figure 4). The increased coverage in the observer data set reflects the shift to catch share management and the associated enhanced reporting requirements around 2010. As is evident in the time series (Figure 4), the Study Fleet effectively provided fishery dependent data during the COVID-19 pandemic, while observers were restricted from deploying. Thus, when answering research questions using fishery dependent data, combining these two distinct data sets will provide the most information.
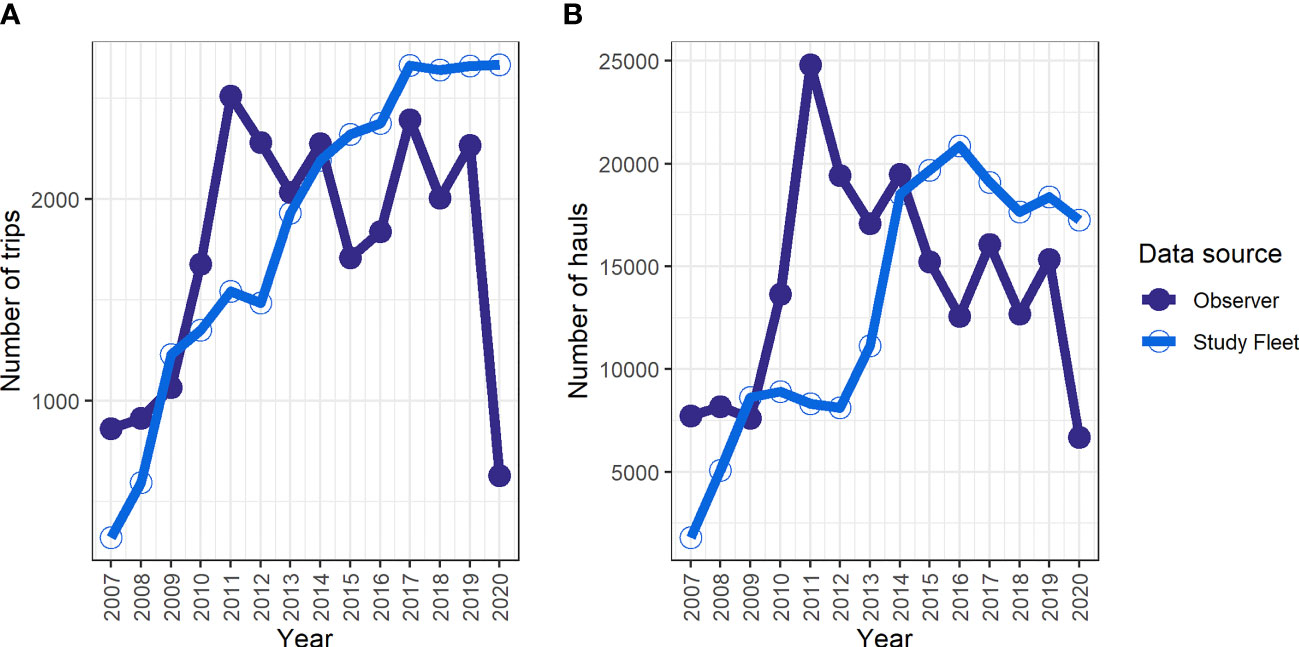
Figure 4 Trends in annual trips (A) and hauls (B) for the Study Fleet program are shown in blue (open circles). For comparison, the annual number of trips and hauls from trawl vessels is shown in purple (closed circles) from another large monitoring program in the region, the fishery observer programs. The goals and sampling schemes of these programs are quite different, but together they represent a large amount of fishery dependent data from the region. Of note is the dip in total trips in the observer program in 2020, a result of a pause in operations for the COVID-19 pandemic.
The spatial coverage for Study Fleet and observer trawl haul data are shown in Figure 5. The two data sets overlap primarily in the Southern New England region. The Study Fleet data set has more representation in the Mid-Atlantic region while the observer data set has a center of mass in the Gulf of Maine and Georges Bank. Again, subtle spatial differences in sampling between these program suggest that combining information may be beneficial for specific projects and questions. Additionally, Figure 5 shows the potential differences in spatial patterns that might be produced if different metrics of fishing activity are used (e.g., number of trips, number of hauls, or the pounds of catch). These generally suggest similar areas are represented regardless of the level at which the data is aggregated.
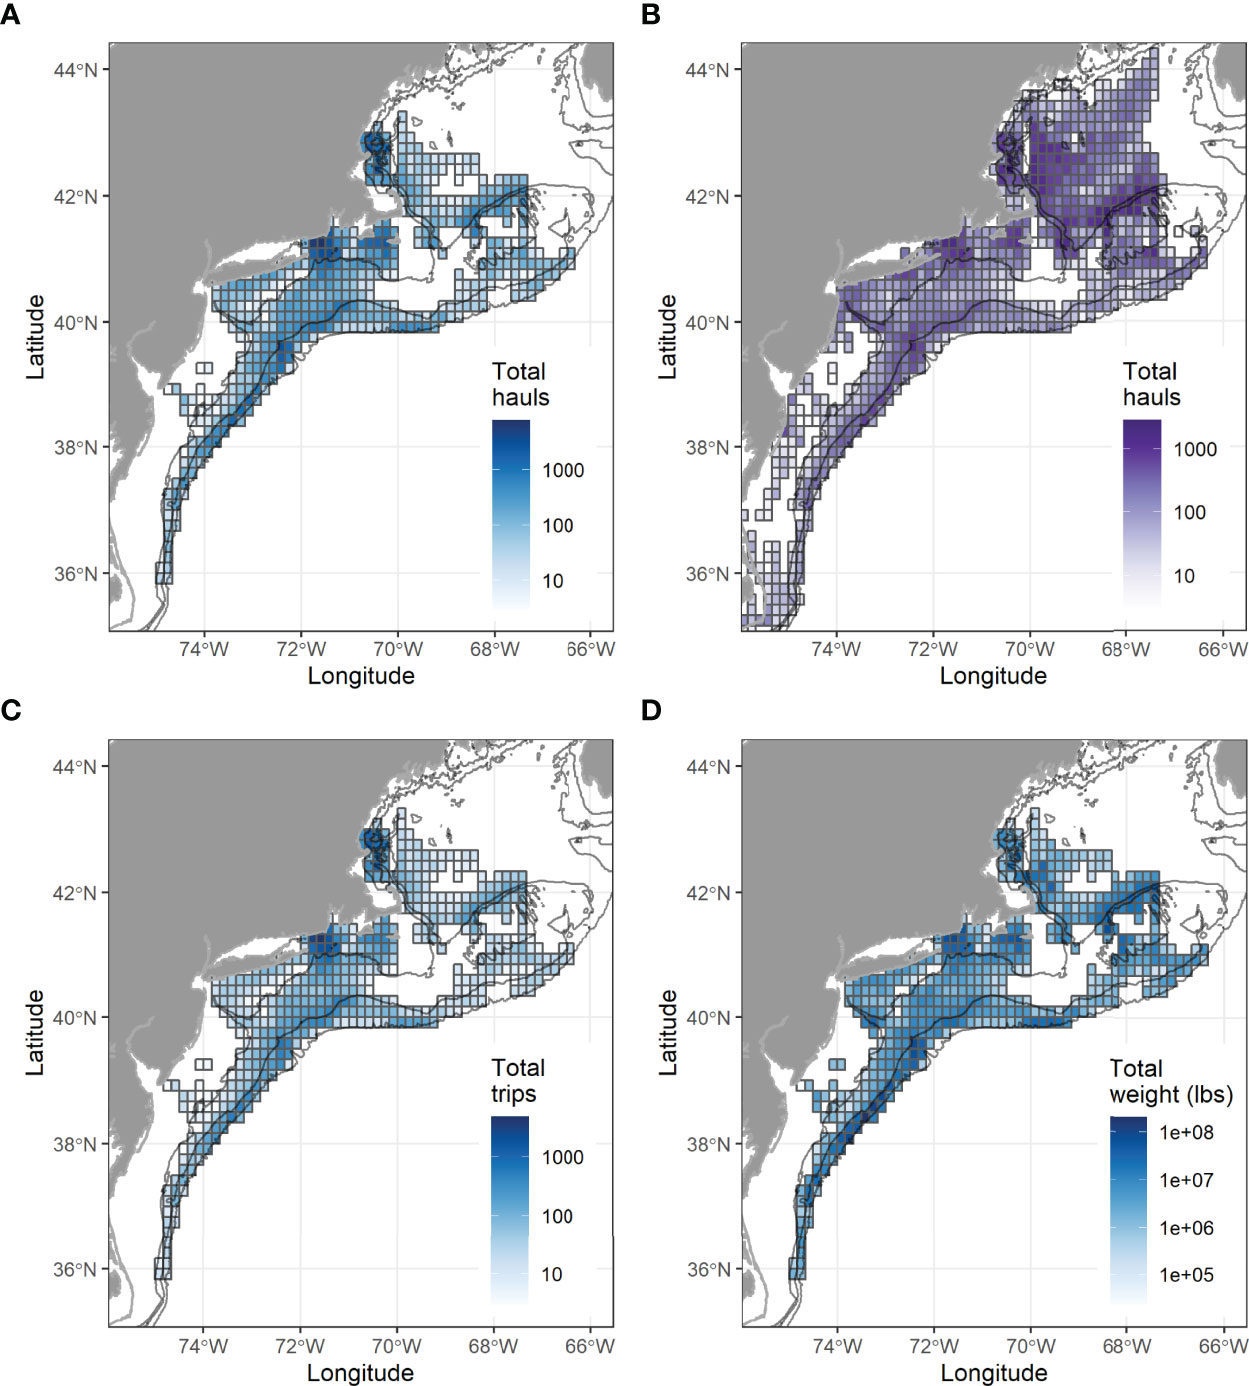
Figure 5 Maps showing the spatial distribution of high-resolution fishery dependent trawl records for 2007 - 2020 gridded into 5-minute squares. In panel (A), the total number of Study Fleet hauls are shown. For comparison the distribution of observer records for otter trawl gear are shown in panels (B, C) shows the total number of trips by Study Fleet vessels. Panel (D) shows the total catch by Study Fleet vessels (lbs). In all panels cells with fewer than three unique permits (records from fewer than three vessels) have been omitted. In panels (A–D) 258 (55%) cells were omitted and in panel (B) 182 were omitted (19%).
The landings reported by the Study Fleet program as a proportion of total landings have increased for a number of regionally important stocks (Figure 6). This is especially true for the two squid species (longfin and shortfin) which have had a large and increasing number of participating vessels. However, as in the case of Atlantic cod (Gadus morhua) this is partially driven by a decreasing trend in total catch. Metrics of coverage which are a key element used to assess the representativeness of the program show similar patterns in the number of vessels included and trips from which data are reported (Appendix C). These levels of participation are crucial to providing assurance that the effort and catch information is representative of the larger fishery that is being sampled (see Primary Lessons Learned).
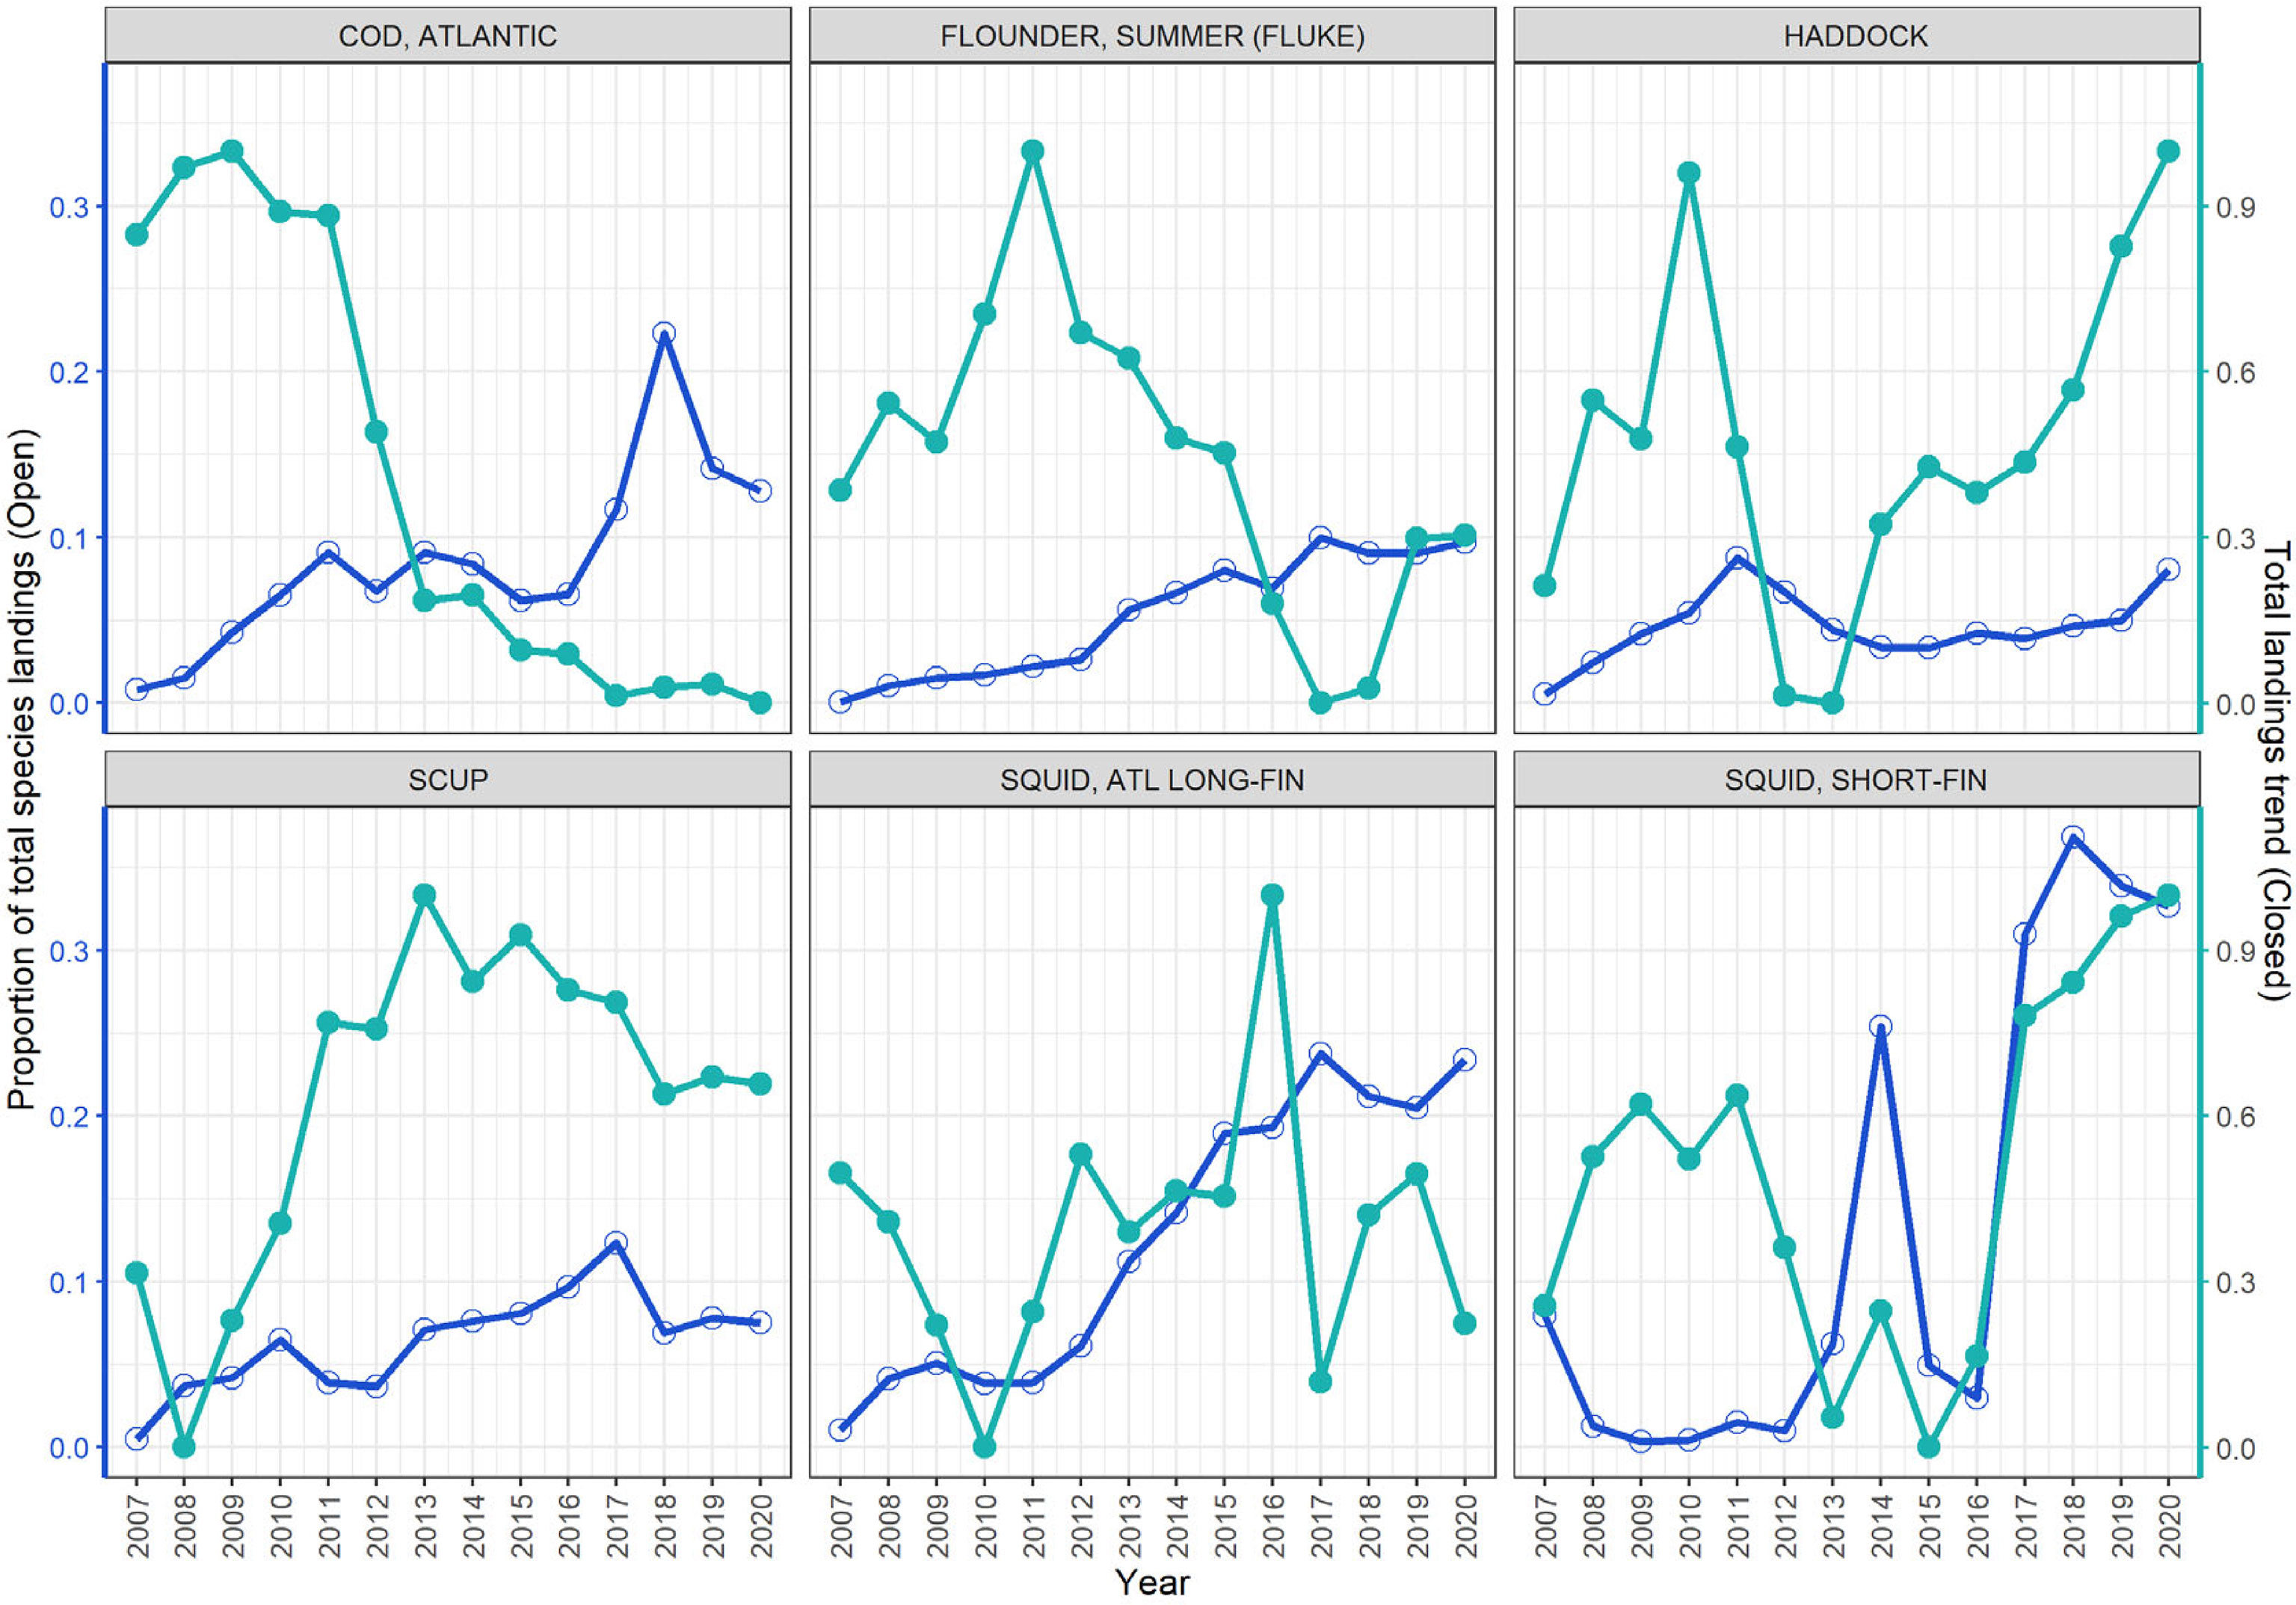
Figure 6 The proportion of six species’ regional commercial landings reported through Study Fleet (dark blue open circles), relative to the trend in total commercial landings of the species (light blue closed circles).
The oceanographic data set associated with the catch and effort data reported by Study Fleet participants (Figure 7) follows a similar pattern to those we see in the programs trip and haul summaries (i.e., increasing rapidly in the early 2010s). These oceanographic records are collected coincidentally with catch and effort data from a number of fisheries, and the composition of target species associated with these records has fluctuated through time. Some Study Fleet vessels also participate in other industry-based oceanographic monitoring programs, such as the environmental monitors on lobster traps and large trawlers program (eMOLT, Manning and Pelletier, 2009). Coordinating among research programs is essential to effective processing and application of data.
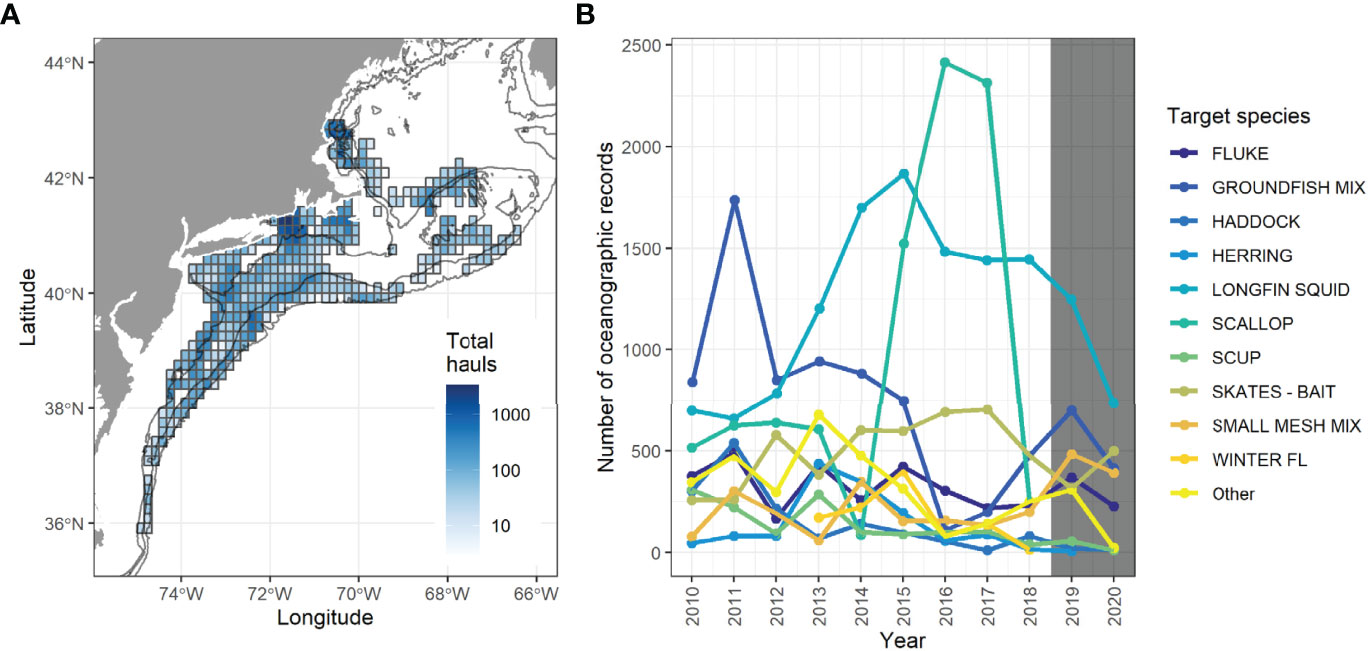
Figure 7 The trend in oceanographic records across space and through time. Panel (A) shows the density of sampling across space for all years sampled (2010-2019). Cells with fewer than three unique permits (records from fewer than three vessels) have been omitted. Panel (B) shows the number of hauls with registered oceanographic data from 2010 to 2020. Data from 2019 and 2020 (shaded gray) are still being processed and sums represent incomplete totals. In panel (A) 223 (40%) cells were omitted.
Examples of Data Applications
Indices of Abundance
Data collected by the Study Fleet program has been used to improve our understanding self-reported catch and effort information (e.g., Palmer et al., 2009). More recently these have been turned into catch per unit effort (CPUE) indices for summer flounder (Gervelis, 2018), scup (NEFSC, 2015), shortfin squid (Jones et al., 2020; Lowman et al., 2022), as well as the Gulf of Maine haddock stock (Cadrin et al., 2020b). These CPUE indices derived from Study Fleet data inform the stock assessments in a qualitative manner and provide valuable perspective on the survey-based indices of abundance (Blackburn, 2017; NEFSC, 2022a; NEFSC, 2022b). Through time, CPUE analyses have become more sophisticated, transforming from purely nominal indices to more technical indices that are standardized using generalized linear or generalized additive models (sensu Maunder and Punt, 2004). In the future, the goal is to develop Study Fleet CPUE indices into products that are regularly included in regional stock assessments. Within the range of assessments from the region, these CPUEs could serve a variety of roles from providing context, to being included in model runs and potentially even in final models (there are a number of ways these indices can potentially be included as valuable additions to the assessment process; see Figure 1).
Fishery Footprints
Fishery footprints describe the spatial distribution of catch and effort (e.g., Amoroso et al., 2018). The fine-scale location data collected by the Study Fleet (vessel position in latitude and longitude collected once per minute) have been used in a number of contexts to develop estimates of fishery footprints. Recently a fishery footprint that included specific comparisons to the planned footprints of offshore wind projects was initiated. This work is likely to expand in scope and parallel efforts in other regions (e.g., Methratta et al., 2020; Schupp et al., 2021) to understand operational conflicts between marine renewable energy developments and fishing operations. Data sets similar to the Study Fleet data collected from onboard EM camera systems have recently been used to understand the impact of spatial management measures on fishing operations (Bell et al., 2021), and there is a high likelihood that Study Fleet data will be used for similar means in the near future.
Habitat Modeling
Combining catch information with other sources of data (geographic and oceanographic data) has facilitated the development of species distribution models. Previously this work was conducted to identify areas where river herring (Alosa spp.) bycatch might be lowest for vessels targeting Atlantic herring (Clupea harengus, Turner et al., 2017). More recently, Lowman et al. (2021) constructed a species distribution model for northern shortfin squid (Illex illecebrosus) to better understand the distribution of this squid and the proportion of its distribution that is overlapped by the fishery. Additionally, catch and effort information from Study Fleet vessels has been used to describe species distributions in space and time, and potentially association with temperature. Species distribution models as well as other explorations can be used to both improve our understanding of their availability to the region’s standardized surveys (e.g., Manderson et al., 2015), as well as the potential impacts of climate change (e.g., McHenry et al., 2019).
Discard Estimation
Bell et al. (2017) compared the use of self-reported kept and discarded catch data against observer data to derive area-specific discard estimates similar to the Standard Bycatch Reporting Methodology (SBRM). In the northeast U.S., the SBRM (Wigley et al., 2007) is a legally required, peer reviewed, analytical approach for estimating discards to be used in stock assessments and management actions including setting quotas and monitoring compliance. This comparison suggested that self-reported logbook data could be a cost effective means to estimate the bycatch of specific stocks that were examined (of the twenty comparisons thirteen were similar in size and trends were similar through time, four had only similar trends through time and three were not similar). More recently, discard data has been utilized to help develop monitoring standards for a logbook audit program for the region’s pre-implementation electronic monitoring programs (Jones et al., 2018). These research applications follow along from work by Roman et al. (2011) and suggest self-reported catch and effort data as a cost-effective mechanism for estimating discards.
Improving Biological Parameter Estimates
Study Fleet has shown success in implementation of an industry-based biological sampling program. While length and weight measurements are not taken by all participants, opportunistic collections have been a key success of this program. Collaboratively working with industry provides an opportunity to access species across space and time that are unavailable to seasonal surveys. These biological samples can improve the data available for studies on age, growth, reproductive dynamics, and bioenergetics. For example, yellowtail flounder samples from three stocks were obtained from Study Fleet vessels across three years to estimate potential annual fecundity (McElroy et al., 2016). Additionally, yellowtail flounder, winter flounder, and summer flounder samples were obtained to support a bioenergetics study on flatfish (Wuenschel et al., 2018).
Discussion
Haul specific logbook data, and reference fleets like the NEFSC Study Fleet provide a unique perspective on marine ecosystems, as they record consistent observations over long periods of time and incorporate the tacit knowledge of fishermen (Johnson, 2007; Hulme, 2014). As with other forms of passive cooperative research, the curation of logbook data by fisheries scientists provides the most straightforward path to having the data used for scientific purposes (Mangi et al., 2018; Bonney et al., 2021). Additionally, the interactions with industry that emerge from the collection and application of these data are likely to increase understanding and trust (Thompson et al., 2019; Holm et al., 2020). A number of these benefits have been realized by the Study Fleet program, with products from the collaborative efforts being incorporated into stock assessments, however it is clear that the program has yet to meet its full potential. A number of lessons were learned during the first 15 years of the Study Fleet that will inform the future of this program and may be of use to developing programs in other regions. Many of these lessons have been seen in other research ventures that engages stakeholders in research partnerships (Mackinson et al., 2011; Gawarkiewicz and Mercer, 2019; Steins et al., 2020; Van Vranken et al., 2020). Having these same lessons emerge repeatedly from independent programs suggests that they are likely to be encountered by other programs attempting to pursue substantive industry collaborations.
Primary Lessons Learned
Sustaining Participation is Hard
As with a number or science-industry research collaborations (e.g., Mangi et al., 2018), a key takeaway from over a decade of working with the fishing industry is that participation and engagement are not guaranteed on either side of the collaboration. Participation and interest in providing data to scientists and managers, and their interest in receiving it, is often linked to specific topics and pending management action. This ebb and flow of interest is part of most research endeavors (Mackinson, 2022), but presents a challenge to creating a consistent time series. This is a barrier to maintaining participation in a broader range of longer-term collaborative research addressing dynamic and evolving questions and capacity building. Building a Study Fleet that is diverse in participation, but stable over time would provide the maximum scientific benefit (data which is the most representative), but without tangible products and impacts over time, participation is difficult to sustain. A unique aspect of the Study Fleet program is that its extended period of operation means that there is currently a need to plan for key participants leaving fisheries. Partnering with regional training programs could provide a means to sustain interest, but it is likely that some time series from specific vessels may have a maximum length.
Find Fishermen Who Really Want to Contribute to Science
For many reasons successes in cooperative research can be challenging to find. Previous research has suggested that finding ‘boundary spanners’, that is individuals who can recognize the value of tacit knowledge while also contributing to scientific objects (Johnson, 2007), is essential. For this project, identifying and onboarding these individuals was a key early success. Evidence of the commitment of these fishermen to the program can be seen in a number of ways. For example, while direct compensation (quarterly stipend) maybe a motivating factor for some fishermen to participate in the Study Fleet, many fishermen who are part of the program have been willing to accept reductions in compensation between 2005 and 2016 (due to budget constraints). This commitment to continuing to collect data, regardless of reduced compensation, reflects their support for the mission of the program. Many fishermen care deeply about the science that informs the management of the fisheries on which their livelihoods rely, and take pride in their contributions of data and knowledge through the Study Fleet. Finding and partnering with these key industry collaborators has been essential to developing and sustaining a research program of this nature. At the same time, it is important to consider those fishermen who may be left out of the program and potential biases that may be introduced by focusing on a subset of a given fishery (Steins et al., 2020). Recent efforts to apply Study Fleet data in novel and impactful ways have re-invigorated Study Fleet participants and sparked additional interest in participation from other fishermen. For example, the catch data have been used to develop CPUE standardizations for a number of stock assessments (e.g., Cadrin et al., 2020b), and data have been made available to regional academic partners for research purposes in the hopes of spurring additional analytical products. Within the region, fishermen often inherently distrust fisheries science and scientific advice because they are often excluded from the process (Johnson, 2007). In a manner similar to other cooperative programs, the Study Fleet provides a venue for fishermen to directly contribute to the scientific process, turning anecdotes into data points.
Fishing Operations Are Diverse and One Piece of Software Does Not Work for All
There are dozens of different gear types used for commercial fisheries, all of which have unique operational sequences and metrics. Developing a data collection system (software and hardware) for all gear types has proven to be extremely difficult, and has limited participation by fixed gear vessels in the Study Fleet. In recent years, operational constraints on software systems were identified for fixed gears and extensive user comments guided enhancements in the layout and sequencing of logbook data entry screens. The challenges of collecting effort-level data for fixed gear types where multiple strings can be deployed at the same time and with some gear left fishing while the boat returns to port, are not fully resolved and require further technical development. A clear lesson from this work is that programs should make an effort to engage and consult with the full breadth of potential users from diverse fishing operations early during the software development phase. Engaging diverse users early in the program can help to anticipate the potential diversity of uses and the flexibility that might be needed.
A Multi-Purpose Logbook Is Useful, But Can Detract From the Scientific Impact
After the demonstrated success of the ELB for the Study Fleet, other groups pushed for its use as a regulatory reporting tool. This utilization of the technology for regulatory reporting rather than science has the potential to provide increased participation and better relationships (because NMFS is providing software and a service) between scientists and fishermen, but comes at a cost of time and resources. This is especially true when resources and field support are limited and are spread across a range of fisheries and the reporting technology is continuously being developed. In this program, there was a hope that the use of the ELB for mandated reporting would lead to more interest in reporting for scientific purposes, but our evaluation of trends in participation suggests that this transition only occurred on one or two occasions. Generally, fishermen preferred to report at a lower-resolution, unless a higher level of participation was required of them (e.g., vessels who opted into pilot electronic monitoring programs). Planning and programmatic mechanisms that enhance scientific partnerships/collaborations to maintain and expand overall activity in a fishery or region are needed given constrained research budgets.
Straddling the Regulatory Divide Can Be a Challenge
The Study Fleet program participants collect using software that is also approved for northeast U.S. federal vessel trip reporting. Therefore, components of the data collected to address scientific questions are passed onto regional regulators and used to maintain regulatory compliance. To perform both of these functions simultaneously, it is essential that boundaries are maintained between regulatory and scientific applications and that fishermen understand how their data are being used. Additionally, there is a need to communicate how data submitted by fishermen are handled and processed to align with specific management programs. Often the QA/QC modifications that are made to data following submission are poorly documented or understood by fishermen, sector managers, or NMFS staff, and this is the core driver of fishery dependent data modernization efforts throughout the Northeast and other regions nationally. Documenting these processes and communicating them back to the fleet will help to avoid issues experienced in this region.
Data Management and QA/QC Need to Be Planned For
At its heart, the Study Fleet seeks to engage the fishing community in collecting high-resolution data sets of catch, effort, and environmental conditions. Each of these elements require high level QA/QC to ensure consistency and applicability. Competition among programs within the region hampered early development and continued evolution of a robust QA/QC system for the Study Fleet. Fully funding these programs would have expedited the availability and enhanced the utility of the data for stock assessments and ecosystem research. Documentation and dedicated staff to operationalize the delivery of standard data products to end users are key to reference fleets realizing their full scientific value. Additionally, end users need to understand the protocols that govern QA/QC and data collection by fishermen.
Data management has become more challenging as the Study Fleet program has developed from a small fleet of vessels in a single fishery to a large number that are spread geographically and across fisheries and gear types. To ensure that data sets are curated and available to analysts and collaborators, sufficient time and resources must be dedicated to data management and data flow. Developing standardized and regular data reports for collaborating participants and for program managers is an important next step for the Study Fleet. These reports could be used to help analyze patterns of omissions or other data quality metrics. Additionally, they could be used to synthesize across multiple types of fisheries dependent data.
Involve Assessment Scientists Early and Connect Often
Moving data from vessels into science and management is a large challenge for research collaborations (Steins et al., 2020). As with many other science-industry collaborations, this program exists in a data rich region where almost all stock assessments are supported by long-term scientific surveys. Because of the length of these time series, assessment scientists are cautious about bringing in fishery dependent data which has many complexities and caveats. While stock assessment scientists assert that there are benefits to these data sets (e.g., the large number of samples collected, and that they are sampled throughout the year), there is hesitation to include the information unless there are significant data gaps to fill.
A number of groups organized by the New England Fishery Management Council, such as the recent Fishery Dependent Data for Stock Assessments Working Group, have advocated for the wider use of fishery dependent data like that collected by the Study Fleet (Cadrin et al., 2020a). These studies highlight the potential utility of Study Fleet data, however regular use in annual operational stock assessments is not possible until the data are integrated in research track stock assessments that occur at 3- to 5-year intervals.
In discussions with collaborating participants, a common concern is that these data are not utilized to its full potential. Ensuring the data meets its potential, informing both qualitative (e.g., providing context to assessments) and quantitative aspects (e.g., improving discard estimates, being incorporated in assessment models as standardized CPUEs) of the fisheries science and management process is a multifaceted challenge. As mentioned previously, the Study Fleet data reflect a somewhat narrow and non-random selection of vessels, and the trip records themselves are continuous rather than random. Additionally, the number of vessels needed to provide a representative picture of trends in catch for any given fishery have not been well established. Communicating these potential pitfalls, and working with assessment scientists to ensure analyses consider these features of the data is an area of active development for this program.
Recently, a number of collaborative efforts have been initiated with assessment scientists, and familiarity and trust in the data are growing. Study Fleet derived CPUE trends have been presented at and incorporated in recent stock assessments. These efforts have highlighted the need to better understand topics that relate to the representativeness of Study Fleet data for different fisheries, as well as the efficiency of commercial gear and how that might affect trends in CPUE. The analytical possibilities are expanding and recent collaborative planning workshops appear to be building analytical capacity for upcoming assessments. Increasing engagement from specific fleets and specific fisheries for longer time periods will enhance the likelihood of success.
Providing Information Back to Captains Is Essential
Finally, there is an ongoing need to develop and expand data reports that are provided back to fishermen. Currently the flow of data is mostly unidirectional, with participants submitting data but relatively few products reporting this information back to the data collectors. Captains find great value in having access to their data, as it allows for a number of comparisons between sources (dealers, observers, port samplers, etc.), and for them to build insight from their fishing activities. Some basic applications to provide this access have been developed and piloted (Appendix D), but there is considerable room for growth in this area. Developing these tools with fishermen, fleet managers, and scientists to prioritize what is most useful would continue to build on the clear success of this program. These types of tools are likely to be valuable for creating an awareness of the importance of accurate reporting. Additionally, being able to see and use collected data, as well as receive information about how their data are being integrated into scientific processes, is vital to sustain participation in this type of scientific endeavor (Holm et al., 2020).
Key Recommendations
Based on these lessons learned, we developed a set of recommendations for data collections similar to the Cooperative Research Study Fleet program in the northeast US. This includes data sets leveraging cameras or other technology to create high resolution fishery dependent data, especially those hoping to apply the data to scientific aspects of fisheries management (e.g., ecosystem and stock assessments). These recommendation echo elements of those suggested by other science-industry research collaborations (Steins et al., 2020), and emphasize that for logbook oriented collaborative projects similar lessons apply.
1. Develop detailed roadmaps for each data collection to keep participants engaged as collaborators. These road maps would explain to participants when and how their data are expected to be used, how likely it is to be used, and set clear expectations and milestones.
2. Target specific fisheries to keep resources from being stretched too thin. Focusing on a limited set of fisheries and on the data sets most likely to be used will help to ensure the program ‘succeeds’.
3. Partner with data users early. End users of the data from science-industry collaborations require continuous and representative time series to perform their analyses. This means that data products and summaries need to be planned well in advance, and planning should incorporate a spectrum of people including assessment scientists, scientists with a deep knowledge of fishery dependent data sources, and ideally, fishermen most familiar with the data.
Author Contributions
AM, AJ, KB, MM, JH, DG, JF, JR, RS, and TS conceived of the study. KB, MM, GG, JW, CA, DG, JF, JR, RS, and TS collected and curated the data. AJ, DD, BL, and AM participated in the formal analysis. AJ, AM, KB, and JH contributed the original draft. All authors contributed to the editing. MM provided software development. Resources were contributed by JH, DG, JF, JR, RS, and TS. All authors contributed to the article and approved the submitted version.
Funding
Funding for this project was largely provided by the NOAA NMFS Northeast Fisheries Science Center as well as NOAA NMFS National Cooperative Research Program.
Conflict of Interest
The authors declare that the research was conducted in the absence of any commercial or financial relationships that could be construed as a potential conflict of interest.
Publisher’s Note
All claims expressed in this article are solely those of the authors and do not necessarily represent those of their affiliated organizations, or those of the publisher, the editors and the reviewers. Any product that may be evaluated in this article, or claim that may be made by its manufacturer, is not guaranteed or endorsed by the publisher.
Acknowledgments
Many participating captains, crew, associated industry members, and NEFSC staff, inspired this work and made it possible through their diligent efforts. This paper was significantly improved by the insightful comments and suggestions of K. Bastille and J. Deroba. Constructive feedback from two reviewers helped to orient this work within the larger literature on science-industry collaborations. The views expressed herein are those of the authors and do not necessarily reflect the views of NOAA or any of its sub-agencies.
Supplementary Material
The Supplementary Material for this article can be found online at: https://www.frontiersin.org/articles/10.3389/fmars.2022.869560/full#supplementary-material
References
Amoroso R. O., Pitcher C. R., Rijnsdorp A. D., McConnaughey R. A., Parma A. M., Suuronen P., et al. (2018). Bottom Trawl Fishing Footprints on the World’s Continental Shelves. Proceedings of the National Academy of Sciences, 115 (43), E10275–E10282.
Bastille K. L. (2019). Applying Fisheries Data From the Norwegian Reference Fleet to Study the Demersal Biodiversity and Fisheries Dynamics in Two Coastal Areas (Bergen, Norway: Master’s thesis, The University of Bergen). Available at: https://bora.uib.no/bora-xmlui/bitstream/handle/1956/19857/Bastille-Master-Thesis.pdf?sequence=1&isAllowed=y.
Bell R. J., Gervelis B., Chamberlain G., Hoey J. (2017). Discard Estimates From Self-Reported Catch Data: An Example From the US Northeast Shelf. North Am. J. Fisheries Manage. 37 (5), 1130–1144. doi: 10.1080/02755947.2017.1350219
Bell R. J., McManus M. C., McNamee J., Gartland J., Galuardi B., McGuire C. (2021). Perspectives From the Water: Utilizing Fisher’s Observations to Inform SNE/MA Windowpane Science and Management. Fisheries Res. 243, 106090. doi: 10.1016/j.fishres.2021.106090
Bjørkan M. (2011). Fishing for Advice: The Case of the Norwegian Reference Fleet (Tromoso, Norway: University of Tromsø). Available at: https://hdl.handle.net/10037/3770.
Blackburn J. (2017). Study Fleet Inventory of Data Uses: A Tool for Stakeholder Engagement (Woods Hole, MA: Northeast Fisheries Science Center Reference Document), 17–06. doi: 10.7289/V5/RD-NEFSC-17-06
Bonney R., Byrd J., Carmichael J. T., Cunningham L., Oremland L., Shirk J., et al. (2021). Sea Change: Using Citizen Science to Inform Fisheries Management. BioScience 71 (5), 519–530. doi: 10.1093/biosci/biab016
Cadrin S., Frede R., Keiley E., Linton B., Maguire J. J., Rago P., et al. (2020a) Fishery Data for Stock Assessment Working Group Report. New England Fishery Management Council Report. Available at: https://s3.amazonaws.com/nefmc.org/200220_Fishery-Data-Working-Group-report_Final_with-appendices.pdf.
Cadrin S. X., Hansell A., Jones A. W. (2020b). Catch Rates of Haddock in the Gulf of Maine Trawl Fishery. 2021 Haddock Research Track Working Paper (Woods Hole, MA: NEFSC), 22.
Clegg T. L., Fuglebakk E., Ono K., Vølstad J. H., Nedreaas K. (2022). A Simulation Approach to Assessing Bias in a Fisheries Self-Sampling Programme. ICES J. Marine Sci. 79 (1), 76–87. doi: 10.1093/icesjms/fsab242
DeCelles G. R., Martins D., Zemeckis D. R., Cadrin S. X. (2017). Using Fishermen’s Ecological Knowledge to Map Atlantic Cod Spawning Grounds on Georges Bank. ICES J. Marine Sci. 74 (6), 1587–1601. doi: 10.1093/icesjms/fsx031
Essington T., Ward E. J., Francis T. B., Greene C., Kuehne L., Lowry D. (2021). Historical Reconstruction of the Puget Sound (USA) Groundfish Community. Mar. Ecol. Prog. Ser. 657, 173–189. doi: 10.3354/meps13547
Feeney R. G., La Valley K. J., Hall-Arber M. (2010). Assessing Stakeholder Perspectives on the Impacts of a Decade of Collaborative Fisheries Research in the Gulf of Maine and Georges Bank. Marine and Coastal Fisheries 2 (1), 205–216. doi: 10.1577/C09-038.1
Feeney T., et al (2021). Historical Reconstruction of the Puget Sound (USA) Groundfish Community. Mar. Ecol. Prog. Ser. 657, 173–189. doi: 10.3354/meps13547
Forrestal F. C., Schirripa M., Goodyear C. P., Arrizabalaga H., Babcock E. A., Coelho R., et al. (2019). Testing Robustness of CPUE Standardization and Inclusion of Environmental Variables With Simulated Longline Catch Datasets. Fisheries Res. 210, 1–13. doi: 10.1016/j.fishres.2018.09.025
Fox D. S., Starr R. M. (1996). Comparison of Commercial Fishery and Research Catch Data. Can. J. Fisheries Aquat. Sci. 53 (12), 2681–2694. doi: 10.1139/f96-230
Gawarkiewicz G., Chen K., Forsyth J., Bahr F., Mercer A., Ellertson A., et al. (2019). Charactersitics of an Advective Marine Heatwave in the Middle Atlantic Bight in Early 2017. Front. Marine Sci. 6, 172. doi: 10.3389/fmars.2019.00712
Gawarkiewicz G., Mercer A. M. (2019). Partnering With Fishing Fleets to Monitor Ocean Conditions. Annu. Rev. Marine Sci. 11, 391–411. doi: 10.1146/annurev-marine-010318-095201
Gervelis B. J. (2018). MS. Summer Flounder CPUE Derived From Cooperative Research Study Fleet Self-Reported Data (Woods Hole, MA: NOAA Fisheries NEFSC Cooperative Research Branch Narragansett RI), 9. 2018 SAW-66 Summer Flounder Working Group Working Paper
Hartley T. W., Robertson R. A. (2006). Emergence of Multi-Stakeholder-Driven Cooperative Research in the Northwest Atlantic: The Case of the Northeast Consortium. Marine Policy 30 (5), 580–592. doi: 10.1016/j.marpol.2005.09.006
Hoare D., Graham N., Schön P. J. (2011). The Irish Sea Data-Enhancement Project: Comparison of Self-Sampling and National Data-Collection Programmes—Results and Experiences. ICES J. Marine Sci. 68 (8), 1778–1784. doi: 10.1093/icesjms/fsr100
Holm, Hadjimichael M., Linke S., Mackinson S. (Eds.) (2020). Collaborative Research in Fisheries: Co-Creating Knowledge for Fisheries Governance in Europe Vol. 22 (Cham, Switzerland: Springer Nature).
Hulme P. E. (2014). Bridging the Knowing–Doing Gap: Know-Who, Know-What, Know-Why, Know-How and Know-When. J. Appl. Ecol. 51 (5), 1131–1136. doi: 10.1111/1365-2664.12321
ICES (2021). ICES Workshop on Standards and Guidelines for Fisheries Dependent Data. ICES Sci. Rep. 3 (38), 90. doi: 10.17895/ices.pub.8038
Johnson T. R. (2007). Integrating Fishermen and Their Knowledge in the Science Policy Process: Case Studies of Cooperative Research in the Northeastern Us (Brunswick, New Jersey: Rutgers The State University of New Jersey-New Brunswick).
Johnson T. R., van Densen W. L. (2007). Benefits and Organization of Cooperative Research for Fisheries Management. ICES J. Marine Sci. 64 (4), 834–840. doi: 10.1093/icesjms/fsm014
Jones A. W., Linden D. W., McAfee B. M., Rossi N. A., Palmer M. C., Hoey J. J., et al. (2018) in Proceedings of the 9th International Fisheries Observer and Monitoring Conference. Vigo, Spain: ISBN. 395 pages ISBN: 978-0- 9924930-7-3.
Jones A. W., Lowman B. A., Mercer A. M. (2020). MAFMC SSC Illex Working Group. Available at: https://static1.squarespace.com/static/511cdc7fe4b00307a2628ac6/t/5ea6f44ba283df7817ec1a09/1587999821890/h_IllexCPUE_StudyFleet_CRB_Jones+et+al.pdf
Kraan M., Uhlmann S., Steenbergen J., Van Helmond A. T. M., Van Hoof L. (2013). The Optimal Process of Self-Sampling in Fisheries: Lessons Learned in the Netherlands. J. Fish Biol. 83 (4), 963–973. doi: 10.1111/jfb.12192
Lowman B. A., Jones A. W., Mercer A. M. (2022). Integrating Economic Factors and Fleet Dynamics Into the Standardization of Northern Shortfin Squid Landings Per Unit Effort 2021 Illex Research Track Working Paper (Woods Hole MA: NEFSC), 38p.
Lowman B. A., Jones A. W., Pessutti J. P., Mercer A. M., Manderson J. P., Galuardi B. (2021). Northern Shortfin Squid (Illex Illecebrosus) Fishery Footprint on the Northeast US Continental Shelf. doi: 10.3389/fmars.2021.631657
Mackinson S. (2022). The Fall and Rise of Industry Participation in Fisheries Science – A European Story. ICES J. Marine Sci. doi: 10.1093/icesjms/fsac041
Mackinson S., Wilson D. C., Galiay P., Deas B. (2011). Engaging Stakeholders in Fisheries and Marine Research. Marine Policy 35 (1), 18–24. doi: 10.1016/j.marpol.2010.07.003
Manderson J. P., Roebuck C., Kohut J., Hoey J. J. (2015). Slouching Towards Bethlehem: Partnerships Between Government, Academic and the Fishing Industry Experts Should be the Foundation of Applied Ecosystem Research in the Sea. A Case Study With Atlantic Butterfish. ICES CM, 10. Available at: https://www.ices.dk/sites/pub/ASCExtendedAbstracts/Shared%20Documents/L%20-%20Science-industry%20partnership.%20The%20value%20of%20cooperative%20research%20in%20fisheries%20and%20marine%20management/L1015.pdf.
Mangi S. C., Kupschus S., Mackinson S., Rodmell D., Lee A., Bourke E., et al. (2018). Progress in Designing and Delivering Effective Fishing Industry–Science Data Collection in the UK. Fish Fisheries 19 (4), 622–642. doi: 10.1111/faf.12279
Manning J., Pelletier E. (2009). Environmental Monitors on Lobster Traps (eMOLT): Long-Term Observations of New England’s Bottom-Water Temperatures. J. Operational Oceanogr. 2 (1), 25–33. doi: 10.1080/1755876X.2009.11020106
Maunder M. N., Punt A. E. (2004). Standardizing Catch and Effort Data: A Review of Recent Approaches. Fisheries Res. 70 (2-3), 141–159. doi: 10.1016/j.fishres.2004.08.002
McElroy D. W., Wuenschel M. J., Towle E. K., McBride R. S. (2016). Spatial and Annual Variation in Fecundity and Oocyte Atresia of Yellowtail Flounder, Limanda Ferruginea, in U.S. Waters. J. Sea Res. 107 (1), 76–89. doi: 10.1016/j.seares.2015.06.015
McHenry J., Welch H., Lester S. E., Saba V. (2019). Projecting Marine Species Range Shifts From Only Temperature can Mask Climate Vulnerability. Global Change Biol. 25 (12), 4208–4221. doi: 10.1111/gcb.14828
Mercer A., Ellertson A., Spencer D., Heimann T. (2018). Fishers Fill Data Gaps for American Lobster (Homarus Americanus) and Jonah Crab (Cancer Borealis) in the Northeast USA. Bull. Marine Sci. 94 (3), 1121–1135. doi: 10.5343/bms.2017.1105
Methratta E. T., Hawkins A., Hooker B. R., Lipsky A., Hare J. A. (2020). Offshore Wind Development in the Northeast US Shelf Large Marine Ecosystem. Oceanoraphy 33 (4), 16–27. doi: 10.5670/oceanog.2020.402
Mion M., Piras C., Fortibuoni T., Celić I., Franceschini G., Giovanardi O., et al. (2015). Collection and Validation of Self-Sampled E-Logbook Data in a Mediterranean Demersal Trawl Fishery. Regional Stud. Marine Sci. 2, 76–86. doi: 10.1016/j.rsma.2015.08.009
Nedreaas K. H., Borge A., Godøy H., Aanes S. (2006). The Norwegian Reference Fleet: Co-Operation Between Fisherman and Scientists for Multiple Objectives. ICES CM 2006/N:05 12 pp. https://imr.brage.unit.no/imr-xmlui/bitstream/handle/11250/100883/N0506.pdf?sequence=1.
Neis B., Schneider D. C., Felt L., Haedrich R. L., Fischer J., Hutchings J. A. (1999). Fisheries Assessment: What Can Be Learned From Interviewing Resource Users? Can. J. Fisheries Aquat. Sci. 56 (10), 1949–1963. doi: 10.1139/f99-115
Northeast Fisheries Science Center (NEFSC) (2015). “60th Northeast Regional Stock Assessment Workshop (60th SAW) Assessment Report,” in US Dept Commer, Northeast Fish Sci Cent Ref Doc, vol. 15-08. (Woods Hole, MA: Bluefish & Scup Assessments), 870. Available at: https://repository.library.noaa.gov/view/noaa/4975. doi: 10.7289/V5W37T9T.
Northeast Fisheries Science Center (NEFSC) (2019). Northeast Fisheries Observer Program Handbook for Fisheries Observers and Providers (Woods Hole, MA: National Oceanic and Atmospheric Administration Institutional Repository 22728). Available at: https://repository.library.noaa.gov/view/noaa/22728.
Northeast Fisheries Science Center (NEFSC) (2022a). Report of the Illex 2021 Research Track Assessment Working Group (166 Water Street, Woods Hole: National Marine Fisheries Service), 149p. Available at: https://apps-nefsc.fisheries.noaa.gov/saw/sasi/uploads/2022_ILL_UNIT_Report_Text.pdf.
Northeast Fisheries Science Center (NEFSC) (2022b). Final Report of the Haddock Research Track Assessment Working Group (166 Water Street, Woods Hole: National Marine Fisheries Service), 65 p. Available at: https://apps-nefsc.fisheries.noaa.gov/saw/sasi/uploads/Haddock_WG_Report_DRAFT_GOM_ONLY_text_v3.pdf.
Palmer M. C., Ball M., Anderson K. A., Conboy I., Moser J. (2009). “An Overview of the Tilefish Data Collected Through the Northeast Fisheries Science Center’s Study Fleet Project. Pages 121-149,” in Northeast Fisheries Science Center. 2009, vol. 09-15. (Woods Hole, MA: 48th Northeast Regional Stock Assessment Workshop (48th SAW) Assessment Report. US Dept Commer, Northeast Fish Sci Cent Ref Doc), 834 p. Available at: https://www.nefsc.noaa.gov/publications/crd/crd0915.
Palmer M. C., Hersey P., Marotta H., Shield G. R., Cierpich S. B. (2016). The Design and Performance of an Automated Observer Deployment System for the Northeastern United States Groundfish Fishery. Fisheries Res. 179, 33–46. doi: 10.1016/j.fishres.2016.02.004
Palmer M. C., Wigley S. E., Hoey J. J., Palmer J. (2007). An Evaluation of the Northeast Region’s Study Fleet Pilot Program and Electronic Logbook (ELB) System: Phases I and II (Woods Hole MA: NOAA Tech. Memo. NMFS-NE-204), 79p.
Pederson J., Hall-Arber M. (1999). “Fish Habitat: A Focus on New England Fishermen’s Perspectives”. Benaka L. R.. Fish Habitat: Essential Fish Habitat and Rehabilitation. American Fisheries Society, Bethesda, MD, pp. 188–211.
Pennington M., Helle K. (2011). Evaluation of the Design and Efficiency of the Norwegian Self-Sampling Purse-Seine Reference Fleet. ICES J. Marine Sci. 68 (8), 1764–1768. doi: 10.1093/icesjms/fsr018
Roman S., Jacobson N., Cadrin S. X. (2011). Assessing the Reliability of Fisher Self-Sampling Programs. North Am. J. Fisheries Manage. 31 (1), 165–175. doi: 10.1080/02755947.2011.562798
Rountree R., Kessler R., Jones D., Martins D., Bub F. (2004). The High-Resolution Industry-Based Trawl Survey Data Report (Fairhaven: University of Massachusetts Dartmouth, School for Marine Science and Technology, Technical Report), 05–0302.
Schupp M. F., Kafas A., Buck B. H., Krause G., Onyango V., Stelzenmüller V., et al. (2021). Fishing Within Offshore Wind Farms in the North Sea: Stakeholder Perspectives for Multi-Use From Scotland and Germany. J. Environ. Manage. 279, 111762. doi: 10.1016/j.jenvman.2020.111762
Steins N. A., Kraan M. L., van der Reijden K. J., Quirijns F. J., van Broekhoven W., Poos J. J. (2020). Integrating Collaborative Research in Marine Science: Recommendations From an Evaluation of Evolving Science-Industry Partnerships in Dutch Demersal Fisheries. Fish Fisheries 21 (1), 146–161. doi: 10.1111/faf.12423
Stephenson R. L., Paul S., Pastoors M. A., Kraan M., Holm P., Wiber M., et al. (2016). Integrating Fishers’ Knowledge Research in Science and Management. ICES J. Marine Sci. 73 (6), 1459–1465. doi: 10.1093/icesjms/fsw025
Thompson S. A., Stephenson R. L., Rose G. A., Paul S. D. (2019). Collaborative Fisheries Research: The Canadian Fisheries Research Network Experience. Can. J. Fisheries Aquat. Sci. 76 (5), 671–681. doi: 10.1139/cjfas-2018-0450
Turner S. M., Hare J. A., Manderson J. P., Hoey J. J., Richardson D. E., Sarro C. L., et al. (2017). Cooperative Research to Evaluate an Incidental Catch Distribution Forecast. Front. Marine Sci. 4, 116. doi: 10.3389/fmars.2017.00116
van Helmond A. T., Mortensen L. O., Plet-Hansen K. S., Ulrich C., Needle C. L., Oesterwind D., et al. (2020). Electronic Monitoring in Fisheries: Lessons From Global Experiences and Future Opportunities. Fish Fisheries 21 (1), 162–189. doi: 10.1111/faf.12425
Van Vranken C., Vastenhoud B. M., Manning J. P., Plet-Hansen K. S., Jakoboski J., Gorringe P., et al. (2020). Fishing Gear as a Data Collection Platform: Opportunities to Fill Spatial and Temporal Gaps in Operational Sub-Surface Observation Networks. Front. Marine Sci. 7, 864. doi: 10.3389/fmars.2020.485512
Wigley S. E., Rago P. J., Sosebee K., Palka D. (2007). The Analytic Component to the Standardized Bycatch Reporting Methodology Omnibus Amendment: Sampling Design, and Estimation of Precision and Accuracy. 2nd Edition Vol. 07-09 (Woods Hole, MA: US Dept Commer, Northeast Fish Sci Cent Ref Doc), 156.
Keywords: logbook, CPUE, fishery dependent data, Northeast United States, self-reported data, cooperative research, reference fleet
Citation: Jones AW, Burchard KA, Mercer AM, Hoey JJ, Morin MD, Gianesin GL, Wilson JA, Alexander CR, Lowman BA, Duarte DG, Goethel D, Ford J, Ruhle J, Sykes R and Sawyer T (2022) Learning From the Study Fleet: Maintenance of a Large-Scale Reference Fleet for Northeast U.S. Fisheries. Front. Mar. Sci. 9:869560. doi: 10.3389/fmars.2022.869560
Received: 07 February 2022; Accepted: 06 April 2022;
Published: 18 May 2022.
Edited by:
Nathalie A. Steins, Wageningen Marine Research IJmuiden, NetherlandsReviewed by:
Teresa Johnson, University of Maine, United StatesFloor Quirijns, Wageningen Marine Research IJmuiden, Netherlands
Copyright © 2022 Jones, Burchard, Mercer, Hoey, Morin, Gianesin, Wilson, Alexander, Lowman, Duarte, Goethel, Ford, Ruhle, Sykes and Sawyer. This is an open-access article distributed under the terms of the Creative Commons Attribution License (CC BY). The use, distribution or reproduction in other forums is permitted, provided the original author(s) and the copyright owner(s) are credited and that the original publication in this journal is cited, in accordance with accepted academic practice. No use, distribution or reproduction is permitted which does not comply with these terms.
*Correspondence: Andrew W. Jones, YW5kcmV3LmpvbmVzQG5vYWEuZ292