
95% of researchers rate our articles as excellent or good
Learn more about the work of our research integrity team to safeguard the quality of each article we publish.
Find out more
ORIGINAL RESEARCH article
Front. Mar. Sci. , 13 May 2022
Sec. Coastal Ocean Processes
Volume 9 - 2022 | https://doi.org/10.3389/fmars.2022.869285
This article is part of the Research Topic Oceanographic Processes Linking Nearshore, Continental Shelf, and Shelf Break View all 34 articles
 Akihiko Morimoto1*
 Menghong Dong1
 Mahiro Kameda1
 Taiga Shibakawa2
 Makiko Hirai3
 Kouhei Takejiri4
 Xinyu Guo1
 Hidetaka Takeoka5
A heavy rain event occurred in early July 2018 near the Seto Inland Sea. Despite clear weather after the heavy rain, the water temperature at 5 m depth on the eastern coast of the Bungo Channel decreased by approximately 3°C. Postulating that the water temperature decrease was related to the heavy rain event, we analyzed observed data during and after the heavy rain and conducted numerical experiments. We found that the surface water temperature decrease was caused by vertical mixing of cold water supplied from the Pacific Ocean in the bottom layer. Numerical experiments revealed that the bottom cold water from the Pacific Ocean was not controlled by the heavy rain event but was intensified by the heavy rain event. The lower salinity (lower water density) due to the heavy rain lasted until the end of August. This lower density intensified the gravitational circulation in the Bungo Channel for 2 months, which led to a 17.5% increase in inflow from the Pacific Ocean in the bottom layer and a 20% increase in the dissolved inorganic nitrogen flux to the Bungo Channel.
Ocean currents such as the Kuroshio and Gulf Stream are geostrophic currents that result from a balance between the Coriolis and pressure gradient forces. A geostrophic current flows along continental shelf isobaths because the horizontal divergence should be zero. Since the Kuroshio and Gulf Stream have ageostrophic components in the real ocean, flow across the continental shelf occurs at times. Generally, the cross-shelf flow is much slower than an alongshore flow such as the Kuroshio. However, cross-shelf flow in the bottom layer contributes strongly to material exchange between the open ocean and coastal sea, especially the nutrient supply from the open ocean into coastal seas. The nutrient flux across the shelf increases despite the slower cross-shelf flow because the horizontal gradient in the nutrient concentration in the bottom layer around the shelf slope is larger. Nutrients supplied from the open ocean related to the cross-shelf flow are thought to contribute largely to primary production in coastal seas. Therefore, many studies have examined the variation in the cross-shelf flow in the presence of a strong current. Atkinson (1977) firstly reported a bottom intrusion of relatively cooler and high-density Gulf Stream water into the south Atlantic Bight shelf in the Gulf Stream region. And then several studies were carried out in terms of the cross-shelf flow in the Gulf Stream region (Lee et al., 1981; Lents, 2003; Castelao, 2011; Ullman et al., 2014). In the Eastern Australian Current region, Schaeffer et al. (2013) analyzed 2 years of mooring data and revealed forcing mechanisms for cross-shelf exchange through the momentum balance. Recently, Brink (2016) reviewed cross-shelf exchange research and pointed out the difficulty with observing cross-shelf flow and the need for further studies of physical mechanisms and quantitative prediction of cross-exchange. He also described the importance of understanding ecosystem responses to cross-shelf exchange.
The Bungo Channel is located in southwestern Japan between Shikoku and Kyushu Islands and connects the Pacific Ocean to the Seto Inland Sea (Figure 1A). It is approximately 50 km wide and 100 km long, and it has a mean water depth of 80 m (Figure 1B). There is a continental shelf slope south of the Bungo Channel along which the Kuroshio flows. The marine environment in the Bungo Channel is influenced by perturbations of the Kuroshio, such as the Kuroshio meander and frontal eddies, and surface and bottom intrusions occur from early summer to autumn (Kaneda et al., 2002a). The surface intrusion of a warm water mass in the Pacific Ocean is called the Kyucho, which is Japanese for a sudden strong current (Figure 1C). The Kyucho can increase the water temperature in the Bungo Channel by 4–5°C within a day as warm water in the Kuroshio intrudes into the Bungo Channel at speeds of 0.3–0.5 m s-1 (Takeoka and Yoshimura, 1988; Takeoka et al., 1993; Takeoka et al., 1995). Several studies have investigated this phenomenon and its mechanism (Akiyama and Saito, 1993; Takeoka et al., 1993; Isobe et al., 2010; Nagai and Hibiya, 2012). In the bottom layer, the bottom intrusion of cold, nutrient-rich water from the shelf slope into the Bungo Channel. Koizumi (1999) showed that relatively cool water (< 20°C) entered the channel for approximately 10 days. Kaneda et al. (2002a) analyzed water temperature time-series data for 2 years at a depth of 68 m along the east coast of the Bungo Channel and revealed that bottom intrusions occurred repeatedly from early summer to late autumn, especially during neap tides. Since there are few large rivers in the Bungo Channel, the nutrient supply associated with a bottom intrusion is thought to be crucial for the Bungo Channel ecosystem (Kaneda et al, 2002b; Katano et al., 2005).
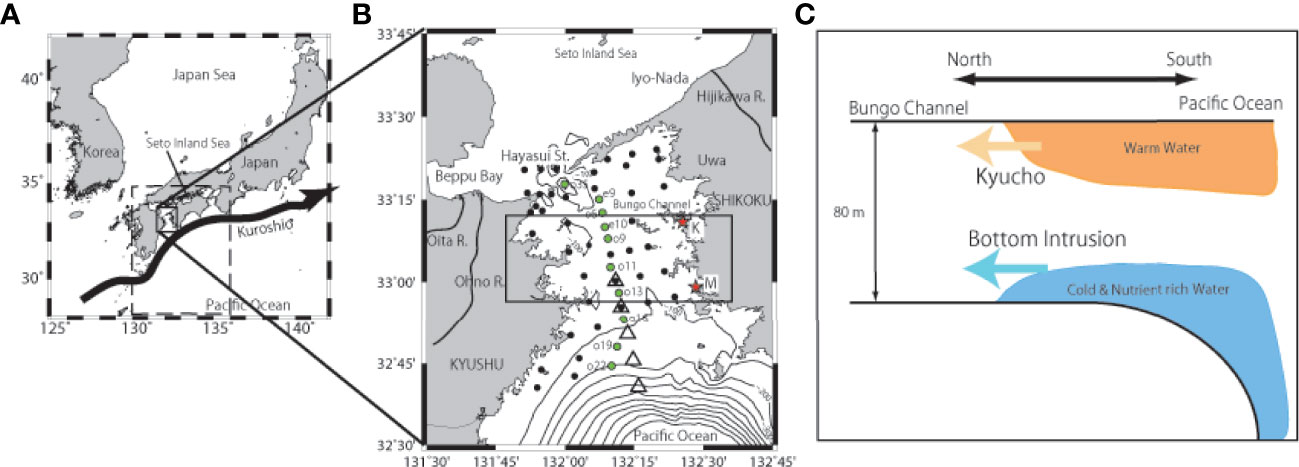
Figure 1 (A) Map of Japan. The dashed square indicates the numerical model domain; the solid square is enlarged in (B). (B) Topography around the Bungo Channel and observed points. Contour lines denote the bottom topography every 100 m of depth. Both black and green dots show the Ehime and Oita Prefecture hydrographic observation stations. Figure 5 uses the hydrographic data of green dots stations. The temporal variation in water temperature was measured at stations marked with red stars. Triangles show nutrient observation points. The black square indicates the area of control volume. (C) Schematic of intrusion phenomena in the Bungo Channel.
Both the Kyucho and bottom intrusions occur during summer neap tides, albeit irregularly (Kaneda et al., 2002a). However, there is a strong correlation between the intensities of the Kyucho and bottom intrusions on a monthly scale (Takeoka et al., 2000), and the intensities of both were correlated with the distance of the Kuroshio axis from the Bungo Channel; when the Kuroshio approaches the Bungo Channel, both Kyucho and bottom intrusions tend to occur (Kaneda et al., 2002c). Therefore, the Kuroshio variation might influence the occurrence of bottom intrusions, but we do not know what triggers a bottom intrusion. Based on a numerical model, Arai (2005) proposed a mechanism for bottom intrusions in the Bungo Channel. However, there is no observational evidence of upwelling southeast of the Bungo Channel. Therefore, the mechanism of bottom intrusions remains controversial.
The vertical circulation in the Bungo Channel during summer tends to be a gravitational circulation such as an estuary circulation; low density surface water flows from the Seto Inland Sea southward into the Pacific Ocean, while high density bottom water flows from south to north (Chang et al., 2009). Therefore, a bottom intrusion might be enhanced by decreasing water density in the Seto Inland Sea. In Japan, heavy rain events are frequent during the rainy season (June and July), and the maximum hourly rainfall is increasing (Fujibe, 2015). Heavy rain events occurred 15 times since 1938 around the Seto Inland Sea area, and 7 of 15 of heavy rain events occurred after 2010. In recent years, the water density in the Seto Inland Sea is thought to have decreased. In early July 2018, a heavy rain event occurred near the Seto Inland Sea, causing flooding and landslides. The integrated precipitation during the 4-day event greatly exceeded the monthly integrated rainfall in a normal July (Figure 2). The maximum integrated rain fall during the heavy rain event was 965 mm which was the highest integral rain fall during a heavy rain event after 2010. The precipitation and river discharge supplied an enormous amount of freshwater during a short period. During the heavy rain, the precipitation exceeded 500 mm in the northern part of the Bungo Channel, dramatically decreasing the water density there. A few days after the heavy rain event, the surface water temperature decreased in the eastern part of the Bungo Channel, despite the clear weather and warm season. This required a supply of cooler water, possibly a bottom intrusion. Therefore, we examined whether there was an enhanced bottom intrusion from the Pacific Ocean to the Bungo Channel related to the heavy rain event using observed data and a numerical model. Section Analyzed Data and Numerical Model Description describes the observed data and numerical model. Section Water Temperature Variation During and After the Heavy Rain Event presents the data analysis. Section Numerical Experiments shows the results of the numerical model for both a heavy-rain case (RC) and a no-rain case (NRC). Section Discussion discusses the results, and Section Summary summarizes the findings.
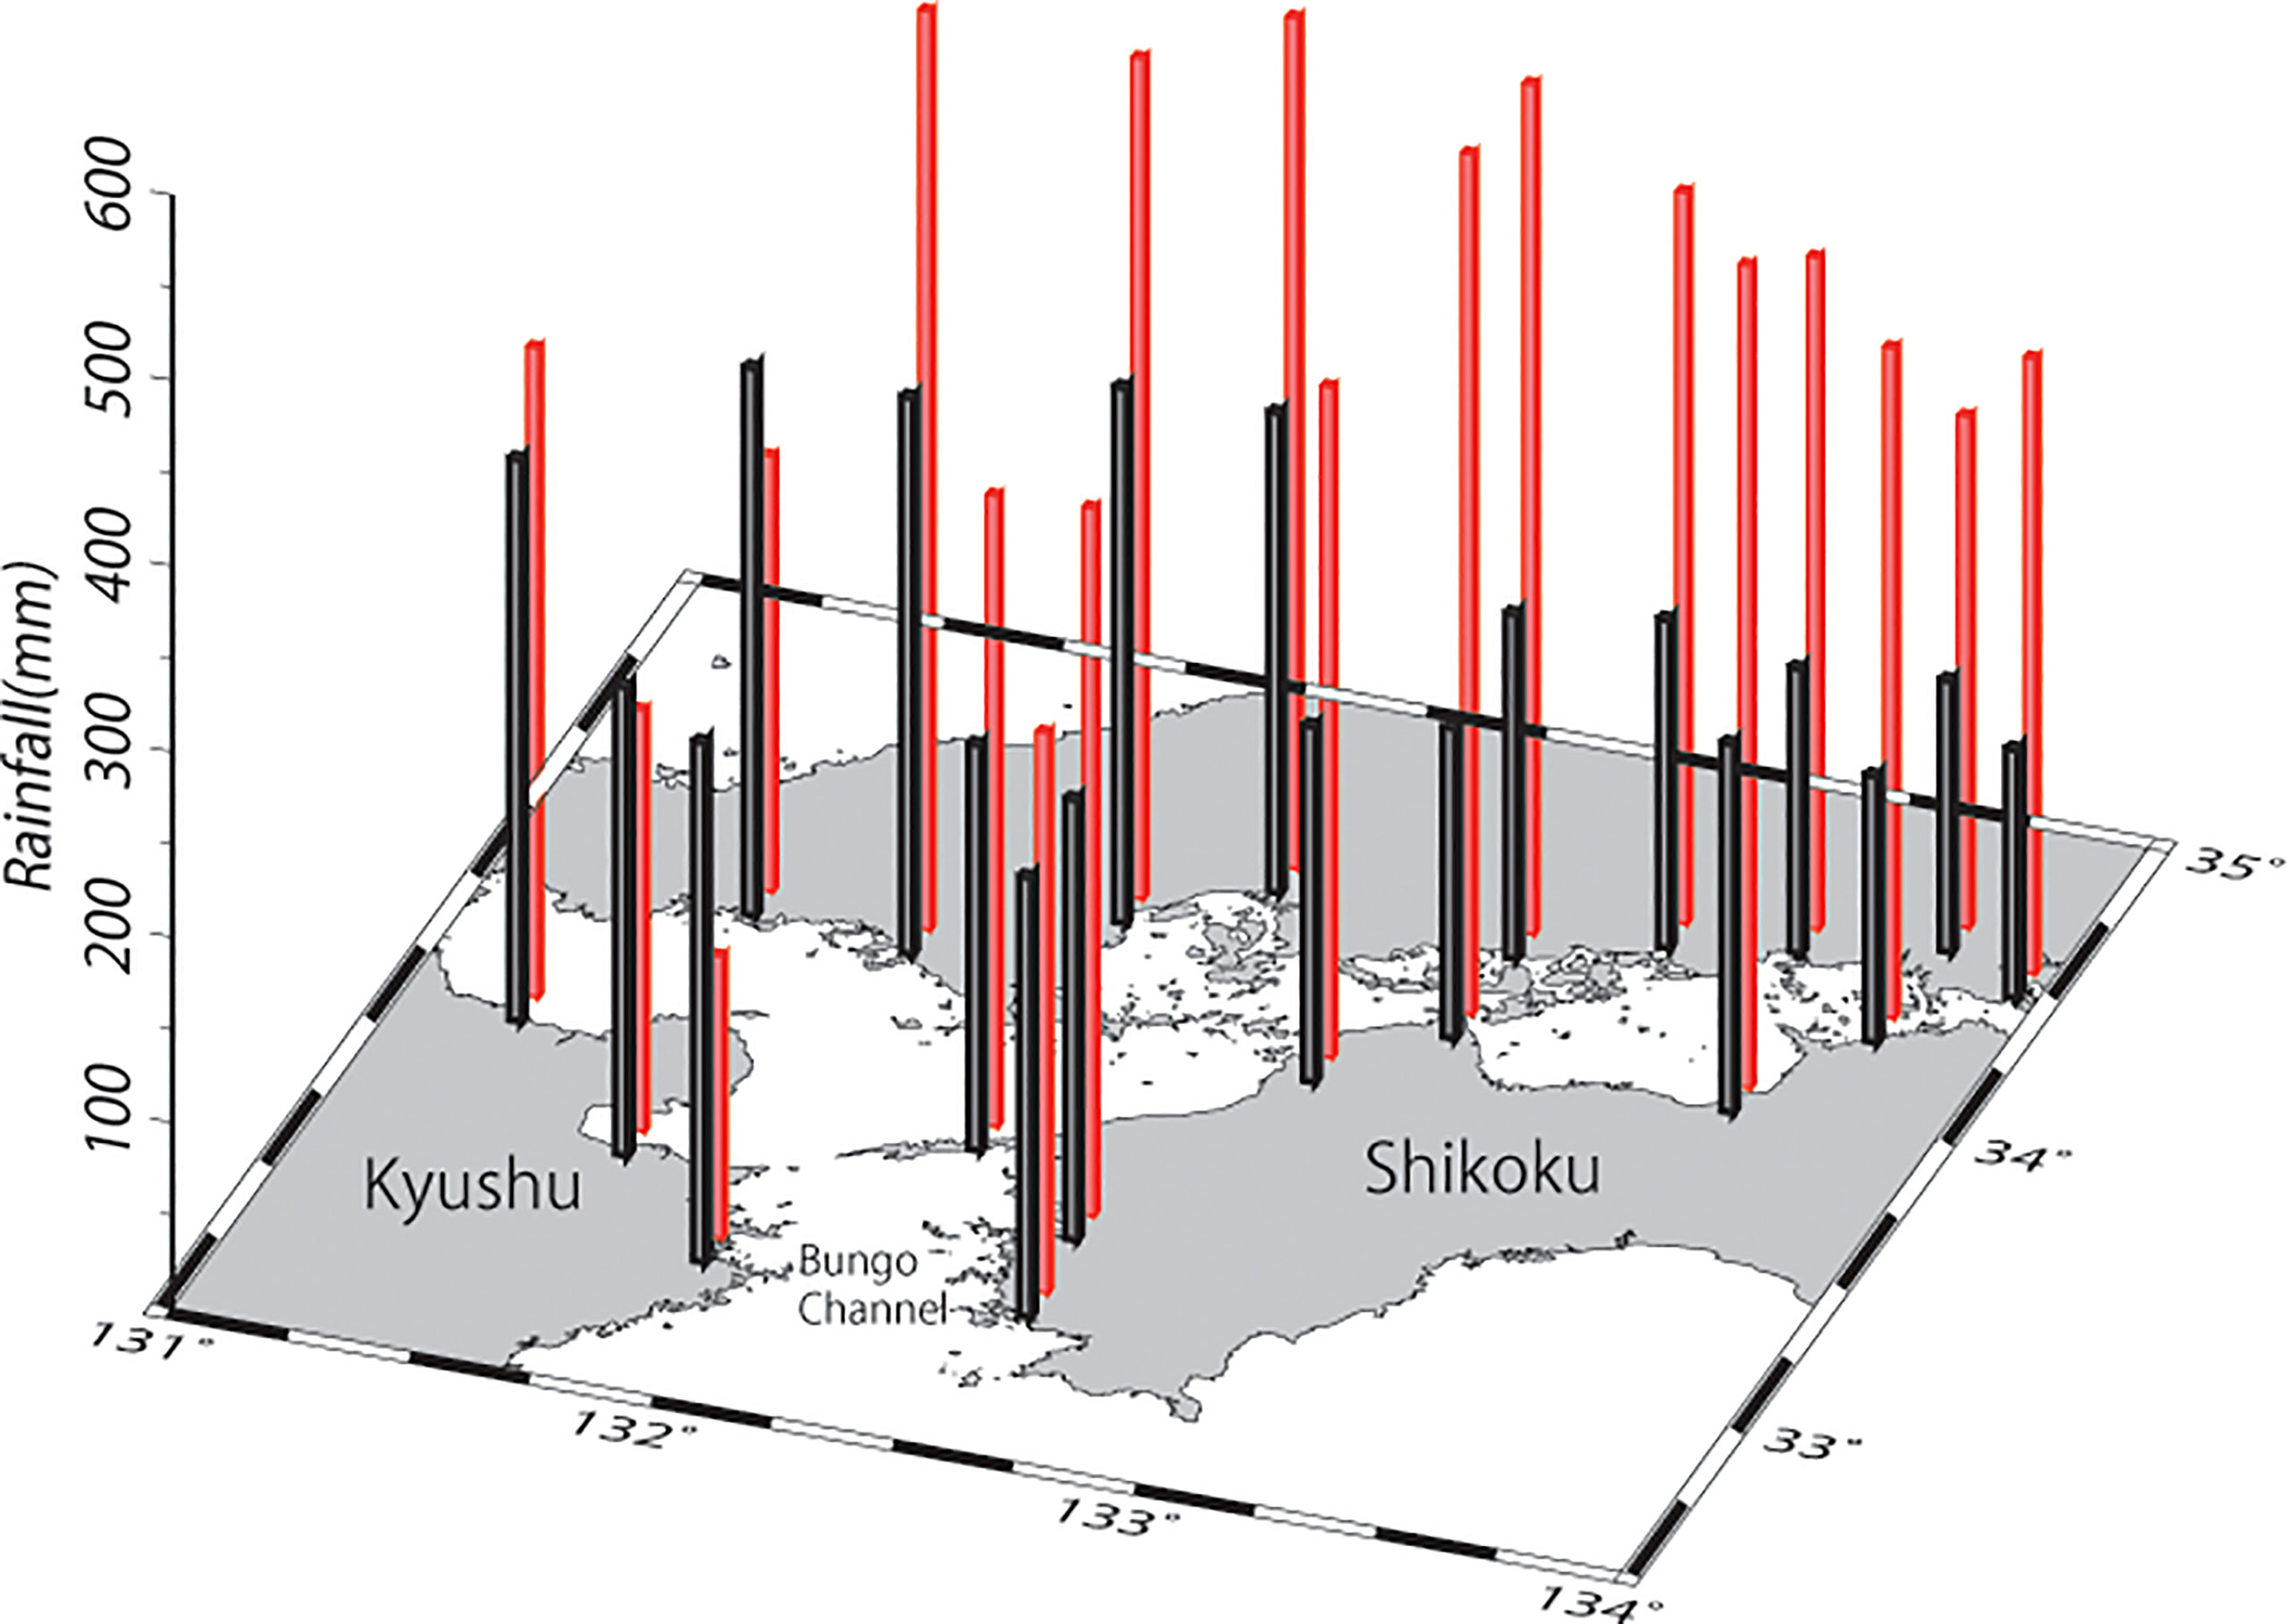
Figure 2 Integrated precipitation for July 5–8, 2018 (red bars) and monthly integrated precipitation in July of a normal year (black bars) around the Seto Inland Sea.
Water temperature was measured from the surface to bottom at two stations on the eastern coast of the Bungo Channel (Figure 1B). Water temperature at 1, 5, 10, 20, 30, and 40 m depth was measured every hour at Station K by using a thermistor-chain (Nichiyu Co., Ltd.) with an accuracy of ±0.1°C and at 5, 20, 30, 40, and 55 m depth at Station M every 10 min by using water temperature meters (JFE advantec Co., Ltd.) with an accuracy of ±0.02°C. The tide killer filter (Hanawa and Mitsudera, 1985) was applied to the water temperature data to remove high-frequency signals associated with tidal variation. The tide killer filter can eliminate the signals with less than 48-hour variability. We used the Level 3 hourly sea surface temperature (SST) data of the Himawari-8 geostationary meteorological satellite obtained from the Japan Aerospace Exploration Agency. The Himawari-8 SST data have a spatial resolution of 2 km. We used only the night-time SST data to remove outlying values. The Fisheries Research Centers of Ehime and Oita Prefectures conducted hydrographic observations from research vessels just after the heavy rain event. Both Fisheries Research Centers measured vertical profiles of water temperature and salinity at 51 stations using CTD (JFE Advantec Co., Ltd.) with an accuracy of ±0.01°C for water temperature and ±0.01 mS cm-1 for conductivity (Figure 1B). Oita Prefecture covered the western side of the Bungo Channel from July 10 to 12, and Ehime Prefecture covered the eastern side from July 11 to 13. We used nutrient data observed on a transect in the southern part of the Bungo Channel in July from 1994 to 2005. Nitrate, nitrite, ammonium, phosphate, and silicate were analyzed by an auto-analyzer (TRAACS 800, Bran Luebbe Co., Ltd.).
The three-dimensional, sigma-coordinate numerical model used here is the model that Chang et al. (2009) developed based on the Princeton Ocean Model (Blumberg and Mellor, 1987). The horizontal and vertical mixing coefficients are calculated using the Smagorinsky (1963) formulation and Mellor and Yamada (1982) turbulent closure scheme, respectively. The model calculation domain is from 129.9875°E to 136.0125°E and 28.125°N to 34.8083°N (Figure 1A); it has a horizontal resolution of approximately 1 km (1/120° in the meridional and 1/80° in the zonal direction) and 31 vertical layers. The bottom topography was prepared using Japan Oceanographic Data Center and ETOPO1 datasets. The minimum water depth in the model was set to 5 m. Open boundary conditions for water temperature, salinity, and current velocity were applied from the Japan Coastal Ocean Experiment 2 reanalysis data (Miyazawa et al., 2009). The model considered tidal constituents (M2, S2, O1, and K1) and applied sea level variation from the harmonic constants of tide model NAO.99b (Matsumoto et al., 2000) at the open boundaries. Heat flux and wind stress every 6 h calculated by the Grid Point Value of Mesoscale Model (GPV-MSM) of the Japan Meteorological Agency were applied at the sea surface. Precipitation calculated using GPV-MSM was applied at the sea surface, except during the heavy rain event in July 2018. Precipitation data observed by meteorological radar were applied at the sea surface before and during the heavy rain event (from June 25 to July 10, 2018) because the distribution and intensity of rainfall calculated by GPV-MSM differed from observations around the northern part of the Bungo Channel. The model considered 37 rivers and obtained river discharge data from the Ministry of Land, Infrastructure, Transport and Tourism database. The model was integrated from January 1, 2015 to September 15, 2018.
The daily precipitation at Uwa, on the northeastern coast of the Bungo Channel, from July 5 to 8, 2018 was 70.5, 178.0, 229.0, and 62.0 mm, respectively. There was no precipitation from July 9 to 20. Therefore, we define the period of the heavy rain event studied as July 5 to 8. Figure 2 shows the integrated precipitation during the heavy rain event. The averaged integrated precipitation on the eastern coast during the heavy rain event was 409.8 mm. Since there are no large rivers in the Bungo Channel, the main supply of freshwater from rivers to Iyo-Nada was from the Hijikawa River, and that to Beppu Bay was from the Oita and Ohno Rivers (Figure 1B). Those river basins have areas almost equal to the area of the Bungo Channel. Precipitation over the Bungo Channel during the heavy rain event might account for a large portion of the freshwater in the sea.
Figure 3 shows the temporal variation in water temperature at Stations K and M (see Figure 1B) from July 5 to 15. The water temperature at 5 m depth decreased from July 11 at Station K and from July 13 at Station M. This water temperature decrease started 3 or 5 days after the heavy rain event, with decreases of 3.53°C and 1.48°C at Stations K and M, respectively. The water temperature at 40 m depth at Station K started decreasing during the heavy rain event on July 7 and reached a minimum on July 15, with a total decrease of 5.18°C. The water temperature at 40 m depth at Station M started decreasing before the heavy rain event on July 5 and reached a minimum on July 9, with a total decrease of 4.42°C. In both stations, the water temperature decrease started in the lower layer and then the decrease propagated to the upper layers. The fact suggests that water mass with lower temperature intruded into the small bays where water temperature monitored through bottom layer. To examine the horizontal distribution of the water temperature decrease at the sea surface after the heavy rain event, we calculated the difference in the satellite SST between July 10 and 15 (Figure 4). The water temperature decreased in the northern part, along the west coast, and in the middle of the east coast of the Bungo Channel, where the topography is relatively complex with islands and small peninsulas. By contrast, SST increased in the central and northeastern parts of the Bungo Channel. Figure 5 shows north–south cross-sections of water temperature and salinity on July 11 and 12 observed by Ehime and Oita Prefectural Fisheries Research Centers in the central part of the Bungo Channel. The water mass was mixed in the north and stratified in the south. Low-salinity water (< 32.2 psu) was seen from Stations o35 to o13, with a high-temperature water mass from o13 to o22 in the surface layer. In the bottom layer, the water from the shelf slope to Station o6 in the northern part of the Bungo Channel was cooler than 19°C and had a salinity > 34.0 psu. The distribution of the water mass in the surface and bottom layers suggests that low-salinity water flows out from the Bungo Channel in the surface layer and below, while saline water enters the Bungo Channel from the shelf slope in the bottom layer, via bottom intrusion. Figure 6 shows the horizontal distribution of surface salinity from July 10 to 13 according to both the Ehime and Oita Fisheries Research Centers. There was low-salinity water (< 30 psu) north of the Hayasui Strait, with a salinity front there. The low-salinity water might have come from Beppu Bay, to which two large rivers supply freshwater. More low-salinity water was present in the northeastern part of the Bungo Channel. This might have been caused by the heavy rainfall over the sea and freshwater from two small rivers. High-salinity water (> 33.8 psu) was present in the southern part of the Bungo Channel.
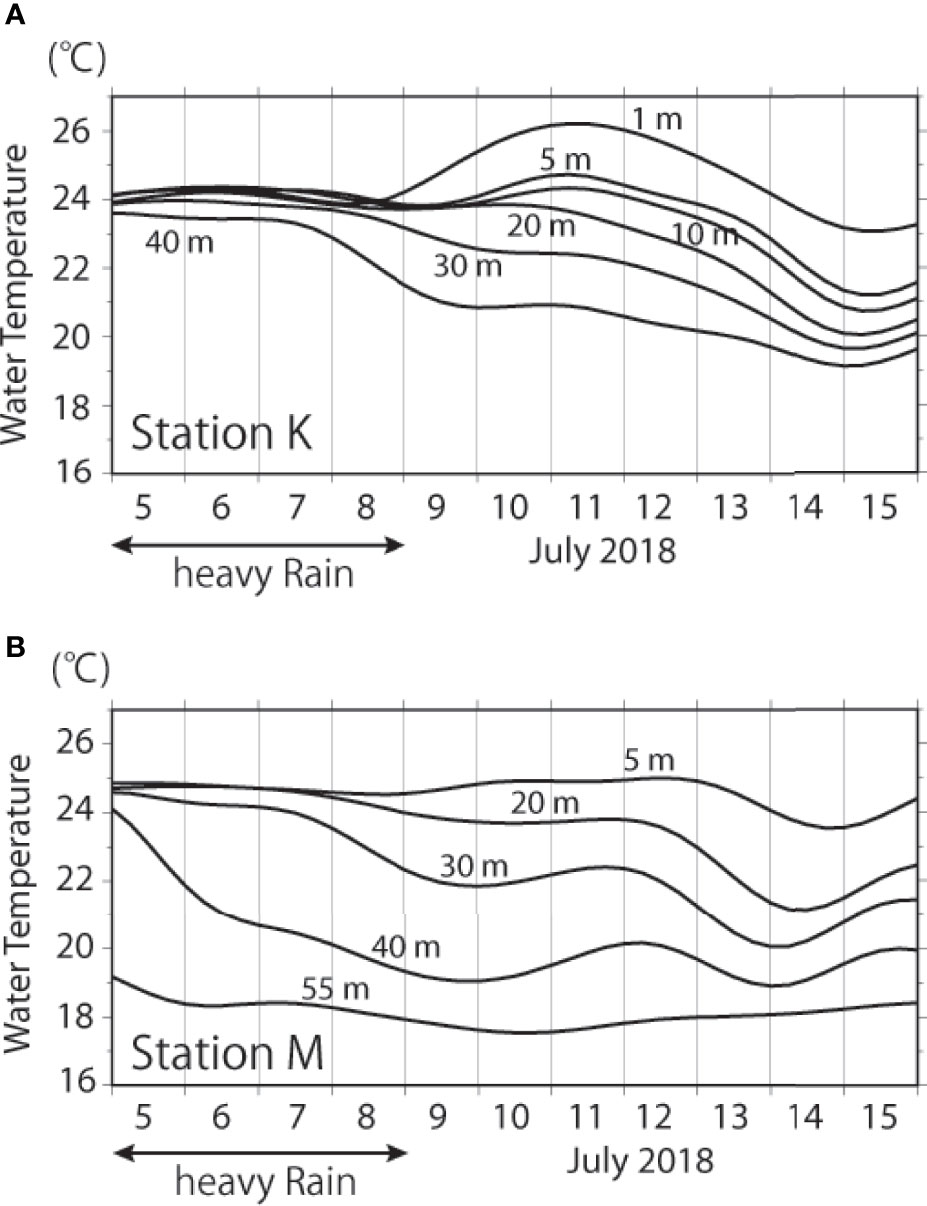
Figure 3 Temporal variation in water temperature from July 5 to 15 (A) at 1, 5, 10, 20, 30, and 40 m depth at Station K and (B) 5, 20, 30, 40, and 55 m depth at Station M.
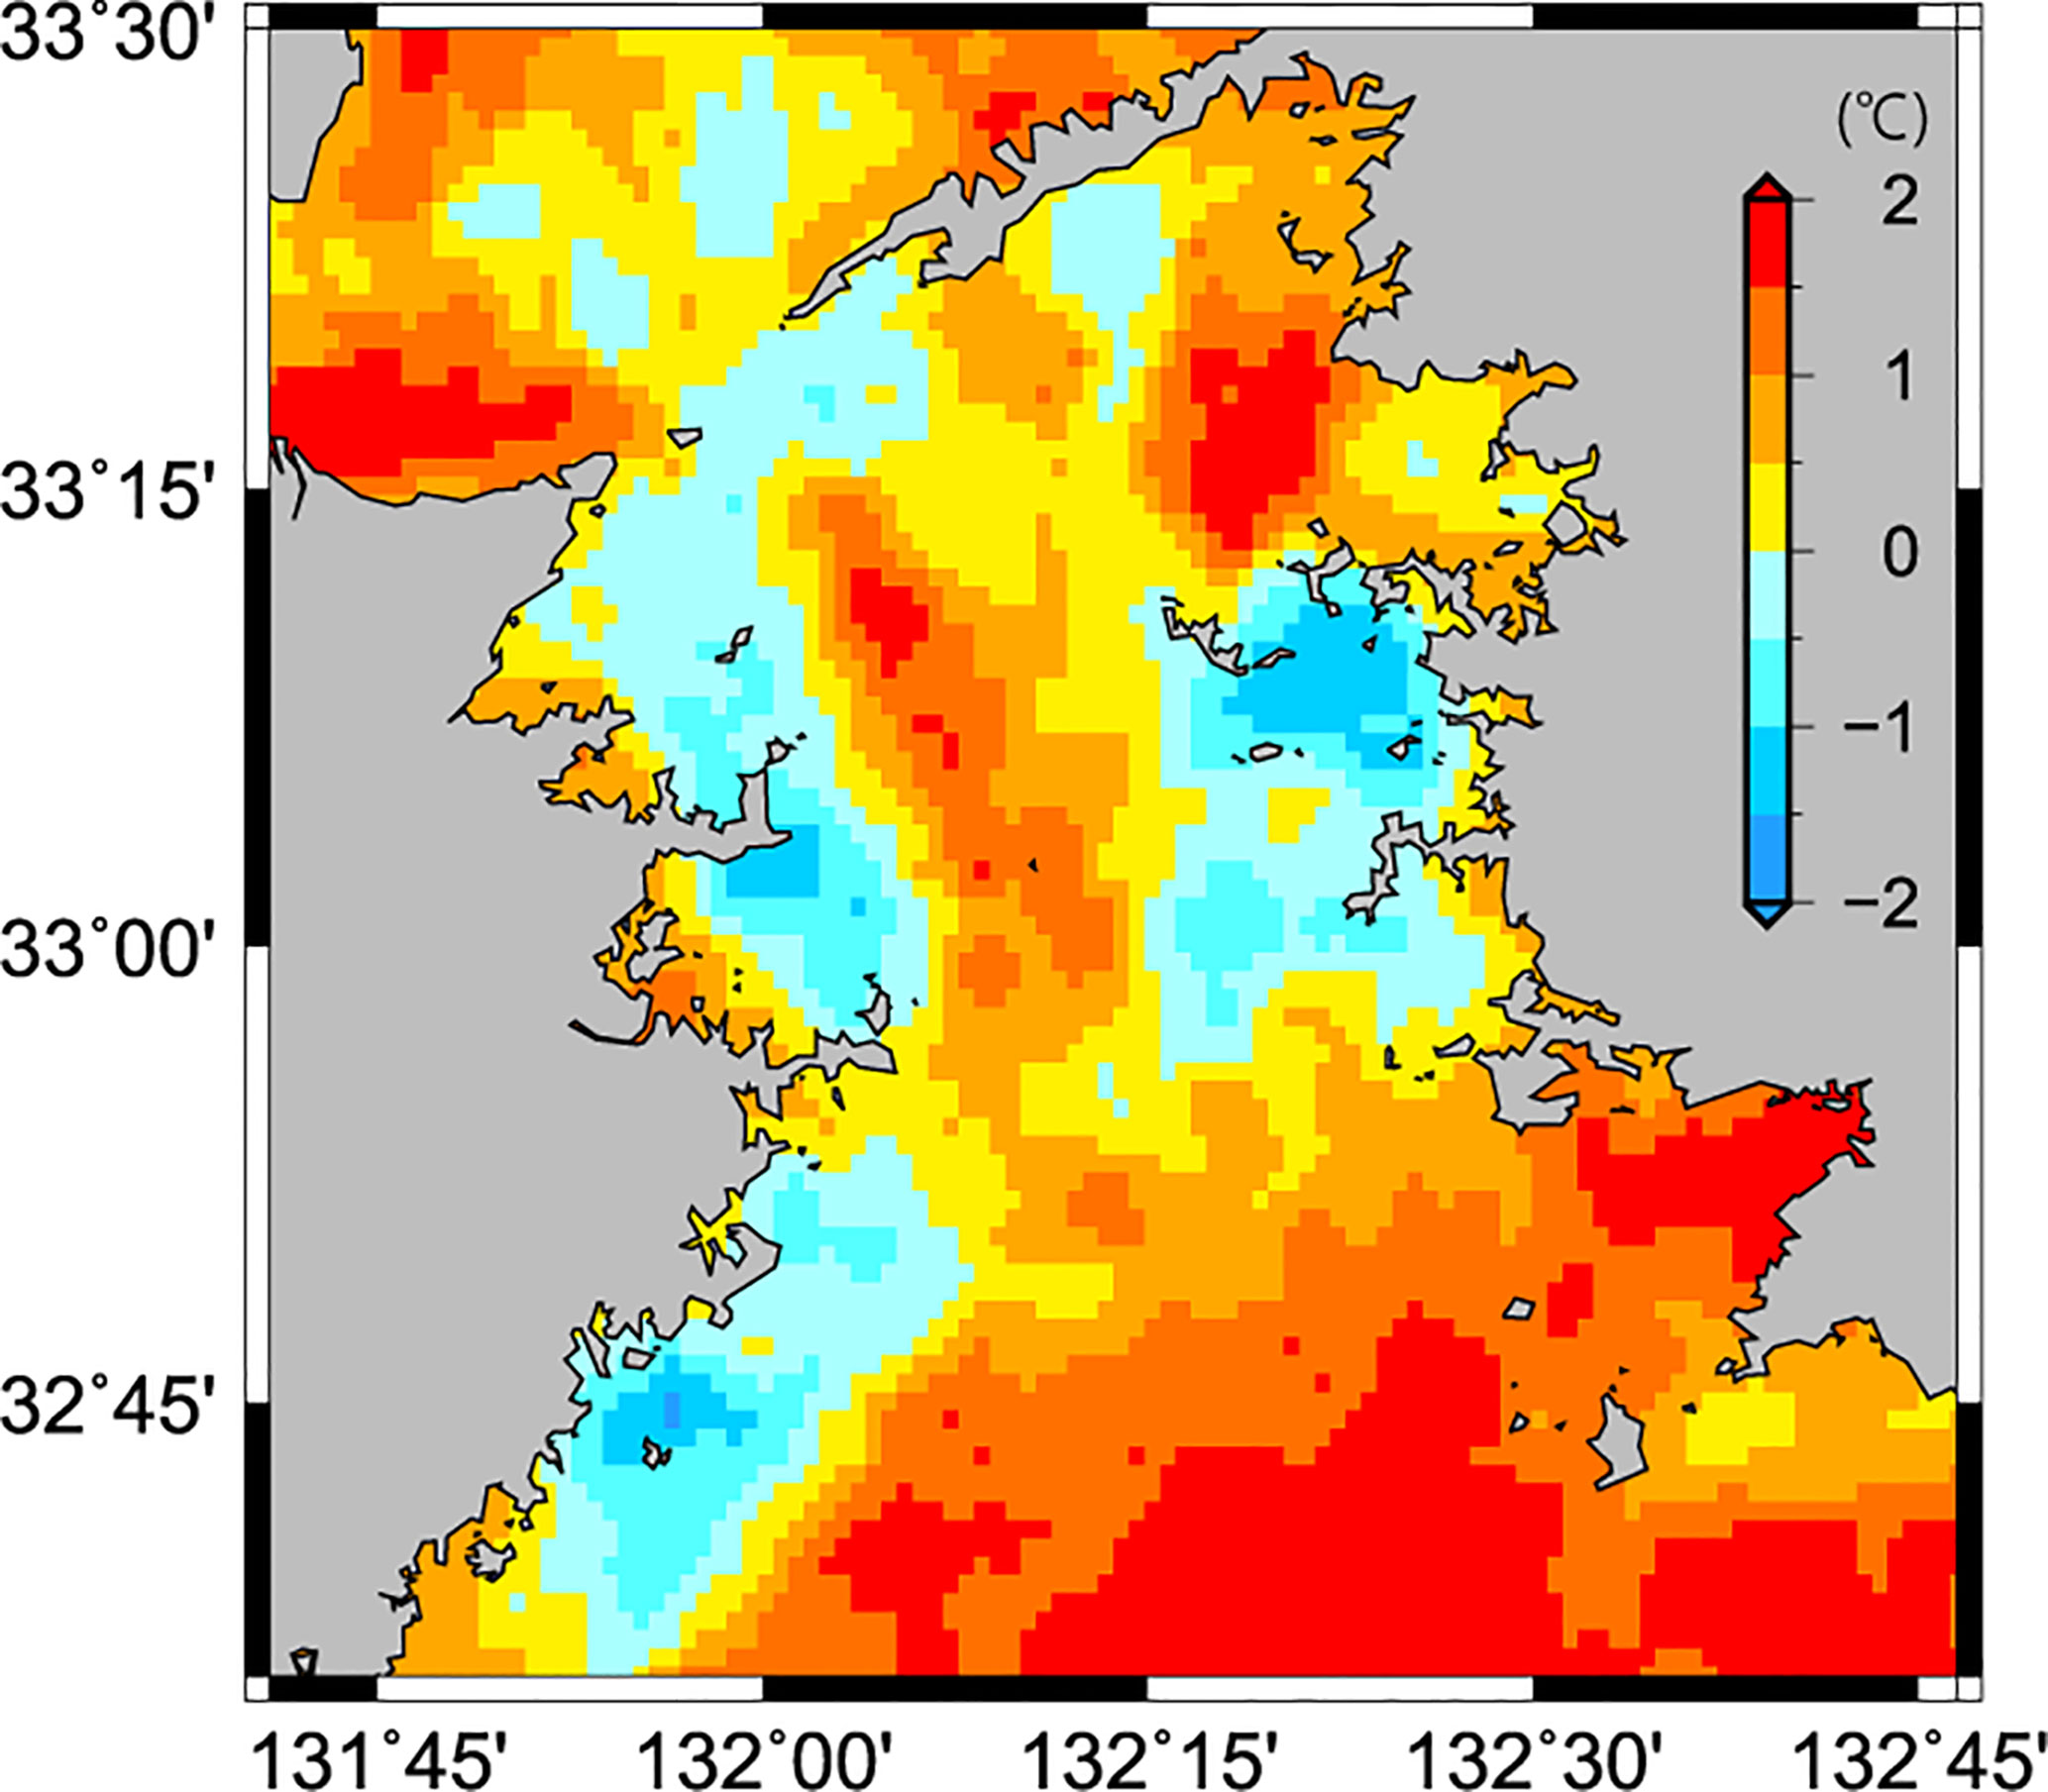
Figure 4 Sea surface temperature (SST) difference between July 10 and 15. Negative values denote a water temperature decrease from July 10.
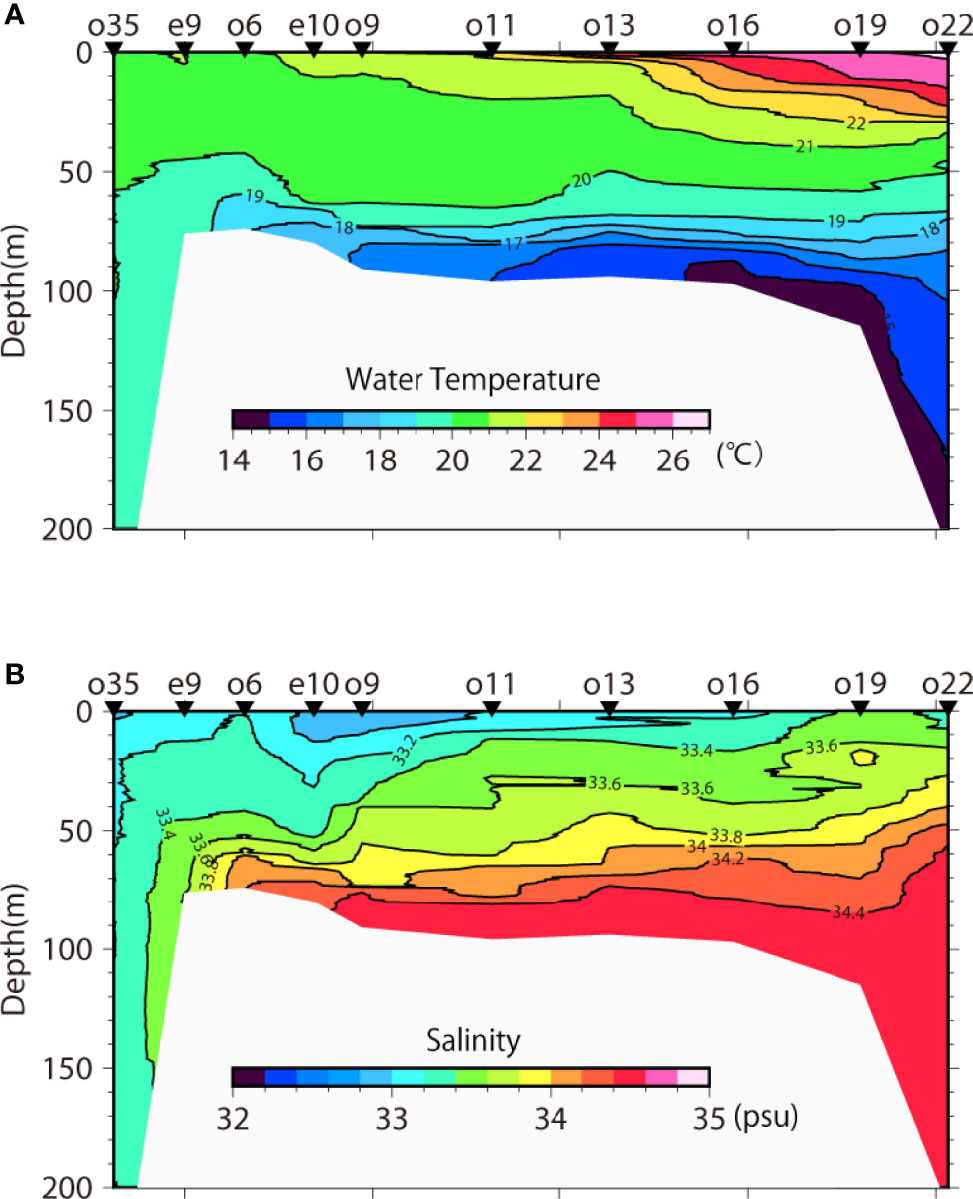
Figure 5 Observed north–south cross-sections of (A) water temperature and (B) salinity from July 11 to 12 at the stations shown as green dots in Figure 1B.
The data analysis indicated that the bottom intrusion in the southern part of the Bungo Channel occurred before the heavy rain event, and a cooler water mass moved northward in the bottom layer. This was shown by the temporal variation in the water temperature at Stations M and K (Figure 3). The cooler water mass reached the northern part of the Bungo Channel 3–4 days after the heavy rain event (Figure 5). The SST near regions with complex topography decreased on July 15, 7 days after the heavy rain event (Figure 4). The water column might be mixed vertically by the strong tidal current in narrow straits and around peninsulas because July 15 was a spring tide. Since a cooler water mass was present in the bottom layer due to the bottom intrusion, the strong vertical mixing of the spring tide might have lowered the SST on July 15. The occurrence of the bottom intrusion appeared to be independent of the heavy rain event. However, it is possible that the heavy rain event intensified the bottom intrusion by supplying low-salinity water (causing buoyancy) in the northern part of the Bungo Channel (Figure 6), which resulted in a large north–south horizontal density gradient, which might have enhanced gravitational circulation: low-salinity water (low water density) in the northern part of the Bungo Channel flows to southward in the surface layer, while dense water around shelf slope flows to northward in the bottom layer. Hereafter, we describe this current pattern (Southward flow in the surface layer and northward flow in the bottom layer) as “gravitational circulation”. The distribution of lower-salinity water implies a southward current in the upper layer (Figure 6). Considering mass conservation, the northward current in the lower layer should be intensified. As a result, the bottom intrusion would be enhanced.
To confirm our hypothesis and understand how the heavy rain event influenced the cross-shelf material exchange, we conducted two sets of numerical experiments using a three-dimensional physical model. One experiment applied realistic river discharges, precipitation, wind forcing, and heat flux (RC), and the other had no river discharge or precipitation during or after the heavy rain event (NRC), while the other conditions were the same as those in the RC. In the NRC, river discharge and precipitation from July 1 to 15 were set to zero.
We tried to reproduce the water temperature and salinity distributions in the Bungo Channel just after the heavy rain event (RC). Figure 7 shows the north–south cross-sections (see Figure 1B) of water temperature and salinity calculated by the numerical model. For comparison, calculated values were compared with observations at the same time and location to plot the cross-section. Compared with Figure 5, the model reproduced the vertical mixing in the northern part, warm surface layer in the southern part, and intrusion of a cooler high-salinity water mass in the bottom layer. However, the bottom cold water was thicker than observed, and the mixed layer in the upper layer was thinner than observed. Although there were some differences, the overall features of the north–south structure were reproduced. Figure 8 shows the calculated horizontal distribution of surface salinity where calculated values used only at observation points shown in Figure 1B. Although the distribution of the low-salinity water around the Hayasui Strait is a little different from the observations, and the salinity in the northeastern part of the Bungo Channel is a little higher (Figure 6), the model reproduced the surface salinity distribution well. Since we demonstrated the reproducibility of the model, the NRC was examined using the same parameters and boundary conditions as those for the RC, except for river discharge and precipitation from July 1 to 15.
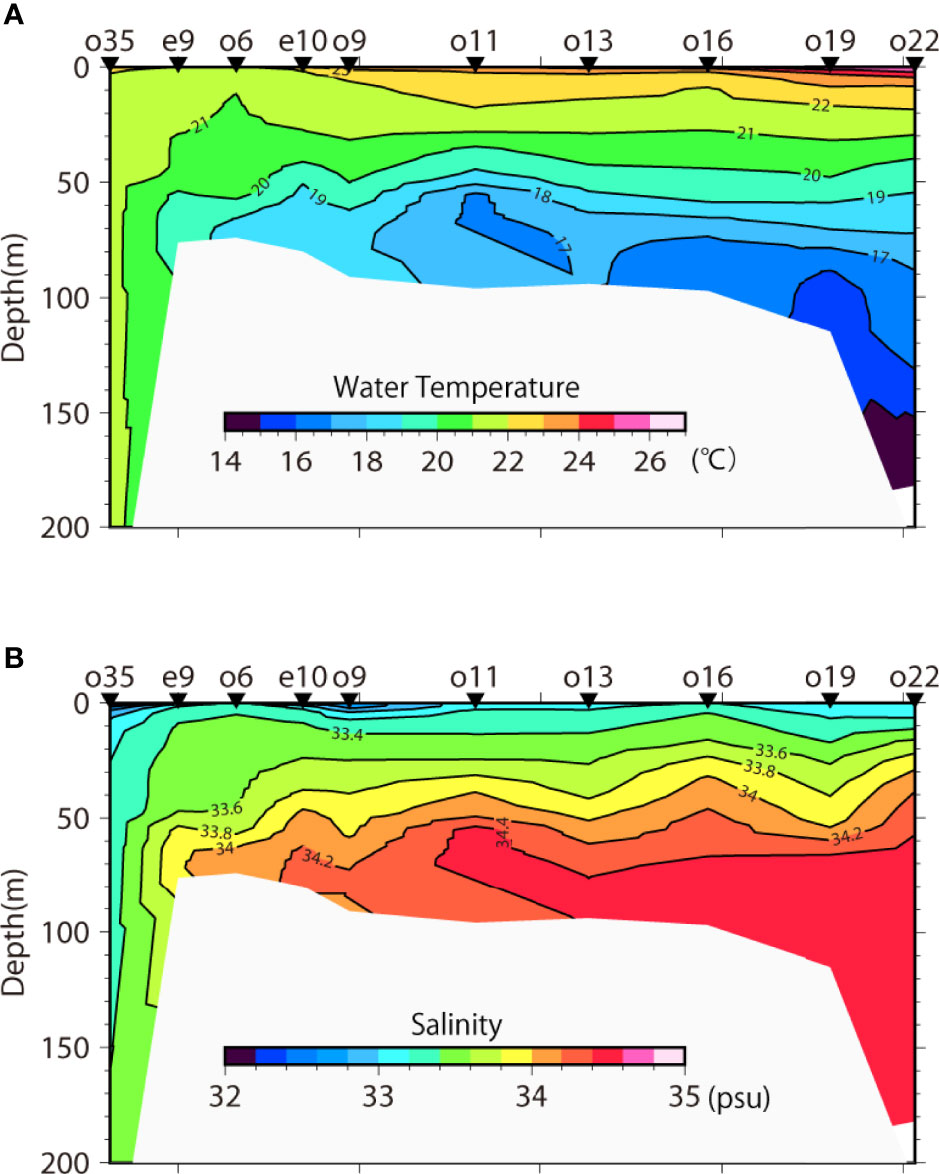
Figure 7 North–south cross-sections of (A) water temperature and (B) salinity calculated using the numerical model. Calculated values used in these figures are compared with the observations at the same location and time from Figure 5.
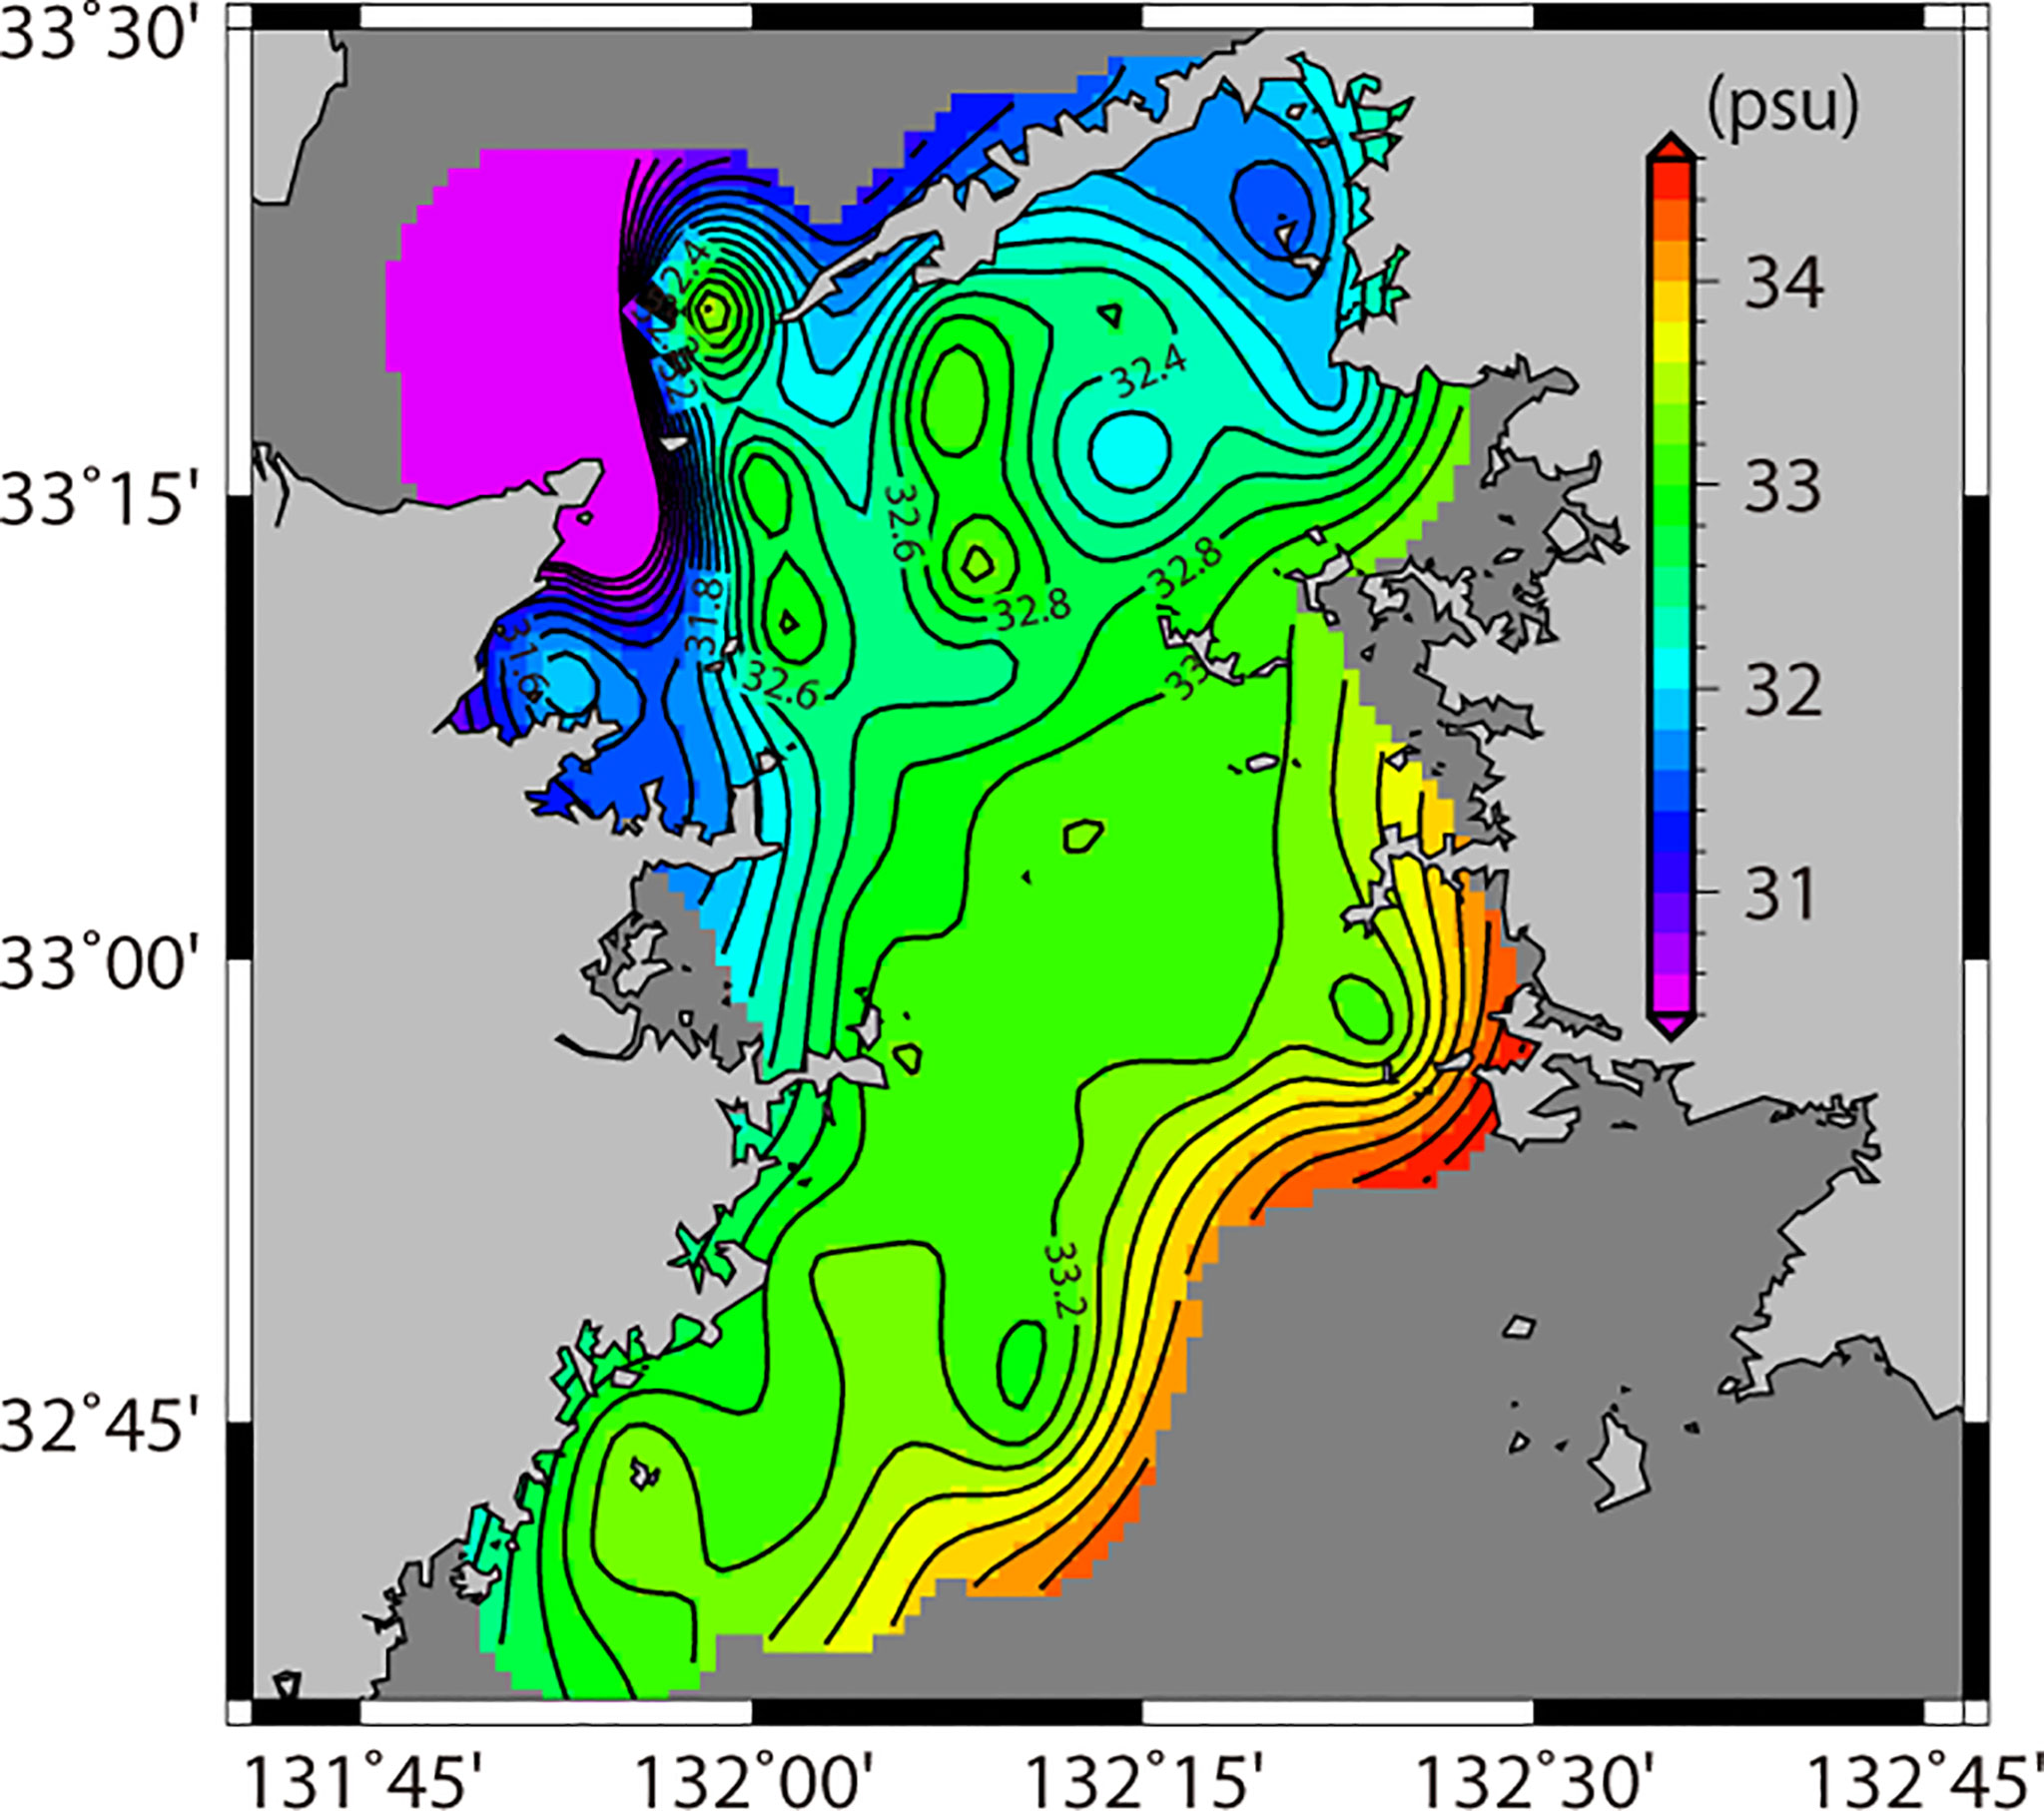
Figure 8 Horizontal distribution of sea surface salinity calculated by the numerical model for the observations at the same location and time as those in Figure 6.
We compared the results of the RC and NRC to determine the influence of the heavy rain event in early July 2018 on the intensity of a bottom intrusion and cross-shelf exchange for 2 months. Figure 9 shows the temporal variation in the surface salinity of RC and NRC in the Hayasui Strait from July 1 to August 31, 2018. The variation was smaller in the NRC than in the RC; the surface salinity decreased drastically from 33.8 psu on July 5 to 33.0 on July 10 because of the heavy rain event. Subsequently, the salinity increased slightly on July 12 and stayed essentially constant until July 22, before decreasing suddenly by 0.6 psu due to the horizontal advection of lower salinity water originating from fresh water discharged from rivers inside the Seto Inland Sea during the heavy rain event. Since a southerly wind blew after the heavy rain event, the freshwater discharged from the Hijikawa River was transported northward and then advected to the Hayasui Strait by a surface residual current (not shown in figure). The salinity in the Hayasui Strait was much lower in RC than in NRC until the end of August. This suggests that the north–south horizontal density gradient of RC is much larger than that of NRC, and that the gravitational circulation of RC is stronger than that of NRC. As a result, the bottom intrusion is more intense in RC than in NRC.
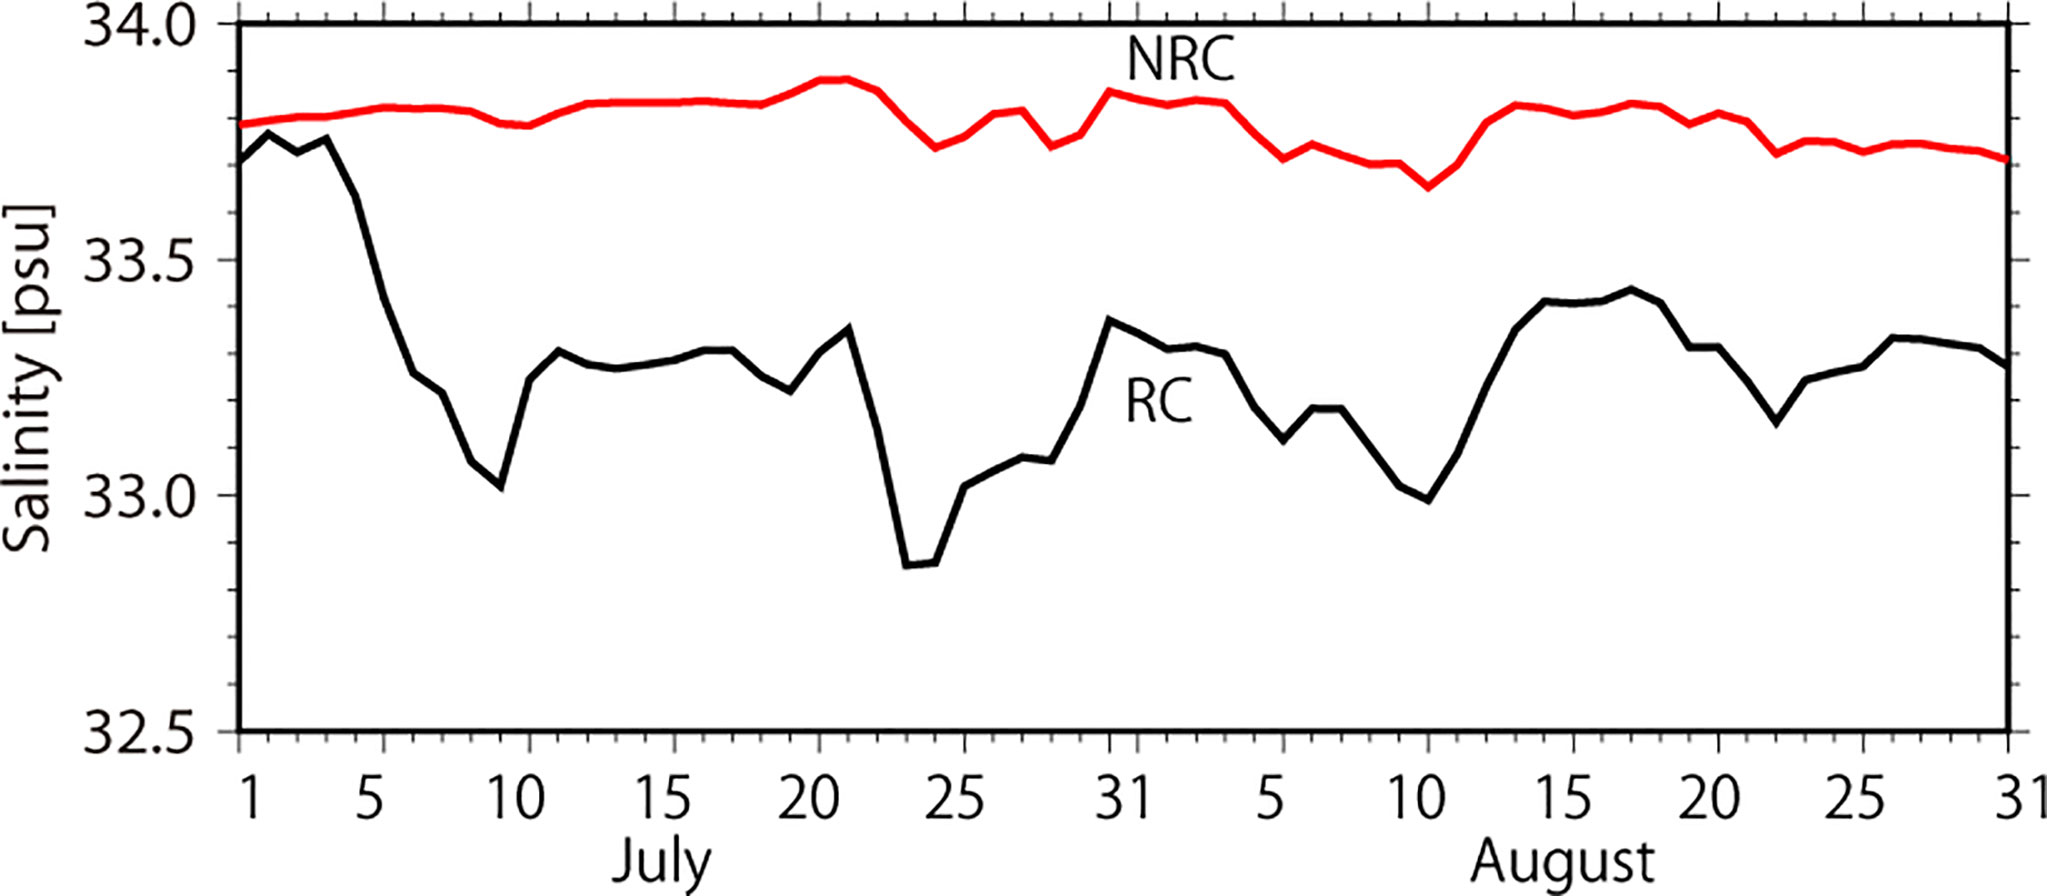
Figure 9 Temporal variation in the calculated sea surface salinity at the Hayasui Strait in the northern Bungo Channel from July 1 to August 31. Black and red lines show the variation in the rain (RC) and no-rain (NRC) cases, respectively.
Figure 10A shows the temporal variation in water temperature below 50 m depth in RC and NRC averaged in an area, shown in Figure 1B as a black square. Based on cross-sections of water temperature and salinity shown in Figures 5 and 7, we define below 50 m depth as bottom layer and above 50 m depth as surface layer. Both RC and NRC showed similar variations. The water temperature decreased on July 4–8, July 22–29, August 1–6, and August 12–21. The decreases during July 4–8 and August 1–6 were sudden. The temporal variation in water temperature below 50 m in RC and NRC was the same until July 12. Subsequently, the water temperature was lower in RC than in NRC, with especially large differences from July 14 to August 2 and from August 17 to 21 (Figure 10A). The volume transports in the surface layer Vs (above 50 m depth) and the bottom layer Vb (below 50 m depth) at 32.92°N (southern boundary of the black square shown in Figure 1B) in RC and NRC were calculated by following equations (Figure 10B).
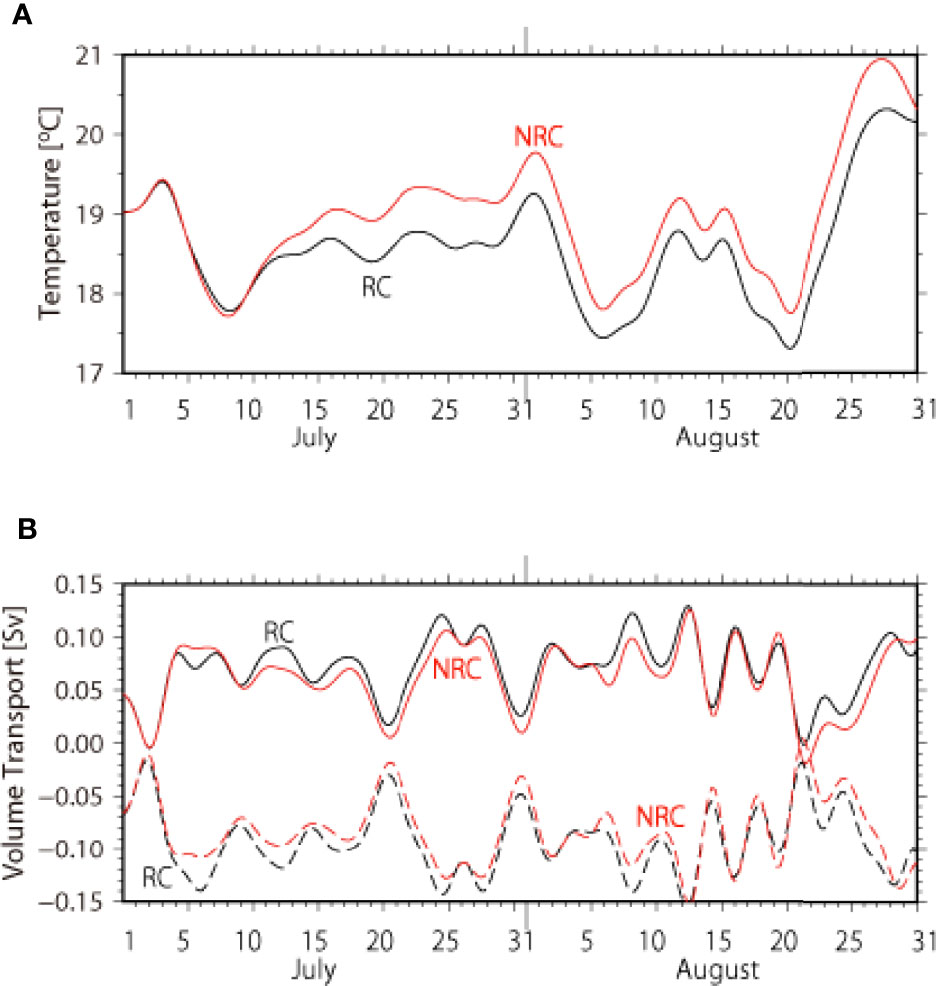
Figure 10 Temporal variation in the (A) calculated water temperature below 50 m depth averaged in the control volume shown in Figure 1B as a black square, and (B) calculated volume transports above 50 m depth and below 50 m depth across 32.92°N. Black and red lines show the variation in the rain (RC) and no-rain (NRC) cases, respectively.
where v is north-southward component of current velocity at 32.92°N, and Aupper and Alower are section area of surface layer and bottom layer, respectively. Here, positive values mean northward transport. The volume transport at both bottom and surface layers in RC and NRC at 32.92°N showed similar variability for 2 months (Figure 10B). The volume transport was mostly positive in the bottom layer and negative in the surface layer, i.e., water was transported from the Pacific Ocean to the Bungo Channel in the bottom layer and from the Bungo Channel to the Pacific Ocean in the surface layer. In both RC and NRC, the volume transport variation across 32.92°N were similar until July 12 in both layers, after which the volume transport tended to be larger in RC. The average volume transports in the surface and bottom layers for 2 months were -0.956 Sv for RC and -0.813 Sv for NRC, and 0.738 Sv for RC and 0.628 Sv for NRC, respectively, being 17.5% larger in RC. When the water temperature decreased, the northward volume transport in the bottom layer across 32.92°N also increased suddenly, except during August 12–21 (Figure 10B). This suggests that a cooler water mass was transported from the shelf region, and that at least three bottom intrusions occurred over the 2 months. Except in early July, the volume transport during the bottom intrusions were larger in RC than in NRC and the water temperature in the bottom layer was lower in RC than in NRC. The bottom intrusion in RC supplied more water from the shelf slope to the Bungo Channel.
The larger volume of transport at 32.92°N in RC suggests that the heavy rain event in early July enhanced the gravitational circulation in the Bungo Channel for at least 2 months. In order to compare intensity of gravitational circulation between RC and NRC, we calculated water budget in a control volume shown in Figures 1B, 11A shows averaged water budget from July 1 to August 31. Southward volume transport (Bungo Channel to the Pacific Ocean) in the surface layer at northern and southern boundaries in RC is larger than that in NRC, and northward volume transport in the bottom layer in RC is also larger than that in NRC. The result clearly indicates that the gravitational circulation in the Bungo Channel was intensified by the heavy rain event. Difference of water temperature in the bottom layer between RC and NRC appeared on July 12 and gradually increased its difference until July 16, and after that the difference became almost stable (Figure 10A). We examined averaged heat budget in bottom layer of the control volume shown in Figure 1B from July 14 to 16 to see the cause of water temperature difference between RC and NRC just after the heavy rain event (Figure 11B). Mean water temperature in the bottom layer of the control volume from July 14 to 16 in RC and NRC were 18.58°C and 18.86°C, respectively. Horizontal heat transports were northward in RC and NRC due to northward volume transport shown in Figure 11A. The horizontal heat transports at southern and northern boundary in RC were larger than those in NRC. This is because volume transport in RC is larger than that in NRC. Horizontal heat budgets in the control volume in RC and NRC were -1.41 TW and -1.14 TW, respectively. It is found that intensification of the gravitational circulation related to the heavy rain event supplied much cooler water mass into the bottom layer of the Bungo Channel from shelf edge region.
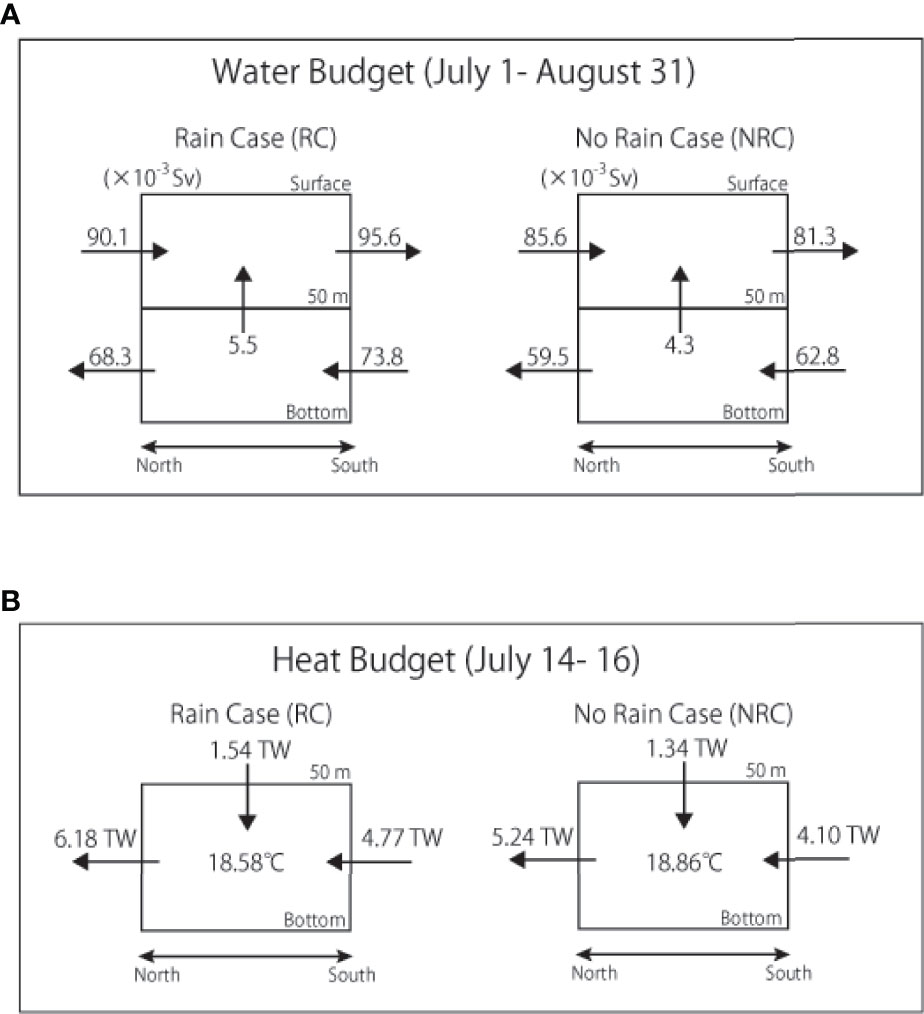
Figure 11 Budget in a control volume shown in Figure 1B as a black square. (A) Water budget from July 1 to August 31 in the control volume and numbers indicate volume transport. Unit is in 10-3 Sv. (B) Heat budget below 50 m depth in the control volume from July 14 to 16 and numbers on the arrows indicate heat transport with a unit in TW. Numbers in the boxes show average water temperature below 50 m depth from July 14 to 16.
We examined the decrease in surface water temperature after a heavy rain event in mid-July (Figure 3). Observations indicated that a cold water mass in the shelf slope region intruded into the bottom layer of the Bungo Channel when the heavy rain started. In the numerical experiment, the bottom intrusion in early July occurred at the same time and magnitude in both RC and NRC. This suggests that the heavy rain event did not influence the occurrence of the bottom intrusion in early July. However, the northward volume transport below 50 m depth across 32.92°N after July 11 was larger in RC than in NRC (Figure 10B), while the water temperature in the bottom layer of the control volume was lower in RC than in NRC (Figure 10A). Namely, the heavy rain event enhanced the shelf slope water mass supply to the bottom layer of the Bungo Channel. The water temperature in the surface layer decreased in the area with complex topography (Figure 4), and the minimum water temperature at 5 m depth occurred during a spring tide. It is thought that the surface water temperature decrease during the spring tide in mid-July was caused by strong tidal vertical mixing of cold water, which was supplied by the bottom intrusion. Therefore, the surface water temperature decrease in mid-July was not related to the heavy rain event in early July. However, since the cold water mass supply from the shelf slope region was larger in RC than in NRC, the heavy rain event might have influenced the magnitude of the surface water temperature decrease in mid-July.
The numerical experiments showed that the lower-salinity condition in the Hayasui Strait lasted until the end of August in RC, and bottom intrusions after mid-July in RC supplied much cold water to the bottom layer of the Bungo Channel compared with NRC. The lower density in the Bungo Channel due to the heavy rain event did not influence the occurrence of the bottom intrusion, because bottom intrusions occurred after mid-July in both RC and NRC. However, the bottom intrusion supplied more cold water in RC than in NRC; i.e., the heavy rain event in early July intensified the cross-shelf exchange between the Bungo Channel and Pacific Ocean for approximately 2 months (Figure 11A). This intensified cross-shelf exchange was thought to cause the following. Since the density in the Bungo Channel decreased for 2 months, the horizontal density gradient between the Bungo Channel and Pacific Ocean was larger. As a result, northward volume transport in the lower layer related to gravitational circulation increased, and bottom intrusions were intensified by the northward flow, and much cold water was supplied to the Bungo Channel.
Although the Bungo Channel faces the Pacific Ocean, the lower-salinity condition continued for 2 months. The heavy rain event in early July 2018 occurred over the entire Seto Inland Sea area (Figure 2), supplying an enormous volume of freshwater to the Seto Inland Sea as precipitation and river discharge. Since the density in the Seto Inland Sea in summer is lower than that in the Pacific Ocean, sea water in the Seto Inland Sea is transported to the Pacific Ocean (Chang et al., 2009). As the mean residence time of sea water in the Seto Inland Sea is 7.7 months (Takeoka, 1984), the freshwater supplied to the Seto Inland Sea by the heavy rain might gradually be transported to the Bungo Channel. In addition, the less saline water in the Seto Inland Sea is mixed by the strong tidal current in the narrow Hayasui Strait, located in the northern part of the Bungo Channel. Therefore, the lower-salinity condition lasted for 2 months for the one heavy rain event.
Recently, the numbers of heavy rain events and tropical cyclones approaching the south coast of Japan have increased (Yamaguchi and Maeda, 2020). The resulting increase in precipitation could decrease the water density (decrease salinity) in the Seto Inland Sea. The numerical experiments showed that the density decrease in the Bungo Channel did not trigger the bottom intrusion but did intensify the bottom intrusion. Increases in heavy rain and tropical cyclones around the Seto Inland Sea might enhance the transport of cold water from the shelf slope to the Bungo Channel, increasing the nutrient supply to the Bungo Channel. Figure 12A shows characteristics of water mass and dissolved inorganic nitrogen (DIN) concentration of the water mass in the southern part of the Bungo Channel in July. In the surface layer (low water density), salinity were lower and DIN were low as well. DIN concentration increased with water density below 24 σt. Therefore, enhancement of cold water transport from the shelf slope might supply much DIN to the Bungo Channel. In order to estimate DIN transport from shelf slope region, we calculated a liner empirical equation between water temperature and DIN concentration. Figure 12B shows the correlation between water temperature lower than 22°C and the DIN concentrations at five stations in the southern part of the Bungo Channel; the correlation coefficient was 0.89 and relation between water temperature T and DIN concentration was DIN=-1.47T+32.62. We calculated the DIN flux, NT, across 32.92°N using a following equation.
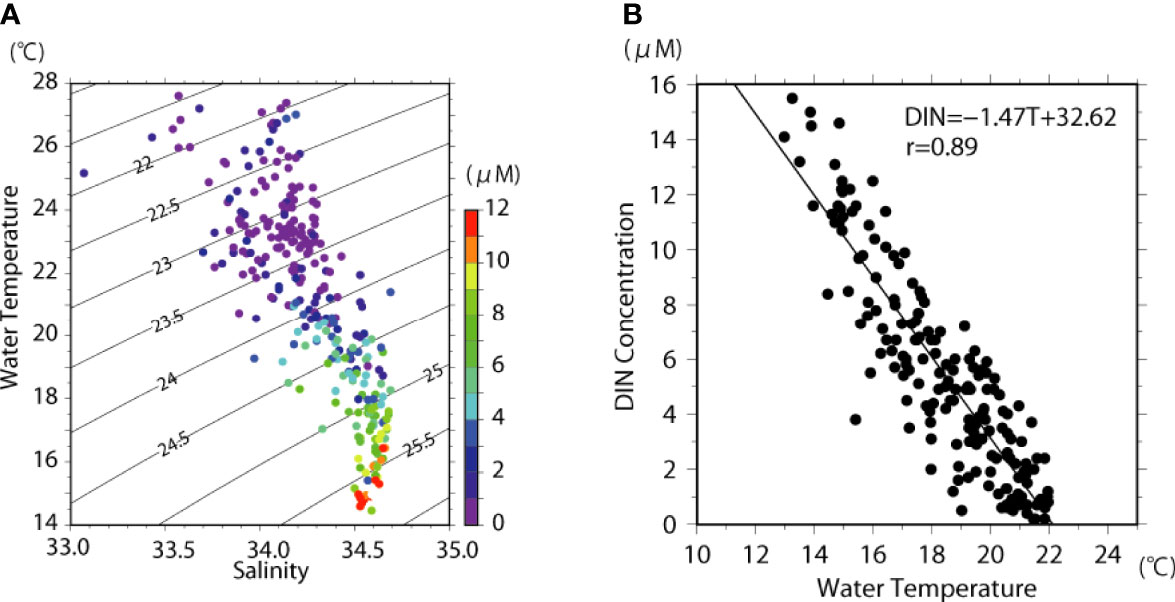
Figure 12 (A) T-S diagram with dissolved inorganic nitrogen (DIN) concentration observed in the southern part of the Bungo Channel. Observation points are shown as triangles in Figure 1B. (B) Scatterplot of water temperature and DIN observed in the southern part of the Bungo Channel. The line in the figure is the regression line.
where DIN is DIN concentration calculated from water temperature using above linear empirical equation, v is north-southward component of current velocity at 32.92°N, and A is section area of 32.92°N. Positive value of NT indicate northward DIN flux. The DIN flux shown in Figure 13 was positive, i.e., DIN is transported to the Bungo Channel from the Pacific Ocean. The DIN flux was higher when a bottom intrusion occurred. The 2-month DIN flux averaged 0.42 kmol s-1 in RC and 0.35 kmol s-1 in NRC, being 20% higher in RC. Since no large rivers enter the Bungo Channel, the increase in DIN flux related to an enhanced gravitational circulation would change primary productivity. Hayami et al. (2005) showed that the chlorophyll-a concentration was high when an intense bottom intrusion occurred. An increased nutrient supply to the Bungo Channel from the Pacific Ocean might affect nutrient conditions in the western part of the Seto Inland Sea, as more than 60% of the nutrients in the Seto Inland Sea originate from the Pacific Ocean (Yanagi and Ishii, 2004; Hayami et al., 2005). Gravitational circulations and bottom intrusions in the Bungo Channel are thought to be the main mechanisms supplying nutrients from the Pacific Ocean to the Seto Inland Sea. Therefore, intensification of the gravitational circulation in the Bungo Channel could affect the Bungo Channel and Seto Inland Sea ecosystems. The nutrient supply via rivers also increases with heavy rain events (Higashino and Stefan, 2014). The occurrence of heavy rain events near the Seto Inland Sea might increase the nutrient supply from both oceanic and terrestrial sources.
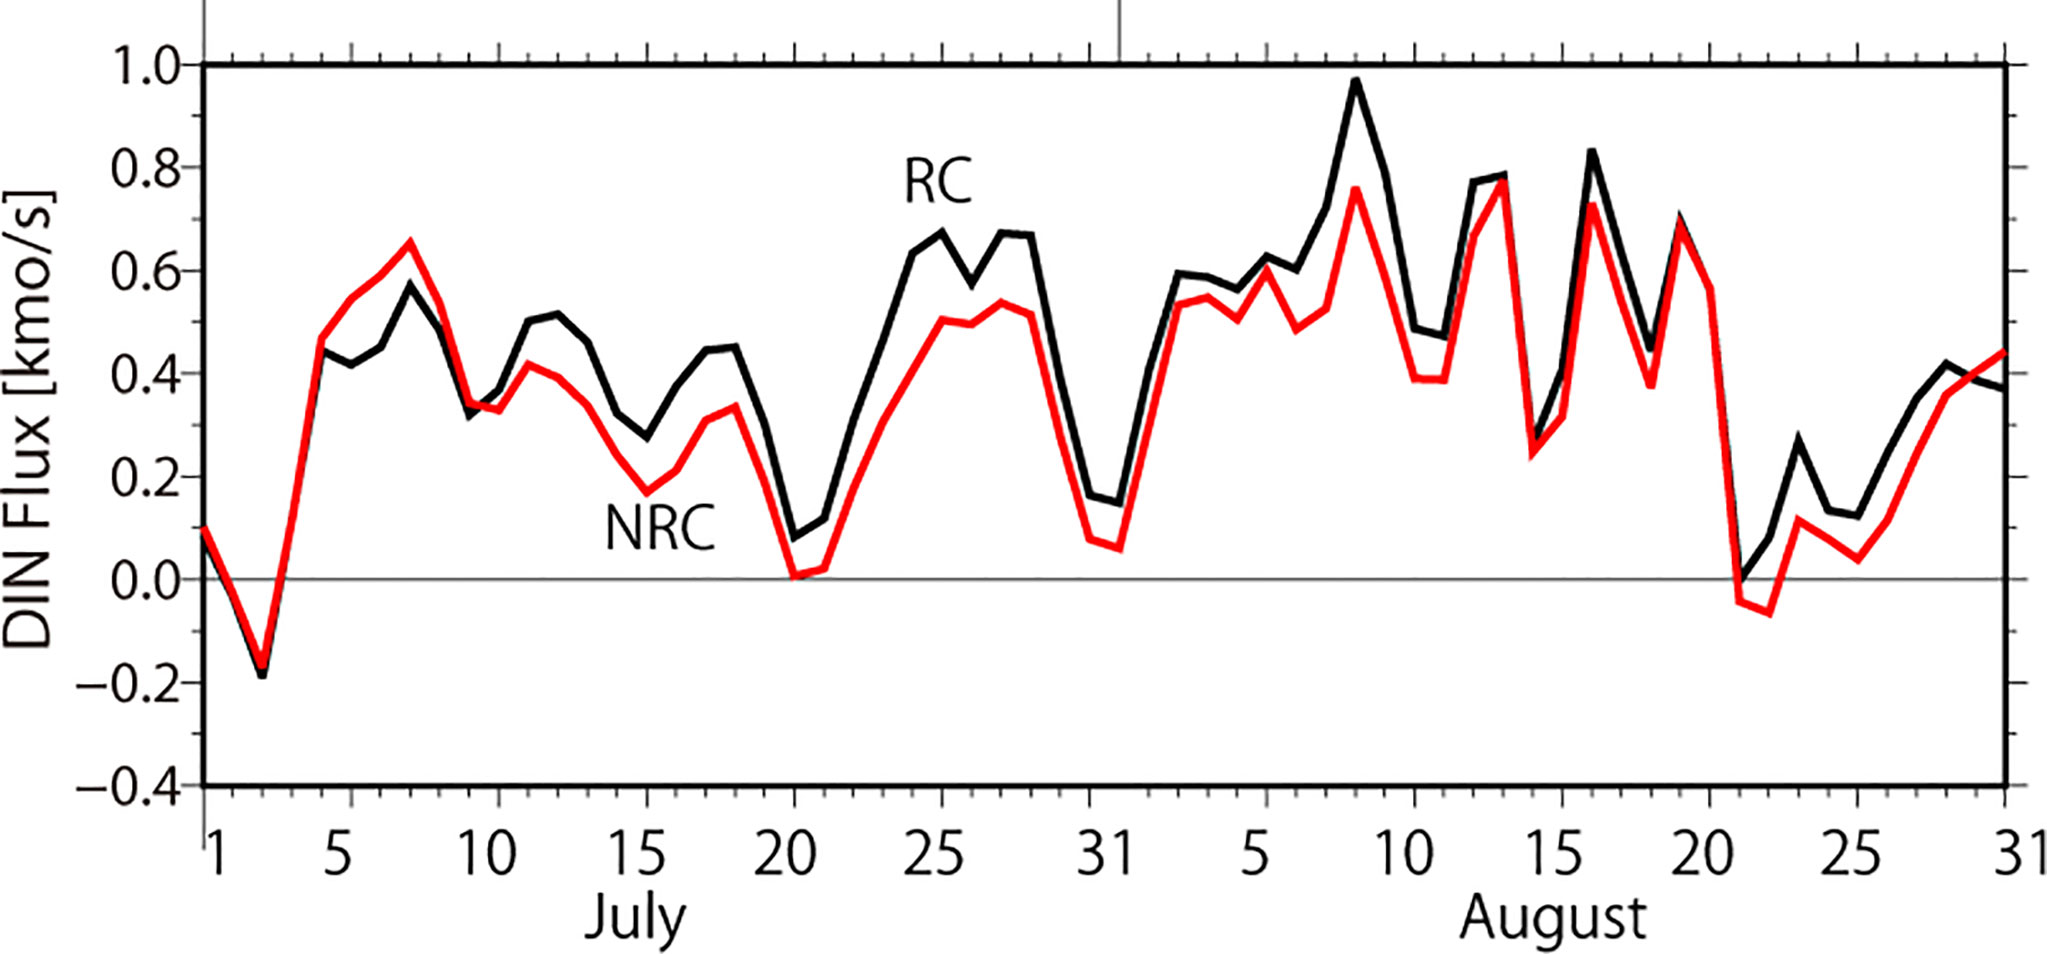
Figure 13 Temporal variation in the DIN flux across 32.92°N shown by the red line in Figure 1B. Black and red lines in show the variation in the rain (RC) and no-rain (NRC) cases, respectively.
A water temperature decrease in the surface layer on the eastern coast of the Bungo Channel was observed a few days after a heavy rain event in July 2018. We hypothesized that the heavy rain event influenced the water temperature decrease by intensifying inflow from the Pacific Ocean to the Bungo Channel in the bottom layer, thereby transporting cold water from the shelf slope region to the bottom layer of the Bungo Channel. To examine this hypothesis, we analyzed observed water temperatures and salinity during and after the heavy rain event and conducted numerical experiments.
The water temperature decrease in the surface layer after the heavy rain event was caused by strong vertical mixing of the cold water mass in the bottom layer supplied by a bottom intrusion, during a spring tide. Numerical experiments showed that the heavy rain event did not affect the occurrence of the bottom intrusion but did intensify the bottom intrusion. The numerical experiments also showed that the heavy rain event in early July gave rise to a lower water density in the Bungo Channel for 2 months, which intensified the gravitational circulation in the Bungo Channel. As a result, the inflow from the Pacific Ocean to the Bungo Channel below 50 m depth increased 17.5% after the heavy rain event.
It was suggested that the intensified gravitational circulation in the Bungo Channel increased the nutrient supply from the Pacific Ocean. The DIN flux across the southern part of the Bungo Channel was 20% larger in the RC than in the NRC in the numerical experiment. The heavy rain event also increased the nutrient supply via rivers. Therefore, heavy rain events near the Seto Inland Sea might increase the nutrient supply from both land and the open ocean.
The original contributions presented in the study are included in the article/supplementary material. Further inquiries can be directed to the corresponding author.
MD developed a physical numerical model. MK and TS analyzed outputs of numerical model. MH and KT conducted hydrographic observation. XG and HT made a basic idea of the present study. All authors contributed to the article and approved the submitted version.
This research was financially supported by the Japan Society for the Promotion of Science, Grant-in-Aid for Scientific Research on Innovative Areas (Research in a proposed research area) (19H05696) and Grant-in-Aid for Scientific Research (B) (20H01972). Research product of Sea Surface Temperature produced from Himawari-8 that was used in this paper was supplied by the P-Tree System, Japan Aerospace Exploration Agency.
The authors declare that the research was conducted in the absence of any commercial or financial relationships that could be construed as a potential conflict of interest.
All claims expressed in this article are solely those of the authors and do not necessarily represent those of their affiliated organizations, or those of the publisher, the editors and the reviewers. Any product that may be evaluated in this article, or claim that may be made by its manufacturer, is not guaranteed or endorsed by the publisher.
The authors are grateful to anonymous reviewers for their critical reading and useful comments.
Akiyama H., Saito S. (1993). The Kyucho in Sukumo Bay Induced by Kuroshio Warm Filament Intrusion. J. Oceanogr. 49, 667–682. doi: 10.1007/BF02276751
Arai M. (2005). Numerical Study of a Kyucho and a Bottom Intrusion in the Bungo Channel, Japan: Disturbances Generated by the Kuroshio Small Meanders. J. Oceanogr. 61, 953–971. doi: 10.1007/s10872-006-0012-3
Atkinson L. P. (1977). Modes of Gulf Stream Intrusion Into the South Atlantic Bight Shelf Waters. Geophys. Res. Lett. 4, 583–586. doi: 10.1029/GL004i012p00583
Blumberg A. F., Mellor G. L. (1987). “A Description of a Three Dimensional Coastal Ocean Circulation Model,” in In Three-Dimensional Coastal Ocean Models, Coastal Estuarine Stud, Vol. 4 . Ed. Heaps N. (AGU, Washington, D.C: American Geophysical Union), 1–16.
Brink K. H. (2016). Cross-Shelf Exchage. Annu. Rev. Mar. Sci. 8, 59–78. doi: 10.1146/annurev-marine-010814-015717
Castelao R. (2011). Intrusion of Gulf Stream Waters Onto the South Atlantic Bight Shelf. J. Geophys. Res. 116, C10011. doi: 10.1029/2011JC007178
Chang P. H., Guo X., Takeoka H. (2009). A Numerical Study of the Seasonal Circulation in the Seto Inland Sea, Japan. J. Oceanogr. 65, 721–736. doi: 10.1007/s10872-009-0062-4
Fujibe F. (2015). Relationship Between Interannual Variations of Extreme Hourly Precipitation and Air/Sea-Surface Temperature in Japan. SOLA 201511, 5–9. doi: 10.2151/sola.2015-002
Hanawa, Mitsudera (1985). On the Data Processings of Daily Mean Values of Oceanographical Data: Note on the Daily Mean Sea-Level Data. Bull. Coast. Oceanogr. 23 (1), 79–87. doi: 10.32142/engankaiyo.23.1_79
Hayami Y., Ougiyama S., Yamada M., Yamada M., Takemura K., Takeoka H. (2005). Seasonal and Inter-Annual Variation in Chlorophyll a Concentration in Kitanada Bay, Uwa Sea. Bull. Jpn. Soc Fish. Oceanogr. 69, 1–9.
Higashino M., Stefan H. G. (2014). Modeling the Effect of Rainfall Intensity on Soil-Water Nutrient Exchange in Flooded Rice Paddies and Implications for Nitrate Fertilizer Runoff to the Oita River in Japan. Water Resour. Res. 50 (11), 8611–8624. doi: 10.1002/2013WR014643
Isobe A., Guo X., Takeoka H. (2010). Hindcast and Predictability of Sporadic Kuroshio-Water Intrusion (Kyucho in Bungo Channel) Into the Shelf and Costal Waters. J. Geophys. Res. 115, C04023. doi: 10.1029/2009JC005818
Kaneda A., Norimatsu K., Watanabe K., Koizumi Y., Takeoka H. (2002c). Influence of Onshore/Offshore Movement of the Kuroshio on the Water Temperature in the Bungo Channel, Japan. Bull. Coast. Oceanogr. 39 (2), 181–188. doi: 10.32142/engankaiyo.39.2_181
Kaneda A., Takeoka H., Koizumi Y. (2002b). Periodic Occurrence of Diurnal Signal of ADCP Backscatter Strength in Uchiumi Bay. Estuar. Coast. Shelf. Sci. 55, 323–330. doi: 10.1006/ecss.2001.0908
Kaneda A., Takeoka H., Nagaura E., Koizumi Y. (2002a). Periodic Intrusion of Cold Water From the Pacific Ocean Into the Bottom Layer of the Bungo Channel, Japan. J. Oceanogr. 58, 547–556. doi: 10.1023/A:1021262609923
Katano T., Kaneda A., Takeoka H., Nakano S. (2005). Seasonal Changes in Abundance and Composition of Picophytoplankton in Relation to Occurrence of Kyucho and Bottom Intrusion in Uchiumi Bay, Japan. Mar. Ecol. Prog. Ser. 298, 59–67. doi: 10.3354/meps298059
Koizumi Y. (1999). Kyucho Events and the Mechanism of Phytoplankton Growth in the Eastern Coast of the Bungo Channel (University of Tokyo: Doctoral Thesis), 145 pp.
Lee T. N., Atkinson P. A., Legeckis R. (1981). Observations of a Gulf Stream Frontal Eddy on the Georgia Continental Shelf, April 1977. Deep-Sea. Res. 28, 347–378. doi: 10.1016/0198-0149(81)90004-2
Lents S. J. (2003). A Climatology of Salty Intrusions Over the Continental Shelf From Georges Bank to Cape Hatteras. J. Geophys. Res. 108 (C10), 3326. doi: 10.1029/2003JC001859
Matsumoto K., Takanezawa T., Ooe M. (2000). Ocean Tide Models Developed by Assimilation TOPEX/POSEIDON Altimeter Data Into Hydorodynamical Model: A Global Model and a Regional Model Around Japan. J. Oceanogr. 56 (5), 567–581. doi: 10.1023/A:1011157212596
Mellor G. L., Yamada T. (1982). Development of a Turbulence Closure Model for Geophysical Fluid Problems. Rev. Geophys. 20, 851–875. doi: 10.1029/RG020i004p00851
Miyazawa Y., Zhang R., Guo X., Tamura H., Ambe D., Lee J.-S., et al. (2009). Water Mass Variability in the Western North Pacific Detected in a 15-Year Eddy Resolving Ocean Reanalysis. J. Oceanogr. 65, 737–756. doi: 10.1007/s10872-009-0063-3
Nagai T., Hibiya T. (2012). Effects of Tidally Induced Eddies on Sporadic Kuroshio-Water Intrusion (Kyucho). J. Oceanogr. 69, 369–377. doi: 10.1007/s10872-013-0179-3
Schaeffer A., Roughan R., Wood J. E. (2013). Observed Bottom Boundary Layer Transport and Uplift on the Continental Shelf Adjacent to a Western Boundary Current. J. Geophys. Res. Ocean. 119, 4922–4939. doi: 10.1002/2013JC009735
Smagorinsky J. S. (1963). General Circulation Experiments With the Primitive Equations. I. The Basic Experiment. Mon. Wea. Rev. 91, 99–164. doi: 10.1175/1520-0493(1963)091<0099:GCEWTP>2.3.CO;2
Takeoka H. (1984). Fundamental Concepts of Exchange and Transport Time Scales in a Coastal Sea. Cont. Shelf. Res. 3 (3), 311–326. doi: 10.1016/0278-4343(84)90014-1
Takeoka H., Akiyama H., Kikuchi T. (1993). The Kyucho in the Bungo Channel, Periodic Intrusion of Oceanic Warm Water. J. Oceanogr. 49, 369–382. doi: 10.1007/BF02234954
Takeoka H., Koizumi Y., Kaneda A. (2000). “Year-To-Year Variation of a Kyucho and a Bottom Intrusion in the Bungo Channel, Japan,” in Interaction Between Estuaries, Coastal Seas and Shelf Seas. Ed. Yanagi T. (Tokyo: Terra Scientific Publishing Company), 192–215.
Takeoka H., Tanaka Y., Ohno Y., Hisaki Y., Nadai A., Kuroiwa H. (1995). Observation of the Kyucho in the Bungo Channel by HF Radar. J. Oceanogr. 51, 699–711. doi: 10.1007/BF02235460
Takeoka H., Yoshimura T. (1988). The Kyucho in Uawjima Bay. J. Oceanogr. Soc Jap. 44, 6–16. doi: 10.1007/BF02303146
Ullman D. S., Codiga D. L., Pfeiffer-Herbert A., Kincaid C. R. (2014). An Anomalous Near-Bottom Cross-Shelf Intrusion of Slop Water on the Southern New England Continental Shelf. J. Geophys. Res. Ocean. 119, 1739–1753. doi: 10.1002/2013JC009259
Yamaguchi M., Maeda S. (2020). Increase in the Number of Tropical Cyclones Approaching Tokyo Since 198. J. Meteor. Soc Jap. 98, 775–786. doi: 10.2151/jmsj.2020-039
Keywords: cross-shelf exchange, bottom intrusion, heavy rain, nutrient supply, gravitational circulation
Citation: Morimoto A, Dong M, Kameda M, Shibakawa T, Hirai M, Takejiri K, Guo X and Takeoka H (2022) Enhanced Cross-Shelf Exchange Between the Pacific Ocean and the Bungo Channel, Japan Related to a Heavy Rain Event. Front. Mar. Sci. 9:869285. doi: 10.3389/fmars.2022.869285
Received: 04 February 2022; Accepted: 20 April 2022;
Published: 13 May 2022.
Edited by:
Wei-Bo Chen, National Science and Technology Center for Disaster Reduction (NCDR), TaiwanReviewed by:
Fajin Chen, Guangdong Ocean University, ChinaCopyright © 2022 Morimoto, Dong, Kameda, Shibakawa, Hirai, Takejiri, Guo and Takeoka. This is an open-access article distributed under the terms of the Creative Commons Attribution License (CC BY). The use, distribution or reproduction in other forums is permitted, provided the original author(s) and the copyright owner(s) are credited and that the original publication in this journal is cited, in accordance with accepted academic practice. No use, distribution or reproduction is permitted which does not comply with these terms.
*Correspondence: Akihiko Morimoto, bW9yaW1vdG8uYWtpaGlrby5jbEBlaGltZS11LmFjLmpw
Disclaimer: All claims expressed in this article are solely those of the authors and do not necessarily represent those of their affiliated organizations, or those of the publisher, the editors and the reviewers. Any product that may be evaluated in this article or claim that may be made by its manufacturer is not guaranteed or endorsed by the publisher.
Research integrity at Frontiers

Learn more about the work of our research integrity team to safeguard the quality of each article we publish.